


PSYC 355
SPSS HOMEWORK: BIVARIATE LINEAR REGRESSION ASSIGNMENT
INSTRUCTIONS
OVERVIEW
This assignment is designed to increase your statistical literacy and proficiency in conducting
and interpreting a bivariate linear regression analysis. You will be completing two bivariate
linear regression analyses in SPSS, using data that are related to specific research scenarios in the
behavioral sciences, such as psychology, social work, and counseling. You will also be
completing one Cumulative Knowledge Question that will use an analysis learned in a previous
week. Behind the scenes knowledge of how this test is conducted is fundamental to being able to
understand and apply research in your related field to your practice. Additionally, SPSS skills are
professionally valuable, as it is one of the most commonly used statistical software packages in
behavioral science settings, both academic and professional.
INSTRUCTIONS
This assignment includes two problem sets that contain research scenarios and related
questions.
For each scenario, you will run an analysis in SPSS. The required product will include
the SPSS output, an APA-style Results section describing the results, and the appropriate
graph inserted as a Figure in APA style.
For each scenario, you will create a new SPSS data file with the data from the problem
scenario. ALL variable names in your SPSS data files must include your initials, so that
they show up in your SPSS output and graph. For example, for someone with the initials
ABC creating a variable of memory scores, the variable could be named
“ABC_mem_scores” or “Mem_Scores_ABC”, etc.
For all problems, interpret results based on an alpha level of a = .05.
Please review the Watch: SPSS Homework Tutorial: Linear Regression in this module for
directions on how to run the statistical test, as well as the Watch: Results Sections in APA
Style for Linear Regression, which includes a template for completing an APA-style Results
section for a bivariate linear regression analysis. The scenarios begin on the next page.
PSYC 355
TOEFL® Score College GPA
94
80
112
72
93
101
76
90
83
68
113
74
100
52
3.0
2.7
1.5
2.9
3.2
3.6
2.0
3.7
2.3
3.4
3.6
2.7
3.4
2.7
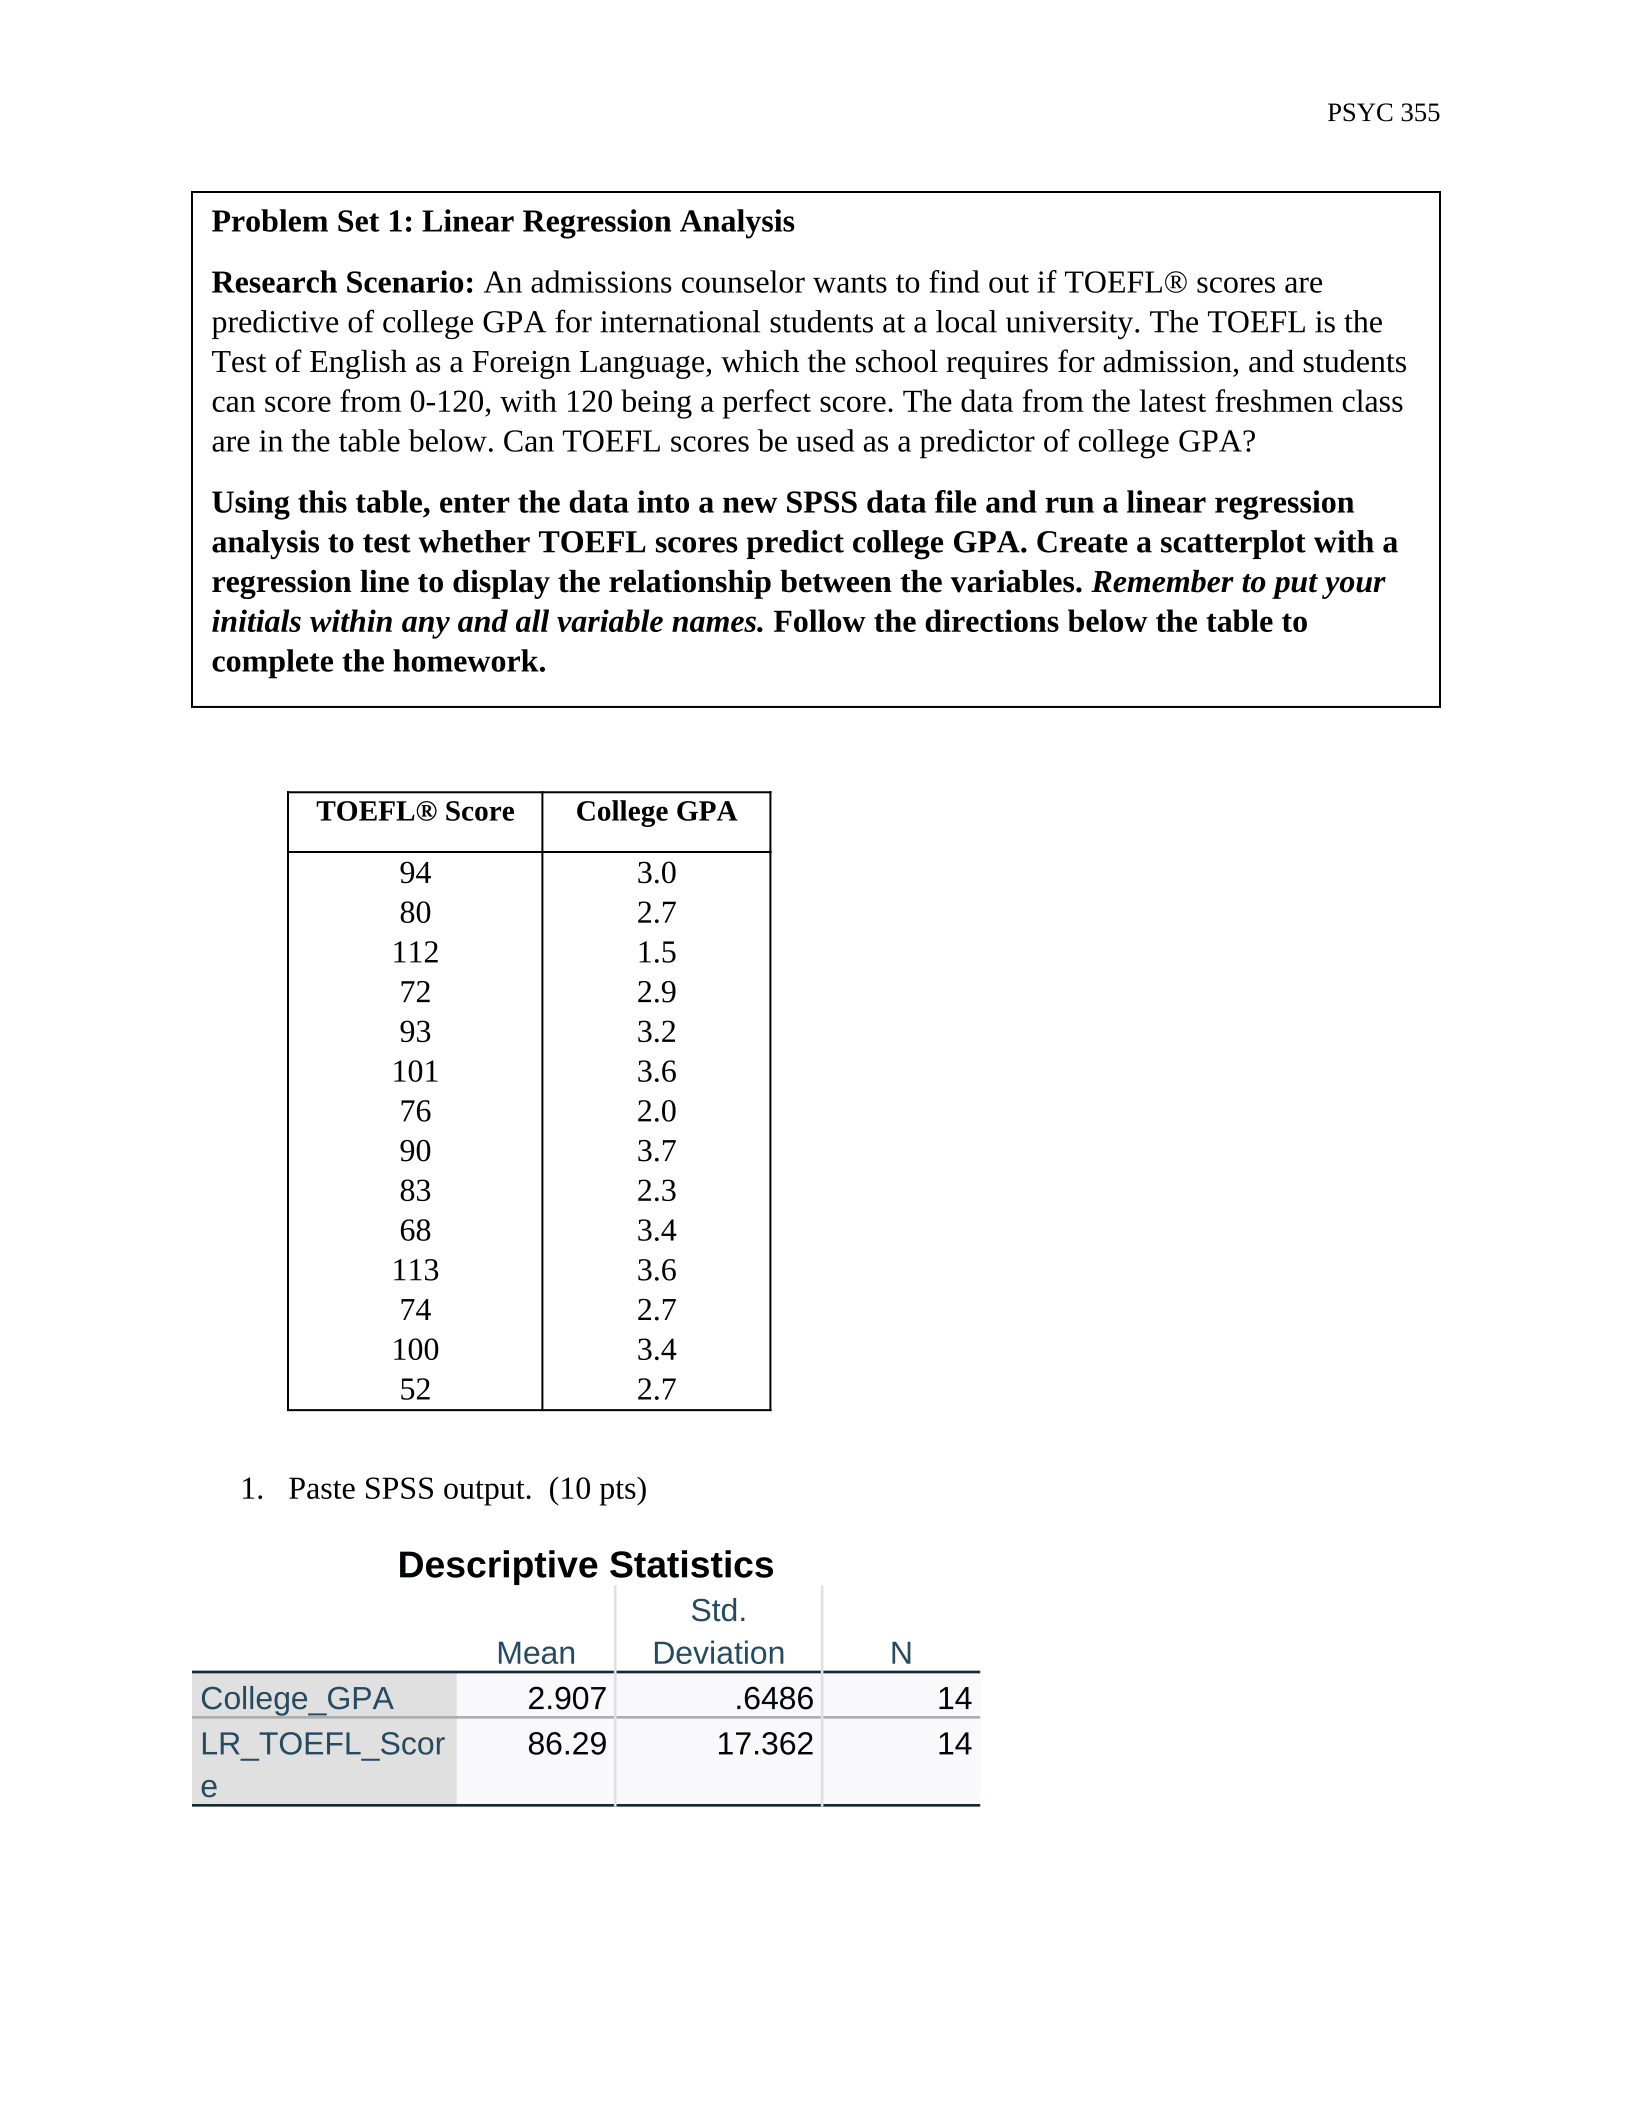
1. Paste SPSS output. (10 pts)
Descriptive Statistics
Mean
Std.
Deviation N
College_GPA 2.907 .6486 14
LR_TOEFL_Scor
e
86.29 17.362 14
Problem Set 1: Linear Regression Analysis
Research Scenario: An admissions counselor wants to find out if TOEFL® scores are
predictive of college GPA for international students at a local university. The TOEFL is the
Test of English as a Foreign Language, which the school requires for admission, and students
can score from 0-120, with 120 being a perfect score. The data from the latest freshmen class
are in the table below. Can TOEFL scores be used as a predictor of college GPA?
Using this table, enter the data into a new SPSS data file and run a linear regression
analysis to test whether TOEFL scores predict college GPA. Create a scatterplot with a
regression line to display the relationship between the variables. Remember to put your
initials within any and all variable names. Follow the directions below the table to
complete the homework.
PSYC 355
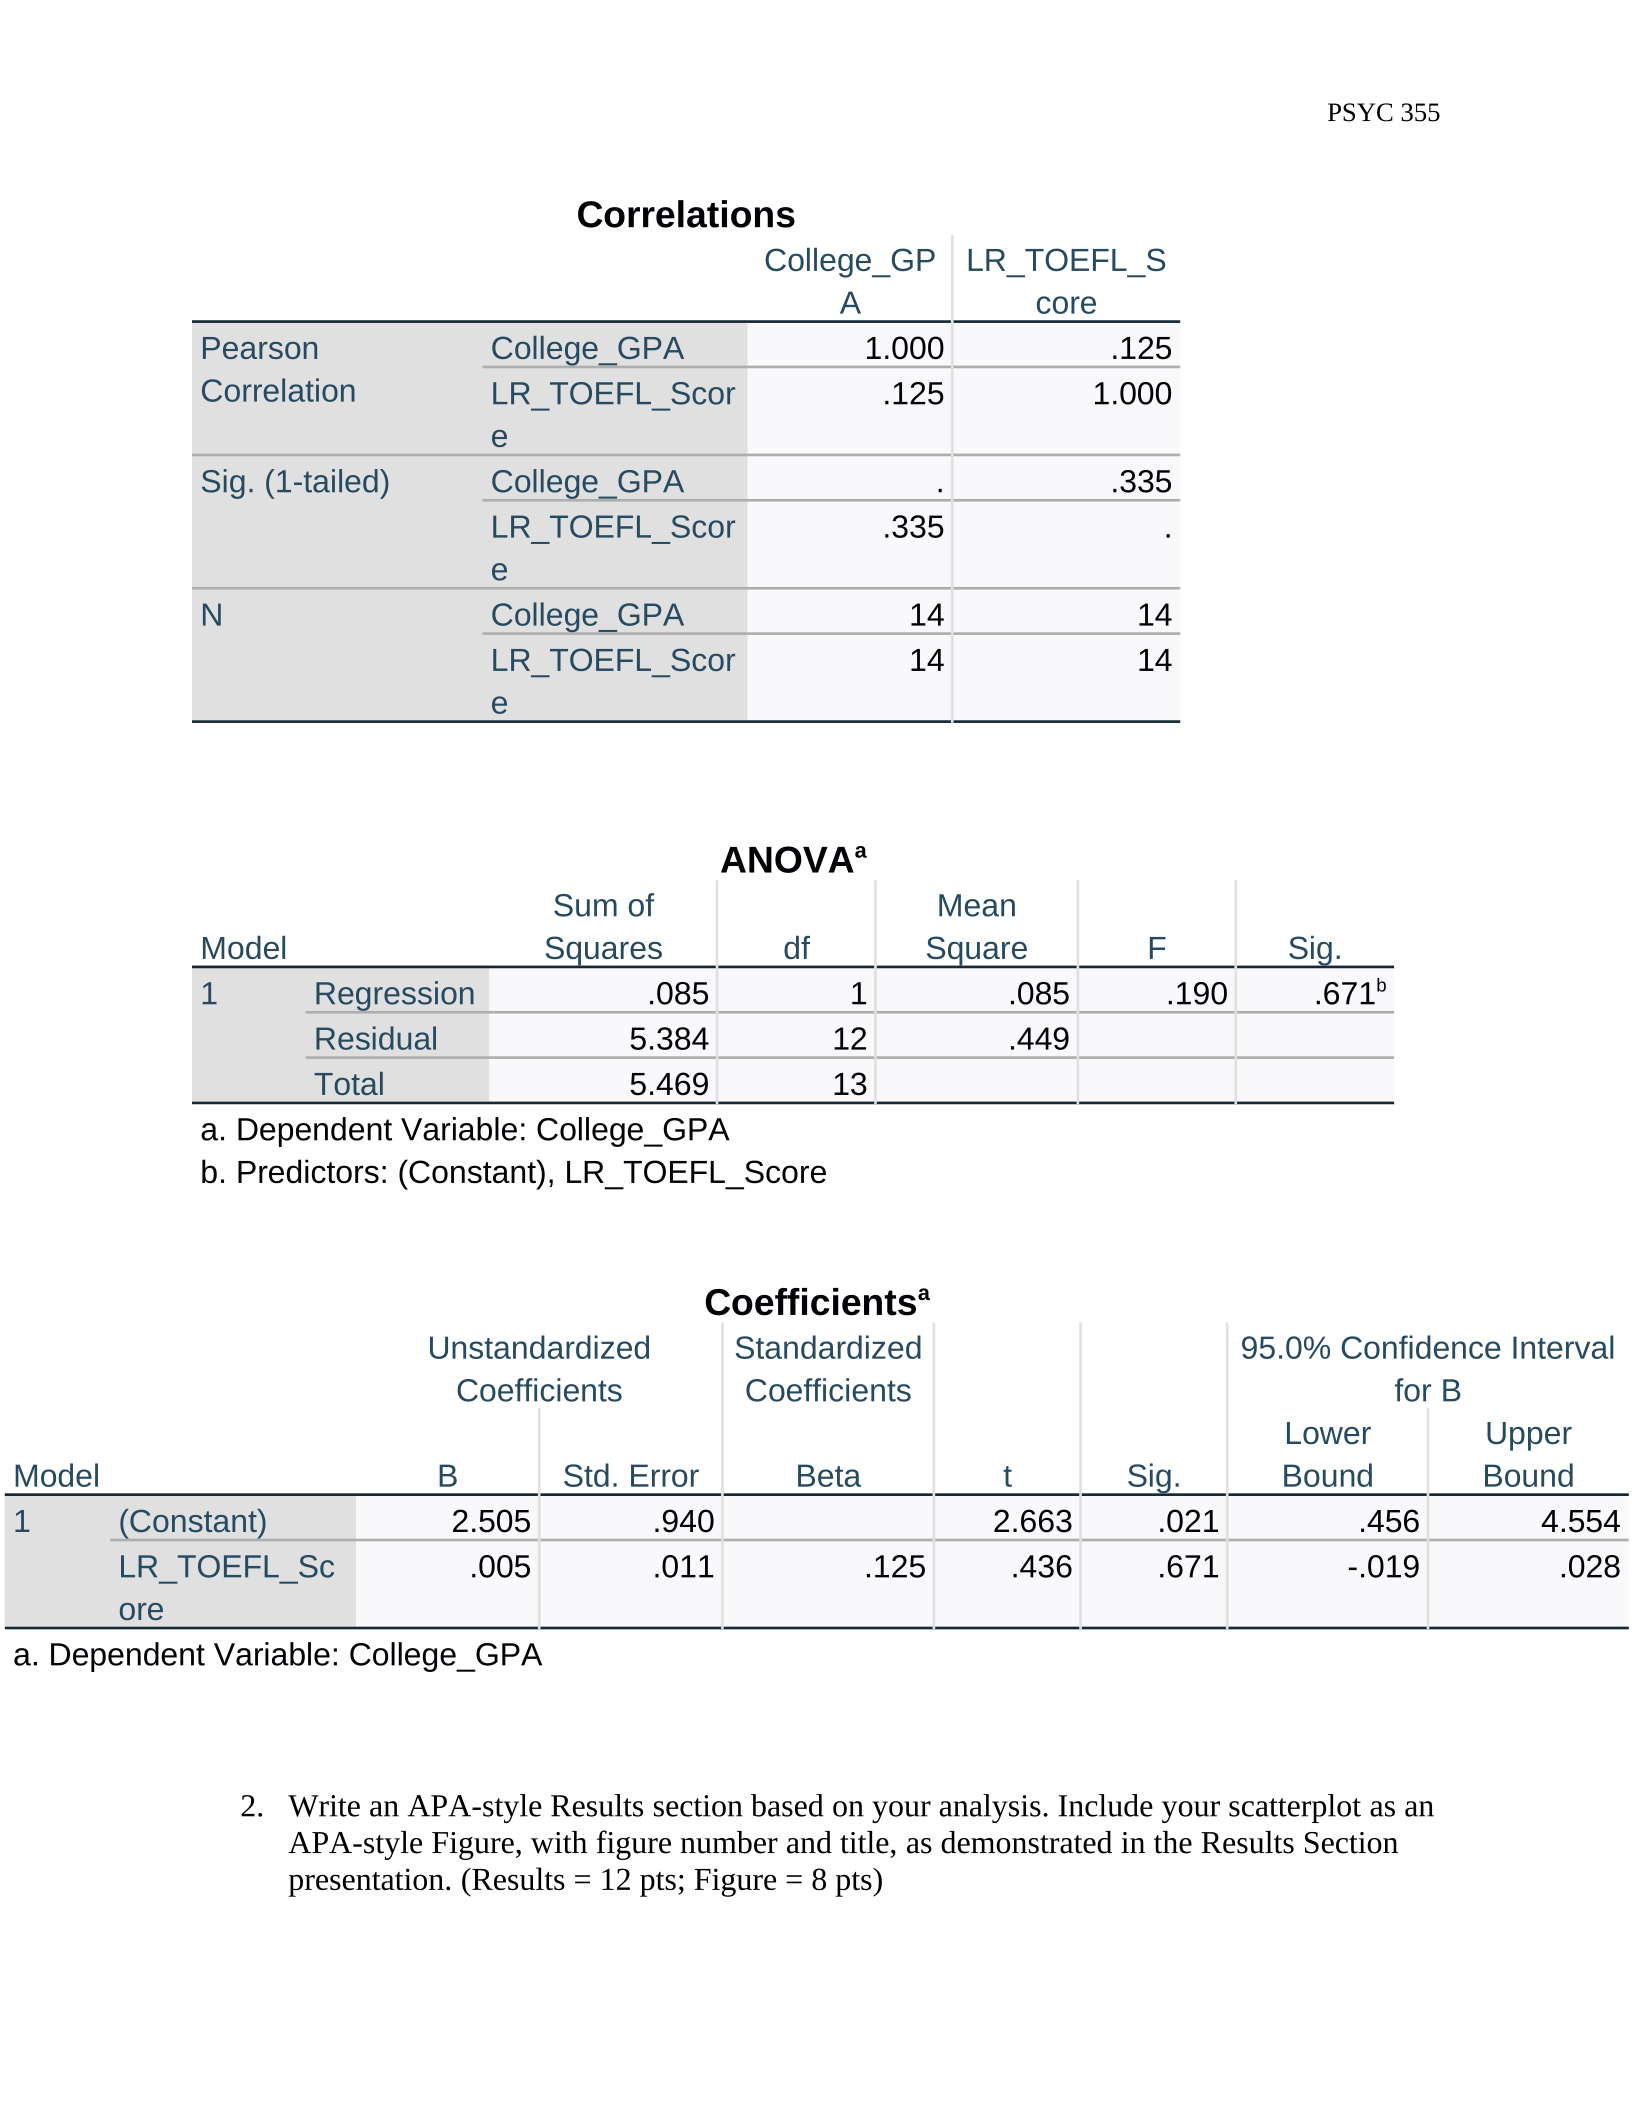
Correlations
College_GP
A
LR_TOEFL_S
core
Pearson
Correlation
College_GPA 1.000 .125
LR_TOEFL_Scor
e
.125 1.000
Sig. (1-tailed) College_GPA . .335
LR_TOEFL_Scor
e
.335 .
N College_GPA 14 14
LR_TOEFL_Scor
e
14 14
ANOVAa
Model
Sum of
Squares df
Mean
Square F Sig.
1 Regression .085 1 .085 .190 .671b
Residual 5.384 12 .449
Total 5.469 13
a. Dependent Variable: College_GPA
b. Predictors: (Constant), LR_TOEFL_Score
Coefficientsa
Model
Unstandardized
Coefficients
Standardized
Coefficients
t Sig.
95.0% Confidence Interval
for B
B Std. Error Beta
Lower
Bound
Upper
Bound
1 (Constant) 2.505 .940 2.663 .021 .456 4.554
LR_TOEFL_Sc
ore
.005 .011 .125 .436 .671 -.019 .028
a. Dependent Variable: College_GPA
2. Write an APA-style Results section based on your analysis. Include your scatterplot as an
APA-style Figure, with figure number and title, as demonstrated in the Results Section
presentation. (Results = 12 pts; Figure = 8 pts)
PSYC 355
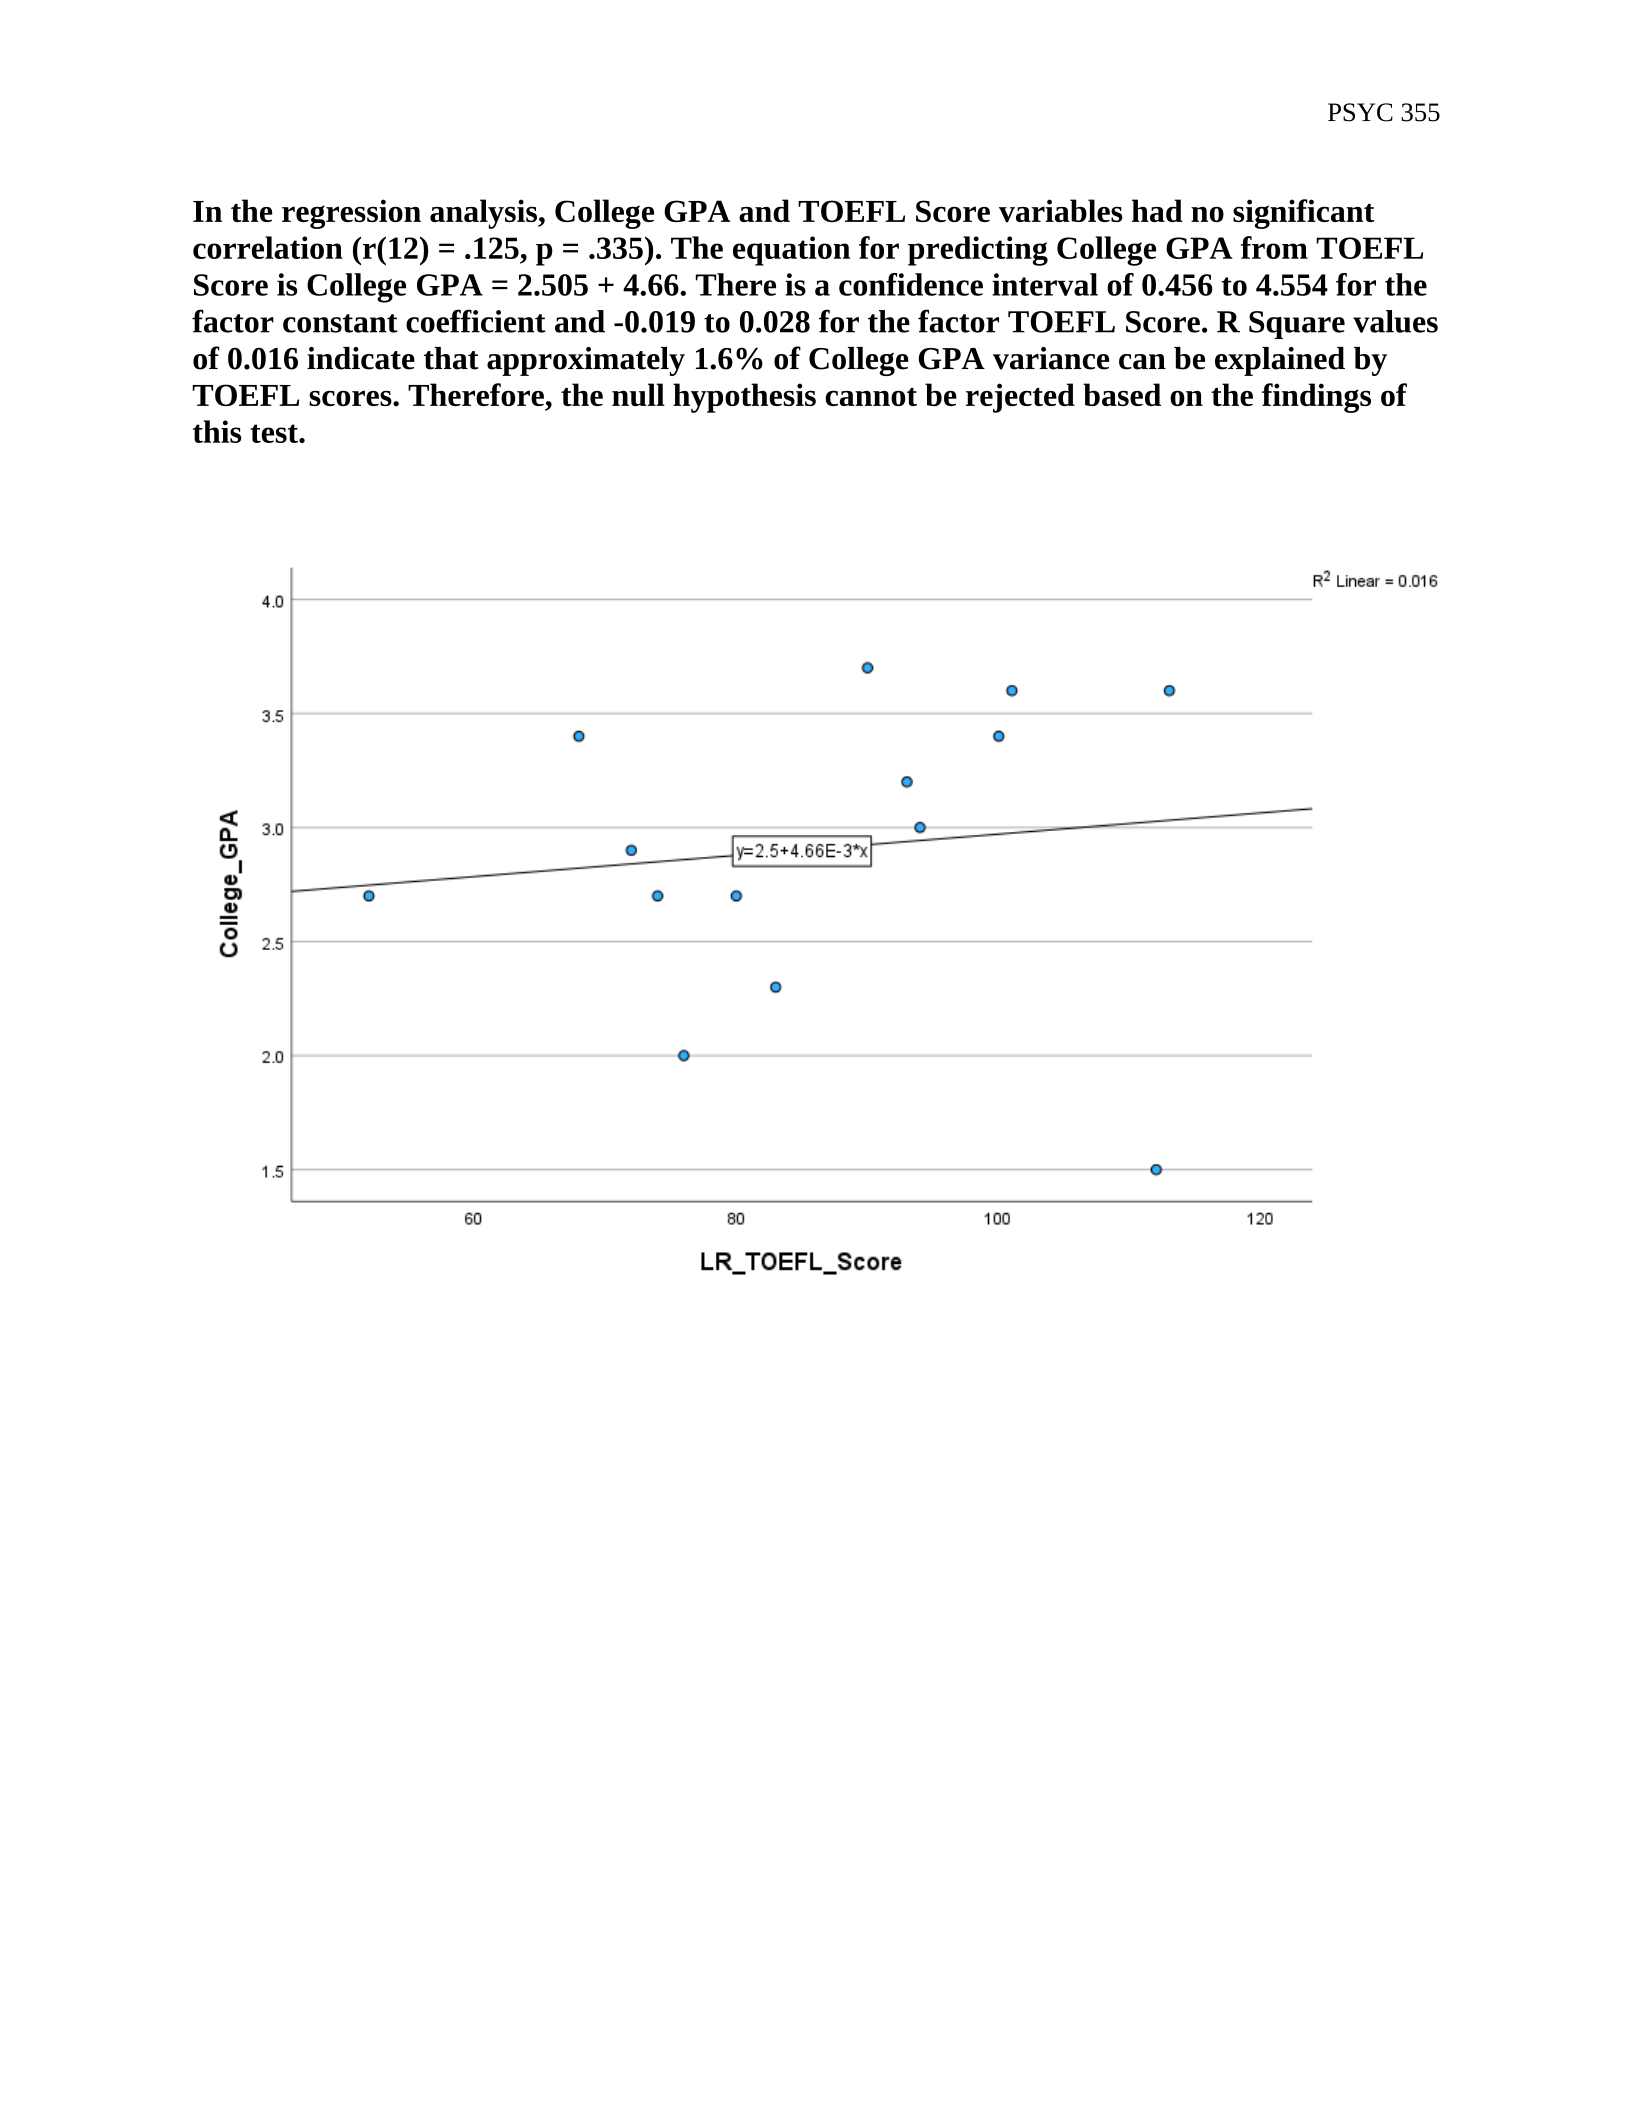
In the regression analysis, College GPA and TOEFL Score variables had no significant
correlation (r(12) = .125, p = .335). The equation for predicting College GPA from TOEFL
Score is College GPA = 2.505 + 4.66. There is a confidence interval of 0.456 to 4.554 for the
factor constant coefficient and -0.019 to 0.028 for the factor TOEFL Score. R Square values
of 0.016 indicate that approximately 1.6% of College GPA variance can be explained by
TOEFL scores. Therefore, the null hypothesis cannot be rejected based on the findings of
this test.
PSYC 355
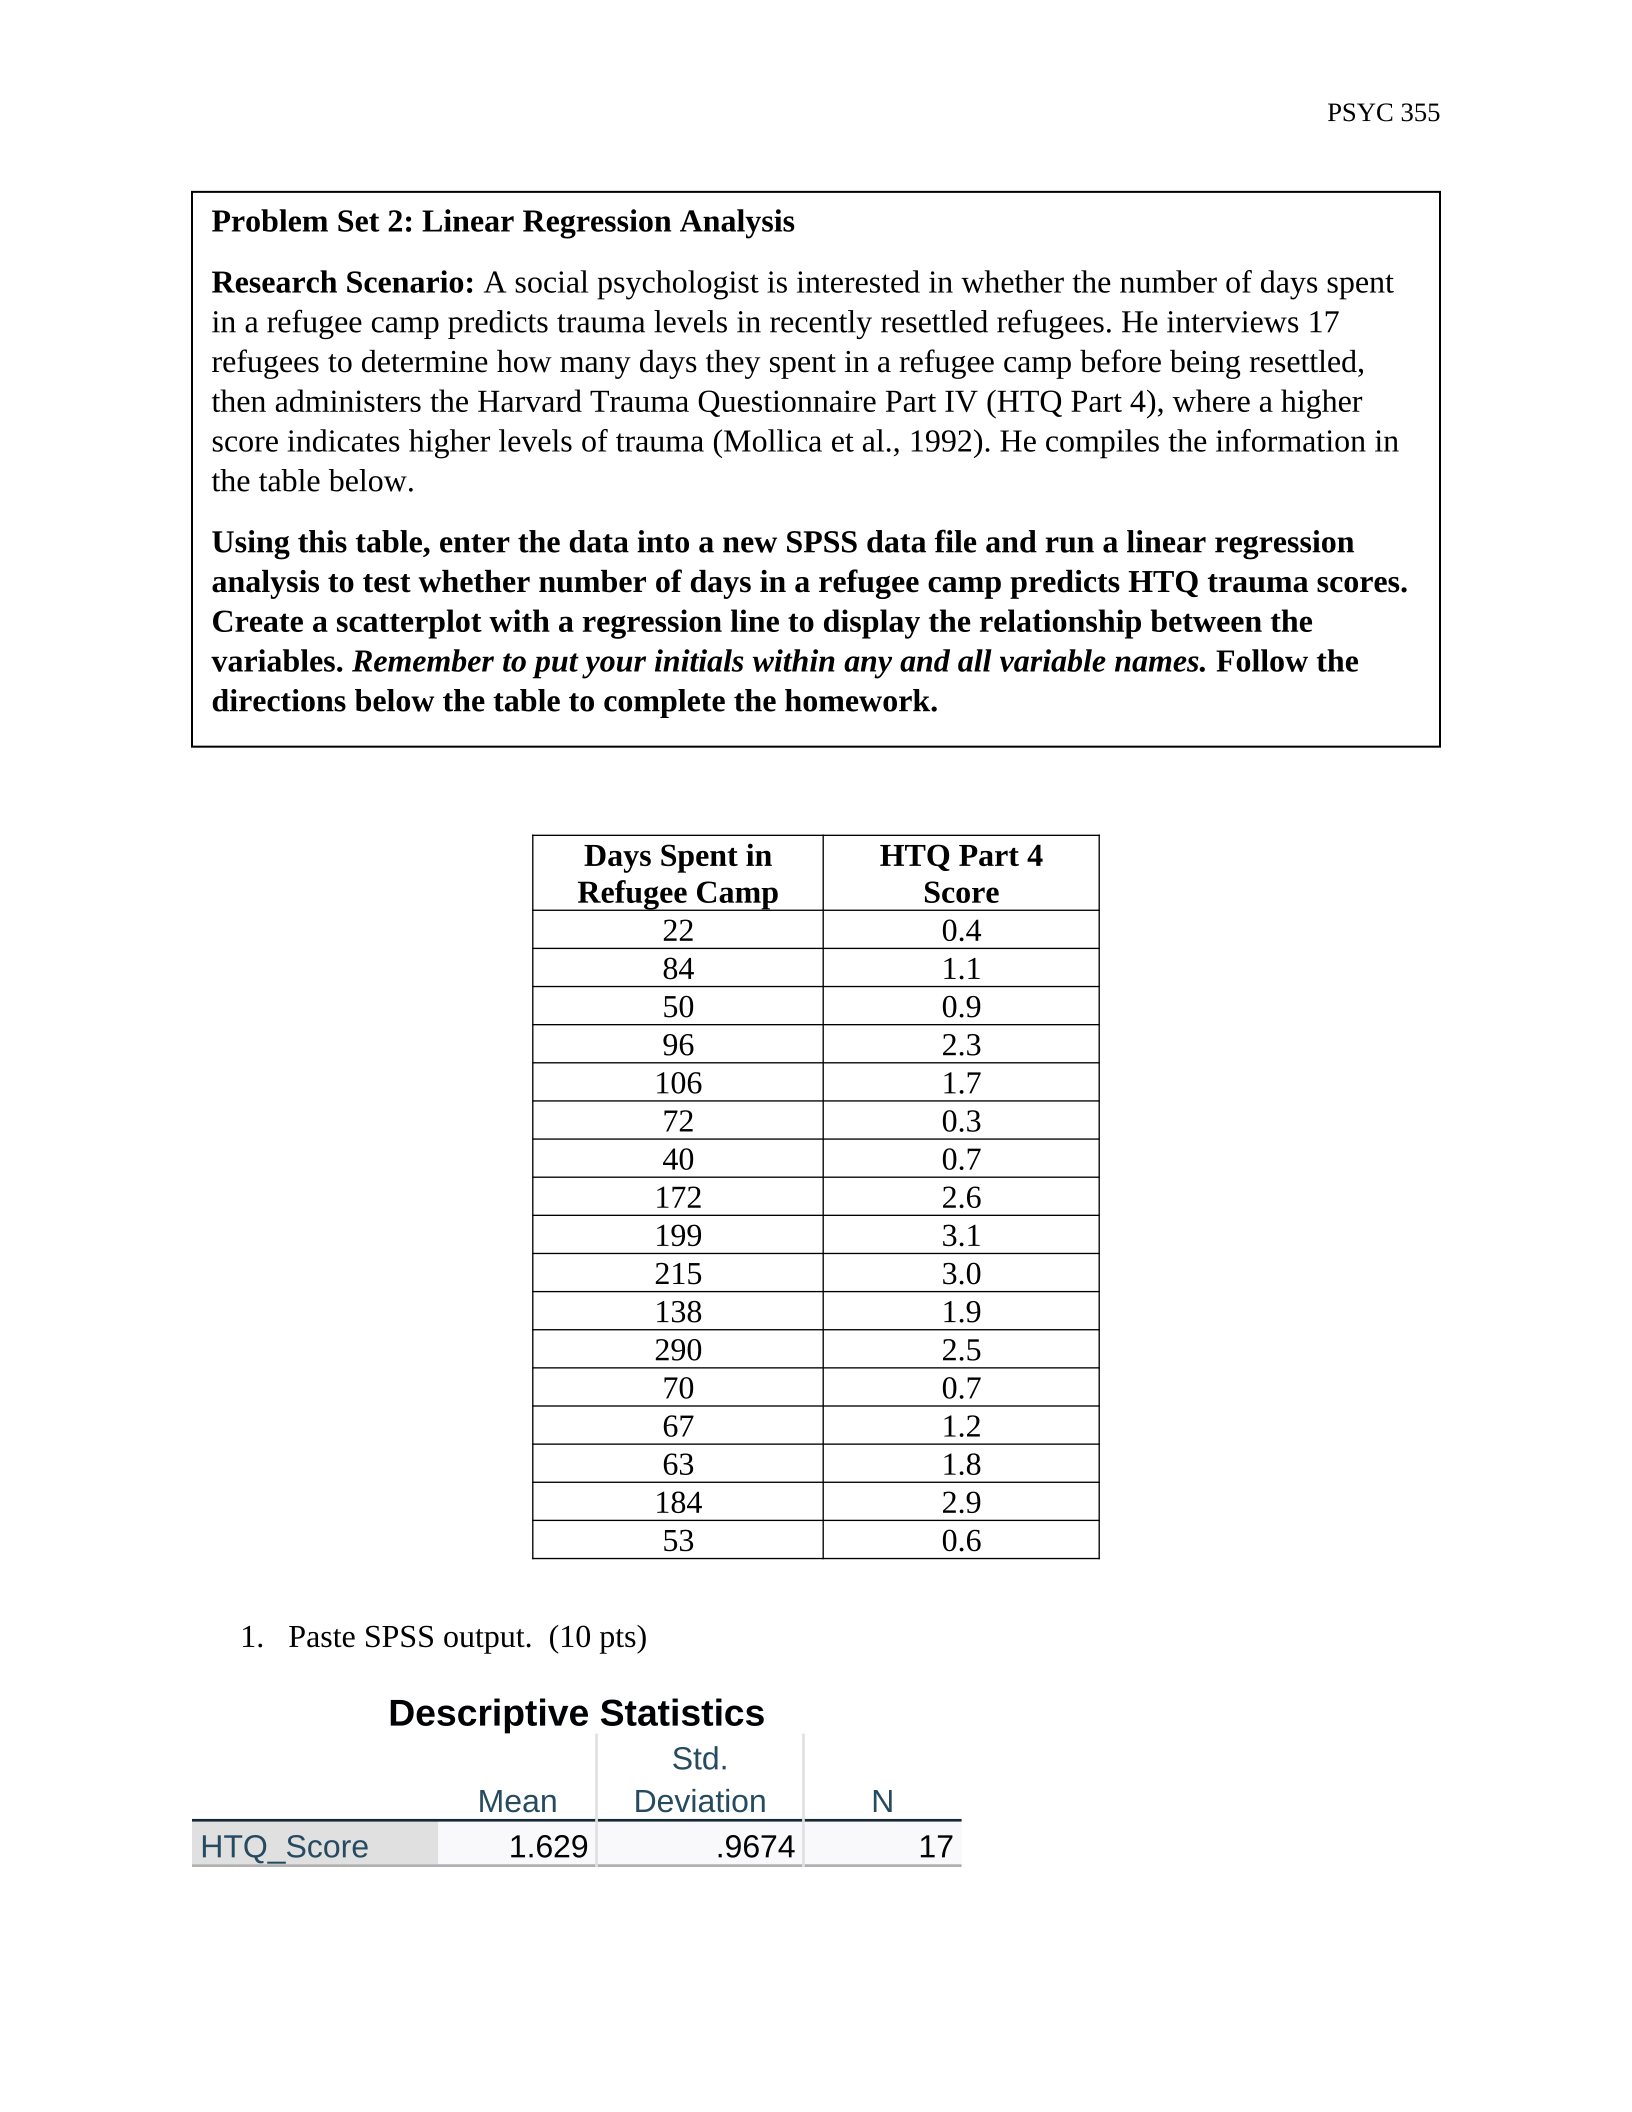
Days Spent in
Refugee Camp
HTQ Part 4
Score
22 0.4
84 1.1
50 0.9
96 2.3
106 1.7
72 0.3
40 0.7
172 2.6
199 3.1
215 3.0
138 1.9
290 2.5
70 0.7
67 1.2
63 1.8
184 2.9
53 0.6
1. Paste SPSS output. (10 pts)
Descriptive Statistics
Mean
Std.
Deviation N
HTQ_Score 1.629 .9674 17
Problem Set 2: Linear Regression Analysis
Research Scenario: A social psychologist is interested in whether the number of days spent
in a refugee camp predicts trauma levels in recently resettled refugees. He interviews 17
refugees to determine how many days they spent in a refugee camp before being resettled,
then administers the Harvard Trauma Questionnaire Part IV (HTQ Part 4), where a higher
score indicates higher levels of trauma (Mollica et al., 1992). He compiles the information in
the table below.
Using this table, enter the data into a new SPSS data file and run a linear regression
analysis to test whether number of days in a refugee camp predicts HTQ trauma scores.
Create a scatterplot with a regression line to display the relationship between the
variables. Remember to put your initials within any and all variable names. Follow the
directions below the table to complete the homework.
PSYC 355
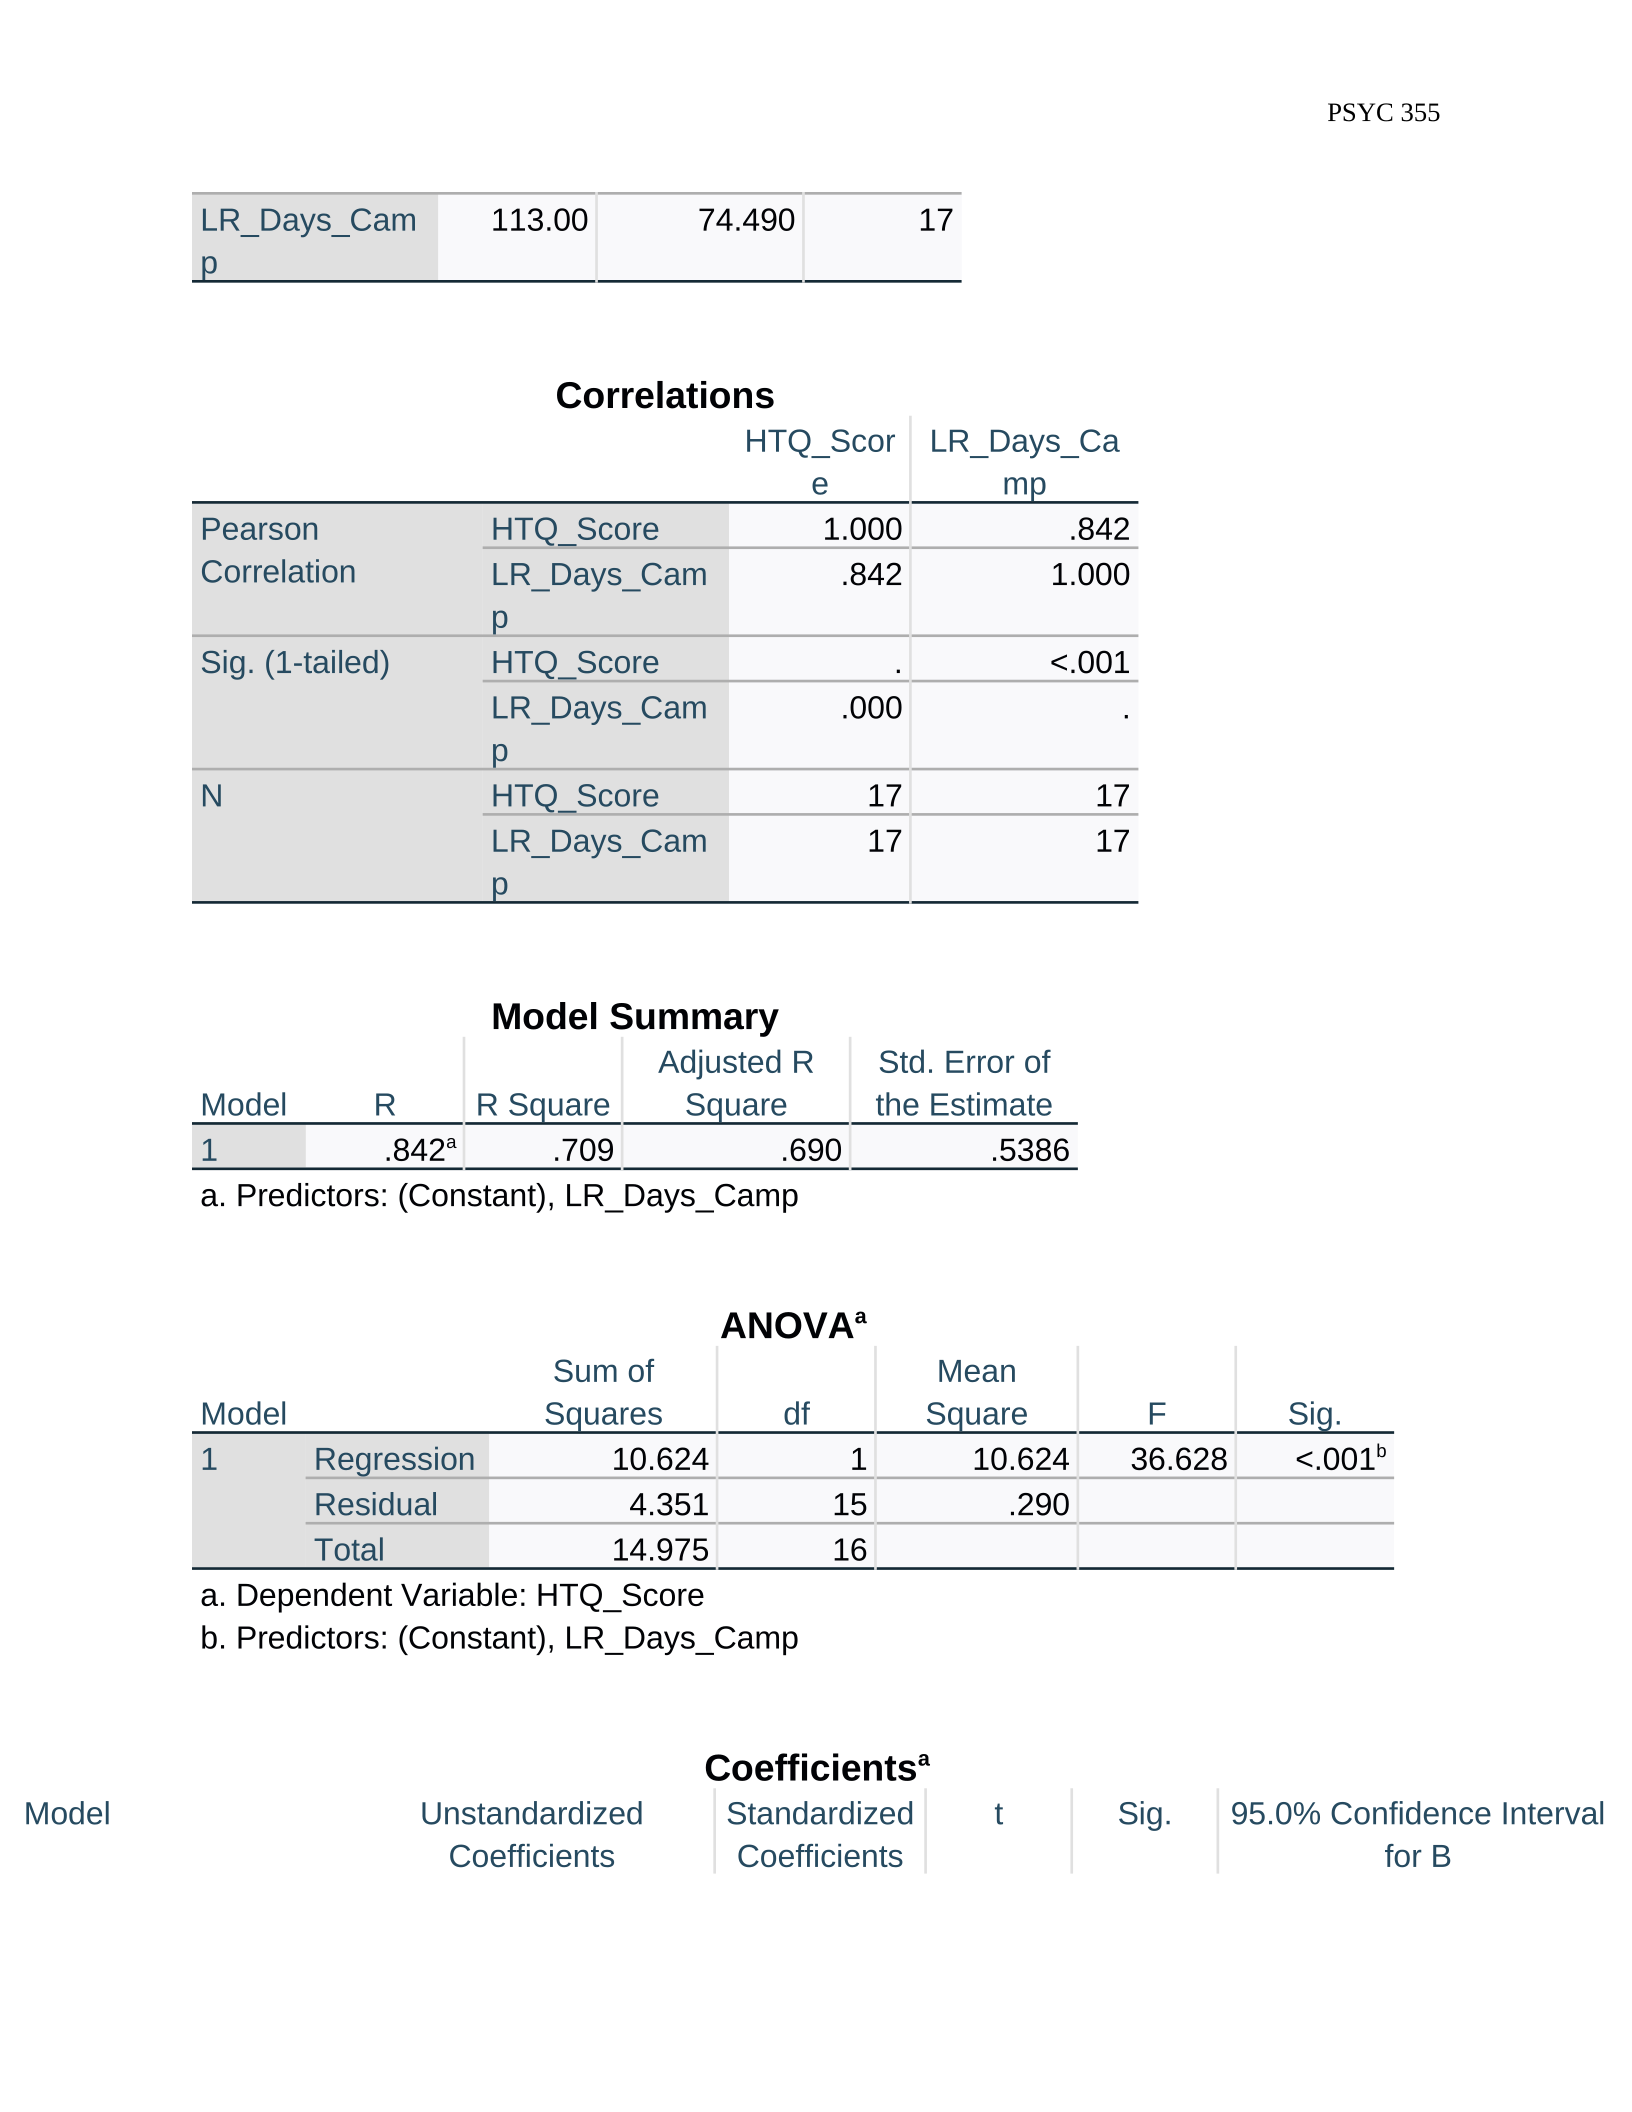
LR_Days_Cam
p
113.00 74.490 17
Correlations
HTQ_Scor
e
LR_Days_Ca
mp
Pearson
Correlation
HTQ_Score 1.000 .842
LR_Days_Cam
p
.842 1.000
Sig. (1-tailed) HTQ_Score . <.001
LR_Days_Cam
p
.000 .
N HTQ_Score 17 17
LR_Days_Cam
p
17 17
Model Summary
Model R R Square
Adjusted R
Square
Std. Error of
the Estimate
1.842a.709 .690 .5386
a. Predictors: (Constant), LR_Days_Camp
ANOVAa
Model
Sum of
Squares df
Mean
Square F Sig.
1 Regression 10.624 1 10.624 36.628 <.001b
Residual 4.351 15 .290
Total 14.975 16
a. Dependent Variable: HTQ_Score
b. Predictors: (Constant), LR_Days_Camp
Coefficientsa
Model Unstandardized
Coefficients
Standardized
Coefficients
t Sig. 95.0% Confidence Interval
for B
PSYC 355
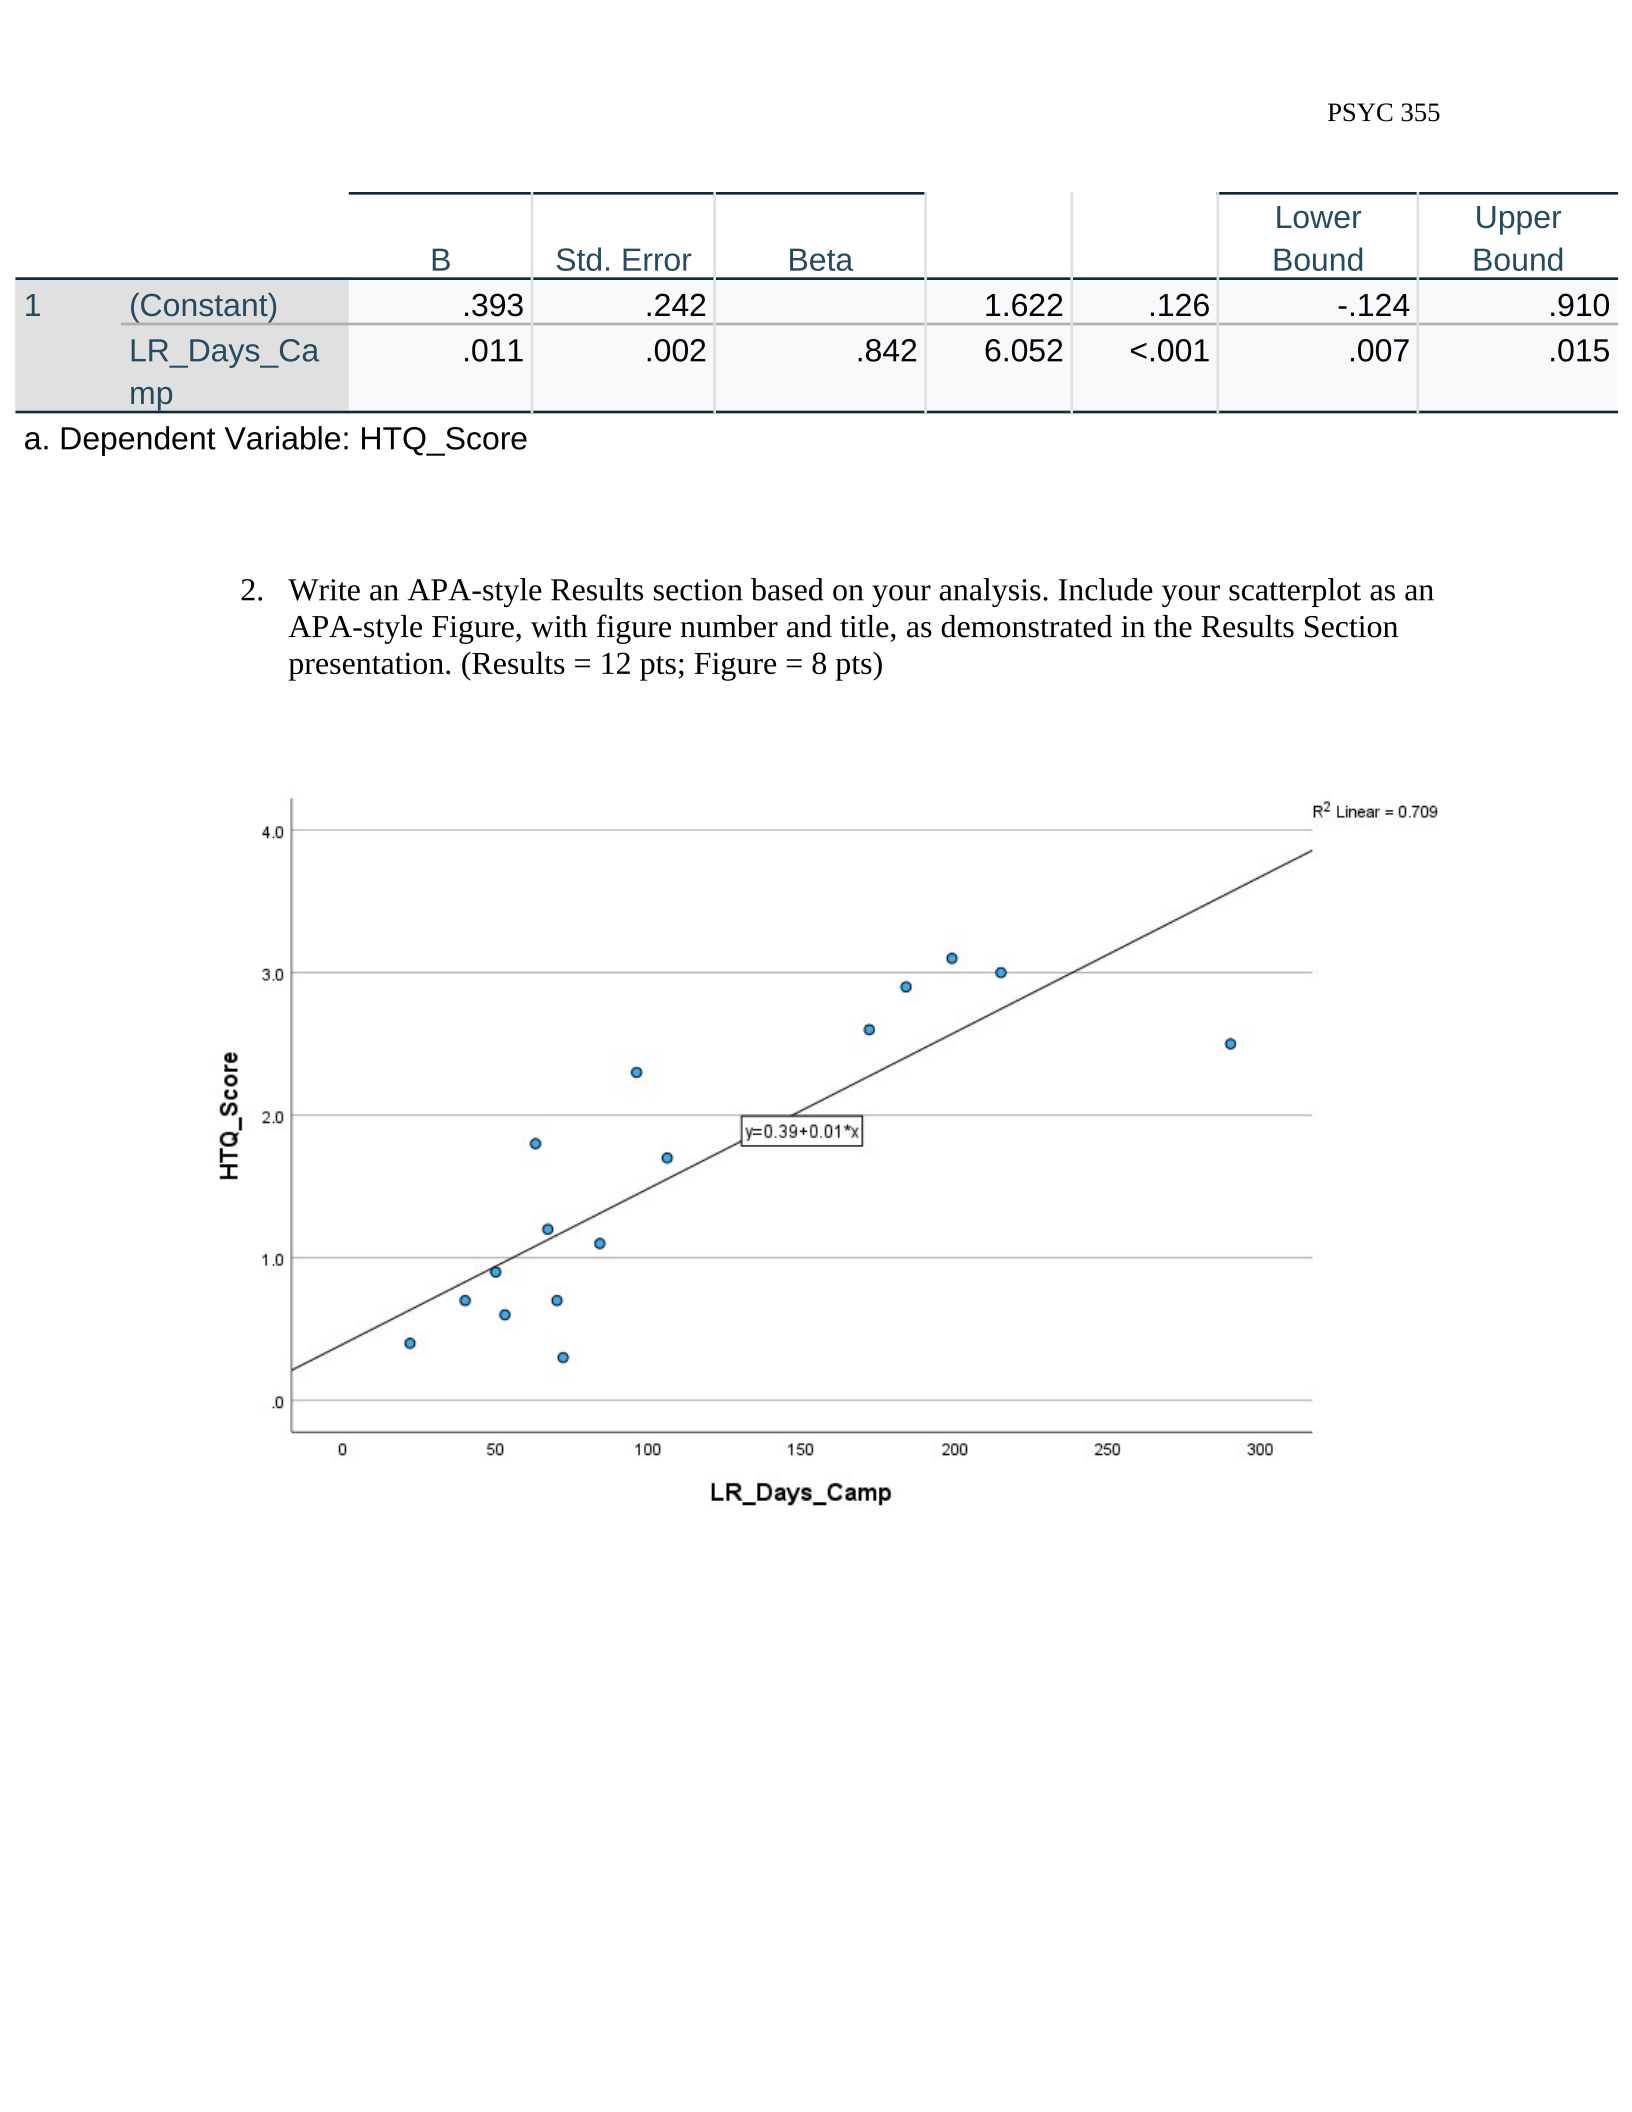
B Std. Error Beta
Lower
Bound
Upper
Bound
1 (Constant) .393 .242 1.622 .126 -.124 .910
LR_Days_Ca
mp
.011 .002 .842 6.052 <.001 .007 .015
a. Dependent Variable: HTQ_Score
2. Write an APA-style Results section based on your analysis. Include your scatterplot as an
APA-style Figure, with figure number and title, as demonstrated in the Results Section
presentation. (Results = 12 pts; Figure = 8 pts)
PSYC 355
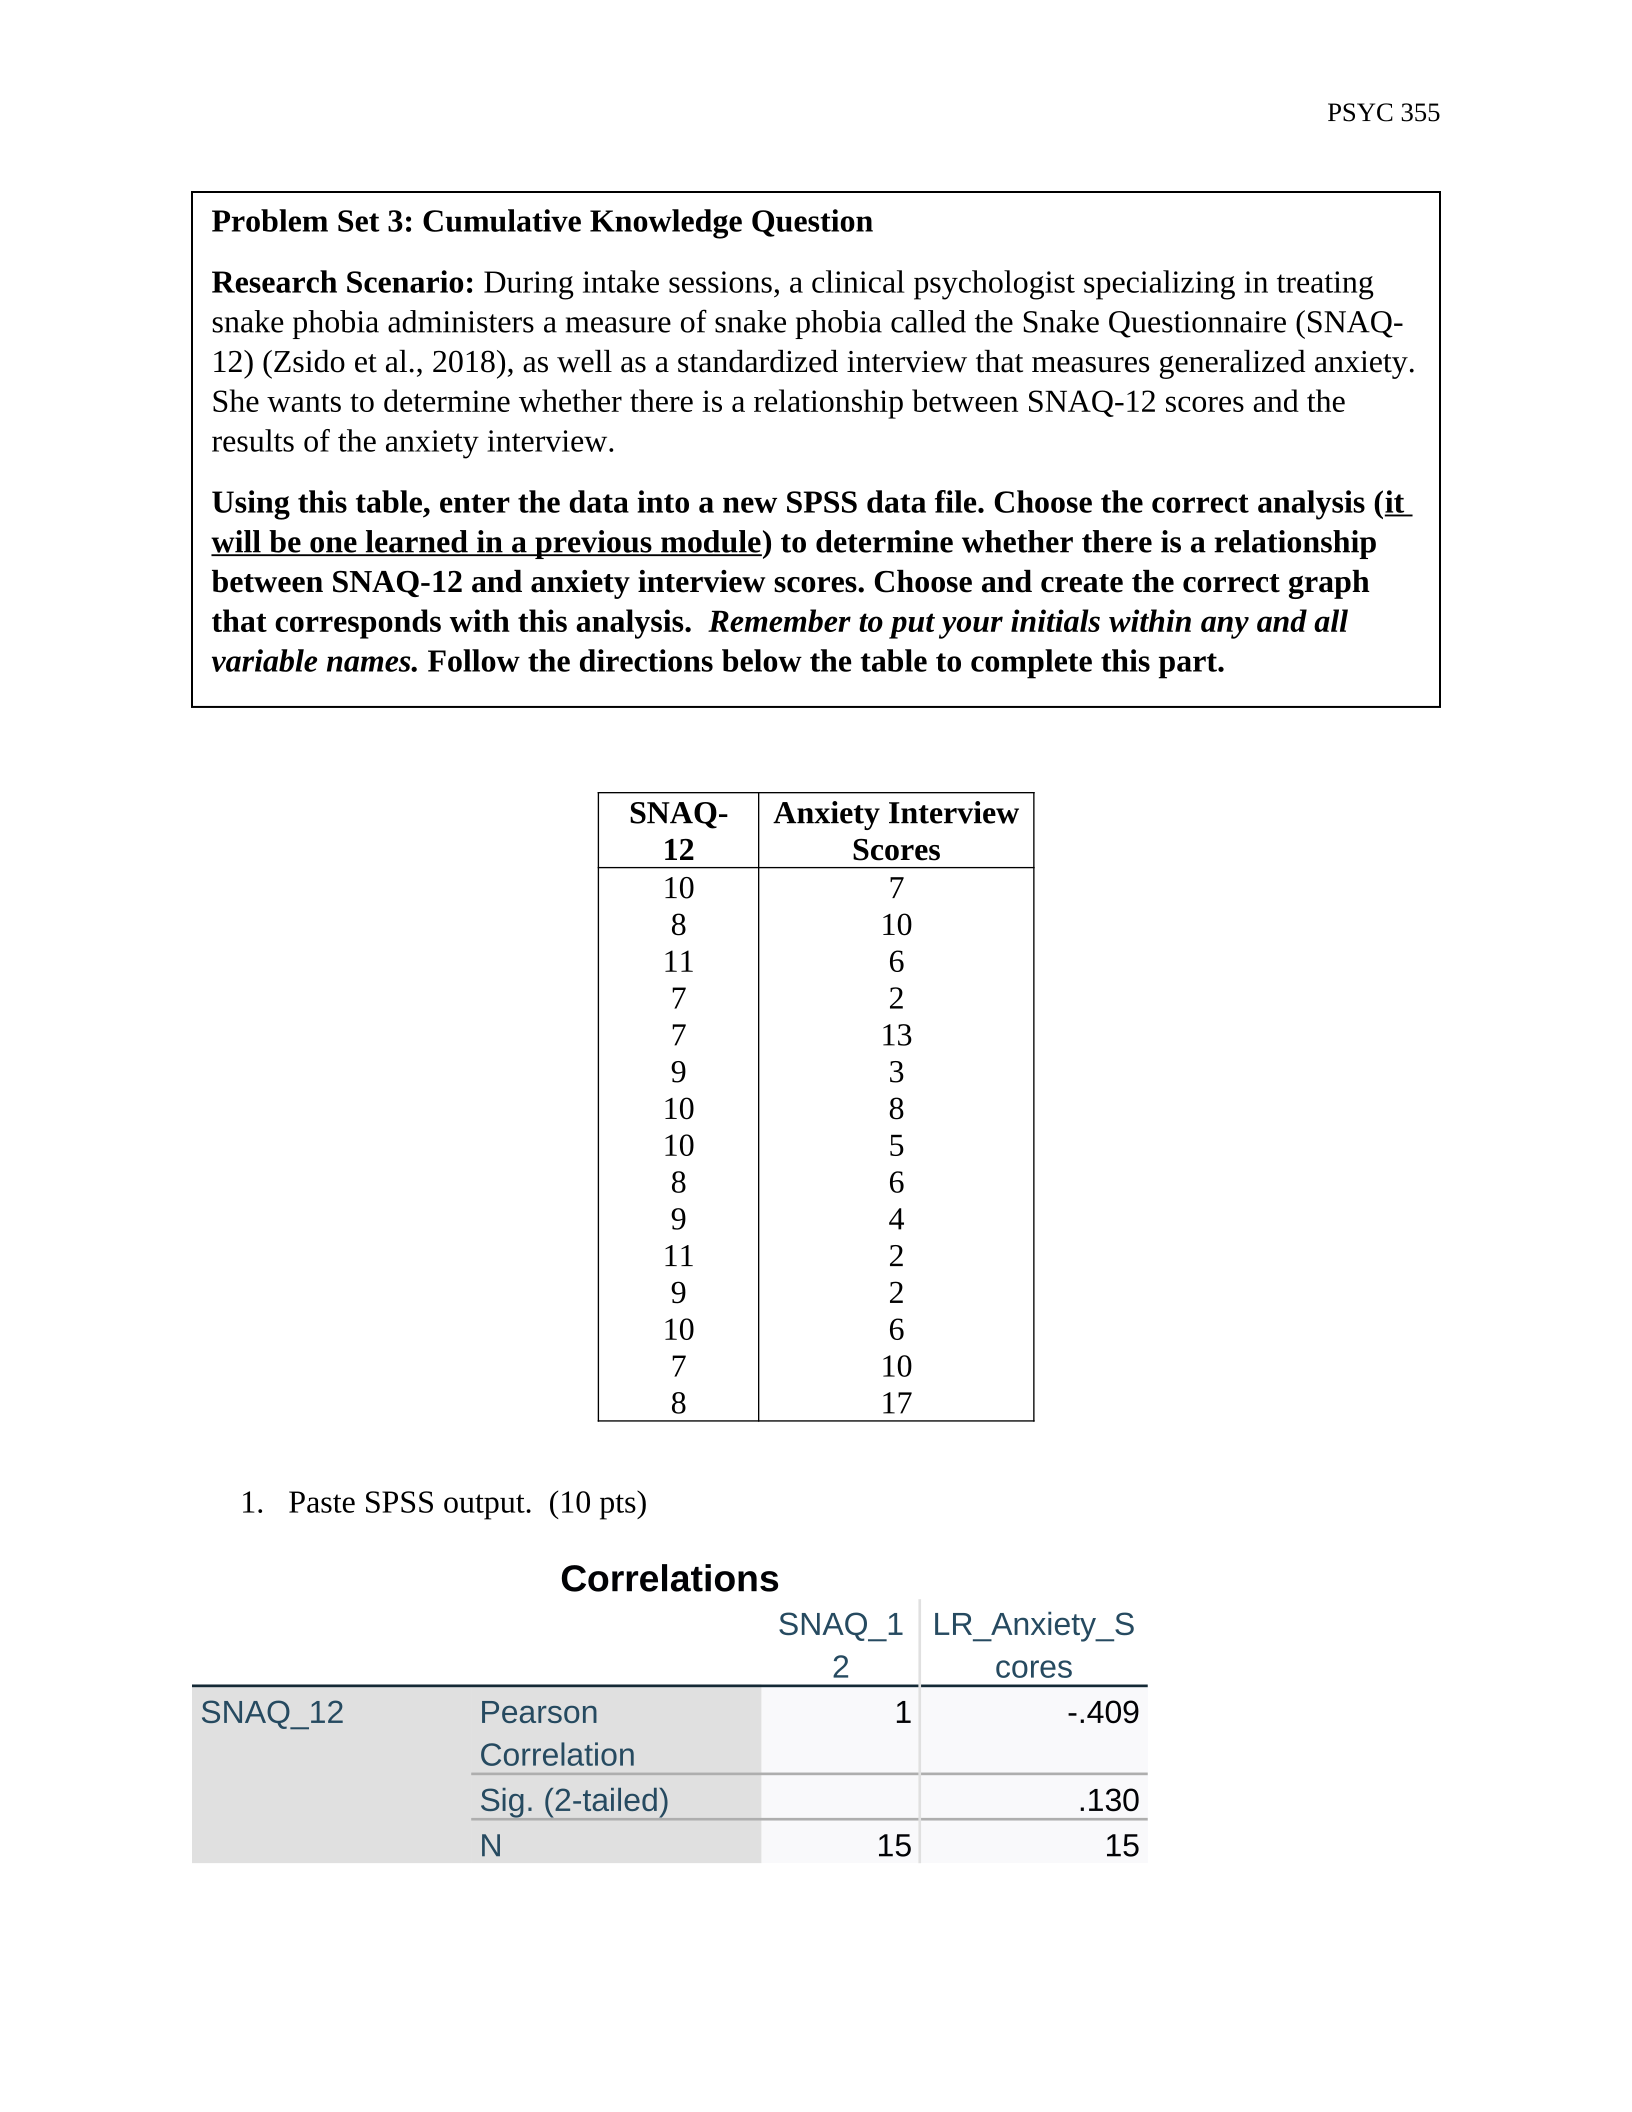
SNAQ-
12
Anxiety Interview
Scores
10 7
8 10
11 6
7 2
7 13
9 3
10 8
10 5
8 6
9 4
11 2
9 2
10 6
7 10
8 17
1. Paste SPSS output. (10 pts)
Correlations
SNAQ_1
2
LR_Anxiety_S
cores
SNAQ_12 Pearson
Correlation
1 -.409
Sig. (2-tailed) .130
N15 15
Problem Set 3: Cumulative Knowledge Question
Research Scenario: During intake sessions, a clinical psychologist specializing in treating
snake phobia administers a measure of snake phobia called the Snake Questionnaire (SNAQ-
12) (Zsido et al., 2018), as well as a standardized interview that measures generalized anxiety.
She wants to determine whether there is a relationship between SNAQ-12 scores and the
results of the anxiety interview.
Using this table, enter the data into a new SPSS data file. Choose the correct analysis (it
will be one learned in a previous module) to determine whether there is a relationship
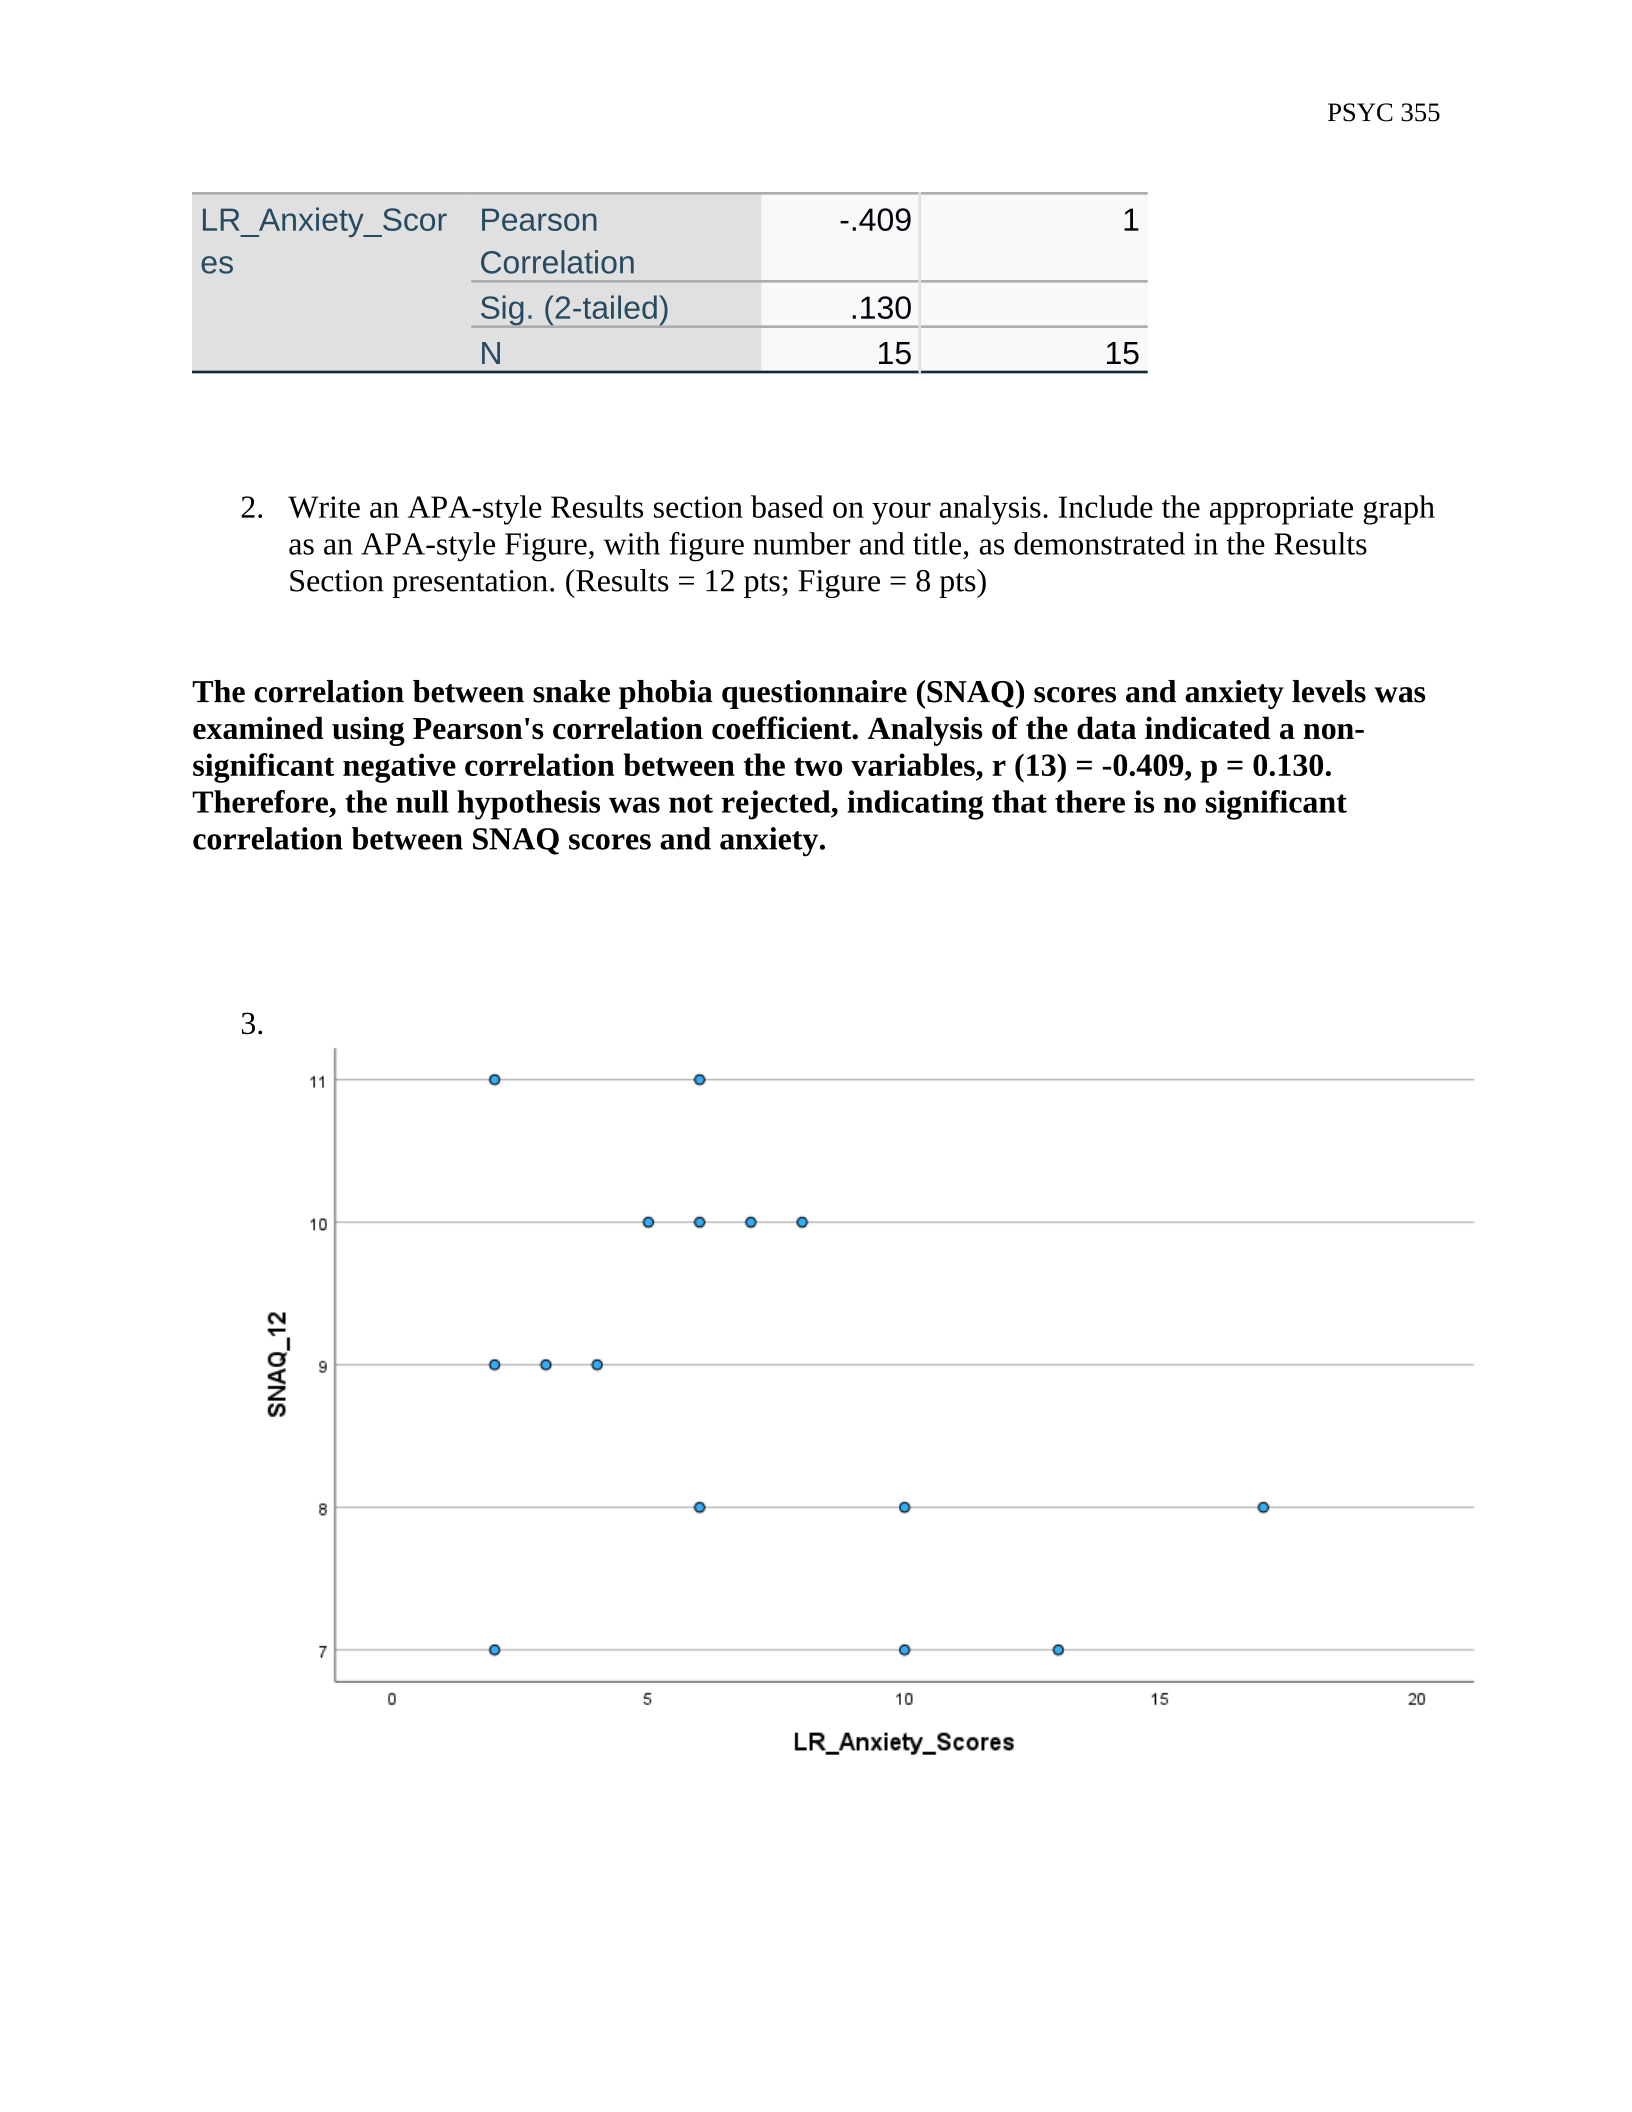
between SNAQ-12 and anxiety interview scores. Choose and create the correct graph
that corresponds with this analysis. Remember to put your initials within any and all
variable names. Follow the directions below the table to complete this part.
PSYC 355
LR_Anxiety_Scor
es
Pearson
Correlation
-.409 1
Sig. (2-tailed) .130
N15 15
2. Write an APA-style Results section based on your analysis. Include the appropriate graph
as an APA-style Figure, with figure number and title, as demonstrated in the Results
Section presentation. (Results = 12 pts; Figure = 8 pts)
The correlation between snake phobia questionnaire (SNAQ) scores and anxiety levels was
examined using Pearson's correlation coefficient. Analysis of the data indicated a non-
significant negative correlation between the two variables, r (13) = -0.409, p = 0.130.
Therefore, the null hypothesis was not rejected, indicating that there is no significant
correlation between SNAQ scores and anxiety.
3.
Powered by TCPDF (www.tcpdf.org)

