2
Target Behavior
The focus of this study revolves around monitoring participants' daily intake of water.
Here, we define water consumption as the act of drinking fluid, specifically purified water,
through the mouth. Participants will be provided with a 16 oz. bottle of purified water, and the
entirety of this water must be consumed to meet the study's criteria.
Observation Period
Water intake was assessed daily over a span of five days, running from April 8th to April
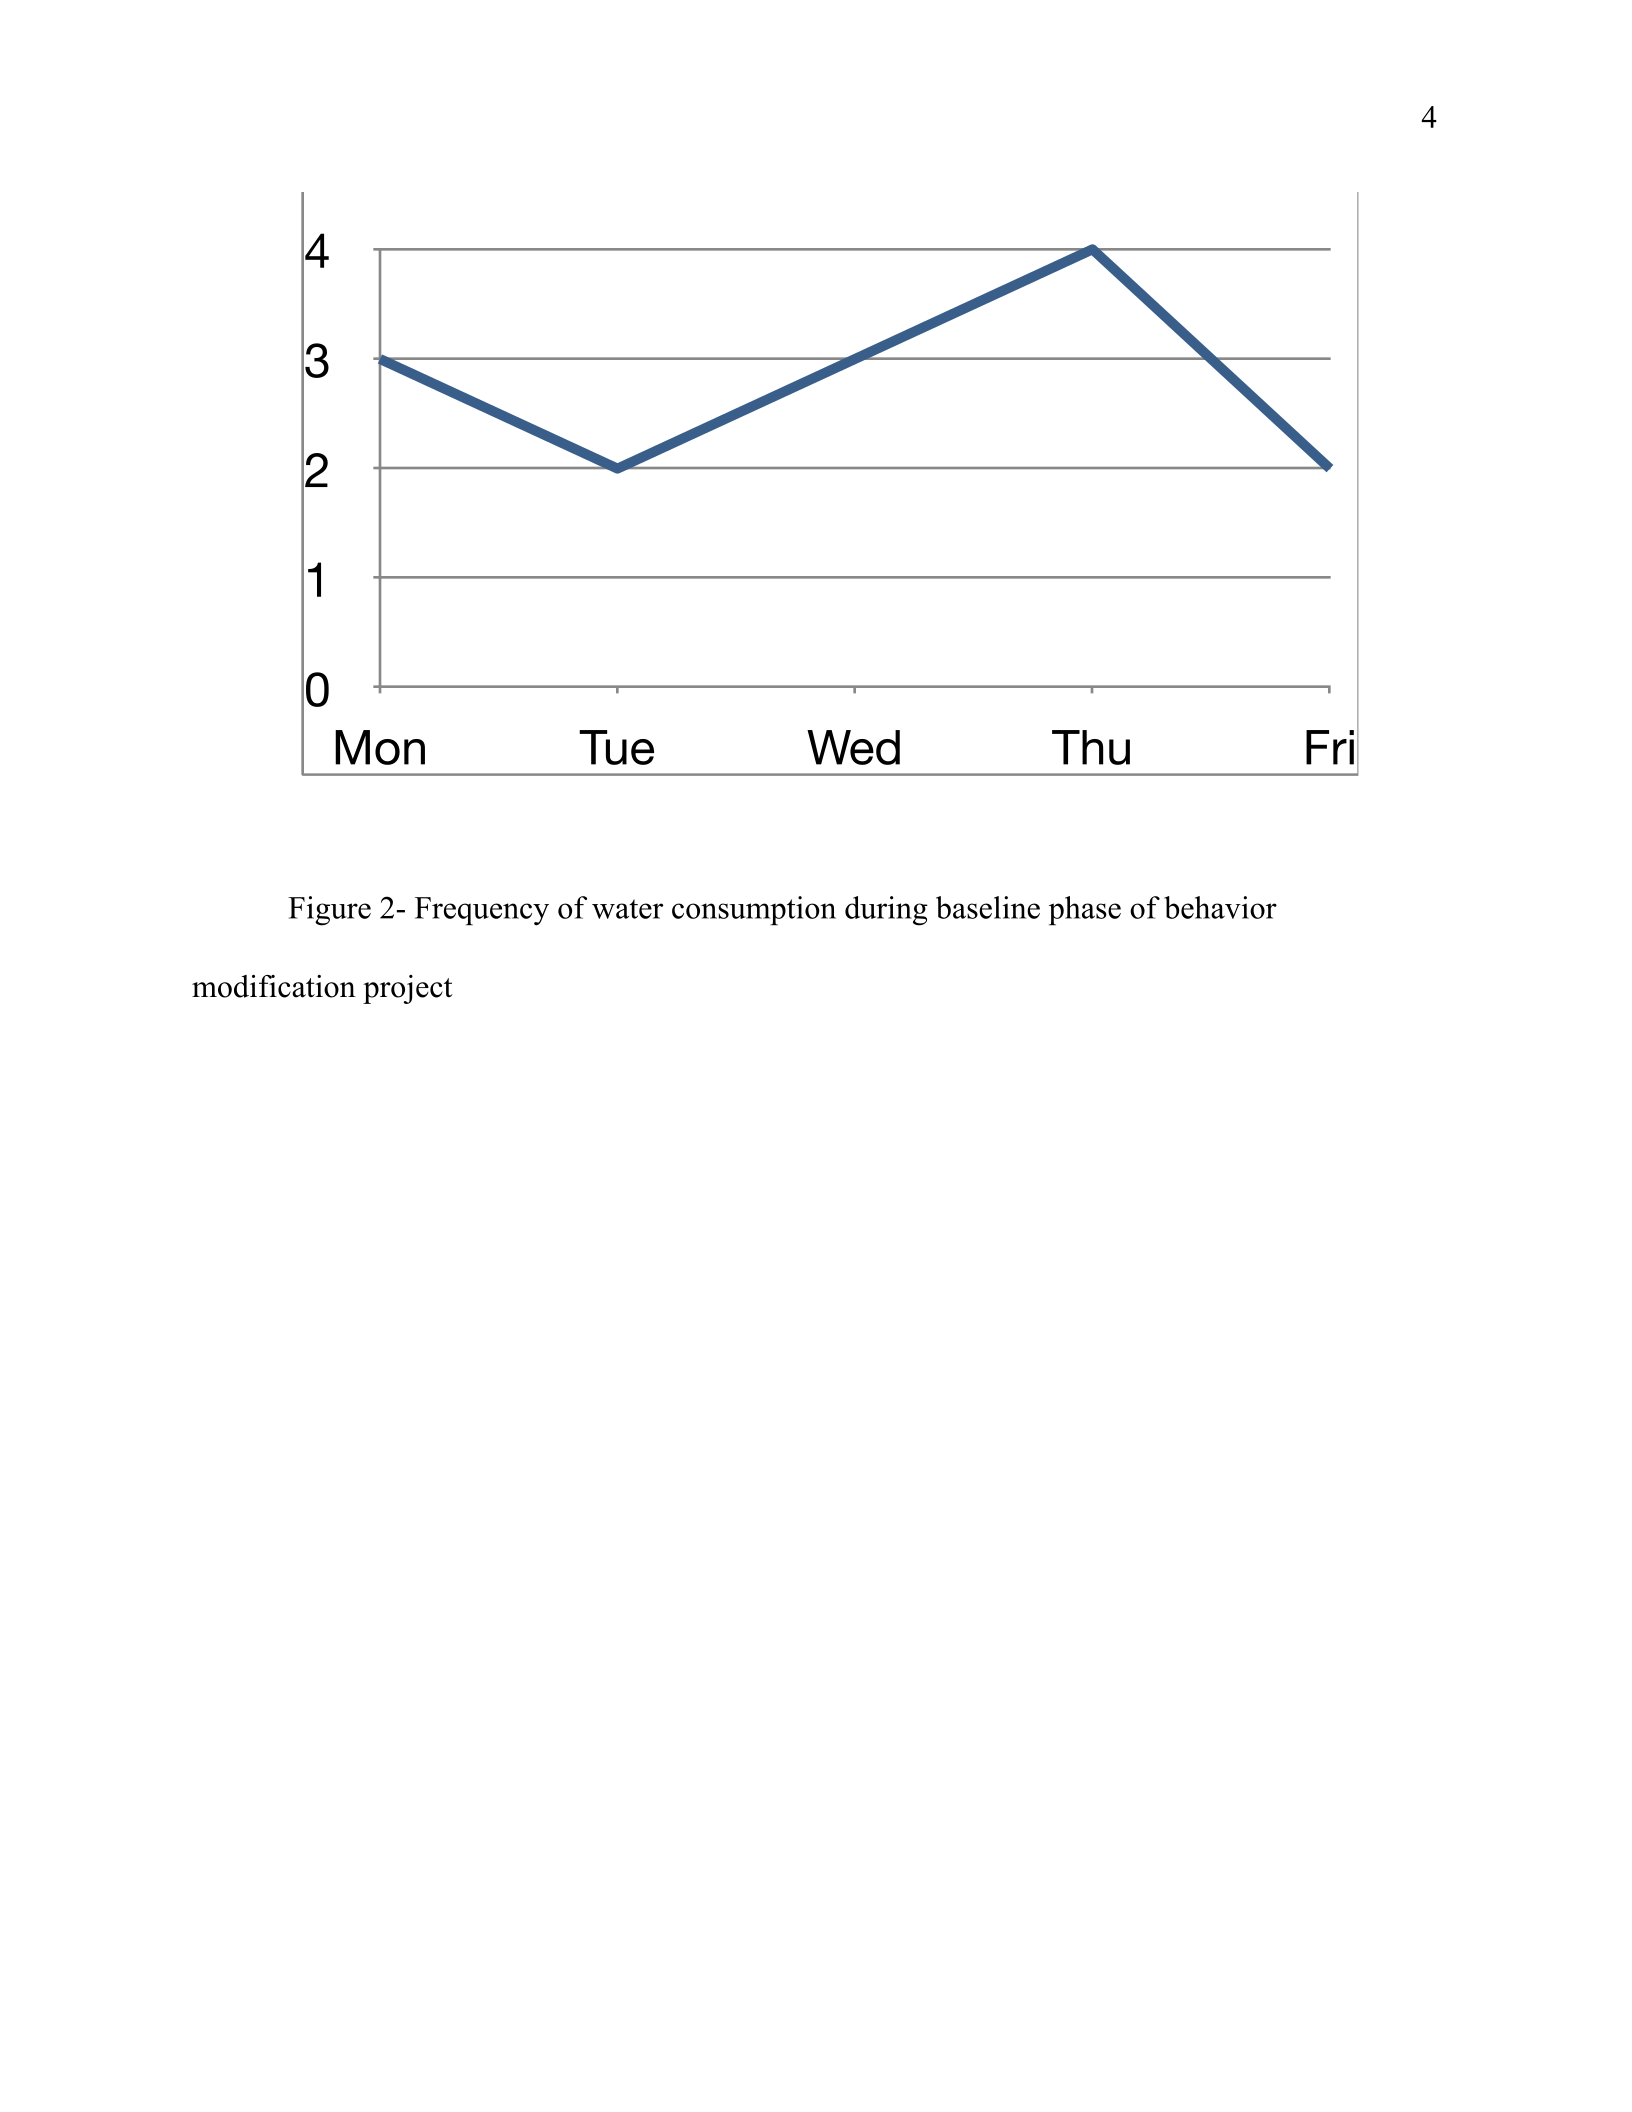
12th, 2024, within the baseline phase, spanning from 7 am to 4 pm. The x-axis of the graph
depicts the dates within the baseline phase: April 8th to April 12th, 2024.
Experiment Narrative
The experiment involved continuous monitoring according to a structured schedule,
conducted daily from Monday to Friday, within the participant's office environment.
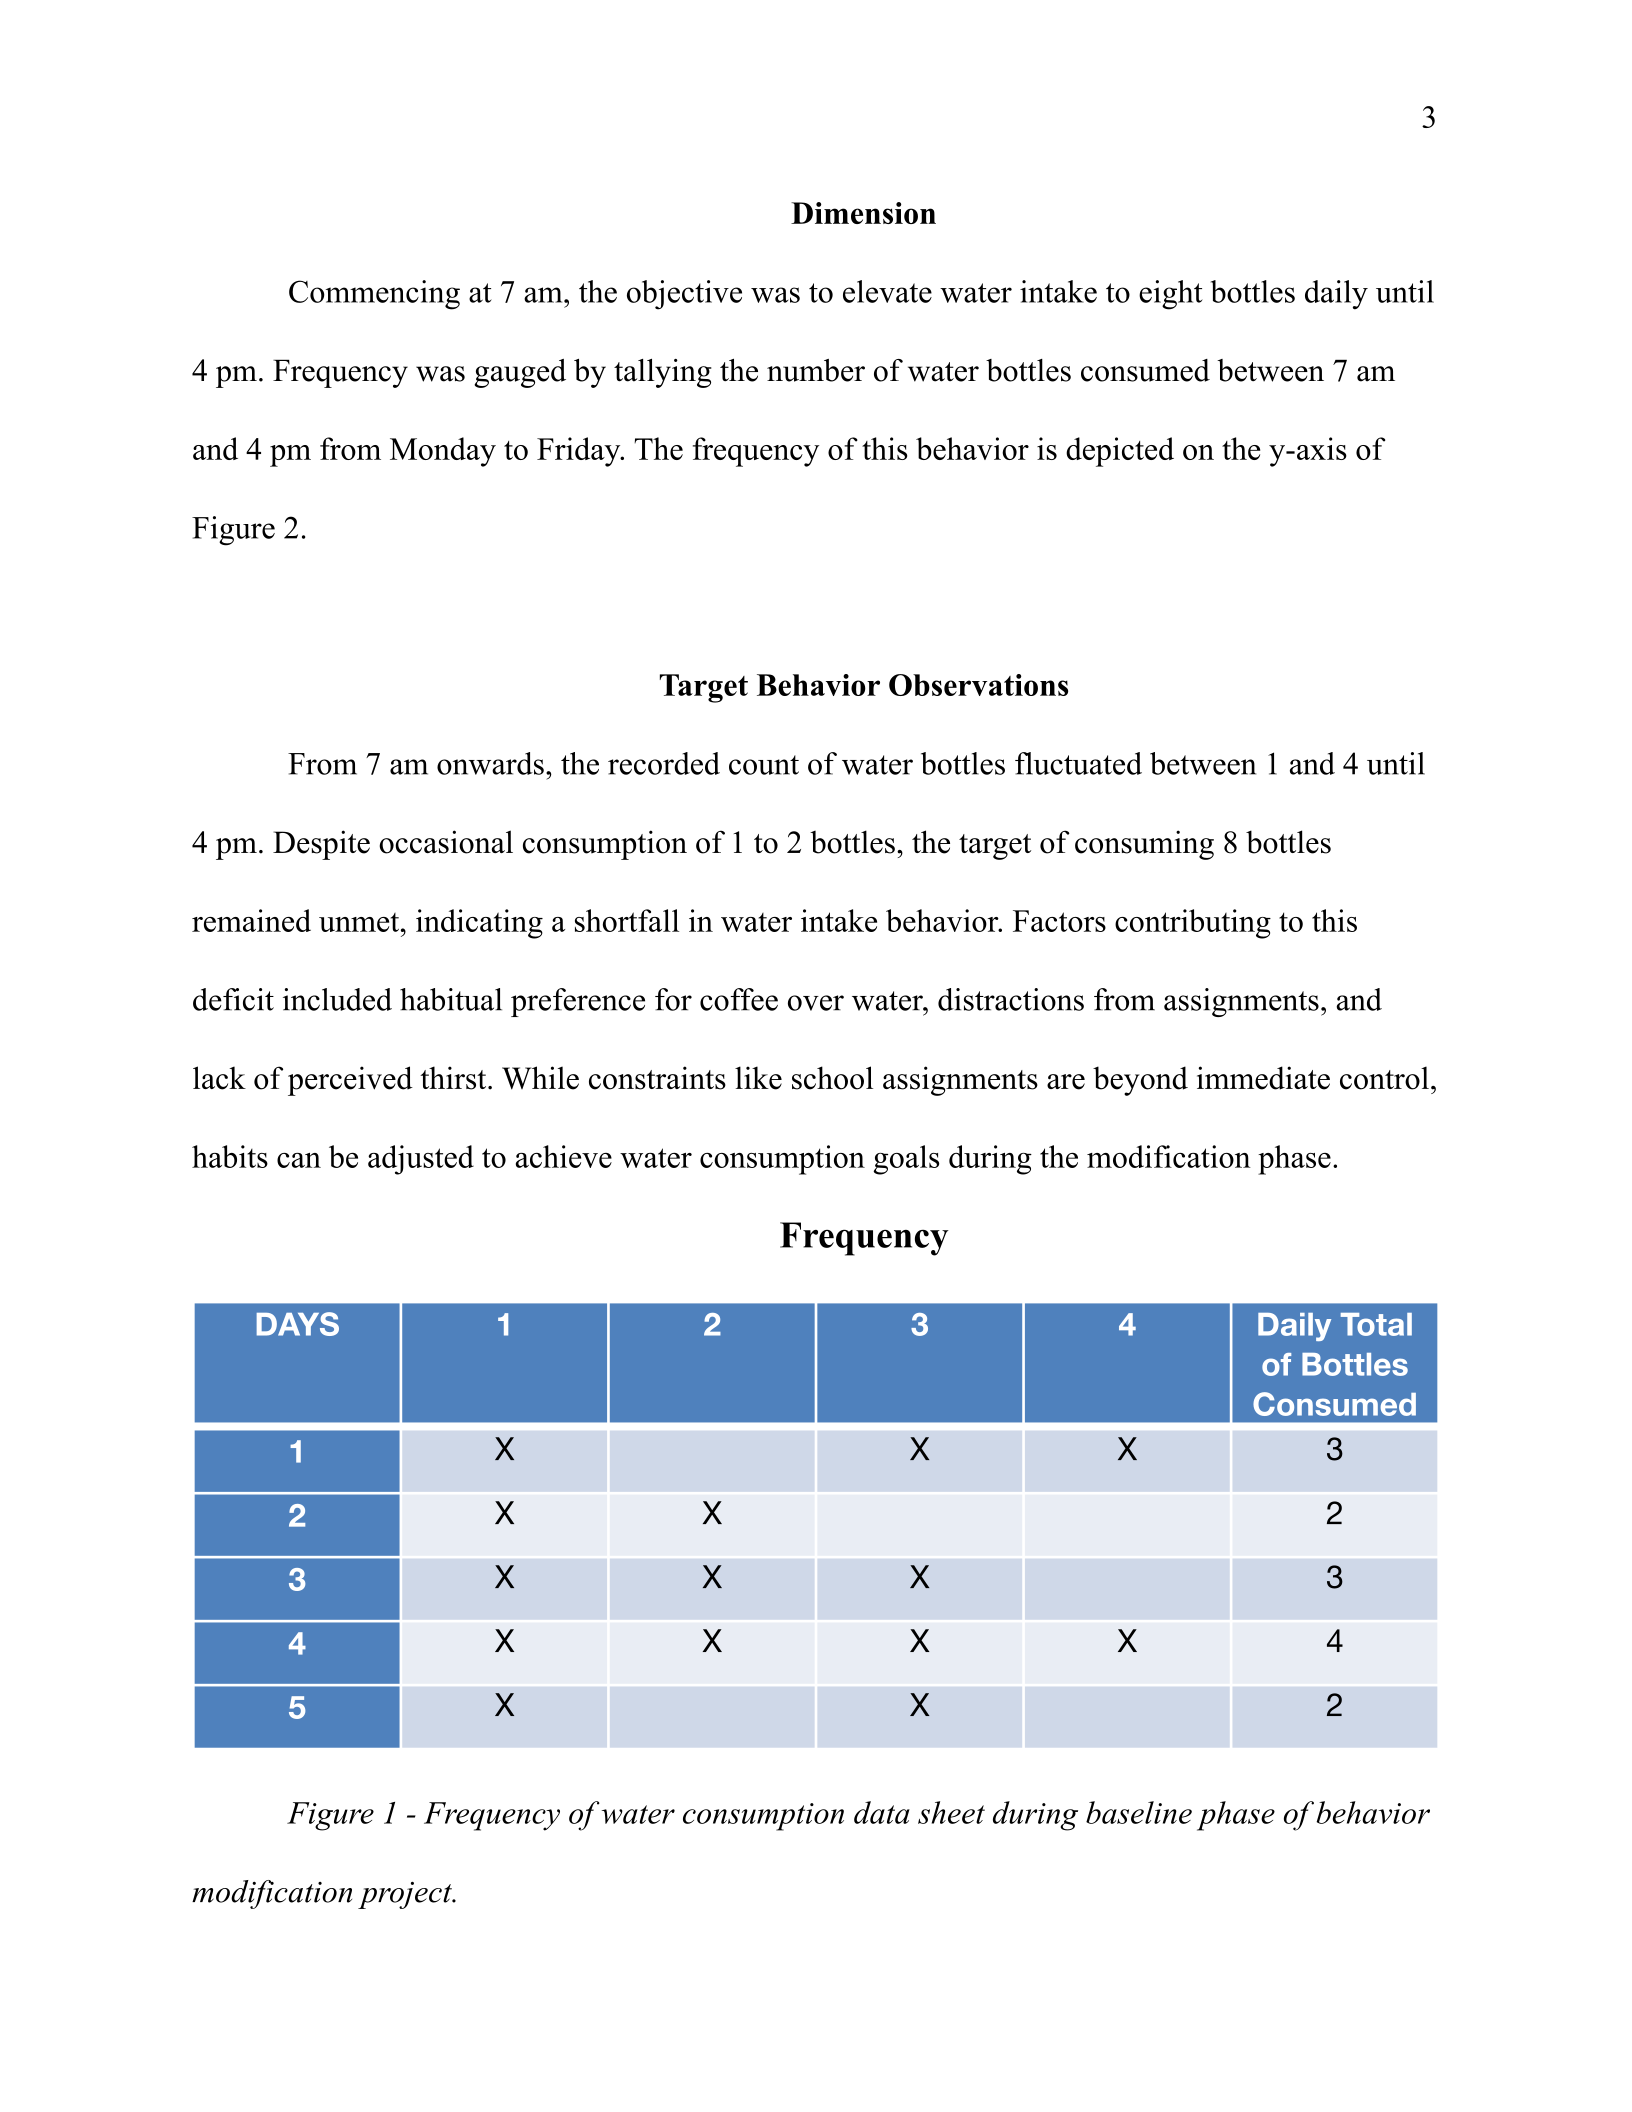
Measurements were self-monitored and documented on paper using a frequency data sheet (see
Figure 1). Each consumed water bottle was denoted by an "x" on the sheet, tallying the total
count by the end of the day. Following the observation period, the collected data was
transformed into a graph illustrating the participant's daily water consumption frequency (refer to
Figure 2).
3
Dimension
Commencing at 7 am, the objective was to elevate water intake to eight bottles daily until
4 pm. Frequency was gauged by tallying the number of water bottles consumed between 7 am
and 4 pm from Monday to Friday. The frequency of this behavior is depicted on the y-axis of
Figure 2.
Target Behavior Observations
From 7 am onwards, the recorded count of water bottles fluctuated between 1 and 4 until
4 pm. Despite occasional consumption of 1 to 2 bottles, the target of consuming 8 bottles
remained unmet, indicating a shortfall in water intake behavior. Factors contributing to this
deficit included habitual preference for coffee over water, distractions from assignments, and
lack of perceived thirst. While constraints like school assignments are beyond immediate control,
habits can be adjusted to achieve water consumption goals during the modification phase.
Frequency
Figure 1 - Frequency of water consumption data sheet during baseline phase of behavior
modification project.
DAYS
1
2
3
4
Daily Total
of Bottles
Consumed
1
X
X
X
3
2
X
X
2
3
X
X
X
3
4
X
X
X
X
4
5
X
X
2