


2
TUTORIAL E STATISTICA ASSIGNMENT
Tutorial E Summary
The data analyzed in tutorial E allowed for close examination of variables using data
mining strategies including Support Vector Machine (SVM), Histogram of Importance, and other
predicting software algorithms. Specifically, the data examined was obesity and conditions of
weight loss and other related variables. The analysis of the data will be highly useful for future
data mining projects through the techniques utilized. Using the feature selection, specific
variables were chosen for further examination and to examine predictions. Importance plot and
an ANOVA analysis was obtained to examine any potential relationships and associations. Data
mining recipes allowed for data exploration and to see which models were useful to apply
towards the data. The validity and reliability of the models were also seen throughout. The
importance of continual testing was highlighted because of changes within the population and
environment. This information would be of great use when applied to real world examples to
assess the reliability and validity of the data as well as to examine relationships and most useful
algorithm predictions of the data. Beta procedures option appear to be utilized in the version 12
software. However, after some digging, the beta procedures were not found to be available in the
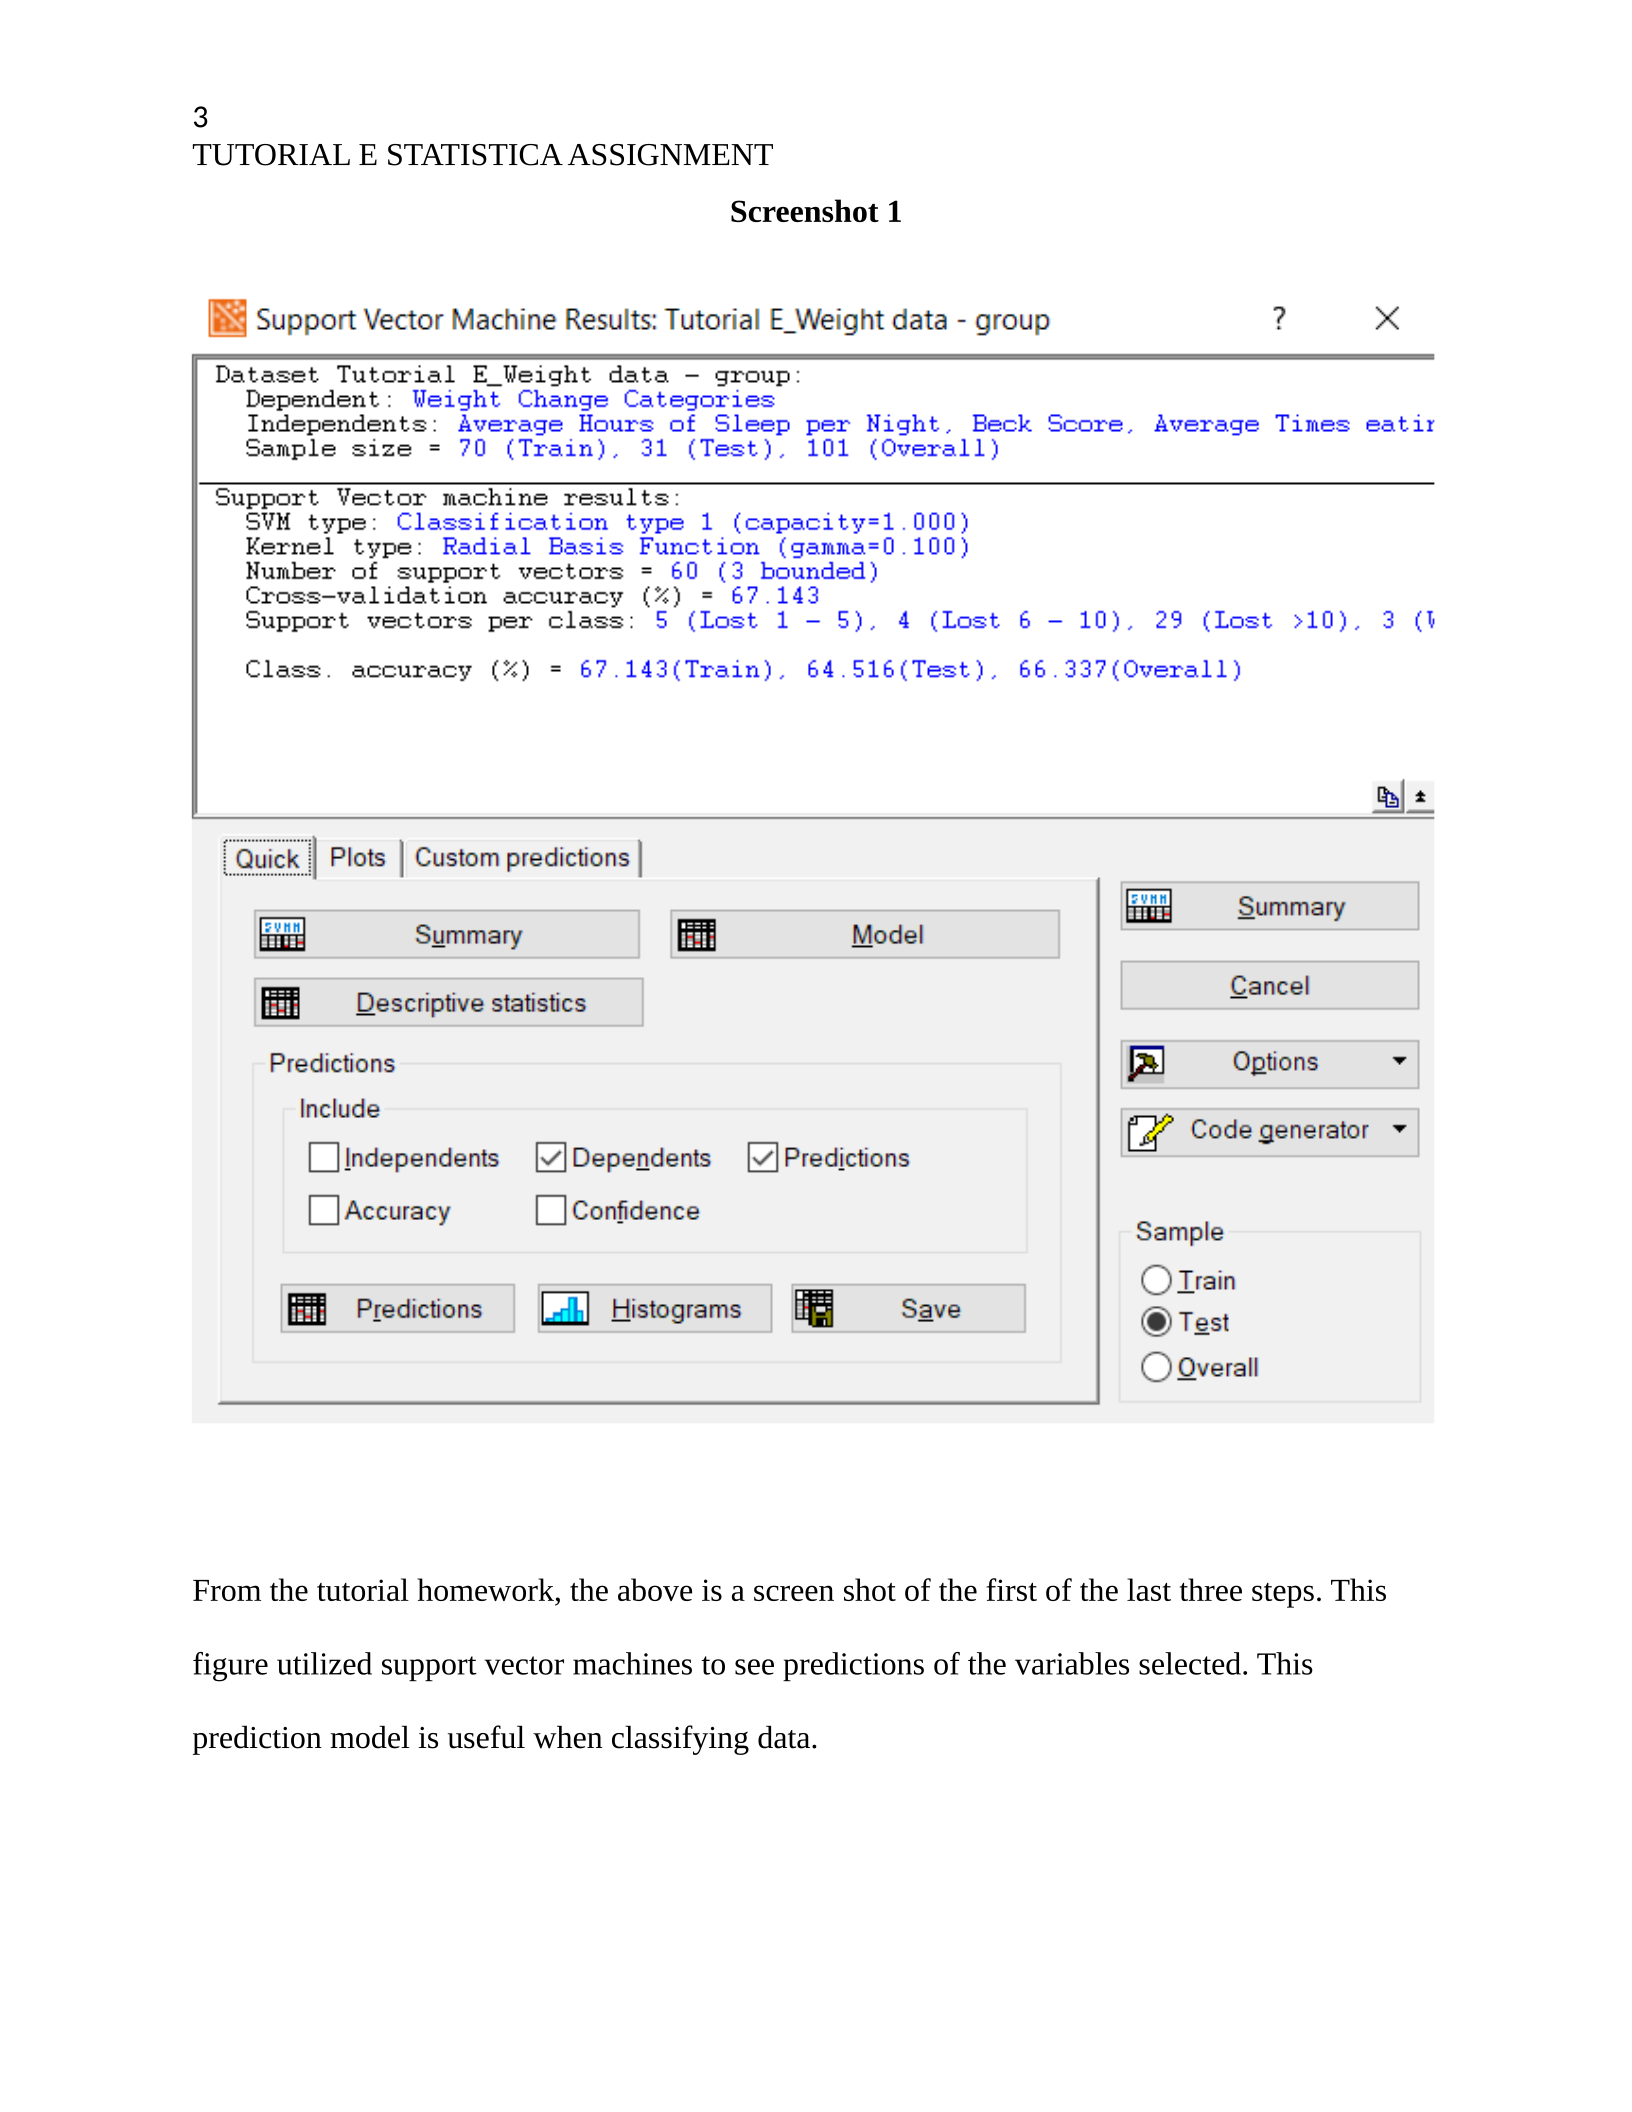
13.5 software. Real world application will be analyzed with each screenshot below.
4
TUTORIAL E STATISTICA ASSIGNMENT
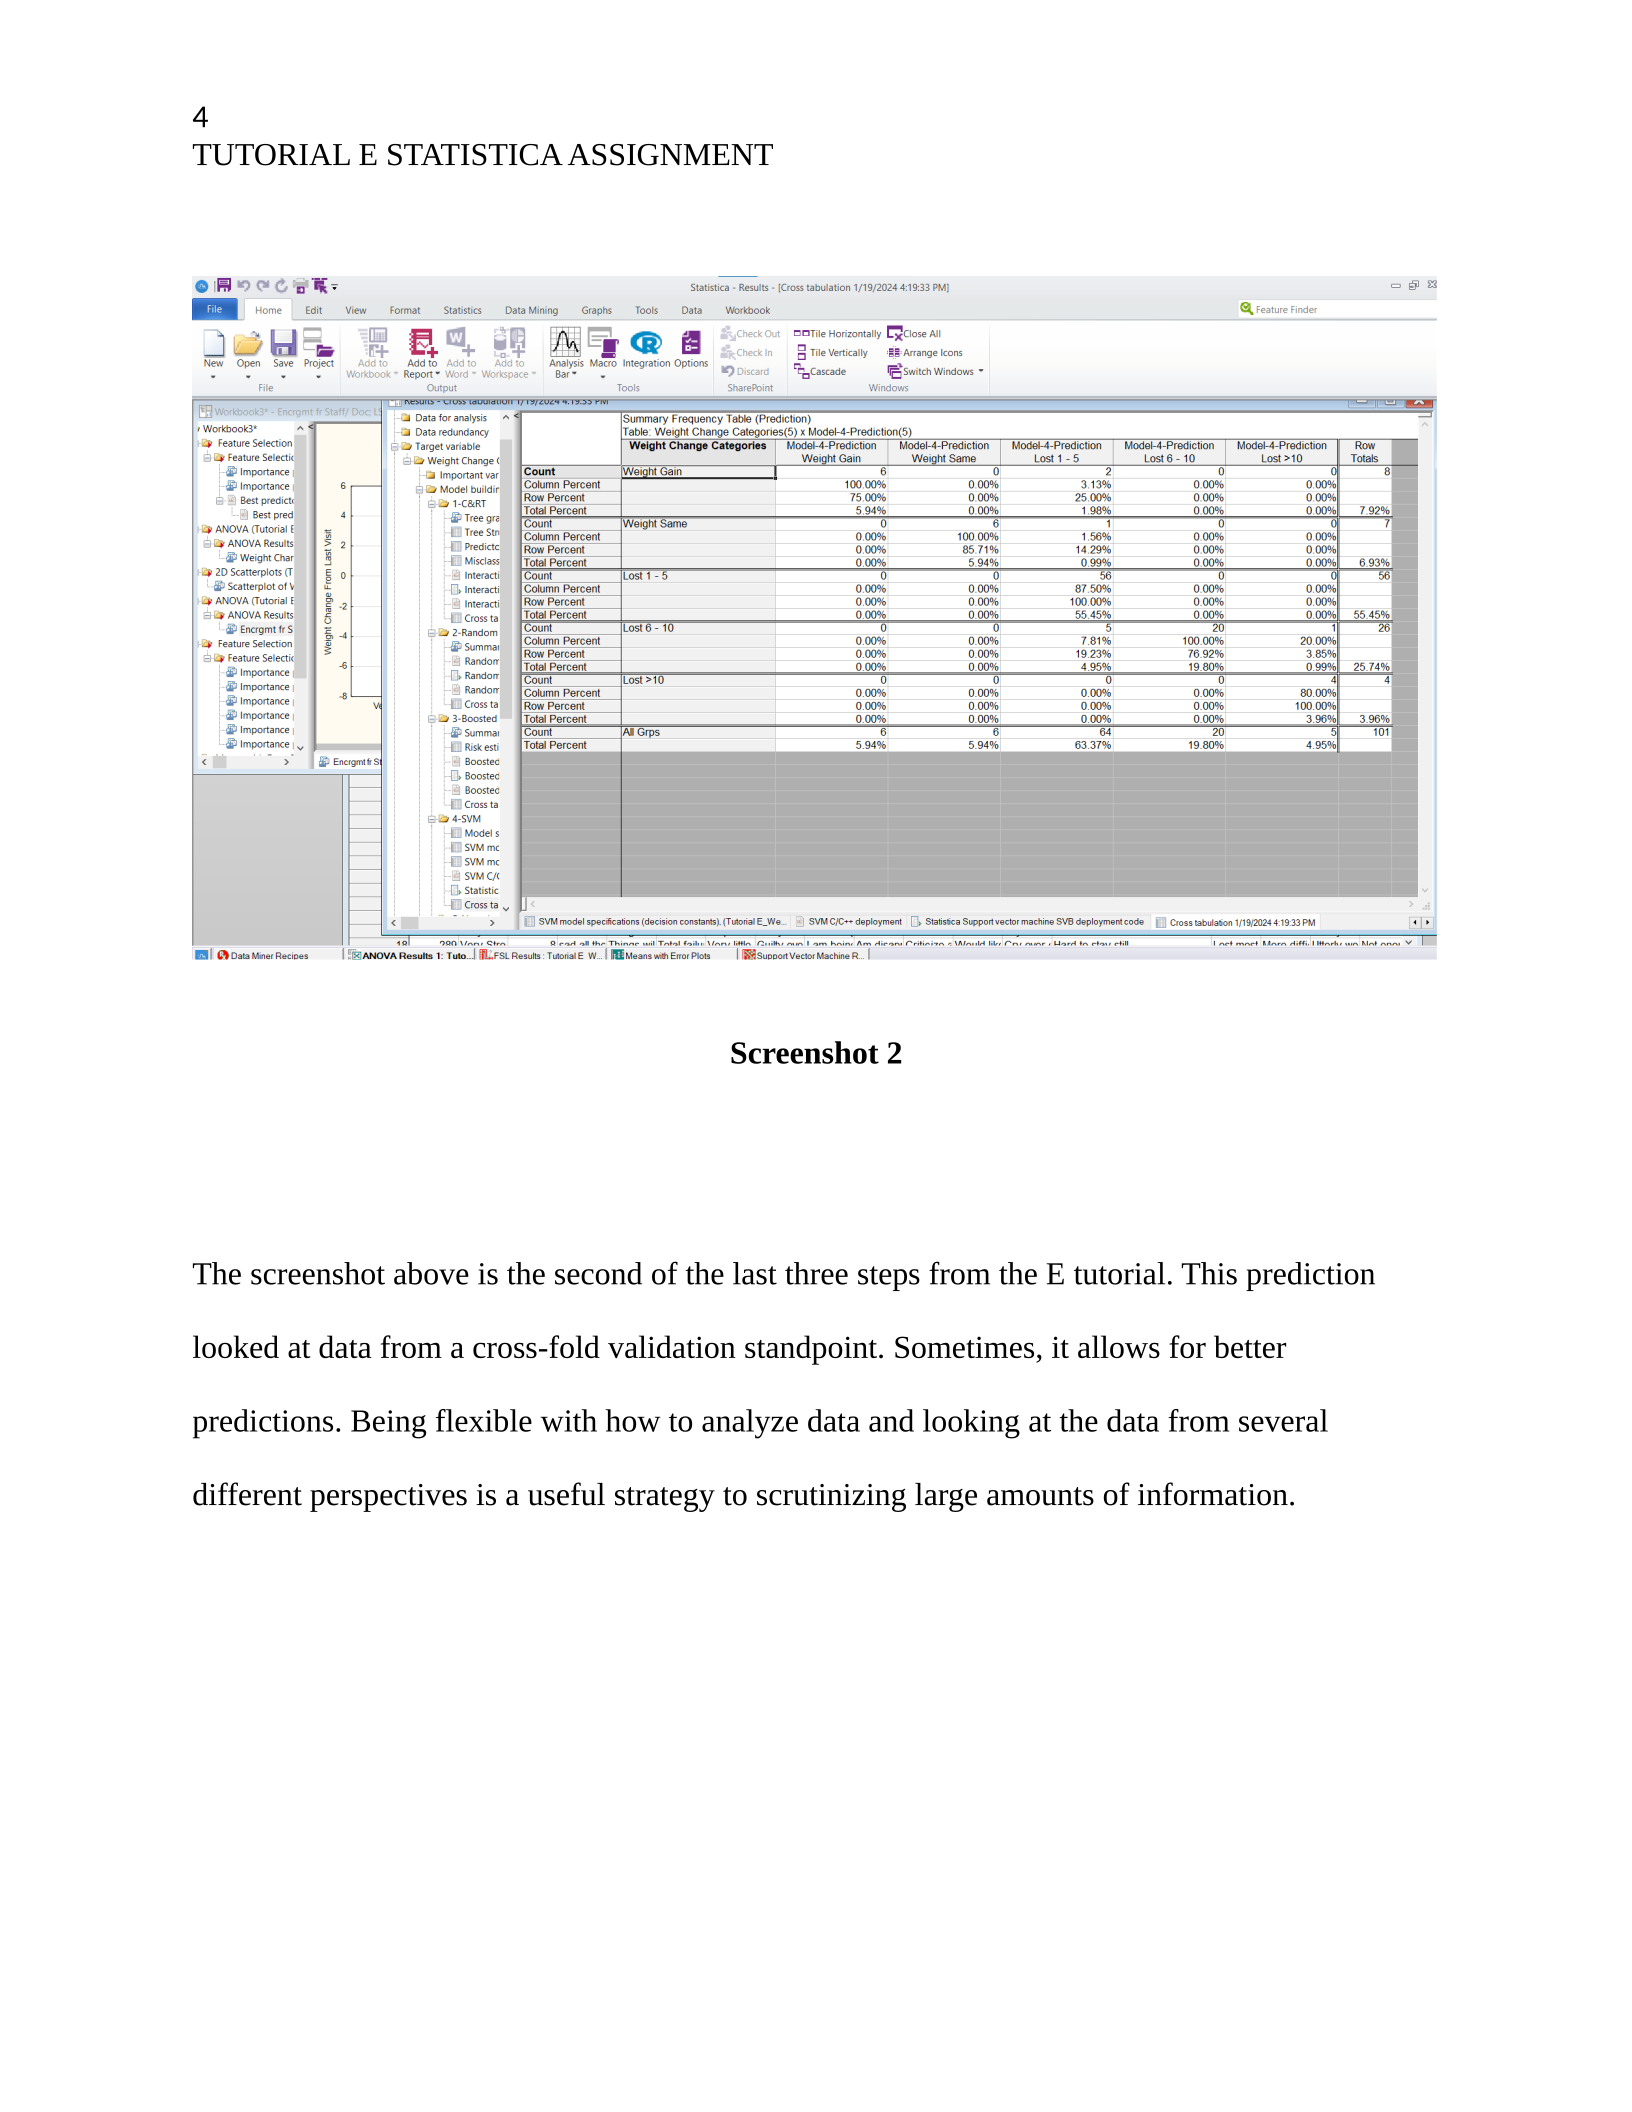
Screenshot 2
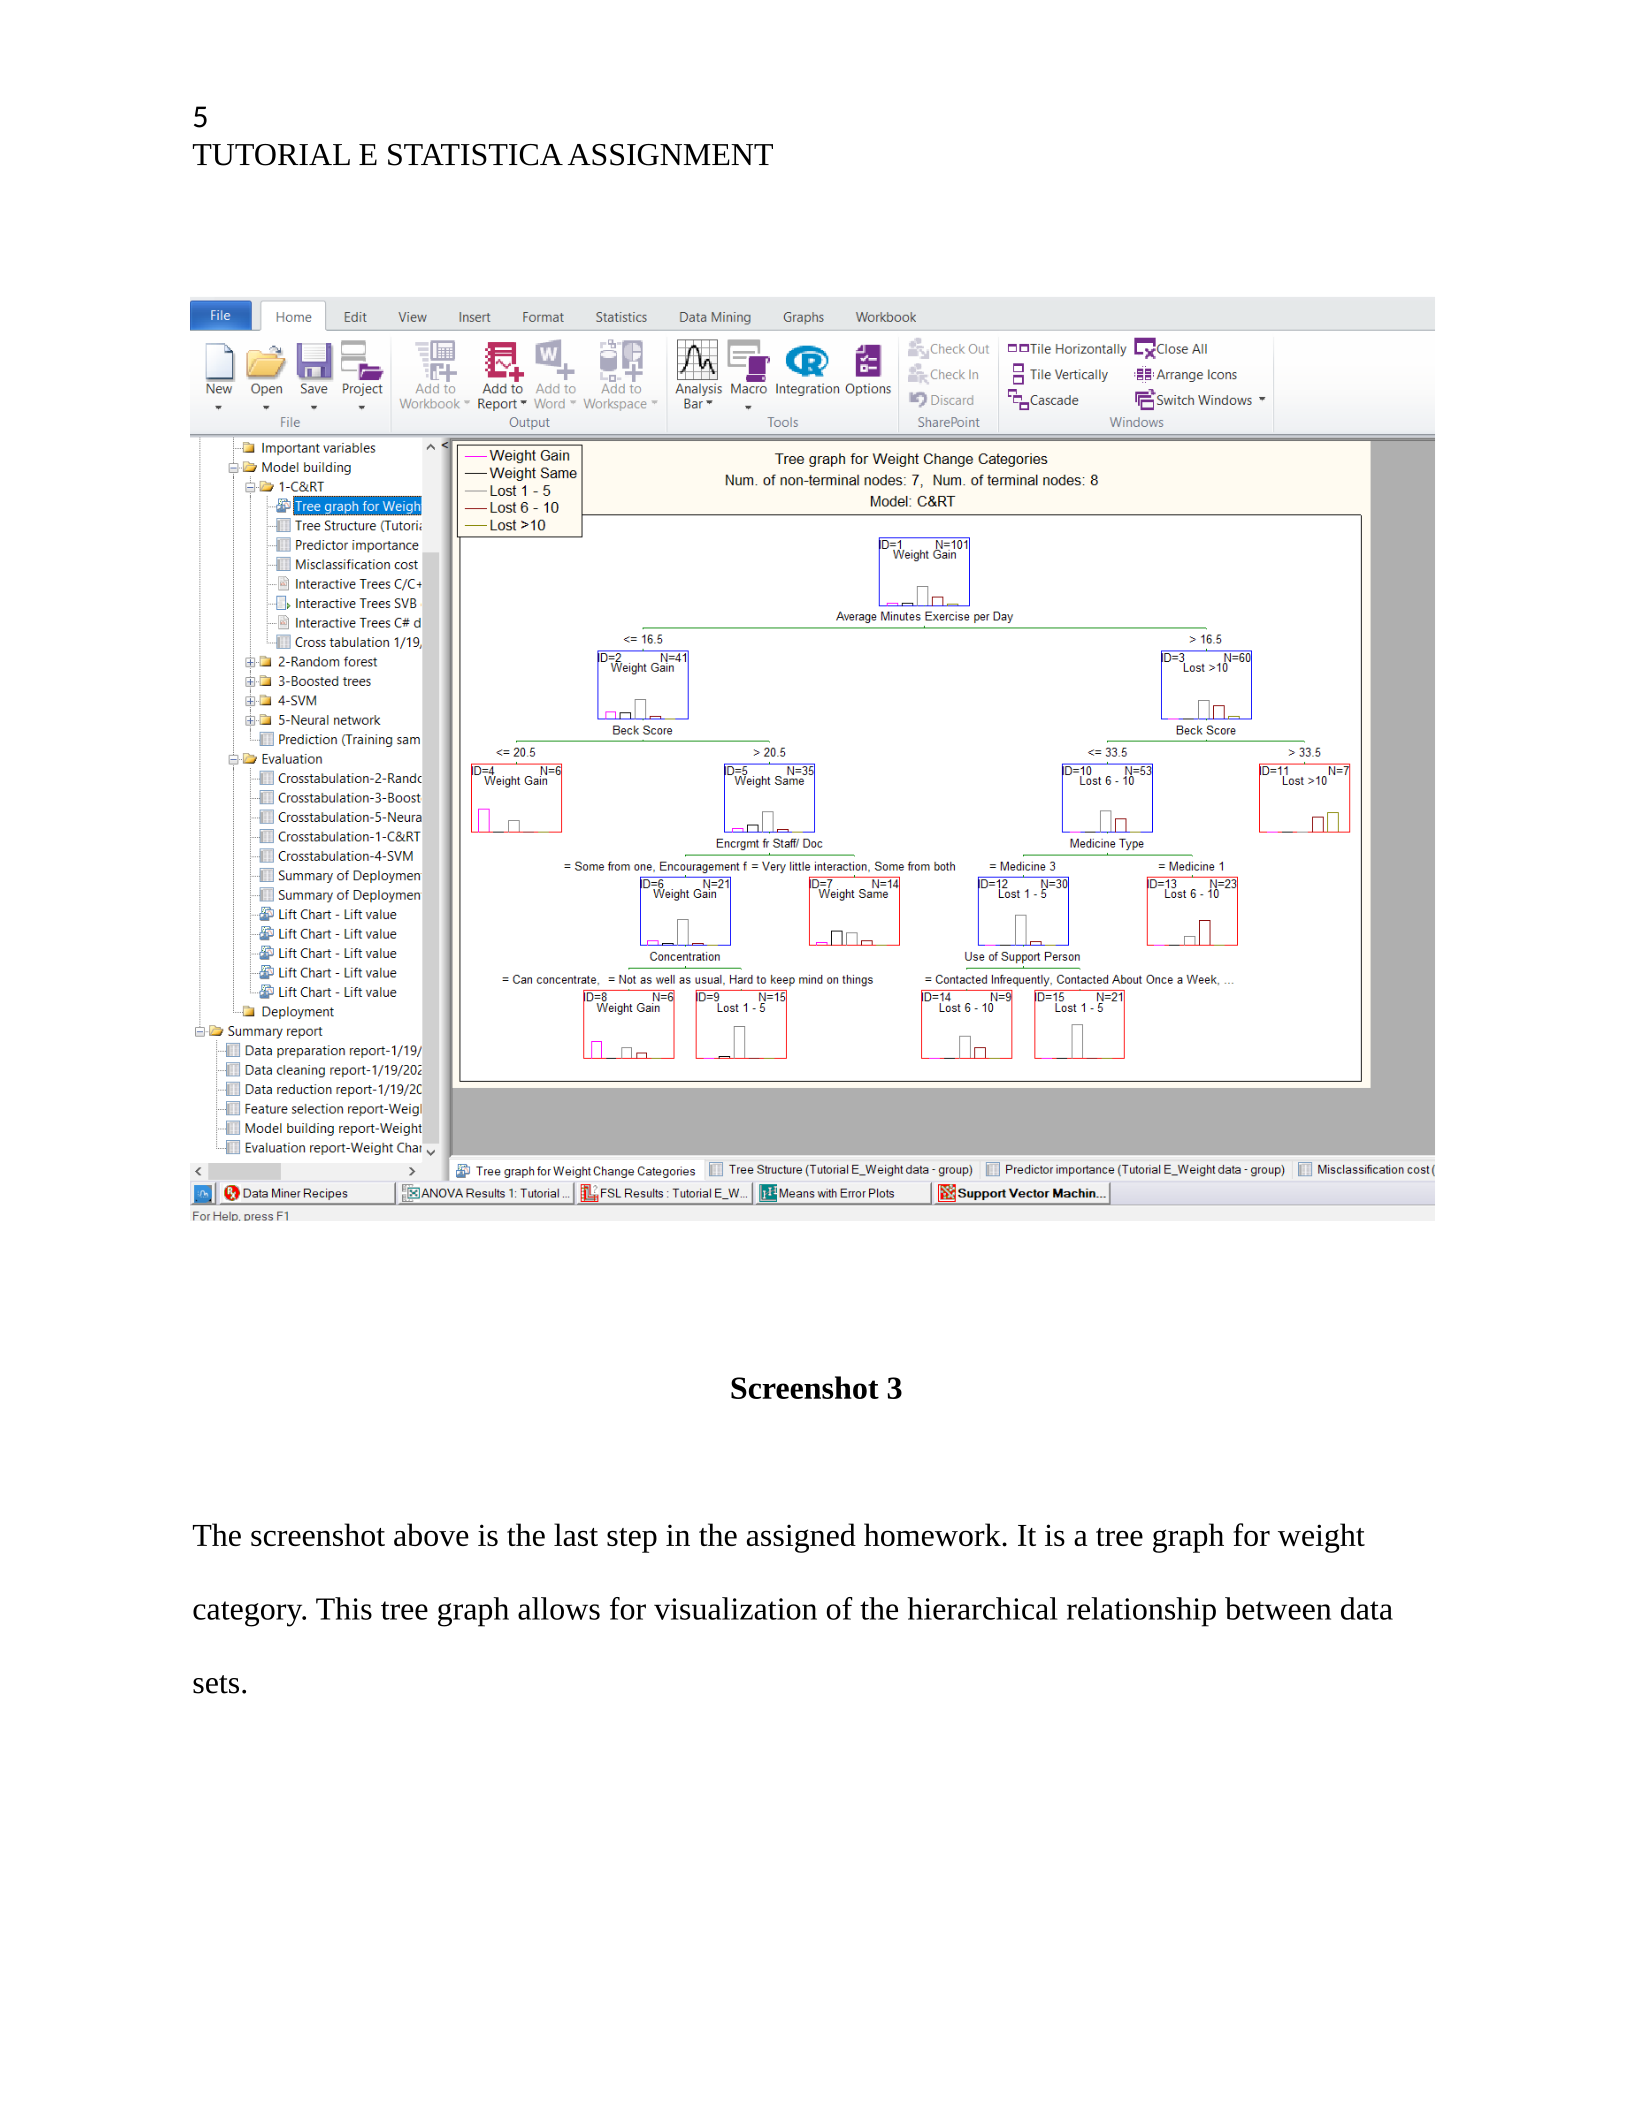
The screenshot above is the second of the last three steps from the E tutorial. This prediction
looked at data from a cross-fold validation standpoint. Sometimes, it allows for better
predictions. Being flexible with how to analyze data and looking at the data from several
different perspectives is a useful strategy to scrutinizing large amounts of information.
6
TUTORIAL E STATISTICA ASSIGNMENT
References
Winters-Miner, L. A., Hill, T., Bolding, P. S., Nisbet, R., Hilbe, J. M., Walton, N., Goldstein, M.,
& Miner, G. (2015). Tutorial E. In@Practical predictive analytics and decisioning systems
for Medicine: Informatics Accuracy and cost-effectiveness for healthcare administration
and delivery including Medical Research@(pp. 359–387). essay, Elsevier, AP
Powered by TCPDF (www.tcpdf.org)

