


*ARTICLE PDF ATTACHED
5 page critical review on the provided speed and agility articles. At least 3 additional references of the
original research article must be cited in current APA format within the review.
Include at least 3 additional references to defend your analysis. Reference articles as a PDF with your
assignment
______________________________________________________________
ESSAY FORMAT
A. Background (Section One: Reason for article choice AND importance)
undefined
1. Reason for Article Selection and Importance/Relationship to Speed and Agility for Elite Athletes
2. Introduction
3. Methods
1. Consider the strength and weaknesses of the research study’s design.
undefined
B. Summary (Section Two: Significance)
undefined
1. Results
2. Discussion
1. Consider the strength and weaknesses of the authors’ discussion section.
3. Conclusion

Influence of Strength on Magnitude and
Mechanisms of Adaptation to Power Training
PRUE CORMIE
1
, MICHAEL R. MCGUIGAN
2,3
, and ROBERT U. NEWTON
1
1
School of Exercise, Biomedical and Health Sciences, Edith Cowan University, Perth, AUSTRALIA;
2
New Zealand Academy
of Sport North Island, Auckland, NEW ZEALAND; and
3
Institute of Sport and Recreation Research New Zealand,
Auckland University of Technology, Auckland, NEW ZEALAND
ABSTRACT
CORMIE, P., M. R. MCGUIGAN, and R. U. NEWTON. Influence of Strength on Magnitude and Mechanisms of Adaptation to
Power Training. Med. Sci. Sports Exerc., Vol. 42, No. 8, pp. 1566–1581, 2010. Purpose: To determine whether the magnitude of
performance improvements and the mechanisms driving adaptation to ballistic power training differ between strong and weak indi-
viduals. Methods: Twenty-four men were divided into three groups on the basis of their strength level: stronger (n= 8, one-repetition
maximum-to-body mass ratio (1RM/BM) = 1.97 T0.08), weaker (n= 8, 1RM/BM = 1.32 T0.14), or control (n= 8, 1RM/BM = 1.37 T
0.13). The stronger and weaker groups trained three times per week for 10 wk. During these sessions, subjects performed maximal-
effort jump squats with 0%–30% 1RM. The impact of training on athletic performance was assessed using a 2-d testing battery
that involved evaluation of jump and sprint performance as well as measures of the force–velocity relationship, jumping mechanics,
muscle architecture, and neural drive. Results: Both experimental groups showed significant (Pe0.05) improvements in jump
(stronger: peak power = 10.0 T5.2 WIkg
j1
, jump height = 0.07 T0.04 m; weaker: peak power = 9.1 T2.3 WIkg
j1
, jump height =
0.06 T0.04 m) and sprint performance after training (stronger: 40-m time = j2.2% T2.0%; weaker: 40-m time = j3.6% T2.3%).
Effect size analyses revealed a tendency toward practically relevant differences existing between stronger and weaker individuals in the
magnitude of improvements in jump performance (effect size: stronger: peak power = 1.55, jump height = 1.46; weaker: peak power =
1.03, jump height = 0.95) and especially after 5 wk of training (effect size: stronger: peak power = 1.60, jump height = 1.59; weaker:
peak power = 0.95, jump height = 0.61). The mechanisms driving these improvements included significant (Pe0.05) changes in the
force–velocity relationship, jump mechanics, and neural activation, with no changes to muscle architecture observed. Conclusions: The
magnitude of improvements after ballistic power training was not significantly influenced by strength level. However, the training had a
tendency toward eliciting a more pronounced effect on jump performance in the stronger group. The neuromuscular and biomechanical
mechanisms driving performance improvements were very similar for both strong and weak individuals. Key Words: BALLISTIC,
JUMP, SQUAT, SPRINT, NEUROMUSCULAR ADAPTATIONS
After strength training, the magnitude of improve-
ments in strength and the mechanisms driving
those adaptations differ as the strength level of
the athlete improves (14,17,33,37). Specifically, initial im-
provements in strength are much greater and predomi-
nately driven by neural adaptations (although early phase
muscular adaptations also occur), whereas further increases
in strength are progressively harder to achieve and morphol-
ogical adaptations in the muscle become more important
(14,17,33,37). Thus, training programs geared at signifi-
cantly improving strength in individuals with an existing
high level of strength require a much more sophisticated de-
sign (i.e., greater specificity and variation) (17,33). Although
the factors contributing to maximal strength and the appli-
cation of strength training are well understood, much less is
known concerning the adaptations to and utilization of bal-
listic power training. In particular, the influence of strength
level on both the magnitude of improvement and the mech-
anisms driving adaptation after ballistic power training is not
known. Such knowledge is vital to the development of train-
ing programs that most effectively improve maximal power
production and athletic performance in athletes with a wide
variety of training backgrounds.
Cross-sectional comparisons have revealed that individ-
uals with higher strength levels have markedly superior
power production capabilities than those with a low level of
strength (2,7,10,24,34,35). For example, significant differ-
ences in power output and/or jump height between in-
dividuals with significantly different strength levels have
been reported in comparisons of well-trained athletes and
relatively untrained controls (10,24,35), athletes competi-
tive in power-type sports (i.e., volleyball) and endurance
events (7), rugby league players involved in national versus
Address for correspondence: Prue Cormie, Ph.D., School of Exercise,
Biomedical and Health Sciences, Edith Cowan University, 270 Joondalup
Submitted for publication September 2009.
Accepted for publication December 2009.
0195-9131/10/4208-1566/0
MEDICINE & SCIENCE IN SPORTS & EXERCISE
Ò
Copyright Ó2010 by the American College of Sports Medicine
DOI: 10.1249/MSS.0b013e3181cf818d
1566
APPLIED SCIENCES
Copyright © 2010 by the American College of Sports Medicine. Unauthorized reproduction of this article is prohibited.

state competitions (2), as well as the strongest and weakest
in a pool of resistance-trained men with various training
backgrounds (34). These findings are supported by reports
of a significant and positive relationship existing between
maximal strength and maximal power production (1,30,34).
While skeletal muscle mechanics that cause the force–
velocity relationship dictate that maximal strength plays a
role in muscular power, the development of muscular power
is influenced by a multitude of factors in addition to maximal
strength (27). For example, McBride et al. (24) observed that
despite no differences in the maximal strength of national-
level weightlifters and powerlifters (Smith machine squat
one-repetition maximum-to-body mass ratio (1RM/BM) =
2.86 T0.15 and 2.88 T0.14, respectively), weightlifters
generated significantly greater power output during an un-
loaded countermovement jump (CMJ; weightlifters = 63.0 T
2.7 WIkg
j1
, powerlifters = 56.9 T2.5 WIkg
j1
). Such obser-
vations were attributed to the various training protocols com-
monly used by these athletes (i.e., high force–high velocity
training vs high force–low velocity training common to
weightlifting and powerlifting, respectively) (24). Similar
results were observed in comparisons between well-trained
power athletes and recreational bodybuilders with similar
strength levels (35). Therefore, although the development
of maximal muscular power required for the successful
performance of many athletic movements is influenced by
a multitude of factors (27), stronger individuals have con-
sistently been shown to display superior power output
than individuals with a significantly lower strength level
(2,7,10,24,34,35).
This raises the question of what mechanisms contribute to
the improved power production capabilities of stronger in-
dividuals. Stronger individuals possess neuromuscular char-
acteristics that form the basis for superior maximal power
production and ultimately contribute to enhanced athletic
performance. Specifically, an individual with a substantially
greater level of strength (i.e., strong vs weak person) would
have larger whole-muscle cross sectional area (CSA), a re-
sult of greater myofibrillar CSA of both Type I and Type II
fibers, with more pronounced hypertrophy of Type II fibers
evident (18,22). Pennation angle may also be greater and
possibly even fascicle length (3,4,21). In addition, effective-
ness of neural drive (i.e., recruitment, rate of onset, firing
frequency) as well as intermuscular coordination would be far
superior in the significantly stronger individual (15,25,33).
These neuromuscular characteristics would result in a shift
in the force–velocity relationship so that the force of muscle
contraction would be greater for any given velocity of short-
ening (19). As a consequence, the ability to generate maximal
muscular power, and therefore perform athletic movements,
would be superior in a considerably stronger individual com-
pared with a weaker person (19,23,38).
Despite the advantage of strength for maximal power
production and athletic performance, little is known re-
garding whether neuromuscular characteristics of stronger
individuals allow for superior adaptation to ballistic power
training. More importantly, it is not known if the mech-
anisms driving adaptations to ballistic power training are
influenced by strength level. To the authors’ knowledge,
only one intervention study examining the possible influence
of strength on improvements after ballistic power training
exists (37). Wilson et al. (37) compared the improvements
between stronger (n= 4; squat 1RM/BM = 1.99 T0.30) and
weaker men (n= 5; squat 1RM/BM = 1.21 T0.18) after 8 wk
of drop jump training. Neither group significantly improved
either jump and reach height or 20-m sprint time, and no
correlation was found between strength level and the mag-
nitude of the training-induced change in jump and reach
height (r=j0.13, n= 14) (37). Therefore, this previous
study offers little insight into the influence of strength on the
magnitude of improvements in athletic performance after
ballistic power training. Furthermore, the investigation did
not involve measures to examine any mechanistic factors pos-
sibly involved in adaptations to the training. Simulation data
suggest that although jump height is most sensitive to in-
creases in strength-to-BM ratio (31), an increase in strength
does not translate into increased jump height unless control
(i.e., intermuscular coordination—the appropriate magnitude
and timing of activation of agonist, synergist, and antagonist
muscles during a movement) is tuned to the strengthened
muscle properties (6). These data are supported by the con-
cept of a delayed training effect in which it takes consid-
erable time and effort for an increase in strength to transmute
to improved performance in multijoint movements because
intermuscular coordination needs to be adapted to the stronger
motor units/muscles (39). Therefore, it may be speculated
that a stronger individual exposed to ballistic power training
would improve performance by fine tuning the timing and
patterns of neural drive, thus improving intermuscular coor-
dination and movement technique (although muscular adap-
tations at the cellular level such as alterations to protein
expression, calcium release, and uptake as well as relaxation
time may also contribute). It is unknown if the combination
of these potential changes with the underlying neuromuscular
characteristics of the stronger individual would result in a
training response dissimilar to individuals with lower levels
of strength.
In comparisons of individuals not currently involved in
ballistic power training, previous research has demonstrated
that stronger individuals are able to generate superior levels
of maximal power than significantly weaker individuals
(2,7,10,24,34,35). Although the enhanced maximal power
production of stronger individuals in the absence of ballistic
power training is theorized to be due to the underlying neu-
romuscular characteristics of stronger individuals, it is un-
clear if these characteristics improve the ability to adapt to
ballistic power training. Specifically, it is not known whether
ballistic power training elicits performance improvements
in stronger individuals of a greater magnitude than that
which is achievable with weaker subjects. Furthermore, there
is a paucity of research investigating whether strength level
influences the mechanisms responsible for performance
INFLUENCE OF STRENGTH ON POWER Medicine & Science in Sports & Exercise
d
1567
APPLIED SCIENCES
Copyright © 2010 by the American College of Sports Medicine. Unauthorized reproduction of this article is prohibited.

improvements after ballistic power training. Therefore, the
purpose of this experiment was to determine whether the
magnitude of performance improvements and the mecha-
nisms driving adaptation to ballistic power training differ
between strong and weak individuals.
METHODS
Experimental design. This study used a randomized,
control design and was conducted during a period of 15 wk.
Subjects were divided into two strata on the basis of their
1RM/BM: stronger (1RM/BM 91.55) or weaker (1RM/BM G
1.55). Subjects in the stronger stratum were allocated into
the stronger group. Subjects in the weaker stratum were ran-
domized into one of two groups: weaker group or control
group. The stronger and weaker groups completed a total of
10 wk of ballistic power training, while the control group
maintained their normal level of activity throughout the
duration of the study. Training involved three sessions per
week in which subjects performed maximal-effort jump
squats with 0%–30% 1RM. Subjects completed a 2-d testing
battery before initiating training (baseline), after 5 wk of
training (midtest—stronger and weaker groups only), and
after the completion of 10 wk of training (posttest). Subjects
were adequately familiarized to all testing procedures before
actual assessment. Testing involved evaluation of jump and
sprint performance as well as measures of the force–velocity
relationship, jumping mechanics, muscle architecture, and
neural drive.
Subjects. Subjects were recruited on the basis of their
ability to perform a back squat with proficient technique. A
total of 35 men fulfilled all the testing and training re-
quirements of this investigation. Data from 11 of these men
were removed on the basis of their 1RM/BM to establish
two experimental groups with very distinct differences in
maximal strength (i.e., data from subjects with a 1RM/BM
between 1.55 and 1.85 were not included). The remaining
24 men were allocated into three groups: stronger group
(n= 8, 1RM/BM = 1.97 T0.08), weaker group (n=8,
1RM/BM = 1.32 T0.14), or control group (n= 8, 1RM/BM
= 1.37 T0.13). Subjects’ characteristics throughout the du-
ration of the study are outlined in Table 1. The participants
were notified about the potential risks involved and gave
their written informed consent. This study was approved by
the university’s human research ethics committee.
Training program. The training program consisted of
three sessions per week separated by at least 24 h of rest.
Each training session was initiated via a warm-up consisting
of two sets of six submaximal jump squats with 0% 1RM
(i.e., CMJ with no external load, just the resistance applied
by a carbon fiber pole (mass = 0.4 kg) held across the
shoulders). During sessions 1 and 3 of each week, subjects
performed seven sets of six maximal-effort jump squats
separated by a 3-min recovery. Jump squats were performed
at the load that maximized power output for each subject, as
determined during the baseline testing session. Similar to
previous research, a load consistent with the subject’s BM
(i.e., no external load or 0% 1RM) maximized power output
for each of the participants in this study (11,12). The second
training session of each week included an additional warm-
up set consisting of five submaximal jump squats with 30%
1RM. Subjects then performed five sets of five maximal-
effort jump squats with 30% 1RM separated by a 3-min
recovery. Subjects were encouraged to perform each jump
as rapidly as possible. Intensity was modified for each
session so that an audible beep could be heard by subjects
during jumps that reached 95% of the maximal power
output at that load from their previous training or testing
session. Previous literature has shown significant perfor-
mance improvements after jump squat training with similar
programming parameters at both 0% 1RM (11) and 30%
1RM (25,38). Subjects refrained from any additional lower
body resistance training, plyometrics, or sprint training
throughout the course of the study.
Testing protocol. Subjects rested for 3–5 d between
their previous training session and the midtest testing ses-
sion and for 7–10 d between the final training session and
the posttest testing session to allow full recovery. Subjects
completed two testing sessions separated by at least 3 d of
recovery at the baseline, midtest, and posttest occasions.
Testing session 1 was initiated with an examination of
the vastus lateralis (VL) muscle architecture through
TABLE 1. Subject characteristics of the stronger, weaker, and control groups throughout the 10 wk of training.
BM (kg) Body Fat (%) 1RM/BM 40-m Sprint (s) Jump Height (m)
Stronger group
Baseline 79.1 T12.8 12.2 T3.9‡1.97 T0.08†5.41 T0.25†0.43 T0.03‡
Midtest 79.8 T12.9 12.3 T3.8‡1.93 T0.11‡5.39 T0.20‡0.50 T0.03*
Posttest 79.6 T13.0 12.6 T3.5‡1.88 T0.11†5.29 T0.20†0.50 T0.03*
,
§
Weaker group
Baseline 79.9 T14.5 17.3 T3.8 1.32 T0.14 5.90 T0.27 0.38 T0.04
Midtest 79.2 T14.2 17.5 T4.0 1.38 T0.16 5.79 T0.20 0.42 T0.07
Posttest 79.1 T13.8 17.7 T3.6 1.39 T0.17 5.69 T0.22 0.44 T0.06
Control group
Baseline 77.5 T8.1 14.6 T3.5 1.37 T0.13 5.79 T0.19 0.41 T0.04
Posttest 78.4 T8.8 14.7 T3.8 1.35 T0.12 5.79 T0.12 0.40 T0.04
BM, body mass; 1RM:BM, squat one repetition maximum to body mass ratio.
* Significantly (Pe0.05) different from baseline.
†Significant (Pe0.05) difference between stronger group and all other groups.
‡Significant (Pe0.05) difference between stronger group and weaker group.
§ Significantly (Pe0.05) different from control group.
http://www.acsm-msse.org1568 Official Journal of the American College of Sports Medicine
APPLIED SCIENCES
Copyright © 2010 by the American College of Sports Medicine. Unauthorized reproduction of this article is prohibited.

ultrasonography. Maximal dynamic strength was then as-
sessed using a back squat 1RM to a depth consistent with a
knee angle of at least 90-of flexion assessed using two-
dimensional motion analysis. During a 30-min recovery,
body composition was assessed using dual-energy x-ray
absorptiometry. Maximal isometric strength was then eval-
uated using an isometric squat test performed at a knee angle
of 140-to allow for the determination of maximum force
output at zero velocity (12,32). Adequate recovery was
permitted (10 min) before examination of jump squat per-
formance across a series of intensities: 0% (i.e., no external
load or BM only), 20%, 40%, 60%, and 80% of squat 1RM.
Subjects completed the jump squats in a randomized order,
which was consistent across the three testing occasions for
each individual subject. Kinematic (both linear position
transducer (LPT) and two-dimensional motion analysis),
kinetic, and EMG data were obtained simultaneously through-
out the testing session. After at least 3 d of recovery, sub-
jects completed the second testing session involving a 40-m
sprint test.
Data acquisition and analysis procedures. The
back squat 1RM involved subjects completing a series of
warm-up sets (four to six repetitions at 30% estimated
1RM, three to four repetitions at 50% estimated 1RM, two
to three repetitions at 70% estimated 1RM, and one to two
repetitions at 90% estimated 1RM), each separated by 3 min
of recovery. A series of maximal lift attempts was then
performed until a 1RM was obtained. No more than five
attempts were permitted with each attempt separated by
5 min of recovery. This protocol has been frequently used
throughout the previous literature for the assessment of
maximal dynamic strength (11,12,30). Only trials in which
subjects reached a relative knee angle (i.e., angle between
the midline of the lower leg and the midline of the thigh)
G90-of flexion were considered successful. This depth was
visually monitored during testing and was confirmed by
two-dimensional motion analysis (stronger group: baseline
= 85.7-T4.2-, posttest = 82.5-T6.8-; weaker group:
baseline = 83.4-T2.4-, posttest = 80.4-T4.3-; control
group: baseline = 83.1-T6.2-, posttest = 82.6-T5.4-; rater
reliability: r= 0.95). Although no significant differences in
the depth of the squat 1RM existed among the testing occa-
sions, there is the potential that the slightly deeper depth
obtained during posttesting could have influenced the 1RM
values obtained.
The isometric squat test was performed with subjects
standing on a force plate (9290AD; Kistler Instruments,
Winterthur, Switzerland) in a back squat position pushing
against an immovable rigid bar. The bar was positioned so
that subjects had a knee angle of 140-of flexion to allow
for the determination of maximal force output at zero ve-
locity. Previous research has shown this knee angle to cor-
respond with the highest isometric force output for the squat
compared with a range of other knee angles (32). Subjects
were instructed to perform a rapid, maximal effort to reach
maximal force output as soon as possible and maintain that
force for 3 s. The analog signal from the force plate was
collected for every trial at 1000 Hz using a data acquisition
system including an analog-to-digital card (cDAQ-9172;
National Instruments, North Ryde, NSW, Australia). Cus-
tom programs designed using LabVIEW software (Version
8.2; National Instruments) were used for recording and an-
alyzing the data. The signal was filtered using a fourth-
order, low-pass Butterworth filter with a cutoff frequency
of 50 Hz. From laboratory calibrations, the voltage output
was converted into vertical ground reaction force. Peak
force relative to BM was assessed as the maximal force
output during the 3-s period divided by the individual’s
BM. The test–retest reliability for peak force relative to BM
was r= 0.98.
Performance of a jump squat involved subjects complet-
ing a maximal-effort CMJ while holding a rigid bar across
their shoulders. Subjects held a 0.4-kg carbon fiber pole for
the 0% 1RM jump squat, whereas for all other intensities,
subjects held a 20-kg barbell loaded with the appropriate
weight plates. Participants were instructed to keep constant
downward pressure on the bar throughout the jump and
were encouraged to move the resistance as fast as possible
to achieve maximal power output with each trial. The bar
was not allowed to leave the shoulders of the subject, with
the trial being repeated if this requirement was not met. A
minimum of two trials at each load were completed, with
additional trials performed if both peak power and jump
height were not within 5% of the previous jump squat.
Adequate rest was enforced between all trials (3 min).
All jump squats were performed while the subject was
standing on the force plate with a LPT (PT5A-150; Celesco
Transducer Products, Chatsworth, CA) attached to the bar.
The LPT was attached 10 cm to the left of the center of the
bar to avoid any interference caused by movement of the
head during the jump. The LPT was mounted above the sub-
ject, and the retraction tension of the LPT (equivalent to
8 N) was accounted for in all calculations. Analog signals
from the force plate and LPT were collected for every trial
at 1000 Hz and analyzed using custom programs designed
using LabVIEW software. The signal from the LPT was
filtered using a fourth-order, low-pass Butterworth digital
filter with a cutoff frequency of 10 Hz, and the voltage output
was converted into displacement using laboratory calibra-
tions. The vertical velocity of the movement was deter-
mined using a first-order derivative of the displacement data.
Power output was calculated as the product of the vertical
velocity and the vertical ground reaction force data. Ac-
celeration of the movement was calculated using a second-
order derivative of the displacement data and smoothed
using a fourth-order, low-pass Butterworth digital filter with a
cutoff frequency of 10 Hz. These data collection and analysis
methodology have been validated previously (9), and the test–
retest reliability for all jump variables examined was con-
sistently rQ0.90.
A series of performance variables was assessed during
the jump squats. Peak force, velocity, power, displacement,
INFLUENCE OF STRENGTH ON POWER Medicine & Science in Sports & Exercise
d
1569
APPLIED SCIENCES
Copyright © 2010 by the American College of Sports Medicine. Unauthorized reproduction of this article is prohibited.

and acceleration were determined as the respective maximal
values achieved during the entire movement. Net impulse
was assessed as the integral of vertical ground reaction
force during the period of application in which force ex-
ceeded that required during stationary standing (i.e., above
body weight). Rate of force development (RFD) was de-
termined between the minimum and maximum force that
occurred throughout the movement. Similarly, rate of power
development (RPD) was also determined between the min-
imum and maximum power that occurred throughout the
movement. Average power output was calculated during the
concentric phase of the movement (i.e., time between min-
imum displacement and takeoff). Instantaneous force and
velocity output at the time at which peak power occurred
was also examined and was termed force at peak power and
velocity at peak power, respectively. These values across
each of the loads examined were used to generate the force–
velocity and force–power relationships for the jump squat.
Velocity at takeoff was defined as the velocity of movement
at the time at which the force output was first zero (i.e.,
when the toes first left the force plate). Furthermore, time
to takeoff was determined as the time between the initiation
of the countermovement (i.e., start of the eccentric phase)
and the point that force was zero (i.e., end of the concentric
phase—takeoff ).
In addition to these instantaneous performance variables,
analyses of parameters throughout the jump movement were
conducted. The power–time and force–time curves from each
individual subject were selected from the beginning of the
eccentric phase (i.e., initiation of countermovement as-
sessed as the time at which a change in velocity first oc-
curred) through to the end of the concentric phase (i.e., at
takeoff when force and power reached zero). The velocity–
time and displacement–time curves were selected from the
beginning of the eccentric phase to peak displacement (i.e.,
zero velocity). Using a custom-designed LabVIEW program,
the number of samples in each individual curve was then
modified to equal 500 samples by changing the time delta
(dt) between samples and resampling the signal (dt = number
of samples in the original signal/500). The sampling fre-
quency of the normalized signals was calculated according to
the following equation:
normalized sampling
frequenzy ðHzÞ¼1 second
½
no:samples in original signal
no:samples in normalized signal
½
seconds
per sample
Consequently, the sampling frequency of the modified
signals was then equivalent to 815 T154 Hz for the power–
time and force–time curves and 538 T68 Hz for the velocity–
time and displacement–time curves. This resampling allowed
for each individual’s power, force, velocity, and displace-
ment curves to be expressed during equal periods of time
(i.e., the 500 samples represented the relative time—from
0% to 100%—taken to complete the jump). In other words,
the various data sets were normalized to total movement
time so that data could be pooled. Each sample of the nor-
malized power–, force–, velocity–, and displacement–time
curves was then averaged across subjects within the stronger,
weaker, or control groups, resulting in averaged curves with
high resolution (sampling frequency of 538–815 Hz). This
allowed for power, force, velocity, and displacement through-
out the jump to be compared across baseline, midtest, and
posttest as well as between groups. Intraclass test–retest
reliabilities for power–, force–, velocity–, and displacement–
time curves during the CMJ have consistently been rQ0.94,
rQ0.90, rQ0.89, and rQ0.92, respectively, using this
methodology (10).
Before assessment of sprint performance, subjects per-
formed a warm-up consisting of 5 min of light jogging and
three submaximal 20-m sprints. The sprint test was initiated
from a standing start involving a staggered stance with the
same front–back leg orientation used for every trial through-
out the baseline, midtest, and posttest. Subjects were in-
structed to commence the sprint at will and accelerate as
quickly as possible throughout the 40 m. Three trials were
performed with each separated by a 3-min recovery. A series
of six dual-beam timing gates (Speedlight; Swift Sports,
Lismore, NSW, Australia) was used to record instanta-
neous time at 5, 10, 20, 30, and 40 m (timing was com-
menced when subject passed through a dual-beam timing
gate positioned at their front foot). Flying 5 m was calculated
as the time between the 5- and 10-m gates, whereas flying
15 m was calculated at the time between the 5- and 20-m
gates. Intraclass test–retest reliability for all sprint perfor-
mance variables examined was consistently rQ0.90.
EMG of the VL, vastus medialis (VM), and biceps fe-
moris (BF) was collected on the dominant leg during the
isometric squat and all jump squats. Disposable surface
electrodes (self-adhesive Ag/AgCl snap electrode, 2-cm in-
terelectrode distance, 1-cm circular conductive area; prod-
uct 272; Noraxon USA, Inc., Scottsdale, AZ) were attached
to the skin over the belly of each measured muscle, distal to
the motor point, and parallel to the direction of muscle
fibers. A reference electrode was placed on the patella. The
exact location of the electrodes relative to the anatomical
landmarks was marked on a sheet of tracing paper after the
first testing session to ensure consistent placement in sub-
sequent tests. Each site was shaved, gently abraded, and
cleansed with alcohol before electrode placement to mini-
mize skin impedance. Raw EMG signals were collected at
1000 Hz and amplified (gain = 1000, bandwidth frequency
= 10–1000 Hz, input impedance G5k6; Model 12D-16-OS
Neurodata Amplifier System; Grass Technologies, West
Warwick, RI). The amplified myoelectric signal was col-
lected simultaneously with force plate and LPT data using a
data acquisition system including an analog-to-digital card.
Custom programs designed using LabVIEW software were
used for recording and analyzing the data. The signal was
full-wave–rectified and filtered using a dual-pass, sixth-
order, 10- to 250-Hz band-pass Butterworth filter as well as
a notch filter at 50 Hz. A linear envelope was created using
http://www.acsm-msse.org1570 Official Journal of the American College of Sports Medicine
APPLIED SCIENCES
Copyright © 2010 by the American College of Sports Medicine. Unauthorized reproduction of this article is prohibited.
a low-pass, fourth-order Butterworth digital filter with a
cutoff frequency of 6 Hz. Maximal voluntary contraction
(MVC) for all muscles were determined by averaging the
integrated EMG signal during a 1-s period of sustained
maximal force output after the initial peak in the force curve
during the isometric squat (intraclass test–retest reliability
consistently rQ0.91). EMG activity during jumping was
analyzed by averaging the integrated EMG signal from the
beginning of the eccentric phase to takeoff. To standardize
for the time taken to complete a jump squat, this value was
then divided by the time to takeoff. The average integrated
EMG (AvgIEMG) was then normalized by expressing it
relative to the MVC. This is similar to methods previously
used when comparing EMG between movements with dif-
ferent time components (29). The rate of rise in AvgIEMG
(expressed as a percentage of MVC per second) was as-
sessed during the 0% 1RM jump squat as the rate of change
between minimum and maximum AvgIEMG throughout
the movement (i.e., from the initiation of the countermove-
ment to takeoff). Intraclass test–retest reliability for all EMG
variables examined was consistently rQ0.80.
In vivo muscle architecture was assessed by B-mode ultra-
sonography recorded using an ultrasound console (SSD-1000;
Aloka Incorporated, Tokyo, Japan) with a 7.5-MHz, 9-cm
linear probe. The same experienced examiner completed all
scans across the baseline, midtesting, and posttesting occa-
sions. Scans were performed on the VL of the dominant leg,
with subjects lying supine and their leg muscles completely
relaxed. To assist with acoustic coupling, water-soluble trans-
mission gel was applied to the transducer. Measurements
were taken at 50% of the thigh length calculated as half the
distance between the centers of the greater trochanter to the
lateral condyle of the femur. Longitudinal images were ob-
tained with the transducer oriented parallel to the muscle
fascicles and perpendicular to the skin. The impact of dis-
crepancies in transducer location and orientation on architec-
tural differences observed between baseline, midtest, and
posttest was minimized using several techniques. The location
and two-dimensional orientation of the transducer relative to
anatomical landmarks were mapped onto a sheet of tracing
paper to ensure that the same site was used across all testing
occasions. In addition, in an effort to minimize any differ-
ences in the three-dimensional orientation of the transducer
between testing occasions, the live, onscreen image during
midtest and posttest was compared with those taken during
baseline testing. This allowed the examiner to match the
unique features of the ultrasound images (i.e., heterogeneities
in the subcutaneous adipose tissue and echoes from inter-
spaces among the fascicles). These procedures have been used
previously in literature, monitoring the impact of training on
muscle architecture (3). Images were digitally recorded, and
the superficial and deep aponeuroses were identified, with
muscle thickness measured as the distance between the apo-
neuroses (3,20). Pennation angle was defined as the angle at
which the fascicles arose from the deep aponeurosis (20).
Intraclass test–retest reliabilities for muscle thickness and
pennation angle were r=0.95andr= 0.90, respectively. In
addition, rater reliabilities for muscle thickness and pennation
angle were r=0.98andr= 0.93, respectively.
Two-dimensional motion analysis was used to evaluate the
movement mechanics during the squat 1RM and jump squats.
A digital video camera (25 Hz; MV830i; Canon Australia
Pty Ltd., North Ryde, NSW, Australia) was positioned 3.1 m
from the subject, perpendicular to the subjects’ sagittal plane.
Dartfish software (Version 4.5 ProSuite; Dartfish, Sydney,
NSW, Australia) was used to analyze the movements. The
video footage was deinterlaced into fields, yielding a 50-Hz
sampling frequency. During the jump squats, the minimum
and maximum knee, hip, and ankle joint angles were assessed
at the transition between the eccentric and concentric phases
(minimum) and the last field before takeoff where the foot is
still in contact with the force plate (maximum). The minimum
knee, hip, and ankle angles were also assessed during the
squat 1RM, representing the joint angles at the transition
between the eccentric and concentric phases. Intraclass test–
retest reliability and rater reliability for all joint angles as-
sessed using motion analysis were consistently rQ0.92 and
rQ0.93, respectively.
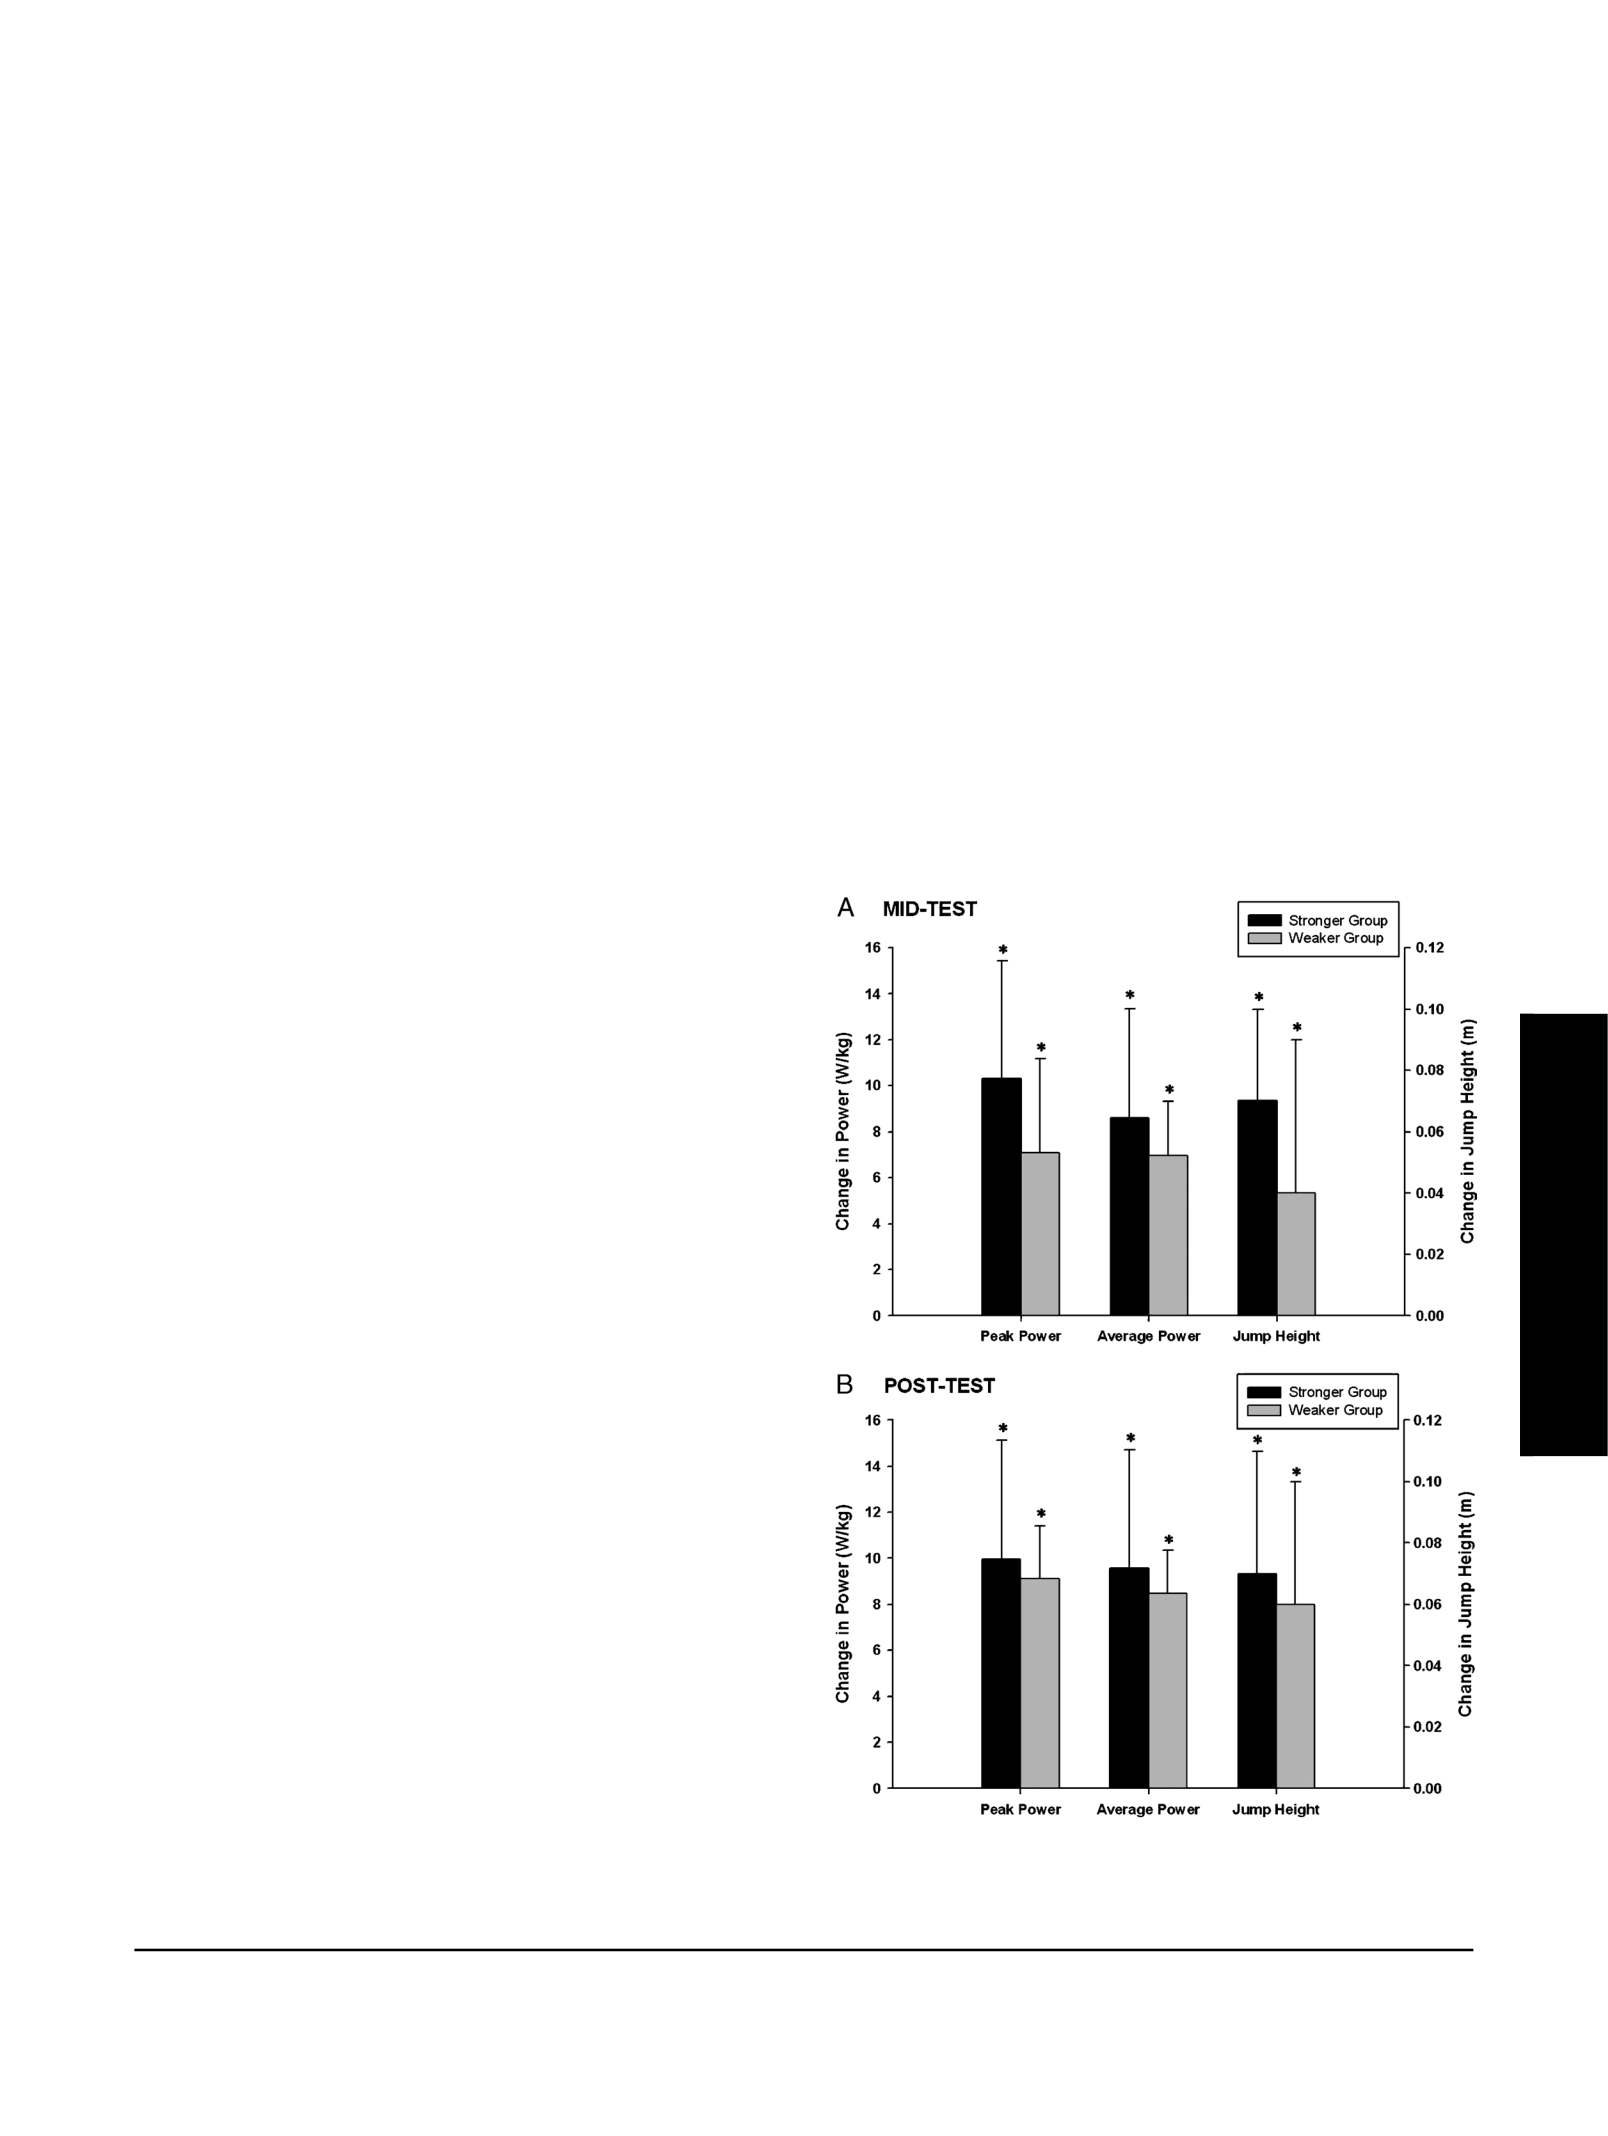
FIGURE 1—Change from baseline in peak power, average power, and
maximum jump height during the 0% 1RM jump squat at midtest (A)
and posttest (B). *Significant (Pe0.05) change from baseline.
INFLUENCE OF STRENGTH ON POWER Medicine & Science in Sports & Exercise
d
1571
APPLIED SCIENCES
Copyright © 2010 by the American College of Sports Medicine. Unauthorized reproduction of this article is prohibited.

Statistical analyses. A general linear model with
repeated-measures ANOVA followed by Bonferroni post
hoc tests was used to examine the impact of training on
performance variables and to determine whether differences
existed between the groups at baseline, at midtest, and at
posttest. t-tests were used for comparisons between var-
iables at baseline and posttest for the control group as well
as for comparison of variables between stronger and weaker
groups at midtest. Statistical significance for all analyses
was defined by Pe0.05, and results were summarized as
means TSD. Estimated effect sizes (ES) of G
2
= 0.502 and
G
2
= 0.300 at observed power levels of 0.976 and 0.626 for
maximum peak power relative to BM after training existed
for stronger and weaker groups, respectively. In addition,
estimated ES of G
2
= 0.406 and G
2
= 0.319 at the observed
power levels of 0.821 and 0.644 existed for the compari-
son of maximum peak power relative to BM between the
stronger and weaker groups at baseline and posttest,
respectively. Mean ES were also calculated to examine
and compare the practical significance of the performance
improvements among the experimental groups. Based on the
study of Cohen (8), which suggests ES of 0.2, 0.5, and 0.8 to
represent small, moderate, and large effects, respectively,
practical relevance was defined as an ES Q0.8 for the
TABLE 2. Change in performance variables during the 0% 1RM jump squat (i.e., BM only) from baseline ($).
Stronger Group Weaker Group
0% 1RM Jump Squat $at Midtest $at Posttest $at Midtest $at Posttest
Power
Peak power (WIkg
j1
) 10.3 T5.1* 10.0 T5.2* 7.1 T4.1* 9.1 T2.3*
Average power (WIkg
j1
) 8.6 T4.8* 9.6 T5.2* 7.0 T2.3* 8.5 T1.9*
Rate of power development (WIkg
j1
Is
j1
) 343.0 T164.4*
,
‡325.2 T132.6* 169.3 T79.4* 236.7 T129.7*
Force
Peak force (NIkg
j1
) 6.3 T5.4* 6.3 T4.7* 3.5 T3.7 4.7 T4.2*
RFD (NIkg
j1
Is
j1
) 76.8 T46.1* 82.3 T58.3* 55.3 T28.8* 94.6 T74.9*
Force at peak power (NIkg
j1
) 2.8 T2.1* 2.1 T1.6* 1.5 T1.8 1.4 T1.9
Net impulse (NIs) 38.9 T22.6* 45.9 T28.9* 48.8 T26.5* 57.4 T20.9*
Velocity
Peak velocity (mIs
j1
) 0.43 T0.29* 0.42 T0.22* 0.34 T0.34* 0.55 T0.26*
Velocity at peak power (mIs
j1
) 0.19 T0.34 0.22 T0.31 0.15 T0.30 0.28 T0.27
Velocity at takeoff (mIs
j1
) 0.43 T0.29* 0.41 T0.24* 0.35 T0.36* 0.60 T0.30*
Acceleration
Peak acceleration (mIs
j1
Is
j1
) 11.7 T6.2*
,
‡14.6 T6.5*
,
‡6.4 T2.0* 8.6 T4.7*
Displacement
Peak displacement (m) 0.07 T0.03* 0.07 T0.04* 0.04 T0.05 0.06 T0.04*
Time
Time to takeoff (s) j0.18 T0.07* j0.19 T0.6* j0.27 T0.12* j0.31 T0.13*
,
‡
* Significant (Pe0.05) change from baseline.
‡Significant (Pe0.05) difference between stronger group and weaker group.
TABLE 3. Comparison of 40-m sprint times among stronger, weaker, and control groups throughout the 10 wk of training.
Sprint Times (s)
5 m 10 m 20 m 30 m 40 m Flying 5 m Flying 15 m
Stronger group
Baseline 1.10 T0.10 1.82 T0.12 3.08 T0.15‡4.25 T0.19†5.41 T0.25†0.72 T0.03†1.98 T0.07†
Midtest 1.08 T0.02‡1.82 T0.04‡3.07 T0.09‡4.23 T0.14‡5.39 T0.20‡0.74 T0.03 1.99 T0.08‡
Posttest 1.02 T0.08§ 1.75 T0.08§ 2.99 T0.11‡4.14 T0.15†5.29 T0.20†0.73 T0.01†1.97 T0.05†
$between baseline
and posttest
j0.08 T0.04*
,
§j0.07 T0.04* j0.09 T0.08*
,
§j0.11 T0.11*
,
§j0.12 T0.11* 0.01 T0.02 j0.01 T0.07
ES 0.86 0.67 0.69 0.65 0.54 0.64 0.18
Weaker group
Baseline 1.17 T0.12 1.95 T0.16 3.32 T0.19 4.60 T0.23 5.90 T0.27 0.78 T0.04 2.14 T0.08
Midtest 1.13 T0.05 1.90 T0.08 3.24 T0.11 4.51 T0.16 5.79 T0.20 0.77 T0.05 2.10 T0.09
Posttest 1.09 T0.05 1.86 T0.07 3.18 T0.12 4.44 T0.17 5.69 T0.22 0.77 T0.02 2.09 T0.08
$between baseline
and posttest
j0.08 T0.09 j0.09 T0.10 j0.13 T0.09*
,
§j0.16 T0.10*
,
§j0.22 T0.14*
,
§j0.01 T0.03 j0.06 T0.03*
,
§
ES 0.79 0.69 0.78 0.76 0.82 0.25 0.66
Control group
Baseline 1.13 T0.04 1.88 T0.07 3.25 T0.11 4.52 T0.14 5.79 T0.19 0.75 T0.03 2.12 T0.08
Posttest 1.15 T0.04 1.91 T0.05 3.27 T0.07 4.53 T0.09 5.79 T0.12 0.76 T0.02 2.12 T0.05
$between baseline
and posttest
0.02 T0.05 0.03 T0.06 0.02 T0.08 0.01 T0.08 0.00 T0.10 0.01 T0.02 0.00 T0.04
ES 0.41 0.46 0.24 0.10 0.01 0.40 0.07
Flying 5 m time is calculated as the time between 5 and 10 m.
Flying 15 m time is calculated as the time between 5 and 20 m.
The change in sprint times between baseline and posttests as well as ES of the change is also displayed.
* Significant (Pe0.05) change from baseline to posttest.
†Significant (Pe0.05) difference between stronger group and all other groups.
‡Significant (Pe0.05) difference between stronger group and weaker group.
§ Significantly (Pe0.05) different from control group.
http://www.acsm-msse.org1572 Official Journal of the American College of Sports Medicine
APPLIED SCIENCES
Copyright © 2010 by the American College of Sports Medicine. Unauthorized reproduction of this article is prohibited.

FIGURE 2—Training-induced changes to the force–velocity and force–power relationships for the jump squat. *Significantly (Pe0.05) different
peak power relative to BM from baseline. +Approaching significantly (Pe0.10) different peak power relative to BM from baseline. xSignificantly
(Pe0.05) different force relative to BM at peak power from baseline. #Significantly (Pe0.05) different velocity at peak power from baseline.
INFLUENCE OF STRENGTH ON POWER Medicine & Science in Sports & Exercise
d
1573
APPLIED SCIENCES
Copyright © 2010 by the American College of Sports Medicine. Unauthorized reproduction of this article is prohibited.

purpose of this study. A statistical software package (SPSS,
Version 13.0; SPSS, Inc., Chicago, IL) was used to perform
all statistical analyses.
RESULTS
Athletic performance. The stronger group had signif-
icantly greater 1RM/BM than both the weaker and control
groups at all testing occasions and displayed a practically
relevant decrease in 1RM/BM at posttest (ES = 0.93, equiv-
alent to a 7 T7-kg decrease in 1RM). Training resulted in
significant within-group changes in a multitude of jump per-
formance variables between baseline and midtest or be-
tween baseline and posttest sessions for both the stronger
and weaker groups (Fig. 1 and Table 2). However, only the
changes in RPD at midtest and time to takeoff at posttest
significantly differed between the groups (Table 2). Com-
parison of the magnitude of changes in average power, peak
power, and peak displacement between the stronger and
weaker groups is illustrated in Figure 1. Any practically
relevant differences between the groups were more pro-
nounced after 5 wk of training, and they diminished some-
what after 10 wk of training (Fig. 1). The stronger group
completed the 40-m sprint in significantly less time than
both the weaker and control groups across all testing occa-
sions (Table 3). Training resulted in a significant change in
time between baseline and posttest at 5-, 10-, 20-, 30-, and
40-m sprints for the stronger group and at 20-, 30-, and 40-m
sprints for the weaker group (Table 3). These changes
were significantly different from the change in time dis-
played by the control group (which did not significantly
alter sprint time).
Force–velocity relationship. Training-induced
changes to force–velocity and force–power relationships
during the jump squat are displayed in Figure 2. Significant
differences between baseline and posttest were evident for
FIGURE 3—Between-group differences in the force–velocity (A–C) and force–power relationships (D–F) for the jump squat throughout the 10 wk of
training. †Significant (Pe0.05) difference in force or power between stronger and all other groups. ‡Significant (Pe0.05) difference in force or
power between stronger and weaker groups. §Significantly (Pe0.05) different force or power from control group.
TABLE 4. Two-dimensional motion analysis variables assessed during the 0% 1RM jump squat.
Minimum Joint Angle Maximum Joint Angle
0% 1RM Jump Squat Knee Angle (-) Hip Angle (-) Ankle Angle (-) Knee Angle (-) Hip Angle (-) Ankle Angle (-)
Stronger group
Baseline 89.7 T8.5 86.3 T13.8 60.7 T4.4 170.0 T7.1 168.3 T4.9 133.4 T3.9
Midtest 94.8 T6.5 89.4 T10.8 61.8 T4.7 174.5 T5.0 171.9 T8.1 137.5 T5.9
Posttest 94.7 T5.6 91.5 T16.4 59.0 T5.4 176.8 T4.3 174.0 T7.1 140.0 T5.8
Weaker group
Baseline 85.9 T7.1 79.3 T8.8 60.1 T3.0 170.2 T6.4 168.1 T8.1 136.0 T8.2
Midtest 90.1 T9.5 84.8 T18.7 59.9 T3.0 174.8 T4.9 172.8 T7.1 137.4 T6.6
Posttest 89.3 T11.1 88.4 T20.4 57.7 T3.7 171.7 T6.3 172.7 T9.5 138.1 T5.2
Control group
Baseline 89.6 T6.4 78.6 T9.8 67.3 T6.3 174.3 T6.5 172.3 T4.9 141.4 T8.5
Posttest 86.0 T12.2 78.0 T6.9 66.3 T3.5 172.3 T9.3 170.9 T12.2 137.3 T7.0
http://www.acsm-msse.org1574 Official Journal of the American College of Sports Medicine
APPLIED SCIENCES
Copyright © 2010 by the American College of Sports Medicine. Unauthorized reproduction of this article is prohibited.

both stronger and weaker groups (Fig. 2). Between-group
comparisons of the force–velocity and force–power rela-
tionships during jump squats revealed several differences
(Fig. 3).
Jump mechanics. No significant differences existed
between the groups in either the minimum or the maximum
joint angles during the 0% 1RM jump squat at baseline,
midtest, or posttest (Table 4). Furthermore, training did not
FIGURE 4—Comparison of the power–time curve during the 0% 1RM jump squat among the stronger, weaker, and control groups at baseline (A),
midtest (B), and posttest (C). Normalized time represents the time from initiation of countermovement to takeoff in A,B, and C.‡Significant
(Pe0.05) difference between stronger and weaker groups. 6Significant (Pe0.05) difference between stronger and control groups. §Significant
(Pe0.05) difference between control and both stronger and weaker groups.
FIGURE 5—Training-induced changes to the power–time (A), force–time (B), velocity–time (C), and displacement–time (D) curves for the 0% 1RM
jump squat in the stronger group. Normalized time represents the time from initiation of countermovement to takeoff for power and force (Aand B)
and from initiation of countermovement to peak displacement for velocity and displacement (Cand D). *Significant (Pe0.05) difference between
baseline and both midtest and posttest. xSignificant (Pe0.05) difference between baseline and posttest.
INFLUENCE OF STRENGTH ON POWER Medicine & Science in Sports & Exercise
d
1575
APPLIED SCIENCES
Copyright © 2010 by the American College of Sports Medicine. Unauthorized reproduction of this article is prohibited.

result in any changes to the joint angles at either the tran-
sition between eccentric and concentric phases or the take-
off during the 0% 1RM jump squat (Table 4). Investigation
of the power–time curve throughout the jump revealed sig-
nificant differences between the groups (Fig. 4). At base-
line, significant differences in power between stronger and
weaker groups existed from 76.0% to 92.8% of normalized
time (Fig. 4A). Similar differences between the stronger
and weaker groups were maintained throughout midtest
(80.4%–91.0% normalized time; Fig. 4B) as well as posttest
(73.8%–90.2% normalized time; Fig. 4C). After training,
significant differences were evident between the control
group and both the stronger and weaker training groups
throughout the power–time curve at posttest (4.4%–23.4%,
40.8%–52.8%, and 69.4%–89.2% normalized time). In addi-
tion, differences existed between the control and stronger
groups from 53.0% to 60.8% normalized time (Fig. 4C).
Several significant training-induced changes were also ob-
served between baseline and both midtesting and posttesting
sessions (Figs. 5 and 6). For the stronger group, significant
differences between baseline and both midtest and posttest
existed during the following phases: (a) power: 6.6%–22.8%,
42.2%–55.6%, and 74.2%–91.2% of normalized time; (b)
force: 9.6%–28.4% and 48.8%–62.8% of normalized time;
(c) velocity: 39.6%–62.6% and 69.6%–86.8% of normal-
ized time; and (d) displacement: 57.4%–89.4% of normal-
ized time. Significant differences between baseline and
posttest also existed during the following phases: (a) power:
70.6%–74.0% of normalized time; (b) force: 28.6%–32.4%,
43.0%–48.6%, and 63.0%–87.0% of normalized time; (c)
velocity: 36.0%–39.4% of normalized time; and (d) dis-
placement: 46.2%–57.2% and 89.6%–100.0% of normalized
time (Fig. 5). For the weaker group, significant differences
between baseline and both midtest and posttest existed dur-
ing the following phases: (a) power: 3.6%–11.4%, 35.4%–
52.6%, and 64.8%–89.6% of normalized time; (b) force:
0.0%–23.2% and 38.0%–70.0% of normalized time; (c)
velocity: 9.4%–32.0%, 39.2%–68.0%, and 75.0%–91.8% of
normalized time; and (d) displacement: 58.0%–88.2% or
normalized time. Significant differences between baseline and
posttest also existed during the following phases: (a) power:
11.6%–18.2% of normalized time, (b) force: 70.2%–79.2%
FIGURE 6—Training-induced changes to the power–time (A), force–time (B), velocity–time (C), and displacement–time (D) curves for the 0% 1RM
jump squat in the weaker group. Normalized time represents the time from initiation of countermovement to takeoff for power and force (Aand B)
and from initiation of countermovement to peak displacement for velocity and displacement (Cand D). *Significant (Pe0.05) difference between
baseline and both midtest and posttest. xSignificant (Pe0.05) difference between baseline and posttest.
http://www.acsm-msse.org1576 Official Journal of the American College of Sports Medicine
APPLIED SCIENCES
Copyright © 2010 by the American College of Sports Medicine. Unauthorized reproduction of this article is prohibited.

of normalized time, and (c) displacement: 88.4%–92.4% of
normalized time (Fig. 6).
Neuromuscular characteristics. No between- or
within-group differences existed for muscle thickness, pen-
nation angle, or lean mass of the leg across each of the
testing occasions (Table 5). However, percent change in
pennation angle from baseline to posttest was significant
(9.9%, P= 0.05) for the weaker group and approaching sig-
nificance (6.5%, P= 0.07) for the stronger group. At base-
line, no between-group differences were evident in any of
the EMG variables assessed (Table 5). After training, no
significant between- or within-group differences existed in
AvgIEMG during the isometric squat (i.e., MVC) or the 0%
1RM jump squat. However, the stronger power training
group significantly increased the rate of rise in AvgIEMG
during the 0% 1RM jump squat at posttest in both VM and
VL (Table 5). Furthermore, the rate of rise in AvgIEMG of
the VM and VL in the stronger power training group was
significantly greater than that in the control group at post-
test. The weaker power training group also displayed a
significant increase in the rate of rise in AvgIEMG of the
VM during the 0% 1RM jump squat at both midtest and
posttest (Table 5). No within-group changes in any EMG
variables were observed for the control group throughout
the study.
DISCUSSION
This investigation revealed that the ability to adapt to
ballistic power training is quite similar for both strong and
weak individuals. Despite trends toward superior improve-
ments in maximal power production and athletic perfor-
mance in stronger individuals (supported by much greater
mean ES, especially after 5 wk of training), the magnitude of
improvements did not significantly differ between stronger
and weaker groups (Fig. 1 and Tables 2 and 3). Further-
more, the mechanisms driving these adaptations were sim-
ilar for both groups (Figs. 2–4 and Tables 4 and 5).
Athletic performance. The current results indicate
that the experimental training effectively improved athletic
performance in both stronger and weaker individuals. Jump
height and maximal power output during a CMJ were
significantly enhanced after both 5 and 10 wk of training
(Fig. 1 and Table 2). In addition, a range of jump perfor-
mance measures (i.e., net impulse, movement velocity,
RFD, and RPD) also showed significant improvement in
both experimental groups. These observations are similar to
previous research involving ballistic power training on ho-
mogeneous groups of subjects with relatively low (11,38) or
moderate strength levels (25,28). Comparisons of the mag-
nitude of these improvements in jump performance between
the experimental groups showed no statistically significant
differences (Fig. 1 and Table 2). However, ES analyses
revealed that practically relevant differences existed between
stronger and weaker individuals in the magnitude of im-
provements in jump performance after ballistic power train-
ing. Any practical differences between the groups were more
pronounced after 5 wk of training and diminished somewhat
after 10 wk of training. For example, after 5 wk of training,
the ES of improvements in CMJ peak power and jump
height were 1.60 and 1.59, respectively, for the stronger
group compared with 0.95 and 0.61 for the weaker group.
At the completion of 10 wk of training, ES were 1.55 and
1.46 for the stronger group and 1.03 and 0.95 for the weaker
group. Thus, despite the lack of statistically significant
differences between the experimental groups, ballistic power
training had a tendency to elicit a more pronounced effect on
the magnitude of improvements of the stronger group, and
TABLE 5. Neuromuscular factors assessed throughout the 10-wk training program.
Stronger Group Weaker Group Control Group
Baseline Midtest Posttest Baseline Midtest Posttest Baseline Posttest
Muscle architecture
Muscle thickness (cm) 3.29 T0.38 3.30 T0.38 3.26 T0.37 3.02 T0.45 3.07 T0.46 3.08 T0.48 3.06 T0.30 3.06 T0.29
Pennation angle (-) 19.80 T2.23 20.76 T2.15 21.03 T2.14 19.20 T1.92 20.15 T1.59 20.98 T1.71 20.44 T3.99 20.59 T4.17
Lean mass of the leg (kg) 11.35 T1.62 11.56 T1.69 11.50 T1.62 10.82 T1.54 10.76 T1.50 10.66 T1.55 11.28 T1.61 11.30 T1.49
Muscle activation
AvgIEMG IS (MVC)
VM (KV) 81.9 T32.8 64.4 T24.6 68.0 T30.5 69.0 T28.9 82.3 T44.7 81.7 T28.2 79.6 T17.1 78.5 T18.2
VL (KV) 69.5 T22.7 66.6 T12.8 58.8 T26.9 73.3 T39.0 72.6 T42.8 71.2 T28.3 71.3 T11.9 70.0 T23.1
BF (KV) 13.9 T5.9 14.2 T11.9 13.8 T6.7 18.6 T14.2 14.3 T9.4 14.8 T10.2 20.3 T11.1 20.9 T12.0
AvgIEMG 0% 1RM JS
VM (% MVCIs
j1
) 114.5 T24.2 145.2 T25.8 148.0 T45.3 108.8 T29.0 121.9 T52.3 115.3 T19.0 81.3 T13.6 84.6 T23.2
VL (% MVCIs
j1
) 115.2 T28.3 122.3 T20.0 135.0 T28.5 118.8 T46.8 130.1 T59.3 106.0 T25.7 107.1 T30.0 109.7 T28.5
BF (% MVCIs
j1
) 125.6 T21.8 195.5 T102.0 200.9 T112.5 100.8 T58.8 181.7 T73.8 174.4 T90.3 103.0 T53.2 104.9 T76.8
Rate of EMG rise 0% 1RM JS
VM (% MVCIs
j1
) 503.5 T148.9 903.7 T380.9 1057.3 T492.0*
,
§ 352.3 T174.4 725.1 T305.9* 672.5 T263.8* 373.0 T209.7 386.7 T227.4
VL (% MVCIs
j1
) 479.2 T210.2 634.1 T188.6 971.4 T338.6*
,
§ 389.6 T187.4 866.0 T672.0 654.1 T283.0 403.6 T209.5 392.9 T146.8
BF (% MVCIs
j1
) 922.6 T413.9 1893.5 T1170.1 1759.3 T941.1 714.5 T551.9 1180.0 T619.0 1359.0 T984.6 449.7 T189.1 477.2 T250.8
AvgIEMG, average integrated EMG; IS, isometric squat; JS, jump squat.
Average integrated EMG (AvgIEMG) was assessed during an isometric squat MVC and during the 0% 1RM jump squat. Rate of rise in AvgIEMG was also assessed during the 0% 1RM
jump squat. Muscle thickness and pennation angle were assessed through ultrasound images. Lean mass of the leg represents the average lean muscle mass of right and left legs as
assessed through dual-energy x-ray absorptiometry scans.
* Significant (Pe0.05) change from baseline.
§ Significantly (Pe0.05) different from control group.
INFLUENCE OF STRENGTH ON POWER Medicine & Science in Sports & Exercise
d
1577
APPLIED SCIENCES
Copyright © 2010 by the American College of Sports Medicine. Unauthorized reproduction of this article is prohibited.

this could hold great practical relevance. Furthermore, these
results suggest that stronger subjects also display a tendency
toward more rapid improvements in performance after bal-
listic power training than weaker individuals, which is also
of considerable practical importance.
Ballistic power training also resulted in enhanced sprint
performance for both stronger and weaker groups (Table 3).
The change in time between baseline and posttest was sig-
nificant for both groups at 20, 30, and 40 m during a 40-m
sprint. In addition, the stronger group also displayed a sig-
nificant reduction in time at the 5- and 10-m marks. The
improvements in sprint performance for both groups were
of a practically relevant magnitude, representing a 7.3% and
2.2% improvement in 5- and 40-m time (ES = 0.86 and
0.54) in the stronger group and a 6.8% and 3.7% im-
provement in 5- and 40-m time (ES = 0.79 and 0.82) in the
weaker group. Although the additional significant improve-
ments of the stronger group (i.e., at 5 and 10 m) may in-
dicate a greater adaptability to the training stimulus, there
were no significant differences in the magnitude of per-
formance enhancements between the stronger and weaker
groups. Furthermore, the mean ES of the improvements in
sprint performance were quite similar between the experi-
mental groups (Table 3). Previous research has reported
improvements in sprint performance approaching signifi-
cance after ballistic power training (38), but such trends
have not been consistently observed (25,37). Thus, the cur-
rent findings are of great importance because this study
provides the strongest evidence to date that sprint perfor-
mance can be improved by ballistic power training in the
form of vertical jumping. The successful transfer of jump
squat training to sprint performance in the current study is
theorized to be associated with the efficacy of the program
design (i.e., highly sports-specific movements, frequency of
training, effective load, repetition, set, and interset recovery
parameters).
The ability of the current study to elucidate whether the
magnitude of performance improvements after ballistic
power training is influenced by strength level was limited
by several factors. First, the principle of diminished returns
dictates that initial improvements in muscular function are
easily invoked and further improvements are progressively
harder to achieve (37). Thus, the training programs of in-
dividuals with significantly greater strength levels (and more
experienced training backgrounds) typically need to contain
added variability, compared with weaker, inexperienced in-
dividuals (27,37). However, the nature of the research ques-
tions addressed by this study meant that the stronger and
weaker groups completed the same training program during
a period of 10 wk. Although the training program was de-
signed to contain a great deal of specificity to common athletic
movements, the experimental training lacked the level of
variability required to maximize improvements in experienced
athletes. Consequently, the ability of this intervention to
maximize the adaptations of the stronger group may have been
affected. Second, the current observations may have been
confounded by the stronger groups’ cessation of strength
training for the duration of the study (i.e., total of 15 wk). To
examine the specific mechanisms driving adaptation to the
ballistic power training intervention, all subjects were in-
structed to refrain from any lower body resistance training
(or sprint training) outside the scope of the current study.
Although this posed no impact on the strength level of the
weaker group (i.e., not involved in any such training before
commencing the experiment), the stronger group displayed a
statistically nonsignificant but practically relevant decrease
in maximal strength (4.6% decrease in 1RM/BM; ES = 0.91).
The neuromuscular changes associated with detraining peri-
ods of a similar time course (i.e., decreased neural drive and
CSA [15]) are theorized to negatively impact the ability of
the stronger group to adapt to the experimental training.
Thus, the cessation of strength training is theorized to have
negatively affected the ability of the stronger group to adapt
to the ballistic power training. It is imperative, therefore, that
future research is conducted that incorporates strength
maintenance sessions during the training intervention to elu-
cidate further the influence of strength on the magnitude
of improvements in athletic performance. Cognizant of
these limitations, the fact that the stronger group showed
similar performance improvements as the weaker group to
the ballistic power training intervention is of great practical
importance.
Mechanisms responsible for improved performance.
Monitoring the training-induced changes to the force–velocity
and force–power relationships during a sports-specific move-
ment such as the jump squat offers some indication of the
mechanisms driving adaptations in the stronger and weaker
groups. The ability of such an applied in vivo measure of
the force–velocity relationship to delineate exact changes to
muscle mechanics after training is complicated by a range of
factors including mixed fiber composition, muscle architec-
tural characteristics, anatomical joint configuration, levels of
neural activation, as well as the complex nature of the jump
squat movement (23). Despite these limitations, examina-
tion of the force–velocity relationship in sports-specific
movements quantifies the ability of the intact neuromus-
cular system to function under various loading conditions, in-
formation essential to understanding muscular function
during dynamic athletic movements. Data from this investi-
gation revealed that strength level did somewhat influence
the training-induced changes to the jump squat force–velocity
and force–power relationships (Figs. 2 and 3). Specifically,
the stronger group showed a more velocity-specific response
to the training stimulus, displaying the greatest improvements
under the lightest loading conditions (i.e., high-velocity, low-
force portion of the force–velocity relationship). In contrast,
ballistic power training with 0%–30% 1RM resulted in im-
provements in velocity and power throughout a range of
loading conditions for the weaker subjects (i.e., similar im-
provements at both high-velocity and high-force portions of
the force–velocity relationship). These changes caused the
slope of the force–velocity relationship to increase in the
http://www.acsm-msse.org1578 Official Journal of the American College of Sports Medicine
APPLIED SCIENCES
Copyright © 2010 by the American College of Sports Medicine. Unauthorized reproduction of this article is prohibited.

stronger group (aided by a slight decrease in F
max
) but not in
the weaker group. Thus, the current data support the theory
of velocity specificity (13,19) and the notion that relatively
weak or inexperienced subjects display relatively nonspecific
adaptations to training when compared with stronger, more
experienced athletes. Although the stronger group seemed
to display a more velocity-specific response, these apparent
dissimilarities did not translate into major changes in the sig-
nificant between-group differences that were evident before
training (Fig. 3). However, a significant between-group
difference in force at peak power during the lightest load
examined (i.e., 0% 1RM) that did not exist at baseline was
observed at midtest and at posttest. In addition, between-
group differences in power at 20% and 40% 1RM loads that
existed before training were no longer present at posttest.
These training-induced changes to the significant differ-
ences between stronger and weaker groups also indicate that
stronger individuals displayed adaptations with greater
velocity specificity.
Another potential mechanism driving the observed im-
provements in athletic performance was changes to move-
ment mechanics during jumping. Although no significant
changes were observed in the minimum and maximum hip,
knee, and ankle angles during the 0% 1RM jump squat
(Table 4), significant training-induced changes in displace-
ment, velocity, force, and power were evident throughout
the 0% 1RM jump squat for both groups (Figs. 4–6). These
changes are theorized to have led to an optimization of
stretch-shorten cycle (SSC) function, which contributed to
the enhanced jump performance. Arguably, the primary
mechanism driving the enhancement of performance during
SSC movements is the attainment of a greater level of force
at the beginning of the concentric phase in comparison to
concentric-only movements (5). Both stronger and weaker
groups displayed significant increases in force during the
eccentric phase and early in the concentric phase of the 0%
1RM jump squat after training (Figs. 5 and 6). This increase
was generated by the improved acceleration of the BM
during the eccentric phase and, similar to comparisons be-
tween SSC and concentric-only movements, resulted in
greater net impulse, velocity of movement, power output,
and, ultimately, enhanced jump height after training. The
observed changes are hypothesized to be due to the slight
modifications in jumping mechanics (i.e., a marginally
shorter but faster countermovement) and a significant de-
crease in time to takeoff (Tables 3 and 4). Very little pre-
vious research exists examining the impact of training on
performance variables throughout the entire movement
however, similar results have been observed after an
analogous ballistic power training intervention involving
relatively untrained men (10). Comparisons between the
stronger and the weaker groups revealed no new significant
between-group differences after training in joint angles of
the hip, knee, and ankle (Table 4) or power output
throughout the 0% 1RM jump squat (Fig. 4). Thus, changes
to jump mechanics common to both stronger and weaker
individuals after ballistic power training involving jump
squats are theorized to have contributed to improvements in
jump performance.
This investigation revealed that stronger and weaker
subjects displayed similar adaptations in muscle architecture
after ballistic power training (Table 5). As expected, the
training intervention did not elicit any significant changes to
muscle thickness (indicative of whole-muscle CSA [21]) or
the lean mass of the leg for either experimental group. The
relatively light loads used during ballistic power training
(i.e., 0%–30% 1RM) were too small to elicit the necessary
mechanical stimulus required to initiate a significant hyper-
trophic response (16,17). In addition, ballistic power train-
ing did not elicit any significant differences in the pennation
angle of either the stronger or the weaker group. Changes in
pennation angle have been reported previously, with
increases observed after heavy resistance training (4,21),
although not consistently (3), and decreases in response to
sprint training (4). These changes are believed to have a
positive impact on the force- and velocity-generating ca-
pacity of muscle, respectively. However, the potential im-
pact of ballistic power training on changes to pennation
angle has not been examined previously. On the basis of
the current data, ballistic power training did not prompt
structural changes to the muscle (i.e., muscle thickness or
pennation angle). Furthermore, the initial strength level of
the subject did not impact the type of adaptations in muscle
architecture. Muscular adaptations at an intracellular level
(i.e., alterations to anaerobic and aerobic enzymes, muscle
substrates, and/or protein expression) and/or connective tis-
sue remodeling may have contributed to the observed per-
formance improvements (14). However, the potential for
such adaptations cannot be established or rejected because
these mechanisms were not assessed in the current study.
Neural adaptations in response to ballistic power train-
ing were observed, with significant changes evident in the
neural activation patterns of subjects regardless of their ini-
tial strength level. Changes in EMG (indicative of alter-
ations in motor unit recruitment, firing frequency, and/or
synchronization) have been previously reported with im-
provements in performance after ballistic power training
(16,25,36). However, this is one of the first experiments to
show training-induced changes in EMG during complex,
multijoint, sports-specific movements. The current data in-
dicate that ballistic power training resulted in significant
increases in the rate of EMG rise during dynamic athletic
performance (i.e., 0% 1RM jump squat) in both stronger
and weaker groups. Thus, it is theorized that the ballistic
power training enhanced intermuscular coordination by op-
timizing the magnitude and timing of muscle activation.
Similarly, Ha¨kkinen et al. (16) observed ballistic power
training (jump squats with 0%–60% 1RM) to result in a
38% increase in the rate of EMG rise during an isometric
knee extension, which was reported to contribute to im-
proved performance (a 24% improvement in isometric
RFD). Although the current study cannot delineate whether
INFLUENCE OF STRENGTH ON POWER Medicine & Science in Sports & Exercise
d
1579
APPLIED SCIENCES
Copyright © 2010 by the American College of Sports Medicine. Unauthorized reproduction of this article is prohibited.

the observed changes in EMG were brought about through
alterations in motor unit recruitment, firing frequency, and/or
synchronization, previous research involving intramus-
cular EMG may offer some insight. During ballistic con-
tractions, motor units have been reported to begin firing at
very high frequencies (even in excess of those required to
achieve maximal force) followed by a rapid decline (40).
The high initial firing frequency is believed to result in in-
creased RFD, even if only maintained for a very short
period (26). van Cutsem et al. (36) reported the peak firing
frequency at the onset of ballistic contraction to increase
after ballistic power training. Furthermore, these higher
firing frequencies were maintained for longer throughout
the contraction after training. In addition, a training-induced
increase in the percentage of doublet discharges (i.e., a
motor unit firing two consecutive discharges in a e5-ms
interval) at the onset of a ballistic contraction was also
reported (5.2% of motor units displayed doublet discharges
before training, and this increased to 37.2% after 12 wk of
ballistic power training). These training-induced changes
were reported to contribute to an 82.3% increase in the RFD
and a 15.9% improvement in time to peak force during bal-
listic contractions (36). Therefore, the ballistic power train-
ing intervention of the current study may have induced
adaptations to the pattern of motor unit firing frequency that
subsequently enhanced RFD capabilities and contributed to
enhanced athletic performance. It is important to note that
these mechanisms of adaptation as well as the performance
improvements observed are specific to the movement pattern
and loading parameters used in the current study as power
produced by muscle varies according to both the nature of
the movement and the loading parameters used (12).
In conclusion, the ballistic power training program used
was very effective at enhancing athletic performance, with
both groups showing significant improvements in maximal
power, jump height, movement velocity, and sprint perfor-
mance. The magnitude of improvements in athletic perfor-
mance after ballistic power training did not significantly
differ between strong and weak subjects. However, ES anal-
yses revealed that the training had a tendency toward pro-
ducing a more pronounced effect on jump performance in
the stronger group (especially after only 5 wk of training)
that is believed to hold great practical relevance. Further-
more, this conclusion is strengthened by the confounding
influences of the principle of diminished returns as well as
the stronger groups’ cessation of strength training. Therefore,
because stronger individuals display superior performance
before ballistic power training and have a tendency for
greater improvements after such training, it would be ad-
vantageous for individuals to establish a solid foundation of
strength before focusing on ballistic power training. The
mechanisms driving the performance improvements were
very similar for both the stronger and the weaker groups.
Ballistic power training involving sports-specific movements
increased the rate of EMG rise during jumping, which,
coupled with slight technique modifications believed to be
specific to this training stimulus, led to an improvement in
SSC function. As a result, subjects were able to achieve
greater force and more optimally timed force application
resulting in higher acceleration and movement velocity in
shorter periods. Thus, athletic performance was improved
through enhanced magnitude and RFD, translating to higher
velocity and power production capabilities. Not only do
these findings provide a deeper understanding of the mech-
anistic factors driving improvements in performance after
ballistic power training but they also reveal that the neuro-
muscular and biomechanical adaptations to such training
are not influenced by strength level. These findings have
several implications for the design of ballistic power training
programs that effectively improve athletic performance. The
use of ballistic jump squats with very light loads (i.e., 0%–
30% 1RM) is sufficient to induce significant improvements
in jump and sprint performance of both strong and weak
athletes. However, ballistic power training programs of
stronger athletes need to contain considerably more variabil-
ity than programs of weaker athletes for continued perfor-
mance improvements beyond 5 wk of training. Finally, the
incorporation of strength maintenance sessions throughout
a power training phase is vital because decrements in max-
imal strength (and the ensuing neuromuscular alterations [15])
are theorized to negatively affect the ability of stronger ath-
letes to adapt to ballistic power training.
Funding from the National Strength and Conditioning Association
was received for this work.
Results of the present study do not constitute endorsement by
the American College of Sports Medicine.
REFERENCES
1. Baker D, Nance S. The relation between strength and power in
professional rugby league players. J Strength Cond Res. 1999;
13(3):224–9.
2. Baker DG, Newton RU. Comparison of lower body strength,
power, acceleration, speed, agility, and sprint momentum to de-
scribe and compare playing rank among professional rugby league
players. J Strength Cond Res. 2008;22(1):153–8.
3. Blazevich AJ, Cannavan D, Coleman DR, Horne S. Influence of
concentric and eccentric resistance training on architectural adap-
tation in human quadriceps muscles. J Appl Physiol. 2007;103(5):
1565–75.
4. Blazevich AJ, Gill ND, Bronks R, Newton RU. Training-specific
muscle architecture adaptation after 5-wk training in athletes. Med
Sci Sports Exerc. 2003;35(12):2013–22.
5. Bobbert MF, Gerritsen KG, Litjens MC, Van Soest AJ. Why is
countermovement jump height greater than squat jump height?
Med Sci Sports Exerc. 1996;28(11):1402–12.
6. Bobbert MF, Van Soest AJ. Effects of muscle strengthening on
vertical jump height: a simulation study. Med Sci Sports Exerc.
1994;26(8):1012–20.
7. Bourque PJ. Determinant of load at peak power during maximal
effort squat jumps in endurance and power trained athletes
http://www.acsm-msse.org1580 Official Journal of the American College of Sports Medicine
APPLIED SCIENCES
Copyright © 2010 by the American College of Sports Medicine. Unauthorized reproduction of this article is prohibited.

[dissertation]. Fredericton (Canada): University of New Brunswick;
2003. p. 44–60.
8. Cohen J. The concepts of power analysis. In: Cohen J, editor.
Statistical Power Analysis for the Behavioral Sciences. Hillsdale
(NJ): Lawrence Erlbaum Associates; 1988. p. 1–18.
9. Cormie P, McBride JM, McCaulley GO. Validation of power
measurement techniques in dynamic lower body resistance exer-
cises. J Appl Biomech. 2007;23(2):103–18.
10. Cormie P, McBride JM, McCaulley GO. Power–time, force–time,
and velocity–time curve analysis of the countermovement jump:
impact of training. J Strength Cond Res. 2009;23(1):177–86.
11. Cormie P, McCaulley GO, McBride JM. Power versus strength–
power jump squat training: influence on the load–power relation-
ship. Med Sci Sports Exerc. 2007;39(6):996–1003.
12. Cormie P, McCaulley GO, Triplett NT, McBride JM. Optimal
loading for maximal power output during lower-body resistance
exercises. Med Sci Sports Exerc. 2007;39(2):340–9.
13. Coyle EF, Feiring DC, Rotkis TC, et al. Specificity of power im-
provements through slow and fast isokinetic training. J Appl
Physiol. 1981;51(6):1437–42.
14. Folland JP, Williams AG. The adaptations to strength training:
morphological and neurological contributions to increased strength.
Sports Med. 2007;37(2):145–68.
15. Ha¨kkinen K, Alen M, Komi PV. Changes in isometric force- and
relaxation-time, electromyographic and muscle fibre characteristics
of human skeletal muscle during strength training and detraining.
Acta Physiol Scand. 1985;125(4):573–85.
16. Ha¨kkinen K, Komi PV, Alen M. Effect of explosive type strength
training on isometric force- and relaxation-time, electromyographic
and muscle fibre characteristics of leg extensor muscles. Acta
Physiol Scand. 1985;125(4):587–600.
17. Ha¨kkinen K, Komi PV, Alen M, Kauhanen H. EMG, muscle fibre
and force production characteristics during a 1 year training period
in elite weight-lifters. Eur J Appl Physiol. 1987;56:419–27.
18. Ha¨kkinen K, Komi PV, Tesch PA. Effect of combined concentric
and eccentric strength training and detraining on force-tme, mus-
cle fibre and metabolic characteristics of leg extensor muscles.
Scand J Sports Sci. 1981;3:50–8.
19. Kaneko M, Fuchimoto T, Toji H, Suei K. Training effect of dif-
ferent loads on the force–velocity relationship and mechanical power
output in human muscle. Scand J Med Sci Sports. 1983;5(2):50–5.
20. Kawakami Y, Abe T, Kanehisa H, Fukunaga T. Human skeletal
muscle size and architecture: variability and interdependence.
Am J Hum Biol. 2006;18(6):845–8.
21. Kawakami Y, Abe T, Kuno SY, Fukunaga T. Training-induced
changes in muscle architecture and specific tension. Eur J Appl
Physiol. 1995;72:566–73.
22. MacDougall JD, Elder GCB, Sale DG, Moroz JR, Sutton JR.
Effects of strength training and immobilization on human muscle
fibers. Eur J Appl Physiol. 1980;43:25–34.
23. MacIntosh BR, Holash RJ. Power output and force-velocity
properties of muscle. In: Nigg BM, MacIntosh BR, Mester J,
editors. Biomechanics and Biology of Movement. Champaign (IL):
Human Kinetics; 2000. p. 193–210.
24. McBride JM, Triplett-McBride NT, Davie A, Newton RU. A
comparison of strength and power characteristics between power
lifters, Olympic lifters, and sprinters. J Strength Cond Res. 1999;
13(1):58–66.
25. McBride JM, Triplett-McBride T, Davie A, Newton RU. The
effect of heavy- vs. light-load jump squats on the development of
strength, power, and speed. JStrengthCondRes. 2002;16(1):75–82.
26. Miller RG, Mirka A, Maxfield M. Rate of tension development
in isometric contractions of a human hand muscle. Exp Neurol.
1981;72:267–85.
27. Newton RU, Kraemer WJ. Developing explosive muscular power:
implications for a mixed method training strategy. Strength Cond
J. 1994;16(5):20–31.
28. Newton RU, Kraemer WJ, Hakkinen K. Effects of ballistic
training on preseason preparation of elite volleyball players. Med
Sci Sports Exerc. 1999;31(2):323–30.
29. Newton RU, Kraemer WJ, Hakkinen K, Humphries B, Murphy
AJ. Kinematics, kinetics, and muscle activation during explosive
upper body movements. J Appl Biomech. 1996;12:31–43.
30. Nuzzo JL, McBride JM, Cormie P, McCaulley GO. Relationship
between countermovement jump performance and multijoint iso-
metric and dynamic tests of strength. J Strength Cond Res. 2008;
22(3):699–707.
31. Pandy MG. An analytical framework for quantifying muscular
action during human movement. In: Winters JM, Woo SLY,
editors. Multiple Muscle Systems Biomechanics and Movement
Organisation. New York (NY): Springer Verlag; 1990. p. 653–62.
32. Paulus DC, Reiser RF, Troxell WO. Pneumatic strength assessment
device: design and isometric measurement. Biomed Sci Instrum.
2004;40:277–82.
33. Sale DG. Neural adaptations to strength training. In: Komi PV,
editor. Strength and Power in Sport. Oxford (UK): Blackwell
Science; 2003. p. 281–313.
34. Stone MH, O’Bryant HS, McCoy L, Coglianese R, Lehmkuhl M,
Schilling B. Power and maximum strength relationships during
performance of dynamic and static weighted jumps. J Strength
Cond Res. 2003;17(1):140–7.
35. Ugrinowitsch C, Tricoli V, Rodacki AL, Batista M, Ricard MD.
Influence of training background on jumping height. J Strength
Cond Res. 2007;21(3):848–52.
36. van Cutsem M, Duchateau J, Hainaut K. Changes in single motor
unit behaviour contribute to the increase in contraction speed
after dynamic training in humans. J Physiol. 1998;513(pt 1):
295–305.
37. Wilson G, Murphy AJ, Walshe AD. Performance benefits from
weight and plyometric training: effects of initial strength level.
Coach Sport Sci J. 1997;2(1):3–8.
38. Wilson GJ, Newton RU, Murphy AJ, Humphries BJ. The optimal
training load for the development of dynamic athletic perfor-
mance. Med Sci Sports Exerc. 1993;25(11):1279–86.
39. Zatsiorsky VM. Science and Practice of Strength Training.
Champaign (IL): Human Kinetics; 1995. p. 47–65.
40. Zehr EP, Sale DG. Ballistic movement: motor control and muscle
activation. Can J Appl Physiol. 1994;19:363–78.
INFLUENCE OF STRENGTH ON POWER Medicine & Science in Sports & Exercise
d
1581
APPLIED SCIENCES
Copyright © 2010 by the American College of Sports Medicine. Unauthorized reproduction of this article is prohibited.

OUTLINE FOR ARTICLE CRITIQUE: TRAINING EXERCISES FOR IMPROVING
SPEED AND AGILITY IN ELITE ATHLETES
Introduction
The article by was chosen for analysis because it discusses training exercises that improve
both speed and agility – the capability to move fast and with less effort, for elite athletes.
The article empirically investigates the adaptation to and use of ballistic power training.
Ballistic training enables athletes to accelerate a load faster with no deceleration stage,
enabling them to build both power and speed-strength.
Methodology
The study design’s procedures are adequate.
The study design used in the experiment by is the randomized controlled trial (RCT)
undertaken for fifteen weeks.
The RCT is an intervention study design in which subjects are randomly assigned to two
clusters – the experimental and control groups.
When the study is conducted, the anticipated difference between the two clusters in the RCT
is the outcome variable under study.
Results
The two experimental groups revealed significant enhancements in jump and sprint
performance following the power training.
Effect size (ES) assessment showed a propensity toward basically relevant variations between
stronger and weaker persons in the improvement degrees in jump performance, mostly after
five weeks’ training.

The mechanisms responsible for these enhancements entailed significant changes in the neural
activation, jump mechanics, and force-velocity relationship.
Discussion
The study offers clear insights into the meaning of the results.
It explains that the findings show that the trial training efficaciously enhanced athletic
performance in both groups – experimental and control.
Additionally, the study embeds the results from the perspective of previous studies.
The study found that the ballistic power training trial training enhanced athletic performance
in both groups – experimental and control.
Conclusion
The article’s purpose was to determine if strength level influences the performance
improvement magnitude and the mechanisms controlling adaptation to ballistic power
training.
Findings showed that strength level did not significantly impact performance improvement
magnitude.
The study has effectively outlined the RCT study design and met the research ethics
requirements.
The study’s discussion clearly interprets findings and relates them to previous studies, and
indicates the setbacks.
References

Running head: ARTICLE CRITIQUE 1
ARTICLE CRITIQUE: TRAINING EXERCISES FOR IMPROVING SPEED AND AGILITY
IN ELITE ATHLETES
Student’s Name:
Institution affiliation:
Date:

ARTICLE CRITIQUE 2
ARTICLE CRITIQUE: TRAINING EXERCISES FOR IMPROVING SPEED AND AGILITY
IN ELITE ATHLETES
Introduction
The article by Cormie et al. (2010) was chosen for analysis because it discusses training
exercises that improve both speed and agility – the capability to move fast and with less effort, for
elite athletes. The article empirically investigates the adaptation to and use of ballistic power
training. Ballistic training enables athletes to accelerate a load faster with no deceleration stage,
enabling them to build both power and speed-strength. This article is vital to speed and agility for
elite athletes because it explores the effect of strength level on enhancement extent and what drives
adaptation following ballistic power training. Understanding this effect is critical to the design of
training exercises that most effectively boost maximal power generation and athlete performance
in athletes with different training backgrounds. Therefore, the article aimed to examine if the level
of performance enhancements and the mechanisms thrusting adaptation to ballistic power training
varies between strong and weak persons (Cormie et al., 2010).
Methodology
The article has salient strengths and weaknesses, as discussed below.
Strengths
The study design’s procedures are adequate. The study design used in the experiment by
Cormie et al. (2010) is the randomized controlled trial (RCT) undertaken for 15 weeks. The RCT
is an intervention study design in which subjects are randomly assigned to two clusters – the
experimental and control groups (Saxena et al., 2012). When the study is conducted, the
anticipated difference between the two clusters in the RCT is the outcome variable under study.
The trial group receives the treatment under assessment, whereas the control group receives an

ARTICLE CRITIQUE 3
alternate intervention or no intervention (Saxena et al., 2012). Investigators monitor under the
experimental conditions to find the trial treatment's efficacy, and effectiveness is evaluated by
comparing it to the control group.
The study was effective in undertaking the necessary steps for the RCT study design. The
RCT requires that subjects are allotted to two or more groups. The investigators divided
participants into two clusters based on their one-repetition-to-body mass ratio (1RM/BM) –
stronger (1BM/BM9 1.55) and weaker (1RM/BMG 1.55). They assigned participants in the
stronger cluster into the stronger group and randomized those in the weaker cluster into one of the
two groups, including the weaker and the control groups.
This study’s methodology also correctly introduced an intervention for different treatments
of the control and experimental groups. In particular, the stronger and weaker sets undertook a 10-
week ballistic training, whereas the control set continued their regular activity level over the study
duration. During the training, three sessions were undertaken every week. Participants did
maximal-effort jump squats having 0-30 percent 1RM. They undertook a 2-d testing battery prior
to commencing training. They did so again after five weeks of training (mid-test), specifically
stronger and weaker sets only, and after ten weeks of evaluation (post-test). The investigators
compared the subjects based on a measured response – the assessment of jump and spring
undertakings and evaluation of the force-velocity connection, jumping mechanics, neural drive,
and muscle architecture.
The study also fulfilled the ethical requirements of studies utilizing human subjects.
According to Resnik (2018), research involving human subjects ethically requires that the likely
participants or those legally permitted to represent the subjects be given the details that a
reasonable individual needs to make an informed judgment whether to take part and a chance to

ARTICLE CRITIQUE 4
assess that information. Cormie et al. (2010) fulfilled this ethical standard by providing their
potential participants with adequate information regarding the study to facilitate their decision-
making whether to participate. Subsequently, Cormie et al. (2010) received the participants’
written informed consent. The study was also authorized by the university’s human research ethics
committee.
Research ethics also requires studies utilizing human participants to minimize risks while
maximizing benefits. Fakruddin et al. (2013) noted that studies with human subjects should protect
subjects from harm and not use unauthorized interventions. Investigators must notify participants
about specific risks linked with specific interventions. They should offer complete details to study
participants regarding the process and possible outcome of randomized trials (Fakruddin et al.,
2013). The expectation of sufficient study design, desirable benefit-harm ratio and equitably free
and adequately informed consent are requisite conditions for an ethical and acceptable human
investigation (Fakruddin et al., 2013). In this regard, Cormie et al. (2010) informed participants
concerning the probable risks involved in the experiment. They also minimized the risks by
recruiting participants based on their capacity to undertake a back squat with adept technique. This
measure enabled the study to obtain 35 men who met all the study’s assessment and training
expectations. The investigators minimized risks further by sufficiently acquainting the participants
with all testing protocols before actual evaluation.
Weaknesses
The article does not explain the sampling method used to obtain the study subjects. The
authors have also not explained the steps they took to obtain the sample. They have only stated
that they recruited participants based on their capability to do a back squat with expertise. They
have not defined the population to which the participants in the experiment belong.

ARTICLE CRITIQUE 5
Results generalizability is difficult since the study did not state the sampling technique
used, the steps undertaken to obtain the sample, or the sample population (target population).
Taherdoost (2016) states that sampling can be utilized to infer about population or generalize
results. However, due to the lack of stating the sampling technique, reasons for its choice, and
necessary steps, it is difficult to determine the population to which the study of can infer.
Results
The two experimental groups revealed significant (stronger and weaker: p ≤ 0.05)
enhancements in jump and sprint performance following the power training. Effect size (ES)
assessment showed a propensity toward basically relevant variations between stronger and weaker
persons in the improvement degrees in jump performance, mostly after five weeks’ training. The
mechanisms responsible for these enhancements entailed significant (p ≤ 0.05) changes in the
neural activation, jump mechanics, and force-velocity relationship. However, there were no
observable changes in muscle architecture. Therefore, strength level did not significantly impact
improvement magnitudes following ballistic power training. However, the training tended to
produce a significant influence on jump performance in the stronger segment. The mechanisms
influencing performance improvements did not differ between strong and weak persons.
Discussion
The strengths and weaknesses of the article’s discussion include the following:
Strengths
The study offers clear results interpretations. It explains that the findings show that the
trial training efficaciously enhanced athletic performance in both groups – experimental and
control. Additionally, the study embeds the results from the perspective of previous studies. The
study found that the ballistic power training enhanced athletic performance in both groups –

ARTICLE CRITIQUE 6
experimental and control. Hence, strength level did not significantly affect improvement levels.
Contrary, McBride et al. (2002) and Wilson et al. (1997) found a significant link between strength
level and performance improvement magnitude after power training. The authors also related their
findings to previous studies. For instance, like this study’s findings, Wilson et al. (1993) reported
significant sprint performance improvements following ballistic power training.
The article indicates the study limitations. Cormie et al. (2010) explain that their current
study’s capacity to determine if the strength level impacted the performance improvement level
following ballistic power training was restricted by factors such as diminishing returns.
Diminishing return is a principle stipulating that preliminary enhancements in muscular activity
are achieved easily, but more improvements are difficult to attain (Wilson et al., 1997).
Weakness
The study does not indicate the degree to which the results can be generalized, although
the discussion presents all the associations illustrated by the results. This issue could be because
the population was not identified earlier in the methodology section. Hence, there is no population
to which to generalize the results.
Conclusion
The article’s purpose was to determine if strength level influences the performance
improvement magnitude and the mechanisms controlling adaptation to ballistic power training.
Findings showed that strength level did not significantly impact performance improvement
magnitude. The study has effectively outlined the RCT study design and met the research ethics
requirements. The study’s discussion clearly interprets findings and relates them to previous
studies, and indicates the setbacks. However, the article does not state its results' generalizability

ARTICLE CRITIQUE 7
due to unstated population and sampling technique. This article generally offers critical insights
into training programs that enhance athletes' speed and agility.

ARTICLE CRITIQUE 8
References
Cormie, P., Mcguigan, M., & Newton, R. (2010). Influence of Strength on Magnitude and
Mechanisms of Adaptation to Power Training. Medicine & Science in Sports &
Exercise, 42(8), 1566-1581. https://doi.org/10.1249/mss.0b013e3181cf818d
Fakruddin, M., Mannan, K., Chowdhury, A., Mazumdar, R., Hossain, M., & Afroz, H. (2013).
Research involving Human Subjects - Ethical Perspective. Bangladesh Journal of
Bioethics, 4(2), 41-48. https://doi.org/10.3329/bioethics.v4i2.16375
McBride, J., Triplett-Mcbride, T., Davie, A., & Newton, R. (2002). The Effect of Heavy- Vs.
Light-Load Jump Squats on the Development of Strength, Power, and Speed. The Journal
of Strength and Conditioning Research, 16(1), 75-82. https://doi.org/10.1519/1533-
4287(2002)016<0075:teohvl>2.0.co;2
Resnik, D. (2018). The ethics of research with human subjects (1st ed.). New York: Springer.
Saxena, P., Prakash, A., Acharya, A., & Nigam, A. (2012). How to design and conduct a
Randomised Controlled Trial? Indian Journal of Medical Specialities, 3(2), 198-202.
https://doi.org/10.7713/ijms.2012.0055
Taherdoost, H. (2016). Sampling Methods in Research Methodology; How to Choose a Sampling
Technique for Research. SSRN Electronic Journal, 5(2), 18-27.
https://doi.org/10.2139/ssrn.3205035
Wilson, G., Murphy, J., & Walshe, D. (1997). Performance benefits from weight and plyometric
training: effects of initial strength level. Coach Sport Sci J., 2(1), 3-8.
Wilson, G., Wilson, R., Murphy, A., & Humphries, B. (1993). The optimal training load for the
development of dynamic athletic performance. Medicine & Science in Sports &
Exercise, 25(11), 1279–1286.

Influence of Strength on Magnitude and
Mechanisms of Adaptation to Power Training
PRUE CORMIE
1
, MICHAEL R. MCGUIGAN
2,3
, and ROBERT U. NEWTON
1
1
School of Exercise, Biomedical and Health Sciences, Edith Cowan University, Perth, AUSTRALIA;
2
New Zealand Academy
of Sport North Island, Auckland, NEW ZEALAND; and
3
Institute of Sport and Recreation Research New Zealand,
Auckland University of Technology, Auckland, NEW ZEALAND
ABSTRACT
CORMIE, P., M. R. MCGUIGAN, and R. U. NEWTON. Influence of Strength on Magnitude and Mechanisms of Adaptation to
Power Training. Med. Sci. Sports Exerc., Vol. 42, No. 8, pp. 1566–1581, 2010. Purpose: To determine whether the magnitude of
performance improvements and the mechanisms driving adaptation to ballistic power training differ between strong and weak indi-
viduals. Methods: Twenty-four men were divided into three groups on the basis of their strength level: stronger (n= 8, one-repetition
maximum-to-body mass ratio (1RM/BM) = 1.97 T0.08), weaker (n= 8, 1RM/BM = 1.32 T0.14), or control (n= 8, 1RM/BM = 1.37 T
0.13). The stronger and weaker groups trained three times per week for 10 wk. During these sessions, subjects performed maximal-
effort jump squats with 0%–30% 1RM. The impact of training on athletic performance was assessed using a 2-d testing battery
that involved evaluation of jump and sprint performance as well as measures of the force–velocity relationship, jumping mechanics,
muscle architecture, and neural drive. Results: Both experimental groups showed significant (Pe0.05) improvements in jump
(stronger: peak power = 10.0 T5.2 WIkg
j1
, jump height = 0.07 T0.04 m; weaker: peak power = 9.1 T2.3 WIkg
j1
, jump height =
0.06 T0.04 m) and sprint performance after training (stronger: 40-m time = j2.2% T2.0%; weaker: 40-m time = j3.6% T2.3%).
Effect size analyses revealed a tendency toward practically relevant differences existing between stronger and weaker individuals in the
magnitude of improvements in jump performance (effect size: stronger: peak power = 1.55, jump height = 1.46; weaker: peak power =
1.03, jump height = 0.95) and especially after 5 wk of training (effect size: stronger: peak power = 1.60, jump height = 1.59; weaker:
peak power = 0.95, jump height = 0.61). The mechanisms driving these improvements included significant (Pe0.05) changes in the
force–velocity relationship, jump mechanics, and neural activation, with no changes to muscle architecture observed. Conclusions: The
magnitude of improvements after ballistic power training was not significantly influenced by strength level. However, the training had a
tendency toward eliciting a more pronounced effect on jump performance in the stronger group. The neuromuscular and biomechanical
mechanisms driving performance improvements were very similar for both strong and weak individuals. Key Words: BALLISTIC,
JUMP, SQUAT, SPRINT, NEUROMUSCULAR ADAPTATIONS
After strength training, the magnitude of improve-
ments in strength and the mechanisms driving
those adaptations differ as the strength level of
the athlete improves (14,17,33,37). Specifically, initial im-
provements in strength are much greater and predomi-
nately driven by neural adaptations (although early phase
muscular adaptations also occur), whereas further increases
in strength are progressively harder to achieve and morphol-
ogical adaptations in the muscle become more important
(14,17,33,37). Thus, training programs geared at signifi-
cantly improving strength in individuals with an existing
high level of strength require a much more sophisticated de-
sign (i.e., greater specificity and variation) (17,33). Although
the factors contributing to maximal strength and the appli-
cation of strength training are well understood, much less is
known concerning the adaptations to and utilization of bal-
listic power training. In particular, the influence of strength
level on both the magnitude of improvement and the mech-
anisms driving adaptation after ballistic power training is not
known. Such knowledge is vital to the development of train-
ing programs that most effectively improve maximal power
production and athletic performance in athletes with a wide
variety of training backgrounds.
Cross-sectional comparisons have revealed that individ-
uals with higher strength levels have markedly superior
power production capabilities than those with a low level of
strength (2,7,10,24,34,35). For example, significant differ-
ences in power output and/or jump height between in-
dividuals with significantly different strength levels have
been reported in comparisons of well-trained athletes and
relatively untrained controls (10,24,35), athletes competi-
tive in power-type sports (i.e., volleyball) and endurance
events (7), rugby league players involved in national versus
Address for correspondence: Prue Cormie, Ph.D., School of Exercise,
Biomedical and Health Sciences, Edith Cowan University, 270 Joondalup
Submitted for publication September 2009.
Accepted for publication December 2009.
0195-9131/10/4208-1566/0
MEDICINE & SCIENCE IN SPORTS & EXERCISE
Ò
Copyright Ó2010 by the American College of Sports Medicine
DOI: 10.1249/MSS.0b013e3181cf818d
1566
APPLIED SCIENCES
Copyright © 2010 by the American College of Sports Medicine. Unauthorized reproduction of this article is prohibited.

state competitions (2), as well as the strongest and weakest
in a pool of resistance-trained men with various training
backgrounds (34). These findings are supported by reports
of a significant and positive relationship existing between
maximal strength and maximal power production (1,30,34).
While skeletal muscle mechanics that cause the force–
velocity relationship dictate that maximal strength plays a
role in muscular power, the development of muscular power
is influenced by a multitude of factors in addition to maximal
strength (27). For example, McBride et al. (24) observed that
despite no differences in the maximal strength of national-
level weightlifters and powerlifters (Smith machine squat
one-repetition maximum-to-body mass ratio (1RM/BM) =
2.86 T0.15 and 2.88 T0.14, respectively), weightlifters
generated significantly greater power output during an un-
loaded countermovement jump (CMJ; weightlifters = 63.0 T
2.7 WIkg
j1
, powerlifters = 56.9 T2.5 WIkg
j1
). Such obser-
vations were attributed to the various training protocols com-
monly used by these athletes (i.e., high force–high velocity
training vs high force–low velocity training common to
weightlifting and powerlifting, respectively) (24). Similar
results were observed in comparisons between well-trained
power athletes and recreational bodybuilders with similar
strength levels (35). Therefore, although the development
of maximal muscular power required for the successful
performance of many athletic movements is influenced by
a multitude of factors (27), stronger individuals have con-
sistently been shown to display superior power output
than individuals with a significantly lower strength level
(2,7,10,24,34,35).
This raises the question of what mechanisms contribute to
the improved power production capabilities of stronger in-
dividuals. Stronger individuals possess neuromuscular char-
acteristics that form the basis for superior maximal power
production and ultimately contribute to enhanced athletic
performance. Specifically, an individual with a substantially
greater level of strength (i.e., strong vs weak person) would
have larger whole-muscle cross sectional area (CSA), a re-
sult of greater myofibrillar CSA of both Type I and Type II
fibers, with more pronounced hypertrophy of Type II fibers
evident (18,22). Pennation angle may also be greater and
possibly even fascicle length (3,4,21). In addition, effective-
ness of neural drive (i.e., recruitment, rate of onset, firing
frequency) as well as intermuscular coordination would be far
superior in the significantly stronger individual (15,25,33).
These neuromuscular characteristics would result in a shift
in the force–velocity relationship so that the force of muscle
contraction would be greater for any given velocity of short-
ening (19). As a consequence, the ability to generate maximal
muscular power, and therefore perform athletic movements,
would be superior in a considerably stronger individual com-
pared with a weaker person (19,23,38).
Despite the advantage of strength for maximal power
production and athletic performance, little is known re-
garding whether neuromuscular characteristics of stronger
individuals allow for superior adaptation to ballistic power
training. More importantly, it is not known if the mech-
anisms driving adaptations to ballistic power training are
influenced by strength level. To the authors’ knowledge,
only one intervention study examining the possible influence
of strength on improvements after ballistic power training
exists (37). Wilson et al. (37) compared the improvements
between stronger (n= 4; squat 1RM/BM = 1.99 T0.30) and
weaker men (n= 5; squat 1RM/BM = 1.21 T0.18) after 8 wk
of drop jump training. Neither group significantly improved
either jump and reach height or 20-m sprint time, and no
correlation was found between strength level and the mag-
nitude of the training-induced change in jump and reach
height (r=j0.13, n= 14) (37). Therefore, this previous
study offers little insight into the influence of strength on the
magnitude of improvements in athletic performance after
ballistic power training. Furthermore, the investigation did
not involve measures to examine any mechanistic factors pos-
sibly involved in adaptations to the training. Simulation data
suggest that although jump height is most sensitive to in-
creases in strength-to-BM ratio (31), an increase in strength
does not translate into increased jump height unless control
(i.e., intermuscular coordination—the appropriate magnitude
and timing of activation of agonist, synergist, and antagonist
muscles during a movement) is tuned to the strengthened
muscle properties (6). These data are supported by the con-
cept of a delayed training effect in which it takes consid-
erable time and effort for an increase in strength to transmute
to improved performance in multijoint movements because
intermuscular coordination needs to be adapted to the stronger
motor units/muscles (39). Therefore, it may be speculated
that a stronger individual exposed to ballistic power training
would improve performance by fine tuning the timing and
patterns of neural drive, thus improving intermuscular coor-
dination and movement technique (although muscular adap-
tations at the cellular level such as alterations to protein
expression, calcium release, and uptake as well as relaxation
time may also contribute). It is unknown if the combination
of these potential changes with the underlying neuromuscular
characteristics of the stronger individual would result in a
training response dissimilar to individuals with lower levels
of strength.
In comparisons of individuals not currently involved in
ballistic power training, previous research has demonstrated
that stronger individuals are able to generate superior levels
of maximal power than significantly weaker individuals
(2,7,10,24,34,35). Although the enhanced maximal power
production of stronger individuals in the absence of ballistic
power training is theorized to be due to the underlying neu-
romuscular characteristics of stronger individuals, it is un-
clear if these characteristics improve the ability to adapt to
ballistic power training. Specifically, it is not known whether
ballistic power training elicits performance improvements
in stronger individuals of a greater magnitude than that
which is achievable with weaker subjects. Furthermore, there
is a paucity of research investigating whether strength level
influences the mechanisms responsible for performance
INFLUENCE OF STRENGTH ON POWER Medicine & Science in Sports & Exercise
d
1567
APPLIED SCIENCES
Copyright © 2010 by the American College of Sports Medicine. Unauthorized reproduction of this article is prohibited.

improvements after ballistic power training. Therefore, the
purpose of this experiment was to determine whether the
magnitude of performance improvements and the mecha-
nisms driving adaptation to ballistic power training differ
between strong and weak individuals.
METHODS
Experimental design. This study used a randomized,
control design and was conducted during a period of 15 wk.
Subjects were divided into two strata on the basis of their
1RM/BM: stronger (1RM/BM 91.55) or weaker (1RM/BM G
1.55). Subjects in the stronger stratum were allocated into
the stronger group. Subjects in the weaker stratum were ran-
domized into one of two groups: weaker group or control
group. The stronger and weaker groups completed a total of
10 wk of ballistic power training, while the control group
maintained their normal level of activity throughout the
duration of the study. Training involved three sessions per
week in which subjects performed maximal-effort jump
squats with 0%–30% 1RM. Subjects completed a 2-d testing
battery before initiating training (baseline), after 5 wk of
training (midtest—stronger and weaker groups only), and
after the completion of 10 wk of training (posttest). Subjects
were adequately familiarized to all testing procedures before
actual assessment. Testing involved evaluation of jump and
sprint performance as well as measures of the force–velocity
relationship, jumping mechanics, muscle architecture, and
neural drive.
Subjects. Subjects were recruited on the basis of their
ability to perform a back squat with proficient technique. A
total of 35 men fulfilled all the testing and training re-
quirements of this investigation. Data from 11 of these men
were removed on the basis of their 1RM/BM to establish
two experimental groups with very distinct differences in
maximal strength (i.e., data from subjects with a 1RM/BM
between 1.55 and 1.85 were not included). The remaining
24 men were allocated into three groups: stronger group
(n= 8, 1RM/BM = 1.97 T0.08), weaker group (n=8,
1RM/BM = 1.32 T0.14), or control group (n= 8, 1RM/BM
= 1.37 T0.13). Subjects’ characteristics throughout the du-
ration of the study are outlined in Table 1. The participants
were notified about the potential risks involved and gave
their written informed consent. This study was approved by
the university’s human research ethics committee.
Training program. The training program consisted of
three sessions per week separated by at least 24 h of rest.
Each training session was initiated via a warm-up consisting
of two sets of six submaximal jump squats with 0% 1RM
(i.e., CMJ with no external load, just the resistance applied
by a carbon fiber pole (mass = 0.4 kg) held across the
shoulders). During sessions 1 and 3 of each week, subjects
performed seven sets of six maximal-effort jump squats
separated by a 3-min recovery. Jump squats were performed
at the load that maximized power output for each subject, as
determined during the baseline testing session. Similar to
previous research, a load consistent with the subject’s BM
(i.e., no external load or 0% 1RM) maximized power output
for each of the participants in this study (11,12). The second
training session of each week included an additional warm-
up set consisting of five submaximal jump squats with 30%
1RM. Subjects then performed five sets of five maximal-
effort jump squats with 30% 1RM separated by a 3-min
recovery. Subjects were encouraged to perform each jump
as rapidly as possible. Intensity was modified for each
session so that an audible beep could be heard by subjects
during jumps that reached 95% of the maximal power
output at that load from their previous training or testing
session. Previous literature has shown significant perfor-
mance improvements after jump squat training with similar
programming parameters at both 0% 1RM (11) and 30%
1RM (25,38). Subjects refrained from any additional lower
body resistance training, plyometrics, or sprint training
throughout the course of the study.
Testing protocol. Subjects rested for 3–5 d between
their previous training session and the midtest testing ses-
sion and for 7–10 d between the final training session and
the posttest testing session to allow full recovery. Subjects
completed two testing sessions separated by at least 3 d of
recovery at the baseline, midtest, and posttest occasions.
Testing session 1 was initiated with an examination of
the vastus lateralis (VL) muscle architecture through
TABLE 1. Subject characteristics of the stronger, weaker, and control groups throughout the 10 wk of training.
BM (kg) Body Fat (%) 1RM/BM 40-m Sprint (s) Jump Height (m)
Stronger group
Baseline 79.1 T12.8 12.2 T3.9‡1.97 T0.08†5.41 T0.25†0.43 T0.03‡
Midtest 79.8 T12.9 12.3 T3.8‡1.93 T0.11‡5.39 T0.20‡0.50 T0.03*
Posttest 79.6 T13.0 12.6 T3.5‡1.88 T0.11†5.29 T0.20†0.50 T0.03*
,
§
Weaker group
Baseline 79.9 T14.5 17.3 T3.8 1.32 T0.14 5.90 T0.27 0.38 T0.04
Midtest 79.2 T14.2 17.5 T4.0 1.38 T0.16 5.79 T0.20 0.42 T0.07
Posttest 79.1 T13.8 17.7 T3.6 1.39 T0.17 5.69 T0.22 0.44 T0.06
Control group
Baseline 77.5 T8.1 14.6 T3.5 1.37 T0.13 5.79 T0.19 0.41 T0.04
Posttest 78.4 T8.8 14.7 T3.8 1.35 T0.12 5.79 T0.12 0.40 T0.04
BM, body mass; 1RM:BM, squat one repetition maximum to body mass ratio.
* Significantly (Pe0.05) different from baseline.
†Significant (Pe0.05) difference between stronger group and all other groups.
‡Significant (Pe0.05) difference between stronger group and weaker group.
§ Significantly (Pe0.05) different from control group.
http://www.acsm-msse.org1568 Official Journal of the American College of Sports Medicine
APPLIED SCIENCES
Copyright © 2010 by the American College of Sports Medicine. Unauthorized reproduction of this article is prohibited.

ultrasonography. Maximal dynamic strength was then as-
sessed using a back squat 1RM to a depth consistent with a
knee angle of at least 90-of flexion assessed using two-
dimensional motion analysis. During a 30-min recovery,
body composition was assessed using dual-energy x-ray
absorptiometry. Maximal isometric strength was then eval-
uated using an isometric squat test performed at a knee angle
of 140-to allow for the determination of maximum force
output at zero velocity (12,32). Adequate recovery was
permitted (10 min) before examination of jump squat per-
formance across a series of intensities: 0% (i.e., no external
load or BM only), 20%, 40%, 60%, and 80% of squat 1RM.
Subjects completed the jump squats in a randomized order,
which was consistent across the three testing occasions for
each individual subject. Kinematic (both linear position
transducer (LPT) and two-dimensional motion analysis),
kinetic, and EMG data were obtained simultaneously through-
out the testing session. After at least 3 d of recovery, sub-
jects completed the second testing session involving a 40-m
sprint test.
Data acquisition and analysis procedures. The
back squat 1RM involved subjects completing a series of
warm-up sets (four to six repetitions at 30% estimated
1RM, three to four repetitions at 50% estimated 1RM, two
to three repetitions at 70% estimated 1RM, and one to two
repetitions at 90% estimated 1RM), each separated by 3 min
of recovery. A series of maximal lift attempts was then
performed until a 1RM was obtained. No more than five
attempts were permitted with each attempt separated by
5 min of recovery. This protocol has been frequently used
throughout the previous literature for the assessment of
maximal dynamic strength (11,12,30). Only trials in which
subjects reached a relative knee angle (i.e., angle between
the midline of the lower leg and the midline of the thigh)
G90-of flexion were considered successful. This depth was
visually monitored during testing and was confirmed by
two-dimensional motion analysis (stronger group: baseline
= 85.7-T4.2-, posttest = 82.5-T6.8-; weaker group:
baseline = 83.4-T2.4-, posttest = 80.4-T4.3-; control
group: baseline = 83.1-T6.2-, posttest = 82.6-T5.4-; rater
reliability: r= 0.95). Although no significant differences in
the depth of the squat 1RM existed among the testing occa-
sions, there is the potential that the slightly deeper depth
obtained during posttesting could have influenced the 1RM
values obtained.
The isometric squat test was performed with subjects
standing on a force plate (9290AD; Kistler Instruments,
Winterthur, Switzerland) in a back squat position pushing
against an immovable rigid bar. The bar was positioned so
that subjects had a knee angle of 140-of flexion to allow
for the determination of maximal force output at zero ve-
locity. Previous research has shown this knee angle to cor-
respond with the highest isometric force output for the squat
compared with a range of other knee angles (32). Subjects
were instructed to perform a rapid, maximal effort to reach
maximal force output as soon as possible and maintain that
force for 3 s. The analog signal from the force plate was
collected for every trial at 1000 Hz using a data acquisition
system including an analog-to-digital card (cDAQ-9172;
National Instruments, North Ryde, NSW, Australia). Cus-
tom programs designed using LabVIEW software (Version
8.2; National Instruments) were used for recording and an-
alyzing the data. The signal was filtered using a fourth-
order, low-pass Butterworth filter with a cutoff frequency
of 50 Hz. From laboratory calibrations, the voltage output
was converted into vertical ground reaction force. Peak
force relative to BM was assessed as the maximal force
output during the 3-s period divided by the individual’s
BM. The test–retest reliability for peak force relative to BM
was r= 0.98.
Performance of a jump squat involved subjects complet-
ing a maximal-effort CMJ while holding a rigid bar across
their shoulders. Subjects held a 0.4-kg carbon fiber pole for
the 0% 1RM jump squat, whereas for all other intensities,
subjects held a 20-kg barbell loaded with the appropriate
weight plates. Participants were instructed to keep constant
downward pressure on the bar throughout the jump and
were encouraged to move the resistance as fast as possible
to achieve maximal power output with each trial. The bar
was not allowed to leave the shoulders of the subject, with
the trial being repeated if this requirement was not met. A
minimum of two trials at each load were completed, with
additional trials performed if both peak power and jump
height were not within 5% of the previous jump squat.
Adequate rest was enforced between all trials (3 min).
All jump squats were performed while the subject was
standing on the force plate with a LPT (PT5A-150; Celesco
Transducer Products, Chatsworth, CA) attached to the bar.
The LPT was attached 10 cm to the left of the center of the
bar to avoid any interference caused by movement of the
head during the jump. The LPT was mounted above the sub-
ject, and the retraction tension of the LPT (equivalent to
8 N) was accounted for in all calculations. Analog signals
from the force plate and LPT were collected for every trial
at 1000 Hz and analyzed using custom programs designed
using LabVIEW software. The signal from the LPT was
filtered using a fourth-order, low-pass Butterworth digital
filter with a cutoff frequency of 10 Hz, and the voltage output
was converted into displacement using laboratory calibra-
tions. The vertical velocity of the movement was deter-
mined using a first-order derivative of the displacement data.
Power output was calculated as the product of the vertical
velocity and the vertical ground reaction force data. Ac-
celeration of the movement was calculated using a second-
order derivative of the displacement data and smoothed
using a fourth-order, low-pass Butterworth digital filter with a
cutoff frequency of 10 Hz. These data collection and analysis
methodology have been validated previously (9), and the test–
retest reliability for all jump variables examined was con-
sistently rQ0.90.
A series of performance variables was assessed during
the jump squats. Peak force, velocity, power, displacement,
INFLUENCE OF STRENGTH ON POWER Medicine & Science in Sports & Exercise
d
1569
APPLIED SCIENCES
Copyright © 2010 by the American College of Sports Medicine. Unauthorized reproduction of this article is prohibited.

and acceleration were determined as the respective maximal
values achieved during the entire movement. Net impulse
was assessed as the integral of vertical ground reaction
force during the period of application in which force ex-
ceeded that required during stationary standing (i.e., above
body weight). Rate of force development (RFD) was de-
termined between the minimum and maximum force that
occurred throughout the movement. Similarly, rate of power
development (RPD) was also determined between the min-
imum and maximum power that occurred throughout the
movement. Average power output was calculated during the
concentric phase of the movement (i.e., time between min-
imum displacement and takeoff). Instantaneous force and
velocity output at the time at which peak power occurred
was also examined and was termed force at peak power and
velocity at peak power, respectively. These values across
each of the loads examined were used to generate the force–
velocity and force–power relationships for the jump squat.
Velocity at takeoff was defined as the velocity of movement
at the time at which the force output was first zero (i.e.,
when the toes first left the force plate). Furthermore, time
to takeoff was determined as the time between the initiation
of the countermovement (i.e., start of the eccentric phase)
and the point that force was zero (i.e., end of the concentric
phase—takeoff ).
In addition to these instantaneous performance variables,
analyses of parameters throughout the jump movement were
conducted. The power–time and force–time curves from each
individual subject were selected from the beginning of the
eccentric phase (i.e., initiation of countermovement as-
sessed as the time at which a change in velocity first oc-
curred) through to the end of the concentric phase (i.e., at
takeoff when force and power reached zero). The velocity–
time and displacement–time curves were selected from the
beginning of the eccentric phase to peak displacement (i.e.,
zero velocity). Using a custom-designed LabVIEW program,
the number of samples in each individual curve was then
modified to equal 500 samples by changing the time delta
(dt) between samples and resampling the signal (dt = number
of samples in the original signal/500). The sampling fre-
quency of the normalized signals was calculated according to
the following equation:
normalized sampling
frequenzy ðHzÞ¼1 second
½
no:samples in original signal
no:samples in normalized signal
½
seconds
per sample
Consequently, the sampling frequency of the modified
signals was then equivalent to 815 T154 Hz for the power–
time and force–time curves and 538 T68 Hz for the velocity–
time and displacement–time curves. This resampling allowed
for each individual’s power, force, velocity, and displace-
ment curves to be expressed during equal periods of time
(i.e., the 500 samples represented the relative time—from
0% to 100%—taken to complete the jump). In other words,
the various data sets were normalized to total movement
time so that data could be pooled. Each sample of the nor-
malized power–, force–, velocity–, and displacement–time
curves was then averaged across subjects within the stronger,
weaker, or control groups, resulting in averaged curves with
high resolution (sampling frequency of 538–815 Hz). This
allowed for power, force, velocity, and displacement through-
out the jump to be compared across baseline, midtest, and
posttest as well as between groups. Intraclass test–retest
reliabilities for power–, force–, velocity–, and displacement–
time curves during the CMJ have consistently been rQ0.94,
rQ0.90, rQ0.89, and rQ0.92, respectively, using this
methodology (10).
Before assessment of sprint performance, subjects per-
formed a warm-up consisting of 5 min of light jogging and
three submaximal 20-m sprints. The sprint test was initiated
from a standing start involving a staggered stance with the
same front–back leg orientation used for every trial through-
out the baseline, midtest, and posttest. Subjects were in-
structed to commence the sprint at will and accelerate as
quickly as possible throughout the 40 m. Three trials were
performed with each separated by a 3-min recovery. A series
of six dual-beam timing gates (Speedlight; Swift Sports,
Lismore, NSW, Australia) was used to record instanta-
neous time at 5, 10, 20, 30, and 40 m (timing was com-
menced when subject passed through a dual-beam timing
gate positioned at their front foot). Flying 5 m was calculated
as the time between the 5- and 10-m gates, whereas flying
15 m was calculated at the time between the 5- and 20-m
gates. Intraclass test–retest reliability for all sprint perfor-
mance variables examined was consistently rQ0.90.
EMG of the VL, vastus medialis (VM), and biceps fe-
moris (BF) was collected on the dominant leg during the
isometric squat and all jump squats. Disposable surface
electrodes (self-adhesive Ag/AgCl snap electrode, 2-cm in-
terelectrode distance, 1-cm circular conductive area; prod-
uct 272; Noraxon USA, Inc., Scottsdale, AZ) were attached
to the skin over the belly of each measured muscle, distal to
the motor point, and parallel to the direction of muscle
fibers. A reference electrode was placed on the patella. The
exact location of the electrodes relative to the anatomical
landmarks was marked on a sheet of tracing paper after the
first testing session to ensure consistent placement in sub-
sequent tests. Each site was shaved, gently abraded, and
cleansed with alcohol before electrode placement to mini-
mize skin impedance. Raw EMG signals were collected at
1000 Hz and amplified (gain = 1000, bandwidth frequency
= 10–1000 Hz, input impedance G5k6; Model 12D-16-OS
Neurodata Amplifier System; Grass Technologies, West
Warwick, RI). The amplified myoelectric signal was col-
lected simultaneously with force plate and LPT data using a
data acquisition system including an analog-to-digital card.
Custom programs designed using LabVIEW software were
used for recording and analyzing the data. The signal was
full-wave–rectified and filtered using a dual-pass, sixth-
order, 10- to 250-Hz band-pass Butterworth filter as well as
a notch filter at 50 Hz. A linear envelope was created using
http://www.acsm-msse.org1570 Official Journal of the American College of Sports Medicine
APPLIED SCIENCES
Copyright © 2010 by the American College of Sports Medicine. Unauthorized reproduction of this article is prohibited.
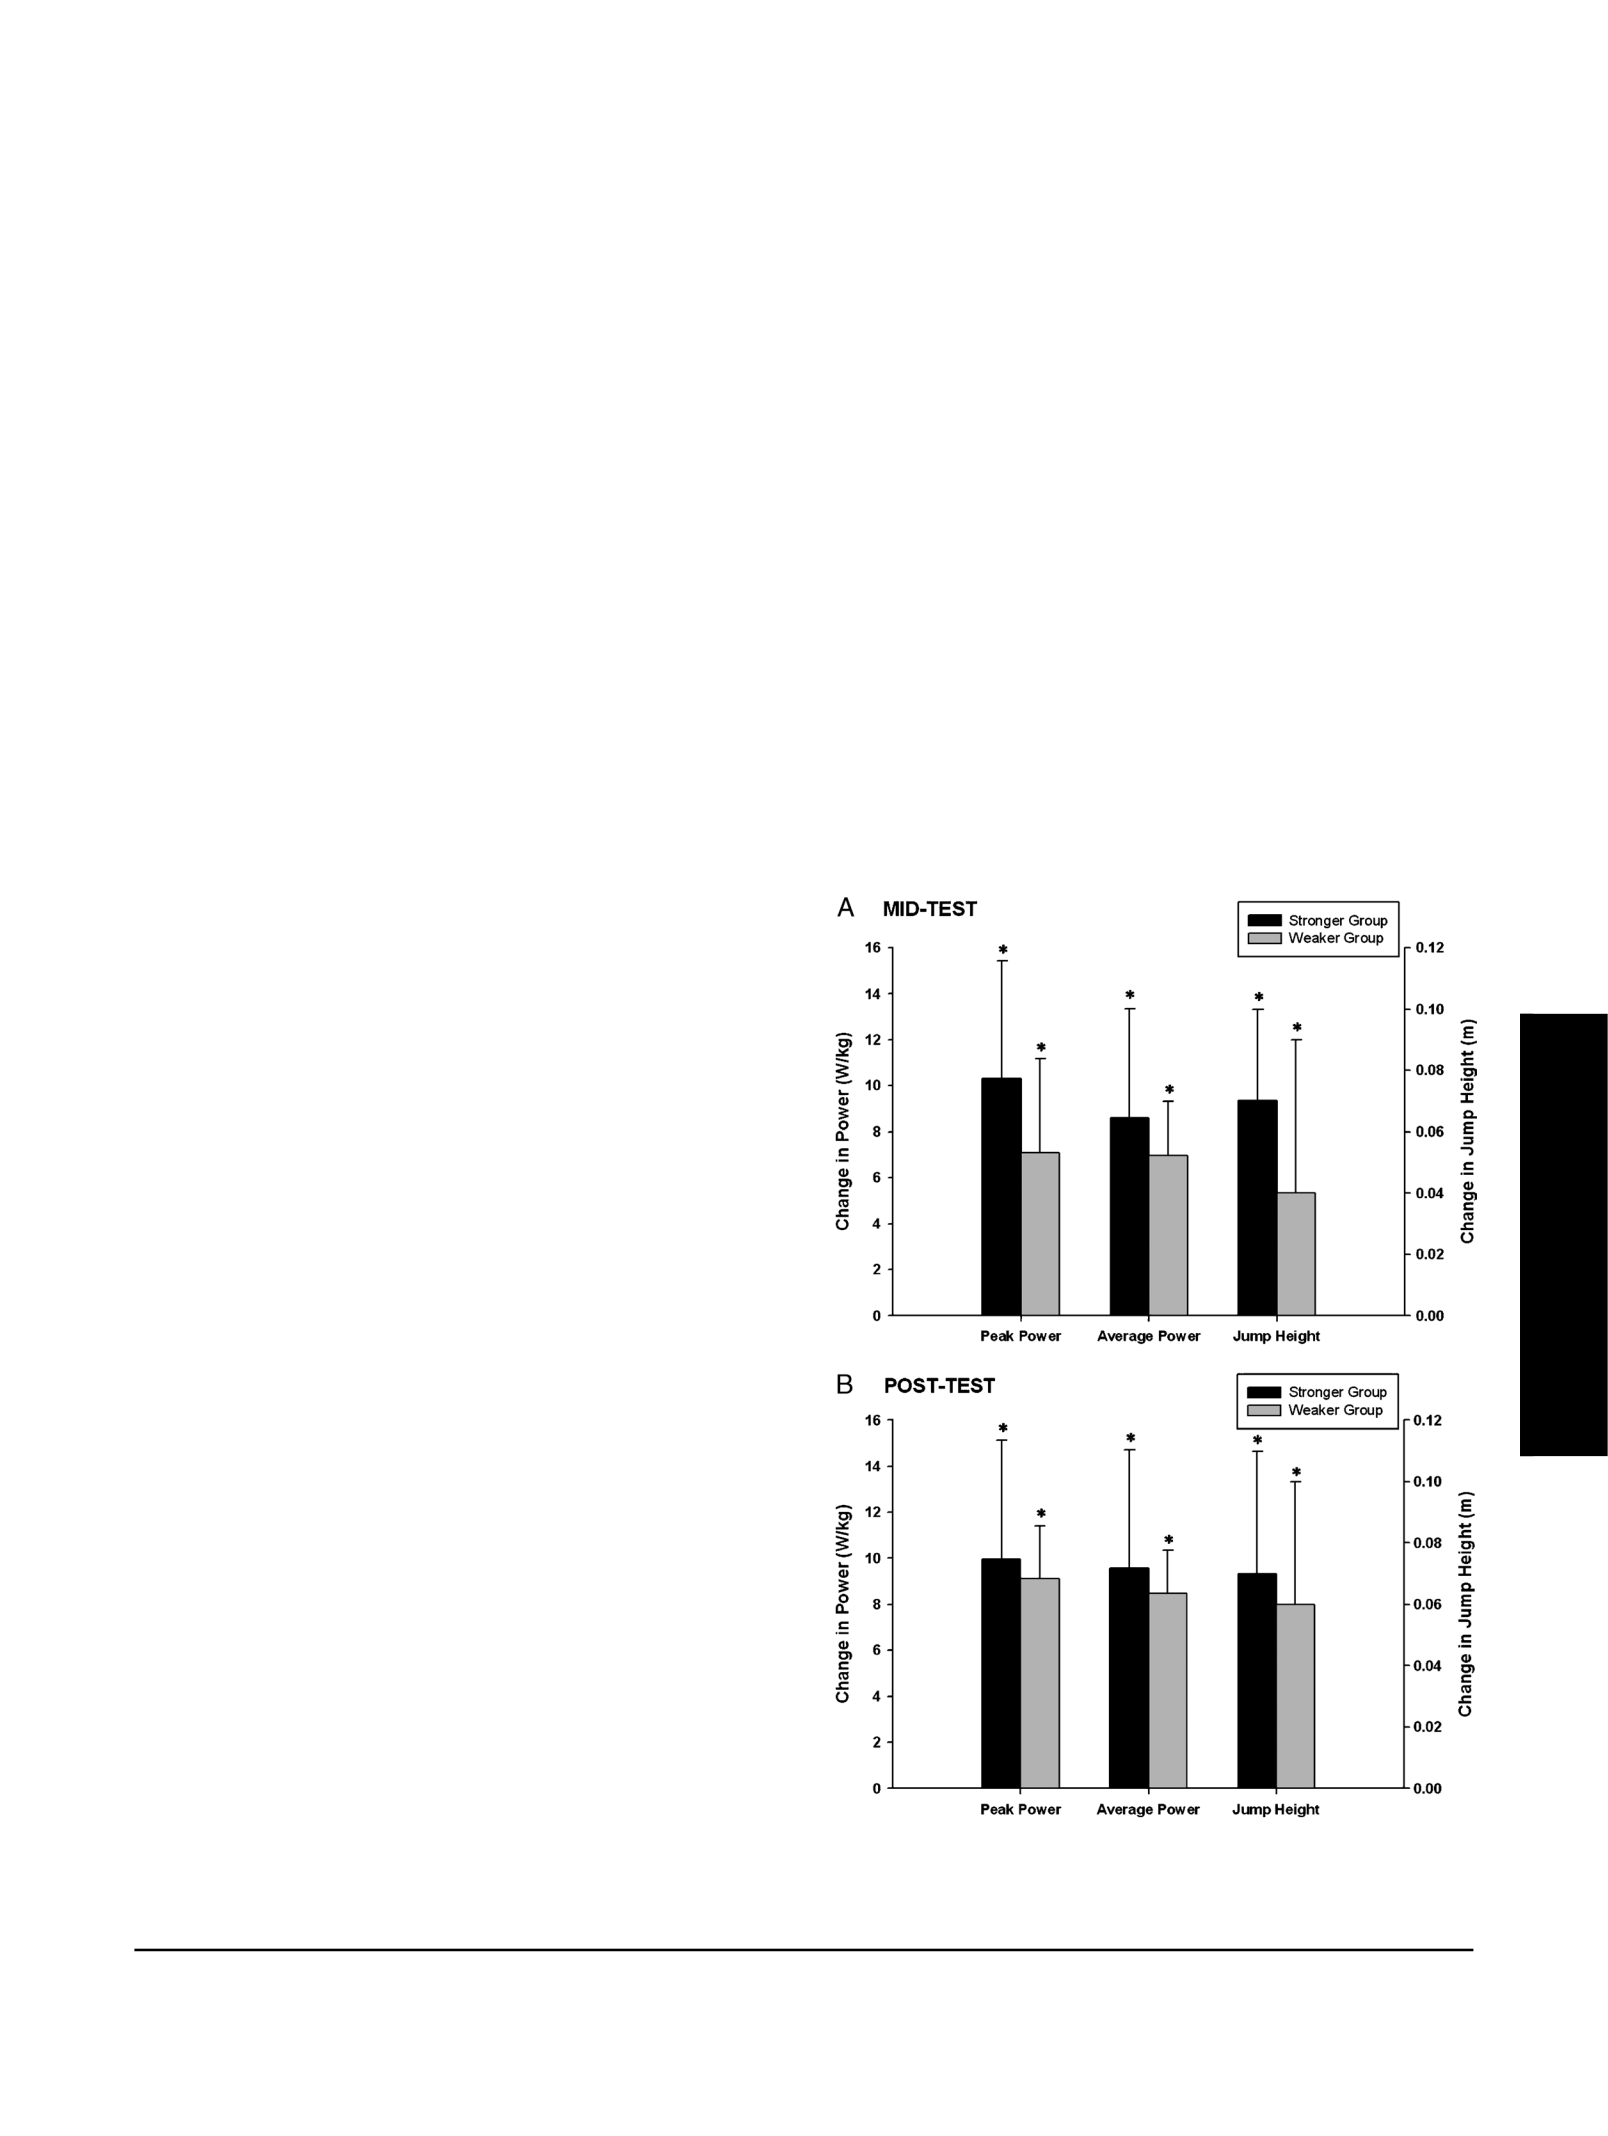
a low-pass, fourth-order Butterworth digital filter with a
cutoff frequency of 6 Hz. Maximal voluntary contraction
(MVC) for all muscles were determined by averaging the
integrated EMG signal during a 1-s period of sustained
maximal force output after the initial peak in the force curve
during the isometric squat (intraclass test–retest reliability
consistently rQ0.91). EMG activity during jumping was
analyzed by averaging the integrated EMG signal from the
beginning of the eccentric phase to takeoff. To standardize
for the time taken to complete a jump squat, this value was
then divided by the time to takeoff. The average integrated
EMG (AvgIEMG) was then normalized by expressing it
relative to the MVC. This is similar to methods previously
used when comparing EMG between movements with dif-
ferent time components (29). The rate of rise in AvgIEMG
(expressed as a percentage of MVC per second) was as-
sessed during the 0% 1RM jump squat as the rate of change
between minimum and maximum AvgIEMG throughout
the movement (i.e., from the initiation of the countermove-
ment to takeoff). Intraclass test–retest reliability for all EMG
variables examined was consistently rQ0.80.
In vivo muscle architecture was assessed by B-mode ultra-
sonography recorded using an ultrasound console (SSD-1000;
Aloka Incorporated, Tokyo, Japan) with a 7.5-MHz, 9-cm
linear probe. The same experienced examiner completed all
scans across the baseline, midtesting, and posttesting occa-
sions. Scans were performed on the VL of the dominant leg,
with subjects lying supine and their leg muscles completely
relaxed. To assist with acoustic coupling, water-soluble trans-
mission gel was applied to the transducer. Measurements
were taken at 50% of the thigh length calculated as half the
distance between the centers of the greater trochanter to the
lateral condyle of the femur. Longitudinal images were ob-
tained with the transducer oriented parallel to the muscle
fascicles and perpendicular to the skin. The impact of dis-
crepancies in transducer location and orientation on architec-
tural differences observed between baseline, midtest, and
posttest was minimized using several techniques. The location
and two-dimensional orientation of the transducer relative to
anatomical landmarks were mapped onto a sheet of tracing
paper to ensure that the same site was used across all testing
occasions. In addition, in an effort to minimize any differ-
ences in the three-dimensional orientation of the transducer
between testing occasions, the live, onscreen image during
midtest and posttest was compared with those taken during
baseline testing. This allowed the examiner to match the
unique features of the ultrasound images (i.e., heterogeneities
in the subcutaneous adipose tissue and echoes from inter-
spaces among the fascicles). These procedures have been used
previously in literature, monitoring the impact of training on
muscle architecture (3). Images were digitally recorded, and
the superficial and deep aponeuroses were identified, with
muscle thickness measured as the distance between the apo-
neuroses (3,20). Pennation angle was defined as the angle at
which the fascicles arose from the deep aponeurosis (20).
Intraclass test–retest reliabilities for muscle thickness and
pennation angle were r=0.95andr= 0.90, respectively. In
addition, rater reliabilities for muscle thickness and pennation
angle were r=0.98andr= 0.93, respectively.
Two-dimensional motion analysis was used to evaluate the
movement mechanics during the squat 1RM and jump squats.
A digital video camera (25 Hz; MV830i; Canon Australia
Pty Ltd., North Ryde, NSW, Australia) was positioned 3.1 m
from the subject, perpendicular to the subjects’ sagittal plane.
Dartfish software (Version 4.5 ProSuite; Dartfish, Sydney,
NSW, Australia) was used to analyze the movements. The
video footage was deinterlaced into fields, yielding a 50-Hz
sampling frequency. During the jump squats, the minimum
and maximum knee, hip, and ankle joint angles were assessed
at the transition between the eccentric and concentric phases
(minimum) and the last field before takeoff where the foot is
still in contact with the force plate (maximum). The minimum
knee, hip, and ankle angles were also assessed during the
squat 1RM, representing the joint angles at the transition
between the eccentric and concentric phases. Intraclass test–
retest reliability and rater reliability for all joint angles as-
sessed using motion analysis were consistently rQ0.92 and
rQ0.93, respectively.
FIGURE 1—Change from baseline in peak power, average power, and
maximum jump height during the 0% 1RM jump squat at midtest (A)
and posttest (B). *Significant (Pe0.05) change from baseline.
INFLUENCE OF STRENGTH ON POWER Medicine & Science in Sports & Exercise
d
1571
APPLIED SCIENCES
Copyright © 2010 by the American College of Sports Medicine. Unauthorized reproduction of this article is prohibited.

Statistical analyses. A general linear model with
repeated-measures ANOVA followed by Bonferroni post
hoc tests was used to examine the impact of training on
performance variables and to determine whether differences
existed between the groups at baseline, at midtest, and at
posttest. t-tests were used for comparisons between var-
iables at baseline and posttest for the control group as well
as for comparison of variables between stronger and weaker
groups at midtest. Statistical significance for all analyses
was defined by Pe0.05, and results were summarized as
means TSD. Estimated effect sizes (ES) of G
2
= 0.502 and
G
2
= 0.300 at observed power levels of 0.976 and 0.626 for
maximum peak power relative to BM after training existed
for stronger and weaker groups, respectively. In addition,
estimated ES of G
2
= 0.406 and G
2
= 0.319 at the observed
power levels of 0.821 and 0.644 existed for the compari-
son of maximum peak power relative to BM between the
stronger and weaker groups at baseline and posttest,
respectively. Mean ES were also calculated to examine
and compare the practical significance of the performance
improvements among the experimental groups. Based on the
study of Cohen (8), which suggests ES of 0.2, 0.5, and 0.8 to
represent small, moderate, and large effects, respectively,
practical relevance was defined as an ES Q0.8 for the
TABLE 2. Change in performance variables during the 0% 1RM jump squat (i.e., BM only) from baseline ($).
Stronger Group Weaker Group
0% 1RM Jump Squat $at Midtest $at Posttest $at Midtest $at Posttest
Power
Peak power (WIkg
j1
) 10.3 T5.1* 10.0 T5.2* 7.1 T4.1* 9.1 T2.3*
Average power (WIkg
j1
) 8.6 T4.8* 9.6 T5.2* 7.0 T2.3* 8.5 T1.9*
Rate of power development (WIkg
j1
Is
j1
) 343.0 T164.4*
,
‡325.2 T132.6* 169.3 T79.4* 236.7 T129.7*
Force
Peak force (NIkg
j1
) 6.3 T5.4* 6.3 T4.7* 3.5 T3.7 4.7 T4.2*
RFD (NIkg
j1
Is
j1
) 76.8 T46.1* 82.3 T58.3* 55.3 T28.8* 94.6 T74.9*
Force at peak power (NIkg
j1
) 2.8 T2.1* 2.1 T1.6* 1.5 T1.8 1.4 T1.9
Net impulse (NIs) 38.9 T22.6* 45.9 T28.9* 48.8 T26.5* 57.4 T20.9*
Velocity
Peak velocity (mIs
j1
) 0.43 T0.29* 0.42 T0.22* 0.34 T0.34* 0.55 T0.26*
Velocity at peak power (mIs
j1
) 0.19 T0.34 0.22 T0.31 0.15 T0.30 0.28 T0.27
Velocity at takeoff (mIs
j1
) 0.43 T0.29* 0.41 T0.24* 0.35 T0.36* 0.60 T0.30*
Acceleration
Peak acceleration (mIs
j1
Is
j1
) 11.7 T6.2*
,
‡14.6 T6.5*
,
‡6.4 T2.0* 8.6 T4.7*
Displacement
Peak displacement (m) 0.07 T0.03* 0.07 T0.04* 0.04 T0.05 0.06 T0.04*
Time
Time to takeoff (s) j0.18 T0.07* j0.19 T0.6* j0.27 T0.12* j0.31 T0.13*
,
‡
* Significant (Pe0.05) change from baseline.
‡Significant (Pe0.05) difference between stronger group and weaker group.
TABLE 3. Comparison of 40-m sprint times among stronger, weaker, and control groups throughout the 10 wk of training.
Sprint Times (s)
5 m 10 m 20 m 30 m 40 m Flying 5 m Flying 15 m
Stronger group
Baseline 1.10 T0.10 1.82 T0.12 3.08 T0.15‡4.25 T0.19†5.41 T0.25†0.72 T0.03†1.98 T0.07†
Midtest 1.08 T0.02‡1.82 T0.04‡3.07 T0.09‡4.23 T0.14‡5.39 T0.20‡0.74 T0.03 1.99 T0.08‡
Posttest 1.02 T0.08§ 1.75 T0.08§ 2.99 T0.11‡4.14 T0.15†5.29 T0.20†0.73 T0.01†1.97 T0.05†
$between baseline
and posttest
j0.08 T0.04*
,
§j0.07 T0.04* j0.09 T0.08*
,
§j0.11 T0.11*
,
§j0.12 T0.11* 0.01 T0.02 j0.01 T0.07
ES 0.86 0.67 0.69 0.65 0.54 0.64 0.18
Weaker group
Baseline 1.17 T0.12 1.95 T0.16 3.32 T0.19 4.60 T0.23 5.90 T0.27 0.78 T0.04 2.14 T0.08
Midtest 1.13 T0.05 1.90 T0.08 3.24 T0.11 4.51 T0.16 5.79 T0.20 0.77 T0.05 2.10 T0.09
Posttest 1.09 T0.05 1.86 T0.07 3.18 T0.12 4.44 T0.17 5.69 T0.22 0.77 T0.02 2.09 T0.08
$between baseline
and posttest
j0.08 T0.09 j0.09 T0.10 j0.13 T0.09*
,
§j0.16 T0.10*
,
§j0.22 T0.14*
,
§j0.01 T0.03 j0.06 T0.03*
,
§
ES 0.79 0.69 0.78 0.76 0.82 0.25 0.66
Control group
Baseline 1.13 T0.04 1.88 T0.07 3.25 T0.11 4.52 T0.14 5.79 T0.19 0.75 T0.03 2.12 T0.08
Posttest 1.15 T0.04 1.91 T0.05 3.27 T0.07 4.53 T0.09 5.79 T0.12 0.76 T0.02 2.12 T0.05
$between baseline
and posttest
0.02 T0.05 0.03 T0.06 0.02 T0.08 0.01 T0.08 0.00 T0.10 0.01 T0.02 0.00 T0.04
ES 0.41 0.46 0.24 0.10 0.01 0.40 0.07
Flying 5 m time is calculated as the time between 5 and 10 m.
Flying 15 m time is calculated as the time between 5 and 20 m.
The change in sprint times between baseline and posttests as well as ES of the change is also displayed.
* Significant (Pe0.05) change from baseline to posttest.
†Significant (Pe0.05) difference between stronger group and all other groups.
‡Significant (Pe0.05) difference between stronger group and weaker group.
§ Significantly (Pe0.05) different from control group.
http://www.acsm-msse.org1572 Official Journal of the American College of Sports Medicine
APPLIED SCIENCES
Copyright © 2010 by the American College of Sports Medicine. Unauthorized reproduction of this article is prohibited.

FIGURE 2—Training-induced changes to the force–velocity and force–power relationships for the jump squat. *Significantly (Pe0.05) different
peak power relative to BM from baseline. +Approaching significantly (Pe0.10) different peak power relative to BM from baseline. xSignificantly
(Pe0.05) different force relative to BM at peak power from baseline. #Significantly (Pe0.05) different velocity at peak power from baseline.
INFLUENCE OF STRENGTH ON POWER Medicine & Science in Sports & Exercise
d
1573
APPLIED SCIENCES
Copyright © 2010 by the American College of Sports Medicine. Unauthorized reproduction of this article is prohibited.

purpose of this study. A statistical software package (SPSS,
Version 13.0; SPSS, Inc., Chicago, IL) was used to perform
all statistical analyses.
RESULTS
Athletic performance. The stronger group had signif-
icantly greater 1RM/BM than both the weaker and control
groups at all testing occasions and displayed a practically
relevant decrease in 1RM/BM at posttest (ES = 0.93, equiv-
alent to a 7 T7-kg decrease in 1RM). Training resulted in
significant within-group changes in a multitude of jump per-
formance variables between baseline and midtest or be-
tween baseline and posttest sessions for both the stronger
and weaker groups (Fig. 1 and Table 2). However, only the
changes in RPD at midtest and time to takeoff at posttest
significantly differed between the groups (Table 2). Com-
parison of the magnitude of changes in average power, peak
power, and peak displacement between the stronger and
weaker groups is illustrated in Figure 1. Any practically
relevant differences between the groups were more pro-
nounced after 5 wk of training, and they diminished some-
what after 10 wk of training (Fig. 1). The stronger group
completed the 40-m sprint in significantly less time than
both the weaker and control groups across all testing occa-
sions (Table 3). Training resulted in a significant change in
time between baseline and posttest at 5-, 10-, 20-, 30-, and
40-m sprints for the stronger group and at 20-, 30-, and 40-m
sprints for the weaker group (Table 3). These changes
were significantly different from the change in time dis-
played by the control group (which did not significantly
alter sprint time).
Force–velocity relationship. Training-induced
changes to force–velocity and force–power relationships
during the jump squat are displayed in Figure 2. Significant
differences between baseline and posttest were evident for
FIGURE 3—Between-group differences in the force–velocity (A–C) and force–power relationships (D–F) for the jump squat throughout the 10 wk of
training. †Significant (Pe0.05) difference in force or power between stronger and all other groups. ‡Significant (Pe0.05) difference in force or
power between stronger and weaker groups. §Significantly (Pe0.05) different force or power from control group.
TABLE 4. Two-dimensional motion analysis variables assessed during the 0% 1RM jump squat.
Minimum Joint Angle Maximum Joint Angle
0% 1RM Jump Squat Knee Angle (-) Hip Angle (-) Ankle Angle (-) Knee Angle (-) Hip Angle (-) Ankle Angle (-)
Stronger group
Baseline 89.7 T8.5 86.3 T13.8 60.7 T4.4 170.0 T7.1 168.3 T4.9 133.4 T3.9
Midtest 94.8 T6.5 89.4 T10.8 61.8 T4.7 174.5 T5.0 171.9 T8.1 137.5 T5.9
Posttest 94.7 T5.6 91.5 T16.4 59.0 T5.4 176.8 T4.3 174.0 T7.1 140.0 T5.8
Weaker group
Baseline 85.9 T7.1 79.3 T8.8 60.1 T3.0 170.2 T6.4 168.1 T8.1 136.0 T8.2
Midtest 90.1 T9.5 84.8 T18.7 59.9 T3.0 174.8 T4.9 172.8 T7.1 137.4 T6.6
Posttest 89.3 T11.1 88.4 T20.4 57.7 T3.7 171.7 T6.3 172.7 T9.5 138.1 T5.2
Control group
Baseline 89.6 T6.4 78.6 T9.8 67.3 T6.3 174.3 T6.5 172.3 T4.9 141.4 T8.5
Posttest 86.0 T12.2 78.0 T6.9 66.3 T3.5 172.3 T9.3 170.9 T12.2 137.3 T7.0
http://www.acsm-msse.org1574 Official Journal of the American College of Sports Medicine
APPLIED SCIENCES
Copyright © 2010 by the American College of Sports Medicine. Unauthorized reproduction of this article is prohibited.

both stronger and weaker groups (Fig. 2). Between-group
comparisons of the force–velocity and force–power rela-
tionships during jump squats revealed several differences
(Fig. 3).
Jump mechanics. No significant differences existed
between the groups in either the minimum or the maximum
joint angles during the 0% 1RM jump squat at baseline,
midtest, or posttest (Table 4). Furthermore, training did not
FIGURE 4—Comparison of the power–time curve during the 0% 1RM jump squat among the stronger, weaker, and control groups at baseline (A),
midtest (B), and posttest (C). Normalized time represents the time from initiation of countermovement to takeoff in A,B, and C.‡Significant
(Pe0.05) difference between stronger and weaker groups. 6Significant (Pe0.05) difference between stronger and control groups. §Significant
(Pe0.05) difference between control and both stronger and weaker groups.
FIGURE 5—Training-induced changes to the power–time (A), force–time (B), velocity–time (C), and displacement–time (D) curves for the 0% 1RM
jump squat in the stronger group. Normalized time represents the time from initiation of countermovement to takeoff for power and force (Aand B)
and from initiation of countermovement to peak displacement for velocity and displacement (Cand D). *Significant (Pe0.05) difference between
baseline and both midtest and posttest. xSignificant (Pe0.05) difference between baseline and posttest.
INFLUENCE OF STRENGTH ON POWER Medicine & Science in Sports & Exercise
d
1575
APPLIED SCIENCES
Copyright © 2010 by the American College of Sports Medicine. Unauthorized reproduction of this article is prohibited.

result in any changes to the joint angles at either the tran-
sition between eccentric and concentric phases or the take-
off during the 0% 1RM jump squat (Table 4). Investigation
of the power–time curve throughout the jump revealed sig-
nificant differences between the groups (Fig. 4). At base-
line, significant differences in power between stronger and
weaker groups existed from 76.0% to 92.8% of normalized
time (Fig. 4A). Similar differences between the stronger
and weaker groups were maintained throughout midtest
(80.4%–91.0% normalized time; Fig. 4B) as well as posttest
(73.8%–90.2% normalized time; Fig. 4C). After training,
significant differences were evident between the control
group and both the stronger and weaker training groups
throughout the power–time curve at posttest (4.4%–23.4%,
40.8%–52.8%, and 69.4%–89.2% normalized time). In addi-
tion, differences existed between the control and stronger
groups from 53.0% to 60.8% normalized time (Fig. 4C).
Several significant training-induced changes were also ob-
served between baseline and both midtesting and posttesting
sessions (Figs. 5 and 6). For the stronger group, significant
differences between baseline and both midtest and posttest
existed during the following phases: (a) power: 6.6%–22.8%,
42.2%–55.6%, and 74.2%–91.2% of normalized time; (b)
force: 9.6%–28.4% and 48.8%–62.8% of normalized time;
(c) velocity: 39.6%–62.6% and 69.6%–86.8% of normal-
ized time; and (d) displacement: 57.4%–89.4% of normal-
ized time. Significant differences between baseline and
posttest also existed during the following phases: (a) power:
70.6%–74.0% of normalized time; (b) force: 28.6%–32.4%,
43.0%–48.6%, and 63.0%–87.0% of normalized time; (c)
velocity: 36.0%–39.4% of normalized time; and (d) dis-
placement: 46.2%–57.2% and 89.6%–100.0% of normalized
time (Fig. 5). For the weaker group, significant differences
between baseline and both midtest and posttest existed dur-
ing the following phases: (a) power: 3.6%–11.4%, 35.4%–
52.6%, and 64.8%–89.6% of normalized time; (b) force:
0.0%–23.2% and 38.0%–70.0% of normalized time; (c)
velocity: 9.4%–32.0%, 39.2%–68.0%, and 75.0%–91.8% of
normalized time; and (d) displacement: 58.0%–88.2% or
normalized time. Significant differences between baseline and
posttest also existed during the following phases: (a) power:
11.6%–18.2% of normalized time, (b) force: 70.2%–79.2%
FIGURE 6—Training-induced changes to the power–time (A), force–time (B), velocity–time (C), and displacement–time (D) curves for the 0% 1RM
jump squat in the weaker group. Normalized time represents the time from initiation of countermovement to takeoff for power and force (Aand B)
and from initiation of countermovement to peak displacement for velocity and displacement (Cand D). *Significant (Pe0.05) difference between
baseline and both midtest and posttest. xSignificant (Pe0.05) difference between baseline and posttest.
http://www.acsm-msse.org1576 Official Journal of the American College of Sports Medicine
APPLIED SCIENCES
Copyright © 2010 by the American College of Sports Medicine. Unauthorized reproduction of this article is prohibited.

of normalized time, and (c) displacement: 88.4%–92.4% of
normalized time (Fig. 6).
Neuromuscular characteristics. No between- or
within-group differences existed for muscle thickness, pen-
nation angle, or lean mass of the leg across each of the
testing occasions (Table 5). However, percent change in
pennation angle from baseline to posttest was significant
(9.9%, P= 0.05) for the weaker group and approaching sig-
nificance (6.5%, P= 0.07) for the stronger group. At base-
line, no between-group differences were evident in any of
the EMG variables assessed (Table 5). After training, no
significant between- or within-group differences existed in
AvgIEMG during the isometric squat (i.e., MVC) or the 0%
1RM jump squat. However, the stronger power training
group significantly increased the rate of rise in AvgIEMG
during the 0% 1RM jump squat at posttest in both VM and
VL (Table 5). Furthermore, the rate of rise in AvgIEMG of
the VM and VL in the stronger power training group was
significantly greater than that in the control group at post-
test. The weaker power training group also displayed a
significant increase in the rate of rise in AvgIEMG of the
VM during the 0% 1RM jump squat at both midtest and
posttest (Table 5). No within-group changes in any EMG
variables were observed for the control group throughout
the study.
DISCUSSION
This investigation revealed that the ability to adapt to
ballistic power training is quite similar for both strong and
weak individuals. Despite trends toward superior improve-
ments in maximal power production and athletic perfor-
mance in stronger individuals (supported by much greater
mean ES, especially after 5 wk of training), the magnitude of
improvements did not significantly differ between stronger
and weaker groups (Fig. 1 and Tables 2 and 3). Further-
more, the mechanisms driving these adaptations were sim-
ilar for both groups (Figs. 2–4 and Tables 4 and 5).
Athletic performance. The current results indicate
that the experimental training effectively improved athletic
performance in both stronger and weaker individuals. Jump
height and maximal power output during a CMJ were
significantly enhanced after both 5 and 10 wk of training
(Fig. 1 and Table 2). In addition, a range of jump perfor-
mance measures (i.e., net impulse, movement velocity,
RFD, and RPD) also showed significant improvement in
both experimental groups. These observations are similar to
previous research involving ballistic power training on ho-
mogeneous groups of subjects with relatively low (11,38) or
moderate strength levels (25,28). Comparisons of the mag-
nitude of these improvements in jump performance between
the experimental groups showed no statistically significant
differences (Fig. 1 and Table 2). However, ES analyses
revealed that practically relevant differences existed between
stronger and weaker individuals in the magnitude of im-
provements in jump performance after ballistic power train-
ing. Any practical differences between the groups were more
pronounced after 5 wk of training and diminished somewhat
after 10 wk of training. For example, after 5 wk of training,
the ES of improvements in CMJ peak power and jump
height were 1.60 and 1.59, respectively, for the stronger
group compared with 0.95 and 0.61 for the weaker group.
At the completion of 10 wk of training, ES were 1.55 and
1.46 for the stronger group and 1.03 and 0.95 for the weaker
group. Thus, despite the lack of statistically significant
differences between the experimental groups, ballistic power
training had a tendency to elicit a more pronounced effect on
the magnitude of improvements of the stronger group, and
TABLE 5. Neuromuscular factors assessed throughout the 10-wk training program.
Stronger Group Weaker Group Control Group
Baseline Midtest Posttest Baseline Midtest Posttest Baseline Posttest
Muscle architecture
Muscle thickness (cm) 3.29 T0.38 3.30 T0.38 3.26 T0.37 3.02 T0.45 3.07 T0.46 3.08 T0.48 3.06 T0.30 3.06 T0.29
Pennation angle (-) 19.80 T2.23 20.76 T2.15 21.03 T2.14 19.20 T1.92 20.15 T1.59 20.98 T1.71 20.44 T3.99 20.59 T4.17
Lean mass of the leg (kg) 11.35 T1.62 11.56 T1.69 11.50 T1.62 10.82 T1.54 10.76 T1.50 10.66 T1.55 11.28 T1.61 11.30 T1.49
Muscle activation
AvgIEMG IS (MVC)
VM (KV) 81.9 T32.8 64.4 T24.6 68.0 T30.5 69.0 T28.9 82.3 T44.7 81.7 T28.2 79.6 T17.1 78.5 T18.2
VL (KV) 69.5 T22.7 66.6 T12.8 58.8 T26.9 73.3 T39.0 72.6 T42.8 71.2 T28.3 71.3 T11.9 70.0 T23.1
BF (KV) 13.9 T5.9 14.2 T11.9 13.8 T6.7 18.6 T14.2 14.3 T9.4 14.8 T10.2 20.3 T11.1 20.9 T12.0
AvgIEMG 0% 1RM JS
VM (% MVCIs
j1
) 114.5 T24.2 145.2 T25.8 148.0 T45.3 108.8 T29.0 121.9 T52.3 115.3 T19.0 81.3 T13.6 84.6 T23.2
VL (% MVCIs
j1
) 115.2 T28.3 122.3 T20.0 135.0 T28.5 118.8 T46.8 130.1 T59.3 106.0 T25.7 107.1 T30.0 109.7 T28.5
BF (% MVCIs
j1
) 125.6 T21.8 195.5 T102.0 200.9 T112.5 100.8 T58.8 181.7 T73.8 174.4 T90.3 103.0 T53.2 104.9 T76.8
Rate of EMG rise 0% 1RM JS
VM (% MVCIs
j1
) 503.5 T148.9 903.7 T380.9 1057.3 T492.0*
,
§ 352.3 T174.4 725.1 T305.9* 672.5 T263.8* 373.0 T209.7 386.7 T227.4
VL (% MVCIs
j1
) 479.2 T210.2 634.1 T188.6 971.4 T338.6*
,
§ 389.6 T187.4 866.0 T672.0 654.1 T283.0 403.6 T209.5 392.9 T146.8
BF (% MVCIs
j1
) 922.6 T413.9 1893.5 T1170.1 1759.3 T941.1 714.5 T551.9 1180.0 T619.0 1359.0 T984.6 449.7 T189.1 477.2 T250.8
AvgIEMG, average integrated EMG; IS, isometric squat; JS, jump squat.
Average integrated EMG (AvgIEMG) was assessed during an isometric squat MVC and during the 0% 1RM jump squat. Rate of rise in AvgIEMG was also assessed during the 0% 1RM
jump squat. Muscle thickness and pennation angle were assessed through ultrasound images. Lean mass of the leg represents the average lean muscle mass of right and left legs as
assessed through dual-energy x-ray absorptiometry scans.
* Significant (Pe0.05) change from baseline.
§ Significantly (Pe0.05) different from control group.
INFLUENCE OF STRENGTH ON POWER Medicine & Science in Sports & Exercise
d
1577
APPLIED SCIENCES
Copyright © 2010 by the American College of Sports Medicine. Unauthorized reproduction of this article is prohibited.

this could hold great practical relevance. Furthermore, these
results suggest that stronger subjects also display a tendency
toward more rapid improvements in performance after bal-
listic power training than weaker individuals, which is also
of considerable practical importance.
Ballistic power training also resulted in enhanced sprint
performance for both stronger and weaker groups (Table 3).
The change in time between baseline and posttest was sig-
nificant for both groups at 20, 30, and 40 m during a 40-m
sprint. In addition, the stronger group also displayed a sig-
nificant reduction in time at the 5- and 10-m marks. The
improvements in sprint performance for both groups were
of a practically relevant magnitude, representing a 7.3% and
2.2% improvement in 5- and 40-m time (ES = 0.86 and
0.54) in the stronger group and a 6.8% and 3.7% im-
provement in 5- and 40-m time (ES = 0.79 and 0.82) in the
weaker group. Although the additional significant improve-
ments of the stronger group (i.e., at 5 and 10 m) may in-
dicate a greater adaptability to the training stimulus, there
were no significant differences in the magnitude of per-
formance enhancements between the stronger and weaker
groups. Furthermore, the mean ES of the improvements in
sprint performance were quite similar between the experi-
mental groups (Table 3). Previous research has reported
improvements in sprint performance approaching signifi-
cance after ballistic power training (38), but such trends
have not been consistently observed (25,37). Thus, the cur-
rent findings are of great importance because this study
provides the strongest evidence to date that sprint perfor-
mance can be improved by ballistic power training in the
form of vertical jumping. The successful transfer of jump
squat training to sprint performance in the current study is
theorized to be associated with the efficacy of the program
design (i.e., highly sports-specific movements, frequency of
training, effective load, repetition, set, and interset recovery
parameters).
The ability of the current study to elucidate whether the
magnitude of performance improvements after ballistic
power training is influenced by strength level was limited
by several factors. First, the principle of diminished returns
dictates that initial improvements in muscular function are
easily invoked and further improvements are progressively
harder to achieve (37). Thus, the training programs of in-
dividuals with significantly greater strength levels (and more
experienced training backgrounds) typically need to contain
added variability, compared with weaker, inexperienced in-
dividuals (27,37). However, the nature of the research ques-
tions addressed by this study meant that the stronger and
weaker groups completed the same training program during
a period of 10 wk. Although the training program was de-
signed to contain a great deal of specificity to common athletic
movements, the experimental training lacked the level of
variability required to maximize improvements in experienced
athletes. Consequently, the ability of this intervention to
maximize the adaptations of the stronger group may have been
affected. Second, the current observations may have been
confounded by the stronger groups’ cessation of strength
training for the duration of the study (i.e., total of 15 wk). To
examine the specific mechanisms driving adaptation to the
ballistic power training intervention, all subjects were in-
structed to refrain from any lower body resistance training
(or sprint training) outside the scope of the current study.
Although this posed no impact on the strength level of the
weaker group (i.e., not involved in any such training before
commencing the experiment), the stronger group displayed a
statistically nonsignificant but practically relevant decrease
in maximal strength (4.6% decrease in 1RM/BM; ES = 0.91).
The neuromuscular changes associated with detraining peri-
ods of a similar time course (i.e., decreased neural drive and
CSA [15]) are theorized to negatively impact the ability of
the stronger group to adapt to the experimental training.
Thus, the cessation of strength training is theorized to have
negatively affected the ability of the stronger group to adapt
to the ballistic power training. It is imperative, therefore, that
future research is conducted that incorporates strength
maintenance sessions during the training intervention to elu-
cidate further the influence of strength on the magnitude
of improvements in athletic performance. Cognizant of
these limitations, the fact that the stronger group showed
similar performance improvements as the weaker group to
the ballistic power training intervention is of great practical
importance.
Mechanisms responsible for improved performance.
Monitoring the training-induced changes to the force–velocity
and force–power relationships during a sports-specific move-
ment such as the jump squat offers some indication of the
mechanisms driving adaptations in the stronger and weaker
groups. The ability of such an applied in vivo measure of
the force–velocity relationship to delineate exact changes to
muscle mechanics after training is complicated by a range of
factors including mixed fiber composition, muscle architec-
tural characteristics, anatomical joint configuration, levels of
neural activation, as well as the complex nature of the jump
squat movement (23). Despite these limitations, examina-
tion of the force–velocity relationship in sports-specific
movements quantifies the ability of the intact neuromus-
cular system to function under various loading conditions, in-
formation essential to understanding muscular function
during dynamic athletic movements. Data from this investi-
gation revealed that strength level did somewhat influence
the training-induced changes to the jump squat force–velocity
and force–power relationships (Figs. 2 and 3). Specifically,
the stronger group showed a more velocity-specific response
to the training stimulus, displaying the greatest improvements
under the lightest loading conditions (i.e., high-velocity, low-
force portion of the force–velocity relationship). In contrast,
ballistic power training with 0%–30% 1RM resulted in im-
provements in velocity and power throughout a range of
loading conditions for the weaker subjects (i.e., similar im-
provements at both high-velocity and high-force portions of
the force–velocity relationship). These changes caused the
slope of the force–velocity relationship to increase in the
http://www.acsm-msse.org1578 Official Journal of the American College of Sports Medicine
APPLIED SCIENCES
Copyright © 2010 by the American College of Sports Medicine. Unauthorized reproduction of this article is prohibited.

stronger group (aided by a slight decrease in F
max
) but not in
the weaker group. Thus, the current data support the theory
of velocity specificity (13,19) and the notion that relatively
weak or inexperienced subjects display relatively nonspecific
adaptations to training when compared with stronger, more
experienced athletes. Although the stronger group seemed
to display a more velocity-specific response, these apparent
dissimilarities did not translate into major changes in the sig-
nificant between-group differences that were evident before
training (Fig. 3). However, a significant between-group
difference in force at peak power during the lightest load
examined (i.e., 0% 1RM) that did not exist at baseline was
observed at midtest and at posttest. In addition, between-
group differences in power at 20% and 40% 1RM loads that
existed before training were no longer present at posttest.
These training-induced changes to the significant differ-
ences between stronger and weaker groups also indicate that
stronger individuals displayed adaptations with greater
velocity specificity.
Another potential mechanism driving the observed im-
provements in athletic performance was changes to move-
ment mechanics during jumping. Although no significant
changes were observed in the minimum and maximum hip,
knee, and ankle angles during the 0% 1RM jump squat
(Table 4), significant training-induced changes in displace-
ment, velocity, force, and power were evident throughout
the 0% 1RM jump squat for both groups (Figs. 4–6). These
changes are theorized to have led to an optimization of
stretch-shorten cycle (SSC) function, which contributed to
the enhanced jump performance. Arguably, the primary
mechanism driving the enhancement of performance during
SSC movements is the attainment of a greater level of force
at the beginning of the concentric phase in comparison to
concentric-only movements (5). Both stronger and weaker
groups displayed significant increases in force during the
eccentric phase and early in the concentric phase of the 0%
1RM jump squat after training (Figs. 5 and 6). This increase
was generated by the improved acceleration of the BM
during the eccentric phase and, similar to comparisons be-
tween SSC and concentric-only movements, resulted in
greater net impulse, velocity of movement, power output,
and, ultimately, enhanced jump height after training. The
observed changes are hypothesized to be due to the slight
modifications in jumping mechanics (i.e., a marginally
shorter but faster countermovement) and a significant de-
crease in time to takeoff (Tables 3 and 4). Very little pre-
vious research exists examining the impact of training on
performance variables throughout the entire movement
however, similar results have been observed after an
analogous ballistic power training intervention involving
relatively untrained men (10). Comparisons between the
stronger and the weaker groups revealed no new significant
between-group differences after training in joint angles of
the hip, knee, and ankle (Table 4) or power output
throughout the 0% 1RM jump squat (Fig. 4). Thus, changes
to jump mechanics common to both stronger and weaker
individuals after ballistic power training involving jump
squats are theorized to have contributed to improvements in
jump performance.
This investigation revealed that stronger and weaker
subjects displayed similar adaptations in muscle architecture
after ballistic power training (Table 5). As expected, the
training intervention did not elicit any significant changes to
muscle thickness (indicative of whole-muscle CSA [21]) or
the lean mass of the leg for either experimental group. The
relatively light loads used during ballistic power training
(i.e., 0%–30% 1RM) were too small to elicit the necessary
mechanical stimulus required to initiate a significant hyper-
trophic response (16,17). In addition, ballistic power train-
ing did not elicit any significant differences in the pennation
angle of either the stronger or the weaker group. Changes in
pennation angle have been reported previously, with
increases observed after heavy resistance training (4,21),
although not consistently (3), and decreases in response to
sprint training (4). These changes are believed to have a
positive impact on the force- and velocity-generating ca-
pacity of muscle, respectively. However, the potential im-
pact of ballistic power training on changes to pennation
angle has not been examined previously. On the basis of
the current data, ballistic power training did not prompt
structural changes to the muscle (i.e., muscle thickness or
pennation angle). Furthermore, the initial strength level of
the subject did not impact the type of adaptations in muscle
architecture. Muscular adaptations at an intracellular level
(i.e., alterations to anaerobic and aerobic enzymes, muscle
substrates, and/or protein expression) and/or connective tis-
sue remodeling may have contributed to the observed per-
formance improvements (14). However, the potential for
such adaptations cannot be established or rejected because
these mechanisms were not assessed in the current study.
Neural adaptations in response to ballistic power train-
ing were observed, with significant changes evident in the
neural activation patterns of subjects regardless of their ini-
tial strength level. Changes in EMG (indicative of alter-
ations in motor unit recruitment, firing frequency, and/or
synchronization) have been previously reported with im-
provements in performance after ballistic power training
(16,25,36). However, this is one of the first experiments to
show training-induced changes in EMG during complex,
multijoint, sports-specific movements. The current data in-
dicate that ballistic power training resulted in significant
increases in the rate of EMG rise during dynamic athletic
performance (i.e., 0% 1RM jump squat) in both stronger
and weaker groups. Thus, it is theorized that the ballistic
power training enhanced intermuscular coordination by op-
timizing the magnitude and timing of muscle activation.
Similarly, Ha¨kkinen et al. (16) observed ballistic power
training (jump squats with 0%–60% 1RM) to result in a
38% increase in the rate of EMG rise during an isometric
knee extension, which was reported to contribute to im-
proved performance (a 24% improvement in isometric
RFD). Although the current study cannot delineate whether
INFLUENCE OF STRENGTH ON POWER Medicine & Science in Sports & Exercise
d
1579
APPLIED SCIENCES
Copyright © 2010 by the American College of Sports Medicine. Unauthorized reproduction of this article is prohibited.

the observed changes in EMG were brought about through
alterations in motor unit recruitment, firing frequency, and/or
synchronization, previous research involving intramus-
cular EMG may offer some insight. During ballistic con-
tractions, motor units have been reported to begin firing at
very high frequencies (even in excess of those required to
achieve maximal force) followed by a rapid decline (40).
The high initial firing frequency is believed to result in in-
creased RFD, even if only maintained for a very short
period (26). van Cutsem et al. (36) reported the peak firing
frequency at the onset of ballistic contraction to increase
after ballistic power training. Furthermore, these higher
firing frequencies were maintained for longer throughout
the contraction after training. In addition, a training-induced
increase in the percentage of doublet discharges (i.e., a
motor unit firing two consecutive discharges in a e5-ms
interval) at the onset of a ballistic contraction was also
reported (5.2% of motor units displayed doublet discharges
before training, and this increased to 37.2% after 12 wk of
ballistic power training). These training-induced changes
were reported to contribute to an 82.3% increase in the RFD
and a 15.9% improvement in time to peak force during bal-
listic contractions (36). Therefore, the ballistic power train-
ing intervention of the current study may have induced
adaptations to the pattern of motor unit firing frequency that
subsequently enhanced RFD capabilities and contributed to
enhanced athletic performance. It is important to note that
these mechanisms of adaptation as well as the performance
improvements observed are specific to the movement pattern
and loading parameters used in the current study as power
produced by muscle varies according to both the nature of
the movement and the loading parameters used (12).
In conclusion, the ballistic power training program used
was very effective at enhancing athletic performance, with
both groups showing significant improvements in maximal
power, jump height, movement velocity, and sprint perfor-
mance. The magnitude of improvements in athletic perfor-
mance after ballistic power training did not significantly
differ between strong and weak subjects. However, ES anal-
yses revealed that the training had a tendency toward pro-
ducing a more pronounced effect on jump performance in
the stronger group (especially after only 5 wk of training)
that is believed to hold great practical relevance. Further-
more, this conclusion is strengthened by the confounding
influences of the principle of diminished returns as well as
the stronger groups’ cessation of strength training. Therefore,
because stronger individuals display superior performance
before ballistic power training and have a tendency for
greater improvements after such training, it would be ad-
vantageous for individuals to establish a solid foundation of
strength before focusing on ballistic power training. The
mechanisms driving the performance improvements were
very similar for both the stronger and the weaker groups.
Ballistic power training involving sports-specific movements
increased the rate of EMG rise during jumping, which,
coupled with slight technique modifications believed to be
specific to this training stimulus, led to an improvement in
SSC function. As a result, subjects were able to achieve
greater force and more optimally timed force application
resulting in higher acceleration and movement velocity in
shorter periods. Thus, athletic performance was improved
through enhanced magnitude and RFD, translating to higher
velocity and power production capabilities. Not only do
these findings provide a deeper understanding of the mech-
anistic factors driving improvements in performance after
ballistic power training but they also reveal that the neuro-
muscular and biomechanical adaptations to such training
are not influenced by strength level. These findings have
several implications for the design of ballistic power training
programs that effectively improve athletic performance. The
use of ballistic jump squats with very light loads (i.e., 0%–
30% 1RM) is sufficient to induce significant improvements
in jump and sprint performance of both strong and weak
athletes. However, ballistic power training programs of
stronger athletes need to contain considerably more variabil-
ity than programs of weaker athletes for continued perfor-
mance improvements beyond 5 wk of training. Finally, the
incorporation of strength maintenance sessions throughout
a power training phase is vital because decrements in max-
imal strength (and the ensuing neuromuscular alterations [15])
are theorized to negatively affect the ability of stronger ath-
letes to adapt to ballistic power training.
Funding from the National Strength and Conditioning Association
was received for this work.
Results of the present study do not constitute endorsement by
the American College of Sports Medicine.
REFERENCES
1. Baker D, Nance S. The relation between strength and power in
professional rugby league players. J Strength Cond Res. 1999;
13(3):224–9.
2. Baker DG, Newton RU. Comparison of lower body strength,
power, acceleration, speed, agility, and sprint momentum to de-
scribe and compare playing rank among professional rugby league
players. J Strength Cond Res. 2008;22(1):153–8.
3. Blazevich AJ, Cannavan D, Coleman DR, Horne S. Influence of
concentric and eccentric resistance training on architectural adap-
tation in human quadriceps muscles. J Appl Physiol. 2007;103(5):
1565–75.
4. Blazevich AJ, Gill ND, Bronks R, Newton RU. Training-specific
muscle architecture adaptation after 5-wk training in athletes. Med
Sci Sports Exerc. 2003;35(12):2013–22.
5. Bobbert MF, Gerritsen KG, Litjens MC, Van Soest AJ. Why is
countermovement jump height greater than squat jump height?
Med Sci Sports Exerc. 1996;28(11):1402–12.
6. Bobbert MF, Van Soest AJ. Effects of muscle strengthening on
vertical jump height: a simulation study. Med Sci Sports Exerc.
1994;26(8):1012–20.
7. Bourque PJ. Determinant of load at peak power during maximal
effort squat jumps in endurance and power trained athletes
http://www.acsm-msse.org1580 Official Journal of the American College of Sports Medicine
APPLIED SCIENCES
Copyright © 2010 by the American College of Sports Medicine. Unauthorized reproduction of this article is prohibited.

[dissertation]. Fredericton (Canada): University of New Brunswick;
2003. p. 44–60.
8. Cohen J. The concepts of power analysis. In: Cohen J, editor.
Statistical Power Analysis for the Behavioral Sciences. Hillsdale
(NJ): Lawrence Erlbaum Associates; 1988. p. 1–18.
9. Cormie P, McBride JM, McCaulley GO. Validation of power
measurement techniques in dynamic lower body resistance exer-
cises. J Appl Biomech. 2007;23(2):103–18.
10. Cormie P, McBride JM, McCaulley GO. Power–time, force–time,
and velocity–time curve analysis of the countermovement jump:
impact of training. J Strength Cond Res. 2009;23(1):177–86.
11. Cormie P, McCaulley GO, McBride JM. Power versus strength–
power jump squat training: influence on the load–power relation-
ship. Med Sci Sports Exerc. 2007;39(6):996–1003.
12. Cormie P, McCaulley GO, Triplett NT, McBride JM. Optimal
loading for maximal power output during lower-body resistance
exercises. Med Sci Sports Exerc. 2007;39(2):340–9.
13. Coyle EF, Feiring DC, Rotkis TC, et al. Specificity of power im-
provements through slow and fast isokinetic training. J Appl
Physiol. 1981;51(6):1437–42.
14. Folland JP, Williams AG. The adaptations to strength training:
morphological and neurological contributions to increased strength.
Sports Med. 2007;37(2):145–68.
15. Ha¨kkinen K, Alen M, Komi PV. Changes in isometric force- and
relaxation-time, electromyographic and muscle fibre characteristics
of human skeletal muscle during strength training and detraining.
Acta Physiol Scand. 1985;125(4):573–85.
16. Ha¨kkinen K, Komi PV, Alen M. Effect of explosive type strength
training on isometric force- and relaxation-time, electromyographic
and muscle fibre characteristics of leg extensor muscles. Acta
Physiol Scand. 1985;125(4):587–600.
17. Ha¨kkinen K, Komi PV, Alen M, Kauhanen H. EMG, muscle fibre
and force production characteristics during a 1 year training period
in elite weight-lifters. Eur J Appl Physiol. 1987;56:419–27.
18. Ha¨kkinen K, Komi PV, Tesch PA. Effect of combined concentric
and eccentric strength training and detraining on force-tme, mus-
cle fibre and metabolic characteristics of leg extensor muscles.
Scand J Sports Sci. 1981;3:50–8.
19. Kaneko M, Fuchimoto T, Toji H, Suei K. Training effect of dif-
ferent loads on the force–velocity relationship and mechanical power
output in human muscle. Scand J Med Sci Sports. 1983;5(2):50–5.
20. Kawakami Y, Abe T, Kanehisa H, Fukunaga T. Human skeletal
muscle size and architecture: variability and interdependence.
Am J Hum Biol. 2006;18(6):845–8.
21. Kawakami Y, Abe T, Kuno SY, Fukunaga T. Training-induced
changes in muscle architecture and specific tension. Eur J Appl
Physiol. 1995;72:566–73.
22. MacDougall JD, Elder GCB, Sale DG, Moroz JR, Sutton JR.
Effects of strength training and immobilization on human muscle
fibers. Eur J Appl Physiol. 1980;43:25–34.
23. MacIntosh BR, Holash RJ. Power output and force-velocity
properties of muscle. In: Nigg BM, MacIntosh BR, Mester J,
editors. Biomechanics and Biology of Movement. Champaign (IL):
Human Kinetics; 2000. p. 193–210.
24. McBride JM, Triplett-McBride NT, Davie A, Newton RU. A
comparison of strength and power characteristics between power
lifters, Olympic lifters, and sprinters. J Strength Cond Res. 1999;
13(1):58–66.
25. McBride JM, Triplett-McBride T, Davie A, Newton RU. The
effect of heavy- vs. light-load jump squats on the development of
strength, power, and speed. JStrengthCondRes. 2002;16(1):75–82.
26. Miller RG, Mirka A, Maxfield M. Rate of tension development
in isometric contractions of a human hand muscle. Exp Neurol.
1981;72:267–85.
27. Newton RU, Kraemer WJ. Developing explosive muscular power:
implications for a mixed method training strategy. Strength Cond
J. 1994;16(5):20–31.
28. Newton RU, Kraemer WJ, Hakkinen K. Effects of ballistic
training on preseason preparation of elite volleyball players. Med
Sci Sports Exerc. 1999;31(2):323–30.
29. Newton RU, Kraemer WJ, Hakkinen K, Humphries B, Murphy
AJ. Kinematics, kinetics, and muscle activation during explosive
upper body movements. J Appl Biomech. 1996;12:31–43.
30. Nuzzo JL, McBride JM, Cormie P, McCaulley GO. Relationship
between countermovement jump performance and multijoint iso-
metric and dynamic tests of strength. J Strength Cond Res. 2008;
22(3):699–707.
31. Pandy MG. An analytical framework for quantifying muscular
action during human movement. In: Winters JM, Woo SLY,
editors. Multiple Muscle Systems Biomechanics and Movement
Organisation. New York (NY): Springer Verlag; 1990. p. 653–62.
32. Paulus DC, Reiser RF, Troxell WO. Pneumatic strength assessment
device: design and isometric measurement. Biomed Sci Instrum.
2004;40:277–82.
33. Sale DG. Neural adaptations to strength training. In: Komi PV,
editor. Strength and Power in Sport. Oxford (UK): Blackwell
Science; 2003. p. 281–313.
34. Stone MH, O’Bryant HS, McCoy L, Coglianese R, Lehmkuhl M,
Schilling B. Power and maximum strength relationships during
performance of dynamic and static weighted jumps. J Strength
Cond Res. 2003;17(1):140–7.
35. Ugrinowitsch C, Tricoli V, Rodacki AL, Batista M, Ricard MD.
Influence of training background on jumping height. J Strength
Cond Res. 2007;21(3):848–52.
36. van Cutsem M, Duchateau J, Hainaut K. Changes in single motor
unit behaviour contribute to the increase in contraction speed
after dynamic training in humans. J Physiol. 1998;513(pt 1):
295–305.
37. Wilson G, Murphy AJ, Walshe AD. Performance benefits from
weight and plyometric training: effects of initial strength level.
Coach Sport Sci J. 1997;2(1):3–8.
38. Wilson GJ, Newton RU, Murphy AJ, Humphries BJ. The optimal
training load for the development of dynamic athletic perfor-
mance. Med Sci Sports Exerc. 1993;25(11):1279–86.
39. Zatsiorsky VM. Science and Practice of Strength Training.
Champaign (IL): Human Kinetics; 1995. p. 47–65.
40. Zehr EP, Sale DG. Ballistic movement: motor control and muscle
activation. Can J Appl Physiol. 1994;19:363–78.
INFLUENCE OF STRENGTH ON POWER Medicine & Science in Sports & Exercise
d
1581
APPLIED SCIENCES
Copyright © 2010 by the American College of Sports Medicine. Unauthorized reproduction of this article is prohibited.

See discussions, stats, and author profiles for this publication at: https://www.researchgate.net/publication/236859692
Research involving Human Subjects - Ethical Perspective
Article · September 2013
DOI: 10.3329/bioethics.v4i2.16375
CITATIONS
2
READS
3,504
6 authors, including:
Some of the authors of this publication are also working on these related projects:
DRiCM, BCISR View project
Physiological function and mechanism of taurine-modification of mitochondrial tRNAs by MTO1 View project
Fakruddin Md.
98 PUBLICATIONS1,310 CITATIONS
SEE PROFILE
Shahnewaj Bin Mannan
Nagasaki University
39 PUBLICATIONS757 CITATIONS
SEE PROFILE
Abhijit Chowdhury
Bangladesh Council of Scientific & Industrial Research
28 PUBLICATIONS409 CITATIONS
SEE PROFILE
Reaz Mohammad Mazumdar
Bangladesh Council of Scientific & Industrial Research
45 PUBLICATIONS512 CITATIONS
SEE PROFILE
All content following this page was uploaded by Fakruddin Md. on 22 May 2014.
The user has requested enhancement of the downloaded file.

Bangladesh Journal of Bioethics 2013; 4(2):41-48
41
RESEARCH INVOLVING HUMAN SUBJECTS- ETHICAL PERSPECTIVE
Md. Fakruddin1*, Khanjada Shahnewaj Bin Mannan2, Abhijit Chowdhury1, Reaz Mohammad
Mazumdar3, Md. Nur Hossain1, Hafsa Afroz4
1Industrial Microbiology Laboratory, Institute of Food Science and Technology (IFST), Bangladesh
Council of Scientific and Industrial Research (BCSIR), Dhaka, Bangladesh
2Center for Food & Waterborne Diseases, icddr,b, Dhaka, Bangladesh
3BCSIR Laboratories Chittagong, Chittagong, Bangladesh
4Department of Microbiology, Primeasia University, Dhaka, Bangladesh
ABSTRACT: Research involving human subjects are important to develop new therapeutics for the
betterment of the human race. To take part in such research as volunteers is moral duty of any human.
But such experiments should be justifiable and minimal risky for the participants. History of unethical
research involving humans led to the development of many guidelines to make such research ethical as
well as to gain maximum possible output. Several guidelines have been formulated to ensure research
with human participants ethical. All the guidelines emphasize on one thing in particular- informed consent
of the human subjects. Other considerations include rational benefit-harm ration, beneficence, justice,
adequate research design and approval from proper authorities. All these guidelines aim to prevent any
unethical research involving humans against their will.
Key words: Research, Human, Ethics, Consent
INTRODUCTION: Research refers to a class of scientific activities designed to develop or contribute to
generalizable knowledge. The term “human research”, then, refers to research that involves human
subjects. Research is a public trust that must be ethically conducted, trustworthy, and socially responsible
if the results are to be valuable1. All parts of a research project – from the project design to submission of
the results for peer review – have to be upstanding in order to be considered ethical2. When even one
part of a research project is questionable or conducted unethically, the integrity of the entire project is
called into question3.
TYPES OF RESEARCH INVOLVING HUMAN: Two subtypes of human research can be identified. (1)
Therapeutic research is closely akin to therapy. Therapeutic research has dual purpose: it is performed
primarily for the benefit of the patient subjects; at the same time, the treatments are administered in a
systematic and controlled way, so that treatment results can be applied to other contexts or to future
subjects and patients. An example of therapeutic research is a study that compares the relative
effectiveness of two similarly promising anti-cancer drugs administered to cancer patients. (2)
Nontherapeutic research, on the other hand is performed primarily for the purpose of gaining new
knowledge, not for the benefit of the subjects involved in the study. For example, healthy human

Bangladesh Journal of Bioethics 2013; 4(2):41-48
42
volunteers who need no drugs for therapeutic purposes frequently participate in the early phases of drug
testing, when the safety of new drugs for human use is being evaluated4.
THE MORAL JUSTIFICATION OF RESEARCH INVOLVING HUMAN SUBJECTS: The primary
argument in favor of human research appeals to the principle of beneficence. It asserts that the social
benefits to be gained from such research are substantial and that the harms resulting from the cessation
of such investigations would be exceedingly grave3.
A second approach to the justification of human research is based on a joint appeal u the principles of
beneficence and justice. According to this view, beneficence requires that each of us make at least a
modest positive contribution to the good of our fellow-citizen or the society as a whole. If our participation
in research promises significant benefit for others, at little or no risk to ourselves, then such participation
may become a duty of beneficence. In addition, if we fail to fulfill this modest duty, while most of our
contemporaries perform it, we may be acting unjustly, since we are not performing our fair share of a
communal task5.
Every person currently alive is the beneficiary of earlier subjects' involvement in research. To be specific,
the willingness of past human volunteers to take part in studies of antibiotics (like penicillin) and vaccines
(like the polio vaccine) contributes to the health of us all. Accordingly, it seems unfair for us to reap the
benefits of already-performed research without making a reciprocal contribution to the alleviation of
disability and disease4.
Investigators should be free to decide what kinds of research they will perform and how they wish to
conduct that research. According to this view, the freedom of scientific inquiry should be protected from
outside interference, unless there are strong reasons for overriding the presumption of freedom. Thus, if
an investigator can find human subjects who are willing to take part in some proposed research, he or
she should generally be allowed to proceed with the research6.
RESEARCH DESIGN AND BENEFIT- HARM RATIO: The requirement of adequate research design is
end-oriented or utilitarian in character. The central aim of this requirement is to ensure that human
research will be conducted efficiently- that is, in a way that maximizes the amount of information gained
from exposing human subjects to the minimum amount of risk. The codes of research ethics add a
second stipulation, that research involving humans should be based upon prior laboratory and animal
studies7. A third stipulation is that all studies involving human subjects should be carefully controlled, so
that the biases of the investigator do not invalidate research results. Fourthly, careful methods of
statistical analysis should be employed in interpreting the data derived from human research, so that the
greatest possible informational benefit is derived from each study8.
Even if the optimal research is selected for a particular study, questions about the probability and
magnitude of anticipated harms and benefits resulting from the study may remain. A maximum level of
anticipated harm is suggested in the Nuremberg Code: “No experiment should be conducted where there
is a priori reason to believe that death or disabling injury will occur”9.

Bangladesh Journal of Bioethics 2013; 4(2):41-48
43
INFORMED CONSENT: Since the Nuremberg trials, no aspect of human research has received greater
attention than the issue of consent. In parallel fashion, several codifications of research ethics, including
the Helsinki Declaration, have gradually developed the concept of informed consent in the context of
research10.
Informed consent is designed to protect individuals participating in clinical research trials. An individual
interested in participating in a medical research trial will receive a document that contains information
about the benefits and risk of the trial, the research procedures and the reasons for the research. The
participant should be able to review the document with doctors and ask questions about things they do
not understand. Official consent to participate in the trial is given when this document is signed, with the
researcher and the participant retaining a copy. The researchers are obligated to keep the participant
updated and answer any questions the participant has. Informed consent does not obligate the participant
to finish the trial. A participant has the right to leave the trial at any time during the study11.
The principle of informed consent is the cardinal canon of loyalty joining men together in medical practice
and investigation. The law of battery protects patients and subjects against unauthorized interventions
while the law of negligence holds investigations liable for falling short of the customary standard in
informing patients or subjects about the potential risks of a particular intervention. It is the duty of the
investigators to provide full information to subjects concerning both the fact of randomization and the
progress of the trial12.
The requirement of adequate research design, favorable benefit-harm ratio and reasonably free and
sufficiently informed consent are generally regarded as necessary conditions of ethically acceptable
human research. Some also add that all subjects who accept the risks of research for the sake of the
society should also receive equitable compensation for injuries sustained in the course if their
participation in that research13.
PRIVACY AND CONFIDENTIALITY: Privacy and confidentiality are very important components for
research involving human subjects. People have a right to protect themselves, and information gathered
during research participation could harm a person by violating their right to keep information about
themselves private. The information gathered from people in biomedical studies has a unique potential to
be particularly embarrassing, harmful, or damaging14.
Recently, a number of research projects have focused on unlocking genetic information. Genetic
information may violate a person’s right to privacy if not adequately protected. The very fact that genetic
information contains information about identity provides a unique challenge to researchers. Many genetic
experiments may seem harmless, but during the process of collecting genetic information on, for
example, breast cancer, a researcher will inevitably collect a wealth of other identifiable information that
could potentially be linked to research participants as well15.
BENEFICENCE: Beneficence is a principle used frequently in research ethics. It means, “doing good.”48
Biomedical research strives to do good by studying diseases and health data to uncover information that
may be used to help others– through the discovery of therapies that improve the lives of people with

Bangladesh Journal of Bioethics 2013; 4(2):41-48
44
spinal cord injuries or new ways to prevent jaundice in infants. The crux of this issue lies in the fact that
uncovering information that may one day help people must be gathered from people who are living and
suffering today16. While research findings may one day help do good, they may also cause harm to
today’s research participants. For example, research participants in an AIDS study could be asked to take
an experimental drug to see if it alleviates their symptoms. The participants with AIDS take on a risk
(ingesting the experimental drug) in order to benefit others (information on how well the drug works) at
some time in the future. Researchers must never subject research participants to more risk than
necessary, be prepared to cease research if it is causing harm, and never put participants at a level of
risk disproportionate to the anticipated benefits17.
JUSTICE: The principle of justice demands that individual research subjects be selected fairly and that
appropriate populations are selected as research subjects. Because historical abuses of research
subjects tended to occur among those who were in some way disadvantaged or vulnerable, justice in the
selection of subject populations was typically considered as the need to protect such populations from
inclusion in research18. However, justice has come to be understood in some situations as fairness in
access to the benefits of participating in research, for individuals and for groups. AIDS and other disease-
based activism in the 1980s offered powerful arguments for access to potentially life-saving but
experimental drugs as well as an appreciation that a protective stance towards research participants
could lead to serious inequities in the availability of medical treatments (e.g., if drugs are not tested with
children, there may not be good drugs available for use with children). As a consequence, there are now
multiple policies of government and professional groups requiring the inclusion of various population
subgroups in research19.
The principle of justice means giving people what is due to them. This means that the risks and benefits
of research should be shared in a fair way, between all parties involved, e.g. sponsors, trial participants
and communities. So it is fair to:
Invite people and communities to take part in the research because it helps researchers achieve
their scientific goals. But they should not be invited for reasons that have nothing to do with the
research, e.g., because it is convenient for the researchers to ask them. For example, in phase III
HIV vaccine trials, people at high-risk of HIV infection will be recruited5.
Select participants in a way that lowers the risks involved. For example, researchers should
choose those who are less vulnerable. So, adults should be involved in HIV vaccine trials first,
then older adolescents, then younger adolescents and so on20.
Ask a person to take on the risks of research, as long as they or the population or community
they represent, have a chance to benefit from it. Anyone who stands to benefit should also take
on some of the risks. For example, it would not be fair to ask poor participants living in Africa to
take on the risks of HIV vaccine research if only persons in the West will benefit. Similarly, if
sponsors stand to benefit from a successful vaccine, they must take on some of the risks like the
cost of making the vaccine21.
RESEARCH INVOLVING CHILDREN: Ethical guidelines for human research generally presuppose that
the subjects who take part in research are adults who have normal mental capacities and who are not
pregnant, seriously ill, institutionalized, or in desperate need of money. Special subjects groups who differ

Bangladesh Journal of Bioethics 2013; 4(2):41-48
45
in one or more respects from this model of the normal adult human subject include the mentally retarded,
the dying, the comatose, fetuses and children6.
The general justification for including children in biomedical research is that physiologically children are
not merely “little adults”. For example, many drugs produce totally different effects in adults and children,
or even in newborn infants and two-year-olds. Unless carefully controlled studies of pediatric reactions to
such drugs are performed, children are likely to receive either ineffective or highly toxic doses of drugs22.
In general, parents are legally empowered to give permission-often termed proxy consent. No
nontherapeutic research should be performed without the informed consent of the research subject.
Young children are incapable of giving informed consent. Therefore, no nontherapeutic research involving
young children should be performed. In some cases the risks of nontherapeutic pediatric research may be
minimal, while the potential benefits of the research to children as a class may be substantial23.
All members of society are mutually interdependent and therefore owe to each other the performance of
certain minimal moral duties. Among these duties is the obligation to take part in minimally risky
nontherapeutic research that promises great promises to the society as a whole. Since, children, too, are
members of the society; they stand under a similar obligation, although they may be too immature to
recognize the fact. According to this argument, it is permissible for parents to provide proxy consent for
their children’s participation in minimally risky non-therapeutic research24.
DOES INCENTIVES ETHICAL? There is considerable confusion regarding the ethical appropriateness of
using incentives in research with human subjects. Previous work on determining whether incentives are
unethical considers them as a form of undue influence or coercive offer. Incentives become problematic
when conjoined with the following factors, singly or in combination with one another: where the subject is
in a dependency relationship with the researcher, where the risks are particularly high, where the
research is degrading, where the participant will only consent if the incentive is relatively large because
the participant’s aversion to the study is strong25.
Incentives in medical research induce people to do something inherently good (assuming of course that
the research is necessary, sound in design, and conducted with integrity), not to violate their duties. So
they are not bribery. Neither is they blackmail, since incentives are offers and not threats; one can refuse
them and remain no worse off than before. The problem centers around the claim that incentives,
particularly relatively large incentives, are a form of undue influence or undue inducement26. An offer can
be irresistibly attractive so that a destitute person may be induced to do something against his or her
better judgment, and even almost against his or her will, by the offer of a large amount of money. Thus,
the debate in this form is unresolvable because the positions arise out of irreconcilable paradigms. The
argument that incentives maximize choice and therefore maximize freedom arises from the economic
paradigm according to which an incentive is simply one form of trade. The alternative argument that
incentives can constitute undue influence evaluates incentives as one form of power27.
Grant and Sugarman28 suggested that the use of incentives in medical research will not pose ethical
problems. According to them, most of the time for most research studies, the use of incentives to recruit

Bangladesh Journal of Bioethics 2013; 4(2):41-48
46
and retain research subjects is entirely innocuous. The ethical responsibility to improve medical care must
be balanced against the ethical responsibility to treat research subjects as autonomous individuals
deserving of respect. Incentives used in an ethically appropriate manner can play an important role in
striking that balance.
ETHICAL APPROVAL FOR RESEARCH INVOLVING HUMAN PARTICIPANTS: In carrying out their
work researchers inevitably face ethical dilemmas which arise out of competing obligations and conflicts
of interest. All research proposals involving data collection involving human participants normally requires
prior ethical approval to ensure the safety, rights, dignity and well-being of the participant and those of the
researcher. Ethical approval should not be considered as a bureaucratic obstacle; it is a mechanism for
ensuring and demonstrating that the design of your research respects the rights of those who are the
participants of the research29.
Ethical Guidelines: Guidelines for the use of human subjects in research are relatively recent, with the
first modern and formal efforts to protect human subjects coming after World War II. The birth of modern
research ethics began with a desire to protect human subjects involved in research projects. The first
ever ethical guideline was that of Nuremberg Code formulated in 1946 which was resulted due to
abhorrent and torturous “experiments” with concentration camp inmates by the Nazi Doctors18. The
Nuremberg Guidelines paved the way for the next major initiative designed to promote responsible
research with human subjects, the Helsinki Declaration. The Helsinki Declaration was developed by the
World Medical Association and has been revised and updated periodically since 196430. Following the
Helsinki Declaration, the next set of research ethics guidelines came out in the Belmont Report of 1979
from the National Commission for the Protection of Human Subjects of Biomedical and Behavioral
Research. Council for international organization of Medical Science in collaboration with WHO developed
international ethical guidelines for biomedical research in 1993 with special attention to developing
country in response to common research as HIV/AIDS20.
Each set of regulations and internationally adopted principles concerning research with human subjects
consider the following issues to be of tantamount concern:
Human subjects must voluntarily consent to research and be allowed to discontinue participation
at any time.
Research involving human subjects must be valuable to society and provide a reasonably
expected benefit proportionate to the burden requested of the research participant.
Research participants must be protected and safe. No research is more valuable than human well
being and human life.
Researchers must avoid harm, injury, and death of research subjects and discontinue research
that might cause harm, injury, or death.
Research must be conducted by responsible and qualified researchers.
No population of people can be excluded from research or unfairly burdened unless there is an
overwhelming reason to do so.

Bangladesh Journal of Bioethics 2013; 4(2):41-48
47
CONCLUSION: Participation of human subjects is a must to make any clinical research successful while
the guidelines direct the researchers to perform such project ethically. Under-developed and developing
countries are more vulnerable in terms of unethical clinical research due to loose monitoring and under-
implementation or lack of appropriate law. Scientists and regulatory authorities should be aware of the
basic principles of bioethics regarding human participation in research. This article will provide readers
basic understanding on ethical principles regarding inclusion of human participants in clinical research.
REFERENCES
1. Harris J. Scientific research is a moral duty. Journal of Medical Ethics 2005; 31: 242–248.
2. Fakruddin M. Ethics in Stem Cell Research. Bangladesh Journal of Bioethics 2012; 3(1):13-18.
3. Beecher HK. Ethics and Clinical Research. The New England Journal of Medicine 1966; 274(24):
1354-1360.
4. Kapp MB. Ethical and legal issues in research involving human subjects: do you want a piece of me?
Journal of Clinical Pathology 2006; 59:335–339.
5. Memon IU. Justification of Participation of Human Subjects in Phase 1 Clinical Trials: An Ethical
Analysis. Bangladesh Journal of Bioethics 2011; 2(2): 26-29.
6. Macklin R. Bioethics, vulnerability, and protection. Bioethics 2003; 17(5-6): 472-486.
7. Verweij M, Dawson A. Public Health Research Ethics: A Research Agenda. Public Health Ethics 2009;
2(1): 1–6
8. Rid A, Wendler D. A framework for risk-benefit evaluations in biomedical research. Kennedy Institute of
Ethics Journal 2011; 21(2): 141–179.
9. Ghooi RB. The Nuremberg Code- A Critique. Perspectives in Clinical Research 2011; 2(2):72-76.
10. Joseph KS. Ethics in clinical research: searching for absolutes. Canadian Medical Association Journal
1998; 158:1303-1305.
11. Ali MA. What Makes Multinational Clinical Research Ethical & How To Minimize Possible Exploitation
In Host Country? Bangladesh Journal of Bioethics 2011; 2(2): 20-23.
12. Emanuel EJ, Wendler D, Grady C. What makes clinical Research ethical? Journal of the American
Medical Association 2000; 283: 2701- 2711.
13. Fakruddin M, Chowdhury A, Hossain MN, Mannan KSB. Ethics in Clinical Research: Bangladesh
Journal of Bioethics 2012; 3(3): 16-20.
14. Fakruddin M, Chowdhury A, Hossain MN, Mannan KSB. Scientific Freedom & Limits- Clinical
Research Perspective. Bangladesh Journal of Bioethics 2013; 4(1): 30-34.
15. Brody BA, McCullough LB, Sharp RR. Consensus and Controversy in Clinical Research Ethics.
Journal of the American Medical Association 2005; 294(11): 1411-1414.

Bangladesh Journal of Bioethics 2013; 4(2):41-48
48
16. Coughlin SS. Ethical issues in epidemiologic research and public health practice. Emerging Themes
in Epidemiology 2006; 3:16.
17. Bhutta ZA. Why regulate? Ethical regulation of health research. Journal of College of Physicians &
Surgeons 2001; 11: 537-540.
18. Grodin MA, Annas GJ. Legacies of Nuremberg: Medical ethics and human rights. Journal of the
American Medical Association 1996; 276: 1682–1683.
19. Kahn JP, Mastroianni AM, Sugarman J. (Eds.) Beyond consent: Seeking justice in research. New
York: Oxford University Press. 1998.
20. Pandey A, Aggarwal A, Seth SD, Maulik M, Juneja A. Strengthening ethics in clinical research. Indian
Journal of Medical Research 2011; 133: 339-340.
21. Hyder AA, Wali SA, Khan AN, Teoh NB, Kass NE and Dawson L. Ethical review of health research: a
perspective from developing country researchers. Journal Medical Ethics 2004; 30(1): 68-72.
22. Caldwell PHY, Murphy SB, Butow PH, Craig JC. Clinical trials in children. Lancet 2004; 364:803– 811.
23. Rothman DJ. The shame of medical research. The New York Review of Books 2000; 47 (19): 60– 64.
24. Rivera R, Borasky D, Rice R, Carayon F. Many worlds, one ethic: design and development of a global
research ethics training curriculum. Developing World Bioethics 2005; 5(2): 169-175.
25. Faden R, Beauchamp T, King N. A history and theory of informed consent. NewYork: Oxford
University Press. 1986.
26. Wilkinson M, Moore A. Inducement in research. Bioethics 1997; 11: 373–389.
27. Tishler CL, Bartholomae S. The recruitment of normal healthy volunteers: A review of the literature on
the use of financial incentives. Journal of Clinical Pharmacology 2002; 42: 363–373.
28. Grant RW, Sugarman J. Ethics in Human Subjects Research: Do Incentives Matter? Journal of
Medicine and Philosophy2004; 29(6): 717–738.
29. Kalantri SP. Ethics in Clinical Research. Indian Journal of Anaesthesia 2003; 47 (1): 30-32.
30. Lasker SP. History of Clinical Research and Ethics. Bangladesh Journal of Bioethics 2013; 4(1):20-
29.
View publication statsView publication stats

See discussions, stats, and author profiles for this publication at: https://www.researchgate.net/publication/308631753
Optimal training load for developing muscular power
Conference Paper · July 2016
CITATIONS
0
READS
4,522
8 authors, including:
Some of the authors of this publication are also working on these related projects:
The IRIS Project View project
Irish Rugby Injury Surveillance (IRIS) View project
Mark Lyons
University of Limerick
126 PUBLICATIONS1,757 CITATIONS
SEE PROFILE
Ian C. Kenny
University of Limerick
141 PUBLICATIONS795 CITATIONS
SEE PROFILE
Alan Griffin
University of Limerick
8 PUBLICATIONS40 CITATIONS
SEE PROFILE
All content following this page was uploaded by Mark Lyons on 26 September 2016.
The user has requested enhancement of the downloaded file.
Introduction
Within the existing literature, there is support for the concept of
using an optimal load, or percentage of one repetition maximum
(1RM) to develop maximum muscular power during resistance
training (Bevan et al., 2010; Jandacka & Uchytil, 2011). McBride
et al. (2002) suggests that improvement in maximal power
production and in turn athletic performance, is a consequence of
training not under lighter or heavier loading conditions, but at a
load that maximizes power output. Despite this, there remains
considerable debate regarding the load which equates to the
most propitious adaptations in muscular power. Some authors
to date advocate using speed orientated training methods that
comprise low resistance (<30% 1RM) with high velocity whilst
others suggest a strength orientated training method
encompassing high resistance (>80% 1RM) with low velocities.
Some of the inconsistencies here derive from variations in the
methods used to measure power output as well as variations in
the nature of the exercises (e.g. single/multi-joint, upper/lower
body). It is also evident that subject’s strength level and/or
training age have not been fully considered in some of the
research published to date.
Aims
The aims of this study were (1) To identify the optimal training
load or range of training loads for the development of muscular
power in the back squat (BS) and bench press (BP) exercises
and (2) To examine if baseline strength levels affect optimal
training loads for development of muscular power in these
exercises.
Method
Participants
50 male field-sports athletes (age: 21.6 ± 3.22yrs; height: 180.5
± 5.7cm; mass: 82.4 ± 8kg) volunteered to participate in this
study. Participants were required to have a minimum training
age of two years and so all participants were actively engaged
in structured resistance training over the previous 2 years.
Participants were screened prior to the study in terms of their
ability to perform the BS and BP exercises proficiently,
completed written informed consent and a Physical Activity
Readiness Questionnaire in advance of testing.
Optimal training load for developing muscular power
Lyons, M., Kenny, I., Griffin, A., Mahon, S., Lynch, G., Witherow, P., Carty, P. & Boyle, M.
Department of Physical Education and Sport Sciences, University of Limerick, Ireland
21st Annual Congress of the European College of Sport Science
Procedures
Participant’s age, mass (BM) and height were recorded on
arrival to the laboratory. A standardized warm-up was
performed prior to both the BS and BP 1RM tests. This
consisted of 5 minutes light intensity exercise on a cycle
ergometer followed by 10 minutes of dynamic stretching and
mobility work. Protocols by Kraemer et al. (2006) and the
National Strength and Conditioning Association (2008) were
used to safely and effectively determine participants’ 1RM for
both the BP and BS exercises. The order of exercises was
randomized. Correct technique and range of motion was
adhered to throughout. Spotters and safety bars were present at
all times.
Power Testing
48 hours after establishing participant 1RM scores, power
testing commenced using the TENDO FitroDyne Weightlifting
Analyzer V-207 (Tendo Sports Machines, Slovak Republic). The
Fitrodyne has been deemed a highly reliable (ICC = 0.97)
device for assessing muscle power output (Jennings et al.,
2001). Using the set-up shown in Figure 1, participants were
instructed to perform one repetition of the BP or BS at loads that
equated to percentages of their predetermined 1RM including
20, 30, 40, 50, 60, 70, 80 and 90%. These were also completed
in a randomized order and a minimum of 3 minutes rest was
given between each repetition. Participants were instructed to
perform the concentric phase of the exercise as explosively as
possible while still maintaining technique. Power was calculated
as the product of the force and velocity of the barbell.
Figure 1. Participants performing the BS and BP exercises with the TENDO unit attached to the barbell (Note: Spotters removed for purposes of the
photograph).
Statistical Analyses
All values are expressed as the mean (±SD) and the descriptive
data are present in Table 1. Repeated measures analysis of
variance (ANOVA) with Bonferroni post-hoc were used to
examine differences in power output across the varying loads
for both BS and BP. All statistical calculations were performed
using IBM SPSS 22.0 (IBM Corporation, Armonk, NY) and
statistical significance was set at p < 0.05.
Results
Descriptive data (mean power output) at different percentages
of 1RM for the BS and BP exercises are presented in Table 1.
The optimal load for development of muscular power was found
to be 60% of 1RM and 70% of 1RM for the BP and BS exercises
respectively. This is illustrated in Figures 3 & 4.
Repeated measures ANOVA revealed that power output at 70%
IRM for the BS was significantly different (p < 0.001) to all other
loads with the exception of 60% and 80% (both, p > 0.05). Maxi-
mal power output is within the 60-80% 1RM range therefore for
the BS exercise.
Repeated measures ANOVA also revealed that power output
achieved at 60% of 1RM for the BP exercise was significantly
different to all other percentages of 1RM recorded with the
exception of 50% (p > 0.05). This suggests that maximal power
output during the BP is achieved during a range of 50-60% of
1RM. Finally, when athletes were categorized according to their
strength to weight ratio (≤ or ≥ 1kg/kg BM (BP); ≤ or ≥ 1.5kg/kg
BM (BS)), this study revealed that the results showed that
stronger athletes generate their optimal power outputs at a
lower relative load compared to weaker athletes.
Conclusions
Maximal power output is achieved at 60% of 1RM and 70% of
1RM for the BP and BS exercises respectively with optimum
ranges of 60-80% for the BS and 50-60% for the BP.
Considerable inter-individual differences exist indicating that
the load that maximizes power output varies across individual
athletes.
Stronger athletes generate optimal power outputs at a lower
relative load compared to weaker athletes.
The nature of the exercise as well as baseline strength levels
need careful consideration when prescribing training load for
the development of muscular power in field-based athletes.
Regular individual determination of optimal load is desirable in
terms of ensuring an athlete is maximizing the development of
muscular power as part of their training.
References
Baechle TR and Earle RW. Essentials of strength training and conditioning. 3rd ed,
Champaign, IL: Human Kinetics, 2008.
Bevan, HR, Bunce, PJ, Owen, NJ, Bennett, MA, Cook, CJ, Cuningham, DJ, Newton, RU,
and Kilduff, L. P. Optimal loading for the development of peak power output in professional
Rugby players. J Strength Cond Res 24(1): 43-47, 2010.
Jandacka, D, and Uchytil, J. Optimal load maximizes the mean mechanical power output
during upper extremity exercise in highly trained soccer players. J Strength Cond Res 2
(10): 276 -2772, 2011.
Jennings, CL, Viljoen, W, Durandt, J, and Lambert, MI. The reliability of the FiTRODyne
as a measure of muscle power. J Strength Cond Res 19: 167–171, 2005.
Kraemer, JW, Ratamess, AN, Fry, CA, and French, ND. Strength training: development
and evaluation of methodology. In: Physiological Assessment of Human Fitness. Maud, JP
and Foster, C, eds. Champaign, IL: Human Kinetics, 2006. pp. 119–150.
McBride, JM, Triplett-McBride, T, Davie, A, and Newton, RU. The effect of heavy-vs. light
load jump squats on the development of strength, power, and speed. J Strength Cond
Res 16(1): 75-82, 2002.
View publication statsView publication stats

See discussions, stats, and author profiles for this publication at: https://www.researchgate.net/publication/319998246
Sampling Methods in Research Methodology; How to Choose a Sampling
Technique for Research
ArticleinSSRN Electronic Journal · January 2016
DOI: 10.2139/ssrn.3205035
CITATIONS
172
READS
792,568
1 author:
Some of the authors of this publication are also working on these related projects:
Marketing Management View project
Manufacturing Strategy View project
Hamed Taherdoost
Hamta Group
99 PUBLICATIONS1,320 CITATIONS
SEE PROFILE
All content following this page was uploaded by Hamed Taherdoost on 23 September 2017.
The user has requested enhancement of the downloaded file.
International Journal of Academic Research in
Management (IJARM)
Vol. 5, No. 2, 2016, Page: 18-27, ISSN: 2296-1747
© Helvetic Editions LTD, Switzerland
www.elvedit.com
Sampling Methods in Research Methodology;
How to Choose a Sampling Technique for
Research
A
Hamed Taherdoost
Research and Development Department, Hamta Business Solution Sdn Bhd
Research and Development Department, Ahoora Ltd | Management
Consultation Group
Kuala Lumpur, Malaysia
A
In order to answer the research questions, it is doubtful that researcher should be able to collect data from all
cases. Thus, there is a need to select a sample. This paper presents the steps to go through to conduct
sampling. Furthermore, as there are different types of sampling techniques/methods, researcher needs to
understand the differences to select the proper sampling method for the research. In the regards, this paper
also presents the different types of sampling techniques and methods.
K Words
Sampling Method, Sampling Technique, Research Methodology, Probability Sampling, and Non-Probability
Sampling.
I. SAMPLING METHODS
In order to answer the research questions, it is doubtful that researcher should be able to
collect data from all cases. Thus, there is a need to select a sample. The entire set of cases from
which researcher sample is drawn in called the population. Since, researchers neither have time
nor the resources to analysis the entire population so they apply sampling technique to reduce
the number of cases. Figure 1 illustrates the stages that are likely to go through when conducting
sampling.
Sampling Method in Research Methodology; How to Choose a Sampling Technique for Research
Hamed Taherdoost
Copyright © 2016 Helvetic Editions LTD - All Rights Reserved
www.elvedit.com 19
FIGURE 1: SAMPLING PROCESS STEPS
A. Stage 1: Clearly Define Target Population
The first stage in the sampling process is to clearly define target population. Population is
commonly related to the number of people living in a particular country.
Clearly Define
Target Population
Select Sampling
Frame
Choose Sampling
Technique
Determine
Sample Size
Collect Data
Assess
Response Rate

International Journal of Academic Research in Management
Volume 5, Issue 2, 2016, ISSN: 2296-1747
Copyright © 2016 Helvetic Editions LTD - All Rights Reserved
www.elvedit.com 20
B. Stage2: Select Sampling Frame
A sampling frame is a list of the actual cases from which sample will be drawn. The sampling
frame must be representative of the population.
C. Stage 3: Choose Sampling Technique
Prior to examining the various types of sampling method, it is worth noting what is meant by
sampling, along with reasons why researchers are likely to select a sample. Taking a subset from
chosen sampling frame or entire population is called sampling. Sampling can be used to make
inference about a population or to make generalization in relation to existing theory. In essence,
this depends on choice of sampling technique.
In general, sampling techniques can be divided into two types:
Probability or random sampling
Non- probability or non- random sampling
Before choosing specific type of sampling technique, it is needed to decide broad sampling
technique. Figure 2 shows the various types of sampling techniques.
.
FIGURE I2: SAMPLING TECHNIQUES
1. Probability Sampling
Probability sampling means that every item in the population has an equal chance of being
included in sample. One way to undertake random sampling would be if researcher was to
construct a sampling frame first and then used a random number generation computer program
to pick a sample from the sampling frame (Zikmund, 2002). Probability or random sampling has
the greatest freedom from bias but may represent the most costly sample in terms of time and
Sampling Techniques
Probability Sampling
Simple random
Stratified random
Cluster sampling
Systematic sampling
Multi stage sampling
Non-probability Sampling
Quota sampling
Snowball sampling
Judgment sampling
Convenience sampling

Sampling Method in Research Methodology; How to Choose a Sampling Technique for Research
Hamed Taherdoost
Copyright © 2016 Helvetic Editions LTD - All Rights Reserved
www.elvedit.com 21
energy for a given level of sampling error (Brown, 1947).
1.1. Simple random sampling
The simple random sample means that every case of the population has an equal
probability of inclusion in sample. Disadvantages associated with simple random
sampling include (Ghauri and Gronhaug, 2005):
A complete frame ( a list of all units in the whole population) is needed;
In some studies, such as surveys by personal interviews, the costs of obtaining
the sample can be high if the units are geographically widely scattered;
The standard errors of estimators can be high.
1.2. Systematic sampling
Systematic sampling is where every nth case after a random start is selected. For
example, if surveying a sample of consumers, every fifth consumer may be selected from
your sample. The advantage of this sampling technique is its simplicity.
1.3. Stratified random sampling
Stratified sampling is where the population is divided into strata (or subgroups) and a
random sample is taken from each subgroup. A subgroup is a natural set of items.
Subgroups might be based on company size, gender or occupation (to name but a few).
Stratified sampling is often used where there is a great deal of variation within a
population. Its purpose is to ensure that every stratum is adequately represented
(Ackoff, 1953).
1.4. Cluster sampling
Cluster sampling is where the whole population is divided into clusters or groups.
Subsequently, a random sample is taken from these clusters, all of which are used in the
final sample (Wilson, 2010). Cluster sampling is advantageous for those researchers
whose subjects are fragmented over large geographical areas as it saves time and money
(Davis, 2005). The stages to cluster sampling can be summarized as follows:
Choose cluster grouping for sampling frame, such as type of company or
geographical region
Number each of the clusters
Select sample using random sampling
1.5. Multi-stage sampling
Multi-stage sampling is a process of moving from a broad to a narrow sample, using a
step by step process (Ackoff, 1953). If, for example, a Malaysian publisher of an

International Journal of Academic Research in Management
Volume 5, Issue 2, 2016, ISSN: 2296-1747
Copyright © 2016 Helvetic Editions LTD - All Rights Reserved
www.elvedit.com 22
automobile magazine were to conduct a survey, it could simply take a random sample of
automobile owners within the entire Malaysian population. Obviously, this is both
expensive and time consuming. A cheaper alternative would be to use multi-stage
sampling. In essence, this would involve dividing Malaysia into a number of
geographical regions. Subsequently, some of these regions are chosen at random, and
then subdivisions are made, perhaps based on local authority areas. Next, some of these
are again chosen at random and then divided into smaller areas, such as towns or cities.
The main purpose of multi-stage sampling is to select samples which are concentrated in
a few geographical regions. Once again, this saves time and money.
2. Non probability Sampling
Non probability sampling is often associated with case study research design and qualitative
research. With regards to the latter, case studies tend to focus on small samples and are intended
to examine a real life phenomenon, not to make statistical inferences in relation to the wider
population (Yin, 2003). A sample of participants or cases does not need to be representative, or
random, but a clear rationale is needed for the inclusion of some cases or individuals rather than
others.
2.1. Quota sampling
Quota sampling is a non random sampling technique in which participants are chosen
on the basis of predetermined characteristics so that the total sample will have the same
distribution of characteristics as the wider population (Davis, 2005).
2.2. Snowball sampling
Snowball sampling is a non random sampling method that uses a few cases to help
encourage other cases to take part in the study, thereby increasing sample size. This
approach is most applicable in small populations that are difficult to access due to their
closed nature, e.g. secret societies and inaccessible professions (Breweton and Millward,
2001).
2.3. Convenience sampling
Convenience sampling is selecting participants because they are often readily and easily
available. Typically, convenience sampling tends to be a favored sampling technique
among students as it is inexpensive and an easy option compared to other sampling
techniques (Ackoff, 1953). Convenience sampling often helps to overcome many of the
limitations associated with research. For example, using friends or family as part of
sample is easier than targeting unknown individuals.

Sampling Method in Research Methodology; How to Choose a Sampling Technique for Research
Hamed Taherdoost
Copyright © 2016 Helvetic Editions LTD - All Rights Reserved
www.elvedit.com 23
2.4. Purposive or judgmental sampling
Purposive or judgmental sampling is a strategy in which particular settings persons or
events are selected deliberately in order to provide important information that cannot be
obtained from other choices (Maxwell, 1996). It is where the researcher includes cases or
participants in the sample because they believe that they warrant inclusion.
Table 1 illustrates strengths and weaknesses associated with each respective sampling
technique.
TABLE 1: STRENGTHS AND WEAKNESSES OF SAMPLING TECHNIQUES
SOURCE: (MALHOTRA AND BIRKS, 2006)
Technique
Strengths
Weaknesses
Convenience
sampling
Least expensive, least time-
consuming, most convenient
Selection bias, sample not
representative, not recommended
by descriptive or casual research
Judgment
sampling
Low-cost, convenient, not time-
consuming, ideal for exploratory
research design
Does not allow generalization,
subjective
Quota
sampling
Sample can be controlled for
certain characteristics
Selection bias, no assurance
Snowball
sampling
Can estimate rare characteristics
Time-consuming
Simple
random
sampling
Easily understood, results
projectable
Difficult to construct sampling
frame, expensive, lower precision,
no assurance of representativeness
Systematic
sampling
Can increase representativeness,
easier to implement than simple
random sampling, sampling frame
not always necessary
Can decrease representativeness
Stratified
sampling
Includes all important sub-
population, precision
Difficult to select relevant
stratification variables, not feasible
to stratify on many variables,
expensive
Cluster
sampling
Easy to implement, cost-effective
Imprecise, difficult to compute an
interpret results
D. Stage 4: Determine Sample Size
In order to generalize from a random sample and avoid sampling errors or biases, a random
sample needs to be of adequate size. What is adequate depends on several issues which often

International Journal of Academic Research in Management
Volume 5, Issue 2, 2016, ISSN: 2296-1747
Copyright © 2016 Helvetic Editions LTD - All Rights Reserved
www.elvedit.com 24
confuse people doing surveys for the first time. This is because what is important here is not the
proportion of the research population that gets sampled, but the absolute size of the sample
selected relative to the complexity of the population, the aims of the researcher and the kinds of
statistical manipulation that will be used in data analysis. While the larger the sample the lesser
the likelihood that findings will be biased does hold, diminishing returns can quickly set in when
samples get over a specific size which need to be balanced against the researcher’s resources (Gill
et al., 2010). To put it bluntly, larger sample sizes reduce sampling error but at a decreasing rate.
Several statistical formulas are available for determining sample size.
There are numerous approaches, incorporating a number of different formulas, for calculating
the sample size for categorical data.
n= p (100-p)z2/E2
n is the required sample size
P is the percentage occurrence of a state or condition
E is the percentage maximum error required
Z is the value corresponding to level of confidence required
There are two key factors to this formula (Bartlett et al., 2001). First, there are considerations
relating to the estimation of the levels of precision and risk that the researcher is willing to
accept:
E is the margin of error(the level of precision) or the risk the researcher is willing to accept (for
example, the plus or minus figure reported in newspaper poll results). In the social research a 5%
margin of error is acceptable. So, for example, if in a survey on job satisfaction 40% of
respondents indicated they were dissatisfied would lie between 35% and 45%. The smaller the
value of E the greater the sample size required as technically speaking sample error is inversely
proportional to the square root of n, however, a large sample cannot guarantee precision (Bryman
and Bell, 2003).
Z concern the level of confidence that the results revealed by the survey findings are accurate.
What this means is the degree to which we can be sure the characteristics of the population have
been accurately estimated by the sample survey. Z is the statistical value corresponding to level
of confidence required. The key idea behind this is that if a population were to be sampled
repeatedly the average value of a variable or question obtained would be equal to the true
population value. In management research the typical levels of confidence used are 95 percent
(0.05: a Z value equal to 1.96) or 99 percent (0.01: Z=2.57). A 95 percent level of confidence
implies that 95 out of 100 samples will have the true population value within the margin of error
(E) specified.
The second key component of a sample size formula concerns the estimation of the variance or
heterogeneity of the population (P). Management researchers are commonly concerned with
determining sample size for issues involving the estimation of population percentages or
proportions (Zikmund, 2002). In the formula the variance of a proportion or the percentage

Sampling Method in Research Methodology; How to Choose a Sampling Technique for Research
Hamed Taherdoost
Copyright © 2016 Helvetic Editions LTD - All Rights Reserved
www.elvedit.com 25
occurrence of how a particular question, for example, will be answered is P(100-P). Where, P= the
percentage of a sample having a characteristic , for example, the 40 % of the respondents who
were dissatisfied with pay, and (100-P) is the percentage (60%) who lack the characteristic or
belief. The key issue is how to estimate the value of P before conducting the survey? Bartlett et
al. (2001) suggest that researchers should use 50% as an estimate of P, as this will result in the
maximization of variance and produce the maximum sample size (Bartlett et al., 2001).
The formula for determining sample size, of the population has virtually no effect on how well
the sample is likely to describe the population and as Fowler (2002) argues, it is most unusual for
it (the population fraction) to be an important consideration when deciding on sample size
(Fowler, 2002).
Table 2 presents sample size that would be necessary for given combinations of precision,
confidence levels, and a population percentage or variability of 50% (the figure which many
researchers suggest to maximize variance).
TABLE I: SAMPLE SIZE BASED ON DESIRED ACCURACY
SOURCE: (GILL ET AL., 2010)
`
Variance of the population P=50%
Confidence level=95%
Margin of error
Confidence level=99%
Margin of error
Population Size
5
3
1
5
3
1
50
44
48
50
46
49
50
75
63
70
74
67
72
75
100
79
91
99
87
95
99
150
108
132
148
122
139
149
200
132
168
196
154
180
198
250
151
203
244
181
220
246
300
168
234
291
206
258
295
400
196
291
384
249
328
391
500
217
340
475
285
393
485
600
234
384
565
314
452
579
700
248
423
652
340
507
672
800
260
457
738
362
557
763
1000
278
516
906
398
647
943
1500
306
624
1297
459
825
1375
2000
322
696
1655
497
957
1784
3000
341
787
2286
541
1138
2539
5000
357
879
3288
583
1342
3838
10000
370
964
4899
620
1550
6228
25000
378
1023
6939
643
1709
9944
50000
381
1045
8057
652
1770
12413
100000
383
1056
8762
656
1802
14172
250000
384
1063
9249
659
1821
15489
500000
384
1065
9423
660
1828
15984
1000000
384
1066
9513
660
1831
16244

International Journal of Academic Research in Management
Volume 5, Issue 2, 2016, ISSN: 2296-1747
Copyright © 2016 Helvetic Editions LTD - All Rights Reserved
www.elvedit.com 26
The sample sizes reflect the number of obtained responses, and not necessarily the number of
questionnaires distributed (this number is often increased to compensate for non-response).
However, in most social and management surveys, the response rates for postal and e-mailed
surveys are very rarely 100%. Probably the most common and time effective way to ensure
minimum samples are met is to increase the sample size by up to 50% in the first distribution of
the survey (Bartlett et al., 2001).
E. Stage 5: Collect Data
Once target population, sampling frame, sampling technique and sample size have been
established, the next step is to collect data.
F. Stage 6: Assess Response Rate
Response rate is the number of cases agreeing to take part in the study. These cases are taken
from original sample. In reality, most researchers never achieve a 100 percent response rate.
Reasons for this might include refusal to respond, ineligibility to respond, inability to respond, or
the respondent has been located but researchers are unable to make contact. In sum, response
rate is important because each non response is liable to bias the final sample. Clearly defining
sample, employing the right sampling technique and generating a large sample, in some respects
can help to reduce the likelihood of sample bias.
II. CONCLUSION
In this paper, the different types of sampling methods/techniques were described. Also the six
steps which should be taken to conduct sampling were explained. As mentioned, there are two
types of sampling methods namely; probability sampling and non-probability sampling. Each of
these methods includes different types of techniques of sampling. Non-probability Sampling
includes Quota sampling, Snowball sampling, Judgment sampling, and Convenience sampling,
furthermore, Probability Sampling includes Simple random, Stratified random, Cluster
sampling, Systematic sampling and Multi stage sampling.
ACKNOWLEDGMENT
This research was prepared under support of Research and Development Department of
Hamta Business Solution Sdn Bhd and Ahoora Ltd | Management Consultation Group.
REFERENCES
[1] ACKOFF, R. L. 1953. The Design of Social Research, Chicago, University of Chicago Press.
[2] BARTLETT, J. E., KOTRLIK, J. W. & HIGGINS, C. C. 2001. Organizational research: determining
appropriate sample size in survey research. Learning and Performance Journal, 19, 43-50.
[3] BREWETON, P. & MILLWARD, L. 2001. Organizational Research Methods, London, SAGE.
[4] BROWN, G. H. 1947. A comparison of sampling methods. Journal of Marketing, 6, 331-337.
[5] BRYMAN, A. & BELL, E. 2003. Business research methods, Oxford, Oxford University Press.
[6] DAVIS, D. 2005. Business Research for Decision Making, Australia, Thomson South-Western.

Sampling Method in Research Methodology; How to Choose a Sampling Technique for Research
Hamed Taherdoost
Copyright © 2016 Helvetic Editions LTD - All Rights Reserved
www.elvedit.com 27
[7] FOWLER, F. J. 2002. Survey research methods, Newbury Park, CA, SAGE.
[8] GHAURI, P. & GRONHAUG, K. 2005. Research Methods in Business Studies, Harlow, FT/Prentice
Hall.
[9] GILL, J., JOHNSON, P. & CLARK, M. 2010. Research Methods for Managers, SAGE Publications.
[10] MALHOTRA, N. K. & BIRKS, D. F. 2006. Marketing Research: An Applied Approach, Harlow,
FT/Prentice Hall.
[11] MAXWELL, J. A. 1996. Qualitative Research Design: An Intractive Approach London, Applied Social
Research Methods Series.
[12] WILSON, J. 2010. Essentials of business research: a guide to doing your research project, SAGE
Publication.
[13] YIN, R. K. 2003. Case study research, design and methods, Newbury Park, CA, SAGE.
[14] ZIKMUND 2002. Business research methods, Dryden, Thomson Learning.
Authors’ Biography
Hamed Taherdoost is holder of Bachelor degree in the field of Science of Power
Electricity, Master of Computer Science (Information Security), Doctoral of
Business Administration; Management Information Systems and second PhD in
the field of Computer Science.
With over 16 years of experience in the field of IT and Management, Dr Hamed
has established himself as an industry leader in the field of Management and IT.
Currently he is Chief Executive Officer of Hamta Business Solutions Sdn Bhd,
Director and Chief Technological Officer of an IT Company, Asanware Sdn Bhd,
Chief Executive Officer of Ahoora Ltd | Management Consultation Group, and
Chief Executive Officer of Simurgh Pvt, an International Trade Company.
Remarkably, a part of his experience in industry background, he also has numerous experiences in
academic environment. Dr.Hamed has published more than 100 scientific articles in authentic journals
and conferences. Currently, he is a member of European Alliance for Innovation, Informatics Society,
Society of Computer Science, American Educational Research Association, British Science Association,
Sales Management Association, Institute of Electrical and Electronics Engineers (IEEE), IEEE Young
Professionals, IEEE Council on Electronic Design Automation, and Association for Computing Machinery
(ACM).
Particularly, he is a Certified Ethical Hacker (CEH), Associate in Project Management (CAPM),
Information Systems Auditor (CISA), Information Security Manager (CISM), PMI Risk Management
Professional, Project Management Professional (PMP), Computer Hacking Forensic Investigator (CHFI)
and Certified Information Systems (CIS).
His research interest areas are Management of Information System, Technology Acceptance Models and
Frameworks, Information Security, Information Technology Management, Cryptography, Smart Card
Technology, Computer Ethics, Web Service Quality, Web Service Security, Performance Evaluation,
Internet Marketing, Project Management and Leadership.
View publication statsView publication stats

The
optimal
training
load
for
the
development
of
dynamic
athletic
performance
GREG
J.
WILSON,
ROBERT
U.
NEWTON,
ARON
J.
MURPHY,
and
BRENDAN
J.
HUMPHRIES
The
Centre
For
Human
Movement
Science
and
Sport
Management,
The
University
of
New
England-Northern
Rivers
Lismore,
2480
NSW
AUSTRALIA
ABSTRACT
WILSON,
G.
J.,
R.
U.
NEWTON,
A.
J.
MURPHY,
and
B.
J.
HUMPHRIES.
The
optimal
training
load
for
the
development
of
dynamic
athletic
performance.
Med.
Sci.
Sports
Exerc.,
Vol.
25,
No.
11,
pp.
1279-1286,
1993.
This
study
was
performed
to
determine
which
of
three
theoretically
optimal
resistance
training
modalities
resulted
in
the
greatest
enhancement
in
the
performance
of
a
series
of
dynamic
athletic
activities.
The
three
training
modalities
included
1)
traditional
weight
training,
2)
plyometric
training,
and
3)
explosive
weight
training
at
the
load
that
maximized
mechanical
power
output.
Sixty-four
previously
trained
subjects
were
randomly
allocated
to
four
groups
that
included
the
above
three
training
modalities
and
a
control
group.
The
experimental
groups
trained
for
10
wk
performing
either
heavy
squat
lifts,
depth
jumps,
or
weighted
squat
jumps.
All
subjects
were
tested
prior
to
training,
after
5
wk
of
training
and
at
the
completion
of
the
training
period.
The
test
items
included
1)
30-m
sprint,
2)
vertical
jumps
performed
with
and
without
a
countermove-
ment,
3)
maximal
cycle
test,
4)
isokinetic
leg
extension
test,
and
5)
a
maximal
isometric
test.
The
experimental
group
which
trained
with
the
load
that
maximized
mechanical
power
achieved
the
best
overall
results
in
enhancing
dynamic
athletic
performance
recording
statis-
tically
significant
(P
<
0.05)
improvements
on
most
test
items
and
producing
statistically
superior
results
to
the
two
other
training
mo-
dalities
on
the
jumping
and
isokinetic
tests.
PERFORMANCE
ENHANCEMENT,
POWER
DEVELOPMENT,
TRAINING
MODALITIES,
BAR
KINETICS,
PLYOMETRICS
training
techniques
to
enhance
their
competitive
performance.
In
past
generations
weight
training
has
been
the
domain
of
strength
sport
athletes
such
as
weight
lifters
and
shot
putters.
However,
more
recently
resistance
training
methods
are
being
adopted
by
ever-
increasing
numbers
of
athletes
from
a
diverse
range
of
sports.
To
enhance
performance,
a
number
of
training
options
are
available
to
the
athlete.
These
include
tra-
ditional
weight
training,
where
relatively
heavy
weights
are
lifted
for
relatively
few
repetitions,
through
to
dy-
namic
plyometric
training,
where
the
acceleration
and
deceleration
of
body
weight
serves
as
the
overload
for
training.
Although
there
are
a
variety
of
resistance
training
F:
centuries
athletes
have
been
using
resistance
0195-9131/93/2511-1279$3.00/0
MEDICINE
AND
SCIENCE
IN
SPORTS
AND
EXERCISE
Copyright
©
1993
by
the
American
College
of
Sports
Medicine
Submitted
for
publication
October
1992.
Accepted
for
publication
May
1993.
methods
one
can
use
to
enhance
dynamic
performance,
there
appears
to
be
three
distinct
schools
of
thought
as
to
which
method
would
result
in
optimal
performance
gains
in
dynamic
sports
such
as
sprinting,
jumping,
throwing,
and
so
on.
These
include:
1.
Traditional
weight
training,
where
relatively
heavy
loads
(80-90%
of
maximum)
are
lifted
for
relatively
few
repetitions
(4-8
repetitions).
This
method
is
seen
to
result
in
optimal
increases
in
strength
(5)
and
has
also
been
reported
to
enhance
power
and
movement
speed
to
a
greater
extent
than
training
with
relatively
light
loads
(21,23).
These
findings
are
rationalized
based
on
the
size
theory
of
motor
unit
recruitment
(19),
which
implies
that
to
train
the
fast
twitch
motor
units,
which
are
dominantly
responsible
for
dynamic
performance,
heavy
loads
must
be
used
in
training
as
only
heavy
load
training
guarantees
the
recruitment
of
all
motor
units
(20).
2.
Plyometric
training,
where
the
acceleration
and
deceleration
of
body
weight
1s
used
as
the
overload
in
dynamic
activities
such
as
depth
jumping
and
bound-
ing.
This
training
method
1s
seen
to
improve
muscular
power
thereby
enhancing
dynamic
competitive
per-
formance
such
as
jumping
(7).
Hakkinen
et
al.
(13,14)
have
reported
that
the
dynamic
nature
of
plyometric
training
allows
for
greater
improvements
in
the
maxi-
mal
rate
of
force
development
and
thus
power
in
com-
parison
with
traditional
weight
training
methods.
Many
coaches
and
athletes
maintain
that
plyometric
training
represents
the
bridge
between
strength
and
power
and
perceive
it
as
a
method
of
training
that
will
directly
enhance
competitive
performance
(8).
3.
Dynamic
weight
training
performed
at
the
load
that
maximizes
mechanical
power
output.
This
training
strategy
involves
lifting
relatively
light
loads
(approxi-
mately
30%
of
maximum)
at
high
speed.
This
training
results
in
the
production
of
the
highest
mechanical
power
output
of
the
musculature,
which
has
been
re-
ported
to
result
in
the
greatest
training
gains
in
power
(6,15,18).
In
observing
the
effects
of
training
at
0%,
30%,
60%,
and
100%
of
maximum,
Kaneko
et
al.
(15)
reported
that
the
30%
of
maximum
load
resulted
in
the
greatest
increase
1n
maximal
mechanical
power
output
1279
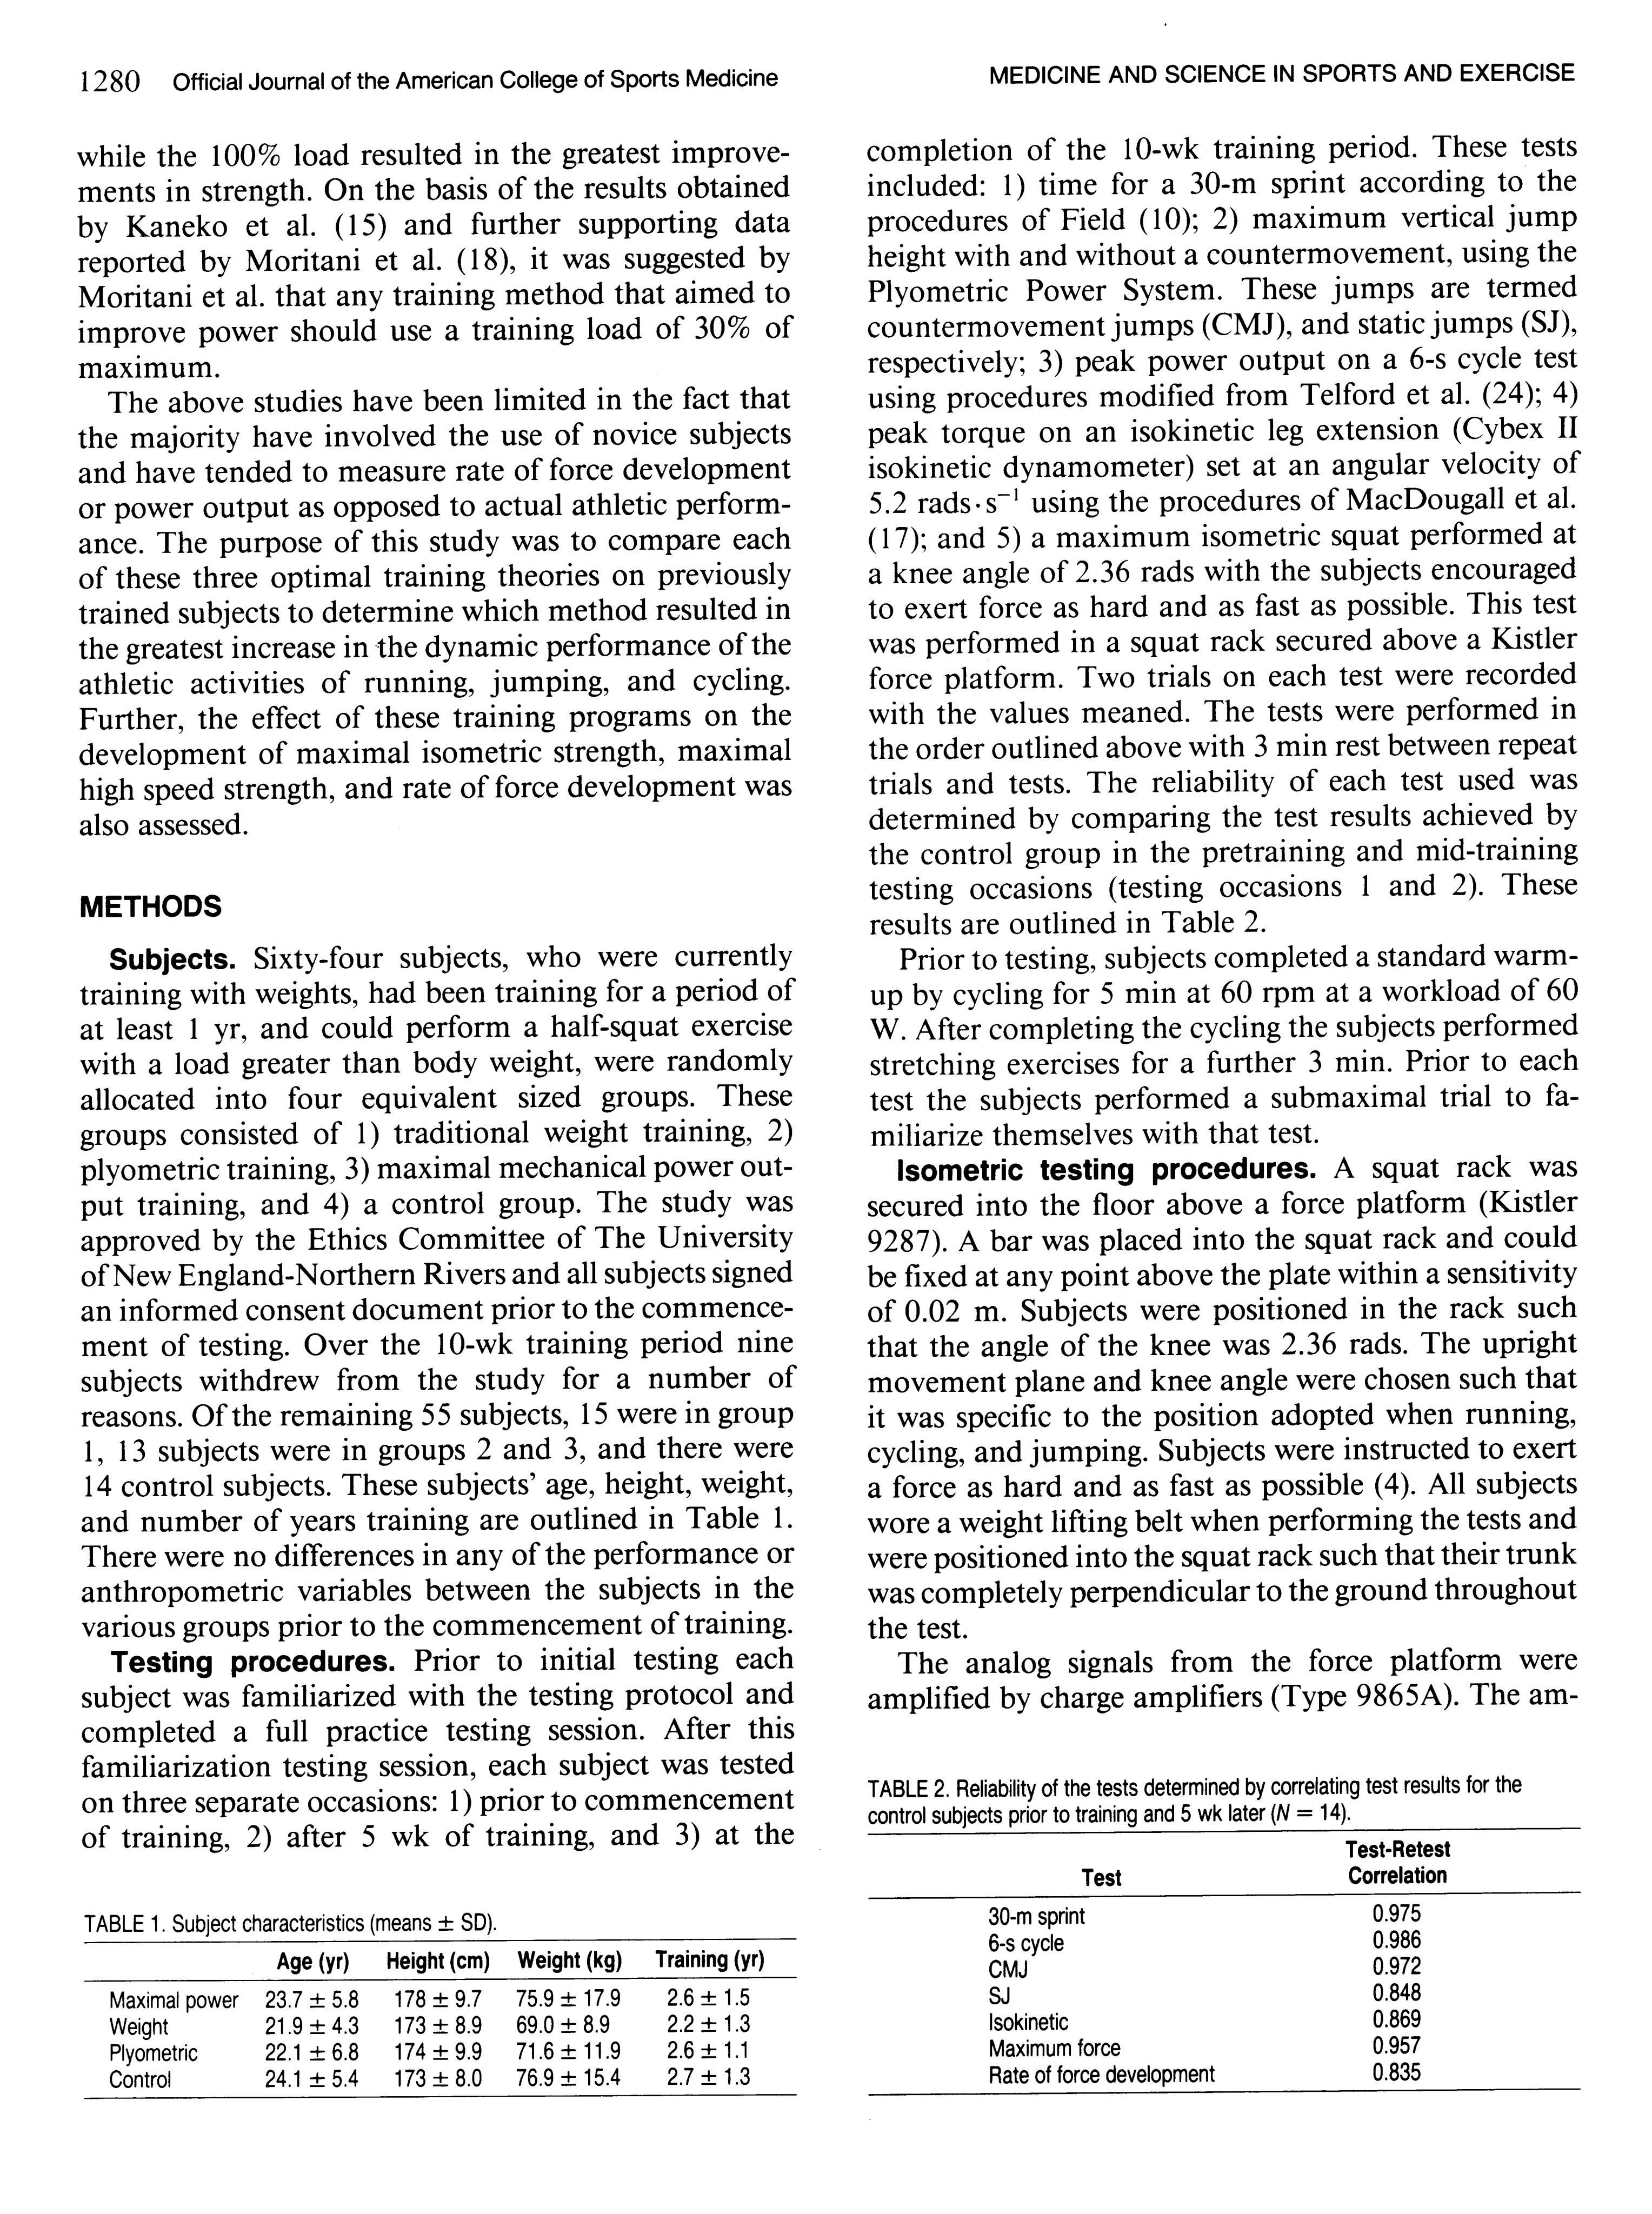
1280
Official
Journal
of
the
American
College
of
Sports
Medicine
while
the
100%
load
resulted
in
the
greatest
improve-
ments
in
strength.
On
the
basis
of
the
results
obtained
by
Kaneko
et
al.
(15)
and
further
supporting
data
reported
by
Moritani
et
al.
(18),
it
was
suggested
by
Moritani
et
al.
that
any
training
method
that
aimed
to
improve
power
should
use
a
training
load
of
30%
of
maximum.
The
above
studies
have
been
limited
in
the
fact
that
the
majority
have
involved
the
use
of
novice
subjects
and
have
tended
to
measure
rate
of
force
development
or
power
output
as
opposed
to
actual
athletic
perform-
ance.
The
purpose
of
this
study
was
to
compare
each
of
these
three
optimal
training
theories
on
previously
trained
subjects
to
determine
which
method
resulted
in
the
greatest
increase
in
the
dynamic
performance
of
the
athletic
activities
of
running,
jumping,
and
cycling.
Further,
the
effect
of
these
training
programs
on
the
development
of
maximal
isometric
strength,
maximal
high
speed
strength,
and
rate
of
force
development
was
also
assessed.
METHODS
Subjects.
Sixty-four
subjects,
who
were
currently
training
with
weights,
had
been
training
for
a
period
of
at
least
1
yr,
and
could
perform
a
half-squat
exercise
with
a
load
greater
than
body
weight,
were
randomly
allocated
into
four
equivalent
sized
groups.
These
groups
consisted
of
1)
traditional
weight
training,
2)
plyometric
training,
3)
maximal
mechanical
power
out-
put
training,
and
4)
a
control
group.
The
study
was
approved
by
the
Ethics
Committee
of
The
University
of
New
England-Northern
Rivers
and
all
subjects
signed
an
informed
consent
document
prior
to
the
commence-
ment
of
testing.
Over
the
10-wk
training
period
nine
subjects
withdrew
from
the
study
for
a
number
of
reasons.
Of
the
remaining
55
subjects,
15
were
in
group
1,
13
subjects
were
in
groups
2
and
3,
and
there
were
14
control
subjects.
These
subjects’
age,
height,
weight,
and
number
of
years
training
are
outlined
in
Table
1.
There
were
no
differences
in
any
of
the
performance
or
anthropometric
variables
between
the
subjects
in
the
various
groups
prior
to
the
commencement
of
training.
Testing
procedures.
Prior
to
initial
testing
each
subject
was
familiarized
with
the
testing
protocol
and
completed
a
full
practice
testing
session.
After
this
familiarization
testing
session,
each
subject
was
tested
on
three
separate
occasions:
1)
prior
to
commencement
of
training,
2)
after 5
wk
of
training,
and
3)
at
the
TABLE
1.
Subject
characteristics
(means
+
SD).
Age
(yr)
Height(cm)
Weight(kg)
Training
(yr)
Maximal
power
23.7458
178+97
759+17.9
2.6+1.5
Weight
219+43
173+89
69.0489
2.2+1.3
Plyometric
22.1+68
174+99
7164119
2.6
+
1.1
Control
241454
173+80
7694154
27+1.3
MEDICINE
AND
SCIENCE
IN
SPORTS
AND
EXERCISE
completion
of
the
10-wk
training
period.
These
tests
included:
1)
time
for
a
30-m
sprint
according
to
the
procedures
of
Field
(10);
2)
maximum
vertical
jump
height
with
and
without
a
countermovement,
using
the
Plyometric
Power
System.
These
jumps
are
termed
countermovement
jumps
(CMJ),
and
static
jumps
(SJ),
respectively;
3)
peak
power
output
on
a
6-s
cycle
test
using
procedures
modified
from
Telford
et
al.
(24);
4)
peak
torque
on
an
isokinetic
leg
extension
(Cybex
II
isokinetic
dynamometer)
set
at
an
angular
velocity
of
5.2
rads-s~!
using
the
procedures
of
MacDougall
et
al.
(17);
and
5)
a
maximum
isometric
squat
performed
at
a
knee
angle
of
2.36
rads
with
the
subjects
encouraged
to
exert
force
as
hard
and
as
fast
as
possible.
This
test
was
performed
in
a
squat
rack
secured
above
a
Kistler
force
platform.
Two
trials
on
each
test
were
recorded
with
the
values
meaned.
The
tests
were
performed
in
the
order
outlined
above
with
3
min
rest
between
repeat
trials
and
tests.
The
reliability
of
each
test
used
was
determined
by
comparing
the
test
results
achieved
by
the
control
group
in
the
pretraining
and
mid-training
testing
occasions
(testing
occasions
1
and
2).
These
results
are
outlined
in
Table
2.
Prior
to
testing,
subjects
completed
a
standard
warm-
up
by
cycling
for
5
min
at
60
rpm
at
a
workload
of
60
W.
After
completing
the
cycling
the
subjects
performed
stretching
exercises
for
a
further
3
min.
Prior
to
each
test
the
subjects
performed
a
submaximal
trial
to
fa-
miliarize
themselves
with
that
test.
Isometric
testing
procedures.
A
squat
rack
was
secured
into
the
floor
above
a
force
platform
(Kistler
9287).
A
bar
was
placed
into
the
squat
rack
and
could
be
fixed
at
any
point
above
the
plate
within
sensitivity
of
0.02
m.
Subjects
were
positioned
in
the
rack
such
that
the
angle
of
the
knee
was
2.36
rads.
The
upright
movement
plane
and
knee
angle
were
chosen
such
that
it
was
specific
to
the
position
adopted
when
running,
cycling,
and
jumping.
Subjects
were
instructed
to
exert
a
force
as
hard
and
as
fast
as
possible
(4).
All
subjects
wore
a
weight
lifting
belt
when
performing
the
tests
and
were
positioned
into
the
squat
rack
such
that
their
trunk
was
completely
perpendicular
to
the
ground
throughout
the
test.
The
analog
signals
from
the
force
platform
were
amplified
by
charge
amplifiers
(Type
9865A).
The
am-
TABLE
2.
Reliability
of
the
tests
determined
by
correlating
test
results
for
the
control
subjects
prior
to
training
and
5
wk
later
(N
=
14).
Test-Retest
Test
Correlation
30-m
sprint
0.975
6-s
cycle
0.986
CMJ
0.972
SJ
0.848
Isokinetic
0.869
Maximum
force
0.957
Rate
of
force
development
0.835
a
OPTIMAL
TRAINING
LOAD
plifiers
were
reset
to
zero
while
the
subject
was
standing
on
the
plate
to
negate
the
weight
of
the
subject.
The
recording
of
force
was
initiated
via
a
manual
trigger
just
prior
to
the
start
of
the
isometric
contraction,
recording
4
s
of
analog
input.
The
data
were
sampled
at
a
rate
of
1000
Hz.
From
this
test
two
performance
variables
were
determined.
These
were
the
maximum
isometric
force
produced
and
the
maximum
rate
of
force
development
(26).
Vertical
jumping
procedures.
The
vertical
jumps
were
performed
in
a
new
testing
device
called
the
Plyometric
Power
System
(Plyopower
Technologies).
This
device
involves
subjects
jumping
in
a
weight
ma-
chine
with
a
4-kg
bar
secured
to
their
back.
The
ma-
chine
allows
only
vertical
movements
to
be
achieved
and
the
maximum
downward
range
of
movement
of
the
bar
during
the
jumps
can
be
limited
within
an
accuracy
of
0.02
m.
The
machine
was
connected
to
a
rotary
encoder
that
recorded
the
position
and
direction
of
the
bar
within
an
accuracy
of
0.0002
m.
This
infor-
mation
was
recorded
by
a
computer
and
software
cal-
culated
the
work
done
(mass
X
gravity
<
height)
and
mean
power
output
(work/time).
The
system
was
cali-
brated
prior
to
use.
On
each
occasion
the
CMJ
test
was
performed
first.
This
involved
subjects
standing
erect,
quickly
perform-
ing
a
countermovement
and
jumping
for
maximal
height.
The
lowest
position
achieved
during
the
coun-
termovement
was
recorded
and
used
as
the
starting
position
for
the
SJ
test.
The
system
was
reset
for
the
SJ
test
such
that
the
bar
could
not
be
initially
moved
downward
prior
to
the
commencement
of
the
jump,
and
hence
the
jump
was
performed
without
use
of
a
countermovement.
The
Plyometric
Power
System
was
used
as
a
testing
device
to
eliminate
previously
identi-
fied
limitations
in
performing
vertical
jumps
using
a
force
platform
(16).
These
limitations
include
technique
|
modifications
between
the
CMJ
and
SJ
conditions
(2,12),
the
use
of
a
countermovement
when
performing
the
SJ
action
(12),
the
failure
of
subjects
to
take
off
and
land
using
similar
body
positions,
and
the
difficulty
in
ensuring
that
the
SJ
and
CMJ
are
performed
through
the
same
range
of
motion.
Training
procedures.
Subjects
in
the
three
experi-
mental
groups
trained
two
times
per
week
for
10
wk
using
their
various
training
methods.
Each
subject
per-
formed
three
to
six
sets
of
6-10
maximum
effort
repe-
titions
in
a
squat
movement;
however,
the
load
was
different
in
each
of
the
groups.
A
3-min
rest
interval
was
imposed
between
repeat
sets.
The
traditional
weight
training
group
trained
at
a
load
that
enabled
the
per-
formance
of
at
least
six
repetitions
but
no
more
than
10.
The
squats
were
performed
in
the
Plyometric
Power
System
using
a
range
of
motion
about
the
knee
which
corresponded
to
knee
angles
of
2.1
to
3.14
rads.
The
plyometric
training
group
performed
depth
jumps
for
Official
Journal
of
the
American
College
of
Sports
Medicine
1281
maximal
height
using
body
weight
as
the
load.
The
height
of
the
depth
jump
was
progressively
increased
throughout
the
training
period
such
that
subjects
started
the
training
period
from
a
drop
height
of
0.2
m
and
consistently
increased
the
height
to
finish
the
training
period
at
a
drop
height
of
0.8
m.
The
optimal
power
group
performed
weighted
jump
squats
at
the
load
that
maximized
mechanical
power
output.
The
jump
squats
were
performed
in
the
Ply-
ometric
Power
System
in
the
same
plane
and
range
of
motion
as
achieved
in
the
traditional
squat
and
ply-
ometric
exercises.
The
system
recorded
the
mean
power
output
for
each
repetition
performed
by
the
subjects.
The
load
for
each
set
was
modified
to
about
30%
of
maximum
isometric
force
level
until
the
power
was
maximized
for
the
subject.
This
load
was
used
as
the
training
load
and
constantly
modified
as
subjects
im-
proved
such
that
it
represented
the
load
that
maximized
muscular
power
for
each
training
session
throughout
the
10-wk
period.
In
addition
to
modifying
the
load
and
height
of
drop,
the
overload
imposed
on
each
experimental
group
was
progressively
increased
throughout
the
training
period
by
increasing
the
number
of
sets.
All
training
groups
performed
three
sets
for
the
first
two
training
weeks,
four
sets
at
week
3,
five
sets
at
week
4,
and
six
sets
from
weeks
5
through
to
the
end
of
the
10-wk
training
period.
The
control
group were
instructed
to
maintain
their
normal
day-to-day
activities
throughout
the
10-wk
period.
Statistical
analysis.
Prior
to
the
commencement
of
training,
each
group
was
statistically
compared
using
a
one-way
analysis
of
variance
(ANOVA).
This
provided
data
that
examined
whether
the
subjects
in
the
various
groups
differed
prior
to
training.
After
the
training
period
the
results
of
each
test
were
analyzed
by
a
two-
way
ANOVA
(4
groups
X
3
levels)
with
repeated
meas-
ures
on
one
factor
(testing
occasion).
If
a
significant
result
was
obtained
(P
<
0.05),
then
a
series
of
one
way
repeated
measures
ANOVA
tests
were
performed
in
combination
with
Fisher’s
PLSD
post-hoc
comparisons
to
identify
between
which
groups
and
at
what
testing
occasions
the
differences
occurred.
RESULTS
AND
DISCUSSION
Jumping
tests.
The
results
for
the
CMJ
and
SJ
tests
are
outlined
in
Table
3.
Prior
to
the
commencement
of
the
training,
the
results
of
the
vertical
jumping
tests
were
not
significantly
different
between
the
four
groups.
A
two-way
repeated
measures
ANOVA
revealed
signif-
icant
repeated
measures
and
interaction
effects
for
both
test
items.
On
further
statistical
analysis
it
was
observed
that
all
experimental
training
conditions
resulted
in
significant
improvements
in
CMJ
and
SJ
performance,
except
that
plyometric
training
had
no
significant
effect
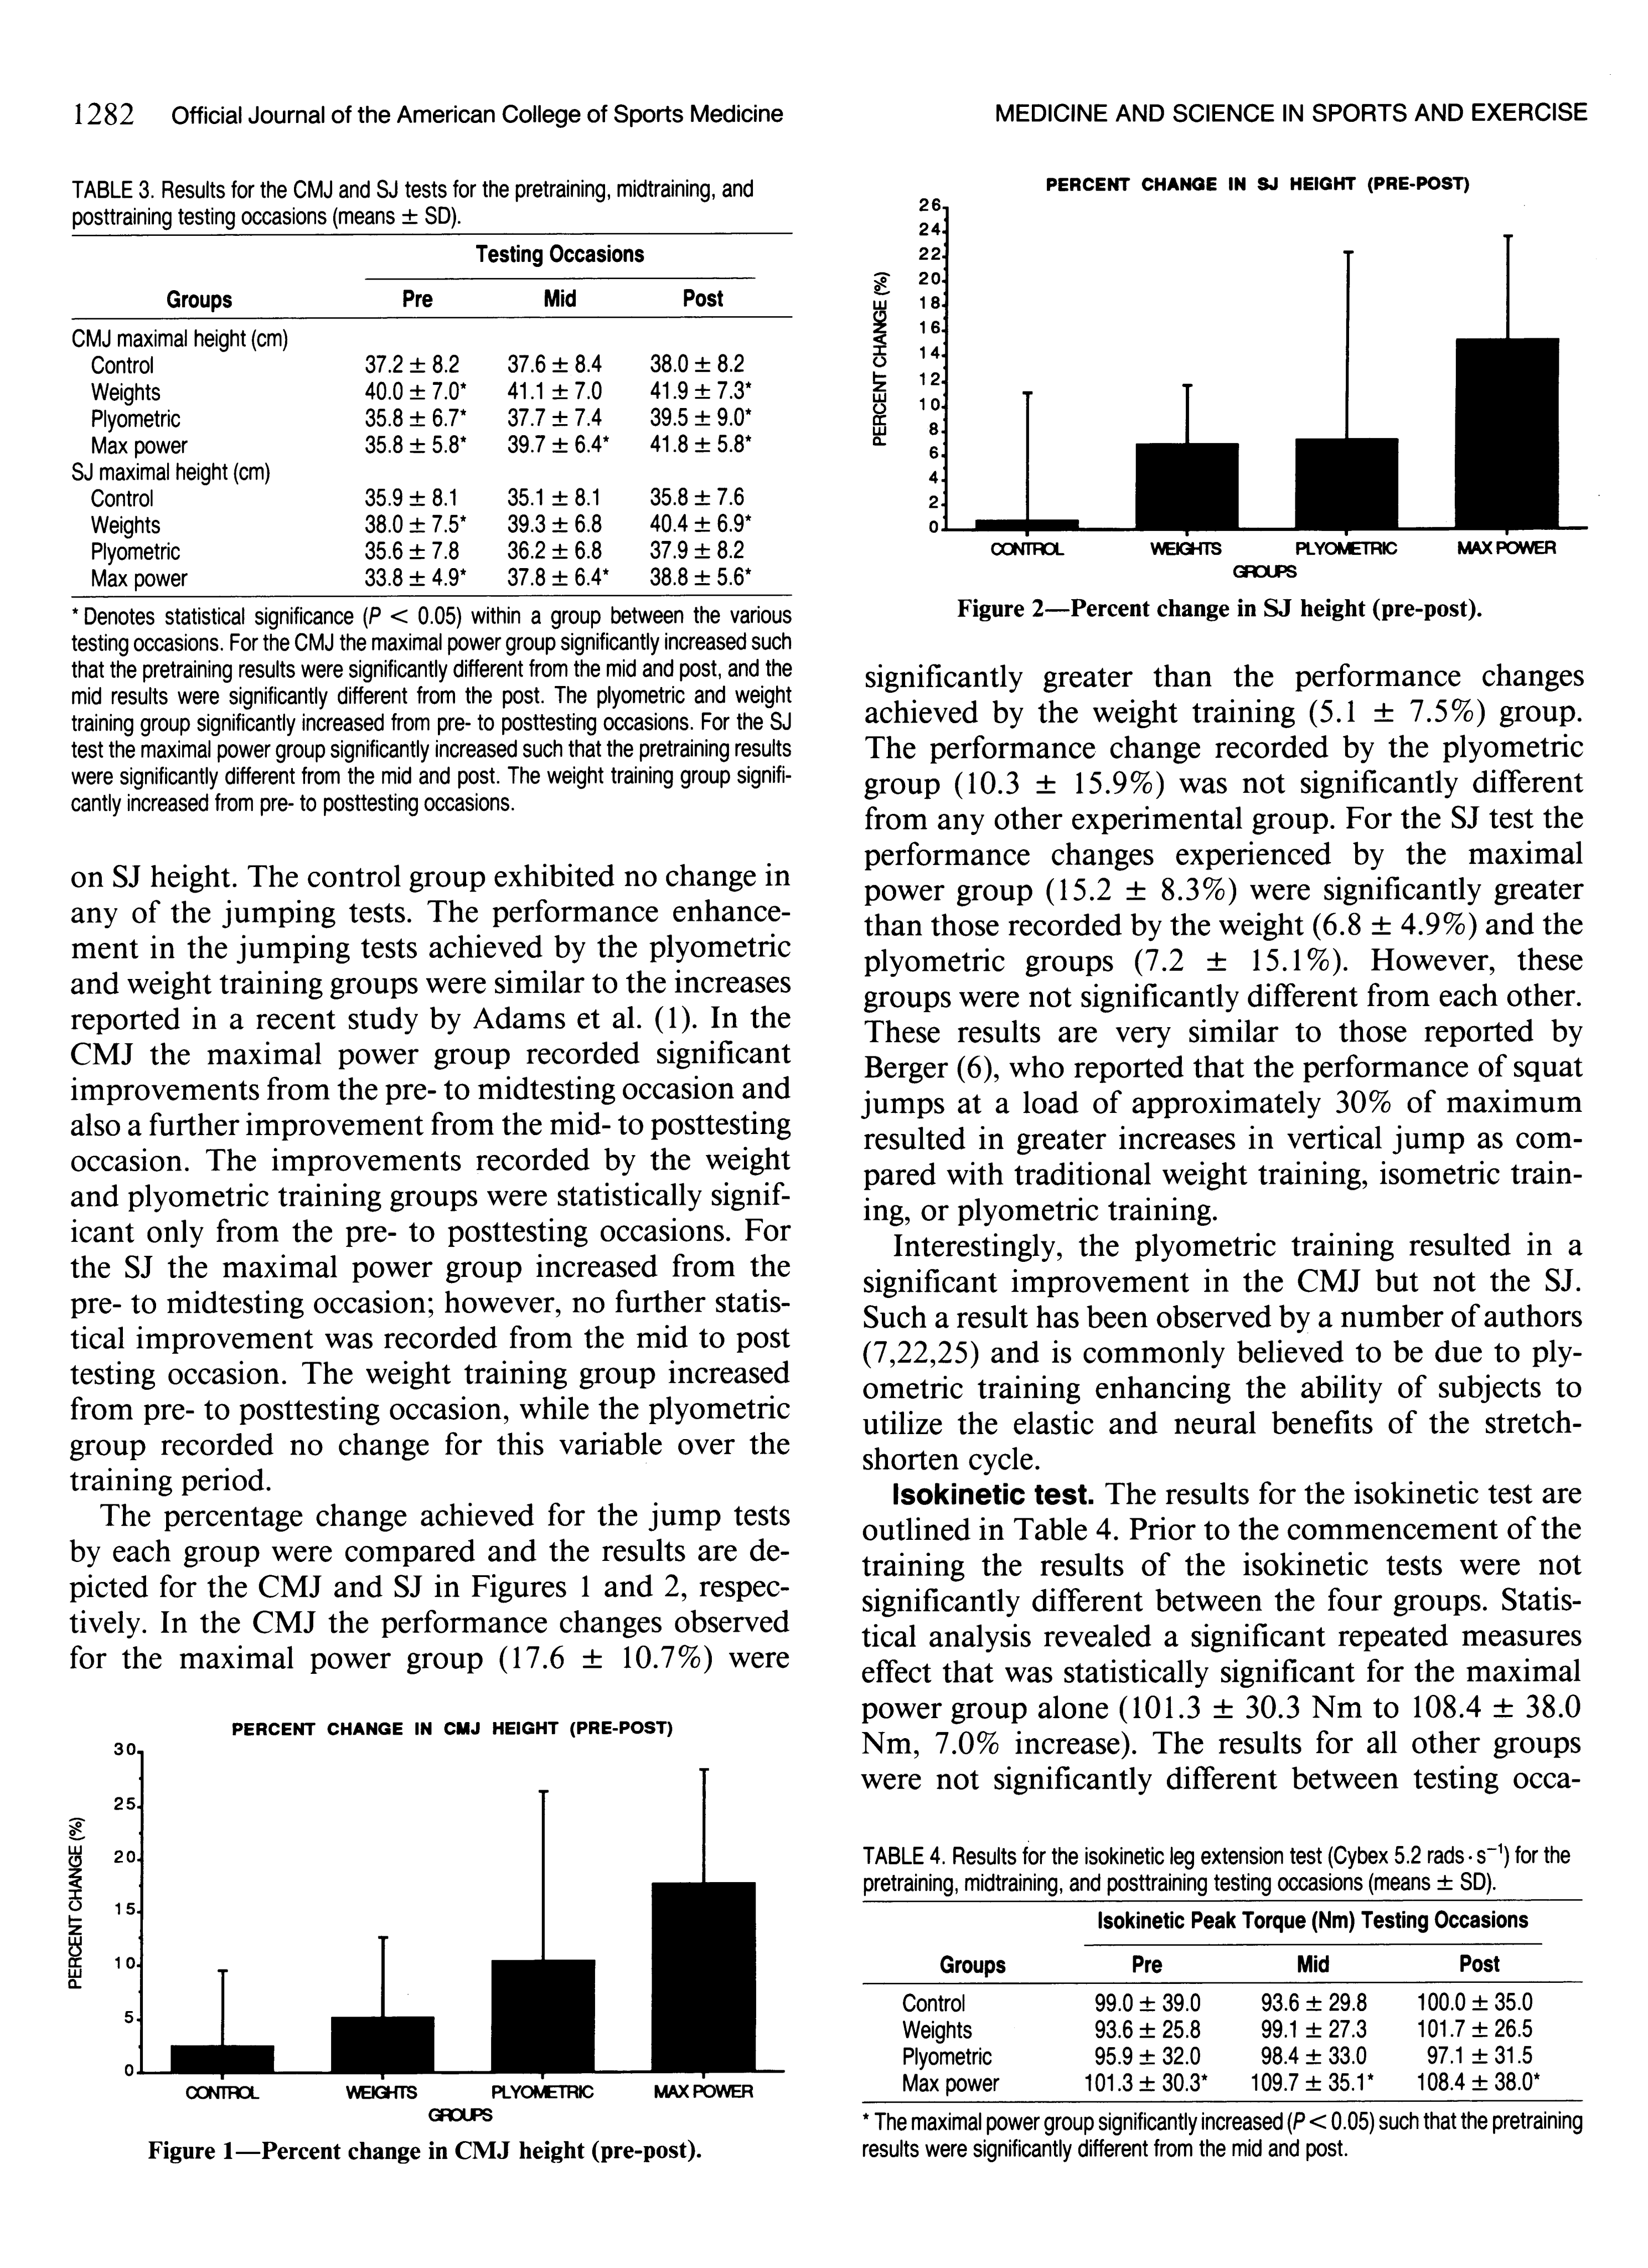
1282
Official
Journal
of
the
American
College
of
Sports
Medicine
TABLE
3.
Results
for
the
CMJ
and
SJ
tests
for
the
pretraining,
midtraining,
and
posttraining
testing
occasions
(means
+
SD).
Testing
Occasions
Groups
Pre
Mid
Post
CMJ
maximal
height
(cm)
Control
37.2
+
8.2
37.6
+
8.4
38.0
+
8.2
Weights
40.0+7.0*
411+7.0
41.9
+
7.3"
Plyometric
35.8+6.7*
37.7+7.4
39.5
+
9.0"
Max
power
35.8+5.8*
39.7+64*
418+5.8"
SJ
maximal
height
(cm)
Control
35.9
+
8.1
35.1
+
8.1
35.8
+
7.6
Weights
38.0+7.5*
39.3468
40.4
+
6.9"
Plyometric
35.6
+
7.8
36.2
+
6.8
37.9+82
Max
power
33.8+49* 378+64* 388+5.6°
*
Denotes
statistical
significance
(P
<
0.05)
within
a
group
between
the
various
testing
occasions.
For
the
CMJ
the
maximal
power
group
significantly
increased
such
that
the
pretraining
results
were
significantly
different
from
the
mid
and
post,
and
the
mid
results
were
significantly
different
from
the
post.
The
plyometric
and
weight
training
group
significantly
increased
from
pre-
to
posttesting
occasions.
For
the
SJ
test
the
maximal
power
group
significantly
increased
such
that
the
pretraining
results
were
significantly
different
from
the
mid
and
post.
The
weight
training
group
signifi-
cantly
increased
from
pre- to
posttesting
occasions.
on
SJ
height.
The
control
group
exhibited
no
change
in
any
of
the
jumping
tests.
The
performance
enhance-
ment
in
the
jumping
tests
achieved
by
the
plyometric
and
weight
training
groups
were
similar
to
the
increases
reported
in
a
recent
study
by
Adams
et
al.
(1).
In
the
CMJ
the
maximal
power
group
recorded
significant
improvements
from
the
pre-
to
midtesting
occasion
and
also
a
further
improvement
from
the
mid-
to
posttesting
occasion.
The
improvements
recorded
by
the
weight
and
plyometric
training
groups
were
statistically
signif-
icant
only
from
the
pre-
to
posttesting
occasions.
For
the
SJ
the
maximal
power
group
increased
from
the
pre-
to
midtesting
occasion;
however,
no
further
statis-
tical
improvement
was
recorded
from
the
mid
to
post
testing
occasion.
The
weight
training
group
increased
from
pre- to
posttesting
occasion,
while
the
plyometric
group
recorded
no
change
for
this
variable
over
the
training
period.
The
percentage
change
achieved
for
the
jump
tests
by
each
group
were
compared
and
the
results
are
de-
picted
for
the
CMJ
and
SJ
in
Figures
|
and
2,
respec-
tively.
In
the
CMJ
the
performance
changes
observed
for
the
maximal
power
group
(17.6
+
10.7%)
were
PERCENT
CHANGE
IN
CMJ
HEIGHT
(PRE-POST)
30
25
20
15
10
PERCENT
CHANGE
(%)
PLYOMETRIC
MAX
POWER
GROUPS
CONTROL
WEIGHTS
Figure
1—Percent
change
in
CMJ
height
(pre-post).
MEDICINE
AND
SCIENCE
IN
SPORTS
AND
EXERCISE
PERCENT
CHANGE
IN
SJ
HEIGHT
(PRE-POST)
26
24
22
20
18
16
14
12
10
PERCENT
CHANGE
(%)
OND
&
OD
MAX
POWER
PLYOMETRIC
GROUPS
CONTROL
WEIGHTS
Figure
2—Percent
change
in
SJ
height
(pre-post).
significantly
greater
than
the
performance
changes
achieved
by
the
weight
training
(5.1
+
7.5%)
group.
The
performance
change
recorded
by
the
plyometric
group
(10.3
+
15.9%)
was
not
significantly
different
from
any
other
experimental
group.
For
the
SJ
test
the
performance
changes
experienced
by
the
maximal
power
group
(15.2
+
8.3%)
were
significantly
greater
than
those
recorded
by
the
weight
(6.8
+
4.9%)
and
the
plyometric
groups
(7.2
+
15.1%).
However,
these
groups
were
not
significantly
different
from
each
other.
These
results
are
very
similar
to
those
reported
by
Berger
(6),
who
reported
that
the
performance
of
squat
jumps
at
a
load
of
approximately
30%
of
maximum
resulted
in
greater
increases
in
vertical
jump
as
com-
pared
with
traditional
weight
training,
isometric
train-
ing,
or
plyometric
training.
Interestingly,
the
plyometric
training
resulted
in
a
significant
improvement
in
the
CMJ
but
not
the
SJ.
Such
a
result
has
been
observed
by
a
number
of
authors
(7,22,25)
and
is
commonly
believed
to
be
due
to
ply-
ometric
training
enhancing
the
ability
of
subjects
to
utilize
the
elastic
and
neural
benefits
of
the
stretch-
shorten
cycle.
lsokinetic
test.
The
results
for
the
isokinetic
test
are
outlined
in
Table
4.
Prior
to
the
commencement
of
the
training
the
results
of
the
isokinetic
tests
were
not
significantly
different
between
the
four
groups.
Statis-
tical
analysis
revealed
a
significant
repeated
measures
effect
that
was
statistically
significant
for
the
maximal
power
group
alone
(101.3
+
30.3
Nm
to
108.4
+
38.0
Nm,
7.0%
increase).
The
results
for
all
other
groups
were
not
significantly
different
between
testing
occa-
TABLE
4.
Results
for
the
isokinetic
leg
extension
test
(Cybex
5.2
rads
-s~')
for
the
pretraining,
midtraining,
and
posttraining
testing
occasions
(means
+
SD).
Isokinetic
Peak
Torque
(Nm)
Testing
Occasions
Groups
Pre
Mid
Post
Control
99.0
+
39.0
93.6
+
29.8
100.0
+
35.0
Weights
93.6
+
25.8
99.1
+
27.3
101.7
+
26.5
Plyometric
95.9
+
32.0 98.4
+
33.0
97.1+
31.5
Max
power
101.34
30.3%
109.7+35.1*
1084+
38.0"
*
The
maximal
power
group
significantly
increased
(P
<
0.05)
such
that
the
pretraining
results
were
significantly
different
from
the
mid
and
post.
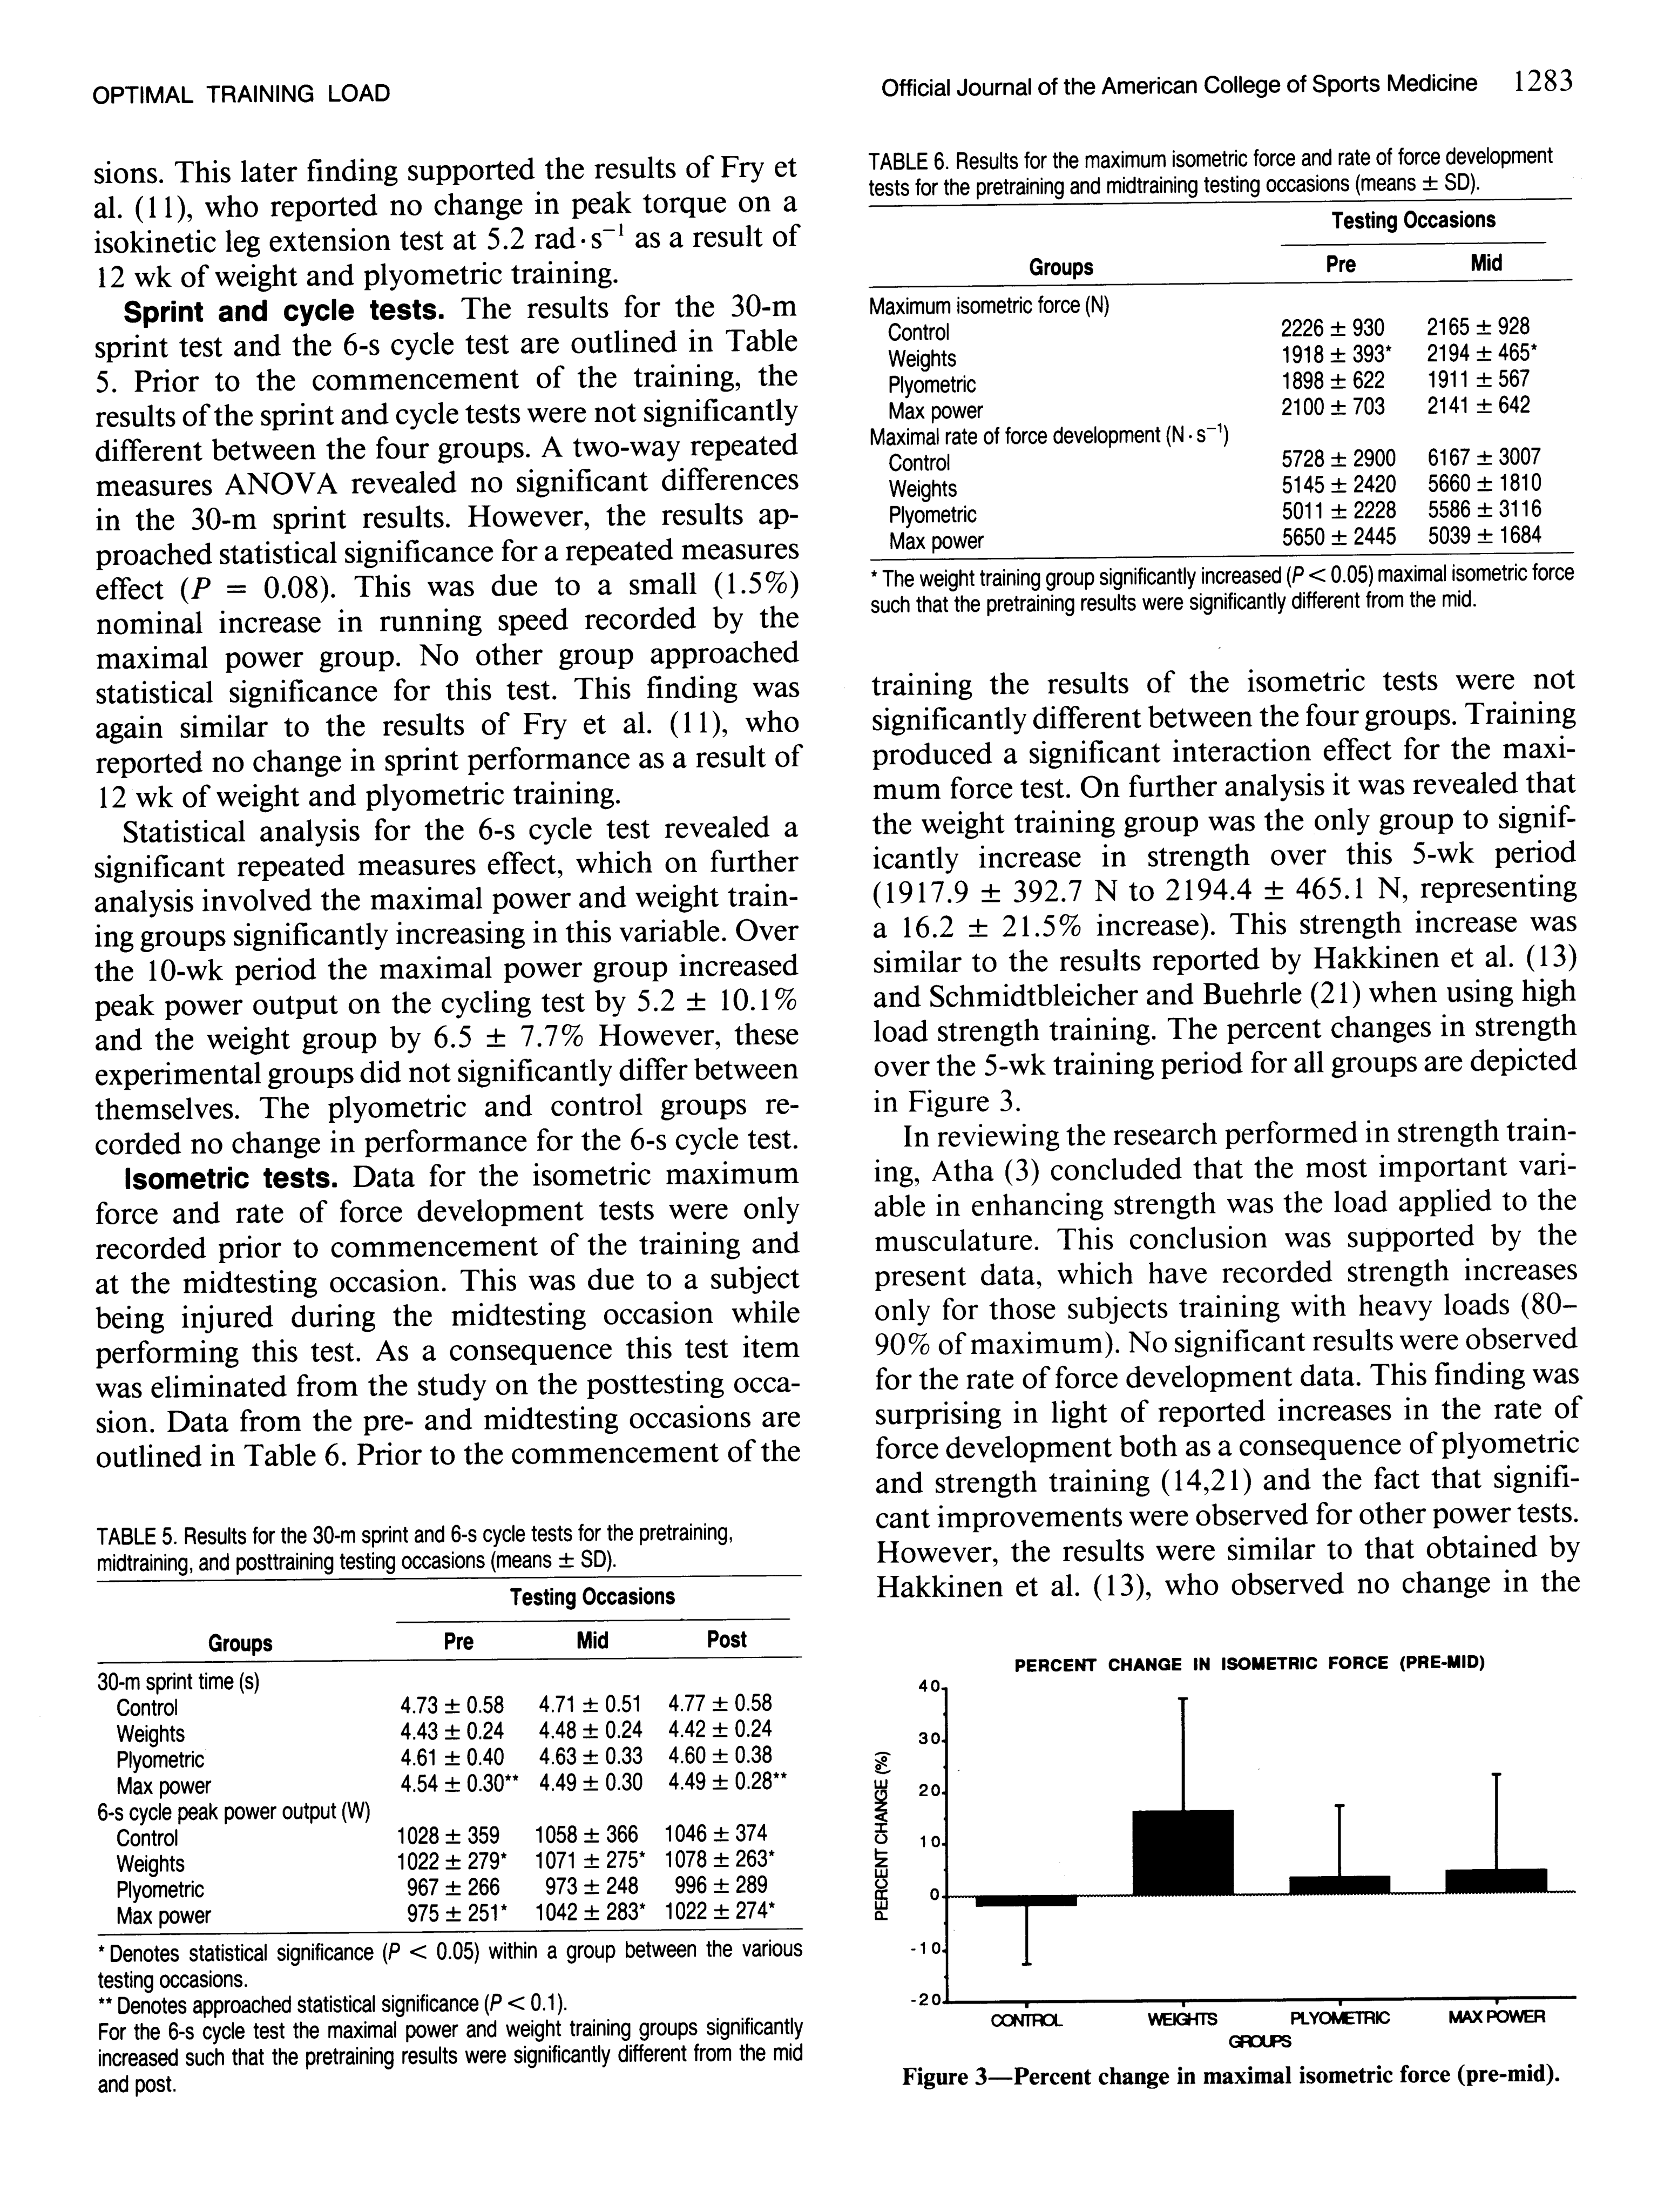
OPTIMAL
TRAINING
LOAD
sions.
This
later
finding
supported
the
results
of
Fry
et
al.
(11),
who
reported
no
change
in
peak
torque
on
a
isokinetic
leg
extension
test
at
5.2
rad-s'
as
a
result
of
12
wk
of
weight
and
plyometric
training.
Sprint
and
cycle
tests.
The
results
for
the
30-m
sprint
test
and
the
6-s
cycle
test
are
outlined
in
Table
5.
Prior
to
the
commencement
of
the
training,
the
results
of
the
sprint
and
cycle
tests
were
not
significantly
different
between
the
four
groups.
A
two-way
repeated
measures
ANOVA
revealed
no
significant
differences
in
the
30-m
sprint
results.
However,
the
results
ap-
proached
statistical
significance
for
a
repeated
measures
effect
(P
=
0.08).
This
was
due
to
a
small
(1.5%)
nominal
increase
in
running
speed
recorded
by
the
maximal
power
group.
No
other
group
approached
statistical
significance
for
this
test.
This
finding
was
again
similar
to
the
results
of
Fry
et
al.
(11),
who
reported
no
change
in
sprint
performance
as
a
result
of
12
wk
of
weight
and
plyometric
training.
Statistical
analysis
for
the
6-s
cycle
test
revealed
a
significant
repeated
measures
effect,
which
on
further
analysis
involved
the
maximal
power
and
weight
train-
ing
groups
significantly
increasing
in
this
variable.
Over
the
10-wk
period
the
maximal
power
group
increased
peak
power
output
on
the
cycling
test
by
5.2
+
10.1%
and
the
weight
group
by
6.5
+
7.7%
However,
these
experimental
groups
did
not
significantly
differ
between
themselves.
The
plyometric
and
control
groups
re-
corded
no
change
in
performance
for
the
6-s
cycle
test.
Isometric
tests.
Data
for
the
isometric
maximum
force
and
rate
of
force
development
tests
were
only
recorded
prior
to
commencement
of
the
training
and
at
the
midtesting
occasion.
This
was
due
to
a
subject
being
injured
during
the
midtesting
occasion
while
performing
this
test.
As
a
consequence
this
test
item
was
eliminated
from
the
study
on
the
posttesting
occa-
sion.
Data
from
the
pre-
and
midtesting
occasions
are
outlined
in
Table
6.
Prior
to
the
commencement
of
the
TABLE
5.
Results
for
the
30-m
sprint
and
6-s
cycle
tests
for
the
pretraining,
midtraining,
and
posttraining
testing
occasions
(means
+
SD).
Testing
Occasions
Groups
Pre
Mid
Post
30-m
sprint
time
(s)
Control
4734058
4714051
4.77+0.58
Weights
4434024
4484024
442+0.24
Plyometric
461+0.40
463+0.33
460+
0.38
Max
power
454+0.30%
449+030
449+
0.28"
6-s
cycle
peak
power
output
(W)
Control
1028+
359
1058+366
1046+
374
Weights
1022
+
279*
1071+
275*
1078
+
263°
Plyometric
967
+
266
973+
248
996
+
289
Max
power
975+
251*
1042+
283*
1022
+
274"
*Denotes
statistical
significance
(P
<
0.05)
within
a
group
between
the
various
testing
occasions.
**
Denotes
approached
statistical
significance
(P
<
0.1).
For
the
6-s
cycle
test
the
maximal
power
and
weight
training
groups
significantly
increased
such
that
the
pretraining
results
were
significantly
different
from
the
mid
and
post.
Official
Journal
of
the
American
College
of
Sports
Medicine
1283
TABLE
6.
Results
for
the
maximum
isometric
force
and
rate
of
force
development
tests
for
the
pretraining
and
midtraining
testing
occasions
(means
+
SD).
:
I
Testing
Occasions
Groups
Pre
Mid
Maximum
isometric
force
(N)
Control
2226+
930
2165+
928
Weights
1918
+
393*
2194
+
465"
Plyometric
1898+
622
1911+
567
Max
power
2100+
703
2141+
642
Maximal
rate
of
force
development
(N-
s~')
Control
5728
+
2900
6167
+
3007
Weights
5145
+
2420
5660
+
1810
Plyometric
5011+
2228
5586
+
3116
Max
power
5650
+
2445
5039
+
1684
*
The
weight
training
group
significantly
increased
(P
<
0.05)
maximal
isometric
force
such
that
the
pretraining
results
were
significantly
different
from
the
mid.
training
the
results
of
the isometric
tests
were
not
significantly
different
between
the
four
groups.
Training
produced
a
significant
interaction
effect
for
the
maxi-
mum
force
test.
On
further
analysis
it
was
revealed
that
the
weight
training
group
was
the
only
group
to
signif-
icantly
increase
in
strength
over
this
5-wk
period
(1917.9
+
392.7
N
to
2194.4
+
465.1
N,
representing
a
16.2
+
21.5%
increase).
This
strength
increase
was
similar
to
the
results
reported
by
Hakkinen
et
al.
(13)
and
Schmidtbleicher
and
Buehrle
(21)
when
using
high
load
strength
training.
The
percent
changes
in
strength
over
the
5-wk
training
period
for
all
groups
are
depicted
in
Figure
3.
In
reviewing
the
research
performed
in
strength
train-
ing,
Atha
(3)
concluded
that
the
most
important
varl-
able
in
enhancing
strength
was
the
load
applied
to
the
musculature.
This
conclusion
was
supported
by
the
present
data,
which
have
recorded
strength
increases
only
for
those
subjects
training
with
heavy
loads
(80-
90%
of
maximum).
No
significant
results
were
observed
for
the
rate
of
force
development
data.
This
finding
was
surprising
in
light
of
reported
increases
in
the
rate
of
force
development
both
as
a
consequence
of
plyometric
and
strength
training
(14,21)
and
the
fact
that
signifi-
cant
improvements
were
observed
for
other
power
tests.
However,
the
results
were
similar
to
that
obtained
by
Hakkinen
et
al.
(13),
who
observed
no
change
in
the
PERCENT
CHANGE
IN
ISOMETRIC
FORCE
(PRE-MID)
40
30
20
10
PERCENT
CHANGE
(%)
-10
-20
PLYOMETRIC
MAX
POWER
GROUPS
CONTROL
WEIGHTS
Figure
3—Percent
change
in
maximal
isometric
force
(pre-mid).
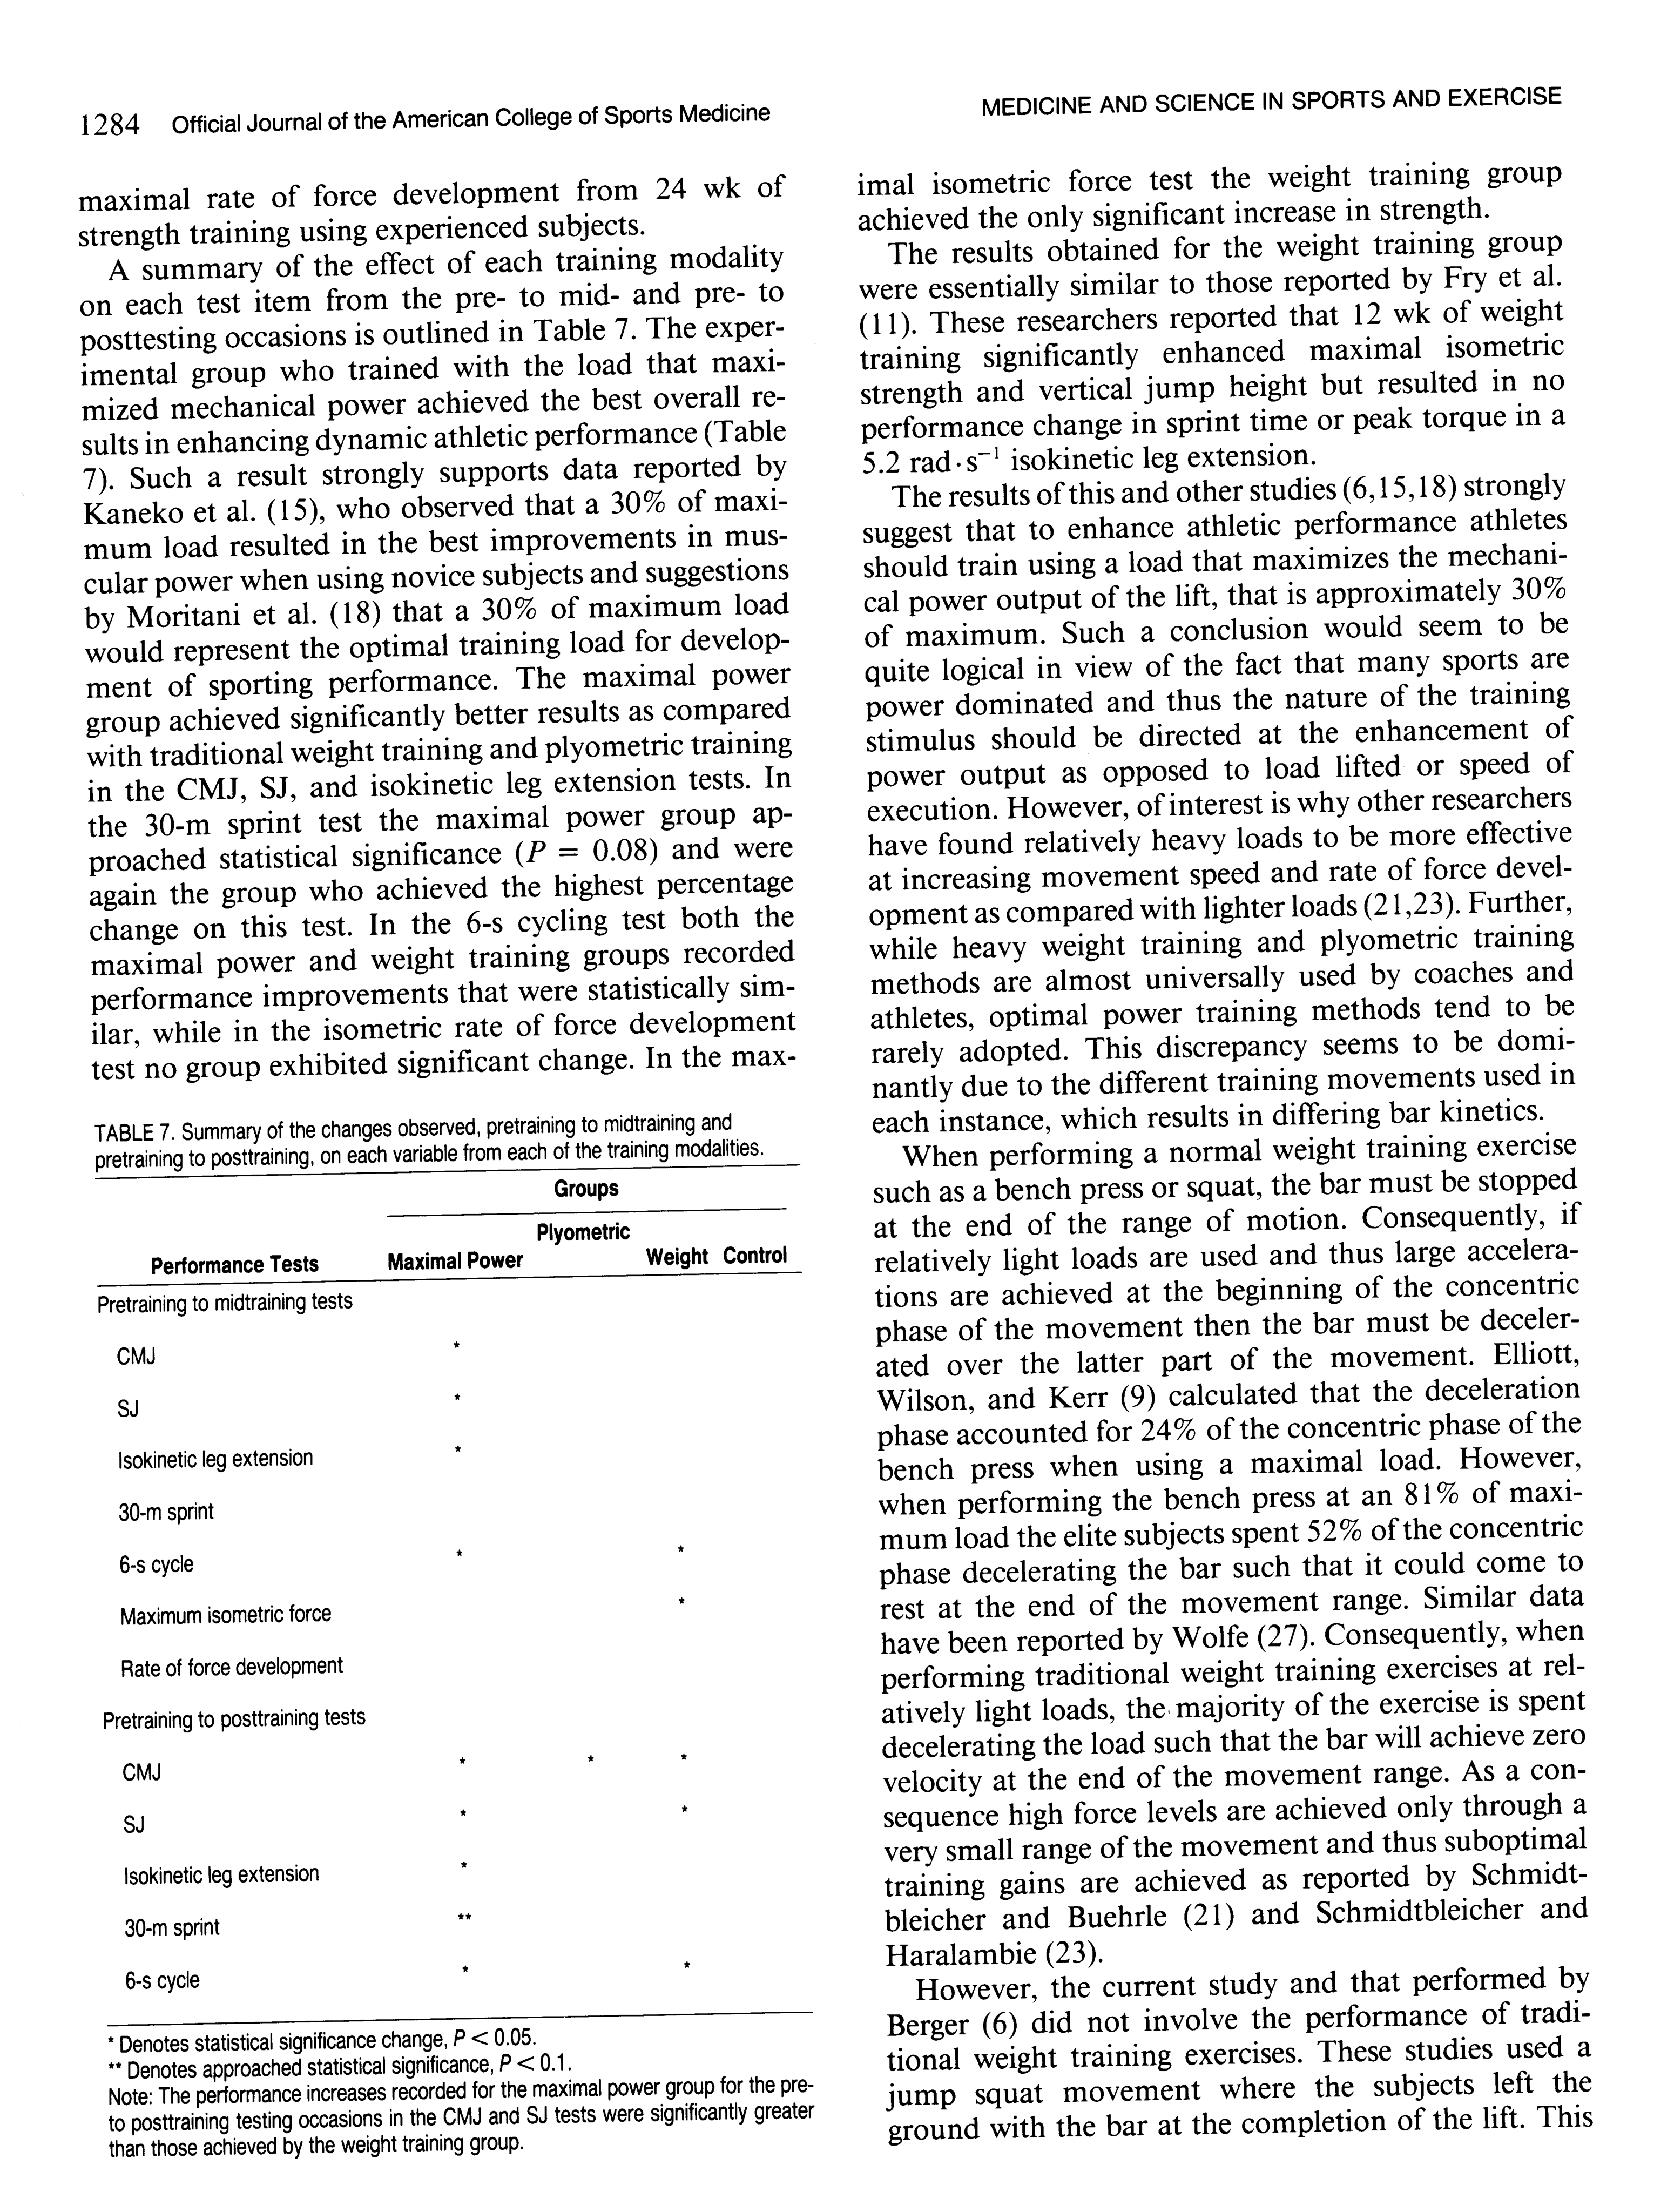
1284
Official
Journal
of
the
American
College
of
Sports
Medicine
maximal
rate
of
force
development
from
24
wk
of
strength
training
using
experienced
subjects.
A
summary
of
the
effect
of
each
training
modality
on
each
test
item
from
the
pre-
to
mid-
and
pre-
to
posttesting
occasions
1s
outlined
in
Table
7.
The
exper-
imental
group
who
trained
with
the
load
that
maxi-
mized
mechanical
power
achieved
the
best
overall
re-
sults
in
enhancing
dynamic
athletic
performance
(Table
7).
Such
a
result
strongly
supports
data
reported
by
Kaneko
et
al.
(15),
who
observed
that
a
30%
of
maxi-
mum
load
resulted
in
the
best
improvements
in
mus-
cular
power
when
using
novice
subjects
and
suggestions
by
Moritani
et
al.
(18)
that
a
30%
of
maximum
load
would
represent
the
optimal
training
load
for
develop-
ment
of
sporting
performance.
The
maximal
power
group
achieved
significantly
better
results
as
compared
with
traditional
weight
training
and
plyometric
training
in
the
CMJ,
SJ,
and
isokinetic
leg
extension
tests.
In
the
30-m
sprint
test
the
maximal
power
group
ap-
proached
statistical
significance
(P
=
0.08)
and
were
again
the
group
who
achieved
the
highest
percentage
change
on
this
test.
In
the
6-s
cycling
test
both
the
maximal
power
and
weight
training
groups
recorded
performance
improvements
that
were
statistically
sim-
ilar,
while
in
the
isometric
rate
of
force
development
test
no
group
exhibited
significant
change.
In
the
max-
TABLE
7.
Summary
of
the
changes
observed,
pretraining
to
midtraining
and
pretraining
to
posttraining,
on
each
variable
from
each
of
the
training
modalities.
Groups
Plyometric
Performance
Tests
Maximal
Power
Weight
Control
Pretraining
to
midtraining
tests
CMJ
*
SJ
*
lsokinetic
leg
extension
*
30-m
sprint
6-s
cycle
**
Maximum
isometric
force
*
Rate
of
force
development
Pretraining
to
posttraining
tests
CMJ
*
**
SJ
**
lsokinetic
leg
extension
30-m
sprint
*
*®
6-s
cycle
nn
*
Denotes
statistical
significance
change,
P
<
0.05.
**
Denotes
approached
statistical
significance,
P<0.1.
Note:
The
performance
increases
recorded
for
the
maximal
power
group
for
the
pre-
to
posttraining
testing
occasions
in
the
CMJ
and
SJ
tests
were
significantly
greater
than
those
achieved
by
the
weight
training
group.
MEDICINE
AND
SCIENCE
IN
SPORTS
AND
EXERCISE
imal
isometric
force
test
the
weight
training
group
achieved
the
only
significant
increase
in
strength.
The
results
obtained
for
the
weight
training
group
were
essentially
similar
to
those
reported
by
Fry
et
al.
(11).
These
researchers
reported
that
12
wk
of
weight
training
significantly
enhanced
maximal
isometric
strength
and
vertical
jump
height
but
resulted
in
no
performance
change
in
sprint
time
or
peak
torque
in
a
5.2
rad-s7!
isokinetic
leg
extension.
The
results
of
this
and
other
studies
(6,
15,18)
strongly
suggest
that
to
enhance
athletic
performance
athletes
should
train
using
a
load
that
maximizes
the
mechani-
cal
power
output
of
the
lift,
that
is
approximately
307%
of
maximum.
Such
a
conclusion
would
seem
to
be
quite
logical
in
view
of
the
fact
that
many
sports
are
power
dominated
and
thus
the
nature
of
the
training
stimulus
should
be
directed
at
the
enhancement
of
power
output
as
opposed
to
load
lifted
or
speed
of
execution.
However,
of
interest
is
why
other
researchers
have
found
relatively
heavy
loads
to
be
more
effective
at
increasing
movement
speed
and
rate
of
force
devel-
opment
as
compared
with
lighter
loads
(21,23).
Further,
while
heavy
weight
training
and
plyometric
training
methods
are
almost
universally
used
by
coaches
and
athletes,
optimal
power
training
methods
tend
to
be
rarely
adopted.
This
discrepancy
seems
to
be
domi-
nantly
due
to
the
different
training
movements
used
in
each
instance,
which
results
in
differing
bar
kinetics.
When
performing
a
normal
weight
training
exercise
such
as
a
bench
press
or
squat,
the
bar
must
be
stopped
at
the
end
of
the
range
of
motion.
Consequently,
if
relatively
light
loads
are
used
and
thus
large
accelera-
tions
are
achieved
at
the
beginning
of
the
concentric
phase
of
the
movement
then
the
bar
must
be
deceler-
ated
over
the
latter
part
of
the
movement.
Elliott,
Wilson,
and
Kerr
(9)
calculated
that
the
deceleration
phase
accounted
for
24%
of
the
concentric
phase
of
the
bench
press
when
using
a
maximal
load.
However,
when
performing
the
bench
press
at
an
81%
of
maxi-
mum
load
the
elite
subjects
spent
52%
of
the
concentric
phase
decelerating
the
bar
such
that
it
could
come
to
rest
at
the
end
of
the
movement
range.
Similar
data
have
been
reported
by
Wolfe
(27).
Consequently,
when
performing
traditional
weight
training
exercises
at
rel-
atively
light
loads,
the.
majority
of
the
exercise
1s
spent
decelerating
the
load
such
that
the
bar
will
achieve
zero
velocity
at
the
end
of
the
movement
range.
As
a
con-
sequence
high
force
levels
are
achieved
only
through
a
very
small
range
of
the
movement
and
thus
suboptimal
training
gains
are
achieved
as
reported
by
Schmidt-
bleicher
and
Buehrle
(21)
and
Schmidtbleicher
and
Haralambie
(23).
However,
the
current
study
and
that
performed
by
Berger
(6)
did
not
involve
the
performance
of
tradi-
tional
weight
training
exercises.
These
studies
used
a
jump
squat
movement
where
the
subjects
left
the
ground
with
the
bar
at
the
completion
of
the
lift.
This

OPTIMAL
TRAINING
LOAD
eliminated
the
deceleration
phase
as
the
bar
did
not
come
to
rest
at
the
completion
of
the
lift.
As
such
large
accelerations
and
forces
were
exerted
throughout
the
entire
movement
range
as
opposed
to
only
a
small
portion
of
the
range.
A
force-time
curve
for
a
repre-
sentative
subject
performing
a
jump
squat
exercise
is
depicted
in
Figure
4
and
clearly
shows
that
high
forces
are
exerted
throughout
the
entire
range
of
motion
and
hence
there
is
no
deceleration
phase
when
performing
this
type
of
exercise.
CONCLUSIONS
Traditional
weight
training
was
designed
in
essence
to
enhance
muscular
strength
and
it
is
seen
to
be
Jump
Squat
Force-Time
Data
A
Representative
Subject
2500
54
kg
load
2000
z
1500
2
5
4
1000
500
takeoff
0
0
0.2
0.4 0.6
0.8
1
1.2
"Time
(s)
Figure
4—Force-time
curve
from
a
representative
subject
performing
a
jump
squat
exercise
using
a
load
that
maximized
the
power
output
of
the
movement.
REFERENCES
1.
ADAMS,
K.,
J.
P.
O'SHEA,
K.
L.
O’SHEA,
and
M.
CLIMSTEIN.
The
effect
of
six
weeks
of
squat,
plyometric
and
squat-plyometric
training
on
power
production.
J.
Appl.
Sport
Sci.
Res.
6:36-41,
1992.
2.
ARUIN,
A.
S.,
B.
I.
PRILUTSKI,
L.
M.
RalTsIn,
and
I.
A.
SAVEL’EV.
Biomechanical
properties
of
muscle
and
efficiency
of
movement.
Hum.
Physiol.
5:426-434,
1979.
3.
ATHA,
J.
Strengthening
muscle.
Exerc.
Sport
Sci.
Rev.
9:1-74,
1981.
4.
BEMBEN,
M.
G.,
J.
L.
CLasey,
and
B.
H.
Massey.
The
effect
of
the
rate
of
muscle
contraction
on
the
force
time
parameters
of
male
and
female
subjects.
Res.
Q.
Exerc.
Sport
61:96-99,
1990.
5.
BERGER,
R.
A.
Optimum
repetitions
for
the
development
of
strength.
Res.
Q.
33:334-338,
1962.
6.
BERGER,
R.
A.
Effect
of
dynamic
and
static
training
on
vertical
jumping.
Res.
Q.
34:419-424,
1963.
7.
Bosco,
C.,
P.
V.
Komi,
M.
PULLI,
C.
PITTERS,
and
H.
MONTONEV.
Considerations
of
the
training
of
the
elastic
potential
of
human
skeletal
muscle.
Volleyball
Technical
Journal
6(3):75-80,
1982.
8.
CHU,
D.
A.
Jumping
into
Plyometrics.
Champaign
IL:
Leisure
Press,
1992,
pp.
1-4.
9.
ELLIoTT,
B.
C.,
G.
J.
WILSON,
and
G.
K.
KERR.
A
biomechanical
analysis
of
the
sticking
region
in
the
bench
press.
Med.
Sci.
Sports
Exerc.
21:450-462,
1989.
10.
FIELD,
W.
Control
tests
for
explosive
events.
Natl.
Strength
Cond.
Assoc.
J.
11:(6):63,
1989.
11.
Fry,
A.
C.,
W.
J.
KRAEMER,
C.
A.
WESEMAN,
et
al.
The
effect
of
an
off-season
strength
and
conditioning
program
on
starters
and
non-starters
in
women’s
intercollegiate
volleyball.
J.
App/.
Sport
Sci.
Res.
5:174-181,
1991.
12.
FUKASHIRO,
S.
and
P.
V.
Komi.
Joint
moment
and
mechanical
power
flow
of
the
lower
limb
during
vertical
jump.
Jnt.
J.
Sports
Med.
8:15-21,
1987.
Official
Journal
of
the
American
College
of
Sports Medicine
1285
effective
in
this
goal.
As
strength
is
related
to
power
(strength
X
speed),
it
will
also
serve
to
have
a
diminished
effect
on
power
and
thus
dynamic
athletic
performance.
Plyometric
training
was
designed
to
directly
enhance
muscular
power
and
thus
competitive
performance.
However,
typically
no
systematic
method
is
used
to
determine
the
optimal
load
for
plyometric
training.
In
fact,
plyometric
training
tends
to
be
performed
at
body
weight
only
as
it
is
a
convenient
load
to
use.
The
optimal
training
strategy
to
enhance
dynamic
athletic
performance
appears
to
be
a
hybrid
between
traditional
weight
training
and
plyometric
training.
That
is,
to
perform
dynamic
weight
training
at
the
load
that
max-
imizes
mechanical
power
output.
As
such,
weight
train-
ing
is
used
to
enhance
muscular
power
directly
rather
than
simply
increasing
muscular
strength.
To
enhance
dynamic
athletic
performance
several
training
strategies
can
be
used
and
will
be
effective
in
increasing
performance
in
at
least
some
activities.
How-
ever,
performance
gains
will
be
optimized
by
the
use
of
plyometric
weight
training
at
a
training
load
that
max-
imizes
the
mechanical
power
output
of
the
exercise.
This
research
was
funded
under
the
Applied
Sports
Research
Program
of
the
Australian
Sports
Commission.
Address
for
correspondence:
Dr.
Greg
J.
Wilson,
Centre
for
Human
Movement
Science
and
Sport
Management,
The
University
of
New
England-Northern
Rivers,
P.O.
Box
157,
Lismore,
2480
NSW
Aus-
tralia.
13.
HAKKINEN,
K.,
M.
ALEN,
and
P.
V.
Komi.
Electromyographic
and
muscle
fibre
characteristics
of
human
skeletal
muscle
during
strength
training
and
detraining.
Acta
Physiol.
Scand.
125:573-
585,
1985.
14.
HAKKINEN,
K.,
P.
V.
Komi,
and
M.
ALEN.
Effect
of
explosive
type
strength
training
on
isometric
force-
and
relaxation-time,
electromyographic
and
muscle
fibre
characteristics
of
leg
extensor
muscles.
Acta
Physiol.
Scand.
125:587-600,
1985.
15.
KANEKO,
M.,
T.
FucuiMoTo,
H.
Ton,
and
K.
Suet.
Training
effect
of
differing
loads
on
the
force-velocity
relationship
and
mechanical
power
output
in
human
muscle.
Scand.
J.
Sport
Sci.
5(2):50-55,
1983.
16.
Komi,
P.
V.
and
C.
Bosco.
Utilization
of
stored
energy
in
leg
extensor
muscles
by
men
and
women.
Med.
Sci.
Sports
10:261-
265,
1978.
17.
MACDOUGALL,
J.
D.,
H.
A.
WENGER,
and
H.
J.
GREEN,
Physio-
logical
Testing
of
the
Elite
Athlete.
Champaign,
IL:
Human
Kinetics,
1982,
pp.
7-37.
18.
MORITANI,
T.,
M.
Muro,
K.
IsHipa,
and
S.
TAGUCHI.
Electro-
physiological
analyses
of
the
effects
of
muscle
power
training.
Res.
J.
Phys.
Ed.
1:23-32,
1987.
19.
SALE,
D.
G.
Influence
of
exercise
and
training
on
motor
unit
activation.
Exerc.
Sport
Sci.
Rev.
K.
B.
Pandolf
(Ed.).
15:95-151,
1987.
20.
SCHMIDTBLEICHER,
D.
Muscular
mechanics
and
neuromuscular
control.
In:
Swimming
Sci.,
V
Int.
Series
Sport
Sci.
B.
E.
Unger-
echts,
K.
Wilke,
and
K.
Reischle
(Eds).
Champaign,
IL:
Human
Kinetics,
1988,
pp.
131-148.
21.
SCHMIDTBLEICHER,
D.
and
BUEHRLE,
M.
Neuronal
adaptations
and
increase
of
cross-sectional
area
studying
different
strength
training
methods.
In:
Biomechanics
X-B,
Vol.
6-B,
G.
B.
Johnson
(Ed.).
Champaign,
IL:
Human
Kinetics
Publishers,
1987,
pp.
615-620.
1286
Official
Journal
of
the
American
College
of
Sports
Medicine
22.
23.
SCHMIDTBLEICHER,
D.,
A.
GOLLHOFER,
and
U.
FRICK.
Effects
of
a
stretch-shortening
typed
training
on
the
performance
capability
and
innervation
characteristics
of
leg
extensor
muscles.
Biome-
chanics
XI-A,
Vol.
7-A,
G.
de
Groot,
et
al.
(Eds.).
Amsterdam:
Free
University
Press,
1988,
pp.
109-117.
SCHMIDTBLEICHER,
D.
and
G.
HARALAMBIE.
Changes
in
contract-
ile
properties
of
muscle
after
strength
training
in
man.
Eur.
J.
Appl.
Physiol.
46:221-228,
1981.
24.
TELFORD,
R.
D.,
B.
R.
MINIKIN,
L.
A.
Hooper,
A.
G.
HANH
and
D.
A.
MCTUMILTYE.
The
tri-level
fitness
profile.
Excel
4:11-13,
1987.
25.
26.
27.
MEDICINE
AND
SCIENCE
IN
SPORTS
AND
EXERCISE
VAN
LEEMPUTTE,
M.,
A.
J.
SPAEPEN,
E.
J.
WILLEMS,
and
V. V.
STIUINEN.
Influence
of
pre-stretch
on
arm
flexion.
Biomechanics
VII-A,
H. Matsui
and
K.
Kobayashi
(Eds.).
Champaign,
IL:
Human
Kinetics,
1983,
pp.
264-270.
VIITASALO,
J.,
S.
SAUKKONEN,
and
P.
V.
KoMI.
Reproducibility
of
measurements
of
selected
neuromuscular
performance
vari-
ables
in
man.
Electromyogr.
Clin.
Neurophysiol.
20:487-501,
1980.
Wo
tre,
M.
Muscles:
structure,
function
and
control.
In:
Strength
Training
by
the
Experts,
2nd
Ed.,
D.
P.
Riley
(Ed.).
New
York:
Leisure
Press,
1982,
pp.
27-41.

75
Journal of Strength and Conditioning Research, 2002, 16(1), 75–82
q2002 National Strength & Conditioning Association
The Effect of Heavy- Vs. Light-Load Jump Squats
on the Development of Strength, Power,
and Speed
JEFFREY M. M
C
BRIDE, TRAVIS TRIPLETT-M
C
BRIDE, ALLAN DAVIE,
AND
ROBERT U. NEWTON
Southern Cross University, School of Exercise Science and Sport Management, Lismore, NSW, Australia.
ABSTRACT
The purpose of this investigation was to examine the effect
of an 8-week training program with heavy- vs. light-load
jump squats on various physical performance measures and
electromyography (EMG). Twenty-six athletic men with
varying levels of resistance training experience performed
sessions of jump squats with either 30% (JS30, n59) or 80%
(JS80, n510) of their one repetition maximum in the squat
(1RM) or served as a control (C, n57). An agility test, 20-
m sprint, and jump squats with 30% (30J), 55% (55J), and
80% (80J) of their 1RM were performed before and after
training. Peak force, peak velocity (PV), peak power (PP),
jump height, and average EMG (concentric phase) were cal-
culated for the jumps. There were significant increases in PP
and PV in the 30J, 55J, and 80J for the JS30 group (p#0.05).
The JS30 group also significantly increased in the 1RM with
a trend towards improved 20-m sprint times. In contrast, the
JS80 group significantly increased both PF and PP in the 55J
and 80J and significantly increased in the 1RM but ran sig-
nificantly slower in the 20-m sprint. In the 30J the JS30
group’s percentage increase in EMG activity was signifi-
cantly different from the C group. In the 80J the JS80 group’s
percentage increase in EMG activity was significantly differ-
ent from the C group. This investigation indicates that train-
ing with light-load jump squats results in increased move-
ment velocity capabilities and that velocity-specific changes
in muscle activity may play a key role in this adaptation.
Key Words: EMG, jumping, sprinting, agility
Reference Data: McBride, J. M., T. Triplett-McBride, A.
Davie, and R. U. Newton. The effect of heavy- vs. light-
load jump squats on the development of strength,
power, and speed. J. Strength Cond. Res. 16(1):75–82.
2002.
Introduction
N
umerous studies have examined the effect of vol-
untary control of movement speed during weight
training and studies on the involvement of plyometric
training on power development (1, 14, 20, 21, 31). One
of the primary points of contention on the develop-
ment of power through resistance exercise has been
the type of loading to be used (23). According to Wil-
son et al. (30) there are 2 conflicting ideas: (a) the per-
ception that it is necessary to use heavy loads (80–
100% of one repetition maximum [1RM]) to induce re-
cruitment of high-threshold fast-twitch motor units on
the basis of the size principle (22, 24), and (b) to train
at a speed that is closer to the actual speed of dynamic
athletic performance movements (using light loads
[30–40% of maximal isometric force or 1RM]) to main-
tain training speed specificity and maximize mechan-
ical power output (15, 16, 19, 26). A few studies have
shown that greater improvements in maximal power
output and jumping using lighter loads (30–40% of
1RM) (15, 30). One study reported that heavy load
(80–100% of 1RM) training resulted in greater increas-
es in movement speed and rate of force development
over lighter load training (24). Thus, this issue remains
unresolved.
Behm and Sale (3) have proposed that it is the in-
tention to move a given load quickly and not the actual
load that determines the training response. On the ba-
sis of the size principle of motor unit recruitment it is
suggested that training with lighter loads does not re-
sult in the generation of forces high enough to cause
sufficient muscle recruitment (22). Therefore, Behm
and Sale (3) suggest that attempting to move a heavy
load quickly may be the best method for improving
speed-strength related movements and thus dynamic
athletic performance. However, the study by Behm and
Sale (3) is in contrast to other studies that found no
effect of isometric or low-velocity concentric training
on high-velocity strength (15, 17, 19). However, these
investigations did not ask the subjects to accelerate the
resistance as quickly as possible. No known investi-
gations have compared heavy and light load training
in which each group attempted to move the weight as
fast as possible without a significant deceleration
phase as occurs in traditional weight training.

76 McBride, Triplett-McBride, Davie, and Newton
Table 1. Subject characteristics.†
JS30 (n59)
Pre Post
JS80 (n510)
Pre Post
C(n57)
Pre Post
Age (y)
Height (cm)
Weight (kg)
Body fat (%)
Thigh girth (cm)
24.2 61.8
181.7 63.5
84.4 64.6
11.7 61.2
56.2 61.8
—
—
84.6 64.7
11.1 61.1
56.6 61.9
21.6 60.8
179.5 62.0
80.5 63.8
10.7 61.5
54.5 61.6
—
—
80.6 63.9
10.8 61.6
55.5 61.4*
22.3 61.8
176.5 63.0
79.1 64.2
12.5 62.4
55.2 61.4
—
—
81.1 63.7
13.5 62.4
55.8 61.0
† Values represent mean 6SE.Pre5before training; post 5after training; JS30 5jump squats at 30% of 1 repetition
maximum (1RM); JS80 5jump squats at 80% of 1RM; C 5control.
* Significant difference from Pre to Post for that group (p#0.05).
Adaptation of the nervous system mediating in-
creases in muscle power has been investigated, indi-
cating a differential response as to the changes ob-
served with increasing muscle strength (8). It has been
suggested that explosive movements typically used for
the development of power result in high-frequency
discharge of involved motor units and selective re-
cruitment of high-threshold motor units in compari-
son with slow movements (4, 6, 11). The differences in
the development of strength and power are supported
by observation of electromyography (EMG)-force
curves associated with different types of training (7,
10). Some evidence exists for velocity-specific changes
in EMG, indicating the possible differential response
of the nervous system to changes in muscle strength
vs. muscle power (8). The previously mentioned factor
of the intention to move quickly in a given movement
may play a vital role in this type of adaptation (3).
However, the speed at which a movement is performed
may also result in differential nervous system adap-
tation. Therefore, the purpose of this investigation was
to compare heavy- vs. light-load explosive resistance
training (jump squats) and their effect on both vertical-
and horizontal-plane physical performance measures
and associated changes in muscle activity (EMG).
Methods
Subjects
This study involved a total of 26 male athletic subjects
between the ages of 18 and 30 with 2 to 4 years of
resistance training experience. Most subjects were also
involved in some type of club-level sporting activities.
Subjects were chosen that were not taking, and had
not previously taken, anabolic steroids, growth hor-
mone, or related performance-enhancement drugs of
any kind. However, individuals were not eliminated if
taking vitamins, minerals, or related natural supple-
ments (other than creatine monohydrate). Each subject
was required to fill out a medical history questionnaire
that was, if needed, screened by a physician to elimi-
nate individuals with contraindications for participat-
ing in the investigation. Prior approval by the Ethics
Committee of Southern Cross University was obtained
for this experiment. All subjects were informed of any
risks associated with participation in the study and
signed an informed consent document before any of
the testing.
Study Design
This was a longitudinal study involving 3 groups (Ta-
ble 1). Two treatment groups performed jump squats
using either 30% (JS30) or 80% (JS80) of their previ-
ously determined 1RM in the squat exercise. The third
group served as controls (C). Subjects were matched
and assigned to a group on the basis of their 1RM
squat-to-body weight ratio, ensuring that the average
for each group was not significantly different. There
were 2 testing periods lasting approximately 2 weeks
separated by an 8-week training phase. The testing pe-
riods involved 2 separate days of testing (day 1 and
day 2). Day 1 involved body composition testing, an
agility T-test, and a 20-m sprint. On day 2 a 1RM squat
test and jump squat testing were performed. EMG was
utilized during the 1RM and jump squat testing. Be-
fore each testing session subjects rode a stationary bike
for 5 minutes at a standard light resistance setting (105
W, Monark Bicycle Ergometer, Monark-Crescent AB,
Varberg, Sweden). Approximately 2 minutes later the
testing began. Reliability data was collected for certain
dependent variables 1 month before testing on a sep-
arate group of subjects not related to this investigation.
Intraclass coefficient and technical error data is sup-
plied with dependent variables below.
Training Protocol
All training was performed using a Smith machine
similar to what has been previously described (30).
This Smith machine was fitted with a braking system
that minimized the eccentric load during the jump-
squat training. In addition, a position transducer (Ce-
lesco Transducer Products, Chatsworth, CA) was at-
tached to the bar to record bar displacement. The dis-
placement measurements were used to determine

Strength, Power, and Speed
77
peak power (PP) output, jump height (JH), and work
for each repetition using a computer program written
in Visual Basic (Microsoft Corporation, Seattle, WA).
The training phase for the 2 treatment groups involved
a one-on-one supervised workout twice per week.
Both groups performed a warm-up stationary bike
ride for 5 minutes at a standard light resistance setting
(105 W, Monark Bicycle Ergometer). Approximately 2
minutes later the training began. The JS30 group then
performed 1 warm-up set of jump squats of 6 repeti-
tions with the bar (25 kg). The JS30 group then pro-
ceeded to perform a series of 5 sets of jump squats
with 30% of their 1RM. The JS80 group performed 2
warm-up sets of jump squats, one with the bar and
then another with 50% of their 1RM. In each warm-
up set they performed 6 repetitions. The JS80 group
then performed a series of 4 sets of jump squats with
80% of their 1RM. The number of sets for each group
was chosen in an attempt to equate overall work loads
at the end of the training period. The number of rep-
etitions performed in each set after the warm-up sets
was determined by a decrease in PP output of 15%.
The cutoff level of 15% was chosen as an arbitrary
point corresponding to a significant decrease in bar
velocity consistent between both groups. Three min-
utes of rest was allowed between every set. Each rep-
etition was performed by squatting to a knee angle of
808and then exploding upwards and jumping to a
maximal height. Subjects moved the bar as quickly as
possible for each and every repetition, exerting as
much force as possible as quickly as possible. The C
group performed no additional training and were told
to maintain their usual daily activity regimen between
the testing periods. The 3 groups were instructed not
to perform any specific explosive lower body training,
sprinting, or jumping other than the training they had
already been involved with as part of their ongoing
athletic activities. Lower body activity logs were ob-
tained from all the subjects to ensure that lower body
activity patterns remained constant.
1RM Testing
This test was modified slightly from established pro-
tocols previously described (27). This test was per-
formed using a standard Smith machine. A number of
warm-up trials were given in the 1RM test protocol
using 30% (8–10 repetitions), 50% (4–6 repetitions),
70% (2–4 repetitions), and 90% (1 repetition) of an es-
timated 1RM either from the subject’s recommendation
or 2–2.5 times the subject’s body weight. From this
point the weights were increased to a point where the
individual had 3–4 maximal efforts to determine the
1RM (ICC [intraclass correlation coefficient] 50.998,
%TEM [technical error of measure percentage] 51.66).
Each subject was asked to lower the bar to the point
where the knee angle was 808, which was marked by
adjustable stoppers. Adequate rest was allowed be-
tween trials (3–5 minutes).
Jump-Squat Testing
This testing involved performing a jump squat in a
standard Smith machine over a force plate (Kistler
type 9287, Kistler Instrument Corporation, Amherst,
MA) with a position transducer (Celesco Transducer
Products) attached to the bar. Two warm-up trial
jumps, with only the bar, were completed. Test loads
of 30% (30J), 55% (55J), and 80% (80J) of the individ-
ual’s 1RM were used. Performance of the jump squat
involved a rapid but controlled lowering of the bar to
a knee angle of 808, which was marked by adjustable
stoppers. They were told when they reached the bot-
tom portion of the movement to immediately acceler-
ate upwards as fast as possible, attempting to jump for
maximum height (JS30, ICC 50.625, %TEM 55.89)
(JS55, ICC 50.933, %TEM 54.67) (JS80, ICC 50.955,
%TEM 54.69). Two trials were performed for the
jump squat at each given load, preceded by 4 warm-
up trials with only the bar (25 kg). The force and dis-
placement measurements were used to determine
peak force (PF), peak velocity (PV) and PP output us-
ing a computer program (Visual Basic) applying stan-
dard biomechanical methods. The ICC for the calcu-
lation PF, PV, and PP are 0.989 (%TEM 52.68), 0.560
(%TEM 52.93), and 0.936 (%TEM 56.14) respective-
ly.
Electromyography
EMG was used during the 1 RM, 30J, 55J, and 80J. A
silver/silver chloride preamplified surface electrode
module (Quantec, Brisbane, Australia) was attached
over the belly of the vastus lateralis muscle distal to
the motor point. Each module contained 2 active elec-
trodes and 1 reference electrode equidistant at 2 cm.
All modules were appropriately applied to the target
muscle with active electrodes aligned parallel to the
muscle fibers. Electrode placement was carefully mea-
sured and marked to ensure placement in the exact
same position for both before-training (Pre) and after-
training (Post) testing. This laboratory has previously
reported high levels of interday reliability for inte-
grated EMG measurements (28). The amplified myo-
electric signal was recorded using a computer and an-
alog-to-digital card (C10-DAS80, Computer Boards,
Mansfield, MA) and stored on a computer disk for lat-
er analysis. Average EMG (mv) for the 1RM and the
jump squats (30J, 55J, 80J) was calculated by full-wave
rectification and averaged over the concentric phase.
Agility T-Test and 20-M Sprint
The agility T-test (AGT) involved a series of forward,
backward, and lateral movements to navigate a T-
shaped course marked by cones (25) (ICC 50.914,
%TEM 52.09). The 20-m sprint involved a standing
start. The subjects were asked to accelerate as quickly

78 McBride, Triplett-McBride, Davie, and Newton
Table 2. Training protocol and squat strength (1RM).†
JS30
Pre Post
JS80
Pre Post
C
Pre Post
Workouts (no.)
Total sets (no.)
Total reps (no.)
Total work (J)
1RM (kg)
1RM/weight ratio
—
—
—
—
145.8 69.8
1.74 60.10
13.7 60.6
81.4 63.2
529.9 624.8
168,876 615,011**
157.8 610.2*
1.87 60.09*
—
—
—
152.3 610.1
1.90 60.10
13.4 60.5
80.1 62.8
459.1 623.2
240,919 621,590
167.8 610.3*
2.09 60.08*
—
—
—
146.8 68.1
1.89 60.13
—
—
—
—
155.0 67.5
1.94 60.11
† 1RM 51 repetition maximum; JS30; jump squats at 30% of 1RM; JS80 5jump squats at 80% of 1RM; C 5control. Values
represent mean 6SE.
* A significant difference from Pre to Post for that group.
** A significant difference between the JS30 group and the JS80 group (p#0.05).
Figure 1. Percentage change in maximum squat
strength (1RM) from before training (Pre) to after
training (Post). * 5significant difference from Pre to
Post for that group (p#0.05).
as possible through a series of 4 timing gates that in-
stantaneously measured the time at 5 m (SPRG1), 10
m (SPRG2), and 20 m (SPRG3) (ICC 50.847, %TEM
51.98). Two minutes of rest was allowed between
each trial and 5 minutes of rest was allowed between
the different tests.
Body Composition
Skinfold measurements were obtained with Harpen-
den skinfold calipers (British Indicators Ltd., Herts,
England) and estimates of percentage of body fat and
lean body mass were determined (13). Thigh girth,
height, and weight were also recorded for each subject.
Statistical Analyses
A general linear model–repeated-measures analysis
with a Bonferroni post hoc test was used to determine
between- and within-group differences. A one-way
analysis of variance was used to determine significant
differences between the groups in percentage change.
Pearson correlation coefficients were determined for
selected variables. The criterion alevel was set at p#
0.05. An estimate of effect size h
2
50.569 at an ob-
served power level of 1.0 for the 1RM. An estimate of
effect size h
2
50.387, 0.371, 0.164, 0.170 at an observed
power of 0.954, 0.941, 0.530, 0.547 for PF, PP, PV, and
JH respectively for the 30J. An estimate of effect size
h
2
50.235, 0.441 at an observed power level of 0.578,
0.931 for average EMG during the 30% and 80% jump
squats, respectively. All statistical analyses were per-
formed through the use of a statistical software pack-
age (SPSS, Version 8.0, SPSS Inc., Chicago, IL).
Results
Subject Characteristics
There were no significant differences between or with-
in the groups for any of the subject characteristic var-
iables, except for thigh girth, at Pre or Post (Table 1).
Thigh girth significantly increased in the JS80 group
from Pre to Post.
Training Protocol
There was no significant difference between the num-
ber of workouts or the total number of sets (including
warm-up sets) or repetitions performed between the
JS30 and JS80 groups (Table 2). There was a significant
difference between total work performed between
these 2 groups. However, no significant correlations
between total work and changes in relevant perfor-
mance variables were found.
Squat (1RM)
There was a significant increase in the 1RM for the
JS30 and JS80 groups from Pre to Post (Figure 1).
There was also a significant increase in the 1RM-to-
body weight ratio (1RM/weight ratio) for the JS30 and
JS80 group (Table 2).
Jump Squats
The JS30 group significantly increased PP, PV, and JH
in the 30J (Figure 2). The percentage increase in JH in

Strength, Power, and Speed
79
Figure 2. Percentage change in peak force (PF), peak
power (PP), peak velocity (PV), and jump height (JH) from
before training (Pre) to after training (Post) for the 30%
jump-squat test (30J). * 5significant difference from Pre to
Post for that group. 15significant difference between the
JS30 group and the JS80 group (p#0.05).
Figure 3. Percentage change in peak force (PF), peak
power (PP), peak velocity (PV), and jump height (JH) from
before training (Pre) to after training (Post) for the 55%
jump-squat test (55J). * 5significant difference from Pre to
Post for that group (p#0.05).
Figure 4. Percentage change in peak force (PF), peak
power (PP), peak velocity (PV), and jump height (JH) from
before training (Pre) to after training (Post) for the 80%
jump-squat test (80J). * 5a significant difference from Pre
to Post for that group (p#0.05).
the JS30 group was significantly higher in comparison
with the JS80 group. The JS80 group significantly in-
creased PF in the 30J.
In the 55J the JS30 group significantly increased PF,
PP, and PV, whereas the JS80 group significantly in-
creased PF and PP (Figure 3).
In the 80J the JS30 group increased PF, PP, and PV,
whereas the JS80 and C group increased in PF and PP
(Figure 4).
There were no significant differences between the
groups for PF, PV, PP, or JH at Pre or Post (Table 3).
Electromyography
The average EMG for the concentric phase significant-
ly increased in the 55J, 80J, and 1RM for the JS30 and
JS80 groups (Figure 5). However, the JS30 group also
significantly increased average EMG during the 30J.
There were no significant changes in average EMG
during the concentric phase during any of the tests for
the C group. The percentage change in average EMG
was significantly higher in the JS30 in comparison
with the C group for the 30J and was significantly
higher in the JS80 in comparison with the C group for
the 80J.
Agility T-Test and 20-m Sprint
The JS30 group significantly decreased AGT from Pre
to Post (Figure 6). The percentage change in SPRG2
was significantly different between the JS30 and JS80
groups. The JS80 group significantly decreased AGT
also. However, there was a significant increase in
SPRG1 from Pre to Post for the JS80 group.
There was no significant difference in AGT, SPRG1,
SPRG2, or SPRG3 between the groups at either Pre or
Post (Table 4).
Discussion
The most significant finding in this investigation was
that the speed at which an individual trains, as con-
trolled by load, results in a velocity-specific change in
muscle electrical activity. In addition, this load-con-
trolled velocity training appears to have a differential
effect on force, velocity, and power variables relating
to physical performance.
Load-controlled velocity training means that the
subjects, regardless of which training group they were
in, tried to move the bar as quickly as possible for each
repetition. The amount of weight on the bar therefore
determined at what velocity the training would occur.
The JS80 group had a heavy load on the bar so they
trained at a much slower velocity than the JS30 group,
which had a light load on the bar. The JS30 group had
an overall trend of improved velocity capabilities re-
gardless of the load in the jump-squat tests. Significant
increases in peak bar velocity for the JS30 group oc-

80 McBride, Triplett-McBride, Davie, and Newton
Table 3. Jump squats.*
JS30
Pre Post
JS80
Pre Post
C
Pre Post
30J
PF (N)
PV (m·s
21
)
PP (W)
JH (cm)
2151.3 6103.8
1.73 60.65
3554.0 6207.7
20.3 61.2
2227.4 6115.3
1.87 60.33
3908.8 6235.9
23.4 61.0
2158.9 695.6
1.85 60.40
3748.4 6180.6
21.9 60.8
2263.3 6101.3
1.84 60.29
3858.9 6148.9
21.3 60.5
2155.1 670.5
1.84 60.31
3699.4 6128.6
23.3 60.8
2191.3 658.9
1.86 60.41
3873.9 6101.9
23.6 60.7
55J
PF (N)
PV (m·s
21
)
PP (W)
JH (cm)
2378.0 6117.9
1.37 60.20
3113.1 6178.1
15.5 60.7
2520.8 6125.3
1.47 60.23
3517.3 6180.3
16.6 60.6
2434.6 6107.7
1.41 60.31
3265.8 6129.7
15.7 60.5
2614.1 6122.1
1.44 60.37
3569.5 6139.9
15.4 60.7
2423.9 694.1
1.42 60.28
3252.3 611.4
16.1 60.9
2490.7 676.3
1.46 60.30
3455.4 674.8
17.3 60.6
80J
PF (N)
PV (m·s
21
)
PP (W)
JH (cm)
2653.1 6133.2
1.05 60.40
2635.3 6153.6
11.3 60.6
2801.9 6133.7
1.14 60.28
3067.3 6151.5
12.1 60.5
2697.7 6133.9
1.07 60.39
2766.9 6170.2
11.2 60.9
2891.5 6124.8
1.1160.39
3050.7 6104.0
11.1 60.6
2651.6 689.3
1.07 60.23
2704.3 677.2
11.6 60.6
2805.1 679.5
1.12 60.31
3010.4 680.1
13.0 60.6
∗Values represent mean 6SE. Significant differences between Pre and Post are indicated in Figures 2, 3 and 4. JS30 5jump
squat at 30 of 1 repetition maximum (1RM); JS80 5jump squats at 80% of 1RM; C 5control; Pre 5before training; Post 5
after training; 30J, 55J and 80J 5agility test, 20-m sprint, and jump squats with 30%, 55%, and 80% of the 1RM.
Figure 5. Percentage change in average electromyogram
(EMG) from the vastus lateralis for the concentric phase of
the one repetition maximum test (1RM) and the 30% (30J),
55% (55J), and 80% (80J) of the 1RM jump-squat tests. * 5
significant difference from before training (Pre) to after
training (Post) for that group. # 5significant difference
from the control (C) group (p#0.05).
Figure 6. Percentage change from before training (Pre) to
after training (Post) in the time to complete the agility test
(AGT) and the time to reach gate 1 (SPRG1) (5 m), gate 2
(SPRG2) (10 m), and gate 3 (SPRG3) (20 m). * 5significant
difference from Pre to Post for that group. 15significant
difference between the JS30 group and the JS80 group (p#
0.05).
curred at all of the testing loads (30J, 55J, 80J), which
did not occur in the JS80 group. Alternatively, the JS80
group showed a trend toward greatly improved force
capabilities but a negligible, and in some instances a
negative, effect on velocity capabilities, again regard-
less of the load in the jump-squat test. The JS80 group
had significant improvements in peak force at all the
testing loads (30J, 55J, 80J); the JS30 group did not.
Thus, the data from this investigation is in contradic-
tion to velocity specificity, which has been largely sup-
ported by isokinetic data (see review, 4). One prior in-
vestigation also used load-controlled velocity in an el-
bow flexor exercise with training loads of 0, 30, 60, and
100% of maximum isometric force (15). The group that
trained with 30% of the maximum isometric force
showed improved velocity capabilities over the whole
range of the testing loads (10, 20, 30, 45, 60% of max-
imum isometric force), similar to our investigation.
The study also showed that only the 60% and 100%
training groups significantly improved isometric force.
However, it was unclear from the study if force output
changed at each load tested in the 60% and 100% train-
ing groups.
It is acknowledged that in the load-controlled ve-

Strength, Power, and Speed
81
Table 4. Agility T-test (AGT) and 20-m sprint.†
JS30
Pre Post
JS80
Pre Post
C
Pre Post
AGT (s)
SPRG1 (s)
SPRG2 (s)
SPRG3 (s)
11.10 60.16
1.12 60.03
1.91 60.04
3.27 60.05
10.91 60.16
1.11 60.03
1.88 60.04
3.24 60.04
10.97 60.20
1.09 60.03
1.84 60.03
3.19 60.05
10.71 60.18
1.16 60.02
1.93 60.02
3.24 60.04
10.80 60.19
1.10 60.04
1.87 60.04
3.18 60.05
10.84 60.17
1.13 60.03
1.89 60.03
3.21 60.05
† Values represent mean 6SE. Significant differences between Pre and Post are indicated in Figure 6. JS30 5jump squats
at 30% of 1 repetition maximum (1RM); JS80 5jump squats at 80% of 1RM; C 5control; Pre 5before training; Post 5after
training; SPRG1 5time measured at 5 m; SPNG2 5time measured at 10 m; SPRG3 5time measured at 20 m.
locity testing (jump squats with 30, 55, and 80% of the
1RM) the JS80 group had an opportunity at the begin-
ning of the movement to generate force while the bar
was moving slowly. This is in contrast to semi-isoki-
netic testing in which the velocity is more constant
throughout the entire range of motion. However, the
training and testing model used in this investigation
is more applicable to dynamic athletic performance in
which velocity changes over the course of a specific
movement (12, 29). This may indicate why previous
investigations have found both heavy and light resis-
tance training to be effective in improving athletic per-
formance (8, 9). However, closer analysis may reveal
that heavy resistance training is effective at increasing
initial acceleration while the movement velocity is
slow, but light resistance training increases accelera-
tion capabilities during the higher velocity component
of the movement (20, 32). This may indicate why the
JS80 group significantly improved in the agility test
but performed significantly worse in the sprint. The T-
test in this study consisted of frequent stopping and
starting and thus the high velocity aspect of the sprint
test was not present. It is acknowledged that some
changes in these variables were also observed in the
control group. However, this group was performing
club sport-type activities that may have influenced
these variables independent of the effects of the testing
protocol itself. The lack of change in EMG in the con-
trol group supports this concept in that the changes
in strength and power in the control group were not
specific to the treatment but a result of outside activity.
The results of this investigation are supported by
a previous cross-sectional analysis of various athletes
(16). This study reported that sprinters had the ability
to produce high velocities during testing. However, al-
though power lifters had the ability to produce large
forces, they had a relatively low ability to produce
high velocities. The patterns of velocity and force ca-
pabilities were more pronounced between these
groups at testing loads closer to the load at which each
group trained. However, the pattern of velocity or
force capabilities unique to each group was observable
over all the testing loads. The current investigation
also found associated patterns of velocity capabilities
during the nonspecific testing of sprint times, with the
JS30 group showing clear trends toward being faster
and the JS80 group being significantly slower. The
trend in sprint times found in this investigation is sup-
ported by a similar study involving sprint, high-veloc-
ity, and high-resistance training over a 9-week period
(5). It was reported that whereas high-velocity training
improved sprint times, high-resistance training had no
effect.
Behm and Sale (3) have indicated that it may be
the intention to move quickly and not the actual move-
ment speed that determines the velocity-specific re-
sponse. Therefore, it has been suggested that when
training for dynamic athletic performance the move-
ment speed is not important as long as the intent of
the muscle action is explosive (2). The current inves-
tigation does not support that conclusion. Both groups
in this study were given specific instructions to initiate
the movement as quickly as possible. In addition, each
group performed the movement with no voluntary de-
celeration in the concentric phase. Therefore, it appears
that the actual velocity of training, as indicated by the
JS30 group, is a vital component of producing high-
velocity capabilities.
Practical Applications
Very little comparative literature exists concerning ve-
locity-specific changes in muscle activity with resis-
tance training. However, one of the primary investi-
gations in this area reported differential velocity-spe-
cific changes in muscle activity between strength train-
ing and explosive high-velocity training (8). Increases
in muscle electrical activity were seen primarily at the
velocity of training (8). Another study has suggested
the possible importance of high-velocity muscle acti-
vation capabilities and the ability to perform high-ve-
locity activities (18). The findings from the current in-
vestigation are consistent with these previous findings.
Training with a specific load and thus velocity results
in velocity-specific increases in muscle activation.
Thus, it appears that the velocity of the movement, as

82 McBride, Triplett-McBride, Davie, and Newton
controlled by the load, plays a key role in improving
high-velocity performance capabilities and possible
neural mechanisms of adaptation. However, it cannot
be determined from this investigation as to the specific
mechanisms responsible for the observed patterns of
velocity-specific increases in EMG activity. Mecha-
nisms for velocity-specific responses in muscle electri-
cal activity with exercise training must be further ex-
plored.
Note: Jeffrey M. McBride is now the Director of the Muscu-
loskeletal Research Center, Department of Exercise and Sport
Science, University of Wisconsin-La Crosse, La Crosse, WI
54602.
References
1. A
DAMS
, K., J.P. O’S
HEA
, K.L. O’S
HEA
,
AND
M. C
LIMSTEIN
.The
effect of six weeks of squat, plyometric and squat-plyometric
training on power production. J. Appl. Sport Sci. Res. 6(1):36–41.
1992.
2. B
EHM
, D.G. Neuromuscular implications and applications of re-
sistance training. J. Strength Cond. Res. 9:264–274. 1995.
3. B
EHM
,D.G.,
AND
D.G. S
ALE
. Intended rather than actual move-
ment velocity determines velocity-specific training response. J.
Appl. Physiol. 74:359–368. 1993a.
4. B
EHM
,D.G.,
AND
D.G. S
ALE
. Velocity specificity of resistance
training. Sports Med. 15:374–388. 1993b.
5. D
ELECLUSE
, C., H. V
AN
C
OPPENOLLE
,E.W
ILLEMS
,M.V
AN
L
EEMPUTTE
,R.D
IELS
,
AND
M. G
ORIS
. Influence of high-resis-
tance and high-velocity training on sprint performance. Med.
Sci. Sports Exerc. 27:1203–1209. 1995.
6. D
ESMEDT
, J.E.,
AND
E. G
ODAUX
. Ballistic contraction of slow
and fast human muscle: Discharge patterns of single motor
units. J. Physiol. 285:185–196. 1978.
7. H
A
¨KKINEN
, K., M. A
LEN
,
AND
P. V. K
OMI
. Changes in isometric
force- and relaxation-time electromyography and muscle fibre
characteristics of human skeletal muscle during strength train-
ing and detraining. Acta Physiol. Scand. 125:573–585. 1985a.
8. H
A
¨KKINEN
,K.,
AND
P. V. K
OMI
. Effect of explosive-type strength
training on electromyographic and force production character-
istics of leg extensor muscles during concentric and various
stretch-shortening cycle exercises. Scand. J. Sports Sci. 7:65–76.
1985a.
9. H
A
¨KKINEN
,K.,
AND
P. V. K
OMI
. Changes in electrical and me-
chanical behaviour of leg extensor muscle during heavy resis-
tance strength training. Scand. J. Sports Sci. 7:55–64. 1985b.
10. H
A
¨KKINEN
,K.,P.V.K
OMI
,
AND
M. A
LEN
. Effect of explosive-
type strength training on isometric force- and relaxation-time,
electromyographic and muscle fibre characteristics of leg ex-
tensor muscles. Acta Physiol. Scand. 125:587–600. 1985b.
11. H
ANNERZ
,J.,
AND
L. G
RIMBY
. The afferent influence on the vol-
untary firing range of individual motor units in man. Muscle
Nerve 2:414–422. 1979.
12. H
UDSON
, J.L. Coordination of segments in the vertical jump.
Med. Sci. Sports Exerc. 18:242–251. 1986.
13. J
ACKSON
, A.S.,
AND
M.L. P
OLLOCK
. Prediction accuracy of body
density, lean body weight, and total body volume equations.
Med. Sci. Sports 9:197. 1977.
14. K
ANEHISA
,H.,
AND
M. M
IYASHITA
. Specificity of velocity in
strength training. Eur. J. Appl. Physiol. 52:104–106. 1983.
15. K
ANEKO
,M.,T.F
UCHIMOTO
,H.T
OJI
,
AND
K. S
UEI
. Training
effect of different loads on the force-velocity relationship and
mechanical power output in human muscle. Scand. J. Sports Sci.
5:50–55. 1983.
16. M
C
B
RIDE
,J.M.,T.T
RIPLETT
-M
C
B
RIDE
,A.D
AVIE
,
AND
R.U. N
EW
-
TON
. A comparison of strength and power characteristics be-
tween power lifters, Olympic lifters and sprinters. J. Strength
Cond. Res. 13:58–66. 1999.
17. M
C
D
ONAGH
, M.J.N., C.M. H
AYWARD
,
AND
C.T.M. D
AVIES
. Iso-
metric training in human elbow flexor muscles. J. Bone Joint
Surg. 64:355–358. 1983.
18. M
ERO
,A.,
AND
P. V. K
OMI
. Force-, EMG-, and elasticity-velocity
relationships at submaximal, maximal and supramaximal run-
ning speeds in sprinters. Eur. J. Appl. Physiol. 55:553–561. 1986.
19. M
ORITANI
,T.,
AND
M. M
URO
. Motor unit activity and surface
electromyogram power spectrum during increasing force of
contraction. Eur. J. Appl. Physiol. 56:260–265. 1987.
20. M
ORRISSEY
, M.C., E.A. H
ARMAN
,
AND
M.J. J
OHNSON
. Resis-
tance training modes: Specificity and effectiveness. Med. Sci.
Sports Exerc. 27:648–660. 1995.
21. N
EWTON
, R.U., W.J. K
RAEMER
,K.H
A
¨KKINEN
,K,B.J.H
UM
-
PHRIES
,
AND
A.J. M
URPHY
. Kinematics, kinetics and muscle ac-
tivation during explosive upper body movements. J. Appl. Bio-
mech. 12:31–43. 1996.
22. S
ALE
, D.G. Influence of exercise and training on motor unit
activation. Exerc. Sport Sci. Rev. 15:95–151. 1987.
23. S
ALE
,D.G.,
AND
D. M
AC
D
OUGALL
. Specificity in strength train-
ing: A review for the coach and athlete. Can. J. Appl. Sports Sci.
6:87–92. 1981.
24. S
CHMIDTBLEICHER
,D.,
AND
G. H
ARALAMBIE
. Changes in con-
tractile activity properties of muscle after strength training in
man. Eur. J. Appl. Physiol. 46:221–228. 1981.
25. S
EMENICK
, D. Testing protocols and procedures. In: Essentials
of Strength Training and Conditioning. T.R. Baechle, ed. Cham-
paign, IL: Human Kinetics, 1994. pp. 258–273.
26. S
HEALY
, M.J., R. C
ALLISTER
, G.A. D
UDLEY
,
AND
S.J. F
LECK
.Hu-
man torque velocity adaptations to sprint, endurance, or com-
bined modes of training. Am. J. Sports Med. 20:581–586. 1992.
27. S
TONE
, M.H.,
AND
H.S. O’B
RYANT
.Weight Training: A Scientific
Approach. Minneapolis: Burgess International, 1987.
28. T
AYLOR
, A.D.,
AND
R. B
RONKS
. Reproducibility and validity of
the quadriceps muscle integrated electromyogram threshold
during incremental cycle ergometry. Eur. J. Appl. Physiol. 70:
252–257. 1995.
29. V
OLKOV
, N.I.,
AND
V.I. L
APIN
. Analysis of the velocity curve in
sprint running. Med. Sci. Sports Exerc. 11:332–337. 1979.
30. W
ILSON
, G.J., R.U. N
EWTON
, A.J. M
URPHY
,
AND
B.J. H
UMPHRIES
.
The optimal training load for the development of dynamic ath-
letic performance. Med. Sci. Sports Exerc. 25:1279–1286. 1993.
31. Y
OUNG
, W.B.,
AND
G.E. B
ILBY
. The effect of voluntary effort to
influence speed of contraction on strength, muscular power,
and hypertrophy development. J. Strength Cond. Res. 7:172–178.
1993.
32. Y
OUNG
, W., B. M
C
L
EAN
,
AND
J. A
RDAGNA
. Relationship be-
tween strength qualities and sprinting performance. J. Sports
Med. Phys. Fitness 35:13–19. 1995.
Acknowledgments
This investigation was supported in part by a grant from
NASA (issued through the American College of Sports
Medicine Foundation). We thank Matt Sharman, Tiffeny
Byrnes, Carol Hartmann, Rob Baglin, and Mark Fisher for
their assistance in the laboratories.
Address correspondence to Jeffrey M. McBride,
mcbride[email protected]u.

