


EXSC 520
CASE STUDY: FACTORIAL ANALYSIS OF VARIANCE TEMPLATE
Instructions: To successfully complete this case study, all of the following instructions must be adhered to. Only
paste tables/figures that contain pertinent information. Only paste tables/ figures where you are instructed to do so.
HIGHLIGHT (in yellow) only relevant the data from tables; as well as your response to each question. In the
write-up section, all information must be provided in paragraph format. When statistical values are discussed, the
numerical value must be given and a reference must be made to the table(s)/figure(s) where the value(s) can be
found. An example of this is “heart rate was statistically greater during running versus cycling (189 vs. 143 bpm) as
indicated in Table 1.
I. Factorial Analysis of Variance
Research question: “is there a statistical difference for skin temperature across time while taking into
account the “factor” “environment” (hot versus cold)?”
Assumptions Testing
1. Data level of measurement- what is the level of measurement for the data used in this case study?
Continuous variables represent the measurement level for the data in this case study.
2. Would the amount of skewness and kurtosis in these affect the analysis? How do you know? Give
numerical values to support your conclusion. The analysis results remained unaffected by the
skewness and kurtosis values. The measurements of skewness and kurtosis showed no
change when exposed to hot conditions at both 15 minutes and 30 minutes. In the hot
environment skewness showed a value of p=-0.88 and kurtosis demonstrated p=-1.07. The
result at 15 minutes revealed p=-1.11 for skewness and p=-0.04 for kurtosis. At the
30-minute mark, the skewness value reached p=-0.76 while the kurtosis value reached
p=-1.02. Analysis of the cold environment demonstrated no impact on skewness because the
statistical value was p=-7.80. Kurtosis displayed measurable impact as indicated by p=17.34.
Skewness measured at 0 minutes produced no effect because of the p-value of -7.82.
Table 1. PASTE TABLE with skewness and kurtosis (EACH FACTOR) BELOW
Page 1 of 9
EXSC 520
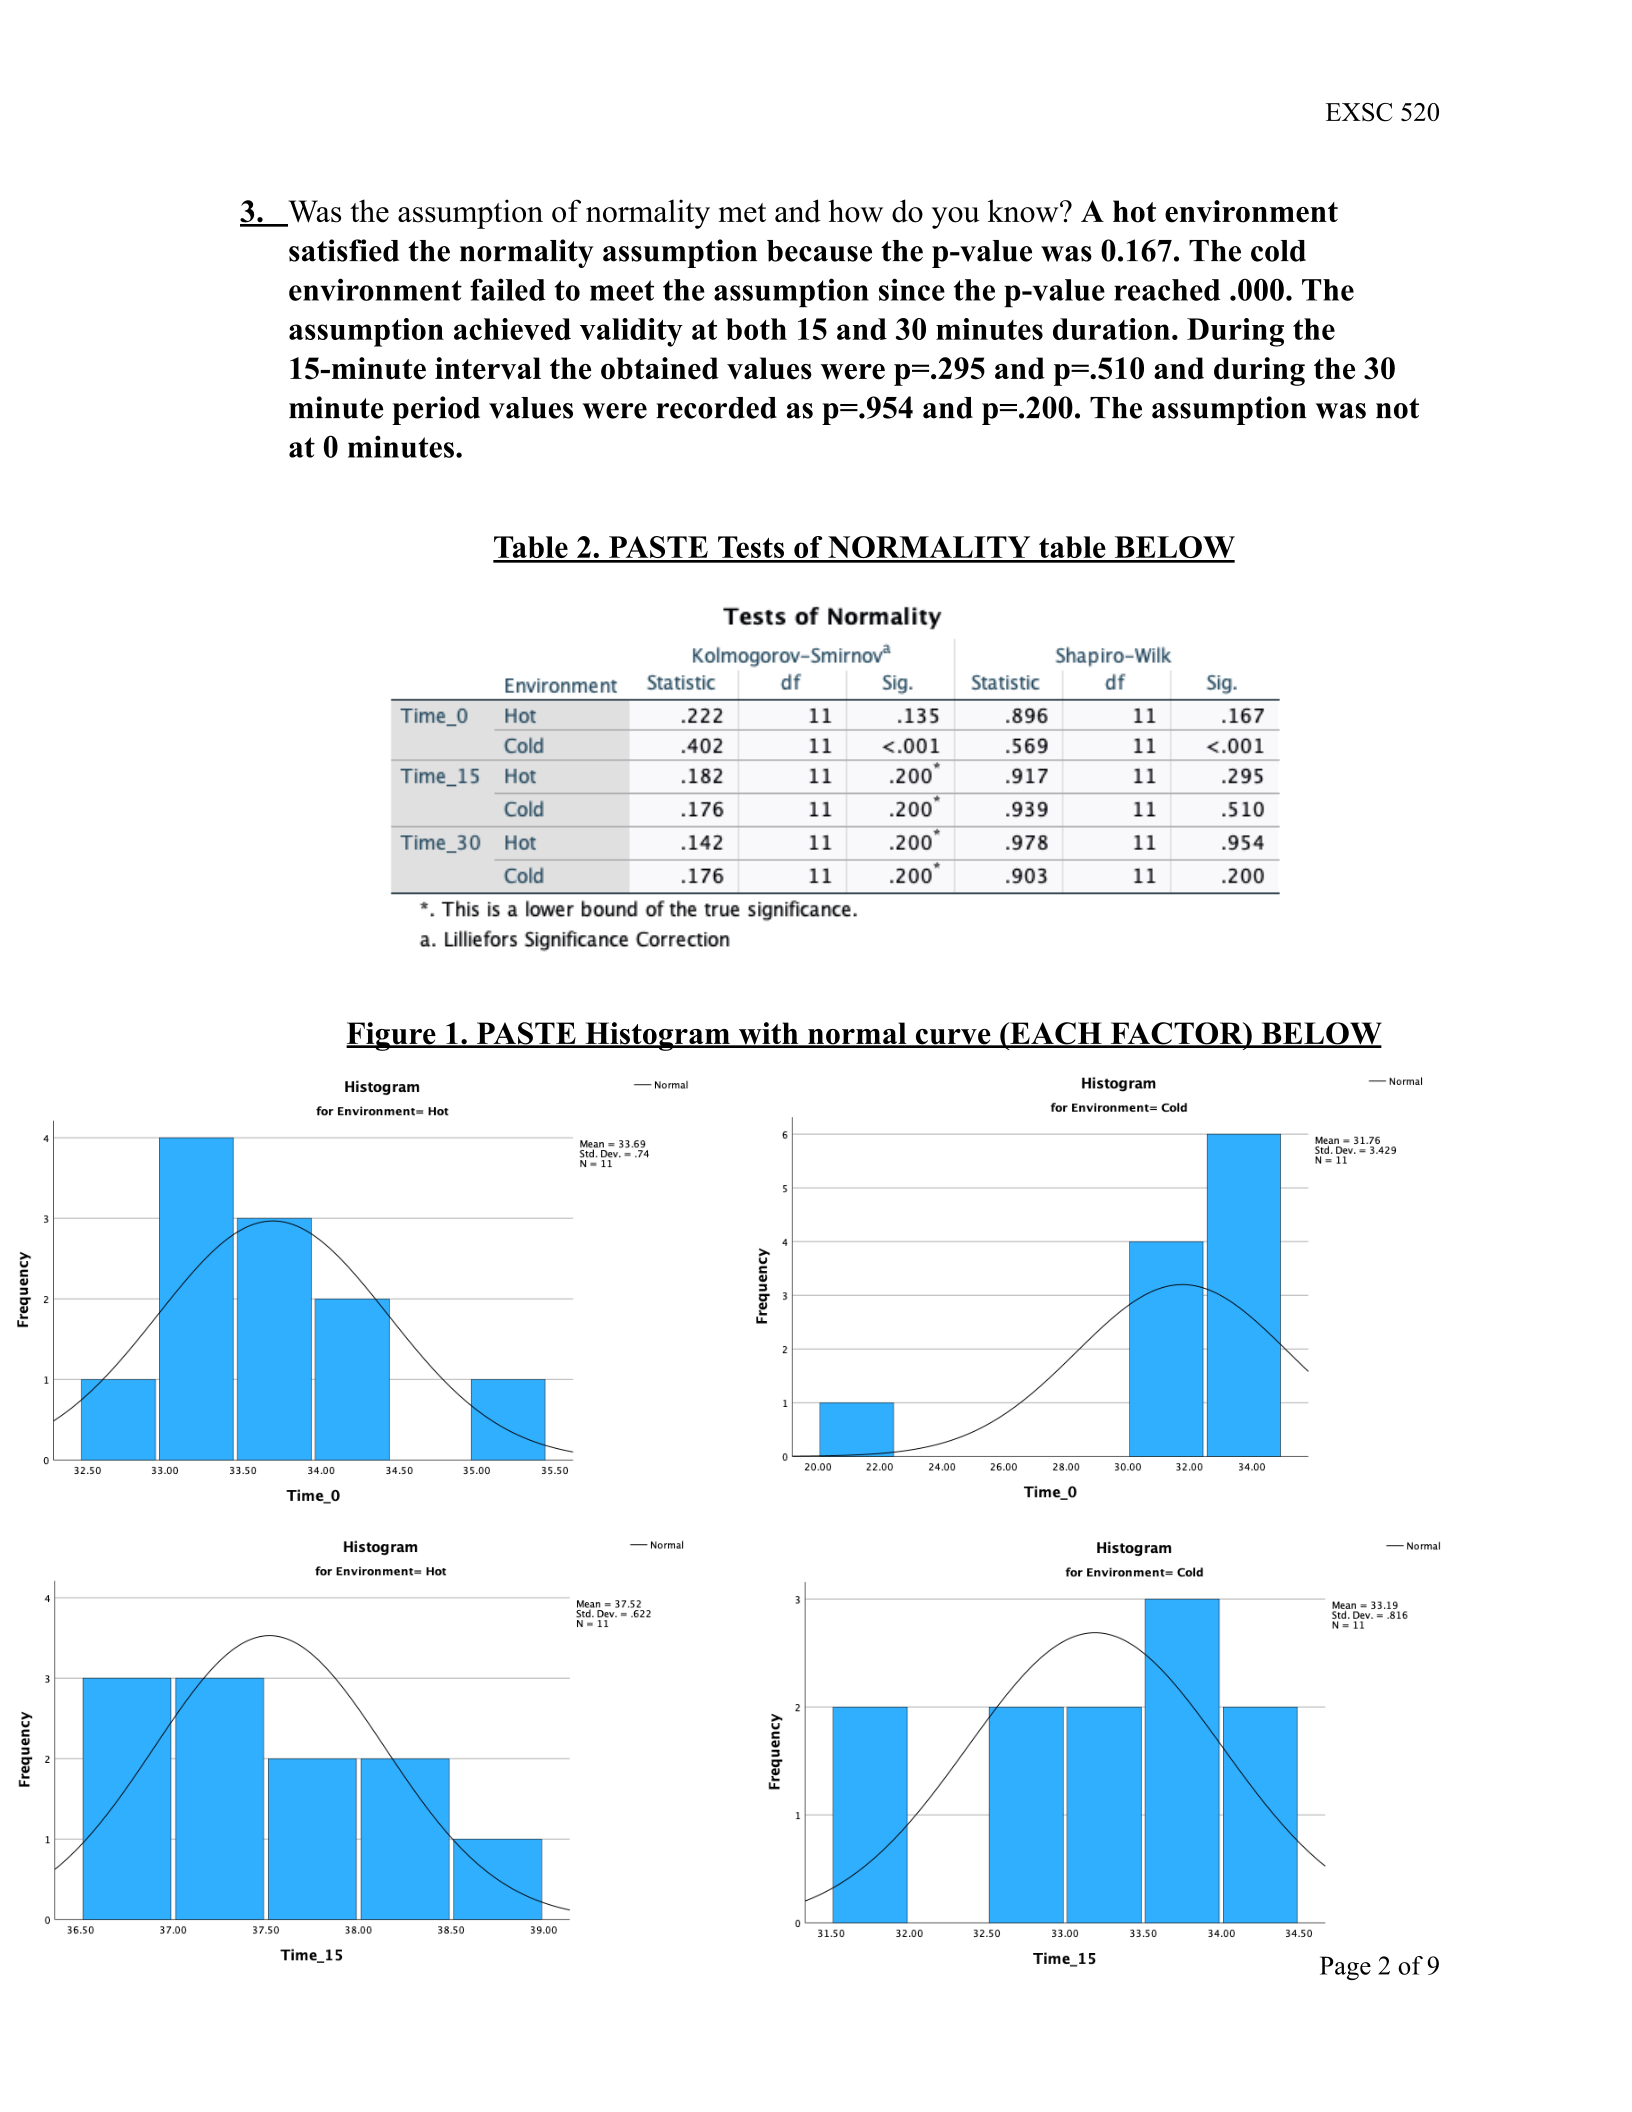
3. Was the assumption of normality met and how do you know? A hot environment
satisfied the normality assumption because the p-value was 0.167. The cold
environment failed to meet the assumption since the p-value reached .000. The
assumption achieved validity at both 15 and 30 minutes duration. During the
15-minute interval the obtained values were p=.295 and p=.510 and during the 30
minute period values were recorded as p=.954 and p=.200. The assumption was not
at 0 minutes.
Table 2. PASTE Tests of NORMALITY table BELOW
Figure 1. PASTE Histogram with normal curve (EACH FACTOR) BELOW
Page 2 of 9



EXSC 520
Table 10. PASTE Levene’s Test of Equality of Error Variances table BELOW
Table 11. PASTE Tests of Between-Subjects Effects table BELOW
Table 12. PASTE Pairwise Comparisons table(s) (FOR EACH FACTOR) BELOW – This
could include the table for the interaction comparison which (may) require the use of the
Syntax calculation.
Page 7 of 9


EXSC 520
Write-up- Use these questions as a guide to write an abstract (paragraph). Use past tense.
The write-up must include the following. Use these questions as a guide.
1. What is the research question?
2. What is the mean and standard deviation for skin temperature at minute 0, 15, and 30
while working in either a hot or cold environment?
3. Was Levene’s test significant? How do you know?
4. What Mauchley’s Test of Sphericity met, how do you know?
5. Was the ANOVA statistically significant? (Hint: look at the p sig value in Test of
Within-Sujects table)
6. List all (if any) significant post-hoc comparisons including the interaction comparison
7. What do the statistical findings of these data suggest about the research question?
8. What are your thoughts on the finding of this analysis, and what are the practical
application(s) of this finding? Elaborate on what the study means, why, how you know,
and relate the findings to exercise physiology knowledge. Use references if needed.
(Hint- does this study “make sense?” What could influence results?)
The research question is are there any statistical differences for skin temperature across
time while considering the factor environment (hot versus cold)?. The descriptive statistics
table shows body temperature means and standard deviations for 0, 15, and 30 minutes
during work in hot and cold environments. At zero minutes the hot environment had a
mean temperature of 33.691 with a .7395 standard deviation while the cold environment
showed a mean temperature of 31.764 with a 3.4294 standard deviation. At 30 minutes the
data shows a standard deviation of .7258 for a hot environment while the cold environment
shows a mean temperature of 35.900 with a standard deviation of .8532. The Levene’s test
of equality of error variances table produced a Sig value of .147 at 0 minute, .364 at 15
minute and .538 demonstrating that the assumption was met because these values exceed
.05. ANOVA results show no statistical significance since the Sig value exceeds the
threshold of .05 with .095. Skin temperature demonstrates some warming up time
dependency yet environmental effects remain more dominant. Trainers and coaches could
benefit from this information to effectively warm up athletes and lower injury risks.
Page 9 of 9
Powered by TCPDF (www.tcpdf.org)

