



EXSC 520
CASE STUDY: CORRELATION AND BIVARIATE REGRESSION
DONALD BIGHAM
AUGUST 20, 2025
I. Correlation
Research question: “Is mean heart rate during exercise correlated to body weight?”
Assumptions Testing
1. Data level of measurement – what were the dependent and independent variables in this
study? What were their names, units and classification used in this case study (ratio, interval,
nominal etc.)?
The dependent variable is the mean heart rate, and the independent variable is body
weight. The classification used in this study was the ratio scale for heart rate and body
weight, which is quantitative. Beginning with zero as the absence value and consistent from
point to point. For example, if a person's heart rate is 150 BPM is three times someone else's
heart rate at 50 BPM.
2. Calculate and report the amount of skewness and kurtosis in these variables. Would skewness
or kurtosis affect the analysis or not? How do you know? Give numerical values to support
your conclusion.
The amount of skewness in mean heart rate is 0.715, and for kurtosis is 0.523.
The skewness or kurtosis would not affect the analysis of mean heart rate, because it falls
between positive and negative 1.96. (Table 1) The amount of skewness in body weight is
2.625, and for kurtosis is 1.633. The skewness in body weight would affect the analysis
because the value is greater than 1.96 or 2.625, but would not affect kurtosis, because the
value is 1.633 and falls between positive and negative 1.96. (Table 1)
Table 1. Table with skewness and kurtosis
Descriptives
Statistic Std. Error
Mean_heart_rate_BP
M
Mean 132.65 3.541
95% Confidence Interval
for Mean
Lower
Bound
125.24
Upper
Bound
140.06
5% Trimmed Mean 132.22
Median 133.50
Page 1 of 16

EXSC 520
Variance 250.766
Std. Deviation 15.836
Minimum 108
Maximum 165
Range 57
Interquartile Range 25
Skewness .366 .512
Kurtosis -.519 .992
Body_weight_Kg Mean 85.845 2.7918
95% Confidence Interval
for Mean
Lower
Bound
80.002
Upper
Bound
91.688
5% Trimmed Mean 84.728
Median 81.750
Variance 155.887
Std. Deviation 12.4855
Minimum 71.3
Maximum 120.5
Range 49.2
Interquartile Range 19.6
Skewness 1.344 .512
Kurtosis 1.620 .992
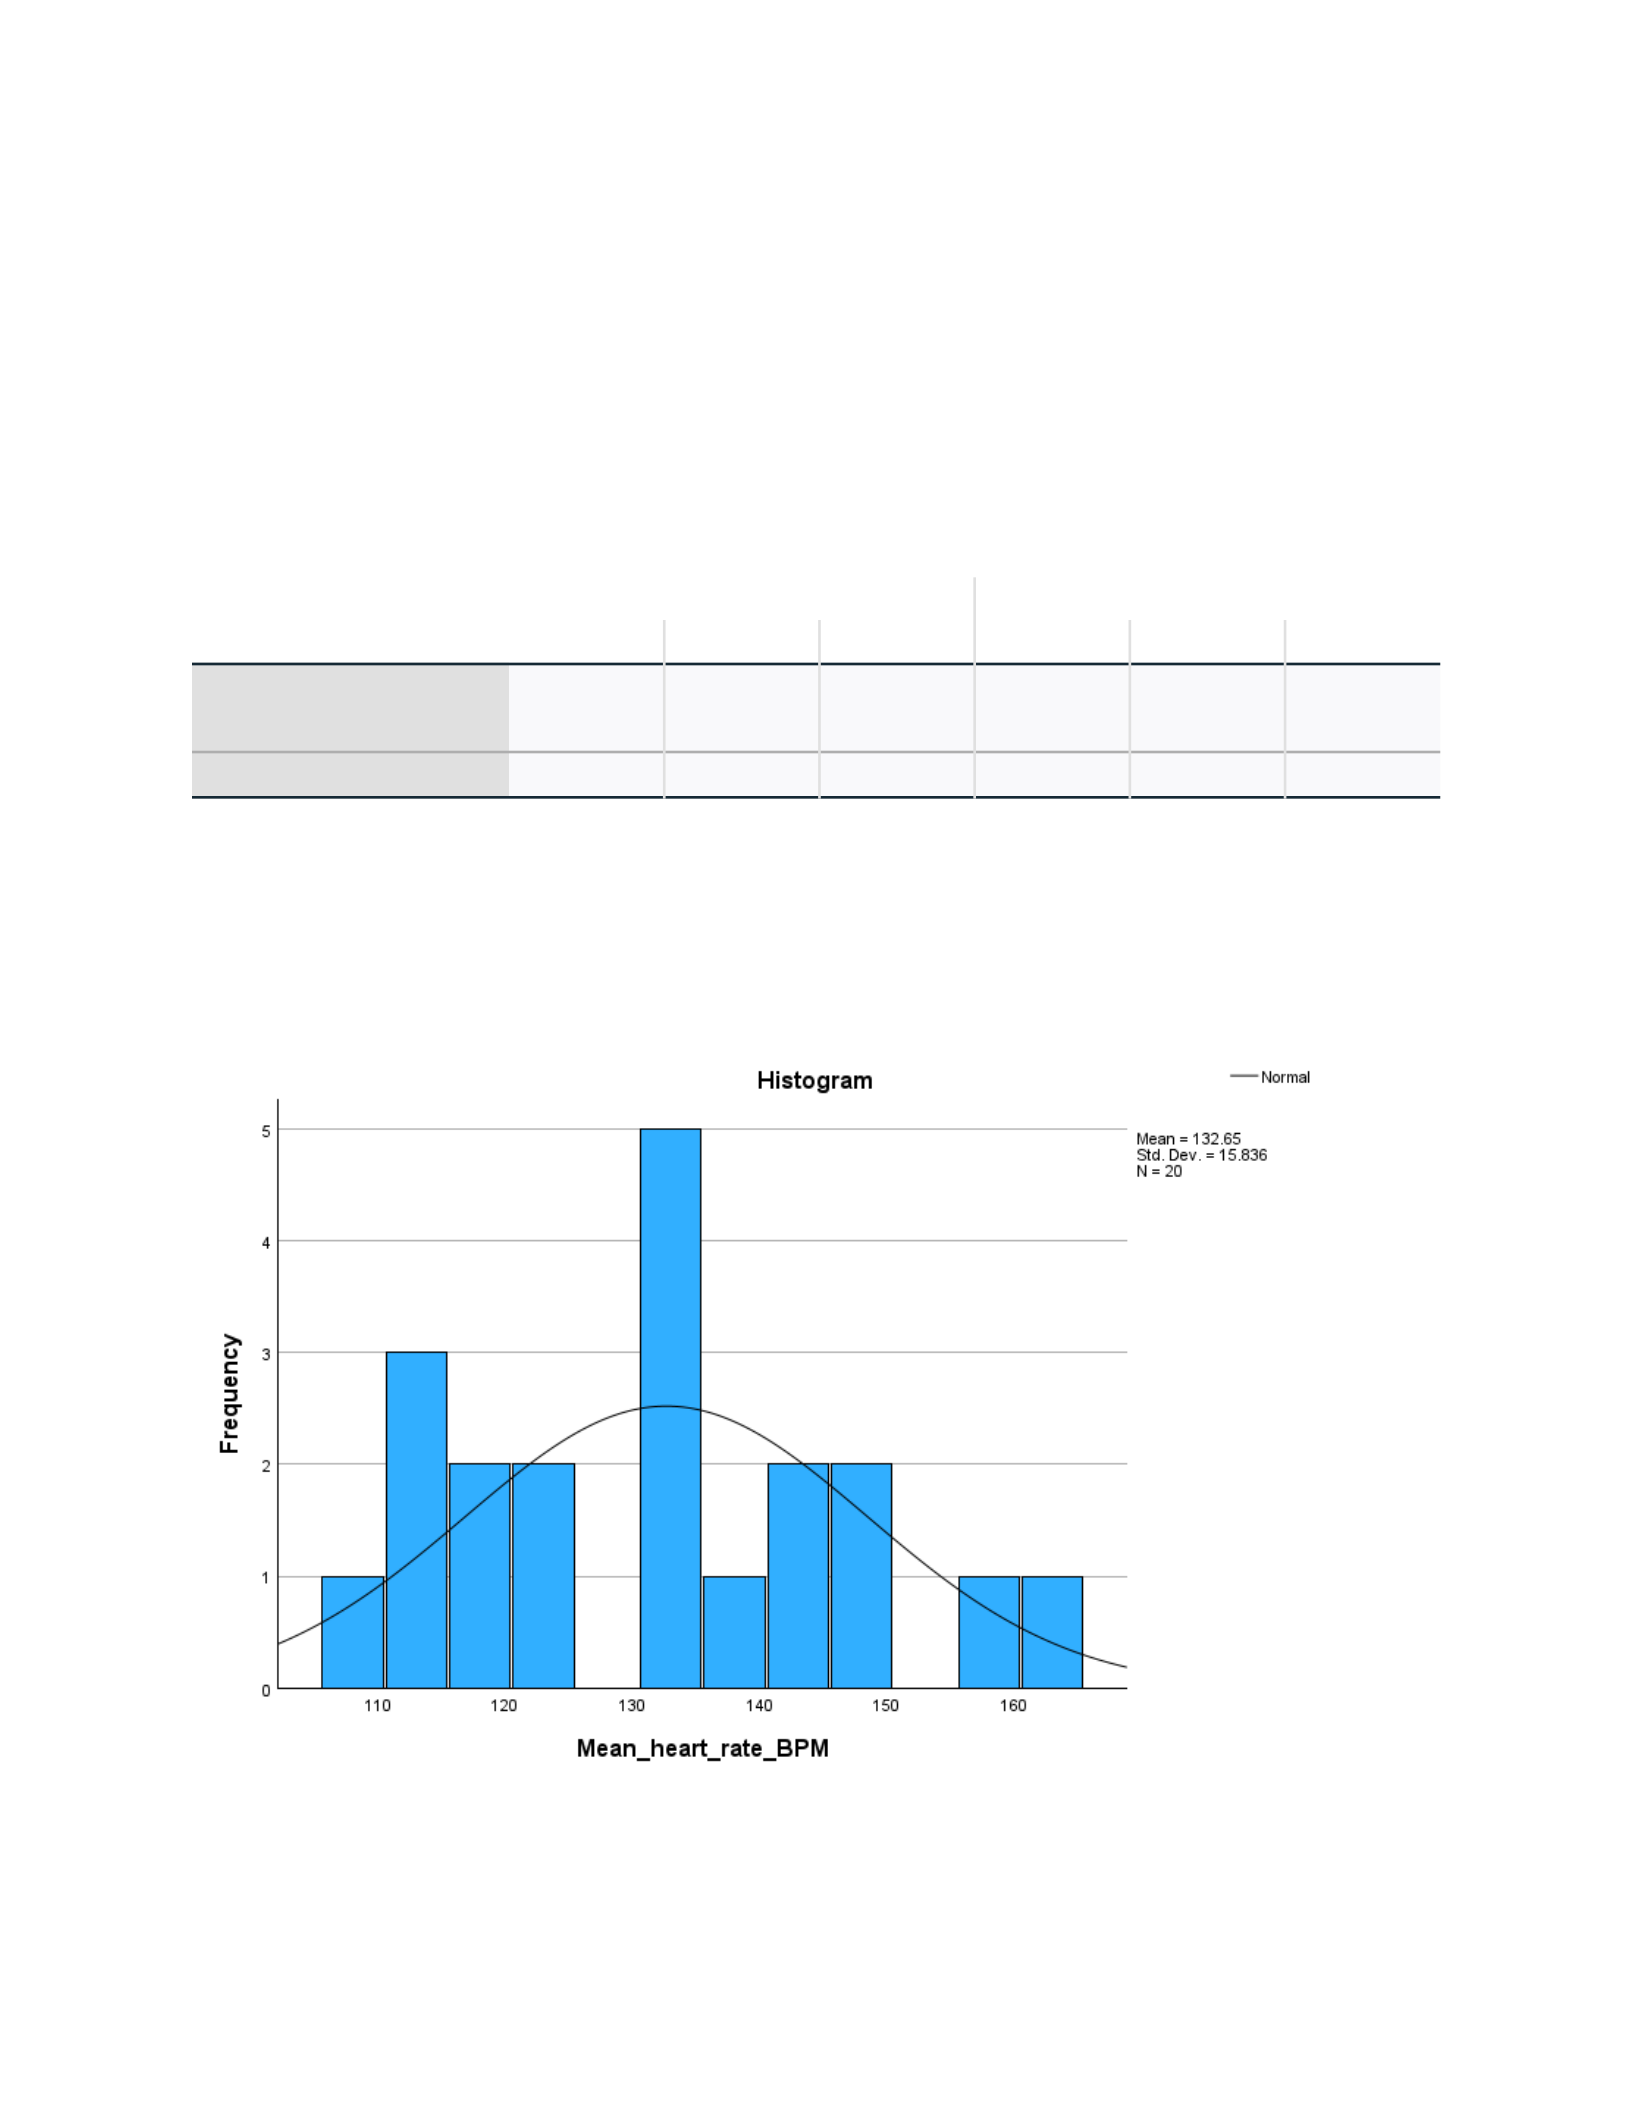
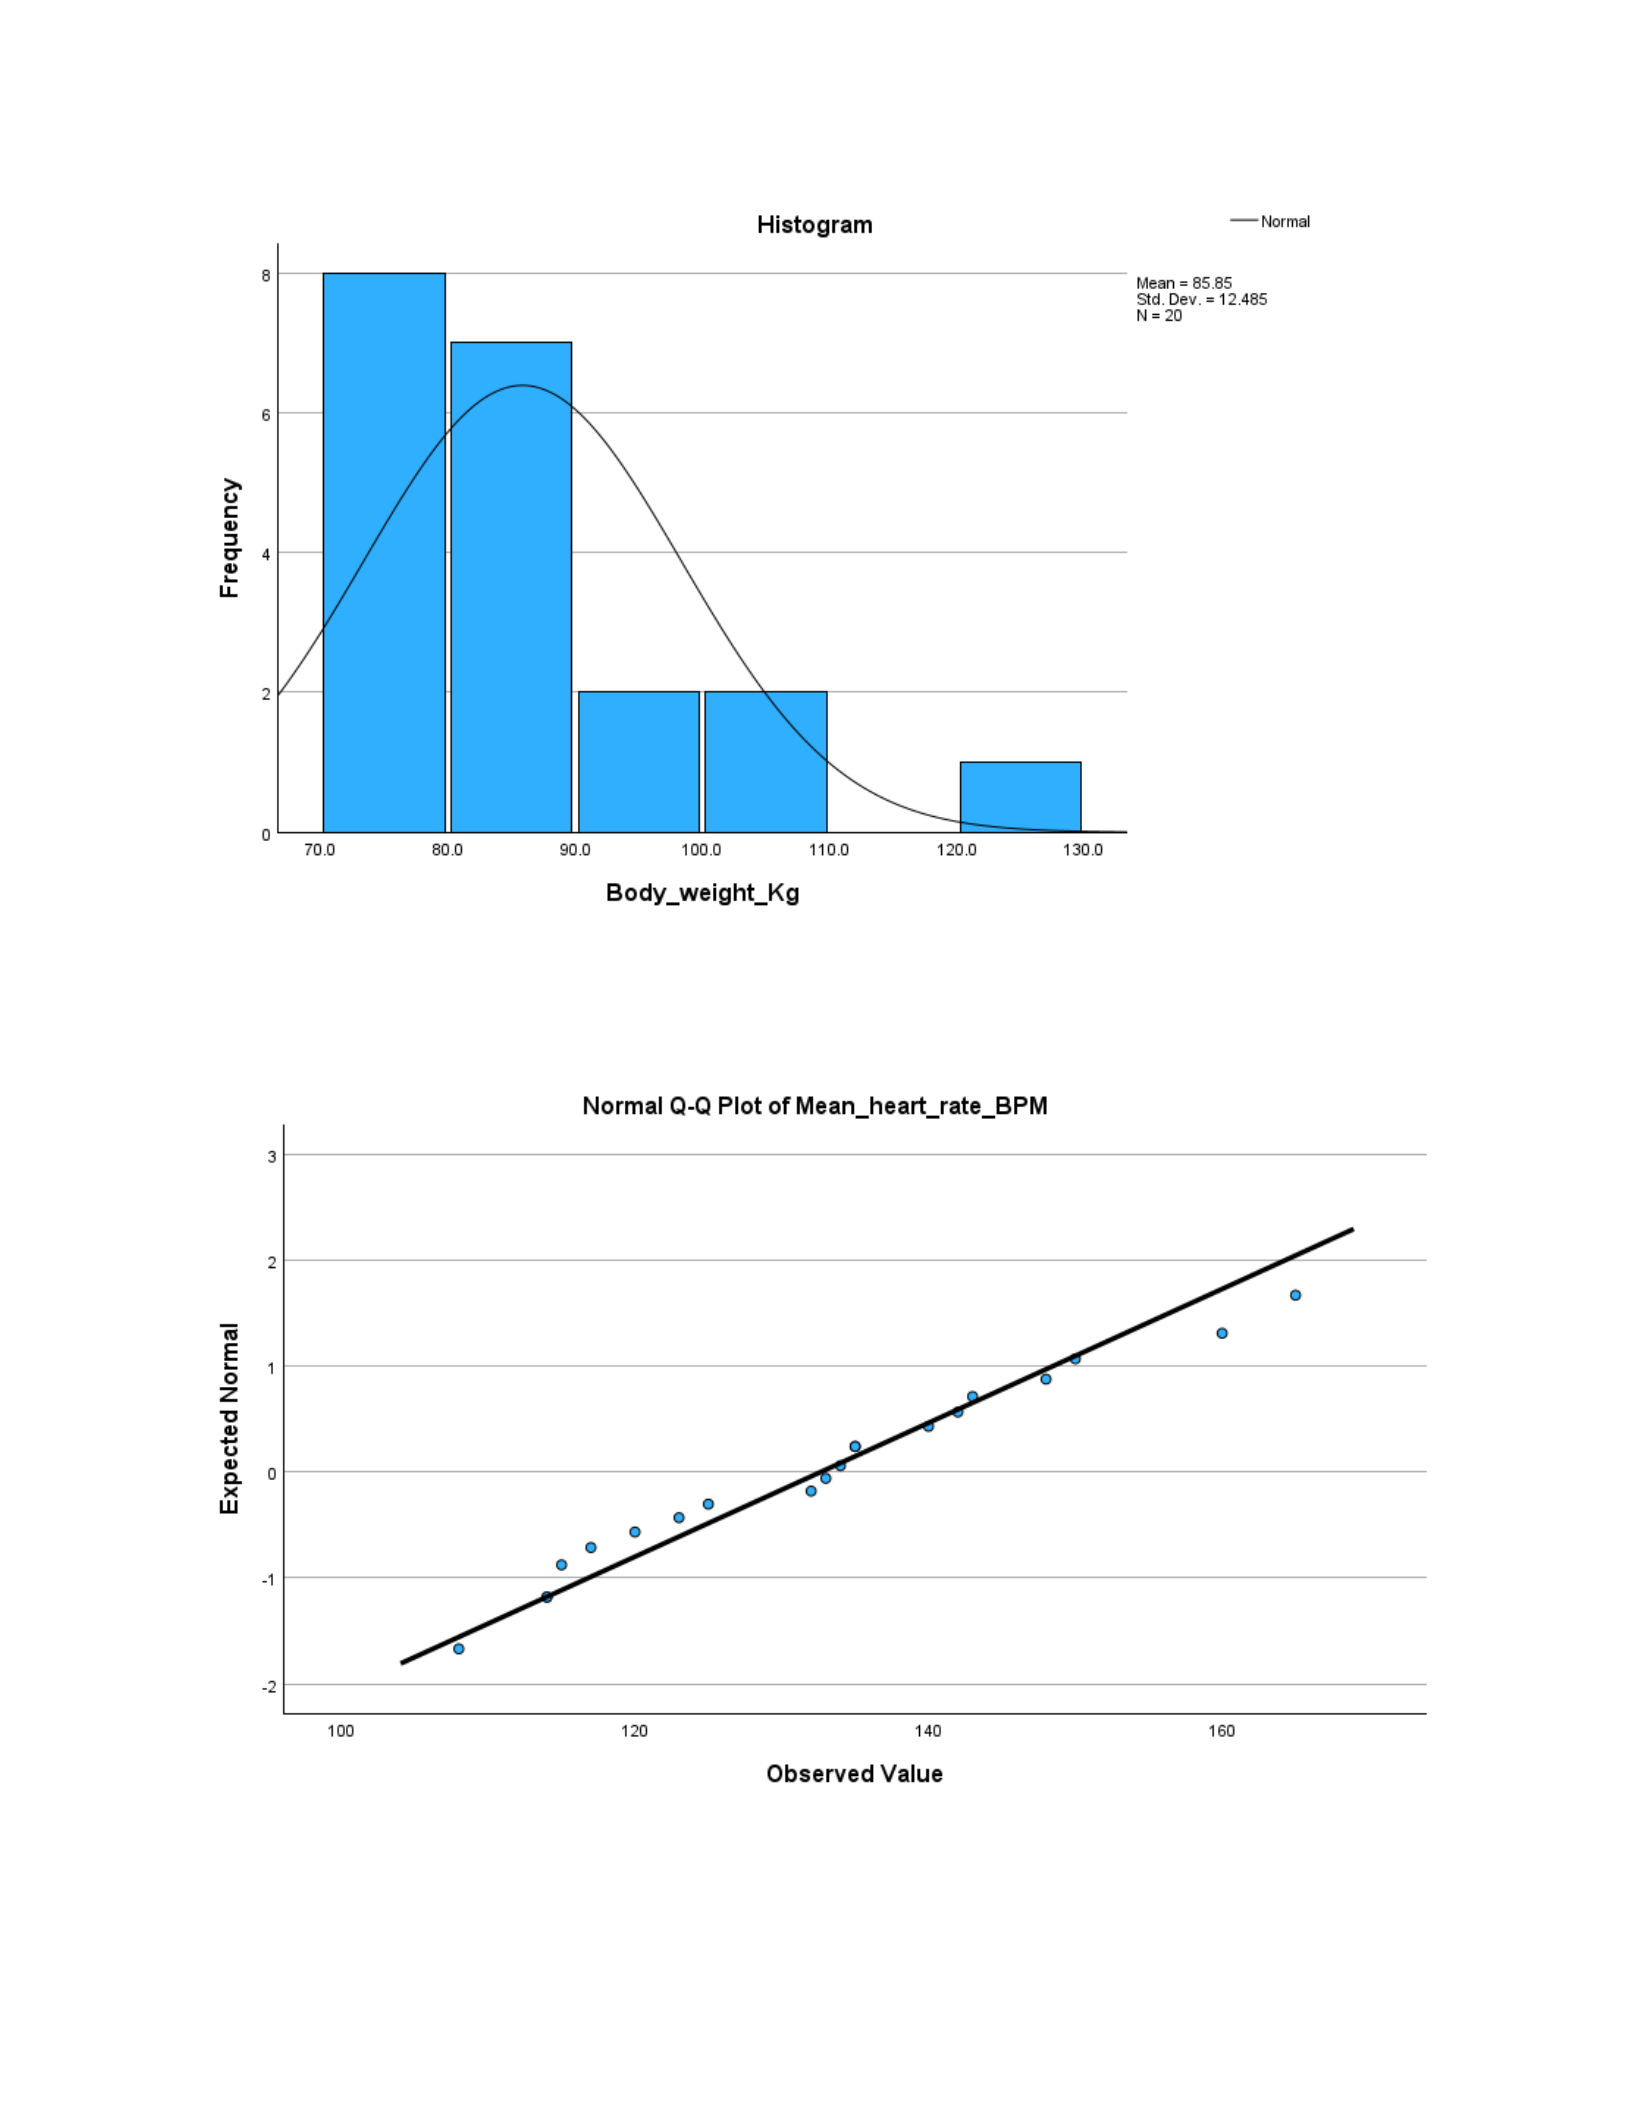
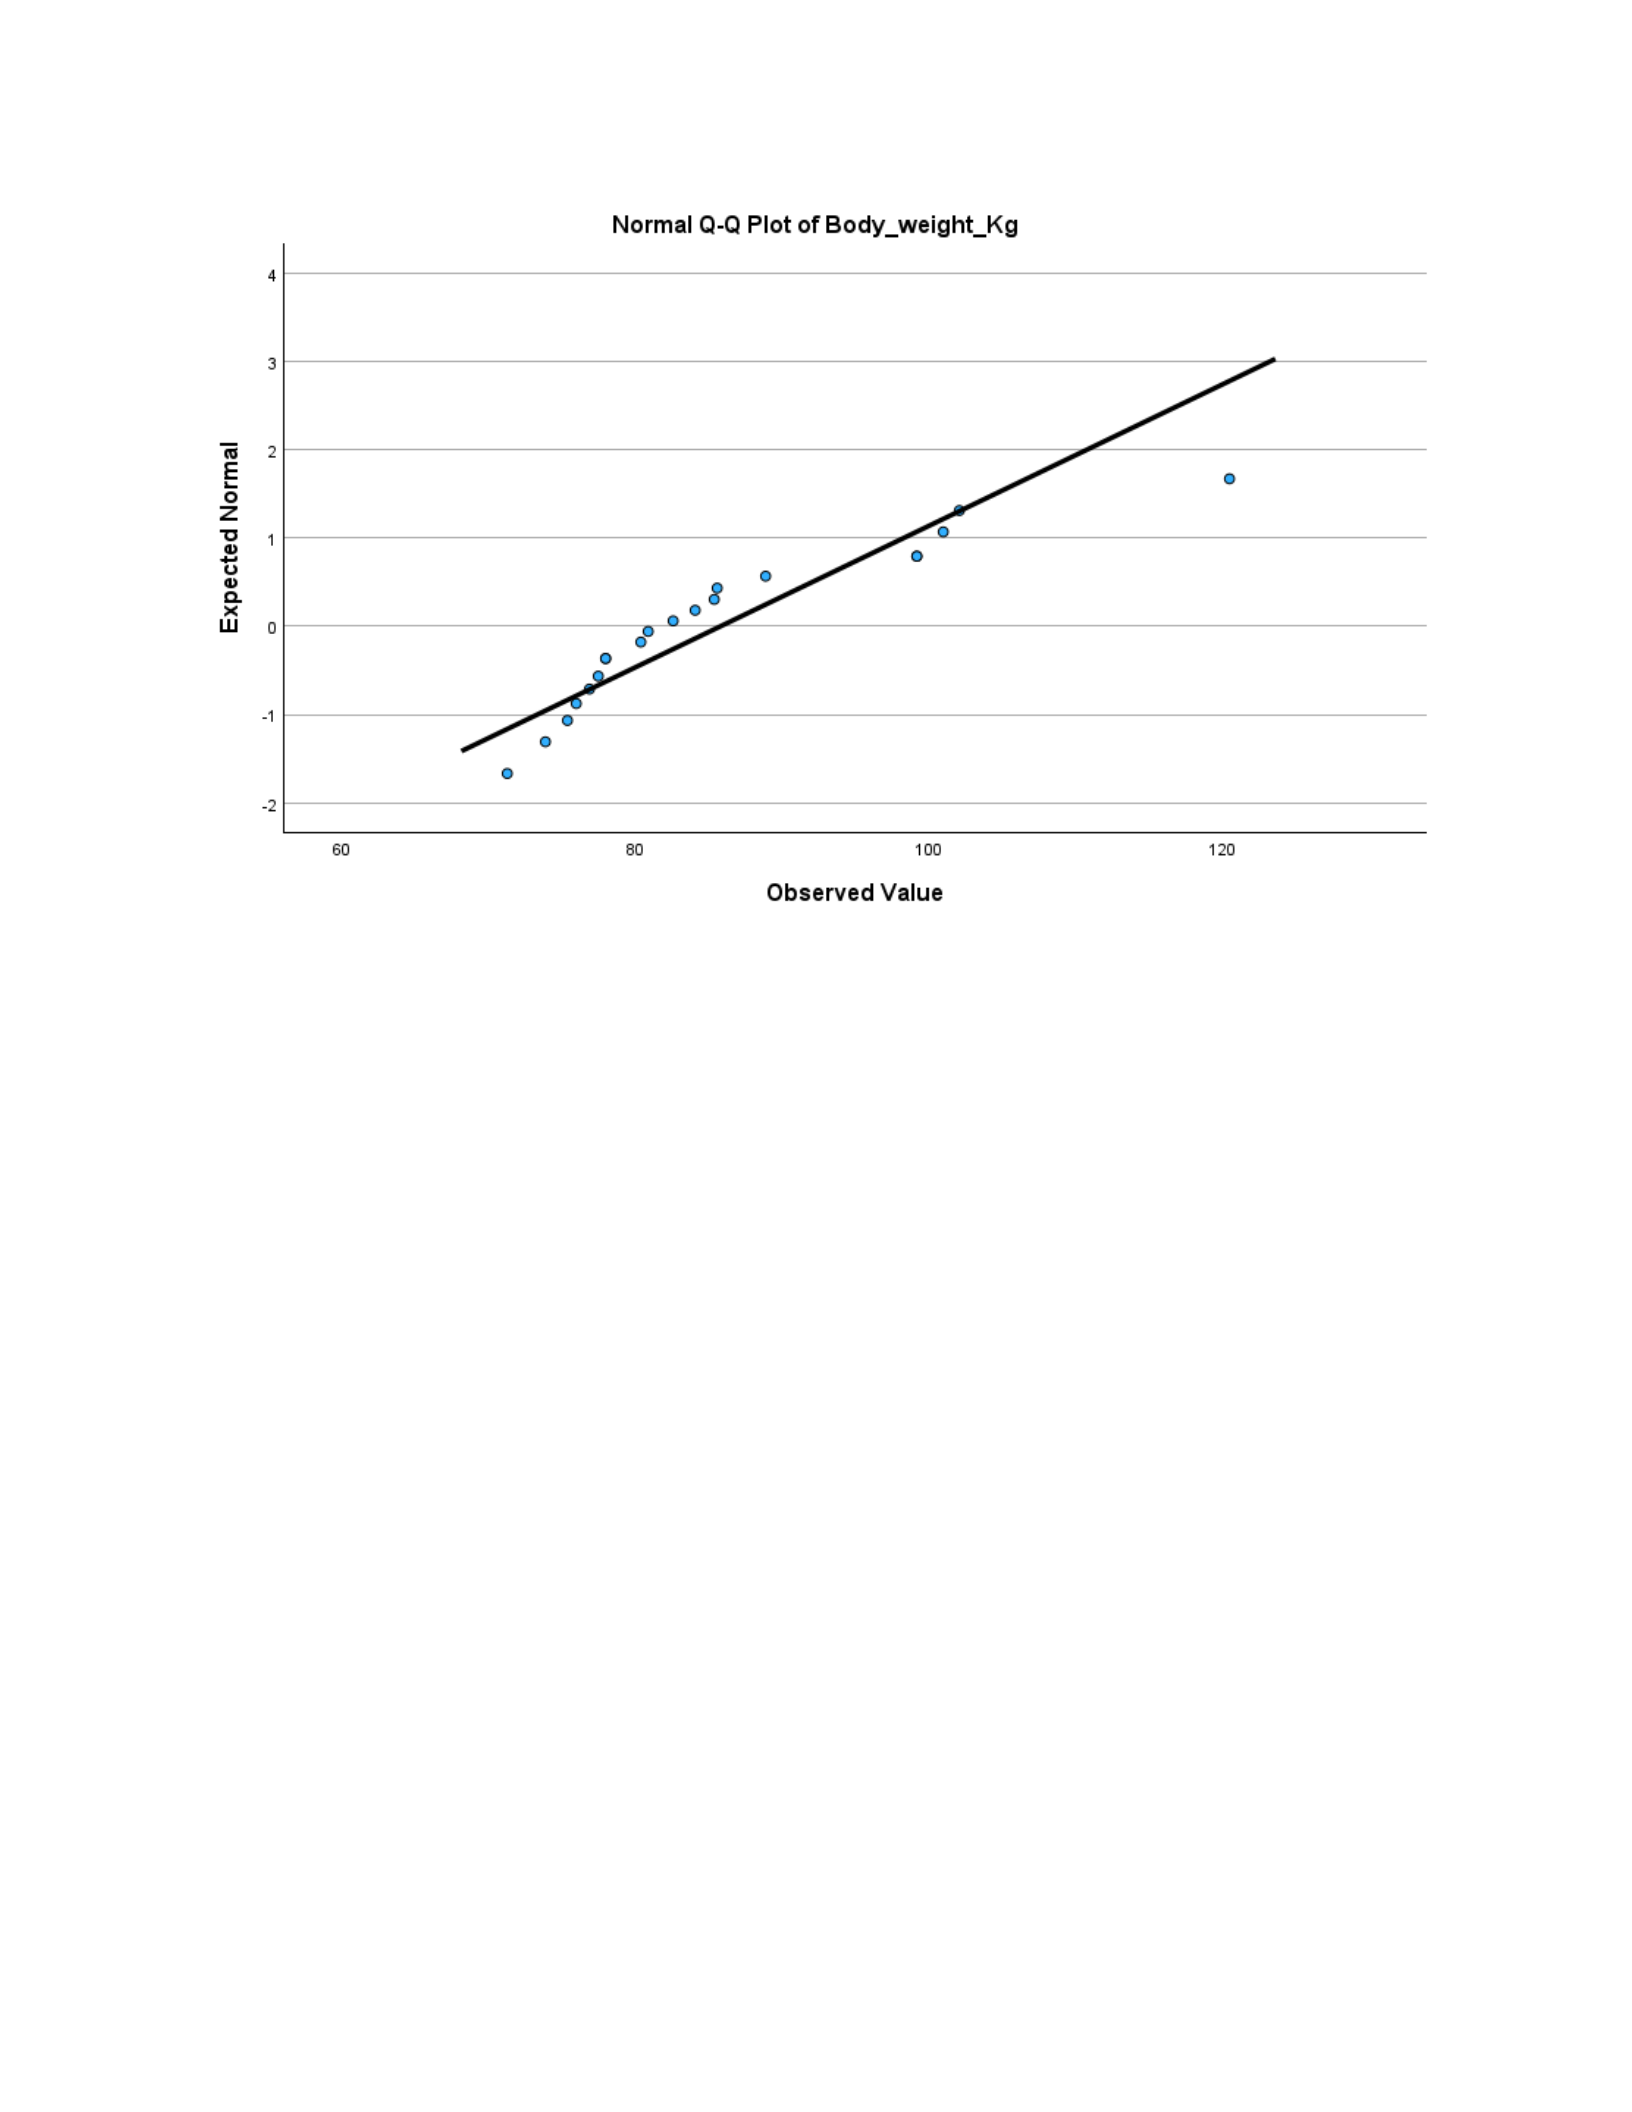
3. Was the assumption of normality met and how do you know?
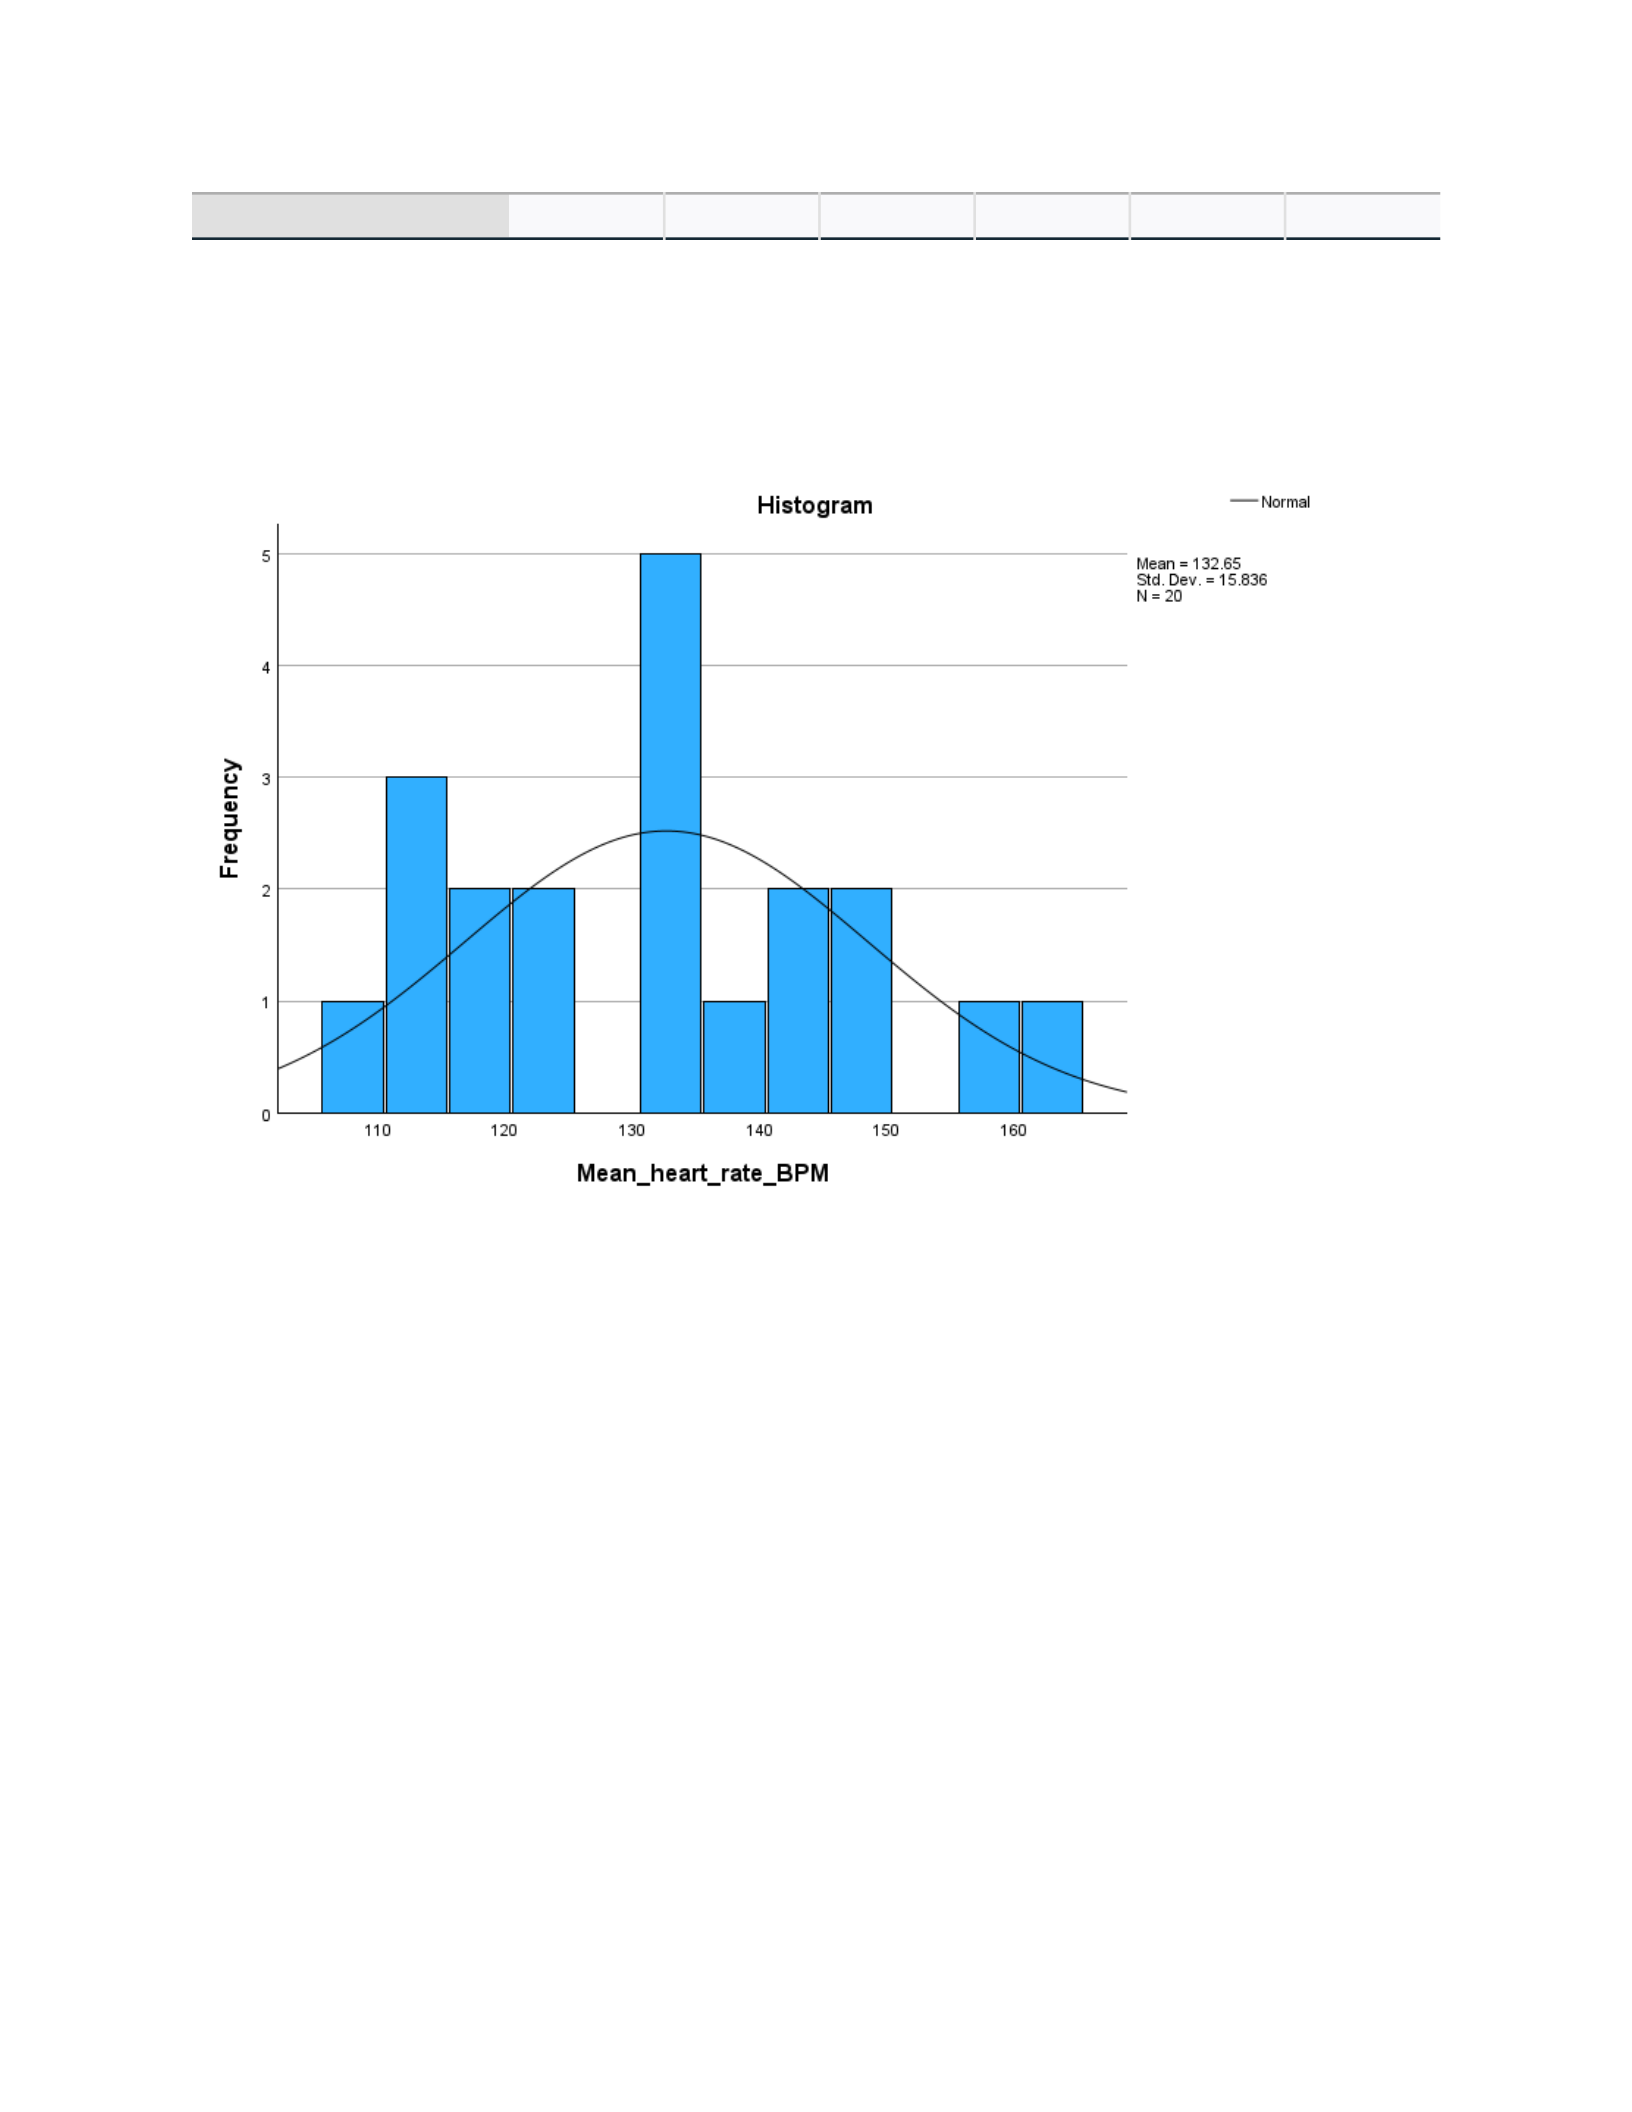
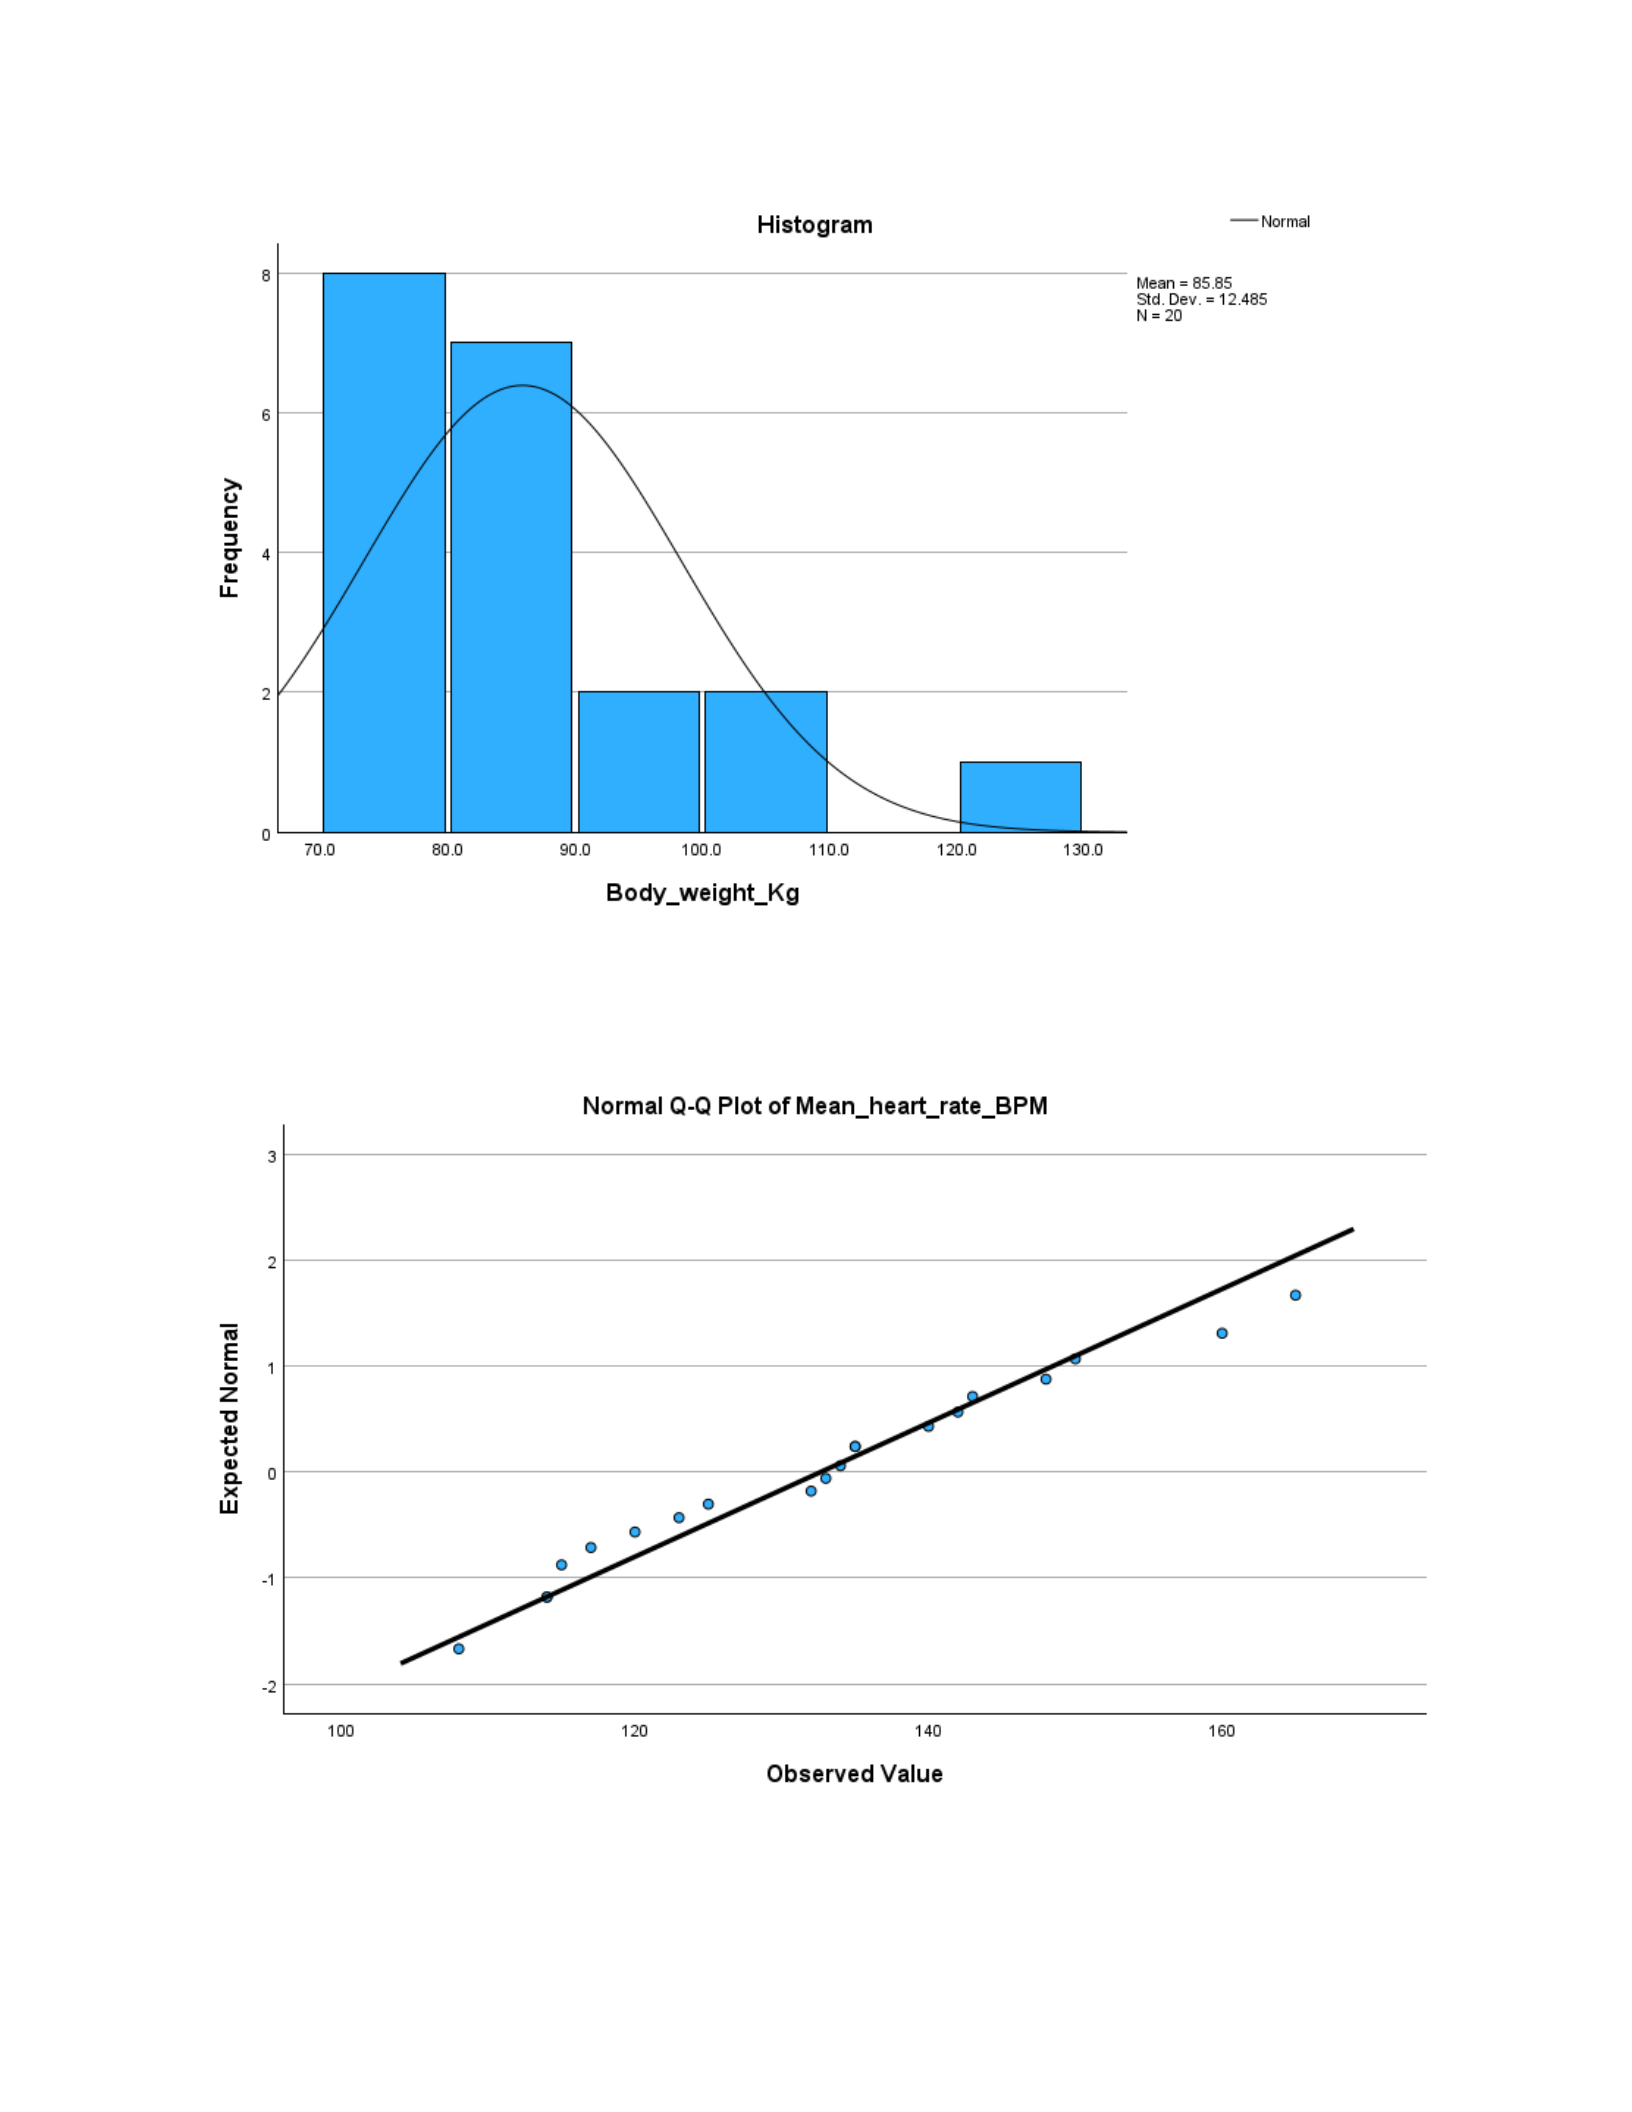
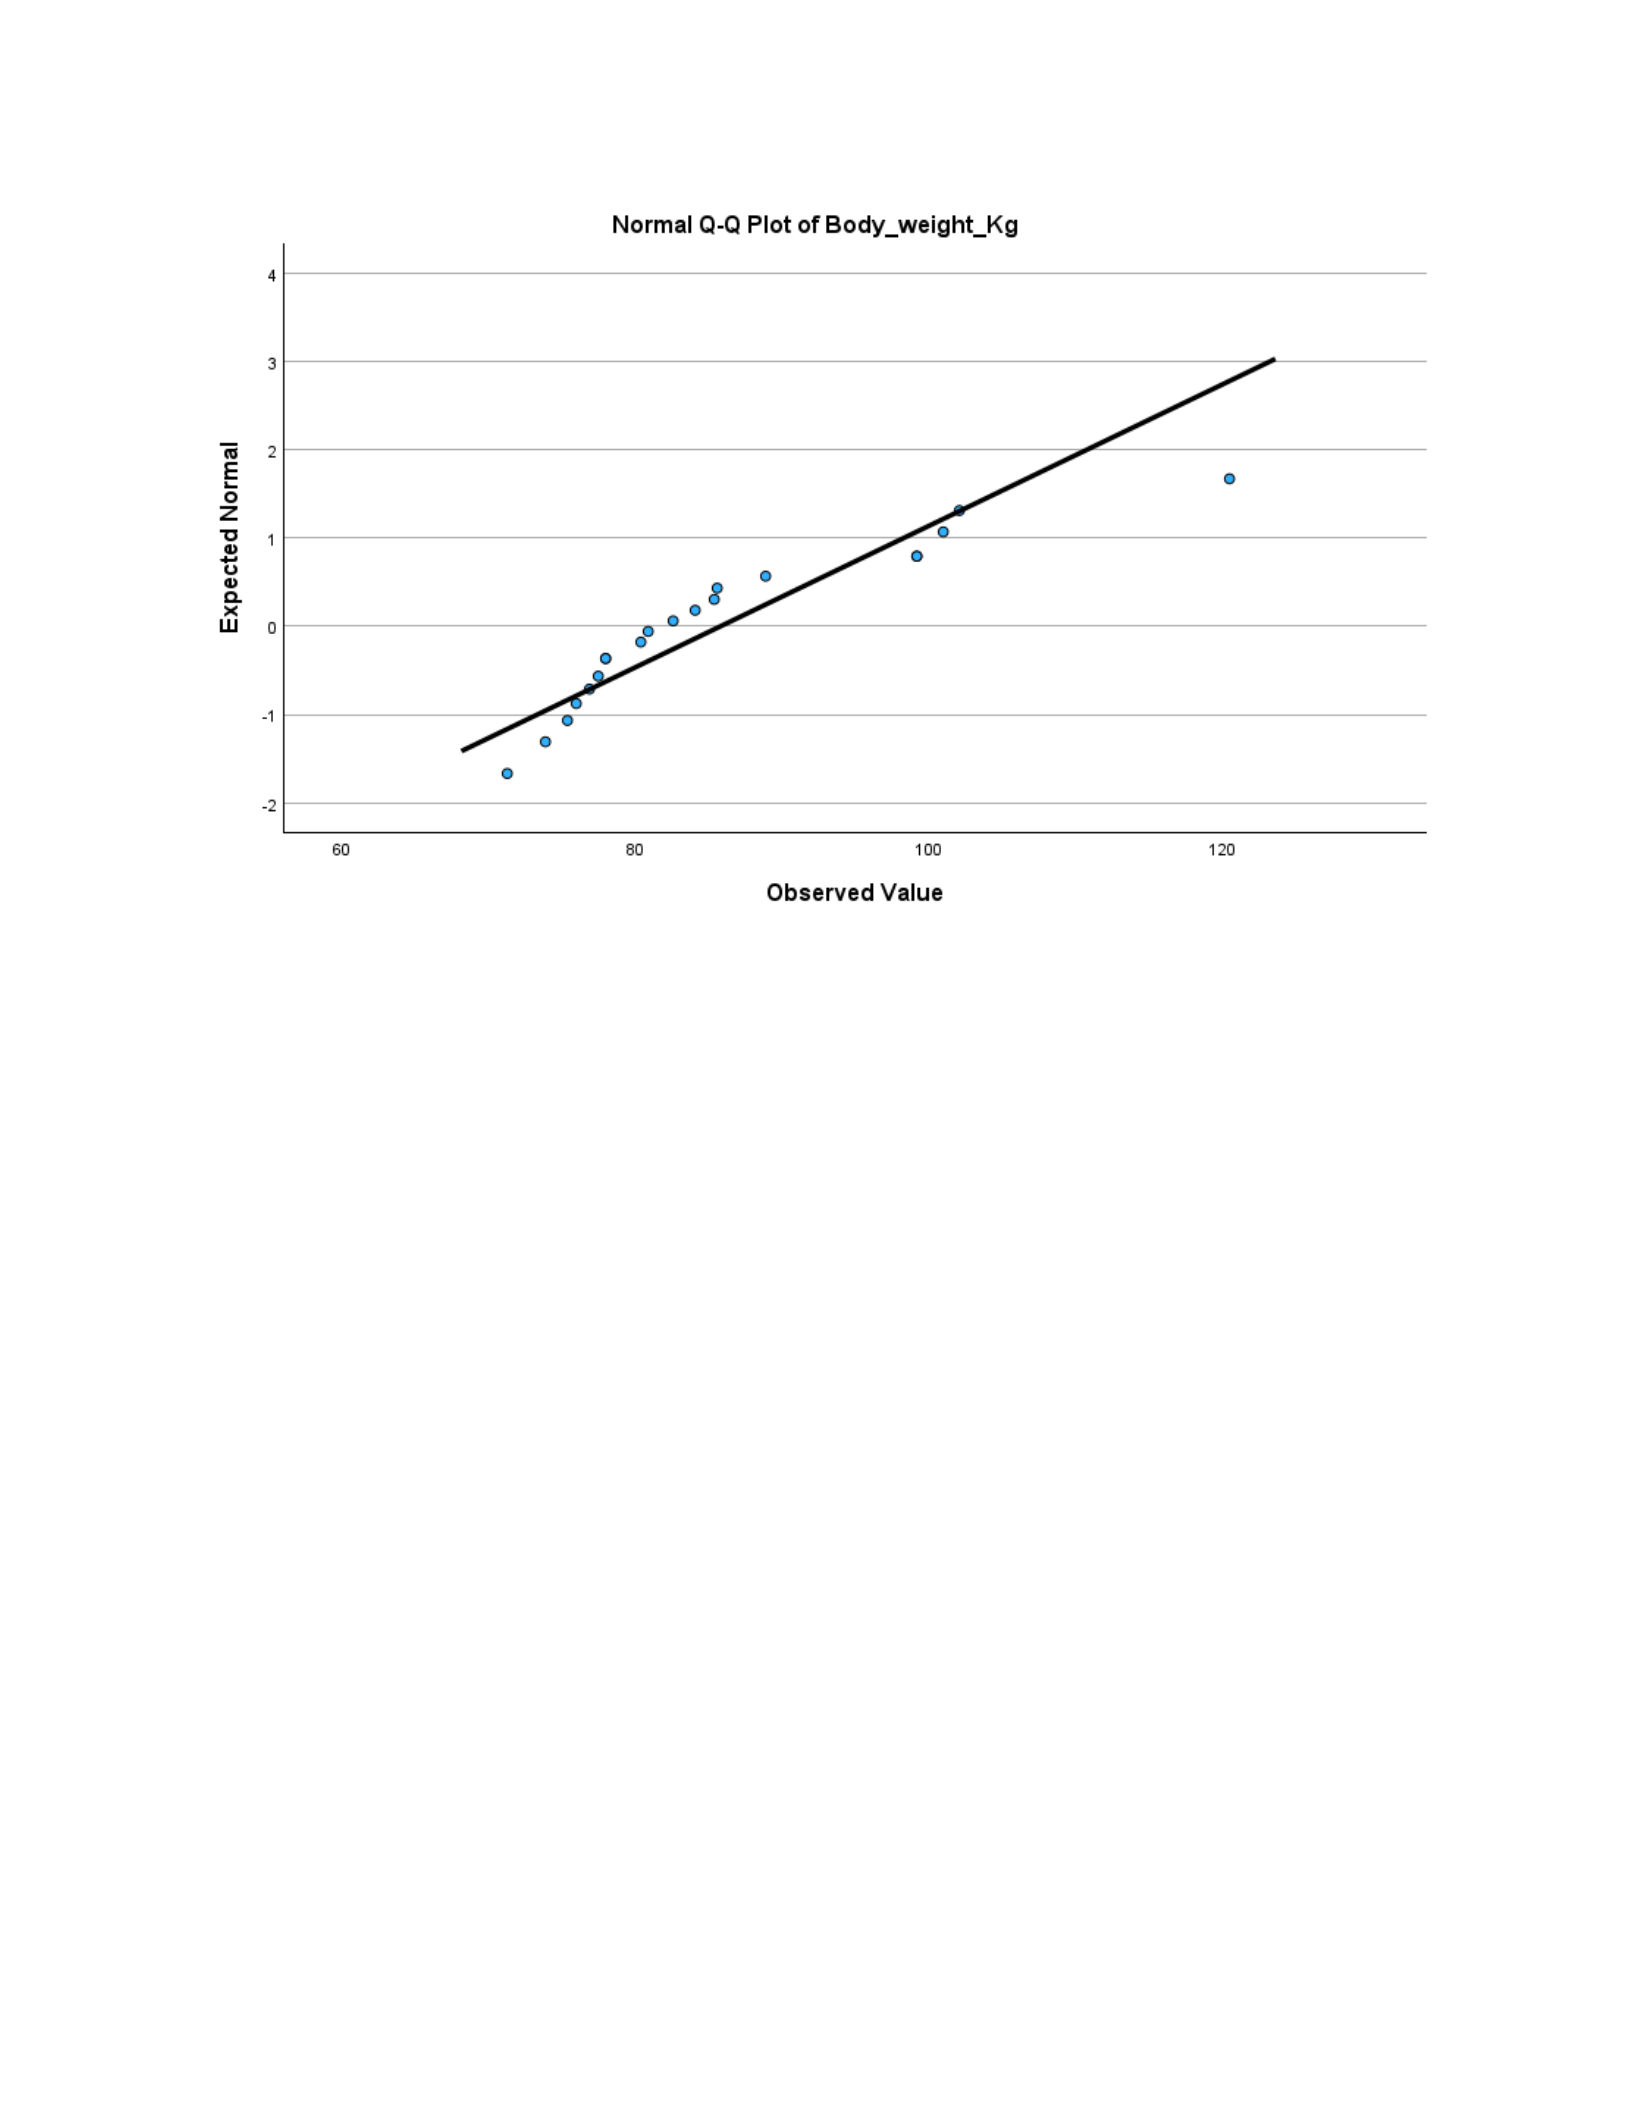
The assumptions of normality were met for mean heart rate in BPM, because the Sig
value was p=0.621, which is greater than p0.05, but the body weight in kgs assumption of
normality was violated, because the Sig value is p=0.008, which is not greater than p0.05.
(Table 2)
Table 2. Tests of normality
Tests of Normality
Kolmogorov-SmirnovaShapiro-Wilk
Statistic df Sig. Statistic df Sig.
Mean_heart_rate_B
PM
.091 20 .200*.964 20 .621
Page 2 of 16
EXSC 520
Body_weight_Kg .208 20 .024 .861 20 .008
*. This is a lower bound of the true significance.
a. Lilliefors Significance Correction
Figure 1. Histogram with normal curve for each variable
Page 3 of 16
EXSC 520
Figure 2. Normal Q-Q plot for each variable
Page 4 of 16
EXSC 520
4. Were there any outliers; how do you know?
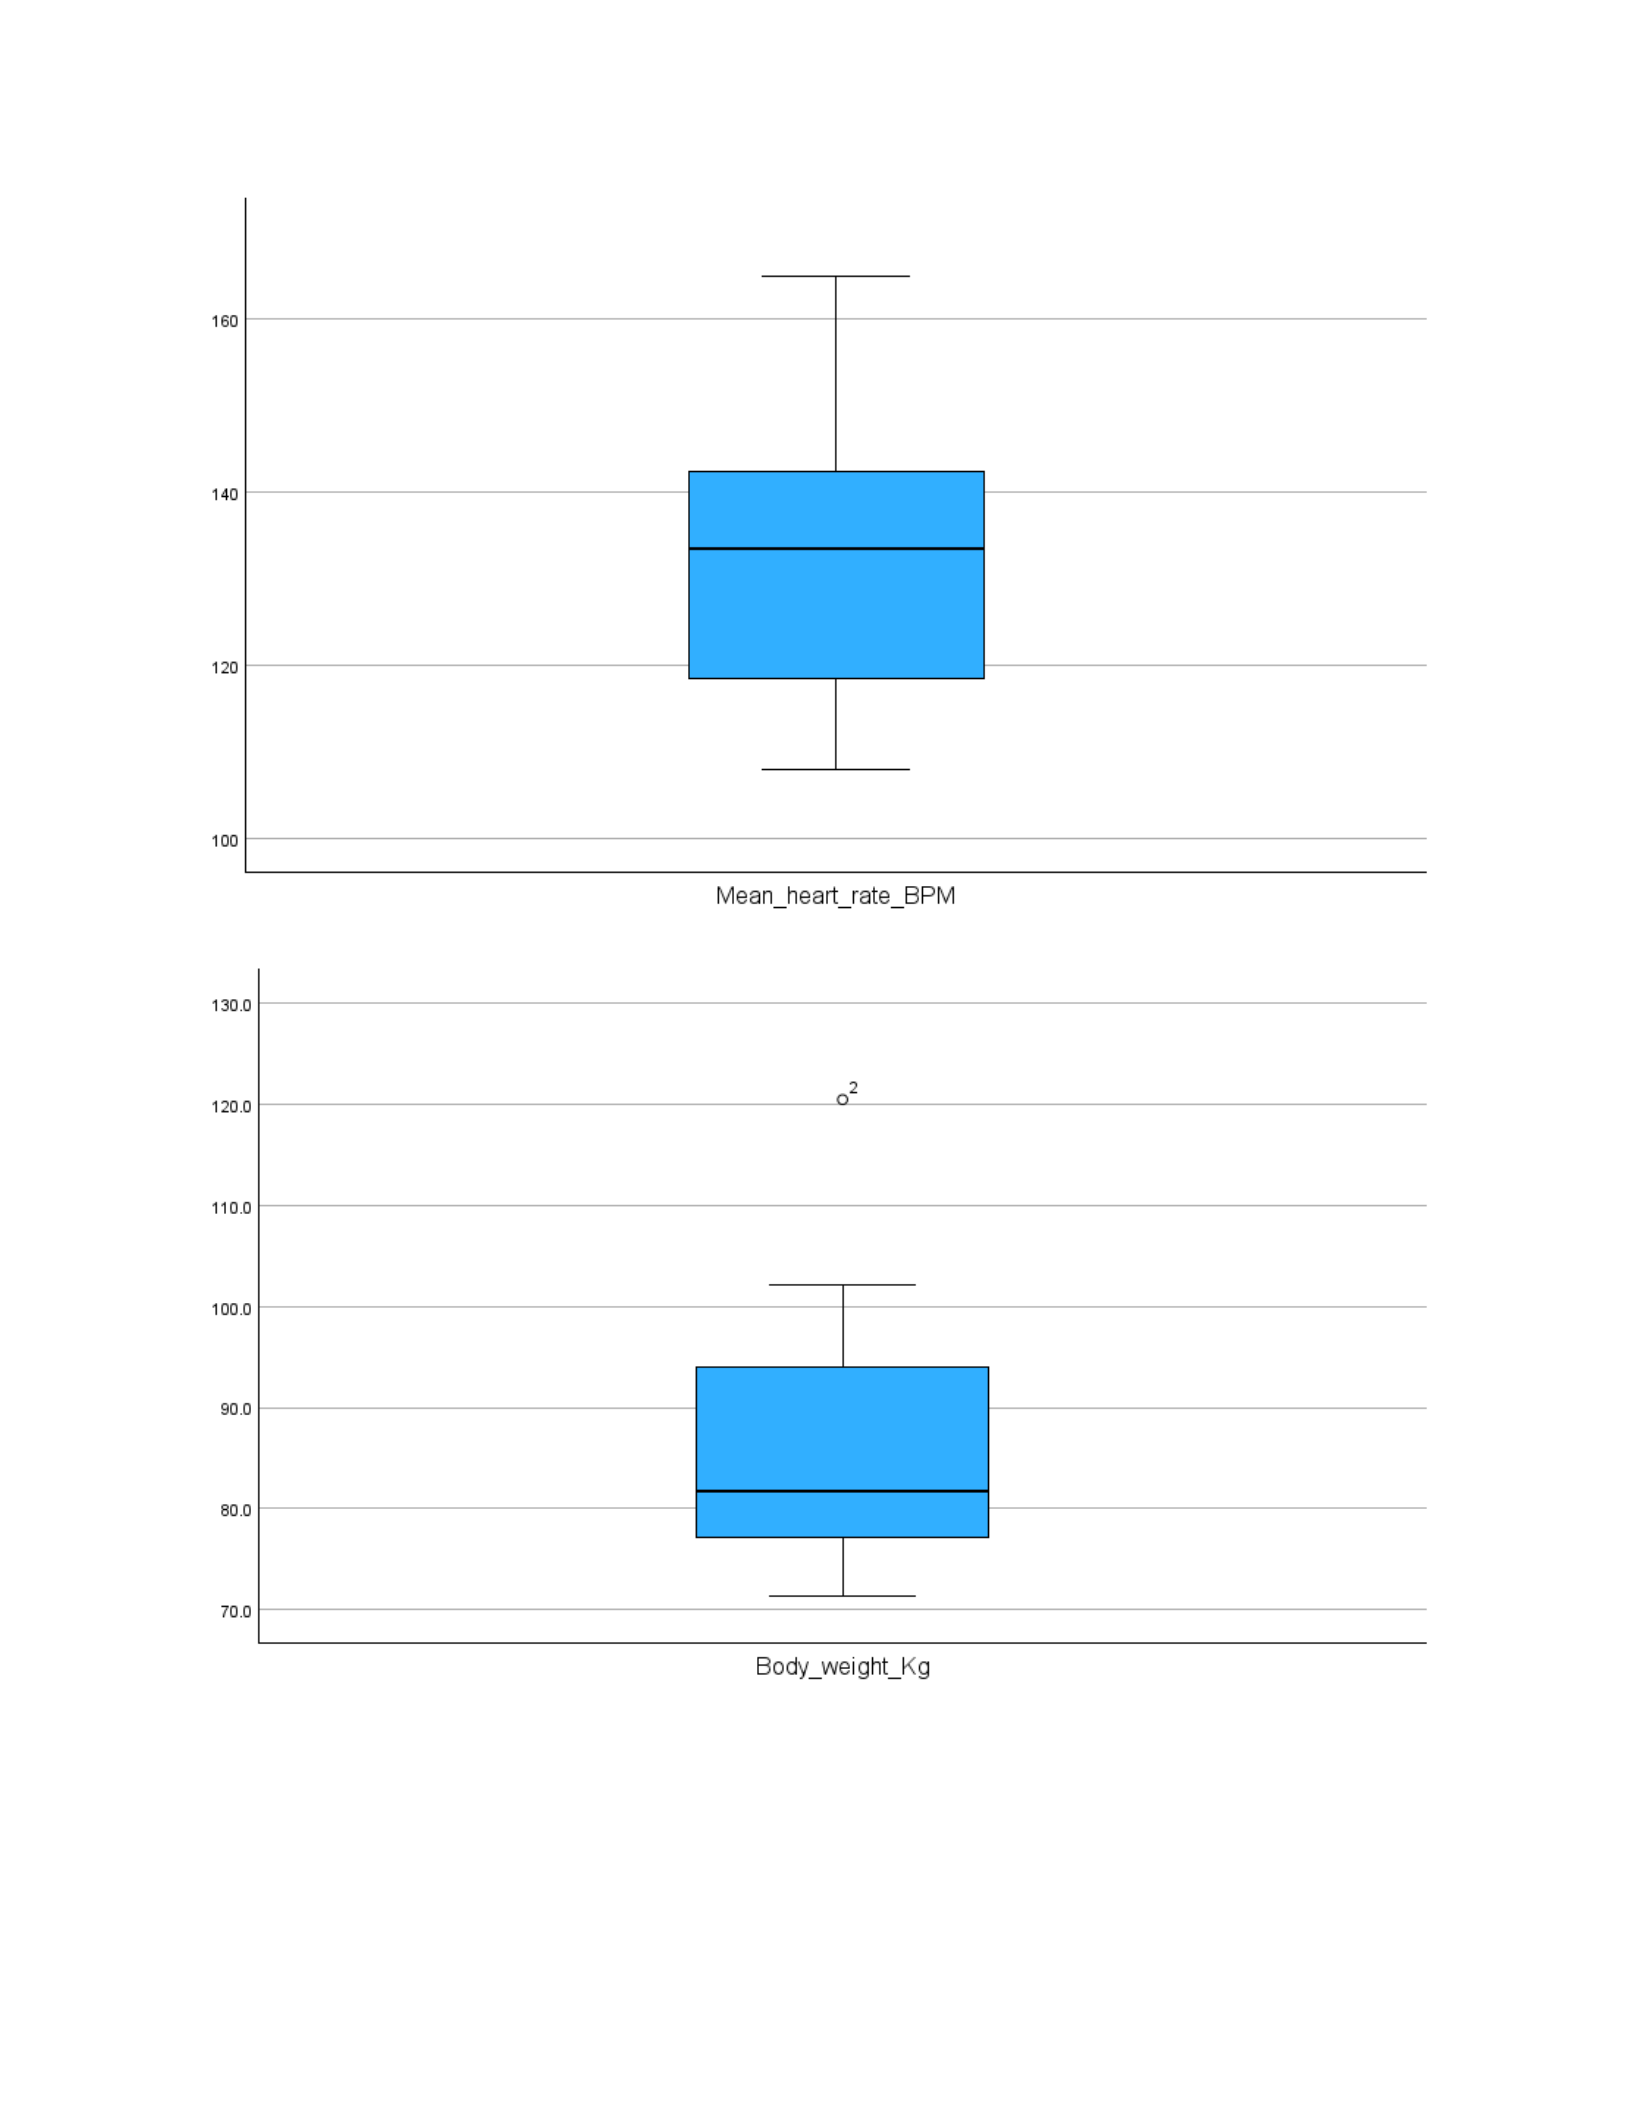
Yes, there were outliers for the body weight in kg variable, because variable
number 2 was above the mean by two standard deviations. There were no outliers for the
mean heart rate variable in BPM. (Table 3)
Table 3. Box-and-Whiskers plot for each variable
Page 5 of 16
EXSC 520
Statistical Analysis
Table 4. Descriptive statistics table
Page 6 of 16

EXSC 520
Descriptive Statistics
Mean
Std.
Deviation N
Mean_heart_rate_BP
M
132.65 15.836 20
Body_weight_Kg 85.845 12.4855 20
Table 5. Correlations table
Correlations
Mean_heart_r
ate_BPM
Body_weight_
Kg
Mean_heart_rate_BP
M
Pearson
Correlation
1 -.411
Sig. (2-tailed) .072
N20 20
Body_weight_Kg Pearson
Correlation
-.411 1
Sig. (2-tailed) .072
N20 20
Write-up- Use these questions as a guide to write an abstract (paragraph). Use past tense.
Page 7 of 16

EXSC 520
In this case study, “Is the mean heart rate during exercise correlated to body
weight?” This study looked at 20 participants, and the Pearson correlation value of r = -
0.411 was not statistically significant, which is larger than 0.005, and the p-value of this
correlation is p = 0.072. This shows an inverse relationship between these two variables
(BPM & kg). This data exposed a skewness in body weight. I agree with these results and
findings because a person's body weight will not always reflect a fit (lower mean HR) or
an unfit athlete (higher mean HR). Without other variables, such as BMI or lean muscle
mass, an atheltes body weight will not always provide a positive correlation to an atheltes
heart rate. From an exercise physiology aspect, we assume that after high intensity
exercise an atheltes heart rate increases, but how much? Fitter atheltes generally have a
lower resting heart rate than compared to obese people. This analysis makes sense, but
needs additional variables (V02 MAX) and in-body results (BMI/Lean Muscle Mass/etc)
to show a significant correlation between body weight and mean heart rate. Weighing
more does not mean that the person is overweight; heart rate is based more on how much
effort or exertion a person expends.
II. Bivariate Regression
Research question: “Can heart rate during exercise be predicted by using body weight as a
predicting variable and creating a linear regression equation?”
(THIS SECTION USES the SAME DATA and will replicate results from above, except for the
REGRESSION Section)
Assumptions Testing
1. Data level of measurement- what were the dependent and independent variables in this
study? What were their names, units and classification used in this case study (ratio, interval,
nominal etc.)?
The dependent variable is the mean heart rate BPM, and the independent variable is body
weight in kg. The classification used in this study was the ratio scale for heart rate and body
weight, which is quantitative. Beginning with zero as the absence value and consistent from
point to point. For example, if a person's heart rate is 150 BPM is three times someone else's
heart rate at 50 BPM.
2. Calculate and report the amount of skewness and kurtosis in these variables. Would skewness
or kurtosis affect the analysis or not? How do you know? Give numerical values to support
your conclusion.
The amount of skewness in mean heart rate is 0.715, and for kurtosis is 0.523.
The skewness or kurtosis would not affect the analysis of mean heart rate, because it falls
between positive and negative 1.96. (Table 1) The amount of skewness in body weight is
2.625, and for kurtosis is 1.633. The skewness in body weight would affect the analysis
because the value is greater than 1.96 or 2.625, but would not affect kurtosis, because the
value is 1.633 and falls between positive and negative 1.96. (Table 1)
Page 8 of 16

EXSC 520
Table 1. Table with skewness and kurtosis
Descriptives
Statistic Std. Error
Mean_heart_rate_BP
M
Mean 132.65 3.541
95% Confidence Interval
for Mean
Lower
Bound
125.24
Upper
Bound
140.06
5% Trimmed Mean 132.22
Median 133.50
Variance 250.766
Std. Deviation 15.836
Minimum 108
Maximum 165
Range 57
Interquartile Range 25
Skewness .366 .512
Kurtosis -.519 .992
Body_weight_Kg Mean 85.845 2.7918
95% Confidence Interval
for Mean
Lower
Bound
80.002
Upper
Bound
91.688
5% Trimmed Mean 84.728
Median 81.750
Variance 155.887
Std. Deviation 12.4855
Minimum 71.3
Maximum 120.5
Range 49.2
Interquartile Range 19.6
Skewness 1.344 .512
Kurtosis 1.620 .992
Page 9 of 16
EXSC 520
3. Was the assumption of normality met and how do you know?
The assumptions of normality were met for mean heart rate in BPM, because the Sig
value was p=0.621, which is greater than p0.05, but the body weight in kgs assumption of
normality was violated, because the Sig value is p=0.008, which is not greater than p0.05. (Table
2)
Table 2. Tests of normality
Tests of Normality
Kolmogorov-SmirnovaShapiro-Wilk
Statistic df Sig. Statistic df Sig.
Mean_heart_rate_B
PM
.091 20 .200*.964 20 .621
Body_weight_Kg .208 20 .024 .861 20 .008
*. This is a lower bound of the true significance.
a. Lilliefors Significance Correction
Figure 1. Histogram with normal curve for each variable
Page 10 of 16
EXSC 520
Figure 2. Normal Q-Q plot for each variable
Page 11 of 16
EXSC 520
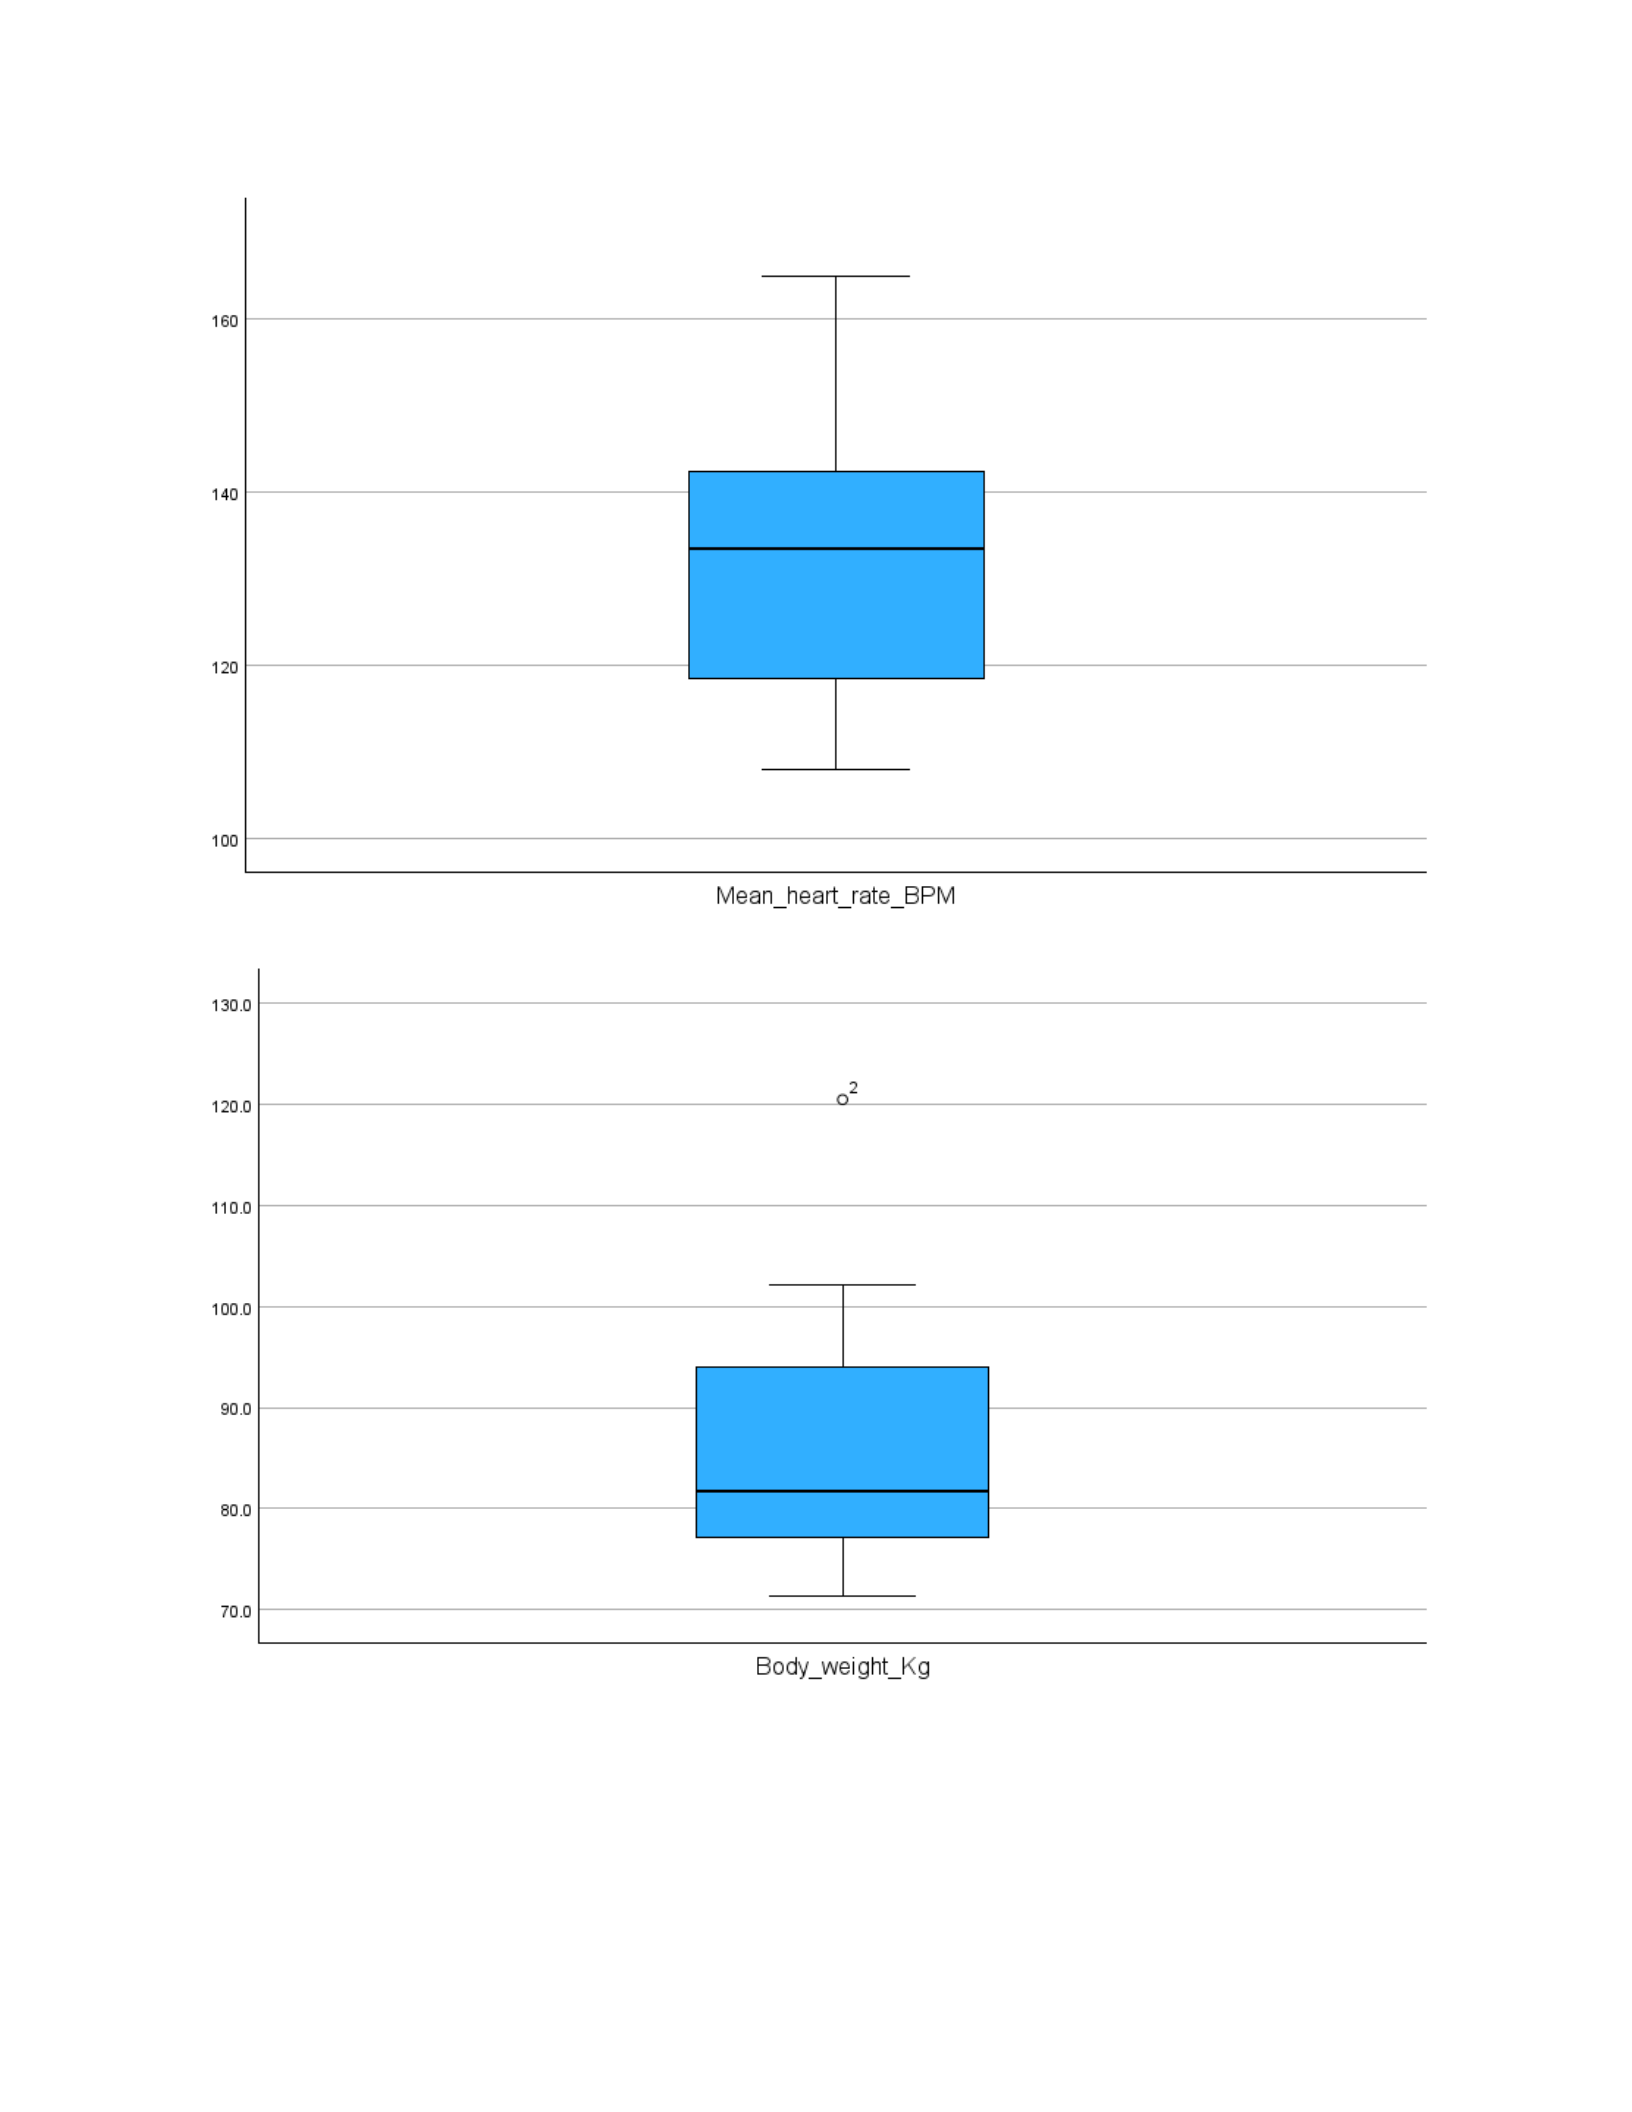
4. Were there any outliers; how do you know?
Yes, there were outliers for the body weight in kg variable, because variable
number 2 was above the mean by two standard deviations. There were no outliers for the
mean heart rate variable in BPM. (Table 3)
Table 3. Box-and-Whiskers plot for each variable
Page 12 of 16
EXSC 520
Statistical Analysis
Page 13 of 16

EXSC 520
Table 4. Descriptive statistics table
Descriptive Statistics
Mean
Std.
Deviation N
Mean_heart_rate_BP
M
132.65 15.836 20
Body_weight_Kg 85.845 12.4855 20
Table 5. Correlations table
Correlations
Mean_heart_r
ate_BPM
Body_weight_
Kg
Pearson
Correlation
Mean_heart_rate_BP
M
1.000 -.411
Body_weight_Kg -.411 1.000
Sig. (1-tailed) Mean_heart_rate_BP
M
. .036
Body_weight_Kg .036 .
N Mean_heart_rate_BP
M
20 20
Body_weight_Kg 20 20
Page 14 of 16
EXSC 520
Table 6. The model summary table
Model Summaryb
Model R R Square
Adjusted R
Square
Std. Error of
the Estimate
Durbin-
Watson
1.411a.169 .123 14.834 1.276
a. Predictors: (Constant), Body_weight_Kg
b. Dependent Variable: Mean_heart_rate_BPM
Table 7. The ANOVA table
ANOVAa
Model
Sum of
Squares df
Mean
Square F Sig.
1 Regression 803.927 1 803.927 3.654 .072b
Residual 3960.623 18 220.035
Total 4764.550 19
a. Dependent Variable: Mean_heart_rate_BPM
b. Predictors: (Constant), Body_weight_Kg
Table 8. The coefficients table
Use this space to type out the regression equation for this data.
y = mx + b or HR = m(kg) + b
Coefficientsa
Model
Unstandardized
Coefficients
Standardize
d
Coefficients
t Sig.
Collinearity
Statistics
B Std. Error Beta
Toleran
ce VIF
Page 15 of 16

EXSC 520
1 (Constant) 177.374 23.632 7.506 <.001
Body_weight
_Kg
-.521 .273 -.411 -1.911 .072 1.000 1.000
a. Dependent Variable: Mean_heart_rate_BPM
Write-up- Use these questions as a guide to write an abstract (paragraph). Use past tense.
The research question in this case study is, “Can heart rate during exercise be
predicted by using body weight as a predicting variable and creating a linear regression
equation?” The sample size was 20 participants, and the Pearson correlation was r = -
0.411, and the p-value is p = 0.036, which is greater than alpha 0.005, and is not
statistically significant. This is a negative correlation between BPM and kg, because r
doesn’t cross +1. The regression formula is HR = -0.521(bodyweight) + 177.374 for this
data set. The body weight of these participants only influenced their heart rate by 17% of
the time. With only the participant's body weight, predictions will be inconsistent and not
provide valid data to determine one's heart rate. Conducting assessments on participants
incorporates numerous other variables in exercise physiology, such as height, BMI,
fitness level, aerobic capacity, and many other variables. This analysis has potential when
the latter variables are considered when predicting one’s exercise heart rate.
Page 16 of 16

