



ENGI 305 - DATA ANALYSIS METHODS AND
MODELING - Classification and Regression
Trees Question Bank
Question 1
Consider a dataset with the following variables: X1,X2,X3, and Y. We
want to create a classification and regression tree model to predict Ybased on
the values of X1,X2, and X3.
The dataset has been split into two nodes using the variable X1with a split
point of 5. The mean value of Yin node 1 is 20 and in node 2 is 30.
1. Calculate the mean squared error for the split on variable X1.
2. Determine the information gain for variable X1.
Solution:
a) To calculate the mean squared error (MSE) for the split on variable X1,
we use the formula:
MSE = 1
n
n
X
i=1
(Yi−¯
Yi)2
where: - nis the total number of observations in the split node. - Yiis the
actual value of Yfor observation i. - ¯
Yiis the mean value of Yin the split node.
For node 1:
MSE1=1
n1
n1
X
i=1
(Yi−20)2
For node 2:
MSE2=1
n2
n2
X
i=1
(Yi−30)2
b) To determine the information gain for variable X1, we need to calculate
the entropy before the split and the weighted average entropy after the split.
Entropy before the split:
H(before) = −p1log2(p1)−p2log2(p2)
1

where: - p1is the proportion of observations in node 1. - p2is the proportion
of observations in node 2.
Weighted average entropy after the split:
H(after) = n1
nH(node 1) + n2
nH(node 2)
Information gain:
Gain = H(before) −H(after)
Question 1:
Consider a dataset with the following variables: X1,X2,X3, and
Y. We want to create a classification and regression tree model to
predict Ybased on the values of X1,X2, and X3.
The dataset has been split into two nodes using the variable X1
with a split point of 5. The mean value of Yin node 1 is 20 and in
node 2 is 30.
1. Calculate the mean squared error for the split on variable X1.
2. Determine the information gain for variable X1.
Solution:
a) To calculate the mean squared error (MSE) for the split on
variable X1, we use the formula:
MSE =1
n
n
X
i=1
(Yi−¯
Yi)2
where: - nis the total number of observations in the split node. -
Yiis the actual value of Yfor observation i. - ¯
Yiis the mean value of
Yin the split node.
For node 1:
MSE1=1
n1
n1
X
i=1
(Yi−20)2
For node 2:
MSE2=1
n2
n2
X
i=1
(Yi−30)2
b) To determine the information gain for variable X1, we need
to calculate the entropy before the split and the weighted average
entropy after the split.
Entropy before the split:
H(before) = −p1log2(p1)−p2log2(p2)
where: - p1is the proportion of observations in node 1. - p2is the
proportion of observations in node 2.
2

Weighted average entropy after the split:
H(after) = n1
nH(node 1) + n2
nH(node 2)
Information gain:
Gain =H(before)−H(after)
Question 2
X1 X2 Y
3 7 A
5 4 B
2 6 A
6 3 B
7 5 A
5 9 B
Solution: 1. Calculate the Gini impurity for the initial node:
Gini = 1 −
k
X
i=1
(pi)2
Gini = 1 − 3
62
+3
62!= 0.5
2. Split the nodes based on attribute X1 and calculate the Gini
impurity for each child node. Choose the split point that yields the
lowest Gini impurity. - For X1 ¡= 4:
GiniA= 1 − 1
22
+1
22!= 0.5
GiniB= 1 − 2
42
+2
42!= 0.5
- For X1 ¿ 4:
GiniA= 1 − 2
22
+ 02!= 0
GiniB= 1 − 0 + 1
42!= 0.1875
3. Choose the split point that yields the lowest Gini impurity,
which is X1 ¿ 4 for splitting the initial node.
3

4. Continue splitting the child nodes based on X2 and calculate
the Gini impurity for each child node until the Gini impurity is 0.
5. Construct the classification tree based on the chosen split
points.
The constructed classification tree will have nodes splitting based
on X1 and X2 to classify the given dataset.
Answer: The constructed classification tree based on the given dataset.
Question 2: Construct a classification tree using the given dataset:
X1 X2 Y
3 7 A
5 4 B
2 6 A
6 3 B
7 5 A
5 9 B
Solution: 1. Calculate the Gini impurity for the initial node:
Gini = 1 −
k
X
i=1
(pi)2
Gini = 1 − 3
62
+3
62!= 0.5
2. Split the nodes based on attribute X1 and calculate the Gini
impurity for each child node. Choose the split point that yields the
lowest Gini impurity. - For X1 ¡= 4:
GiniA= 1 − 1
22
+1
22!= 0.5
GiniB= 1 − 2
42
+2
42!= 0.5
- For X1 ¿ 4:
GiniA= 1 − 2
22
+ 02!= 0
GiniB= 1 − 0 + 1
42!= 0.1875
3. Choose the split point that yields the lowest Gini impurity,
which is X1 ¿ 4 for splitting the initial node.
4

4. Continue splitting the child nodes based on X2 and calculate
the Gini impurity for each child node until the Gini impurity is 0.
5. Construct the classification tree based on the chosen split
points.
The constructed classification tree will have nodes splitting based
on X1 and X2 to classify the given dataset.
Answer: The constructed classification tree based on the given dataset.
Question 3
A dataset contains information on student test scores and various
factors such as study hours, attendance, and extracurricular activi-
ties. The goal is to build a decision tree to predict a student’s final
exam grade based on these factors. The dataset is divided into a
training set and a testing set.
(a) Explain the concept of decision trees and how they are used for
classification and regression problems.
(b) Discuss the process of building a decision tree for regression
analysis, including splitting criteria and tree pruning methods.
(c) Given the training dataset with the following variables:
Study hours (hours)
Attendance rate (%)
Extracurricular activities (yes/no)
and the corresponding final exam grades, build a simple regres-
sion tree using the following steps:
i. Calculate the initial impurity measure for the target variable
(final exam grades).
ii. Determine the best split variable (feature) and split point
based on the impurity measure.
iii. Split the dataset into two child nodes based on the best
split.
iv. Calculate the impurity measures for the child nodes and
check for the stopping criteria.
v. Repeat steps ii-iv recursively until the stopping criteria are
met.
Show the step-by-step process of building the regression tree
based on the provided dataset.
5

(d) Evaluate the performance of the regression tree on the testing
dataset by calculating metrics such as mean squared error (MSE)
and coefficient of determination (R2).
Question 3:
A dataset contains information on student test scores and various
factors such as study hours, attendance, and extracurricular activi-
ties. The goal is to build a decision tree to predict a student’s final
exam grade based on these factors. The dataset is divided into a
training set and a testing set.
(a) Explain the concept of decision trees and how they are used for
classification and regression problems.
(b) Discuss the process of building a decision tree for regression
analysis, including splitting criteria and tree pruning methods.
(c) Given the training dataset with the following variables:
Study hours (hours)
Attendance rate (%)
Extracurricular activities (yes/no)
and the corresponding final exam grades, build a simple regres-
sion tree using the following steps:
i. Calculate the initial impurity measure for the target variable
(final exam grades).
ii. Determine the best split variable (feature) and split point
based on the impurity measure.
iii. Split the dataset into two child nodes based on the best
split.
iv. Calculate the impurity measures for the child nodes and
check for the stopping criteria.
v. Repeat steps ii-iv recursively until the stopping criteria are
met.
Show the step-by-step process of building the regression tree
based on the provided dataset.
(d) Evaluate the performance of the regression tree on the testing
dataset by calculating metrics such as mean squared error (MSE)
and coefficient of determination (R2).
6
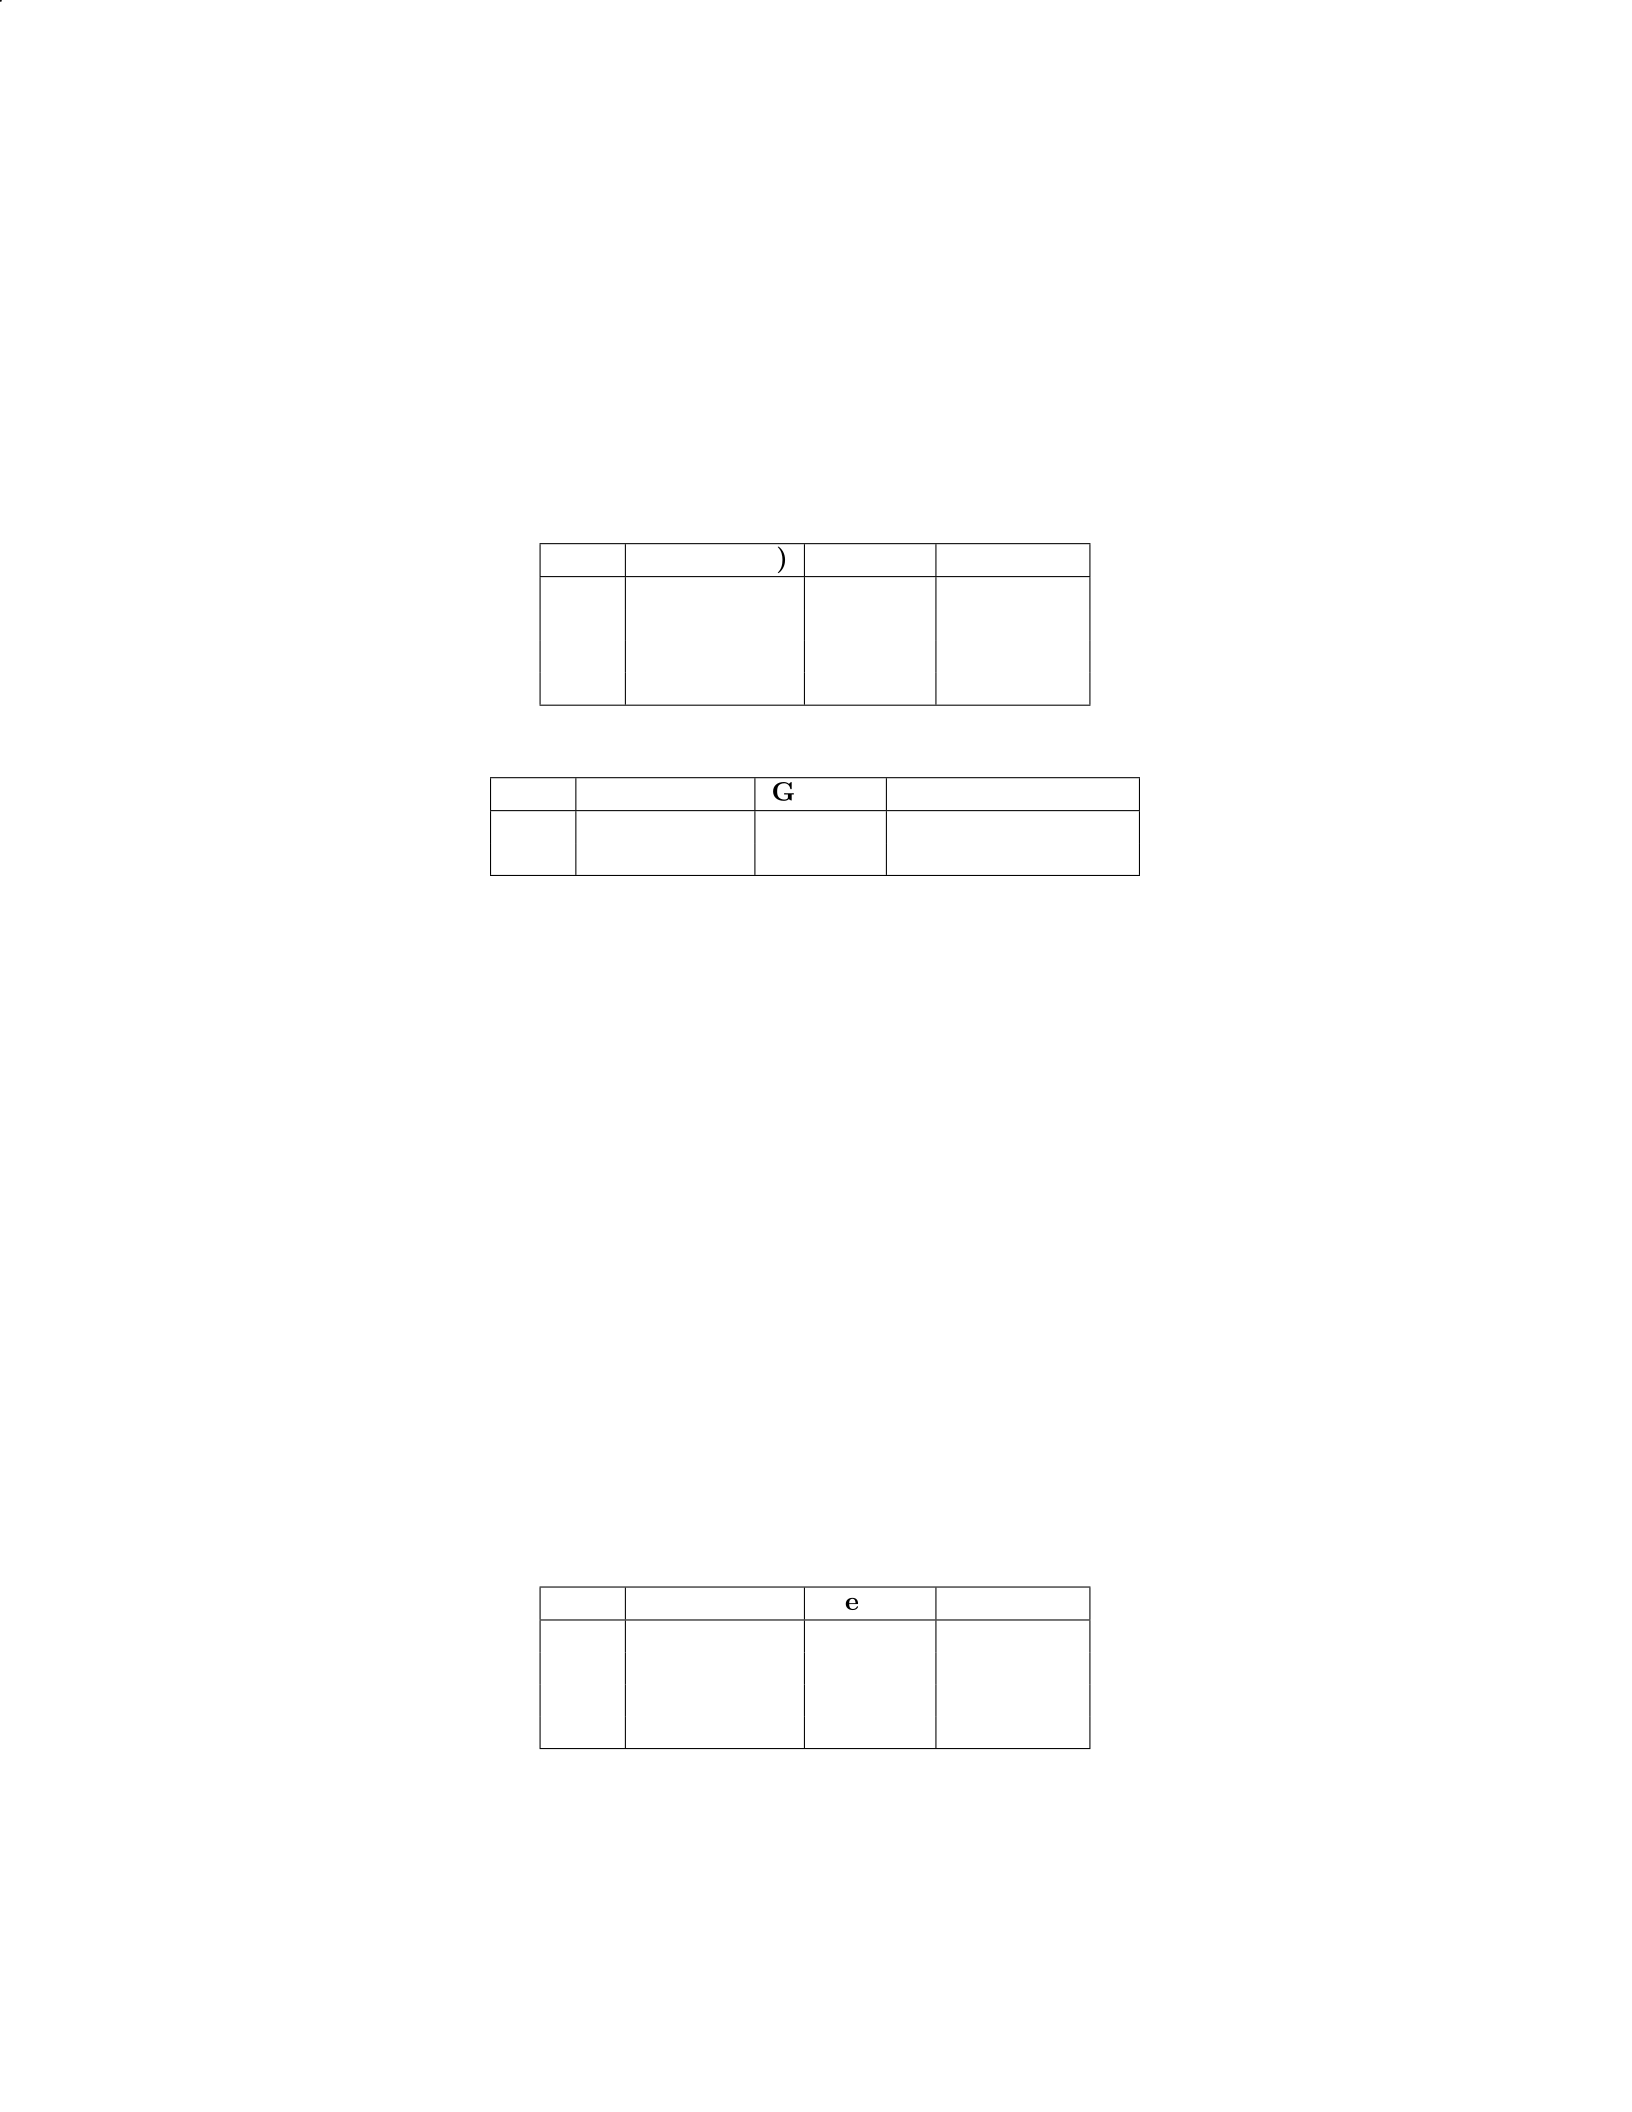
Question 4
A researcher wants to build a classification tree to predict whether
a customer will purchase a product based on their age, income, and
gender. The dataset consists of 1000 observations with 70
Training Data:
Age Income (
$
) Gender Purchase
25 30000 Male Yes
35 50000 Female No
45 70000 Male Yes
30 40000 Female Yes
Testing Data:
Age Income (
$
) Gender Actual Purchase
40 60000 Male No
50 80000 Female Yes
a) Draw the classification tree based on the training data.
b) Using the classification tree, predict the purchase outcome for
the testing data.
Solution:
a) The classification tree based on the training data is as follows:
[Gender [Male, edge label=node[midway,left]Age ≤30 [No, edge
label=node[midway,left]Income ≤40000] [Yes, edge label=node[midway,right]Income
>40000] ] [Female, edge label=node[midway,right]Age >30 [Yes, edge
label=node[midway,left]Income ≤60000] [No, edge label=node[midway,right]Income
>60000] ] ]
b) Predictions for the testing data:
For the first observation (40, 60000, Male): Following the tree:
- Gender: Male - Age: 40 ¿ 30 - Income: 60000 ¿ 40000 Predicted
outcome: Yes
For the second observation (50, 80000, Female): Following the tree:
- Gender: Female - Age: 50 ¿ 30 - Income: 80000 ¿ 60000 Predicted
outcome: YesQuestion 4:
A researcher wants to build a classification tree to predict whether
a customer will purchase a product based on their age, income, and
gender. The dataset consists of 1000 observations with 70
Training Data:
Age Income (
$
) Gender Purchase
25 30000 Male Yes
35 50000 Female No
45 70000 Male Yes
30 40000 Female Yes
Testing Data:
7

Age Income (
$
) Gender Actual Purchase
40 60000 Male No
50 80000 Female Yes
a) Draw the classification tree based on the training data.
b) Using the classification tree, predict the purchase outcome for
the testing data.
Solution:
a) The classification tree based on the training data is as follows:
[Gender [Male, edge label=node[midway,left]Age ≤30 [No, edge
label=node[midway,left]Income ≤40000] [Yes, edge label=node[midway,right]Income
>40000] ] [Female, edge label=node[midway,right]Age >30 [Yes, edge
label=node[midway,left]Income ≤60000] [No, edge label=node[midway,right]Income
>60000] ] ]
b) Predictions for the testing data:
For the first observation (40, 60000, Male): Following the tree:
- Gender: Male - Age: 40 ¿ 30 - Income: 60000 ¿ 40000 Predicted
outcome: Yes
For the second observation (50, 80000, Female): Following the tree:
- Gender: Female - Age: 50 ¿ 30 - Income: 80000 ¿ 60000 Predicted
outcome: Yes
Question 5
Customer ID Age (years) Purchase Amount (
$
)
1 25 50
2 45 100
3 30 60
4 35 70
5 20 40
6 40 90
7 50 120
Use the Classification and Regression Tree (CART) algorithm to
build a decision tree to classify customers into two classes: A (low
purchase amount) and B (high purchase amount). When building the
tree, use Gini impurity as the splitting criterion.
Solution:
1. Calculate Gini Impurity for the Root Node:
The Gini impurity for the root node is calculated based on the
class distribution of the entire dataset:
Gini root = 1−3
72+4
72
Gini root = 1−9
49 +16
49
8

Gini root = 1−25
49
Gini root = 24
49
2. Split the Data based on Age (years):
Choose a split point for Age to calculate Gini impurity for each
split.
For example, let’s consider splitting at Age = 30:
Left Child Node (Age ≤30):
Gini left = 1−2
32+1
32
Gini left = 1−4
9+1
9
Gini left = 1−5
9
Gini left = 4
9
Right Child Node (Age >30):
Gini right = 1−1
42+3
42
Gini right = 1−1
16 +9
16
Gini right = 1−10
16
Gini right = 6
16
3. Calculate Information Gain:
Information Gain = Gini root - Weighted Average of Child Node
Gini Impurity
Information Gain for Age ≤30 = 24
49 −3
7×4
9+4
7×6
16
Information Gain for Age ≤30 = 24
49 −12
63 +24
112
Information Gain for Age ≤30 = 24
49 −4
21 +3
14
Information Gain for Age ≤30 = 24
49 −8
42 +9
42
Information Gain for Age ≤30 = 24
49 −17
42
Information Gain for Age ≤30 0.0204
4. Continue the Splitting Process:
Continue splitting the nodes further based on purchase amount
and calculate the information gain at each split point until the
decision tree is fully grown.
Question 5:
Consider the following dataset that categorizes customers into two
classes based on their purchase behavior:
9
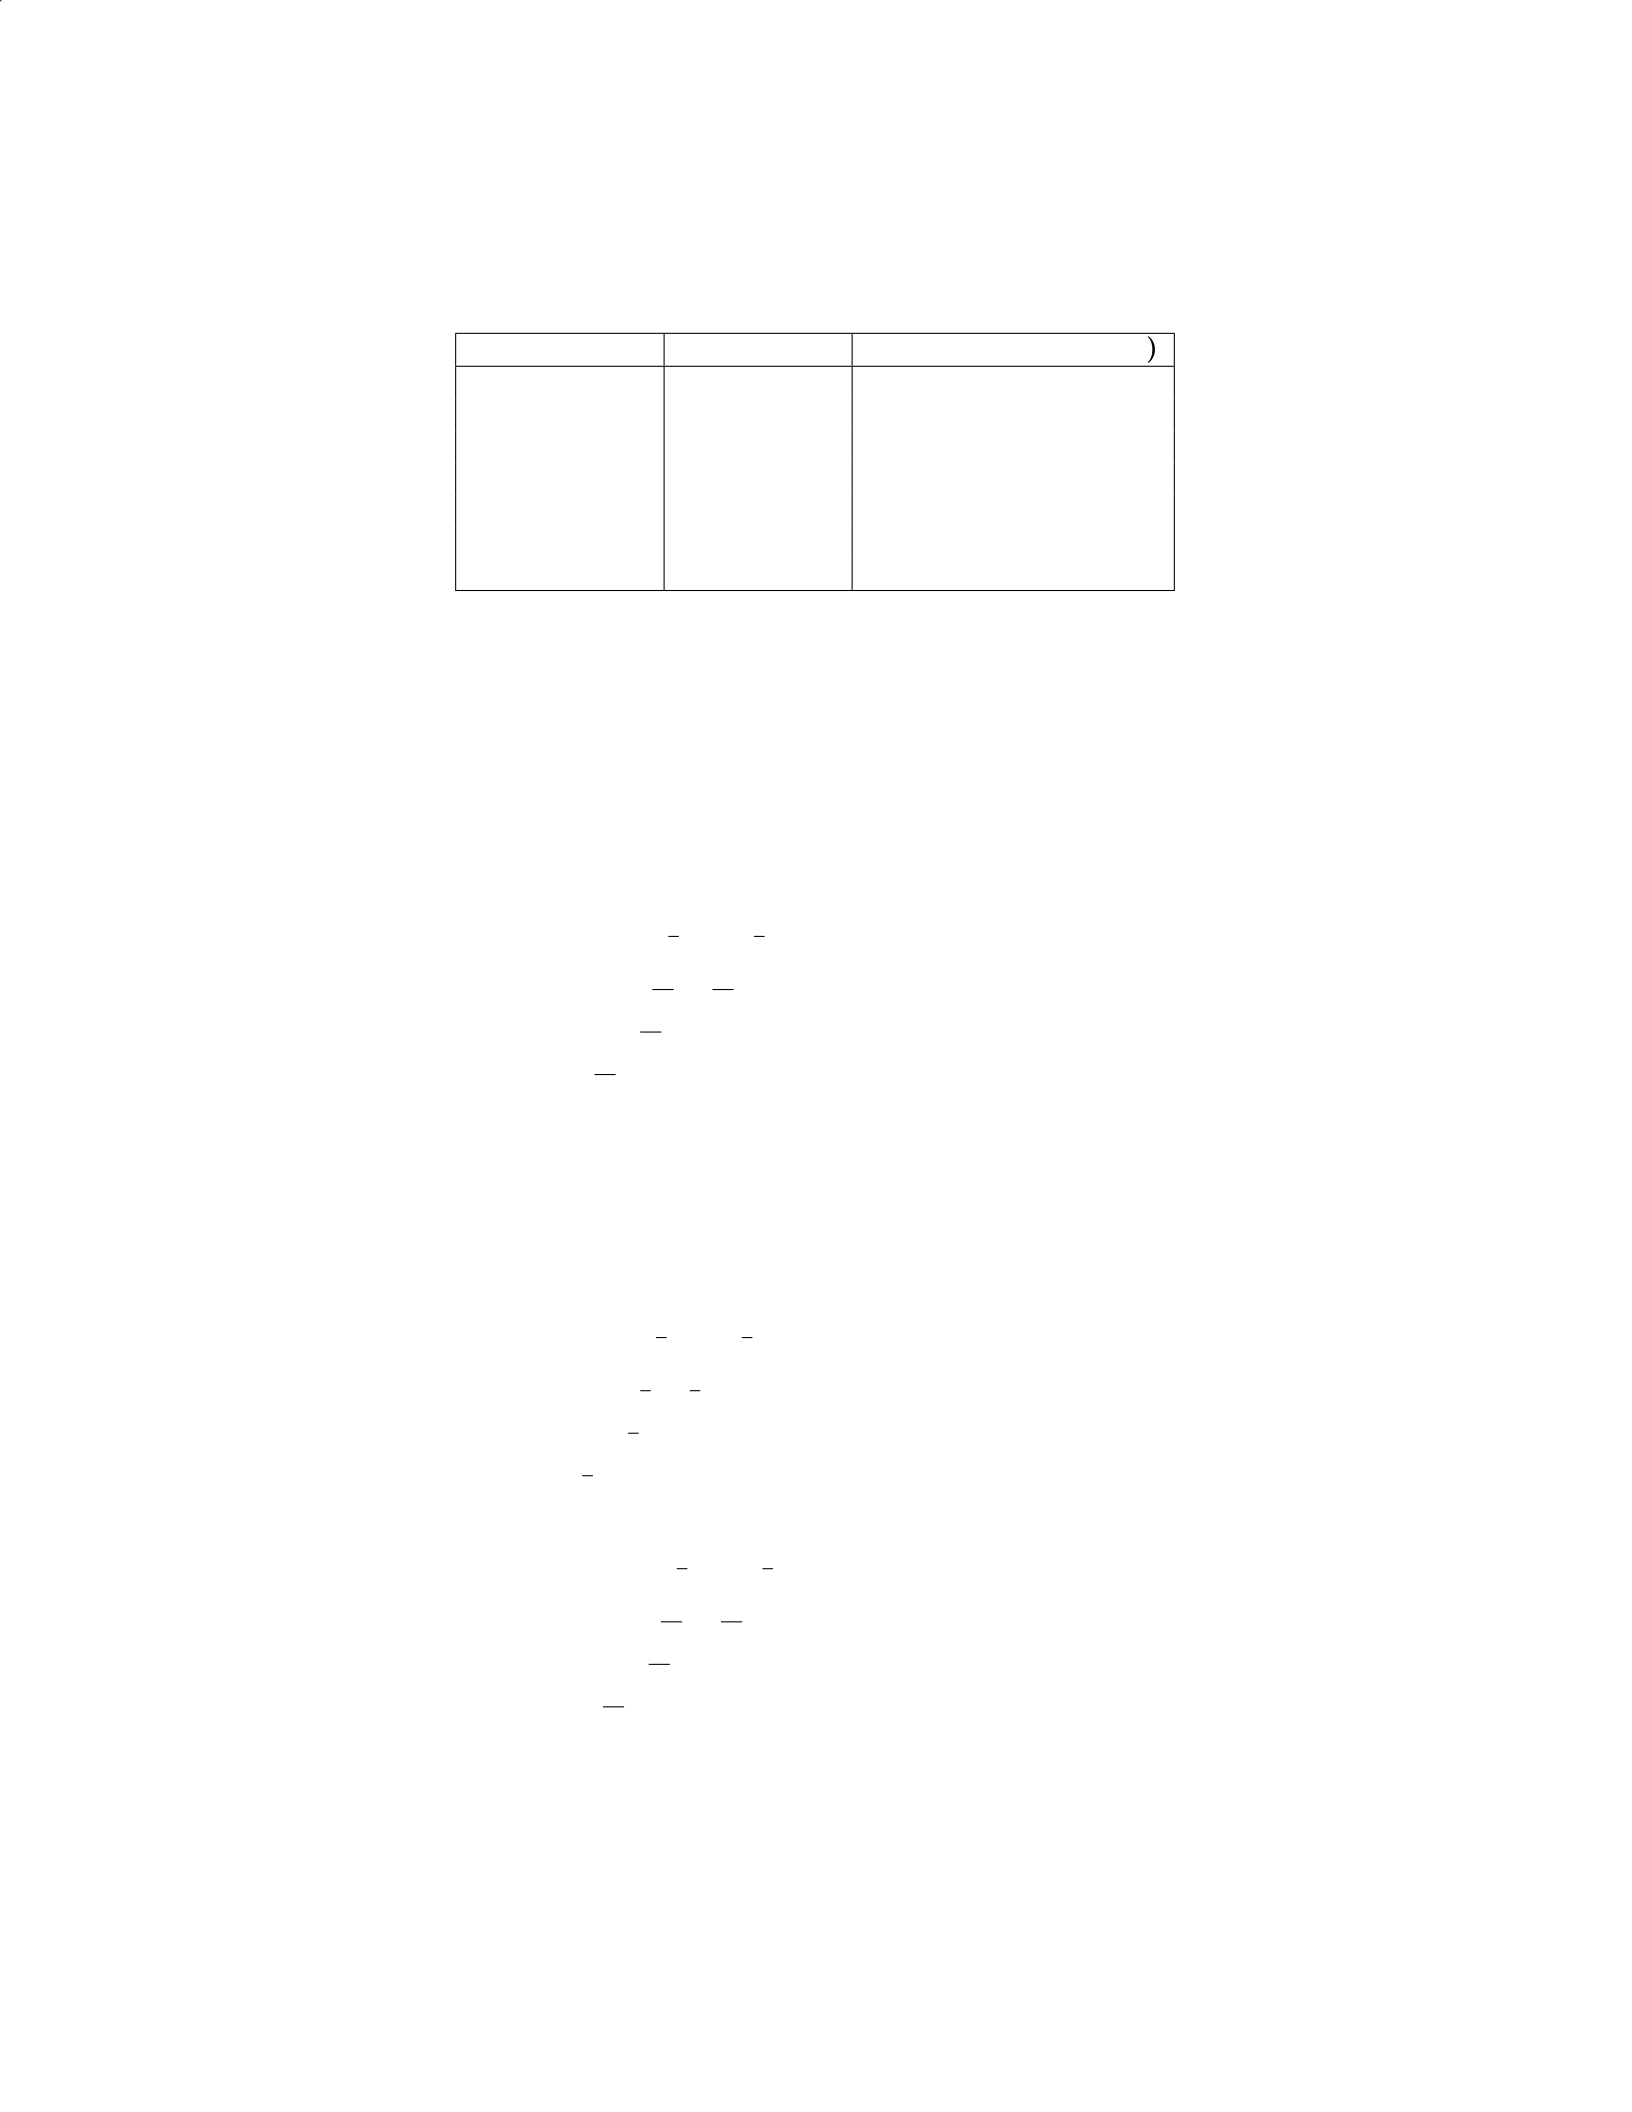
Customer ID Age (years) Purchase Amount (
$
)
1 25 50
2 45 100
3 30 60
4 35 70
5 20 40
6 40 90
7 50 120
Use the Classification and Regression Tree (CART) algorithm to
build a decision tree to classify customers into two classes: A (low
purchase amount) and B (high purchase amount). When building the
tree, use Gini impurity as the splitting criterion.
Solution:
1. Calculate Gini Impurity for the Root Node:
The Gini impurity for the root node is calculated based on the
class distribution of the entire dataset:
Gini root = 1−3
72+4
72
Gini root = 1−9
49 +16
49
Gini root = 1−25
49
Gini root = 24
49
2. Split the Data based on Age (years):
Choose a split point for Age to calculate Gini impurity for each
split.
For example, let’s consider splitting at Age = 30:
Left Child Node (Age ≤30):
Gini left = 1−2
32+1
32
Gini left = 1−4
9+1
9
Gini left = 1−5
9
Gini left = 4
9
Right Child Node (Age >30):
Gini right = 1−1
42+3
42
Gini right = 1−1
16 +9
16
Gini right = 1−10
16
Gini right = 6
16
10

3. Calculate Information Gain:
Information Gain = Gini root - Weighted Average of Child Node
Gini Impurity
Information Gain for Age ≤30 = 24
49 −3
7×4
9+4
7×6
16
Information Gain for Age ≤30 = 24
49 −12
63 +24
112
Information Gain for Age ≤30 = 24
49 −4
21 +3
14
Information Gain for Age ≤30 = 24
49 −8
42 +9
42
Information Gain for Age ≤30 = 24
49 −17
42
Information Gain for Age ≤30 0.0204
4. Continue the Splitting Process:
Continue splitting the nodes further based on purchase amount
and calculate the information gain at each split point until the
decision tree is fully grown.
Question 6
Explain the concept of pruning in Classification and Regression
Trees (CART) and describe the two common approaches used for
pruning.
Step-by-step solution:
1. Pruning in CART: - Pruning is the process of reducing the size
of a decision tree by removing nodes that add little predictive power.
This helps prevent overfitting and improves the tree’s generalization
ability.
2. Two common approaches for pruning: a) Cost complexity prun-
ing (also known as weakest link pruning): - This method involves
growing a large tree without setting a stopping rule, then pruning
back the tree while controlling for a tuning parameter (usually called
alpha or complexity parameter). The pruning process stops when
further splits do not improve the overall performance of the tree. -
The algorithm calculates a cost complexity measure for each sub-tree
as a function of the error reduction and the size of the sub-tree. The
sub-tree with the minimum cost complexity measure is selected as
the pruned tree.
b) Reduced error pruning: - This approach involves first splitting
the dataset into training and validation sets. The decision tree is
then built using the training set and pruned using the validation set
by iteratively replacing subtrees with leaf nodes. The replacement is
accepted if it improves the tree’s performance on the validation set.
- The process continues until pruning no longer improves the tree’s
performance on the validation set.
11

These two approaches help improve the performance and inter-
pretability of decision trees by simplifying the tree structure while
maintaining predictive accuracy.Question 6:
Explain the concept of pruning in Classification and Regression
Trees (CART) and describe the two common approaches used for
pruning.
Step-by-step solution:
1. Pruning in CART: - Pruning is the process of reducing the size
of a decision tree by removing nodes that add little predictive power.
This helps prevent overfitting and improves the tree’s generalization
ability.
2. Two common approaches for pruning: a) Cost complexity prun-
ing (also known as weakest link pruning): - This method involves
growing a large tree without setting a stopping rule, then pruning
back the tree while controlling for a tuning parameter (usually called
alpha or complexity parameter). The pruning process stops when
further splits do not improve the overall performance of the tree. -
The algorithm calculates a cost complexity measure for each sub-tree
as a function of the error reduction and the size of the sub-tree. The
sub-tree with the minimum cost complexity measure is selected as
the pruned tree.
b) Reduced error pruning: - This approach involves first splitting
the dataset into training and validation sets. The decision tree is
then built using the training set and pruned using the validation set
by iteratively replacing subtrees with leaf nodes. The replacement is
accepted if it improves the tree’s performance on the validation set.
- The process continues until pruning no longer improves the tree’s
performance on the validation set.
These two approaches help improve the performance and inter-
pretability of decision trees by simplifying the tree structure while
maintaining predictive accuracy.
Question 7
Consider the following dataset:
Feature 1 Feature 2 Feature 3 Label
2 5 1 0
4 3 2 1
3 7 1 1
6 2 3 0
7 4 2 1
Perform the following steps to build a classification tree:
a) Calculate the Gini index for the root node.
12

b) Split the data based on the best split using Gini index as the
impurity measure.
c) Calculate the Gini index for the child nodes after the split.
d) Repeat steps b) and c) until a stopping criterion is met or all
data points are pure.
Provide the step-by-step solution using Classification and Regres-
sion Trees.
Solution:
a) To calculate the Gini index for the root node, we use the for-
mula:
Gini = 1 −
c
X
i=1
p2
i
where piis the proportion of instances of class iin the node.
For the root node: - Instances of class 0: 2 (Feature 1: 2, Label: 0,
Feature 4: 6, Label: 0) - Instances of class 1: 3 (Feature 2: 3, Label:
1, Feature 3: 7, Label: 1) - Total instances: 5
Giniroot = 1 −(2
5)2−(3
5)2= 1 −(4
25 )−(9
25 ) = 12
25
Giniroot = 0.48
b) To determine the best split, calculate the Gini index for all
possible splits and choose the one with the lowest Gini index.
For example, we could consider splitting on Feature 1 at the value
2.5: - Left child node: Feature 1 ¡ 2.5 (2 instances: Label 0, Label 0)
- Right child node: Feature 1 ¿= 2.5 (3 instances: Label 1, Label 1,
Label 0)
Ginilef t = 1 −(2
2)2−0=0
Giniright = 1 −(1
3)2−(2
3)2= 1 −(1
9)−(4
9) = 4
9
c) Next, we calculate the Gini index for the child nodes after the
split: - Left child node: Gini index = 0 - Right child node: Gini index
= 0.44
d) Repeat steps b) and c) until a stopping criterion is met or all
data points are pure.
Continue splitting and calculating Gini index for each split until
you reach a stopping criterion or all data points are pure.Question 7:
Consider the following dataset:
Feature 1 Feature 2 Feature 3 Label
2 5 1 0
4 3 2 1
3 7 1 1
6 2 3 0
7 4 2 1
13

Perform the following steps to build a classification tree:
a) Calculate the Gini index for the root node.
b) Split the data based on the best split using Gini index as the
impurity measure.
c) Calculate the Gini index for the child nodes after the split.
d) Repeat steps b) and c) until a stopping criterion is met or all
data points are pure.
Provide the step-by-step solution using Classification and Regres-
sion Trees.
Solution:
a) To calculate the Gini index for the root node, we use the for-
mula:
Gini = 1 −
c
X
i=1
p2
i
where piis the proportion of instances of class iin the node.
For the root node: - Instances of class 0: 2 (Feature 1: 2, Label: 0,
Feature 4: 6, Label: 0) - Instances of class 1: 3 (Feature 2: 3, Label:
1, Feature 3: 7, Label: 1) - Total instances: 5
Giniroot = 1 −(2
5)2−(3
5)2= 1 −(4
25 )−(9
25 ) = 12
25
Giniroot = 0.48
b) To determine the best split, calculate the Gini index for all
possible splits and choose the one with the lowest Gini index.
For example, we could consider splitting on Feature 1 at the value
2.5: - Left child node: Feature 1 ¡ 2.5 (2 instances: Label 0, Label 0)
- Right child node: Feature 1 ¿= 2.5 (3 instances: Label 1, Label 1,
Label 0)
Ginilef t = 1 −(2
2)2−0=0
Giniright = 1 −(1
3)2−(2
3)2= 1 −(1
9)−(4
9) = 4
9
c) Next, we calculate the Gini index for the child nodes after the
split: - Left child node: Gini index = 0 - Right child node: Gini index
= 0.44
d) Repeat steps b) and c) until a stopping criterion is met or all
data points are pure.
Continue splitting and calculating Gini index for each split until
you reach a stopping criterion or all data points are pure.
14
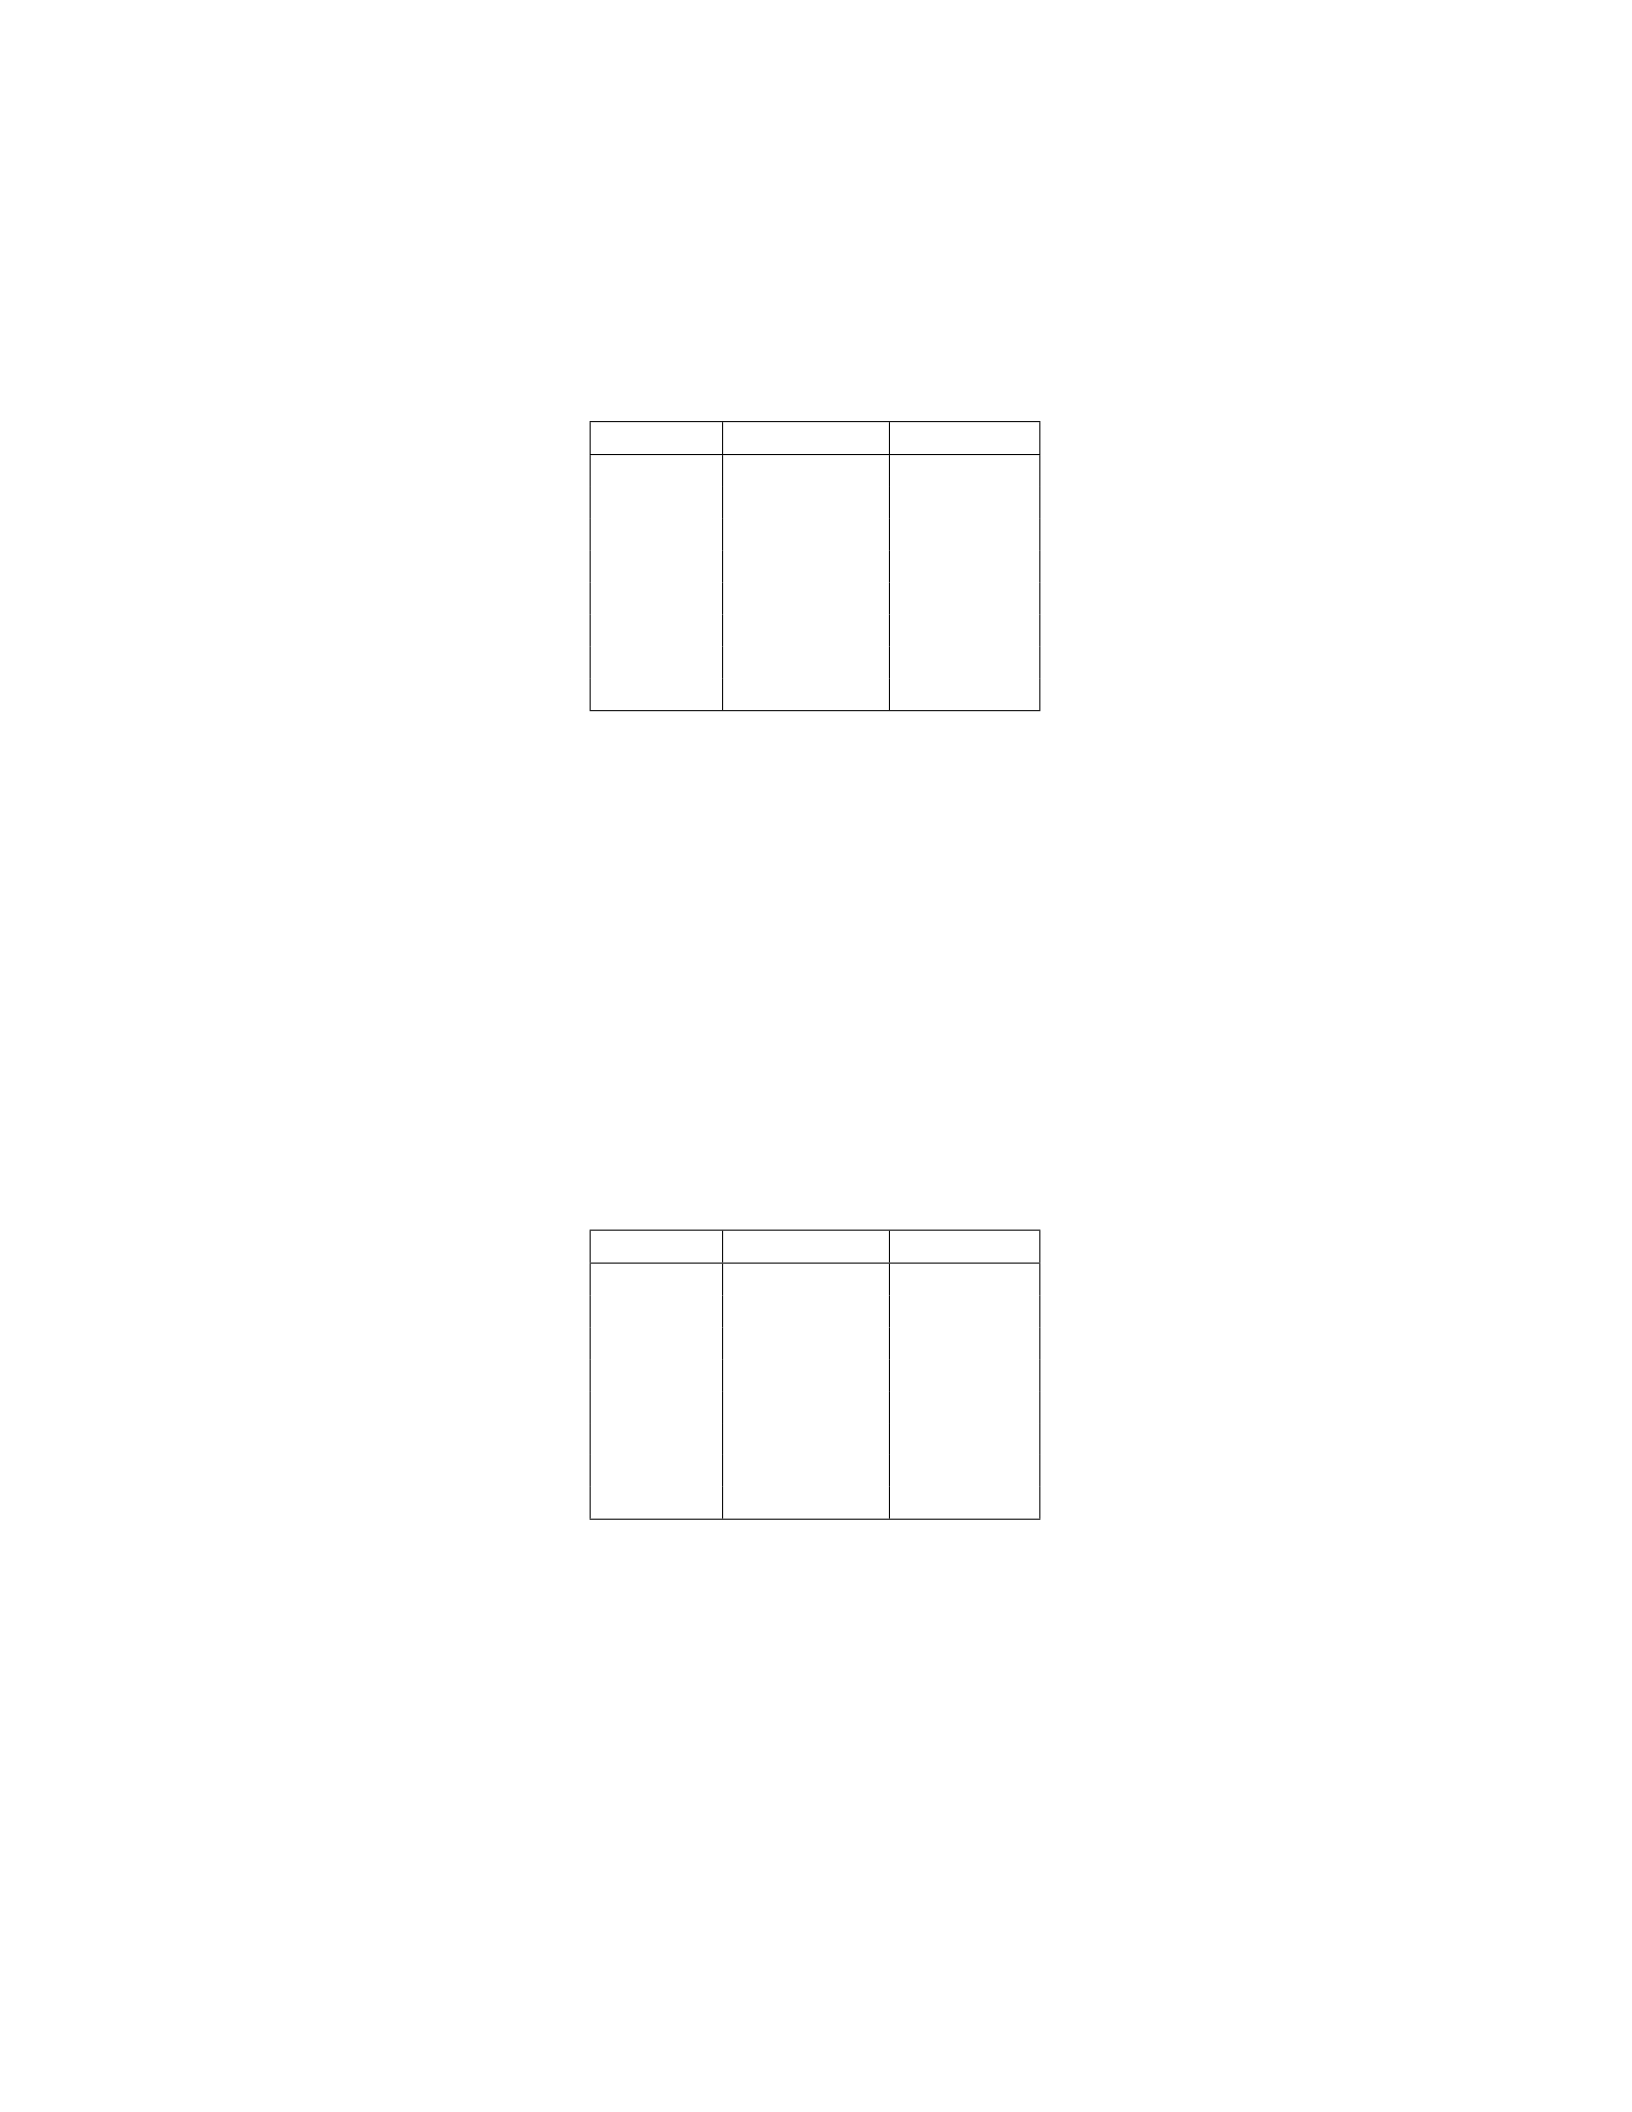
Question 8
Student Test Score Pass/Fail
1 85 Pass
2 70 Fail
3 92 Pass
4 65 Fail
5 78 Pass
6 60 Fail
7 88 Pass
8 72 Fail
1. Construct a classification tree to predict whether a student will
pass or fail based on their test score. 2. Calculate the Gini index for
each split to determine the best split at each node. 3. Determine the
final classification tree with the optimal splits.
Use the following Gini index formula:
Gini = 1 −
n
X
i=1
p2
i
where pirepresents the proportion of samples in class iat a par-
ticular node.
Begin by constructing the initial classification tree and calculating
the Gini index for each split.Question 8: Consider the following data
set representing students’ test scores and whether they passed or
failed a course:
Student Test Score Pass/Fail
1 85 Pass
2 70 Fail
3 92 Pass
4 65 Fail
5 78 Pass
6 60 Fail
7 88 Pass
8 72 Fail
1. Construct a classification tree to predict whether a student will
pass or fail based on their test score. 2. Calculate the Gini index for
each split to determine the best split at each node. 3. Determine the
final classification tree with the optimal splits.
Use the following Gini index formula:
Gini = 1 −
n
X
i=1
p2
i
15
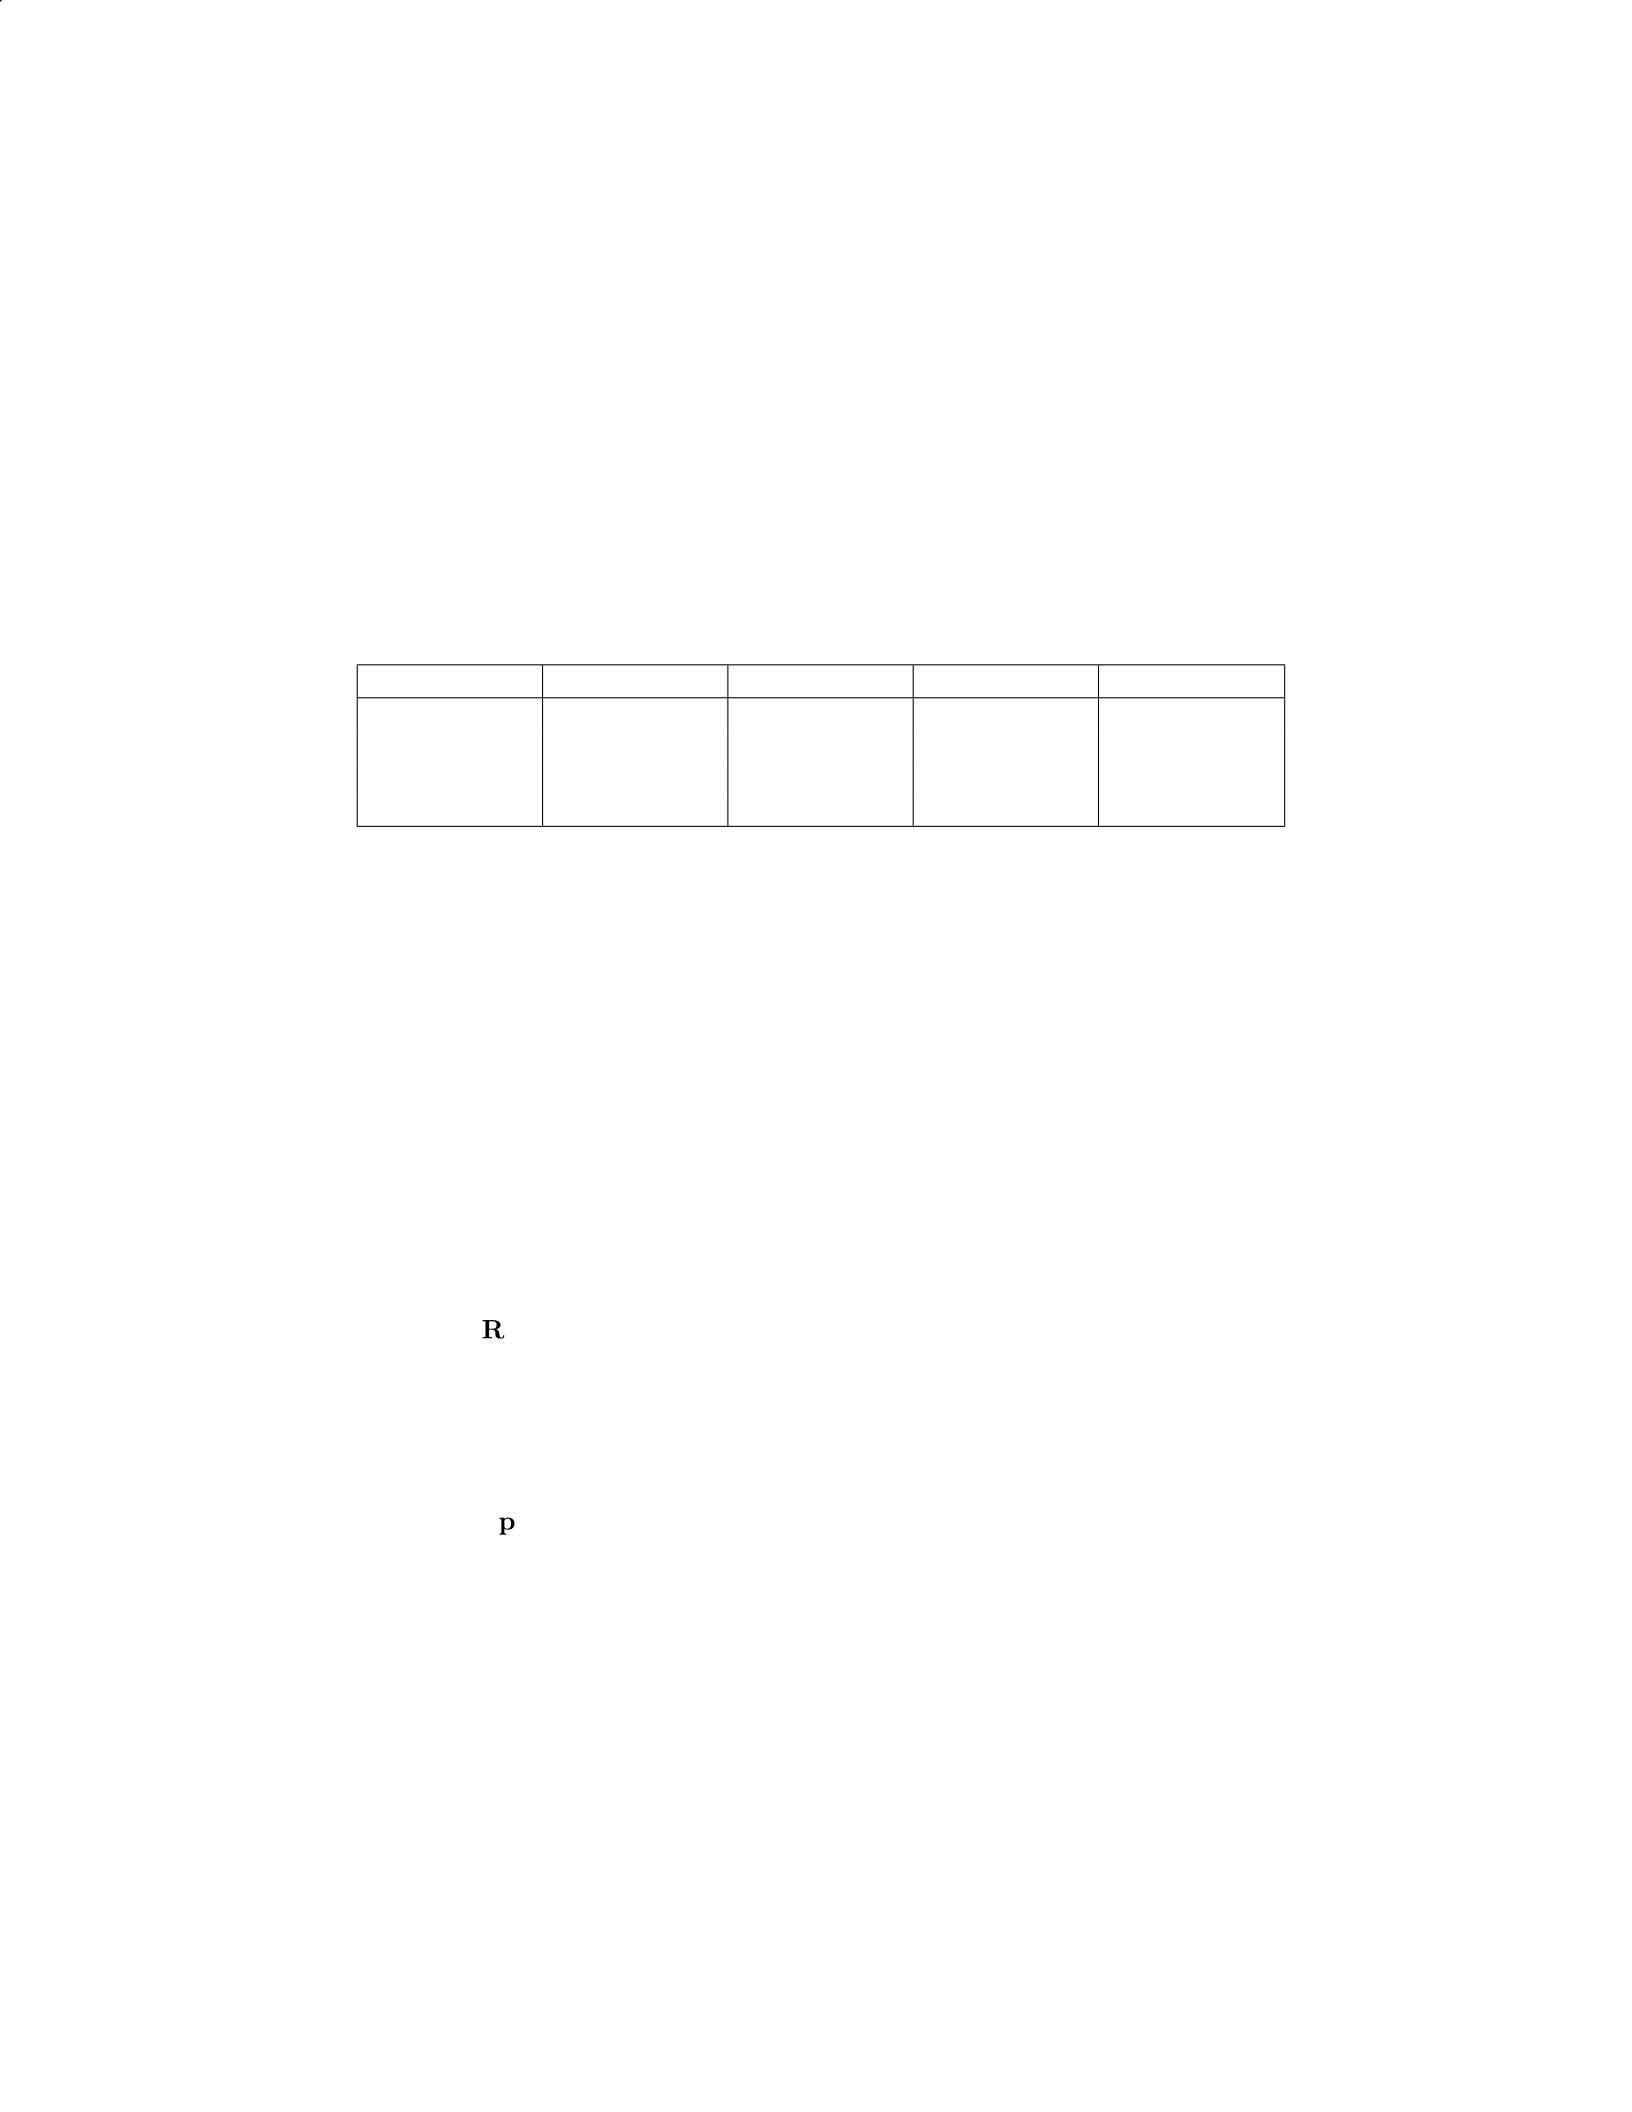
where pirepresents the proportion of samples in class iat a par-
ticular node.
Begin by constructing the initial classification tree and calculating
the Gini index for each split.
Question 9
Consider a dataset with the following attributes:
Attribute 1 Attribute 2 Attribute 3 Attribute 4 Class Label
2.4 1.8 3.5 4.2 A
3.2 2.5 4.1 5.3 B
1.9 2.3 3.4 4.9 A
2.7 3.1 4.5 5.1 B
(a) Given the dataset above, build a classification tree to predict the
class label using the Gini index as the impurity measure.
(b) Explain the process of splitting the dataset using the Gini index
and determine the split criteria for each node of the tree.
Solution:
(a) To build a classification tree using the Gini index, we start with
the root node containing all the data points. We then recursively
split the data based on the attribute that minimizes the Gini
index at each node until a stopping criterion is met.
In this case, we have a small dataset with only four data points,
so let’s build the tree:
Root Node: Calculate the Gini index for the entire dataset:
Gini(D) = 1−PC
i=1 p(i)2,
where p(i)is the proportion of class iin the dataset.
For the root node:
Gini(D) = 1−(0.5)2−(0.5)2= 0.5
Split Node 1:
To determine the best split for the first node, we calculate
the Gini index for each attribute and split the data based
on the attribute that minimizes the Gini index.
Gini(Attribute 1) = [Calculate Gini index for splitting on
Attribute 1]
Gini(Attribute 2) = [Calculate Gini index for splitting on
Attribute 2]
16

Gini(Attribute 3) = [Calculate Gini index for splitting on
Attribute 3]
Gini(Attribute 4) = [Calculate Gini index for splitting on
Attribute 4]
Suppose that splitting on Attribute 2 results in the lowest
Gini index.
The split criteria for this node would be: Split on Attribute
2 with a threshold value of 2.0.
Split Node 2:
Repeat the process for Split Node 2 to determine the best
attribute and split criteria.
Continue this process until a stopping criterion is met (e.g.,
minimum number of data points in a node, maximum tree
depth).
The classification tree will have nodes with split criteria based
on the Gini index to predict the class labels.
(b) The process of splitting the dataset using the Gini index involves
evaluating the impurity of each potential split and selecting the
split that results in the lowest impurity. The Gini index mea-
sures the impurity of a node by calculating how often a randomly
chosen element would be incorrectly classified based on the dis-
tribution of class labels in that node.
The split criteria for each node of the tree are determined by
identifying the attribute and corresponding threshold value that
minimize the Gini index when splitting the data. This process
is repeated recursively for each node until a stopping criterion
is met.
Question 9:
Consider a dataset with the following attributes:
Attribute 1 Attribute 2 Attribute 3 Attribute 4 Class Label
2.4 1.8 3.5 4.2 A
3.2 2.5 4.1 5.3 B
1.9 2.3 3.4 4.9 A
2.7 3.1 4.5 5.1 B
(a) Given the dataset above, build a classification tree to predict the
class label using the Gini index as the impurity measure.
(b) Explain the process of splitting the dataset using the Gini index
and determine the split criteria for each node of the tree.
Solution:
17

(a) To build a classification tree using the Gini index, we start with
the root node containing all the data points. We then recursively
split the data based on the attribute that minimizes the Gini
index at each node until a stopping criterion is met.
In this case, we have a small dataset with only four data points,
so let’s build the tree:
Root Node: Calculate the Gini index for the entire dataset:
Gini(D) = 1−PC
i=1 p(i)2,
where p(i)is the proportion of class iin the dataset.
For the root node:
Gini(D) = 1−(0.5)2−(0.5)2= 0.5
Split Node 1:
To determine the best split for the first node, we calculate
the Gini index for each attribute and split the data based
on the attribute that minimizes the Gini index.
Gini(Attribute 1) = [Calculate Gini index for splitting on
Attribute 1]
Gini(Attribute 2) = [Calculate Gini index for splitting on
Attribute 2]
Gini(Attribute 3) = [Calculate Gini index for splitting on
Attribute 3]
Gini(Attribute 4) = [Calculate Gini index for splitting on
Attribute 4]
Suppose that splitting on Attribute 2 results in the lowest
Gini index.
The split criteria for this node would be: Split on Attribute
2 with a threshold value of 2.0.
Split Node 2:
Repeat the process for Split Node 2 to determine the best
attribute and split criteria.
Continue this process until a stopping criterion is met (e.g.,
minimum number of data points in a node, maximum tree
depth).
The classification tree will have nodes with split criteria based
on the Gini index to predict the class labels.
(b) The process of splitting the dataset using the Gini index involves
evaluating the impurity of each potential split and selecting the
split that results in the lowest impurity. The Gini index mea-
sures the impurity of a node by calculating how often a randomly
chosen element would be incorrectly classified based on the dis-
tribution of class labels in that node.
18

The split criteria for each node of the tree are determined by
identifying the attribute and corresponding threshold value that
minimize the Gini index when splitting the data. This process
is repeated recursively for each node until a stopping criterion
is met.
Question 10
Explain the process of pruning in the context of Classification and
Regression Trees.
Solution:
Pruning is a technique used in Classification and Regression Trees
(CART) to prevent overfitting of the model. Overfitting occurs when
the model memorizes the training data too well and performs poorly
on new, unseen data.
The process of pruning involves starting with a fully grown tree
(one that is likely overfit) and then cutting back the branches to
find the optimal tree size that generalizes well to new data. This
is typically done by setting a stopping criterion, such as maximum
tree depth, minimum number of samples in a leaf node, or minimum
information gain at a split.
Here are the steps involved in the pruning process:
1. Start with a fully grown tree that is likely overfit to the training
data. 2. Evaluate the performance of the tree on a separate valida-
tion dataset or using cross-validation. 3. For each node in the tree,
consider pruning the subtree rooted at that node by either remov-
ing it entirely or merging it with a neighboring node. 4. Calculate
the change in performance (e.g., reduction in error rate, increase in
accuracy) that would result from pruning the subtree at each node.
5. Prune the subtree at the node that leads to the greatest improve-
ment in performance, or stop pruning if further pruning degrades
performance. 6. Repeat steps 2-5 until no further improvement in
performance is observed.
By pruning a tree, we aim to find the simplest tree that provides
the best generalization performance on unseen data. This helps to
improve the model’s ability to make accurate predictions on new in-
stances.Question 10:
Explain the process of pruning in the context of Classification and
Regression Trees.
Solution:
Pruning is a technique used in Classification and Regression Trees
(CART) to prevent overfitting of the model. Overfitting occurs when
the model memorizes the training data too well and performs poorly
on new, unseen data.
19

The process of pruning involves starting with a fully grown tree
(one that is likely overfit) and then cutting back the branches to
find the optimal tree size that generalizes well to new data. This
is typically done by setting a stopping criterion, such as maximum
tree depth, minimum number of samples in a leaf node, or minimum
information gain at a split.
Here are the steps involved in the pruning process:
1. Start with a fully grown tree that is likely overfit to the training
data. 2. Evaluate the performance of the tree on a separate valida-
tion dataset or using cross-validation. 3. For each node in the tree,
consider pruning the subtree rooted at that node by either remov-
ing it entirely or merging it with a neighboring node. 4. Calculate
the change in performance (e.g., reduction in error rate, increase in
accuracy) that would result from pruning the subtree at each node.
5. Prune the subtree at the node that leads to the greatest improve-
ment in performance, or stop pruning if further pruning degrades
performance. 6. Repeat steps 2-5 until no further improvement in
performance is observed.
By pruning a tree, we aim to find the simplest tree that provides
the best generalization performance on unseen data. This helps to
improve the model’s ability to make accurate predictions on new in-
stances.
Question 11
Explain how the Gini Index is used in the process of constructing
a Classification Tree.
Step-by-step solution:
The Gini Index is a metric used in the process of constructing a
Classification Tree. Here’s how it is used:
1. Start with a dataset containing the target variable and predictor
variables. 2. Calculate the Gini Index for the target variable in the
dataset. The Gini Index measures the impurity of a dataset, with
a lower value indicating higher purity and a higher value indicating
higher impurity. 3. Split the dataset based on different predictor
variables to create different nodes in the tree. 4. Calculate the Gini
Index for each split and compare them. The split with the lowest Gini
Index is chosen as the best split for that node. 5. Repeat this process
recursively for each node in the tree until a stopping criterion is met
(e.g., maximum tree depth reached, minimum number of samples
in a node). 6. The resulting tree structure represents the decision-
making process for classifying new data points based on the predictor
variables.
By using the Gini Index to evaluate and select the best splits, Clas-
sification Trees can effectively partition a dataset into subsets that are
20

more homogeneous with respect to the target variable.Question 11:
Explain how the Gini Index is used in the process of constructing
a Classification Tree.
Step-by-step solution:
The Gini Index is a metric used in the process of constructing a
Classification Tree. Here’s how it is used:
1. Start with a dataset containing the target variable and predictor
variables. 2. Calculate the Gini Index for the target variable in the
dataset. The Gini Index measures the impurity of a dataset, with
a lower value indicating higher purity and a higher value indicating
higher impurity. 3. Split the dataset based on different predictor
variables to create different nodes in the tree. 4. Calculate the Gini
Index for each split and compare them. The split with the lowest Gini
Index is chosen as the best split for that node. 5. Repeat this process
recursively for each node in the tree until a stopping criterion is met
(e.g., maximum tree depth reached, minimum number of samples
in a node). 6. The resulting tree structure represents the decision-
making process for classifying new data points based on the predictor
variables.
By using the Gini Index to evaluate and select the best splits,
Classification Trees can effectively partition a dataset into subsets
that are more homogeneous with respect to the target variable.
Question 12
Consider a dataset with the following information for a set of in-
dividuals:
- Age (in years): 25, 30, 35, 40, 45, 50 - Income (in thousands of
dollars): 60, 70, 80, 90, 100, 110 - Purchased (yes or no): yes, no,
yes, no, yes, no
1. Using the Classification and Regression Tree (CART) method,
build a decision tree to predict whether an individual will make a pur-
chase based on their age and income. 2. Interpret the decision tree
and explain the reasoning behind the splits. 3. Determine the pre-
dicted purchase outcome for a 33-year-old individual with an income
of 75,000.
Solution:
1. To build the decision tree, we follow these steps:
a. Calculate the Gini impurity for the starting node (no split):
Gini(D)=1−(pyes)2−(pno)2Gini(D) = 1−(3
6)2−(3
6)2Gini(D)=1−9
36 −9
36
Gini(D)=1−1
4−1
4Gini(D) = 1
2
b. Calculate the Gini impurity for potential splits based on age
and income.
c. Choose the split with the lowest Gini impurity and repeat the
process for the child nodes.
21

The decision tree will have the following structure:
“‘ Age ¡= 35 — Income ¡= 75 — — Predict: yes — Income ¿ 75
— — Predict: no Age ¿ 35 — Predict: yes “‘
2. The decision tree splits the data based on age and income as
follows: - If age is less than or equal to 35 and income is less than or
equal to 75, predict ”yes” (purchase). - If age is less than or equal
to 35 and income is greater than 75, predict ”no” (no purchase). - If
age is greater than 35, predict ”yes” (purchase).
The splits are based on finding the combinations of age and income
that result in the lowest Gini impurity and best separate the data into
”yes” and ”no” purchase outcomes.
3. For a 33-year-old individual with an income of 75,000, basedonthedecisiontree :
−Age <= 35 : Y es −Income <= 75 : Y es
The predicted purchase outcome for the 33-year-old with a 75,000incomeis”yes.”
This decision tree provides a simple yet effective way to predict
purchase outcomes based on age and income.Question 12:
Consider a dataset with the following information for a set of in-
dividuals:
- Age (in years): 25, 30, 35, 40, 45, 50 - Income (in thousands of
dollars): 60, 70, 80, 90, 100, 110 - Purchased (yes or no): yes, no,
yes, no, yes, no
1. Using the Classification and Regression Tree (CART) method,
build a decision tree to predict whether an individual will make a pur-
chase based on their age and income. 2. Interpret the decision tree
and explain the reasoning behind the splits. 3. Determine the pre-
dicted purchase outcome for a 33-year-old individual with an income
of 75,000.
Solution:
1. To build the decision tree, we follow these steps:
a. Calculate the Gini impurity for the starting node (no split):
Gini(D)=1−(pyes)2−(pno)2Gini(D) = 1−(3
6)2−(3
6)2Gini(D)=1−9
36 −9
36
Gini(D)=1−1
4−1
4Gini(D) = 1
2
b. Calculate the Gini impurity for potential splits based on age
and income.
c. Choose the split with the lowest Gini impurity and repeat the
process for the child nodes.
The decision tree will have the following structure:
“‘ Age ¡= 35 — Income ¡= 75 — — Predict: yes — Income ¿ 75
— — Predict: no Age ¿ 35 — Predict: yes “‘
2. The decision tree splits the data based on age and income as
follows: - If age is less than or equal to 35 and income is less than or
equal to 75, predict ”yes” (purchase). - If age is less than or equal
to 35 and income is greater than 75, predict ”no” (no purchase). - If
age is greater than 35, predict ”yes” (purchase).
The splits are based on finding the combinations of age and income
that result in the lowest Gini impurity and best separate the data into
22

”yes” and ”no” purchase outcomes.
3. For a 33-year-old individual with an income of 75,000, basedonthedecisiontree :
−Age <= 35 : Y es −Income <= 75 : Y es
The predicted purchase outcome for the 33-year-old with a 75,000incomeis”yes.”
This decision tree provides a simple yet effective way to predict
purchase outcomes based on age and income.
Question 13
A company wants to build a decision tree to predict whether a cus-
tomer will renew their subscription based on the following features:
Age (in years)
Monthly subscription cost
Number of months subscribed
The company has collected the following training data:
Age Monthly Cost (
$
) Months Subscribed Renew
30 50 6 Yes
25 30 3 No
45 70 12 Yes
35 60 8 Yes
Task: Build a classification tree to predict whether a customer will
renew their subscription.
Solution:
Step 1: Begin at the root node and calculate the Gini impurity for
the initial dataset.
Gini impurity = 1−Pp2
i
For the initial dataset: - Number of ”Yes” = 3 - Number of ”No”
= 1 - Total observations = 4
Gini impurity = 1−3
42+1
42
Gini impurity = 1−9
16 +1
16
Gini impurity = 1−10
16
Gini impurity = 1−0.625
Gini impurity = 0.375
Step 2: Split the data based on each feature and calculate the
Gini impurity for each split. Choose the split that yields the lowest
impurity.
Split on Age (30 years): - Left node (Age ≤30 years): - Number
of ”Yes” = 1 - Number of ”No” = 0 - Total observations = 1
Gini impurity = 0 (perfect classification)
- Right node (Age >30 years): - Number of ”Yes” = 2 - Number
of ”No” = 1 - Total observations = 3
23
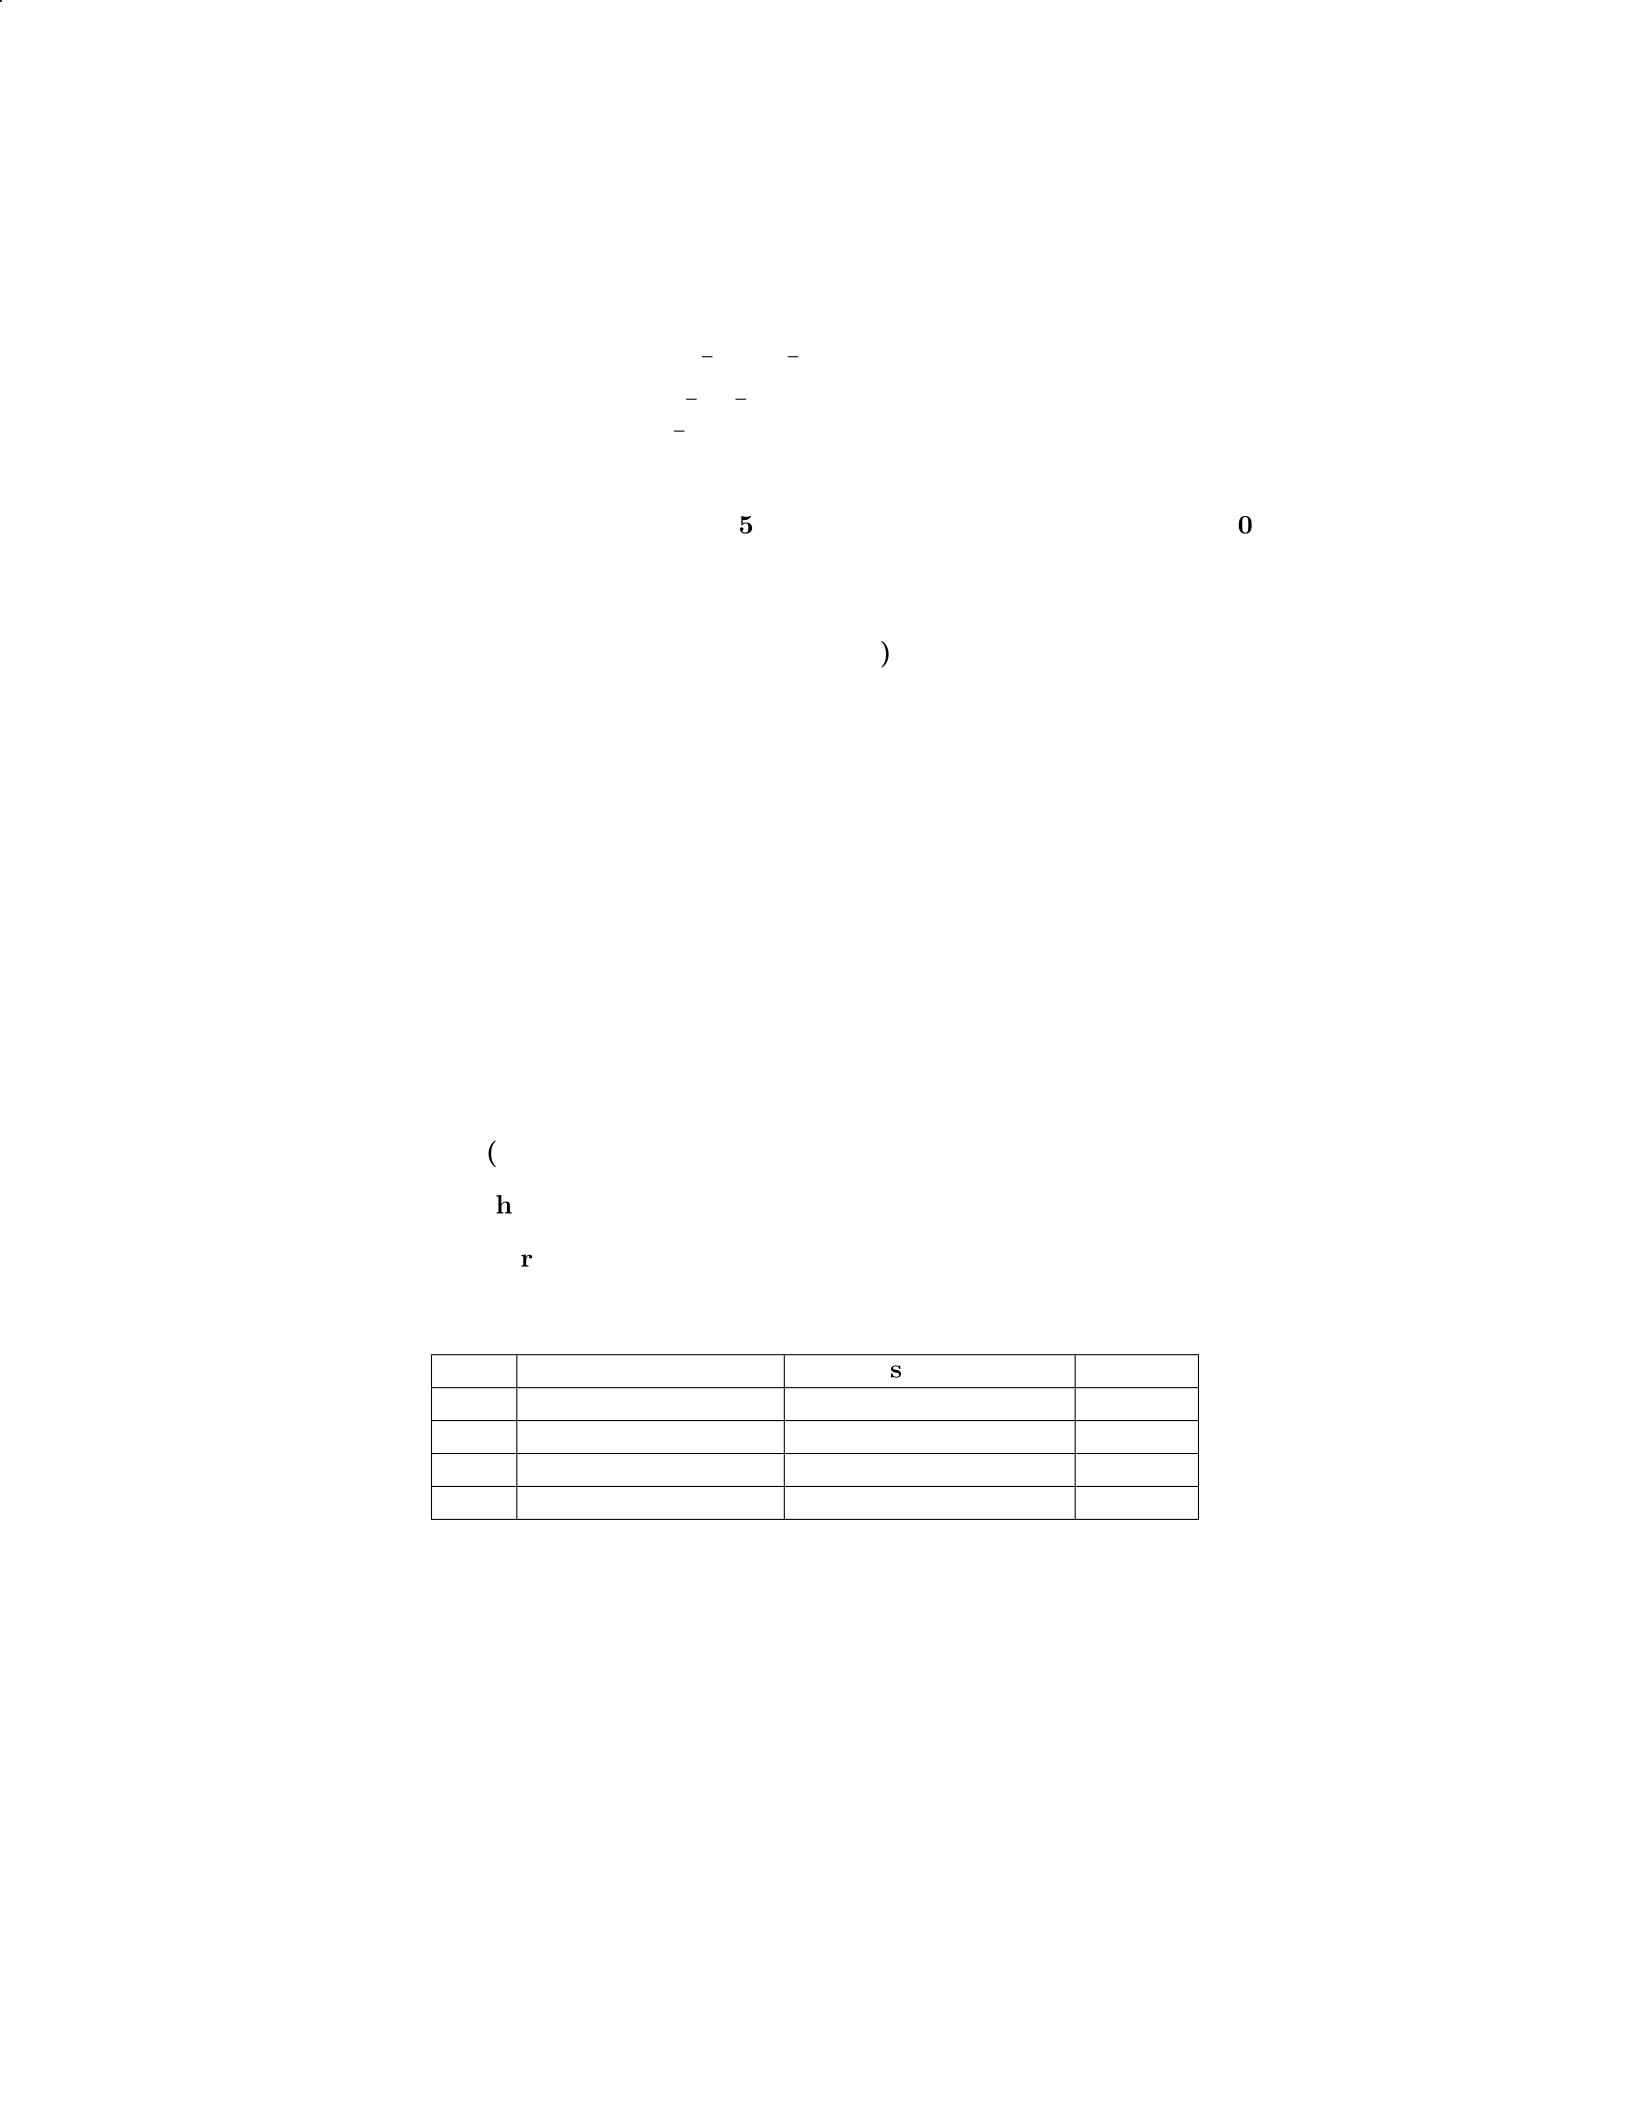
Gini impurity = 1−2
32+1
32
Gini impurity = 1−4
9+1
9
Gini impurity = 1−5
9
Gini impurity = 1−0.555
Gini impurity ≈0.445
Split on Monthly Cost (
$
50): - Left node (Monthly Cost ≤
$
50):
- Number of ”Yes” = 1 - Number of ”No” = 0 - Total observations
= 1
Gini impurity = 0 (perfect classification)
- Right node (Monthly Cost >
$
50): - Number of ”Yes” = 2 -
Number of ”No” = 1 - Total observations = 3
Gini impurity = 0.445 (same calculation as above)
Split on Months Subscribed (6 months): - Left node (Months Sub-
scribed ≤6 months): - Number of ”Yes” = 1 - Number of ”No” = 0
- Total observations = 1
Gini impurity = 0 (perfect classification)
- Right node (Months Subscribed >6 months): - Number of ”Yes”
= 2 - Number of ”No” = 1 - Total observations = 3
Gini impurity = 0.445 (same calculation as above)
Based on the calculations, the split on Age >30 years has the
lowest Gini impurity. Therefore, the decision tree will split on Age >
30 years at the root node.Question 13:
A company wants to build a decision tree to predict whether a cus-
tomer will renew their subscription based on the following features:
Age (in years)
Monthly subscription cost
Number of months subscribed
The company has collected the following training data:
Age Monthly Cost (
$
) Months Subscribed Renew
30 50 6 Yes
25 30 3 No
45 70 12 Yes
35 60 8 Yes
Task: Build a classification tree to predict whether a customer will
renew their subscription.
Solution:
Step 1: Begin at the root node and calculate the Gini impurity for
the initial dataset.
Gini impurity = 1−Pp2
i
For the initial dataset: - Number of ”Yes” = 3 - Number of ”No”
= 1 - Total observations = 4
24

Gini impurity = 1−3
42+1
42
Gini impurity = 1−9
16 +1
16
Gini impurity = 1−10
16
Gini impurity = 1−0.625
Gini impurity = 0.375
Step 2: Split the data based on each feature and calculate the
Gini impurity for each split. Choose the split that yields the lowest
impurity.
Split on Age (30 years): - Left node (Age ≤30 years): - Number
of ”Yes” = 1 - Number of ”No” = 0 - Total observations = 1
Gini impurity = 0 (perfect classification)
- Right node (Age >30 years): - Number of ”Yes” = 2 - Number
of ”No” = 1 - Total observations = 3
Gini impurity = 1−2
32+1
32
Gini impurity = 1−4
9+1
9
Gini impurity = 1−5
9
Gini impurity = 1−0.555
Gini impurity ≈0.445
Split on Monthly Cost (
$
50): - Left node (Monthly Cost ≤
$
50):
- Number of ”Yes” = 1 - Number of ”No” = 0 - Total observations
= 1
Gini impurity = 0 (perfect classification)
- Right node (Monthly Cost >
$
50): - Number of ”Yes” = 2 -
Number of ”No” = 1 - Total observations = 3
Gini impurity = 0.445 (same calculation as above)
Split on Months Subscribed (6 months): - Left node (Months Sub-
scribed ≤6 months): - Number of ”Yes” = 1 - Number of ”No” = 0
- Total observations = 1
Gini impurity = 0 (perfect classification)
- Right node (Months Subscribed >6 months): - Number of ”Yes”
= 2 - Number of ”No” = 1 - Total observations = 3
Gini impurity = 0.445 (same calculation as above)
Based on the calculations, the split on Age >30 years has the
lowest Gini impurity. Therefore, the decision tree will split on Age >
30 years at the root node.
Question 14
Consider the following dataset:
25
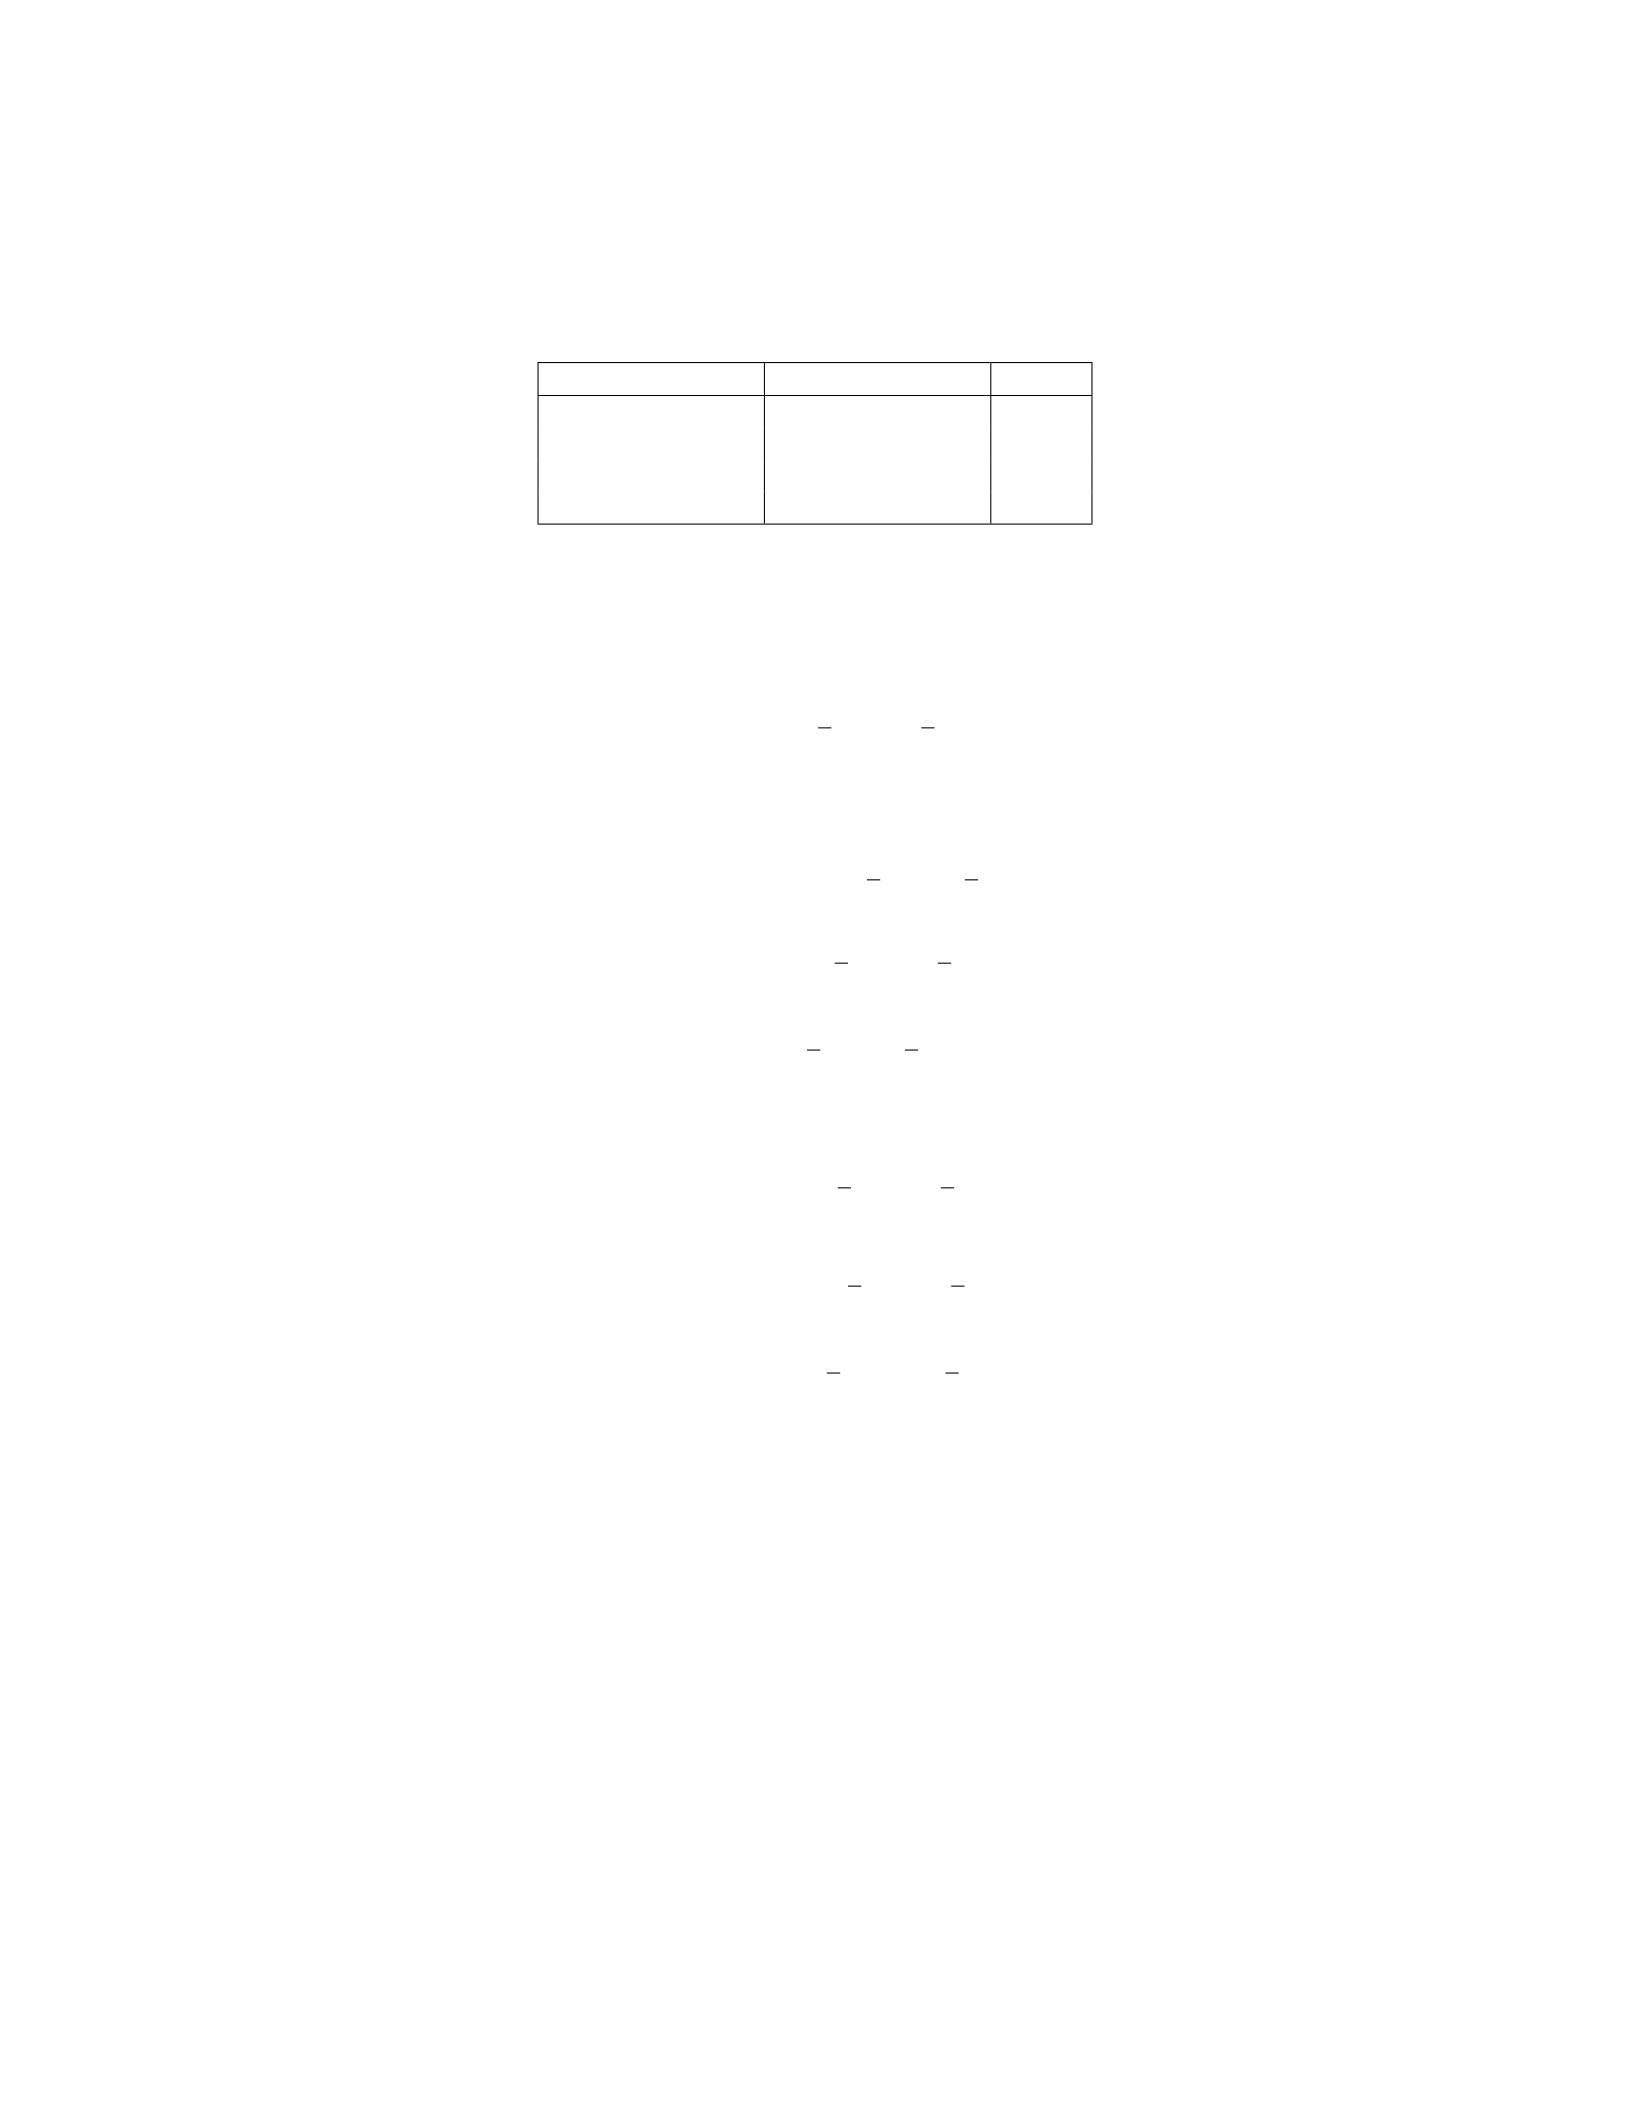
Feature 1 (X1) Feature 2 (X2) Label
2 5 1
4 7 0
3 9 1
6 2 1
Apply the Classification and Regression Trees (CART) algorithm
to build a decision tree for this dataset.
Step-by-step solution:
1. Calculate Gini index for the initial dataset:
Gini(Label)=1− 1
42
+3
42!= 0.375
2. Calculate Gini index for splitting at Feature 1 (X1) with thresh-
old 2.5:
Gini(X1<2.5) = 0 ×1
1+ 1 ×3
3= 0
Gini(X1≥2.5) = 1 − 1
32
+2
32!= 0.444
W eighted Gini (X1) = 1
4×0 + 3
4×0.444 = 0.333
3. Calculate Gini index for splitting at Feature 2 (X2) with thresh-
old 6:
Gini(X2<6) = 1 − 1
22
+1
22!= 0.5
Gini(X2≥6) = 1 − 0
22
+2
22!= 0
W eighted Gini (X2) = 2
4×0.5 + 2
4×0=0.25
4. Choose the split with the lowest Gini index, which is splitting
at Feature 1 (X1) with threshold 2.5. Create a node for this split.
5. Repeat the process for each child node recursively until all
nodes are pure or stopping criteria are met.
The decision tree for the given dataset will have a root node split-
ting at Feature 1 (X1) with threshold 2.5, resulting in the following
tree structure:
Feature 1 (X1) ¡ 2.5
|Label 1
Feature 1 (X1) ¿= 2.5
26
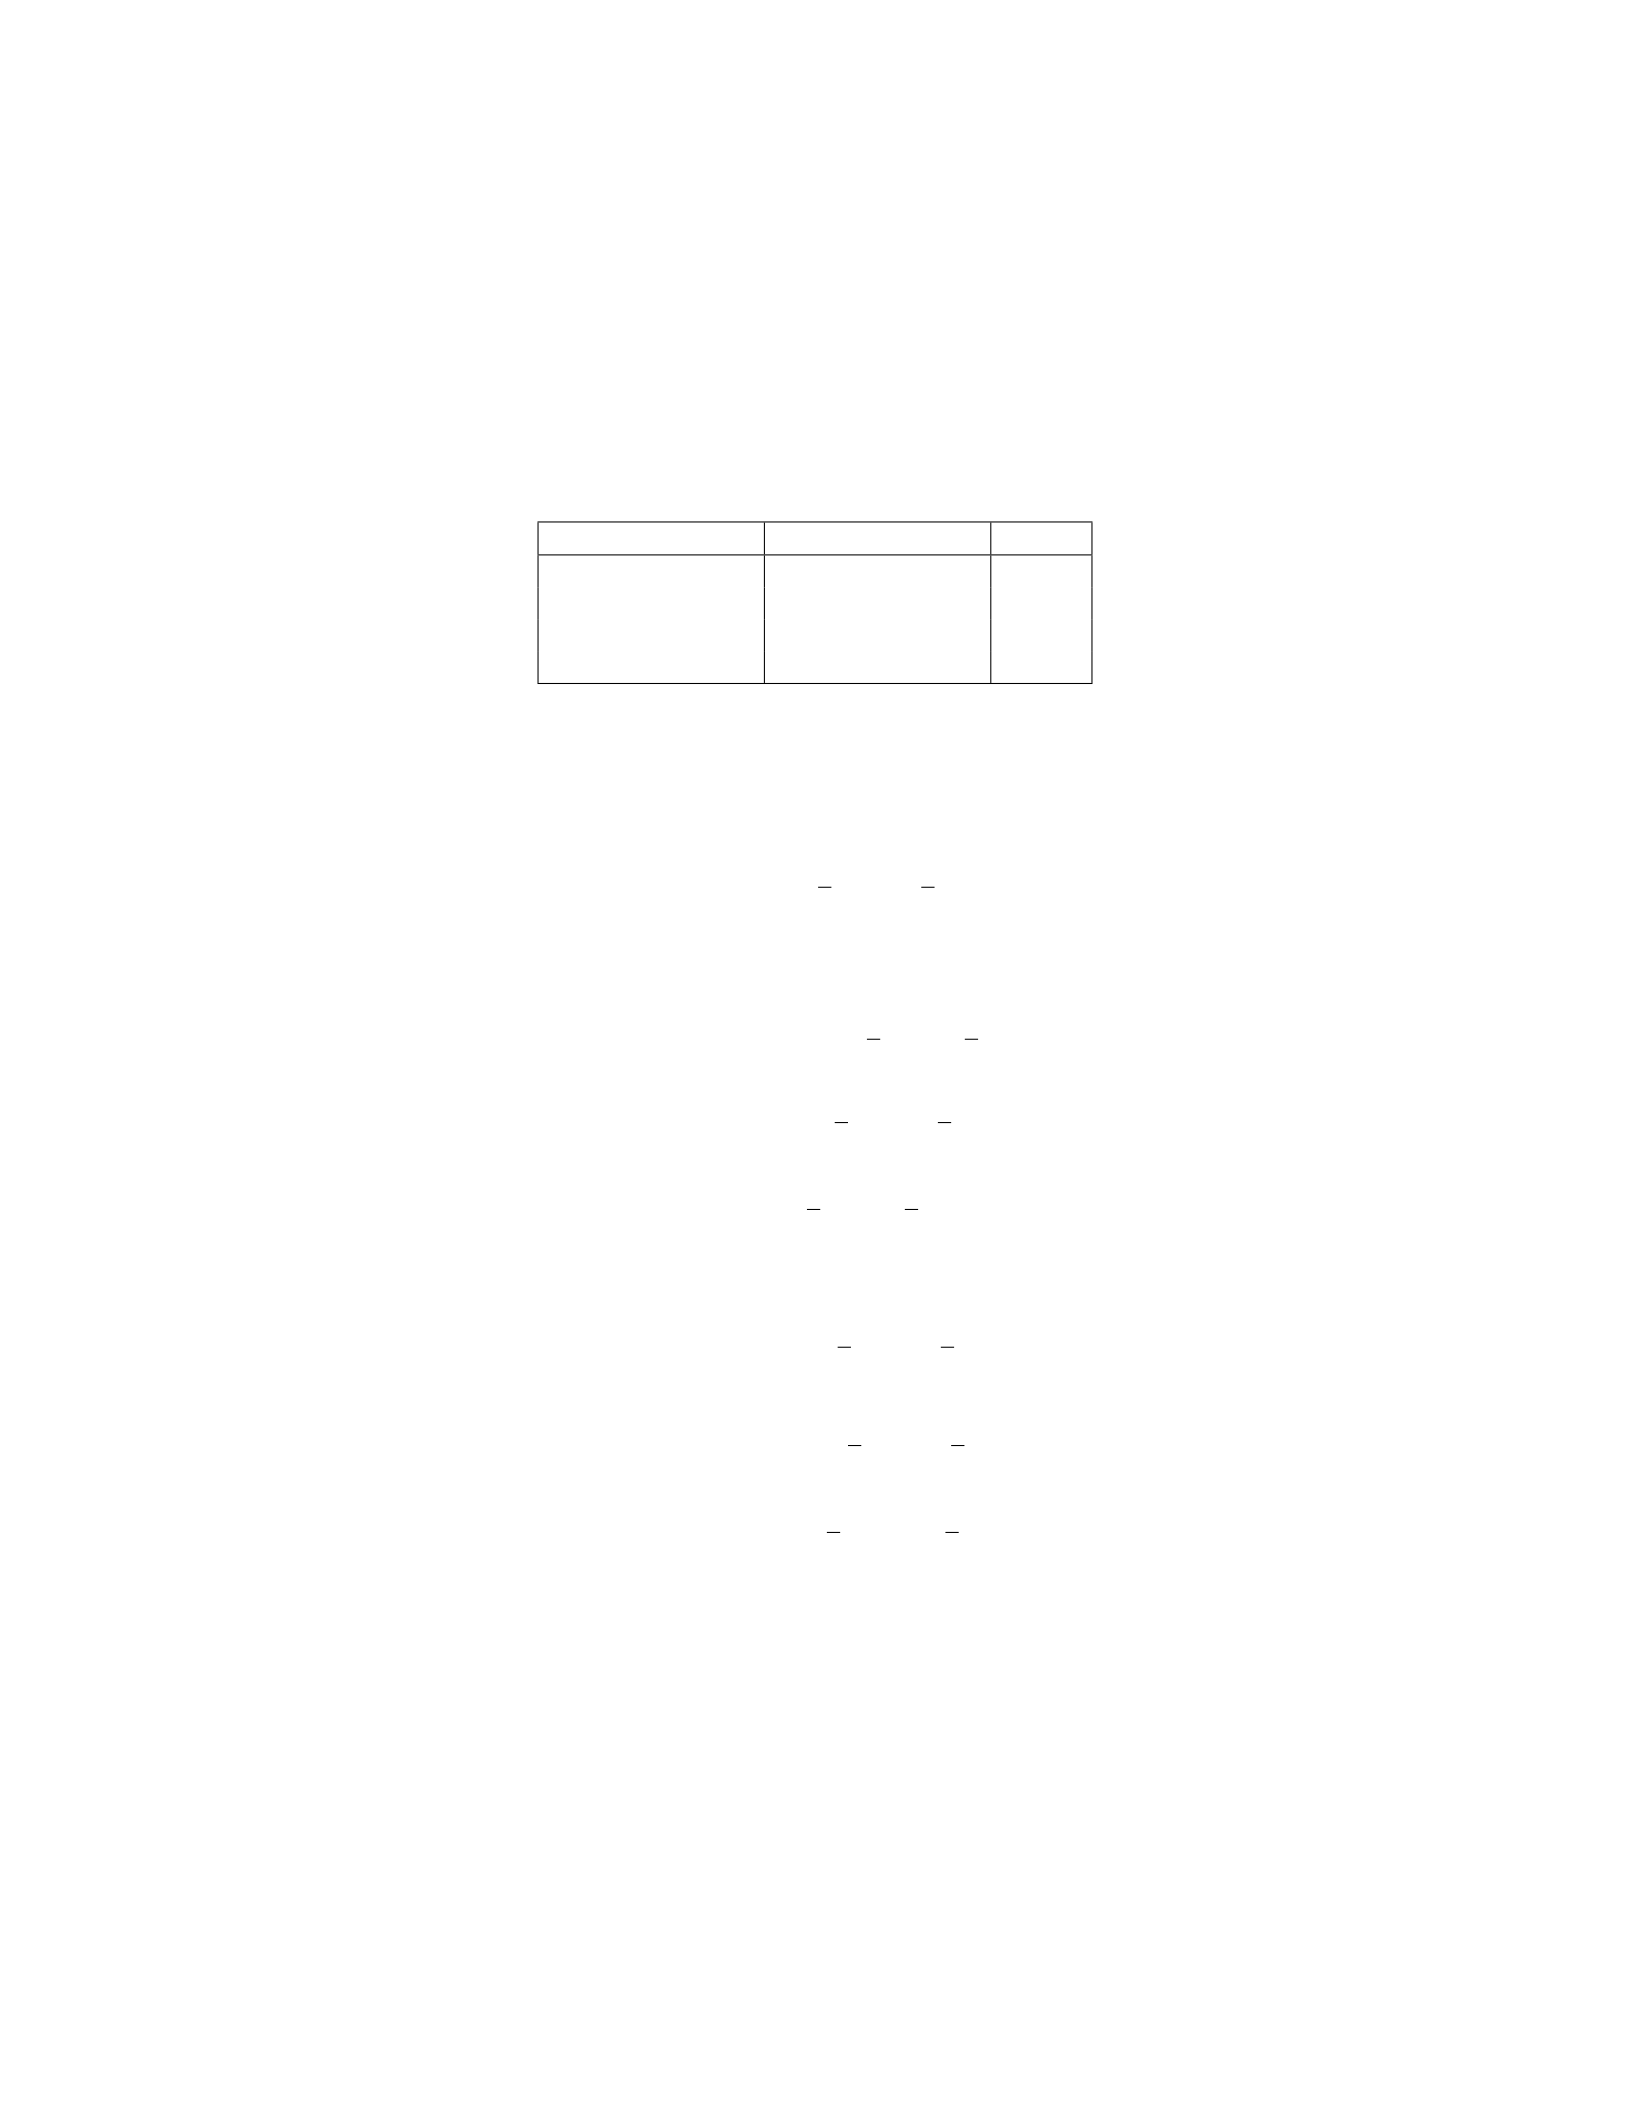
|Label 0
|Label 1
Question 14:
Consider the following dataset:
Feature 1 (X1) Feature 2 (X2) Label
2 5 1
4 7 0
3 9 1
6 2 1
Apply the Classification and Regression Trees (CART) algorithm
to build a decision tree for this dataset.
Step-by-step solution:
1. Calculate Gini index for the initial dataset:
Gini(Label)=1− 1
42
+3
42!= 0.375
2. Calculate Gini index for splitting at Feature 1 (X1) with thresh-
old 2.5:
Gini(X1<2.5) = 0 ×1
1+ 1 ×3
3= 0
Gini(X1≥2.5) = 1 − 1
32
+2
32!= 0.444
W eighted Gini (X1) = 1
4×0 + 3
4×0.444 = 0.333
3. Calculate Gini index for splitting at Feature 2 (X2) with thresh-
old 6:
Gini(X2<6) = 1 − 1
22
+1
22!= 0.5
Gini(X2≥6) = 1 − 0
22
+2
22!= 0
W eighted Gini (X2) = 2
4×0.5 + 2
4×0=0.25
4. Choose the split with the lowest Gini index, which is splitting
at Feature 1 (X1) with threshold 2.5. Create a node for this split.
5. Repeat the process for each child node recursively until all
nodes are pure or stopping criteria are met.
The decision tree for the given dataset will have a root node split-
ting at Feature 1 (X1) with threshold 2.5, resulting in the following
tree structure:
27

Feature 1 (X1) ¡ 2.5
|Label 1
Feature 1 (X1) ¿= 2.5
|Label 0
|Label 1
Question 15
Question 15:
A dataset contains information on students such as their age, gen-
der, study hours, and GPA, along with a binary variable indicating if
they passed or failed a course. Using the Classification and Regres-
sion Trees (CART) algorithm, construct a decision tree to predict the
likelihood of a student passing the course based on the given features.
The dataset is as follows:
Age Gender Study Hours GPA Pass/Fail
18 Male 4 3.2Fail
20 Female 6 3.5Pass
22 Male 3 2.8Fail
19 Female 5 3.7Pass
Use the Gini index as the splitting criterion.
Step-by-step solution:
1. Calculate the Gini index for the initial dataset:
Gini(S) = 1 − 2
42
+2
42!= 0.5
2. Split the dataset based on each feature and calculate the Gini
index for each split.
3. Select the split with the lowest Gini index to create the first
node of the decision tree.
4. Repeat the process for each subset until all instances are cor-
rectly classified or the tree reaches a specified depth.
This process will generate a decision tree for predicting the like-
lihood of a student passing the course based on the given features
using the CART algorithm.Certainly! Here is question number 15 on
Classification and Regression Trees presented in LateX code:
Question 15:
A dataset contains information on students such as their age, gen-
der, study hours, and GPA, along with a binary variable indicating if
28

they passed or failed a course. Using the Classification and Regres-
sion Trees (CART) algorithm, construct a decision tree to predict the
likelihood of a student passing the course based on the given features.
The dataset is as follows:
Age Gender Study Hours GPA Pass/Fail
18 Male 4 3.2Fail
20 Female 6 3.5Pass
22 Male 3 2.8Fail
19 Female 5 3.7Pass
Use the Gini index as the splitting criterion.
Step-by-step solution:
1. Calculate the Gini index for the initial dataset:
Gini(S) = 1 − 2
42
+2
42!= 0.5
2. Split the dataset based on each feature and calculate the Gini
index for each split.
3. Select the split with the lowest Gini index to create the first
node of the decision tree.
4. Repeat the process for each subset until all instances are cor-
rectly classified or the tree reaches a specified depth.
This process will generate a decision tree for predicting the like-
lihood of a student passing the course based on the given features
using the CART algorithm.
Question 16
Consider the following dataset with two features (X1, X2) and a
target variable (Y):
X1X2Y
2 3 10
4 1 15
1 5 8
3 4 12
a) Build a classification tree for the dataset using Gini impurity
as the splitting criterion.
b) Determine the final classification tree.
Step-by-step solutions:
a) To build a classification tree using Gini impurity, we need to
find the best split at each node that maximally reduces the impurity.
29

1. Calculate the Gini impurity for the initial dataset:
Gini impurity = 1 −
n
X
i=1
p2
i
For the initial dataset, the Gini impurity is calculated as follows:
Gini(10,15,8,12) = 1 −1
42
−1
42
−1
42
−1
42
Gini(10,15,8,12) = 1 −1
16 −1
16 −1
16 −1
16
Gini(10,15,8,12) = 1 −1
4=3
4
2. Find the best split for each feature at each node to minimize
the Gini impurity.
b) The final classification tree after building the tree using Gini
impurity is as follows:
- Root Node (X1): Split at X1 = 2 - Left Node: Predict 10 - Right
Node: Continue splitting - Split at X2 = 3 - Left Node: Predict 12 -
Right Node: Predict 8Question 16:
Consider the following dataset with two features (X1, X2) and a
target variable (Y):
X1X2Y
2 3 10
4 1 15
1 5 8
3 4 12
a) Build a classification tree for the dataset using Gini impurity
as the splitting criterion.
b) Determine the final classification tree.
Step-by-step solutions:
a) To build a classification tree using Gini impurity, we need to
find the best split at each node that maximally reduces the impurity.
1. Calculate the Gini impurity for the initial dataset:
Gini impurity = 1 −
n
X
i=1
p2
i
For the initial dataset, the Gini impurity is calculated as follows:
Gini(10,15,8,12) = 1 −1
42
−1
42
−1
42
−1
42
Gini(10,15,8,12) = 1 −1
16 −1
16 −1
16 −1
16
30

Gini(10,15,8,12) = 1 −1
4=3
4
2. Find the best split for each feature at each node to minimize
the Gini impurity.
b) The final classification tree after building the tree using Gini
impurity is as follows:
- Root Node (X1): Split at X1 = 2 - Left Node: Predict 10 - Right
Node: Continue splitting - Split at X2 = 3 - Left Node: Predict 12 -
Right Node: Predict 8
Question 17
A student is studying the factors that could potentially influence
a person’s decision to purchase a new car. The student collected
data on various variables such as income level, age, location, and car
model preference. The student decided to build a classification tree
to predict whether a person will buy a new car or not based on these
variables.
The student used the following data to build the classification tree:
Income Level Age Location Car Model Preference Buy New Car (Yes/No)
Low Young Urban SUV No
Medium Young Suburban Sedan Yes
High Middle-aged Rural Truck Yes
Medium Young Urban SUV No
Low Middle-aged Suburban SUV Yes
(a) Draw the classification tree for the given data.
(b) Explain how the classification tree can be used to predict
whether a new individual with the following characteristics will buy
a new car or not: Income Level: High, Age: Young, Location: Sub-
urban, Car Model Preference: Sedan.
—
Solution:
(a) To draw the classification tree for the given data, follow these
steps:
1. Root Node: Calculate the impurity measure (e.g., Gini index)
for the target variable ”Buy New Car (Yes/No).”
2. Split 1: Choose the best variable to split the data based on the
lowest impurity measure.
3. Split 2: Continue splitting the data based on the selected vari-
ables until each terminal node is as pure as possible.
4. Terminal Nodes: Assign the most frequent class in each termi-
nal node.
31
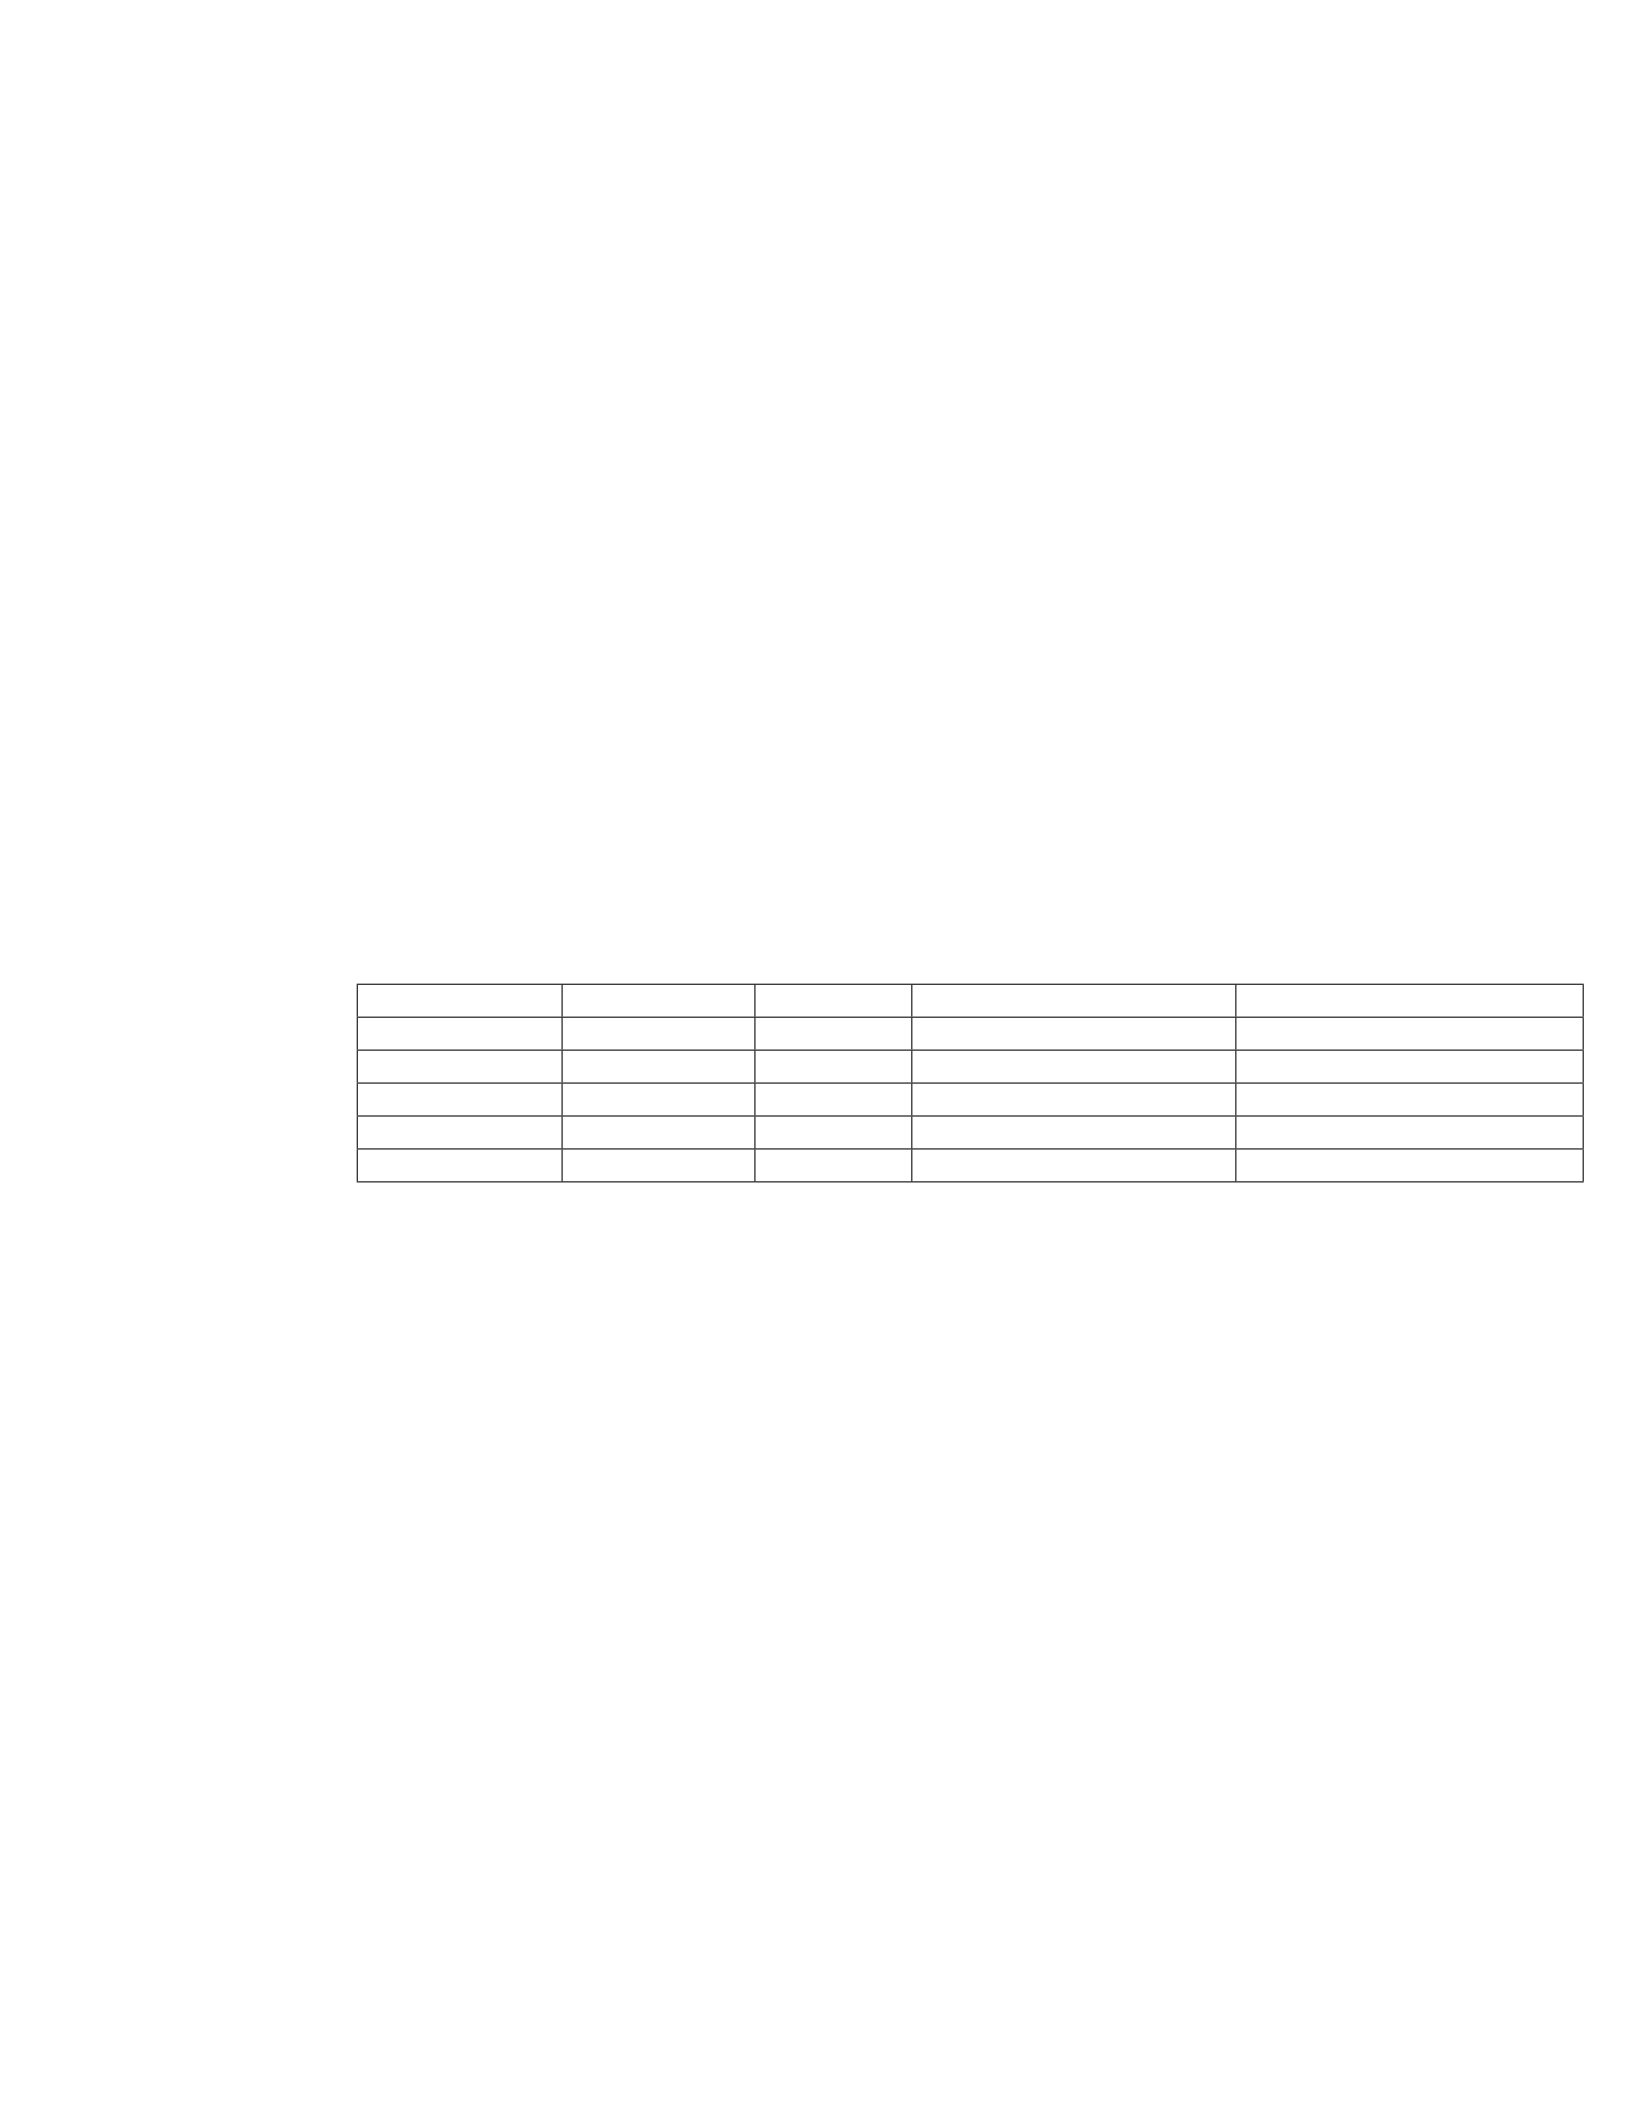
Here is the classification tree for the given data:
fortree =grow =north[IncomeLevel[Low, edgelabel =node[midway, abovelef t]N o[Y oung, edgelabel =node[midway, abovelef t]N o[U rban, edgelabel =node[midway, abovelef t]N o[SU V, edgelabel =node[midway, abovelef t]N o]]]][M edium, edgelabel =node[midway, aboveright]Y es[Y oung, edgelabel =node[midway, aboveright]N o[U rban, edgelabel =node[midway, aboveright]No[SU V, edgelabel =node[midway, aboveright]No]]][M iddle−aged, edgelabel =node[midway, aboveright]Y es[Rural, edgelabel =node[midway, aboveright]Y es[T ruck, edgelabel =node[midway, aboveright]Y es]]]][High, edgelabel =node[midway, aboveright]Y es[Y oung, edgelabel =node[midway, aboveright]N o[Suburban, edgelabel =node[midway, aboveright]Y es[SUV, edgelabel =node[midway, aboveright]Y es]]]][Middle−aged, edgelabel =node[midway, aboveright]Y es[Suburban, edgelabel =node[midway, aboveright]Y es[SU V, edgelabel =node[midway, aboveright]Y es]]]]
(b) To predict whether a new individual with the characteristics
Income Level: High, Age: Young, Location: Suburban, Car Model
Preference: Sedan will buy a new car or not using the classification
tree, follow the path based on the given characteristics: - Start at the
root node (Income Level) - Follow the branch for High - Move to the
Age node, follow the branch for Young - Move to the Location node,
followQuestion 17:
A student is studying the factors that could potentially influence
a person’s decision to purchase a new car. The student collected
data on various variables such as income level, age, location, and car
model preference. The student decided to build a classification tree
to predict whether a person will buy a new car or not based on these
variables.
The student used the following data to build the classification tree:
Income Level Age Location Car Model Preference Buy New Car (Yes/No)
Low Young Urban SUV No
Medium Young Suburban Sedan Yes
High Middle-aged Rural Truck Yes
Medium Young Urban SUV No
Low Middle-aged Suburban SUV Yes
(a) Draw the classification tree for the given data.
(b) Explain how the classification tree can be used to predict
whether a new individual with the following characteristics will buy
a new car or not: Income Level: High, Age: Young, Location: Sub-
urban, Car Model Preference: Sedan.
—
Solution:
(a) To draw the classification tree for the given data, follow these
steps:
1. Root Node: Calculate the impurity measure (e.g., Gini index)
for the target variable ”Buy New Car (Yes/No).”
2. Split 1: Choose the best variable to split the data based on the
lowest impurity measure.
3. Split 2: Continue splitting the data based on the selected vari-
ables until each terminal node is as pure as possible.
4. Terminal Nodes: Assign the most frequent class in each termi-
nal node.
Here is the classification tree for the given data:
32

fortree =grow =north[IncomeLevel[Low, edgelabel =node[midway, abovelef t]N o[Y oung, edgelabel =node[midway, abovelef t]N o[U rban, edgelabel =node[midway, abovelef t]N o[SU V, edgelabel =node[midway, aboveleft]No]]]][Medium, edgelabel =node[midway, aboveright]Y es[Y oung, edgelabel =node[midway, aboveright]No[Urban, edgelabel =node[midway, aboveright]N o[SU V, edgelabel =node[midway, aboveright]N o]]][M iddle−aged, edgelabel =node[midway, aboveright]Y es[Rural, edgelabel =node[midway, aboveright]Y es[T ruck, edgelabel =node[midway, aboveright]Y es]]]][High, edgelabel =node[midway, aboveright]Y es[Y oung, edgelabel =node[midway, aboveright]N o[Suburban, edgelabel =node[midway, aboveright]Y es[SUV, edgelabel =node[midway, aboveright]Y es]]]][Middle−aged, edgelabel =node[midway, aboveright]Y es[Suburban, edgelabel =node[midway, aboveright]Y es[SU V, edgelabel =node[midway, aboveright]Y es]]]]
(b) To predict whether a new individual with the characteristics
Income Level: High, Age: Young, Location: Suburban, Car Model
Preference: Sedan will buy a new car or not using the classification
tree, follow the path based on the given characteristics: - Start at the
root node (Income Level) - Follow the branch for High - Move to the
Age node, follow the branch for Young - Move to the Location node,
follow
Question 18
Explain the concept of pruning in the context of Classification and
Regression Trees (CART).
Step-by-step solution:
Pruning in the context of CART refers to the process of reducing
the size of a decision tree by removing some of its branches. This is
done to prevent overfitting, which occurs when a tree is too complex
and captures noise in the training data rather than the underlying
patterns.
The process of pruning involves: 1. Growing a full decision tree,
which includes all possible splits based on the training data. 2. As-
sessing the performance of the tree on a separate validation dataset
or through cross-validation. 3. Starting at the leaves of the tree and
working upwards, evaluating the impact of removing a branch on the
overall performance of the tree. 4. If removing a branch improves
or maintains the performance of the tree, that branch is pruned. 5.
This process continues until further pruning would decrease the per-
formance of the tree.
Pruning helps to simplify the decision tree, making it easier to
interpret and less susceptible to overfitting. By finding the optimal
balance between complexity and performance, pruning can improve
the generalization ability of the tree on unseen data.Question 18:
Explain the concept of pruning in the context of Classification and
Regression Trees (CART).
Step-by-step solution:
Pruning in the context of CART refers to the process of reducing
the size of a decision tree by removing some of its branches. This is
done to prevent overfitting, which occurs when a tree is too complex
and captures noise in the training data rather than the underlying
patterns.
The process of pruning involves: 1. Growing a full decision tree,
which includes all possible splits based on the training data. 2. As-
sessing the performance of the tree on a separate validation dataset
33

or through cross-validation. 3. Starting at the leaves of the tree and
working upwards, evaluating the impact of removing a branch on the
overall performance of the tree. 4. If removing a branch improves
or maintains the performance of the tree, that branch is pruned. 5.
This process continues until further pruning would decrease the per-
formance of the tree.
Pruning helps to simplify the decision tree, making it easier to
interpret and less susceptible to overfitting. By finding the optimal
balance between complexity and performance, pruning can improve
the generalization ability of the tree on unseen data.
Question 19
Consider the following dataset that contains information on stu-
dents’ study habits and their final exam scores:
Study Hours (X1) Practice Tests (X2) Final Exam Score (Y)
4 3 85
6 2 82
2 5 78
5 4 88
Construct a classification and regression tree (CART) to predict
the final exam score based on the study hours and practice tests.
Step-by-step solution:
1. Calculate the Gini impurity for the initial node:
Gini = 1 −Xp2
i
where piis the proportion of each class in the node.
For the initial node:
phigh =2
4= 0.5
plow =2
4= 0.5
Giniinitial = 1 −(0.52+ 0.52)=0.5
2. Determine the best split based on Gini impurity reduction.
Calculate the Gini impurity for each possible split and find the one
with the highest reduction.
For splitting on Study Hours (X1 = 4):
Left Child Node (X1 ¡ 4):
Ginileft =calculategini(lef tchilddata)calculategini(leftchilddata)calculategini(lef tchilddata)calculategini(lef tchilddata)
34

Right Child Node (X1 ¿= 4):
Giniright =calculategini(rightchilddata)calculategini(rightchilddata)calculategini(rightchilddata)calculategini(rightchilddata)
3. Compare the Gini impurity of the potential splits and choose
the best split. Repeat the process for subsequent splits until stopping
criteria are met.
Continue constructing the tree by recursively splitting the nodes
based on the features that provide the most information gain until a
stopping criteria is reached.
This process results in a classification and regression tree (CART)
that can be used to predict the final exam score based on the study
hours and practice tests.Question 19:
Consider the following dataset that contains information on stu-
dents’ study habits and their final exam scores:
Study Hours (X1) Practice Tests (X2) Final Exam Score (Y)
4 3 85
6 2 82
2 5 78
5 4 88
Construct a classification and regression tree (CART) to predict
the final exam score based on the study hours and practice tests.
Step-by-step solution:
1. Calculate the Gini impurity for the initial node:
Gini = 1 −Xp2
i
where piis the proportion of each class in the node.
For the initial node:
phigh =2
4= 0.5
plow =2
4= 0.5
Giniinitial = 1 −(0.52+ 0.52)=0.5
2. Determine the best split based on Gini impurity reduction.
Calculate the Gini impurity for each possible split and find the one
with the highest reduction.
For splitting on Study Hours (X1 = 4):
Left Child Node (X1 ¡ 4):
Ginileft =calculategini(lef tchilddata)calculategini(leftchilddata)calculategini(lef tchilddata)calculategini(lef tchilddata)
35

Right Child Node (X1 ¿= 4):
Giniright =calculategini(rightchilddata)calculategini(rightchilddata)calculategini(rightchilddata)calculategini(rightchilddata)
3. Compare the Gini impurity of the potential splits and choose
the best split. Repeat the process for subsequent splits until stopping
criteria are met.
Continue constructing the tree by recursively splitting the nodes
based on the features that provide the most information gain until a
stopping criteria is reached.
This process results in a classification and regression tree (CART)
that can be used to predict the final exam score based on the study
hours and practice tests.
Question 20
A company wants to build a decision tree to classify customers
as ”likely to buy” or ”not likely to buy” based on their age, income,
and browsing history (number of pages visited on the company’s web-
site). The company has gathered the following data from a sample of
customers:
Customer ID Age (years) Income (
$
) Pages Visited Likely to Buy
1 25 35000 10 Yes
2 40 50000 5 No
3 30 45000 8 Yes
4 35 60000 3 No
5 20 30000 12 Yes
6 45 70000 6 No
7 28 40000 9 Yes
8 38 55000 4 No
Based on this data, the company wants to construct a classification
tree to predict whether a customer is likely to buy or not. Use the
Classification and Regression Tree (CART) algorithm to build the
decision tree.
a. Calculate the Gini impurity for the initial node.
b. Determine the best split point and resulting nodes based on
Gini impurity.
c. Continue splitting the nodes until all nodes are pure or addi-
tional splitting does not provide further improvements in Gini impu-
rity.
d. Draw the final classification tree.
36

0.1 Solution:
a. Calculating the Gini impurity for the initial node:
Gini impurity for a node is calculated using the formula:
Gini = 1 −
c
X
i=1
(pi)2
where piis the probability of class iin the node and cis the number
of classes.
For the initial node ”Likely to Buy”:
Gini = 1 −(P(Yes))2−(P(No))2
Calculating the probabilities: - P(Yes) = 4
8= 0.5-P(No) = 4
8= 0.5
Substitute into the formula:
Gini = 1 −(0.5)2−(0.5)2= 0.5
Therefore, the Gini impurity for the initial node is 0.5.
b. Determining the best split point and resulting nodes based on
Gini impurity:
To find the best split, we calculate the Gini impurity for each
feature and each split point.
For Age: - Split at 25 years:
Probabilities: - P(Yes) = 1
1= 1 -P(No)=0
Gini impurity: 1−(1)2−(0)2= 0
- Split at 30 years:
Probabilities: - P(Yes) = 2
2= 1 -P(No)=0
Gini impurity: 1−(1)2−(0)2= 0
- Split at 35 years:
Probabilities: - P(Yes) = 1
2= 0.5-P(No) = 1
2= 0.5
Gini impurity: 1−(0.5)2−(0.5)2= 0.5
- Split at 38 years:
Probabilities: - P(Yes) = 1
3≈0.33 -P(No) = 2
3≈0.67
Gini impurity: 1−(0.33)2−(0.67)2
0.2 Question 20:
A company wants to build a decision tree to classify customers as
”likely to buy” or ”not likely to buy” based on their age, income,
and browsing history (number of pages visited on the company’s web-
site). The company has gathered the following data from a sample of
customers:
37

Customer ID Age (years) Income (
$
) Pages Visited Likely to Buy
1 25 35000 10 Yes
2 40 50000 5 No
3 30 45000 8 Yes
4 35 60000 3 No
5 20 30000 12 Yes
6 45 70000 6 No
7 28 40000 9 Yes
8 38 55000 4 No
Based on this data, the company wants to construct a classification
tree to predict whether a customer is likely to buy or not. Use the
Classification and Regression Tree (CART) algorithm to build the
decision tree.
a. Calculate the Gini impurity for the initial node.
b. Determine the best split point and resulting nodes based on
Gini impurity.
c. Continue splitting the nodes until all nodes are pure or addi-
tional splitting does not provide further improvements in Gini impu-
rity.
d. Draw the final classification tree.
0.3 Solution:
a. Calculating the Gini impurity for the initial node:
Gini impurity for a node is calculated using the formula:
Gini = 1 −
c
X
i=1
(pi)2
where piis the probability of class iin the node and cis the number
of classes.
For the initial node ”Likely to Buy”:
Gini = 1 −(P(Yes))2−(P(No))2
Calculating the probabilities: - P(Yes) = 4
8= 0.5-P(No) = 4
8= 0.5
Substitute into the formula:
Gini = 1 −(0.5)2−(0.5)2= 0.5
Therefore, the Gini impurity for the initial node is 0.5.
b. Determining the best split point and resulting nodes based on
Gini impurity:
To find the best split, we calculate the Gini impurity for each
feature and each split point.
38

For Age: - Split at 25 years:
Probabilities: - P(Yes) = 1
1= 1 -P(No)=0
Gini impurity: 1−(1)2−(0)2= 0
- Split at 30 years:
Probabilities: - P(Yes) = 2
2= 1 -P(No)=0
Gini impurity: 1−(1)2−(0)2= 0
- Split at 35 years:
Probabilities: - P(Yes) = 1
2= 0.5-P(No) = 1
2= 0.5
Gini impurity: 1−(0.5)2−(0.5)2= 0.5
- Split at 38 years:
Probabilities: - P(Yes) = 1
3≈0.33 -P(No) = 2
3≈0.67
Gini impurity: 1−(0.33)2−(0.67)2
39

