EDUC 812
Independent Samples T-Test Assignment
Jada Nunn-Mclean, M.A.
EDUC-812
Page 1 of 6
EDUC 812
FINDINGS
Overview
The purpose of this study was to see if there was a significant difference between
Scholastic Assessment Test (SAT) scores of male and female high school students. The
independent variable was gender and the dependent variable was SAT scores. An Independent
Samples t-test was used to test the hypothesis. The Findings section includes the research
question, null hypothesis, data screening, descriptive statistics, assumption testing, and results.
Research Question
RQ: Is there a significant difference between Scholastic Assessment Test (SAT) scores of
male and female high school students?
Null Hypothesis
H0: There is no significant difference between Scholastic Assessment Test (SAT) scores
of male and female high school students.
Data Screening
Data screening was conducted on each group’s dependent variable. The researcher sorted
the data on each variable and scanned for inconsistencies. One data inconsistency was identified.
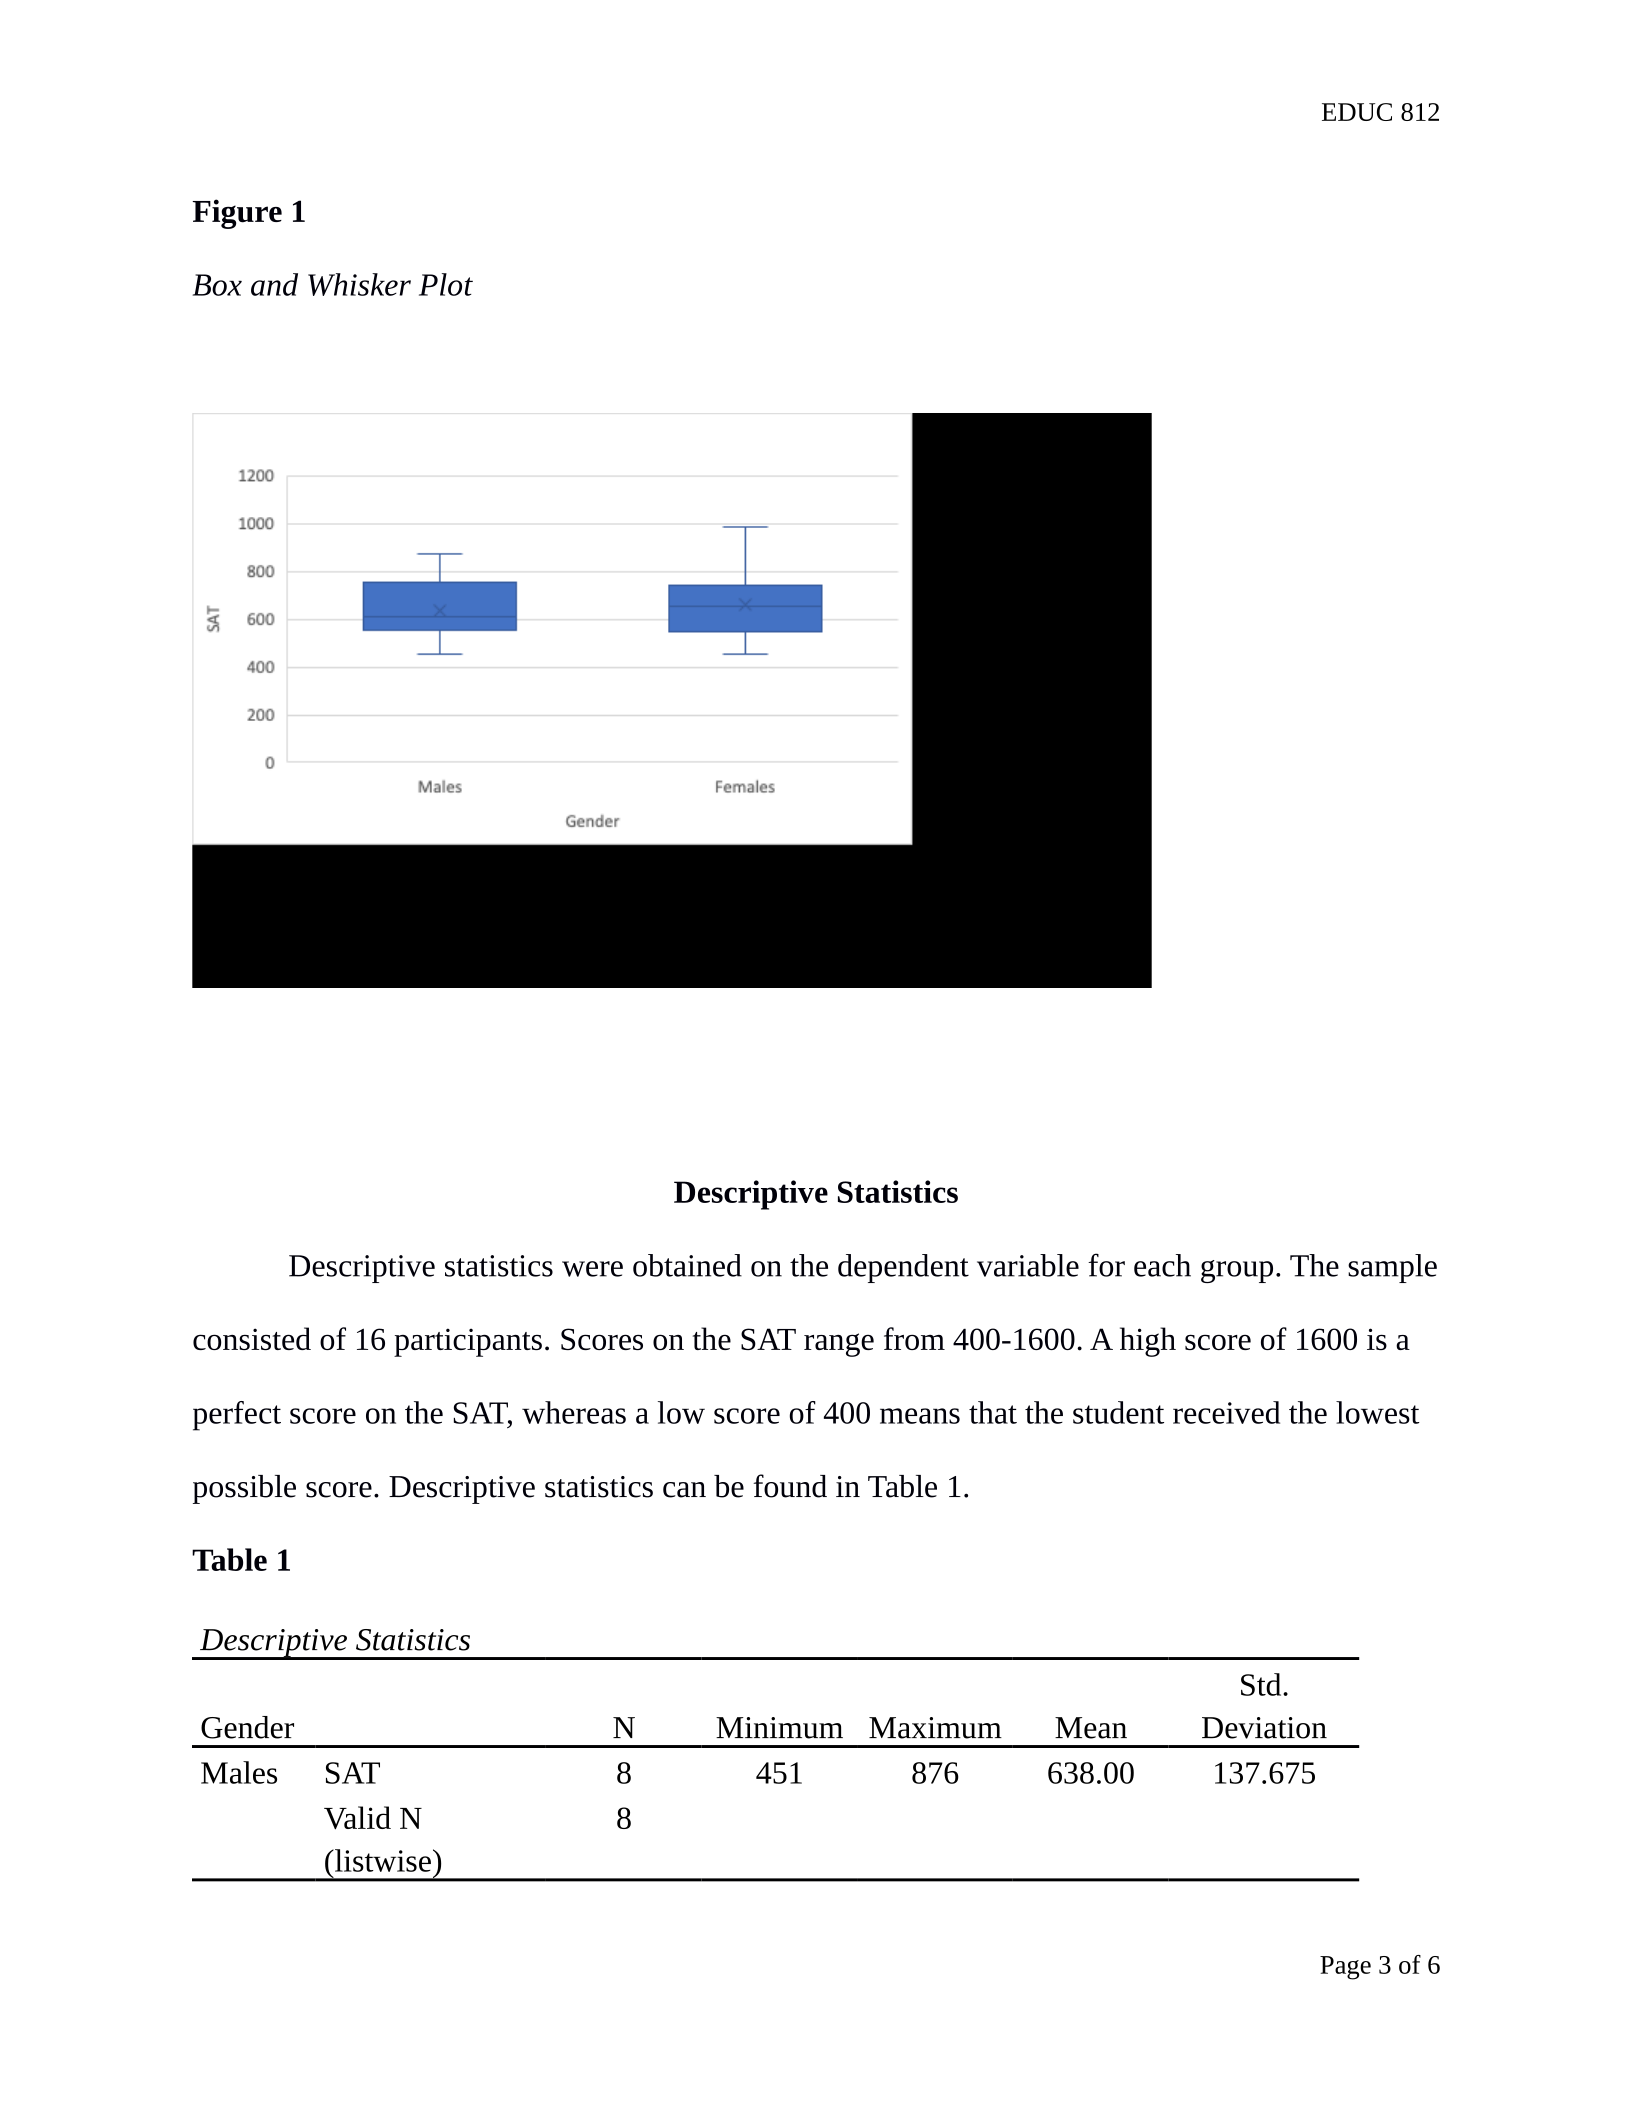
Box and whiskers plots were used to detect outliers on each dependent variable and. There was 1
outlier found in student #11. See Figure 1 for box and whisker plots.
Page 2 of 6
EDUC 812
Figure 1
Box and Whisker Plot
Descriptive Statistics
Descriptive statistics were obtained on the dependent variable for each group. The sample
consisted of 16 participants. Scores on the SAT range from 400-1600. A high score of 1600 is a
perfect score on the SAT, whereas a low score of 400 means that the student received the lowest
possible score. Descriptive statistics can be found in Table 1.
Table 1
Descriptive Statistics
Gender N Minimum Maximum Mean
Std.
Deviation
Males SAT 8 451 876 638.00 137.675
Valid N
(listwise)
8
Page 3 of 6
EDUC 812
Females SAT 8 451 989 660.75 162.989
Valid N
(listwise)
8
a. No statistics are computed for one or more split files because there are no valid cases.
Assumption Testing
Assumption of Normality
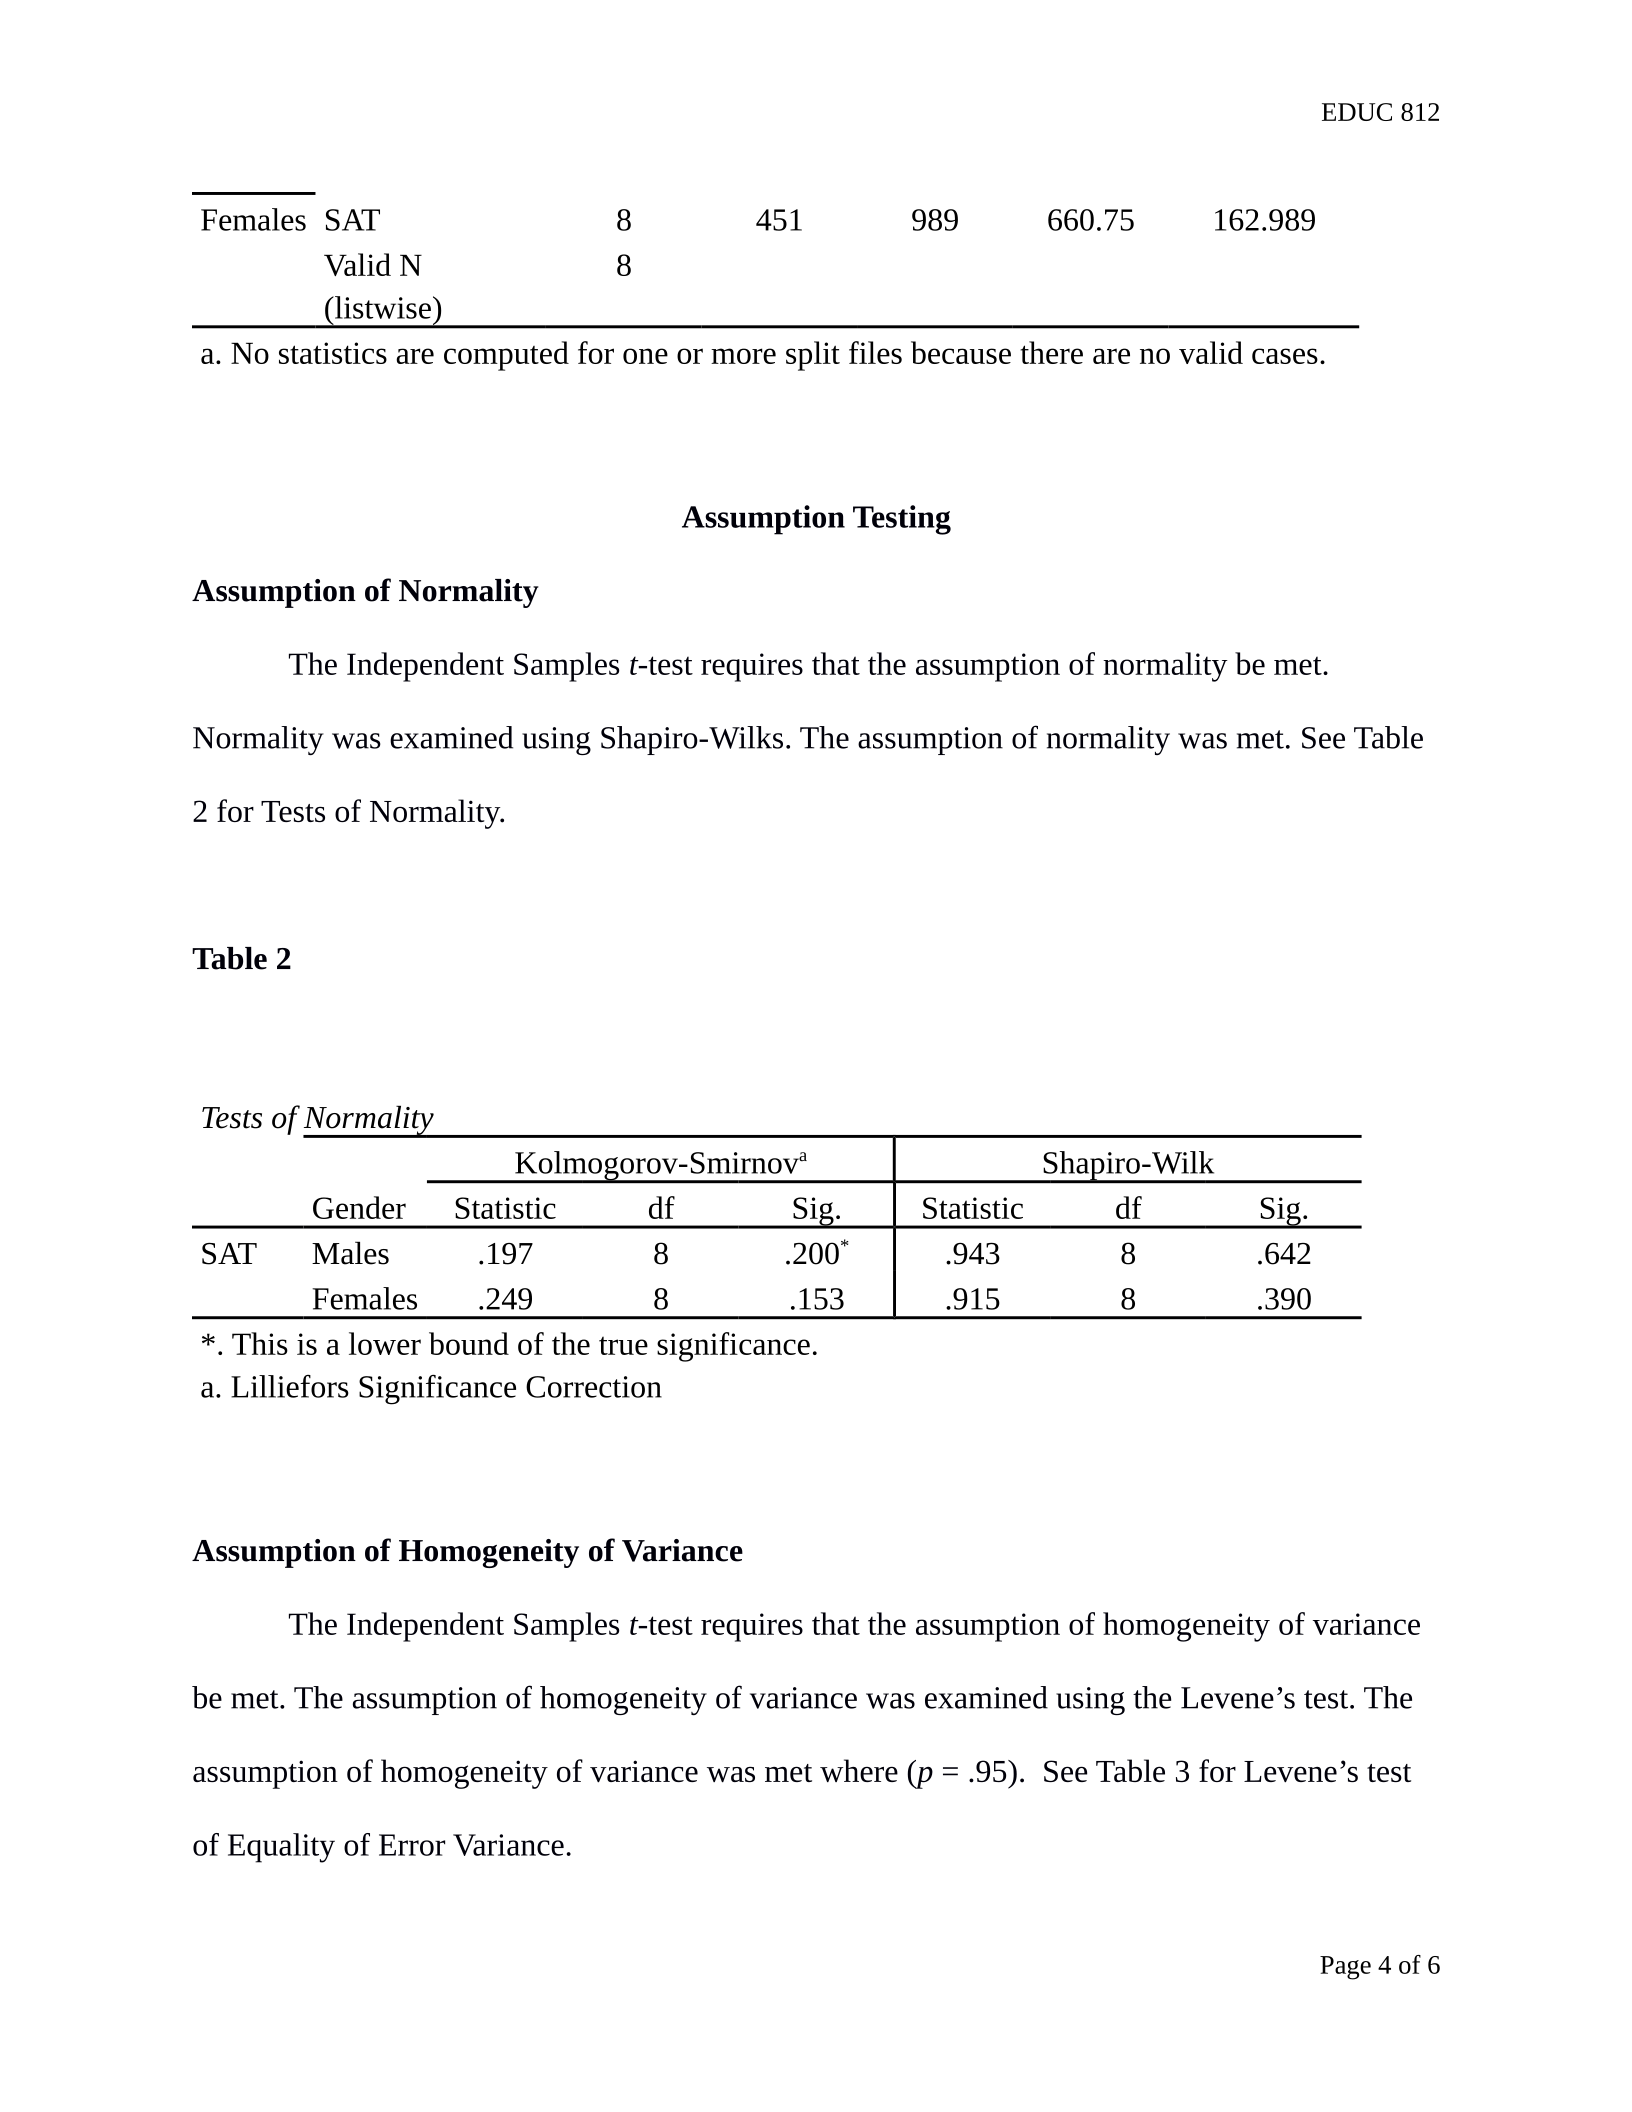
The Independent Samples t-test requires that the assumption of normality be met.
Normality was examined using Shapiro-Wilks. The assumption of normality was met. See Table
2 for Tests of Normality.
Table 2
Tests of Normality
Gender
Kolmogorov-SmirnovaShapiro-Wilk
Statistic df Sig. Statistic df Sig.
SAT Males .197 8 .200*.943 8 .642
Females .249 8 .153 .915 8 .390
*. This is a lower bound of the true significance.
a. Lilliefors Significance Correction
Assumption of Homogeneity of Variance
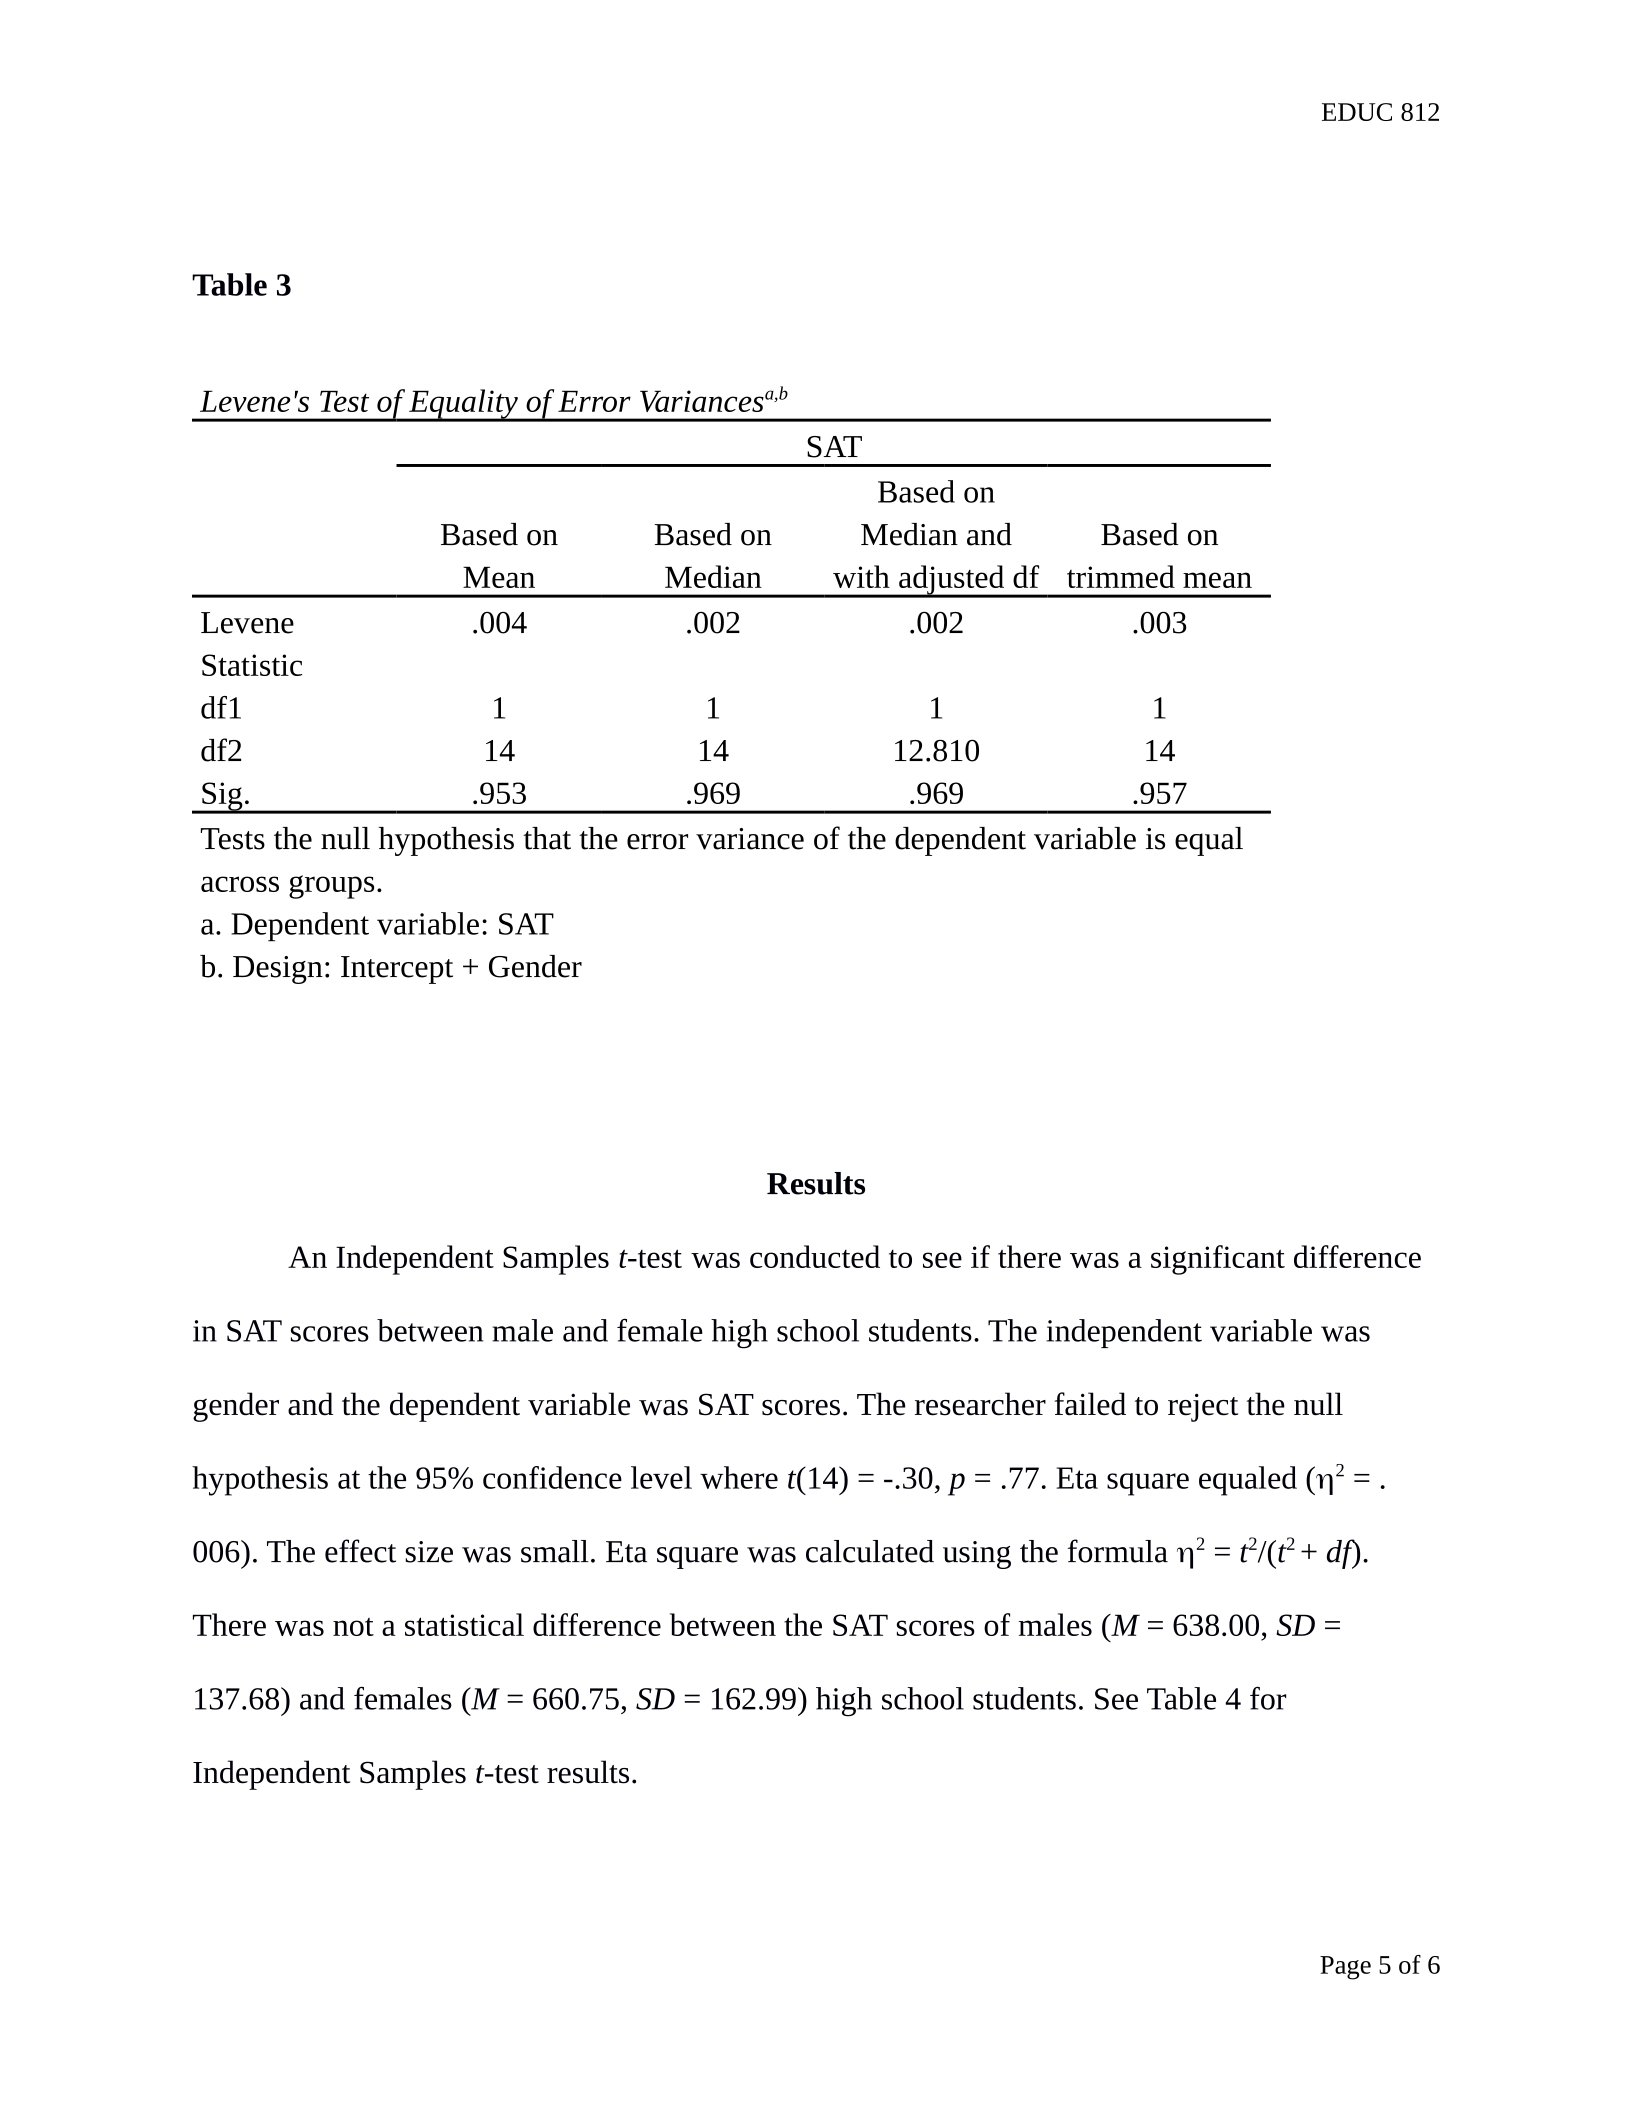
The Independent Samples t-test requires that the assumption of homogeneity of variance
be met. The assumption of homogeneity of variance was examined using the Levene’s test. The
assumption of homogeneity of variance was met where (p = .95). See Table 3 for Levene’s test
of Equality of Error Variance.
Page 4 of 6
EDUC 812
Table 3
Levene's Test of Equality of Error Variancesa,b
SAT
Based on
Mean
Based on
Median
Based on
Median and
with adjusted df
Based on
trimmed mean
Levene
Statistic
.004 .002 .002 .003
df1 1 1 1 1
df2 14 14 12.810 14
Sig. .953 .969 .969 .957
Tests the null hypothesis that the error variance of the dependent variable is equal
across groups.
a. Dependent variable: SAT
b. Design: Intercept + Gender
Results
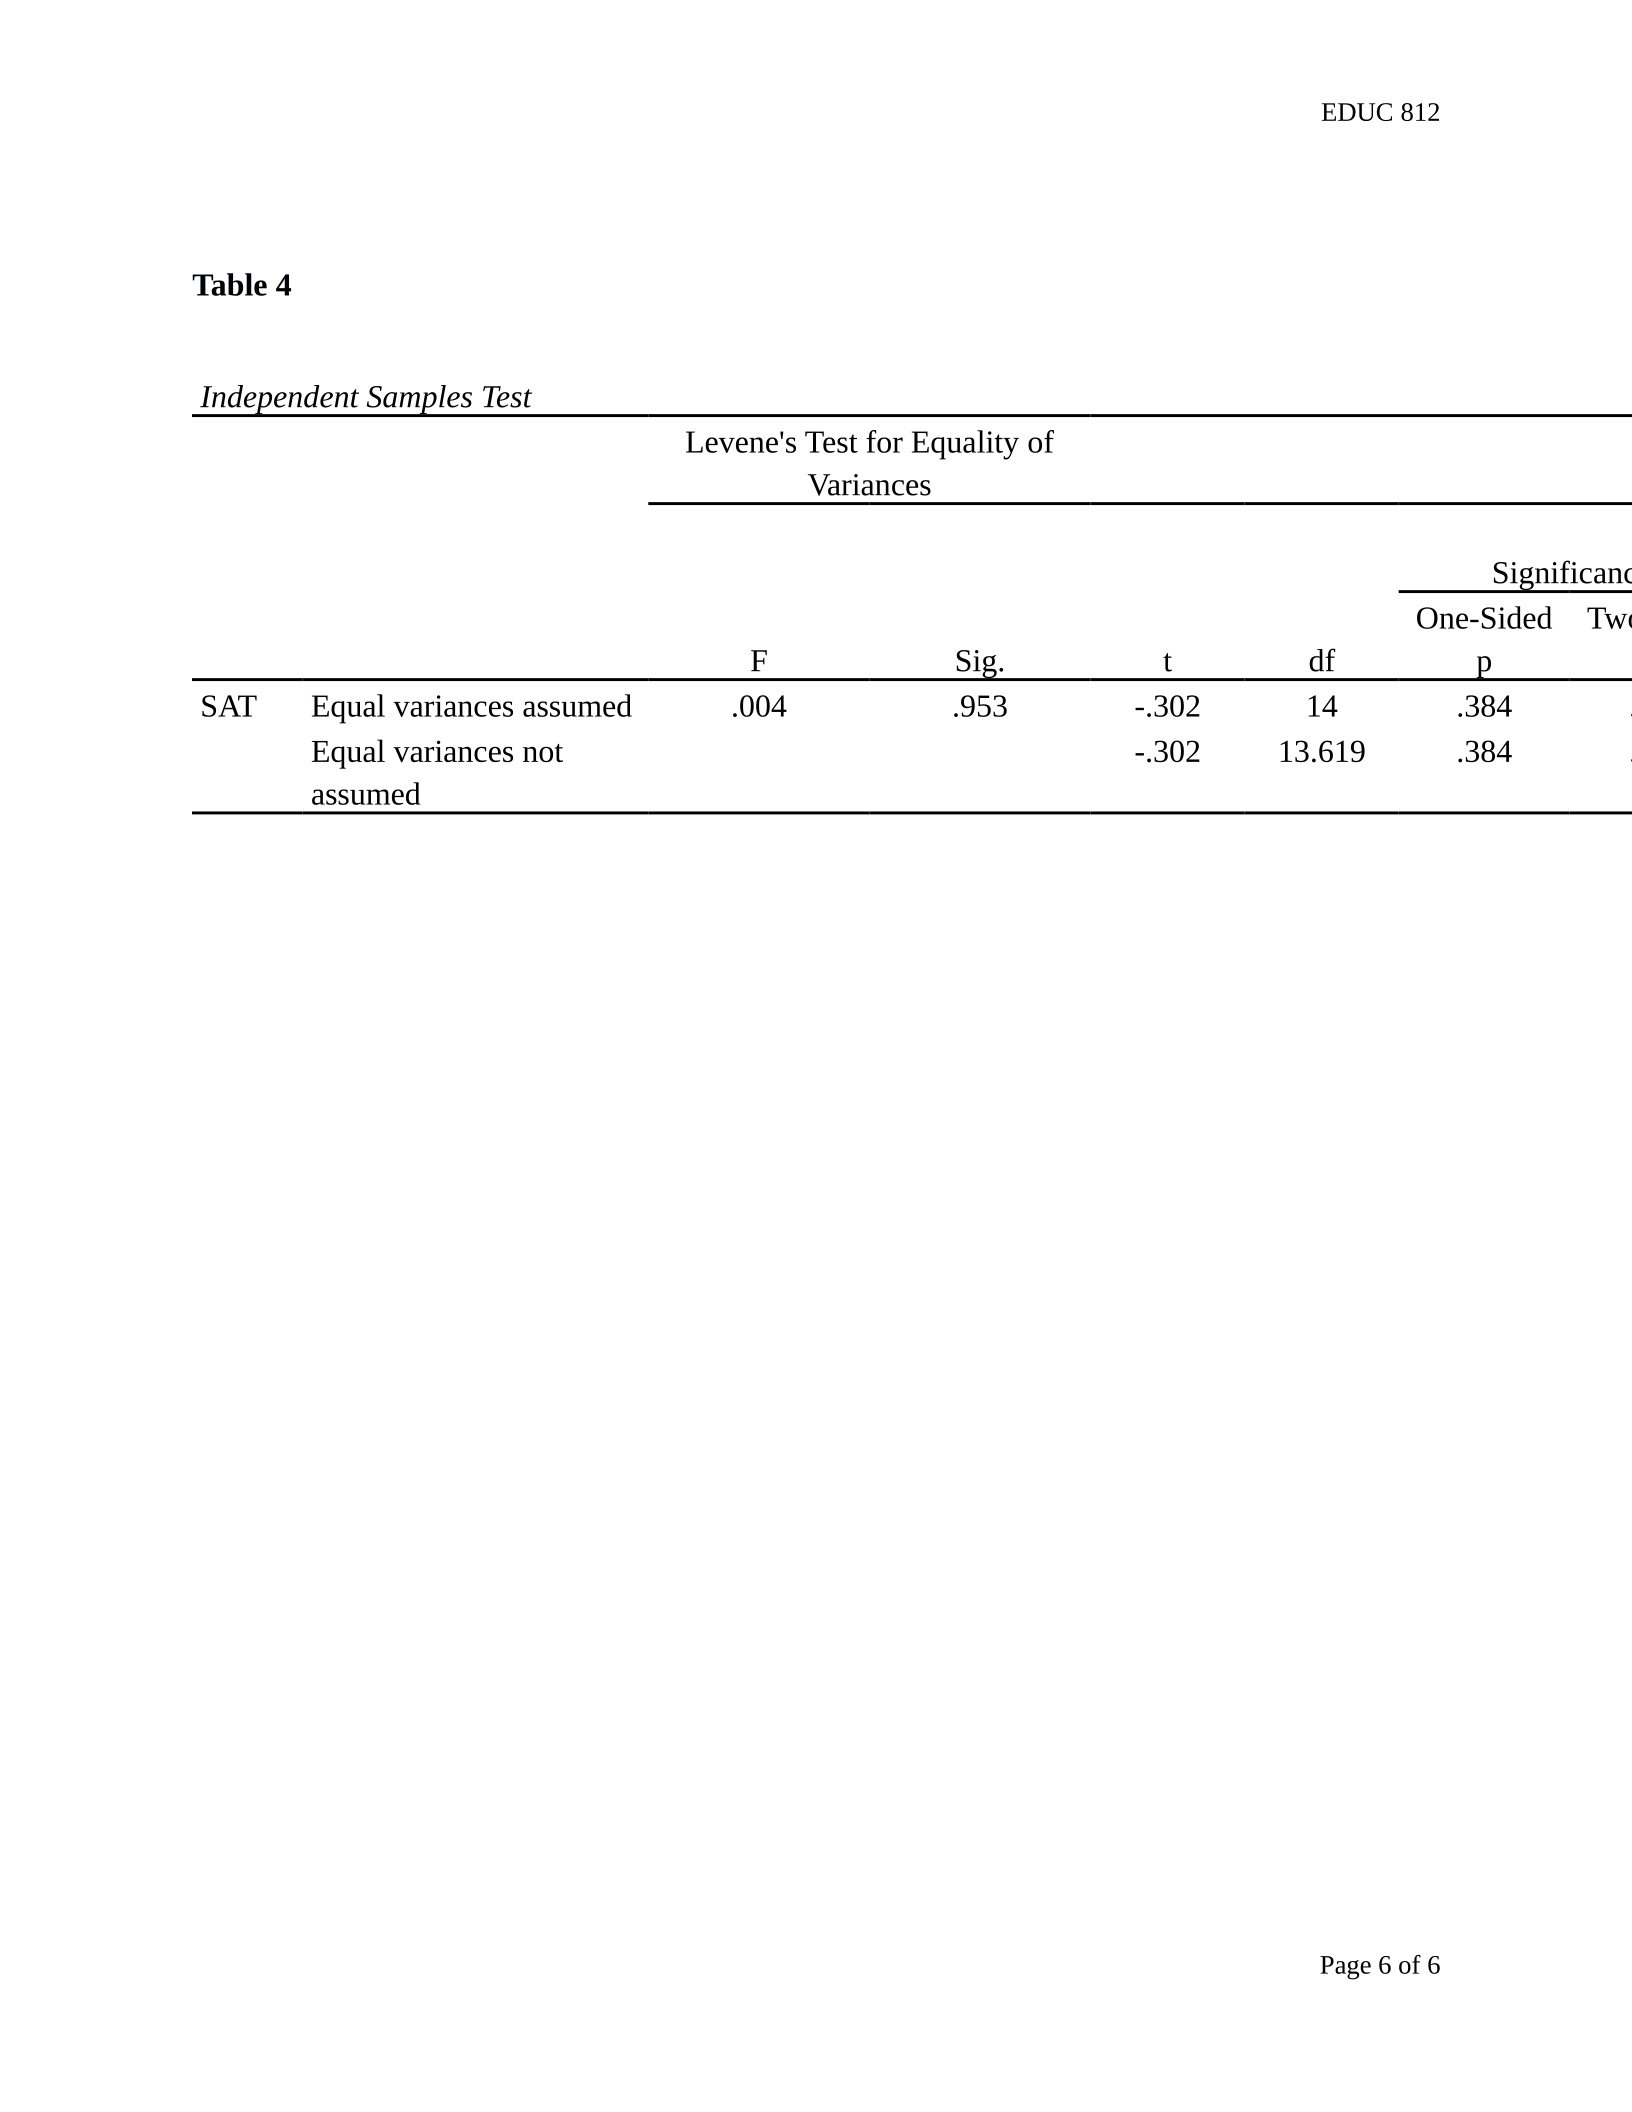
An Independent Samples t-test was conducted to see if there was a significant difference
in SAT scores between male and female high school students. The independent variable was
gender and the dependent variable was SAT scores. The researcher failed to reject the null
hypothesis at the 95% confidence level where t(14) = -.30, p = .77. Eta square equaled (2 = .
006). The effect size was small. Eta square was calculated using the formula 2 = t2/(t2 + df).
There was not a statistical difference between the SAT scores of males (M = 638.00, SD =
137.68) and females (M = 660.75, SD = 162.99) high school students. See Table 4 for
Independent Samples t-test results.
Page 5 of 6