Liberty University SOE 04-20-2018
GROUP # WRITE-UP: SPSS 4
by
Furman Leopard, Amy Lundgren, Rebecca Peeler, Zaida Saldivar & Ashleigh Yearde
Liberty University
Partial Fulfillment
Of the Requirements for EDUC 812
Liberty University
Year
Liberty University SOE 04-20-2018
FINDINGS
Research Question
The research question for this study was:
RQ1: Is there a difference in depression among students who receive Journal and
Counseling therapy, Journal therapy only, or Counseling therapy only?
Null Hypothesis
The null hypothesis for this study was:
H01: There is no significant difference among the depression scores of students who
receive Journal and Counseling therapy, Journal therapy only, or Counseling therapy only, while
controlling for pre-test depression scores.
Descriptive Statistics
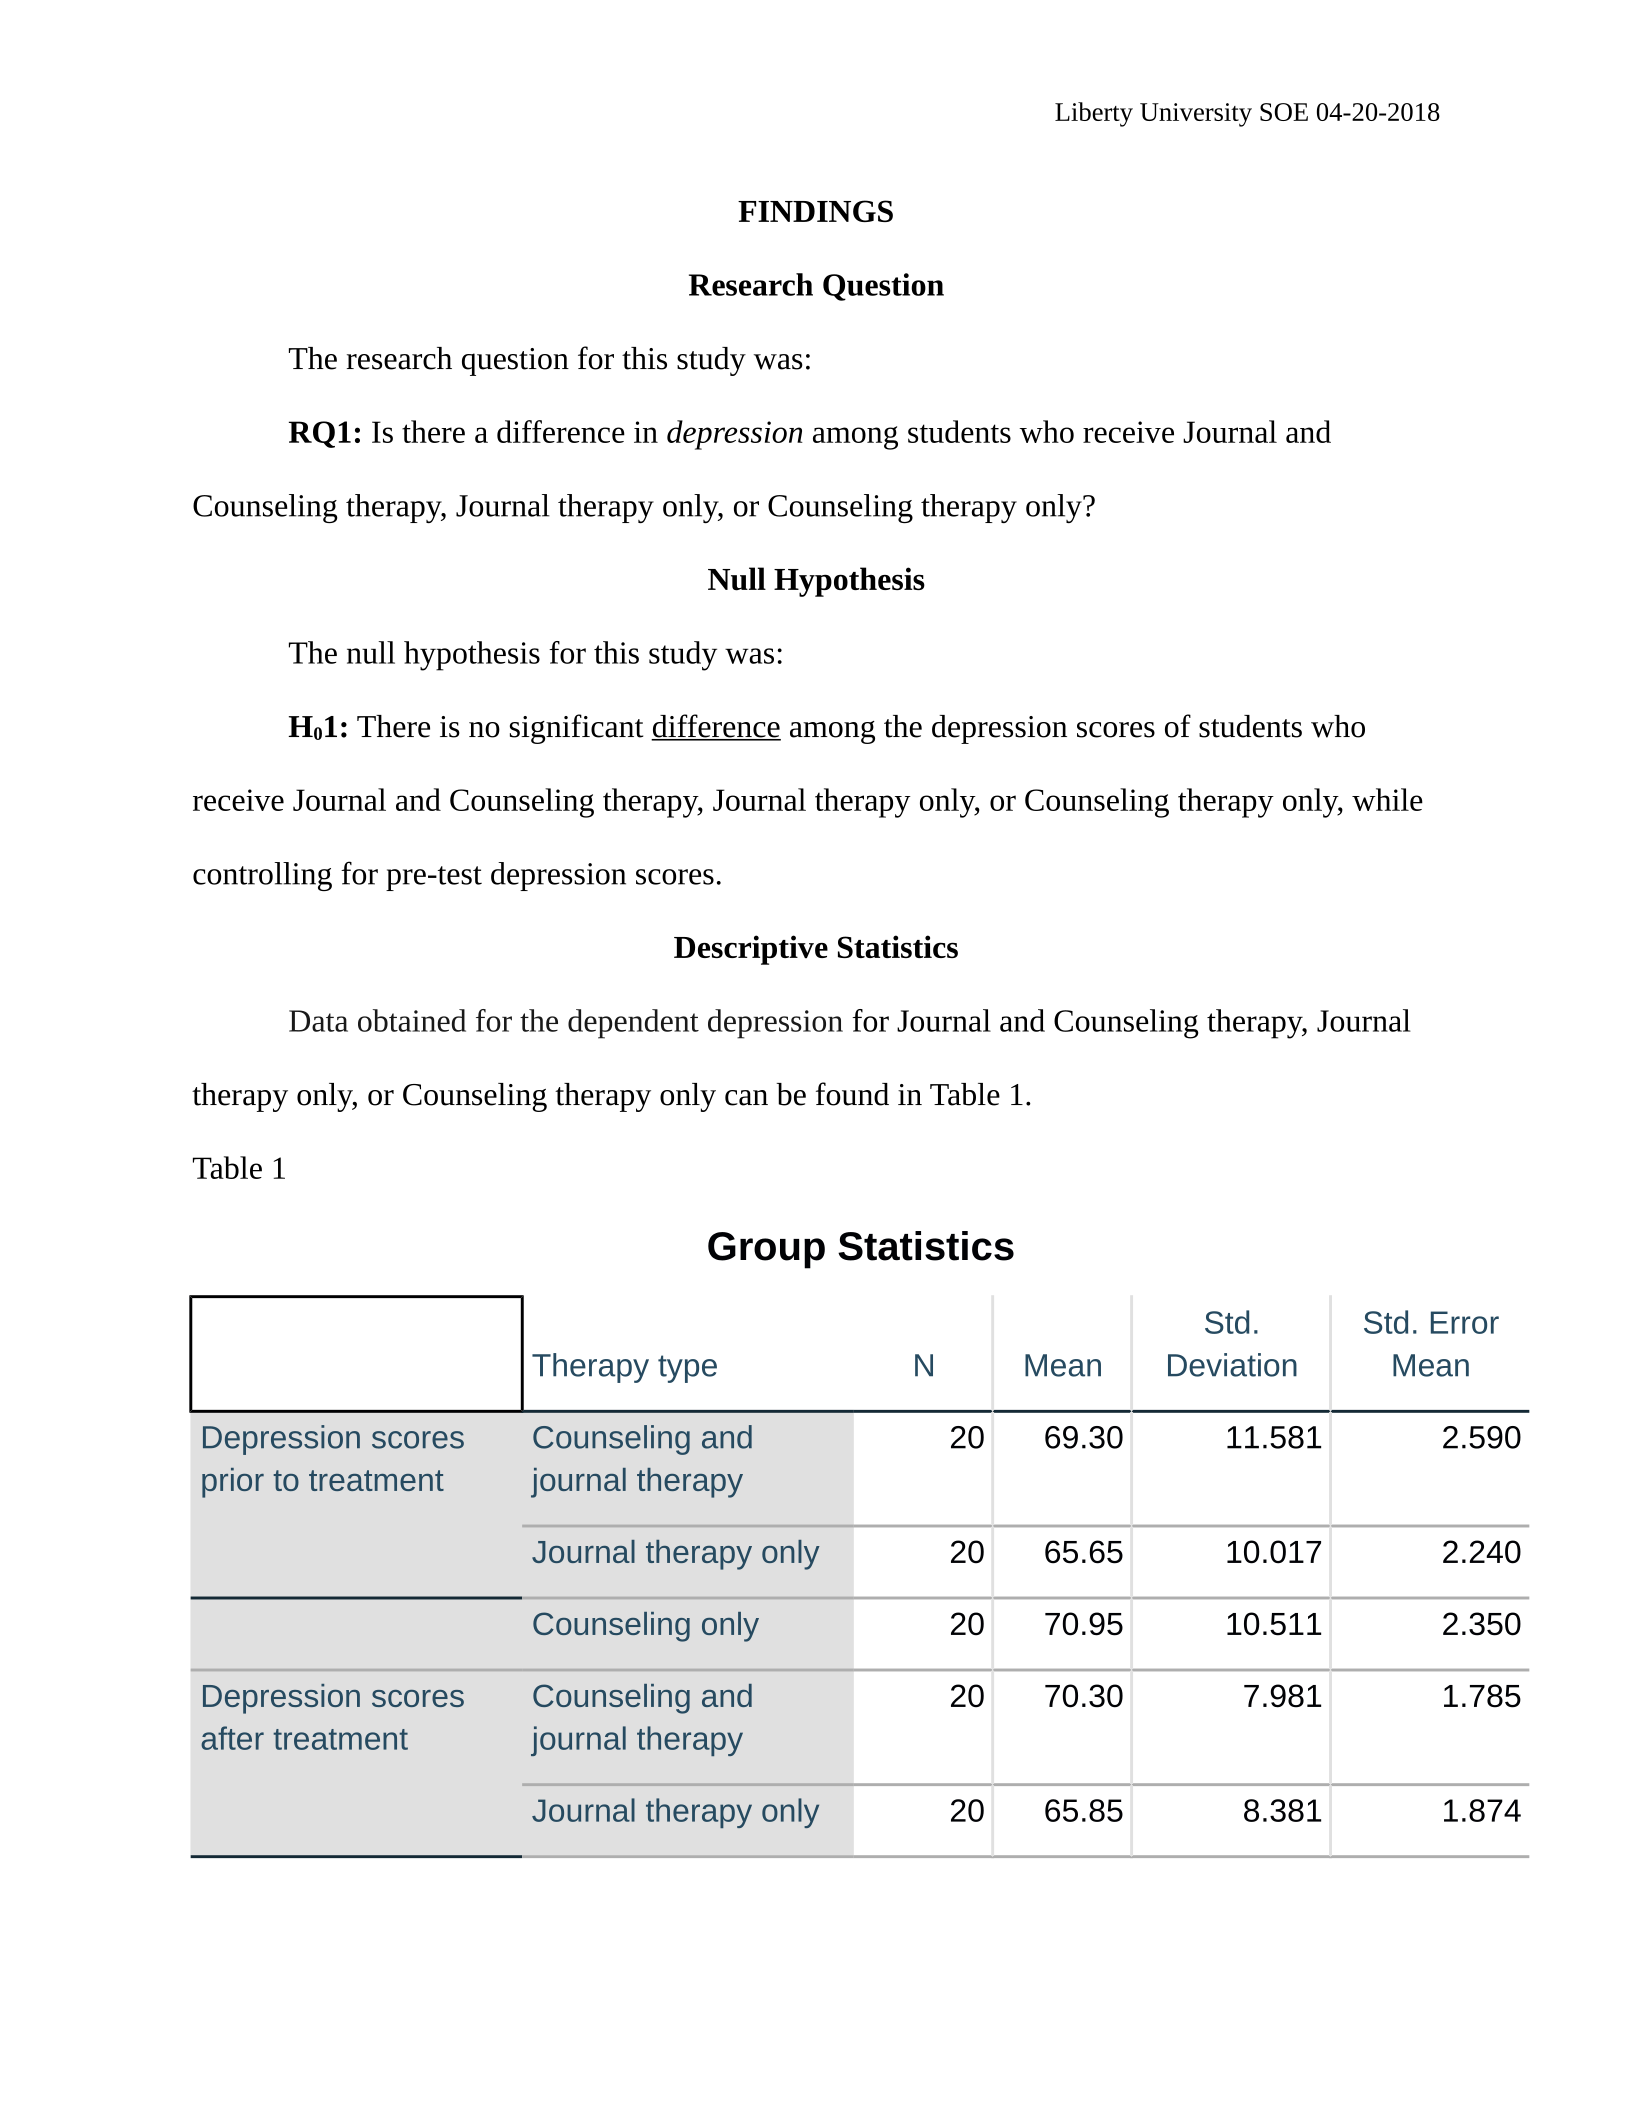
Data obtained for the dependent depression for Journal and Counseling therapy, Journal
therapy only, or Counseling therapy only can be found in Table 1.
Table 1
Group Statistics
Therapy type N Mean
Std.
Deviation
Std. Error
Mean
Depression scores
prior to treatment
Counseling and
journal therapy
20 69.30 11.581 2.590
Journal therapy only 20 65.65 10.017 2.240
Counseling only 20 70.95 10.511 2.350
Depression scores
after treatment
Counseling and
journal therapy
20 70.30 7.981 1.785
Journal therapy only 20 65.85 8.381 1.874
Liberty University SOE 04-20-2018
Counseling only 20 71.10 7.210 1.612
Results
Data screening
Data screening was conducted on each group’s dependent variables (Journal and
Counseling therapy, Journal therapy only, or Counseling therapy only) regarding data
inconsistencies and outliers. The researcher sorted the data on each variable and scanned for
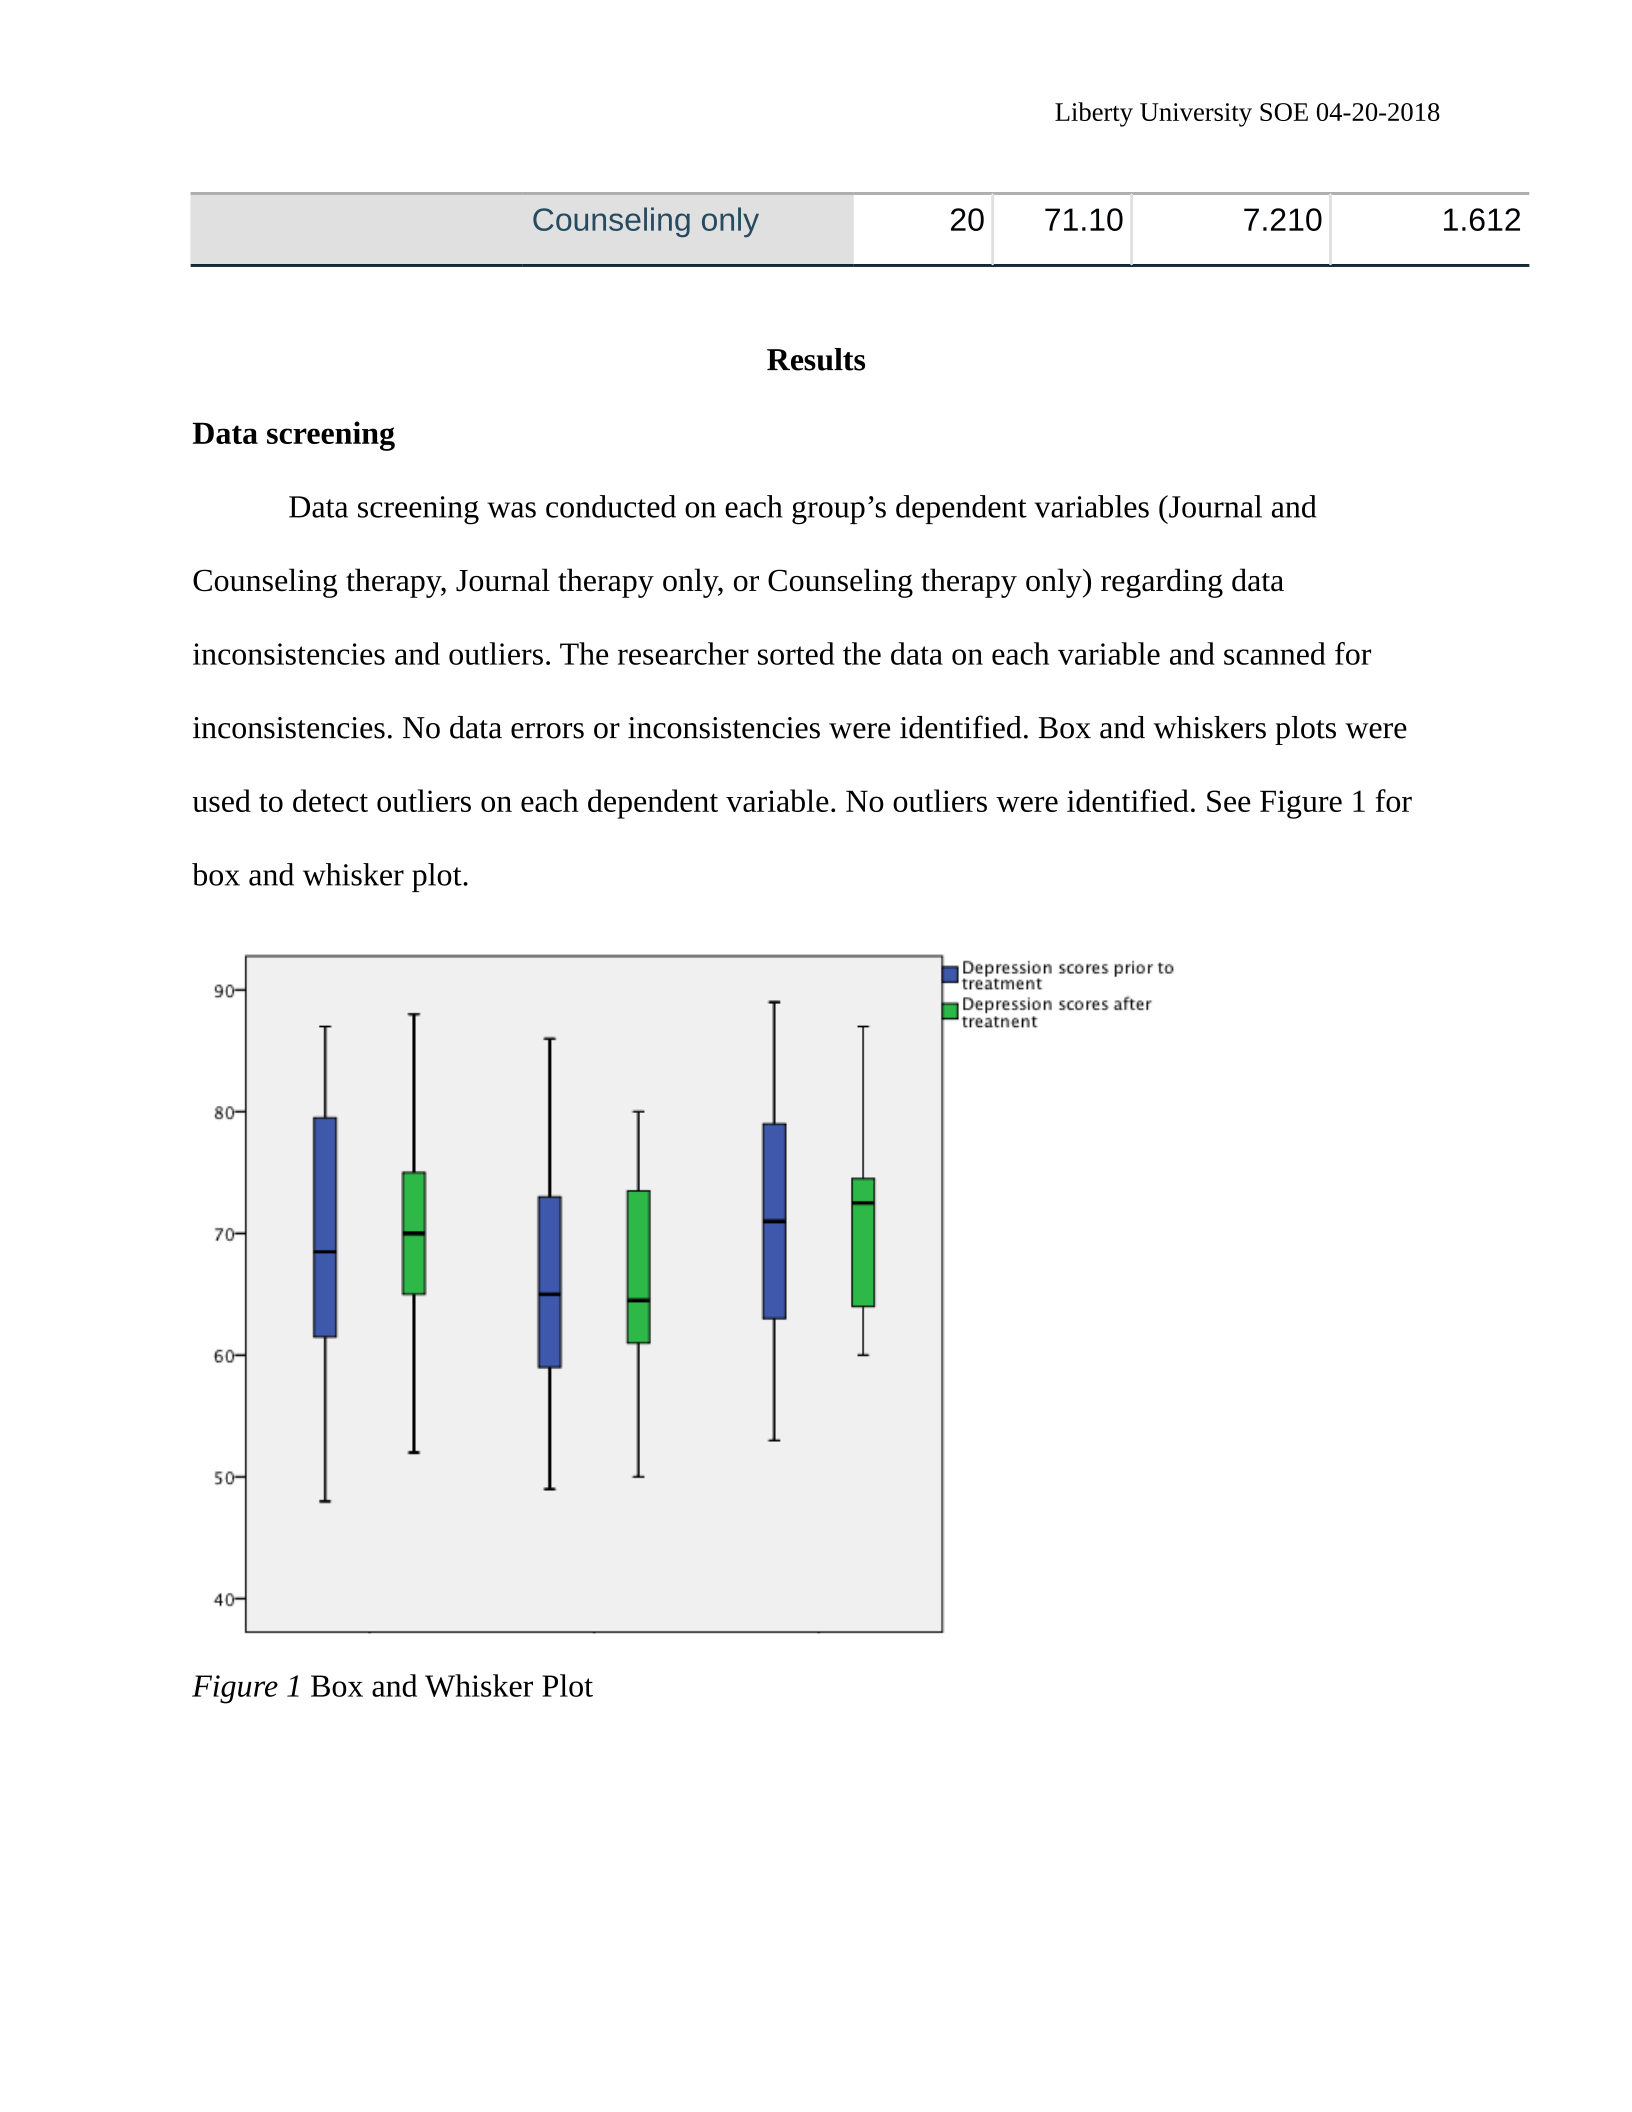
inconsistencies. No data errors or inconsistencies were identified. Box and whiskers plots were
used to detect outliers on each dependent variable. No outliers were identified. See Figure 1 for
box and whisker plot.
Tests of Normality
Group Kolmogorov-SmirnovaShapiro-Wilk
Statistic df Sig. Statistic df Sig.
Score
TL .179 10 .200*.883 10 .140
AL .224 9 .200*.921 9 .399
SL .105 11 .200*.958 11 .751
*. This is a lower bound of the true significance.
a. Lilliefors Significance Correction
Figure 1 Box and Whisker Plot
Liberty University SOE 04-20-2018
Assumptions
An Analysis of Variance (ANOVA) was used to test the first null hypothesis that looked
at the differences among type of therapy.. The ANOVA required that the assumptions of
normality and homogeneity of variance are met. Normality was examined using a Shapiro-Wilk
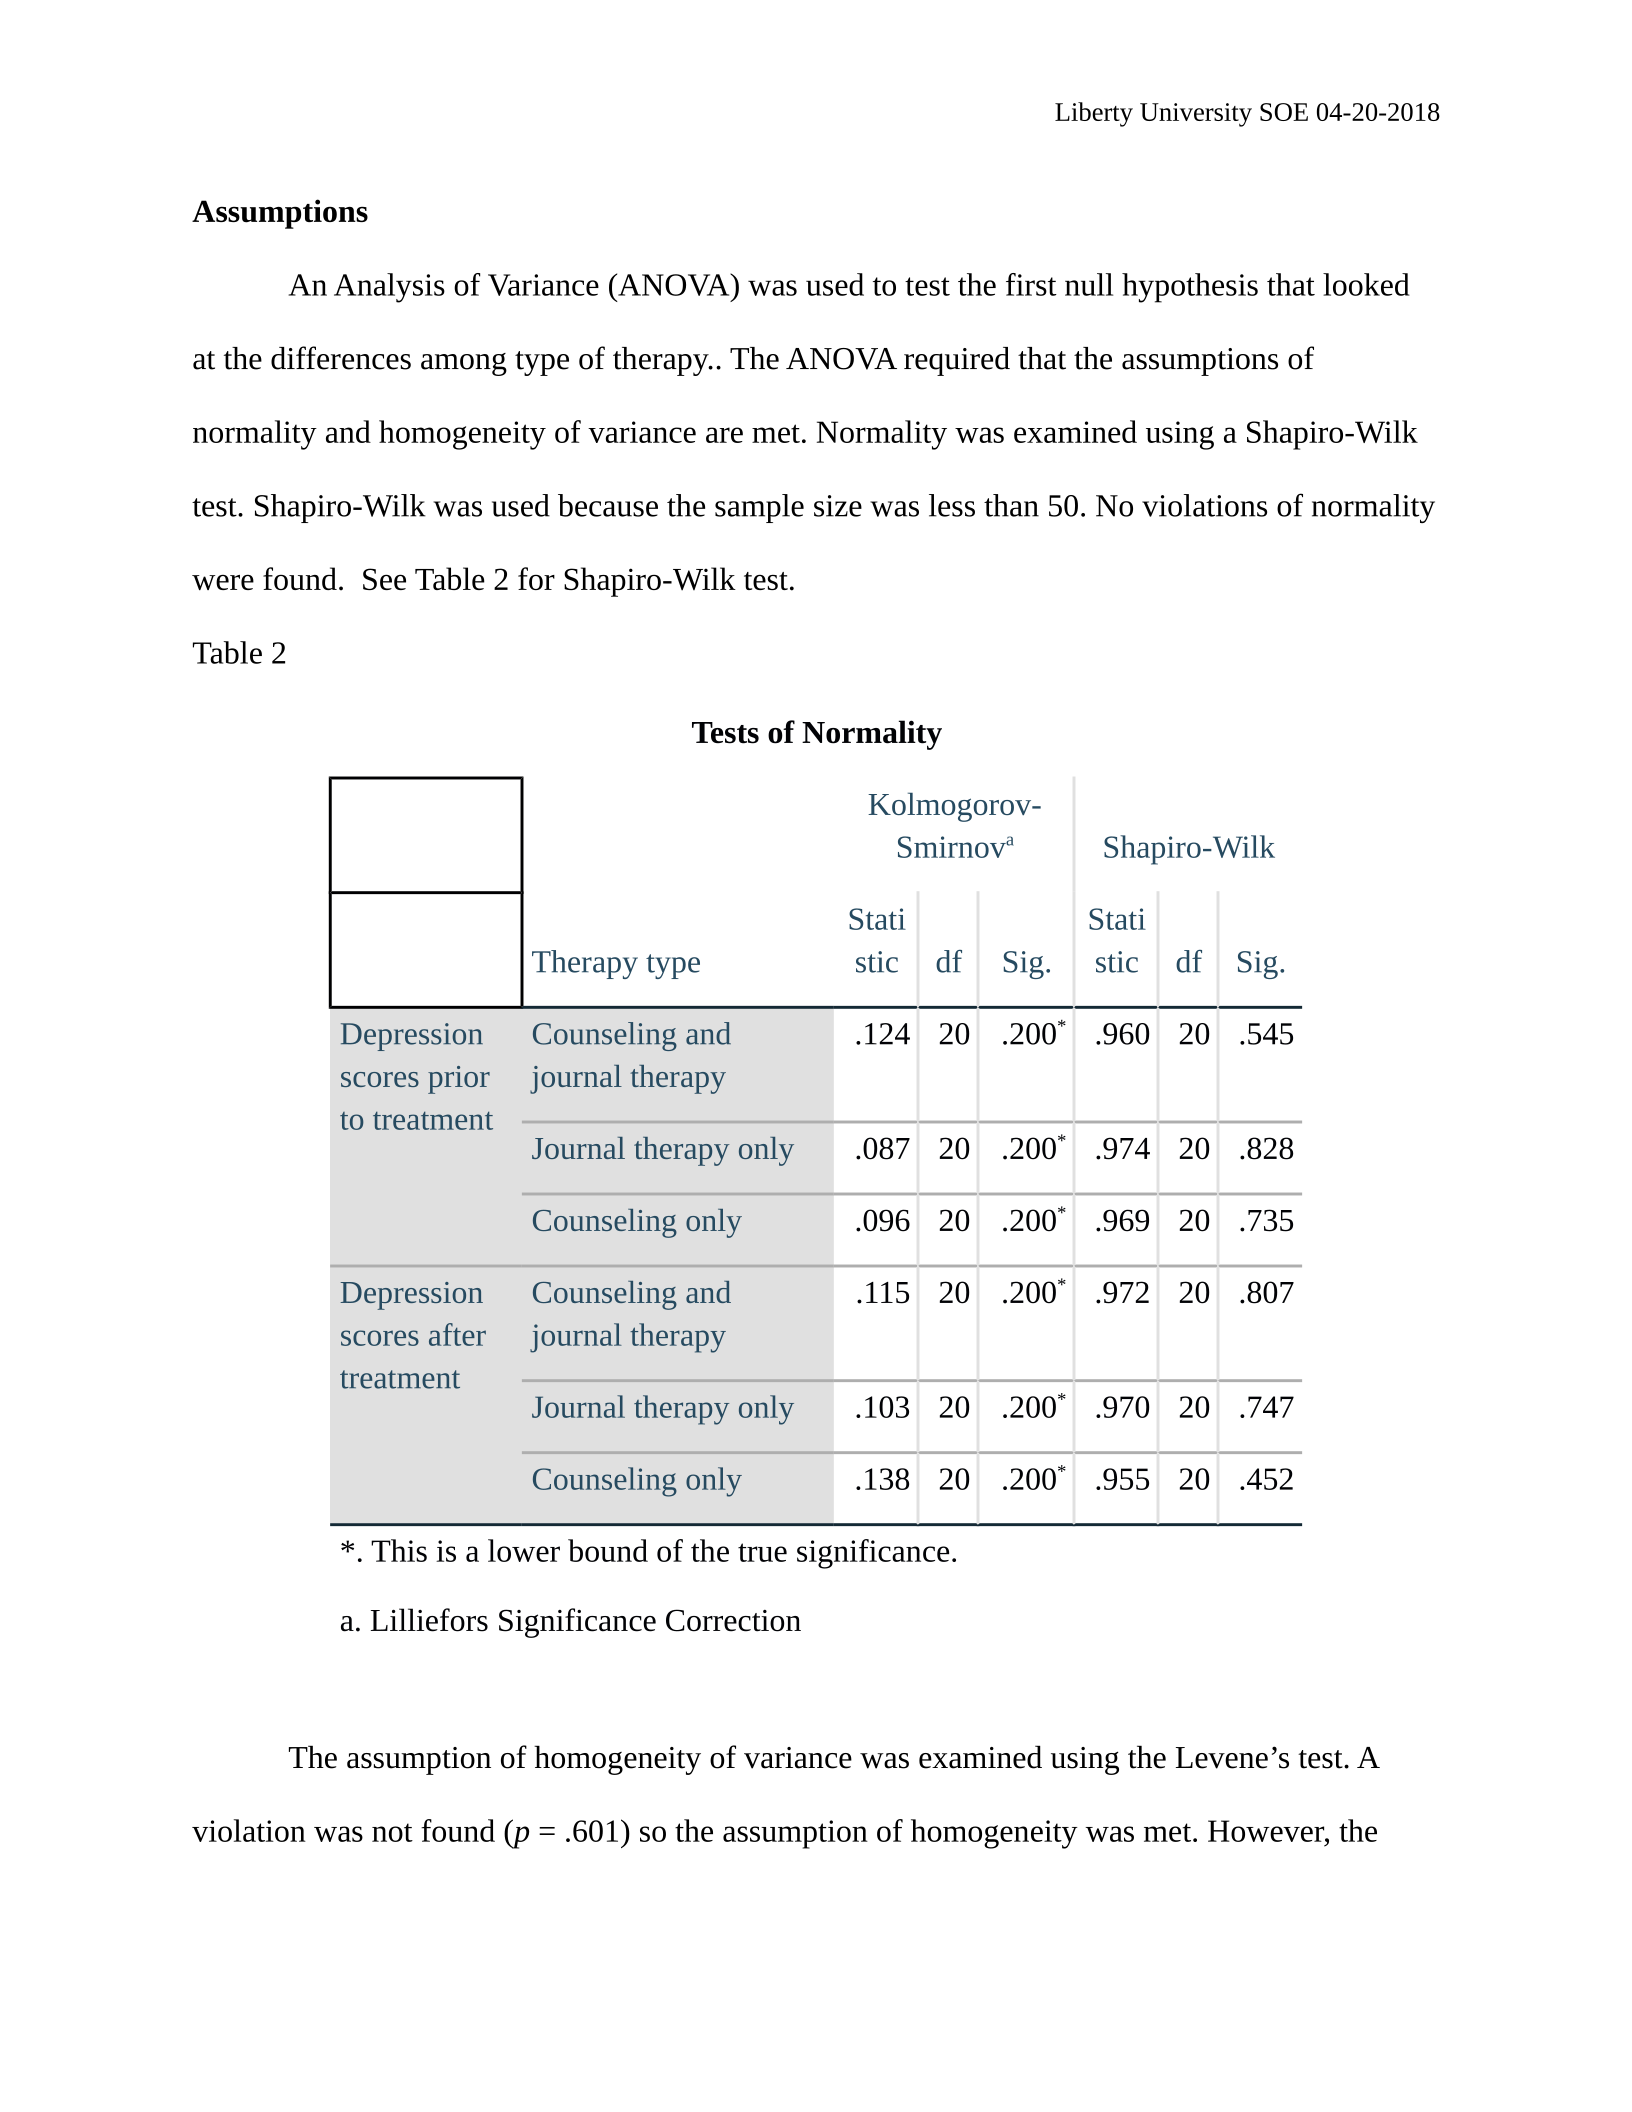
test. Shapiro-Wilk was used because the sample size was less than 50. No violations of normality
were found. See Table 2 for Shapiro-Wilk test.
Table 2
Tests of Normality
Therapy type
Kolmogorov-
SmirnovaShapiro-Wilk
Stati
stic df Sig.
Stati
stic df Sig.
Depression
scores prior
to treatment
Counseling and
journal therapy
.124 20 .200*.960 20 .545
Journal therapy only .087 20 .200*.974 20 .828
Counseling only .096 20 .200*.969 20 .735
Depression
scores after
treatment
Counseling and
journal therapy
.115 20 .200*.972 20 .807
Journal therapy only .103 20 .200*.970 20 .747
Counseling only .138 20 .200*.955 20 .452
*. This is a lower bound of the true significance.
a. Lilliefors Significance Correction
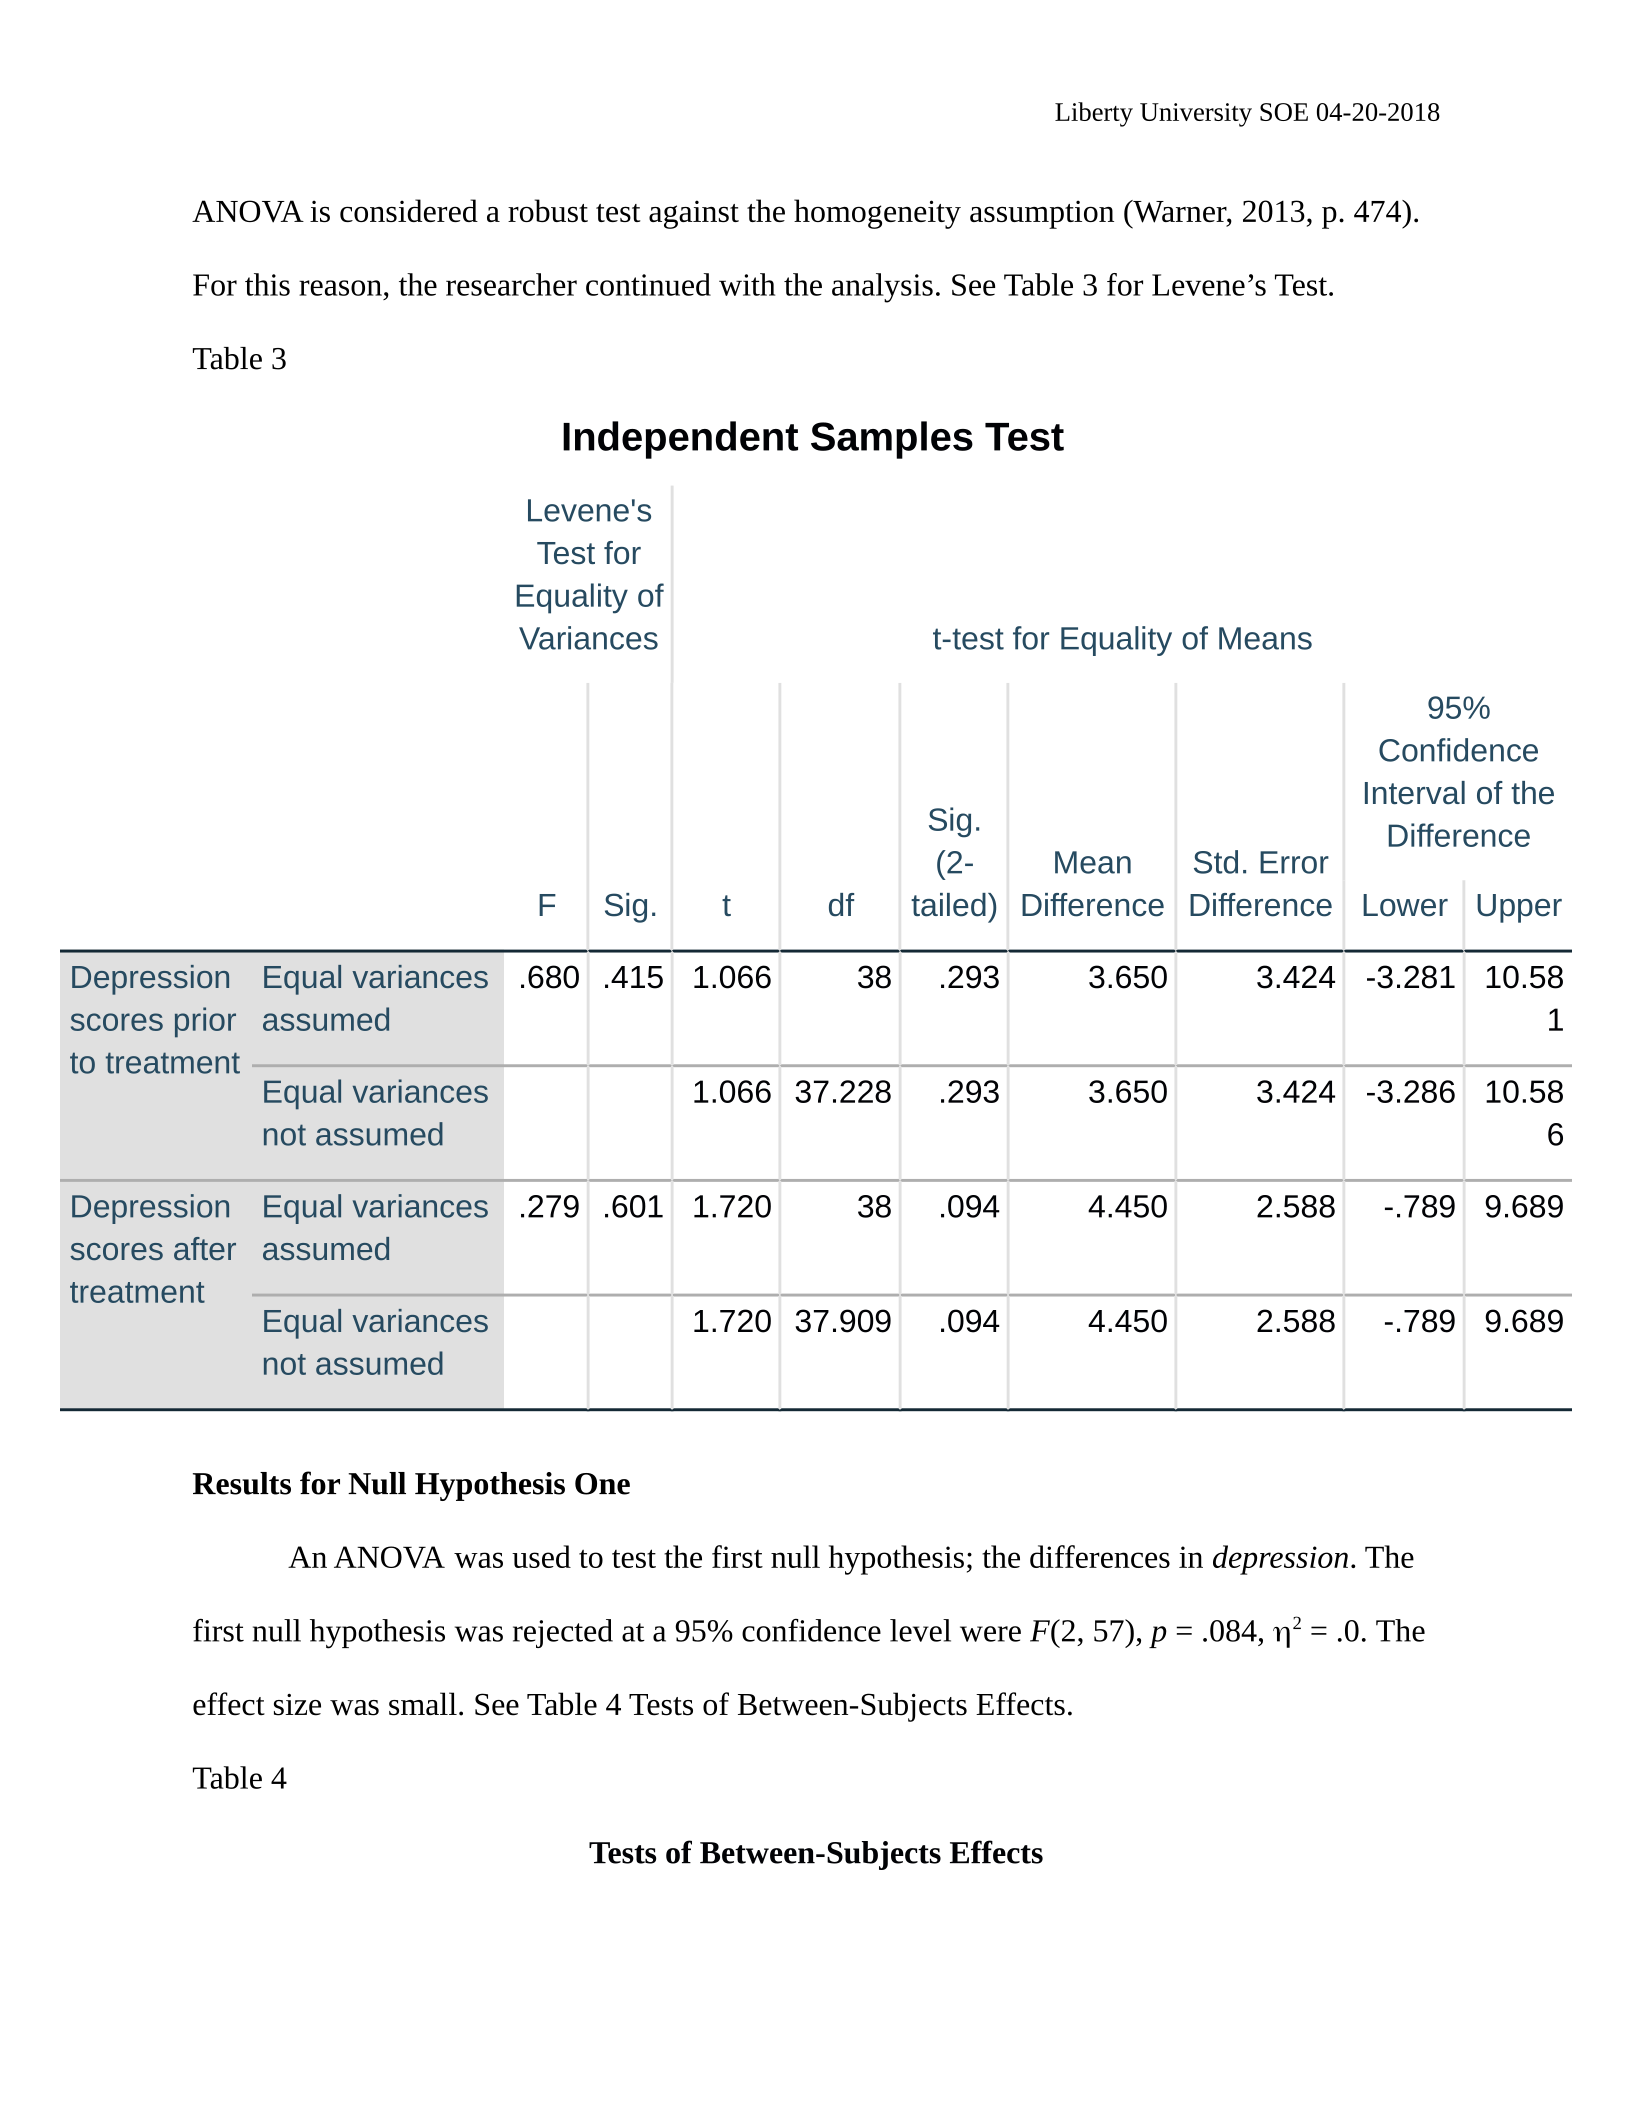
The assumption of homogeneity of variance was examined using the Levene’s test. A
violation was not found (p = .601) so the assumption of homogeneity was met. However, the
Liberty University SOE 04-20-2018
ANOVA is considered a robust test against the homogeneity assumption (Warner, 2013, p. 474).
For this reason, the researcher continued with the analysis. See Table 3 for Levene’s Test.
Table 3
Independent Samples Test
Levene's
Test for
Equality of
Variances t-test for Equality of Means
F Sig. t df
Sig.
(2-
tailed)
Mean
Difference
Std. Error
Difference
95%
Confidence
Interval of the
Difference
Lower Upper
Depression
scores prior
to treatment
Equal variances
assumed
.680 .415 1.066 38 .293 3.650 3.424 -3.281 10.58
1
Equal variances
not assumed
1.066 37.228 .293 3.650 3.424 -3.286 10.58
6
Depression
scores after
treatment
Equal variances
assumed
.279 .601 1.720 38 .094 4.450 2.588 -.789 9.689
Equal variances
not assumed
1.720 37.909 .094 4.450 2.588 -.789 9.689
Results for Null Hypothesis One
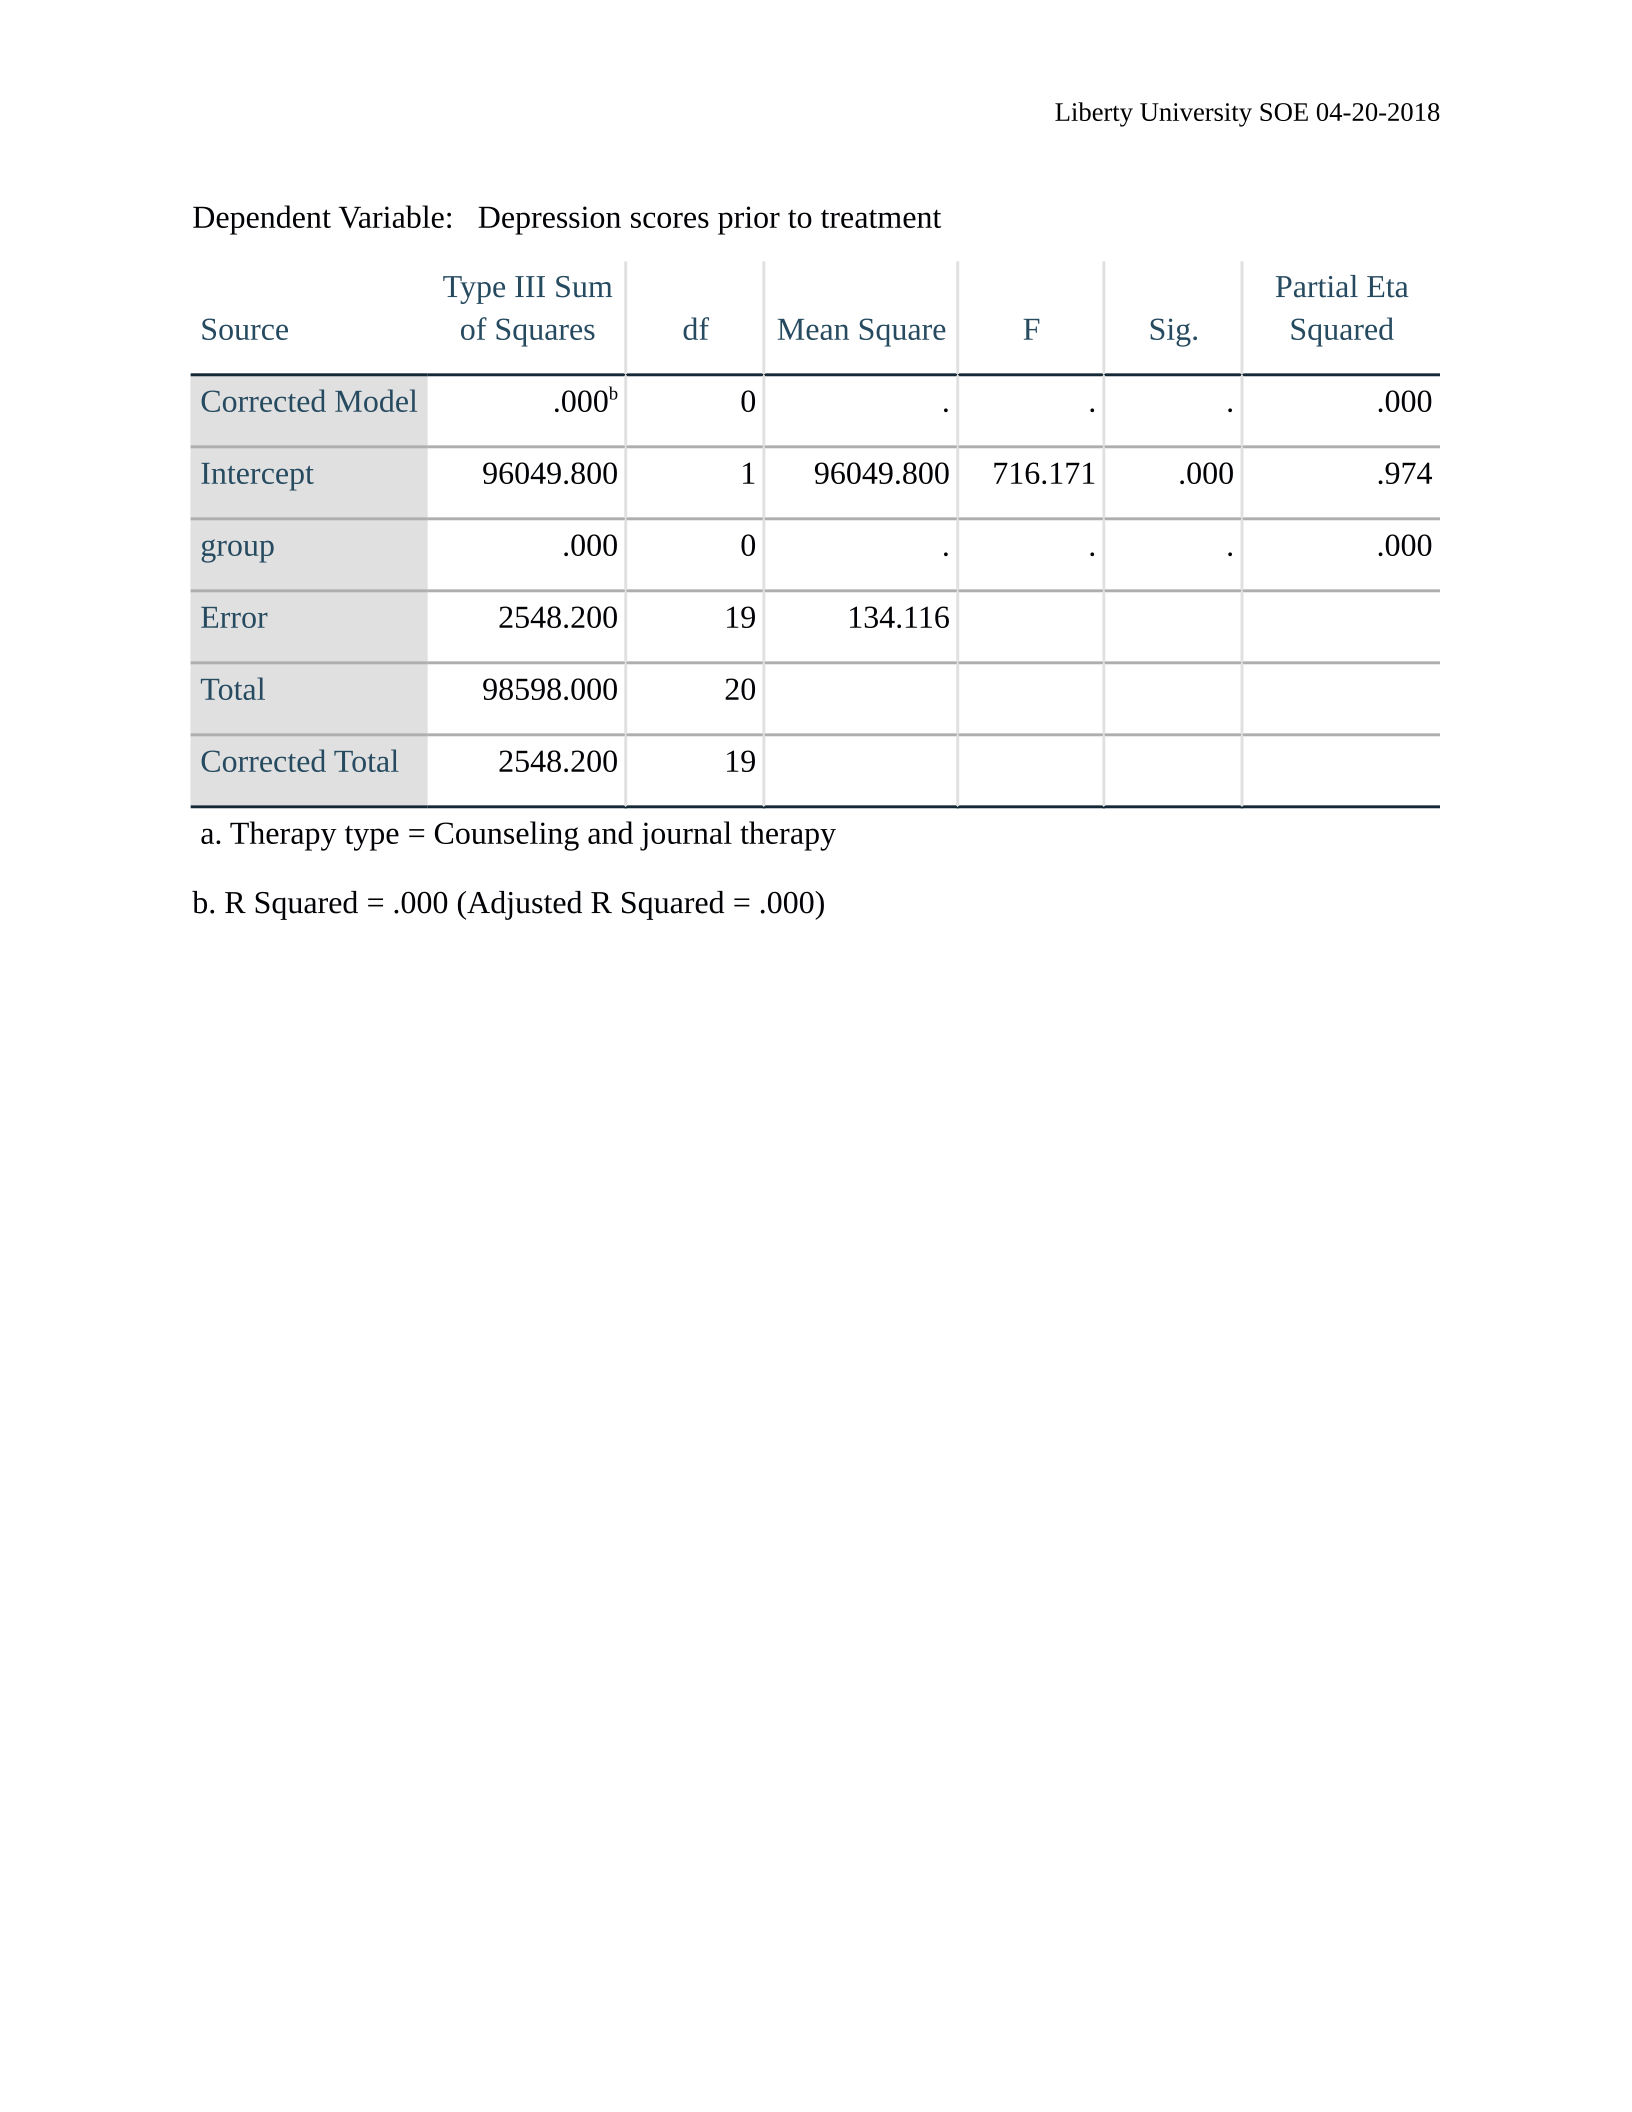
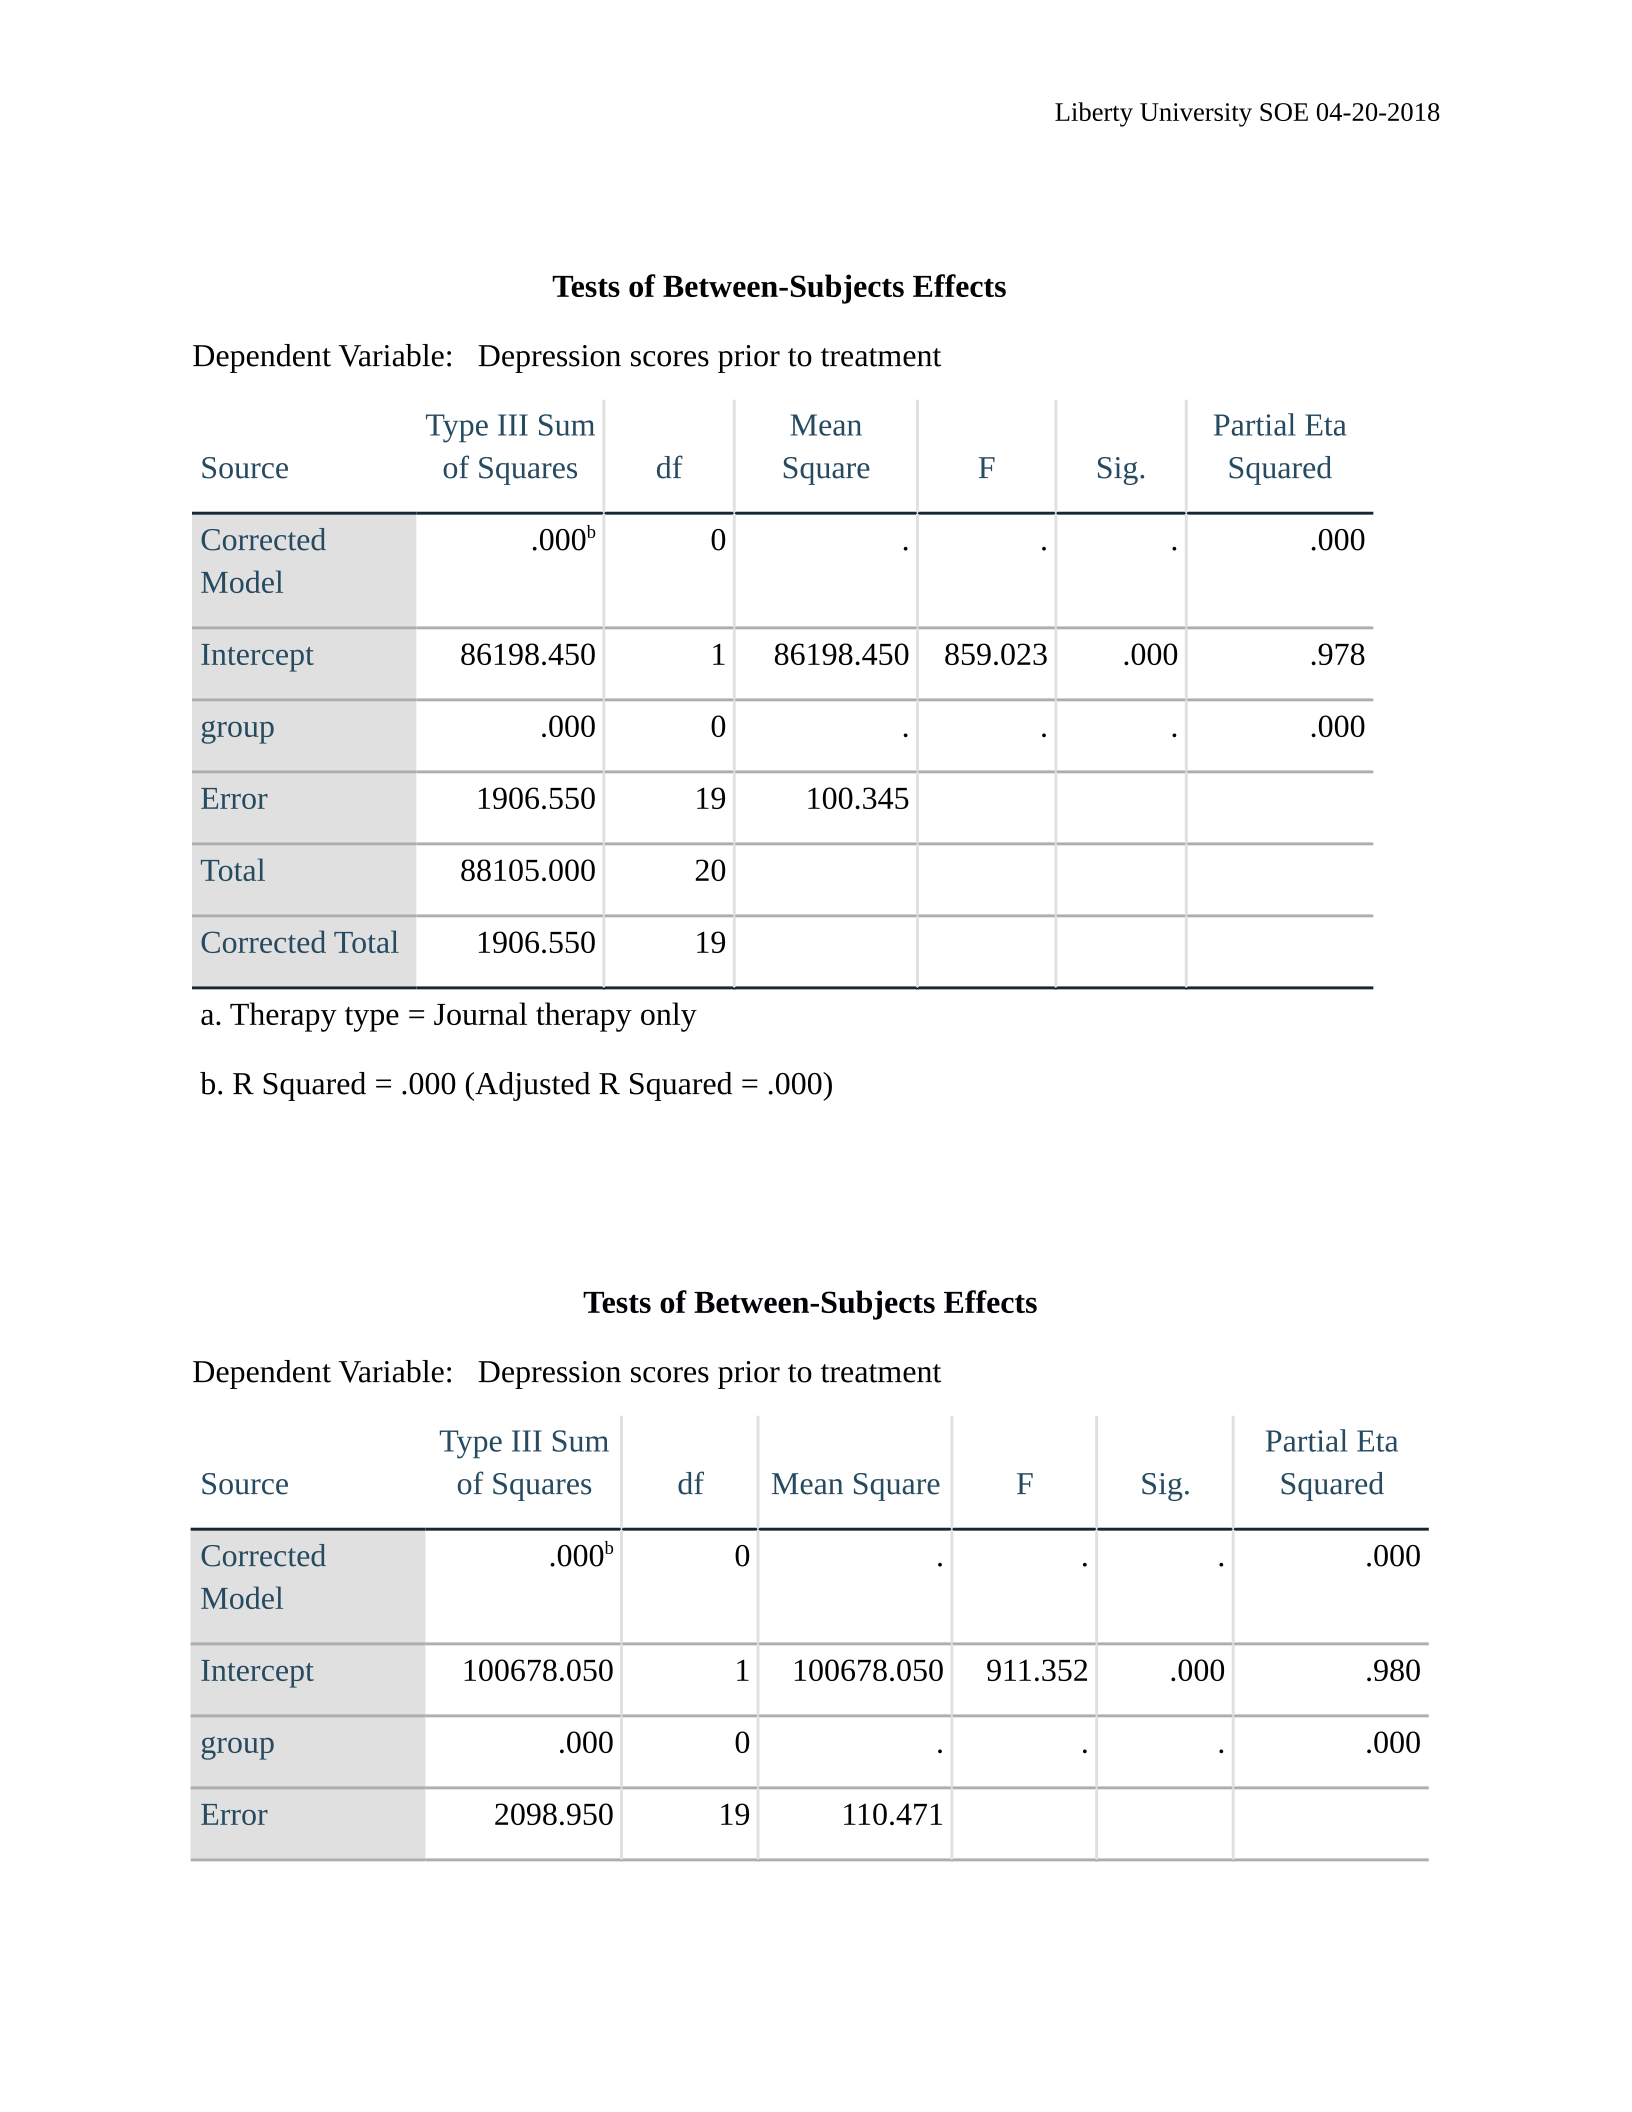
An ANOVA was used to test the first null hypothesis; the differences in depression. The
first null hypothesis was rejected at a 95% confidence level were F(2, 57), p = .084, 2 = .0. The
effect size was small. See Table 4 Tests of Between-Subjects Effects.
Table 4
Tests of Between-Subjects Effects
Liberty University SOE 04-20-2018
Dependent Variable: Depression scores prior to treatment
Source
Type III Sum
of Squares df Mean Square F Sig.
Partial Eta
Squared
Corrected Model .000b0 . . . .000
Intercept 96049.800 1 96049.800 716.171 .000 .974
group .000 0 . . . .000
Error 2548.200 19 134.116
Total 98598.000 20
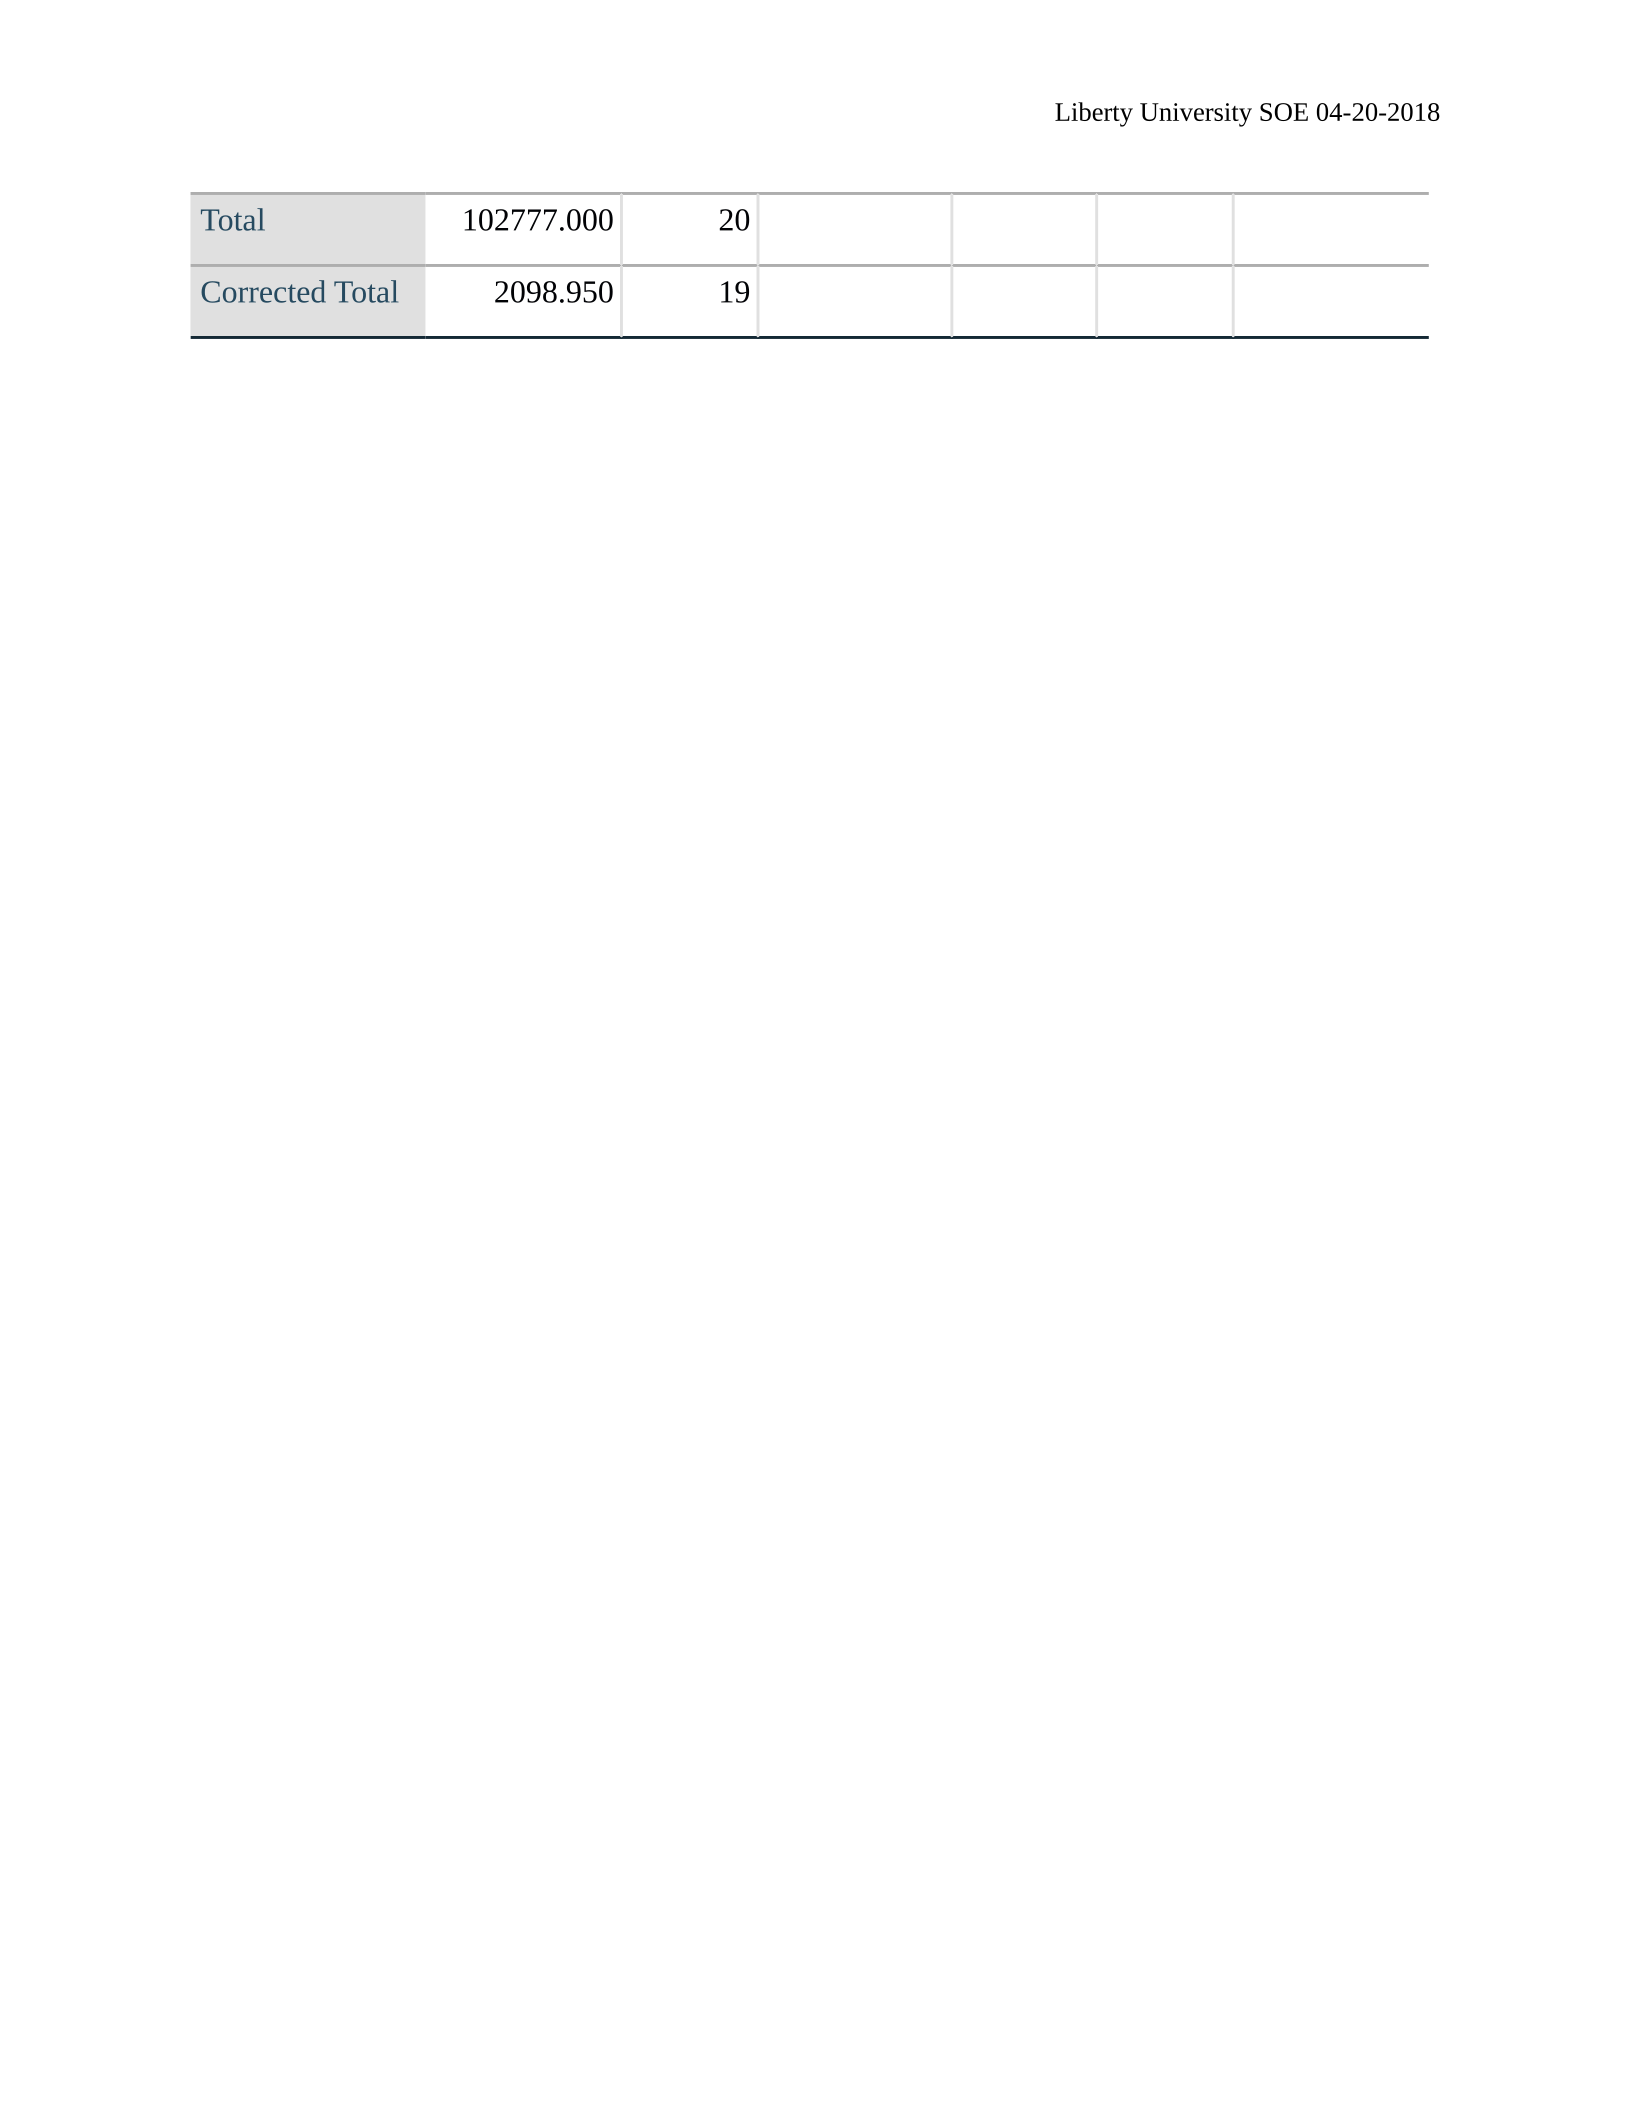
Corrected Total 2548.200 19
a. Therapy type = Counseling and journal therapy
b. R Squared = .000 (Adjusted R Squared = .000)
Liberty University SOE 04-20-2018
Tests of Between-Subjects Effects
Dependent Variable: Depression scores prior to treatment
Source
Type III Sum
of Squares df
Mean
Square F Sig.
Partial Eta
Squared
Corrected
Model
.000b0 . . . .000
Intercept 86198.450 1 86198.450 859.023 .000 .978
group .000 0 . . . .000
Error 1906.550 19 100.345
Total 88105.000 20
Corrected Total 1906.550 19
a. Therapy type = Journal therapy only
b. R Squared = .000 (Adjusted R Squared = .000)
Tests of Between-Subjects Effects
Dependent Variable: Depression scores prior to treatment
Source
Type III Sum
of Squares df Mean Square F Sig.
Partial Eta
Squared
Corrected
Model
.000b0 . . . .000
Intercept 100678.050 1 100678.050 911.352 .000 .980
group .000 0 . . . .000
Error 2098.950 19 110.471