


Running heading: GROUP 3 ANOVA
GROUP # 3 WRITE-UP: 2 ANOVA
by
Shontell Stanford
Liberty University
Partial Fulfillment
Of the Requirements for EDUC 812
Liberty University
2019
GROUP 3 ANOVA 2
FINDINGS
Research Question
The research question for this study was:
RQ1: Is there a difference in extrovertedness among blonds, brunets, and redheads?
Null Hypothesis
The null hypothesis for this study was:
H01: There is no difference among blonds, brunets and redheads in respect to their
extrovertedness.
Descriptive Statistics
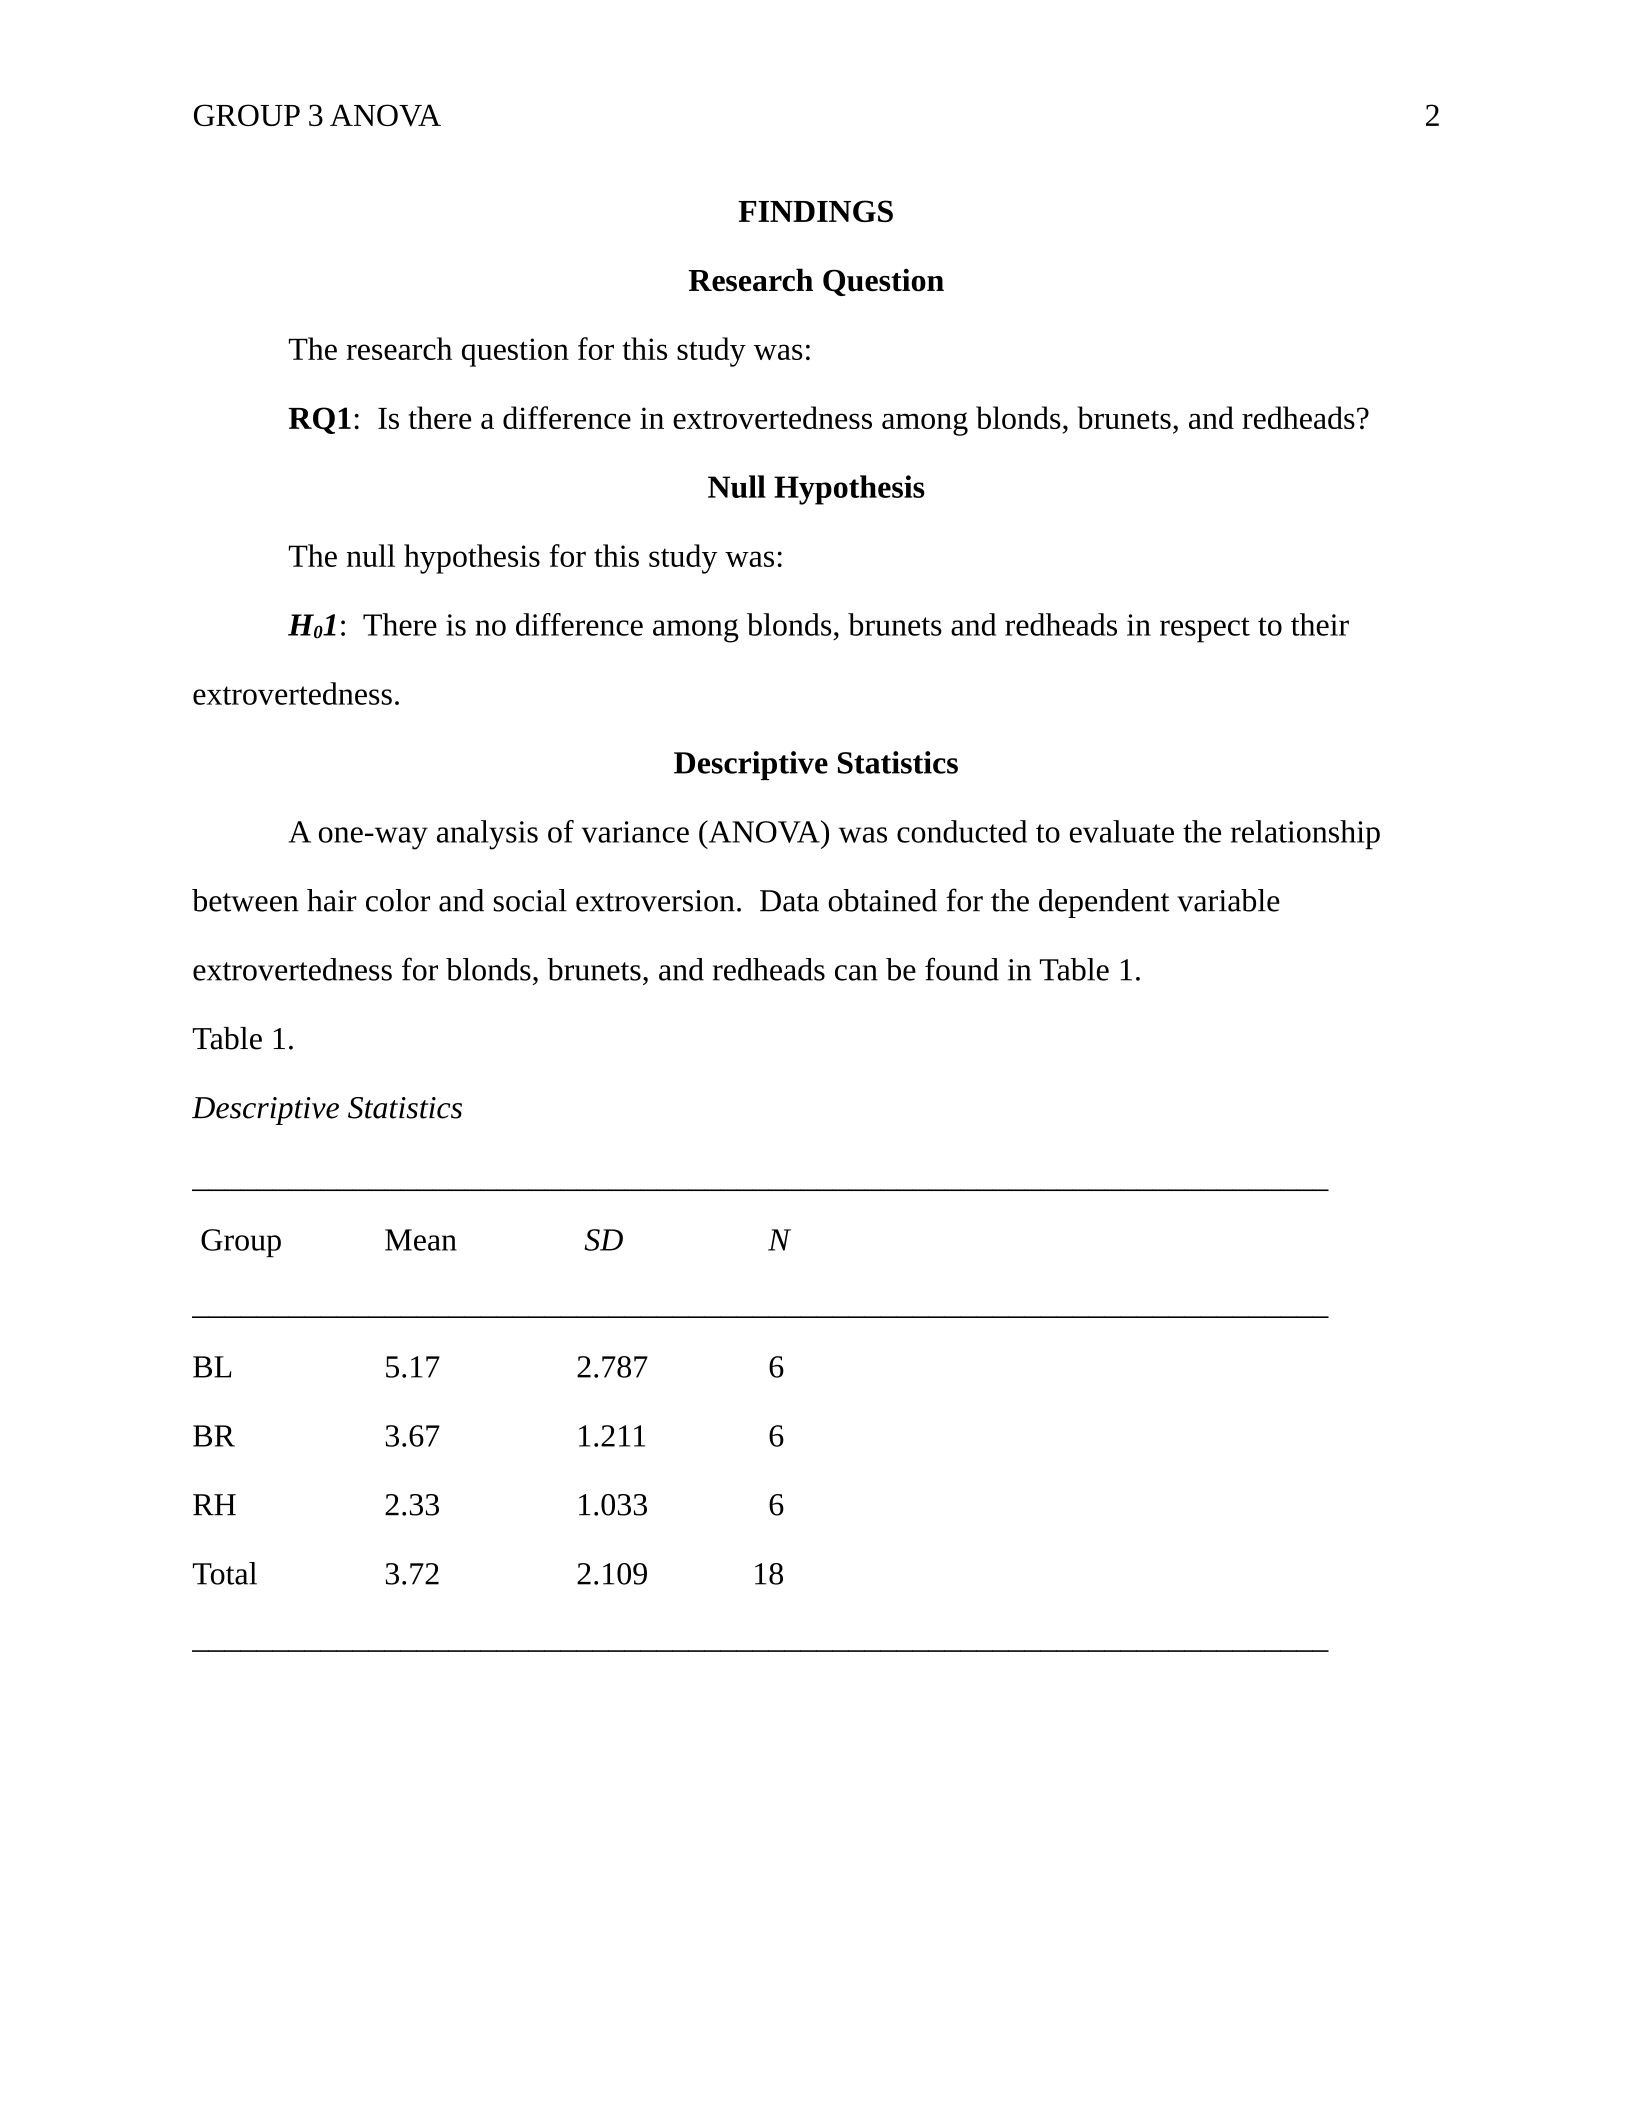
A one-way analysis of variance (ANOVA) was conducted to evaluate the relationship
between hair color and social extroversion. Data obtained for the dependent variable
extrovertedness for blonds, brunets, and redheads can be found in Table 1.
Table 1.
Descriptive Statistics
_______________________________________________________________________
Group Mean SD N
_______________________________________________________________________
BL 5.17 2.787 6
BR 3.67 1.211 6
RH 2.33 1.033 6
Total 3.72 2.109 18
_______________________________________________________________________
GROUP 3 ANOVA 3
Results
Data screening
Data screening was conducted on each group’s dependent variable, extrovertedness for
blond, brunet, and redhead, regarding inconsistencies and outliers. The researcher sorted the data
on each variable and scanned for inconsistencies. No data errors or inconsistencies were
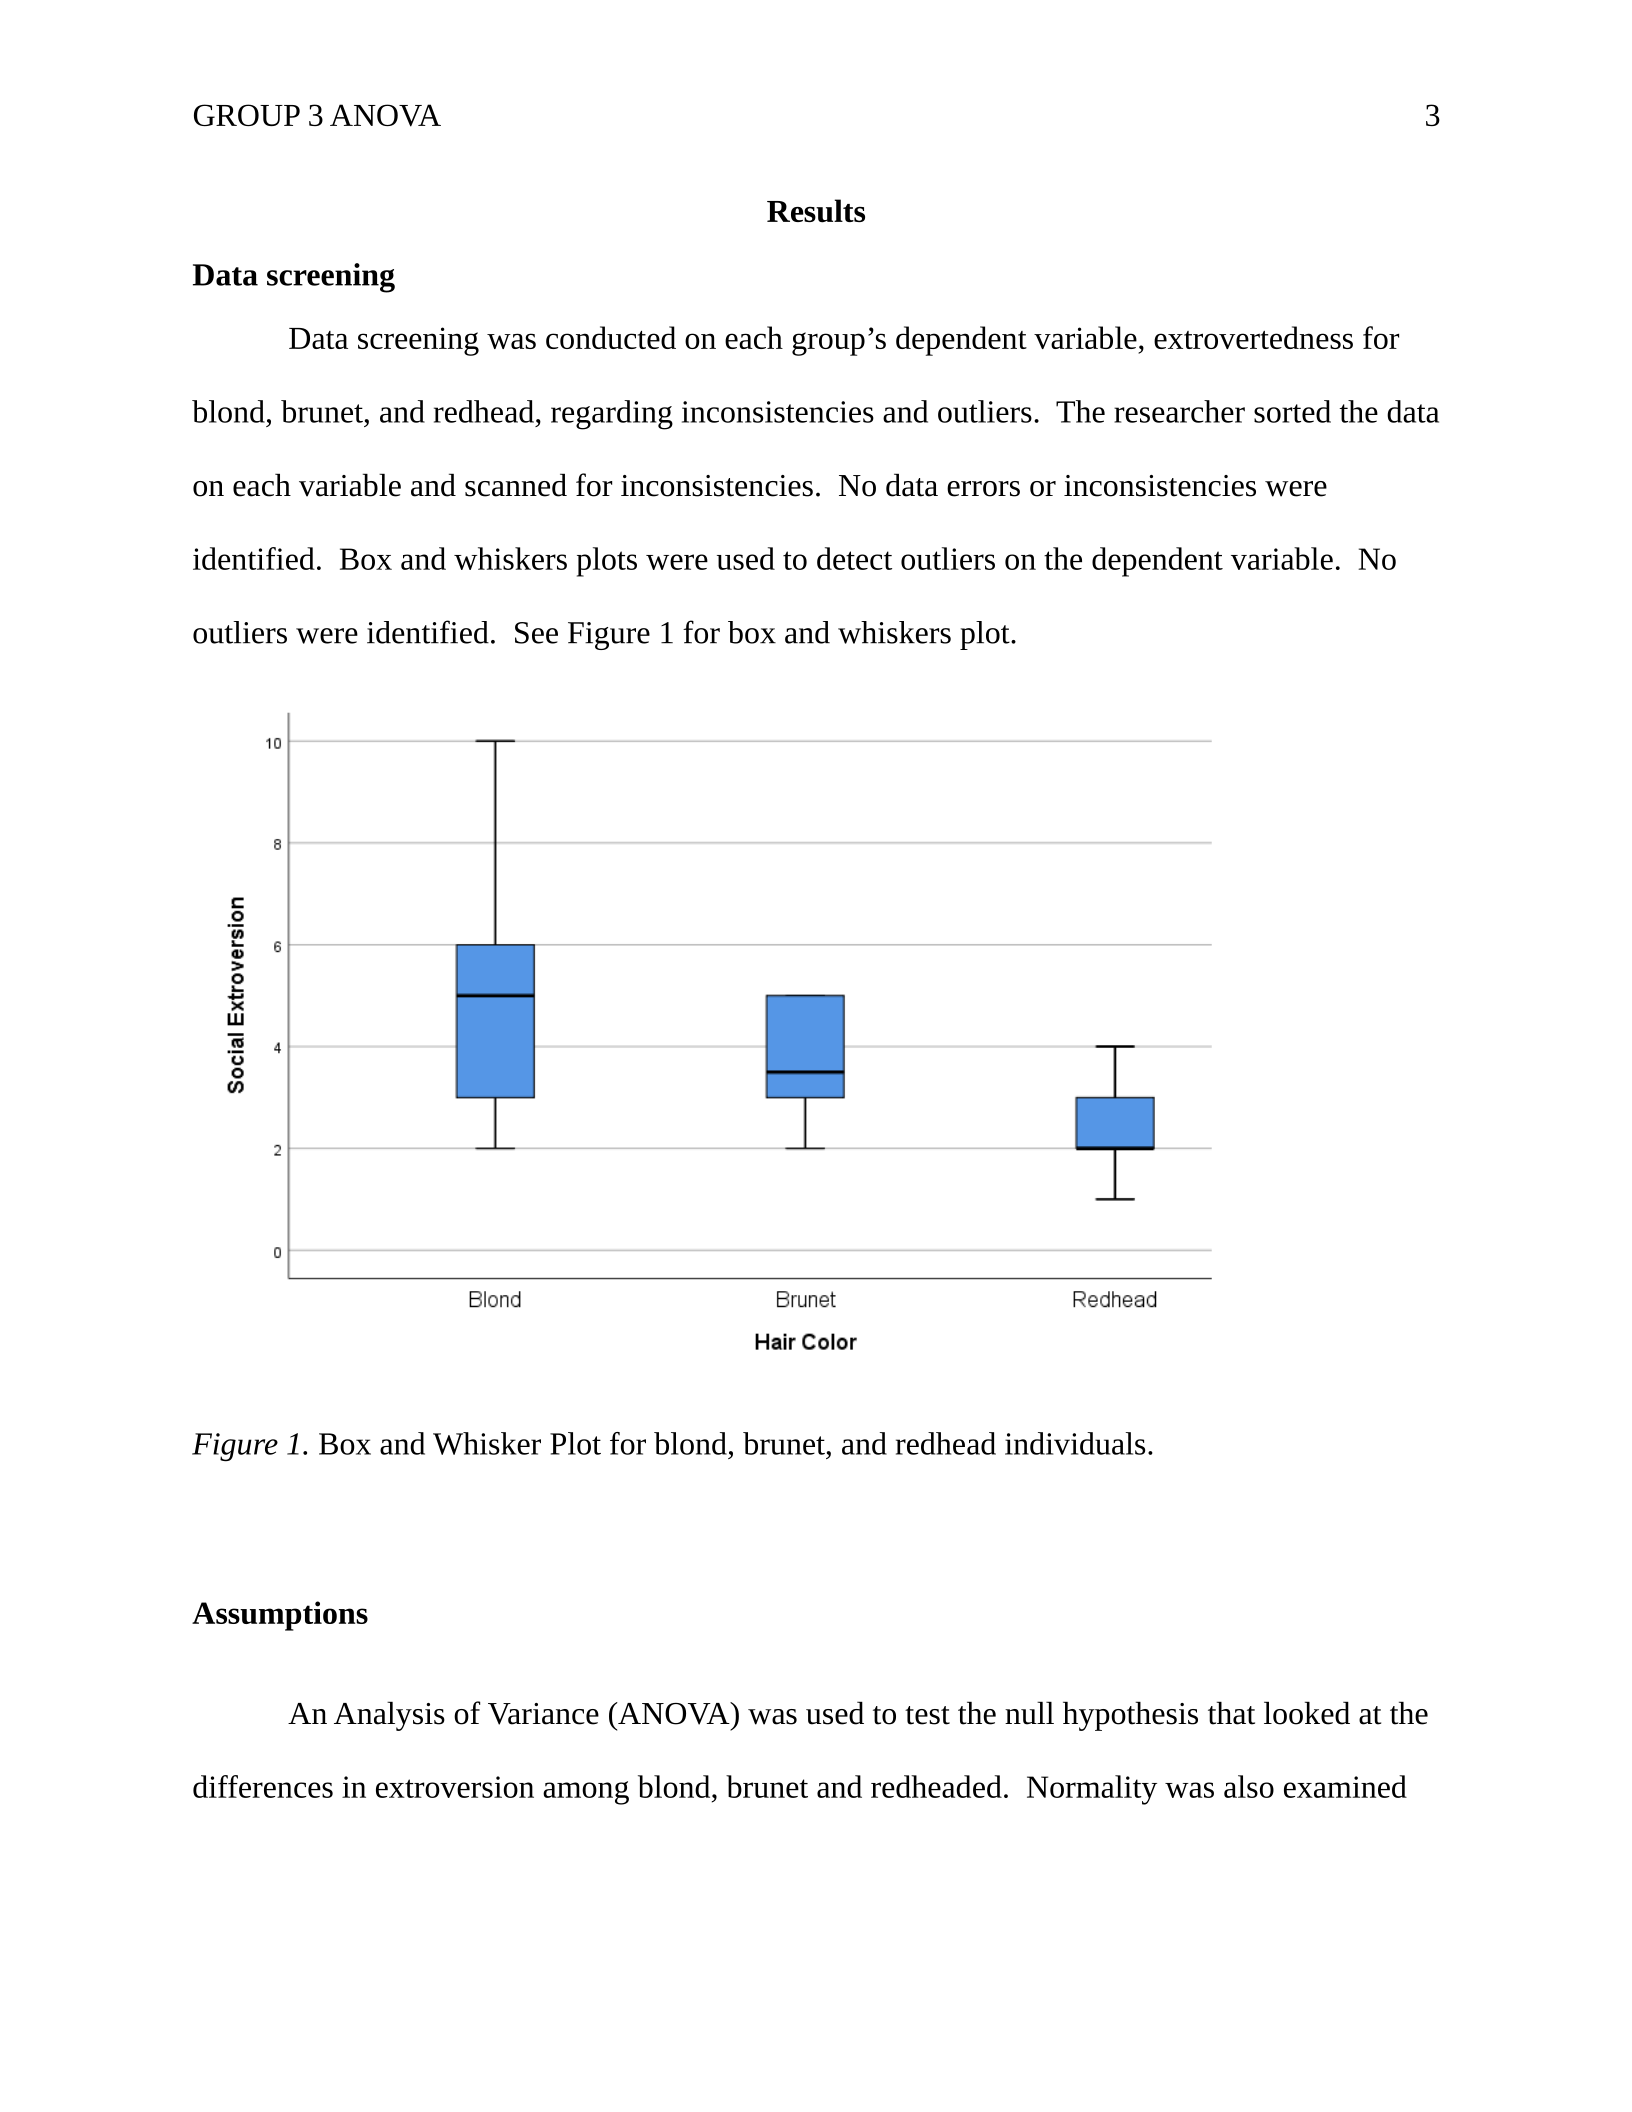
identified. Box and whiskers plots were used to detect outliers on the dependent variable. No
outliers were identified. See Figure 1 for box and whiskers plot.
Tests of Normality
Group Kolmogorov-SmirnovaShapiro-Wilk
Statistic df Sig. Statistic df Sig.
Score
TL .179 10 .200*.883 10 .140
AL .224 9 .200*.921 9 .399
SL .105 11 .200*.958 11 .751
*. This is a lower bound of the true significance.
a. Lilliefors Significance Correction
Figure 1. Box and Whisker Plot for blond, brunet, and redhead individuals.
Assumptions
An Analysis of Variance (ANOVA) was used to test the null hypothesis that looked at the
differences in extroversion among blond, brunet and redheaded. Normality was also examined
GROUP 3 ANOVA 4
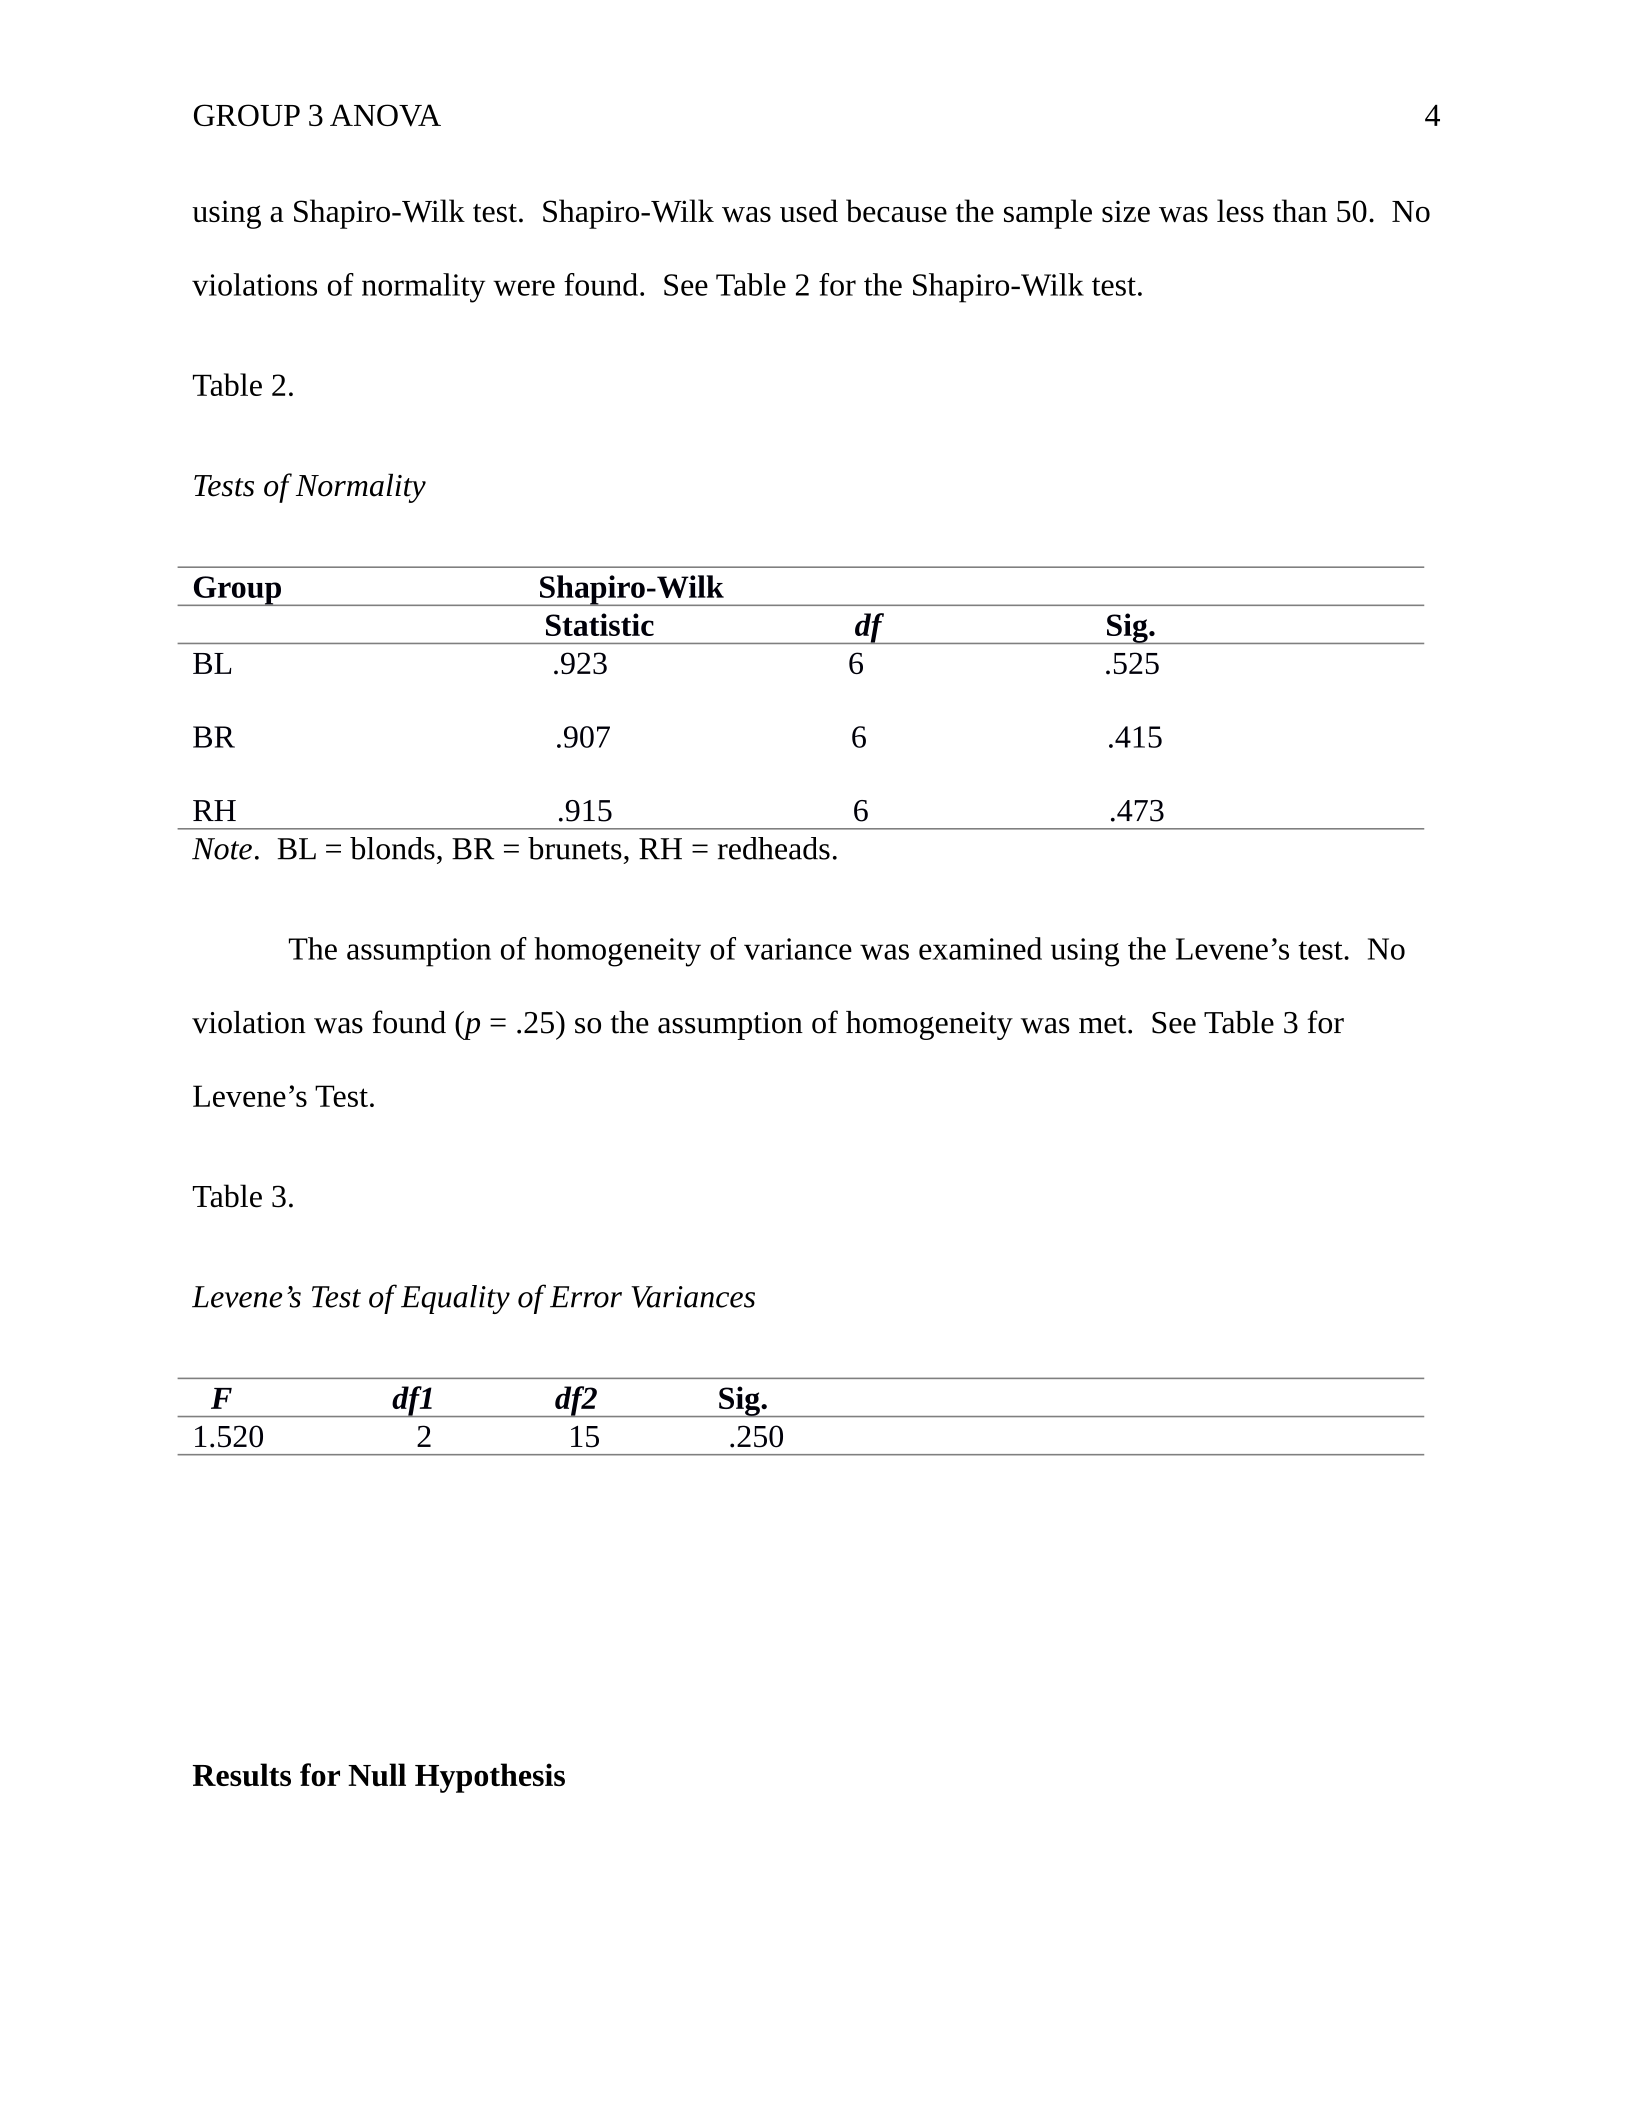
using a Shapiro-Wilk test. Shapiro-Wilk was used because the sample size was less than 50. No
violations of normality were found. See Table 2 for the Shapiro-Wilk test.
Table 2.
Tests of Normality
Group Shapiro-Wilk
Statistic df Sig.
BL .923 6 .525
BR .907 6 .415
RH .915 6 .473
Note. BL = blonds, BR = brunets, RH = redheads.
The assumption of homogeneity of variance was examined using the Levene’s test. No
violation was found (p = .25) so the assumption of homogeneity was met. See Table 3 for
Levene’s Test.
Table 3.
Levene’s Test of Equality of Error Variances
F df1 df2 Sig.
1.520 2 15 .250
Results for Null Hypothesis
GROUP 3 ANOVA 5
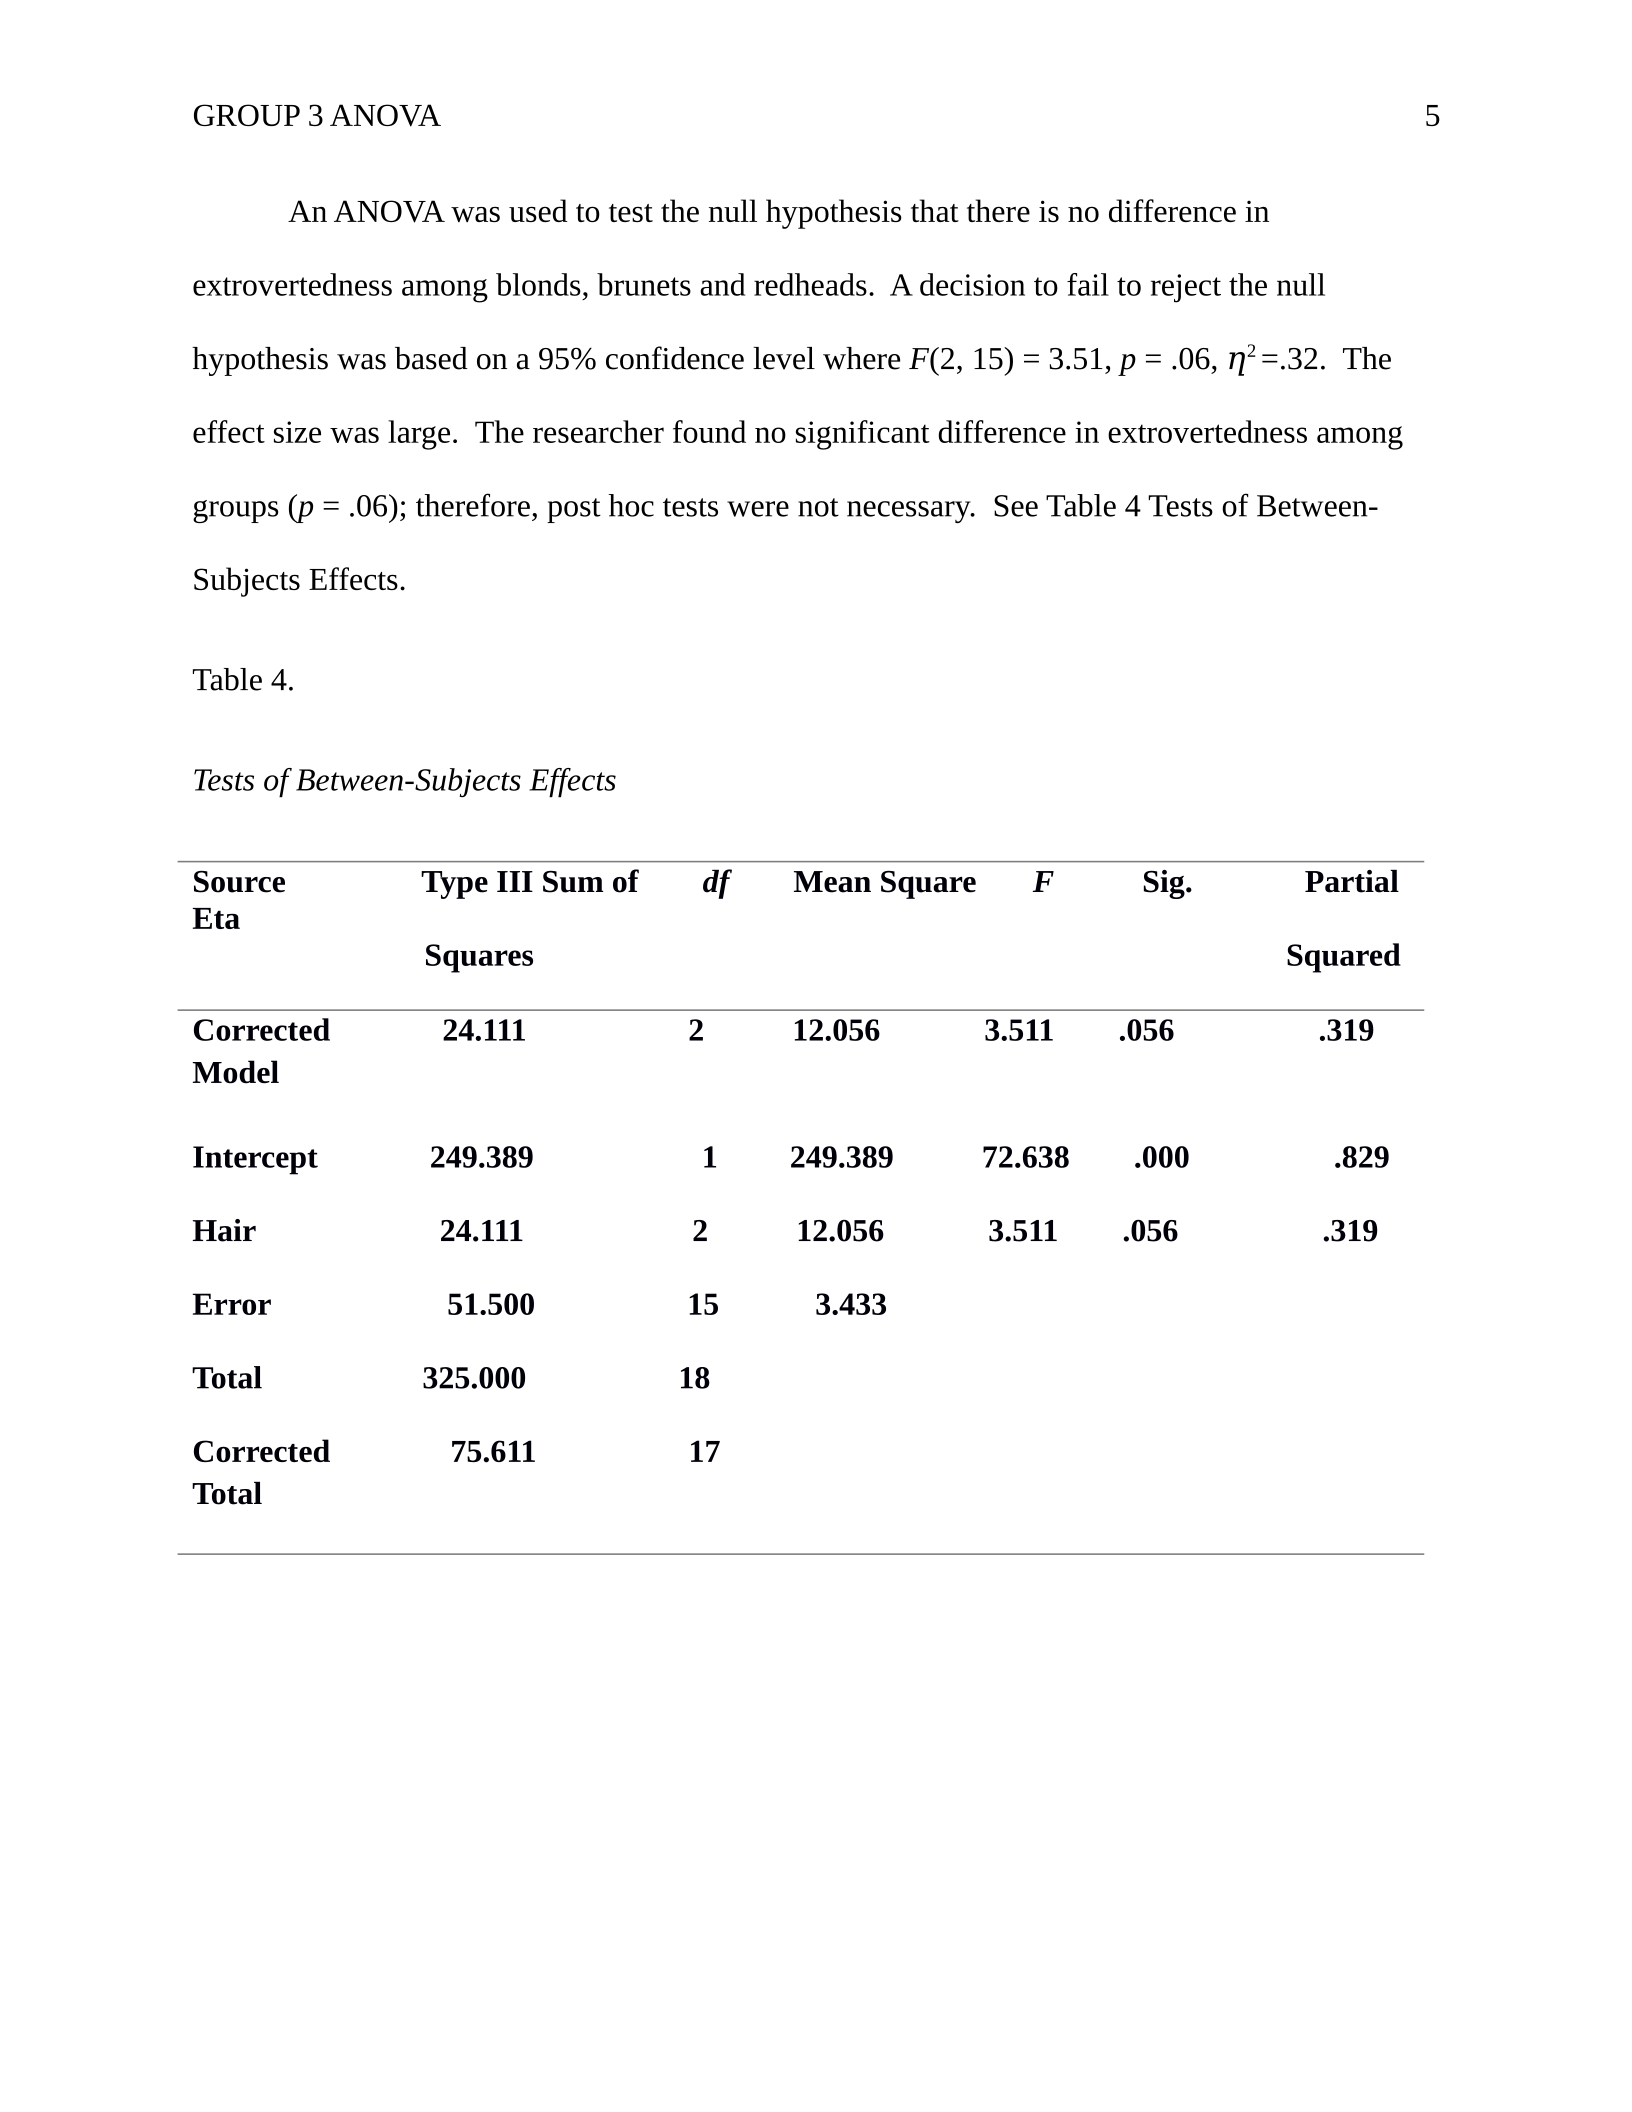
An ANOVA was used to test the null hypothesis that there is no difference in
extrovertedness among blonds, brunets and redheads. A decision to fail to reject the null
hypothesis was based on a 95% confidence level where F(2, 15) = 3.51, p = .06, ƞ2 =.32. The
effect size was large. The researcher found no significant difference in extrovertedness among
groups (p = .06); therefore, post hoc tests were not necessary. See Table 4 Tests of Between-
Subjects Effects.
Table 4.
Tests of Between-Subjects Effects
Source Type III Sum of df Mean Square F Sig. Partial
Eta
Squares Squared
Corrected 24.111 2 12.056 3.511 .056 .319
Model
Intercept 249.389 1 249.389 72.638 .000 .829
Hair 24.111 2 12.056 3.511 .056 .319
Error 51.500 15 3.433
Total 325.000 18
Corrected 75.611 17
Total
Powered by TCPDF (www.tcpdf.org)

