


Final Exam
By
Rebecca Peeler
Liberty University
Partial Fulfillment
Of the Requirements for EDUC 812
Liberty University
2023
Scenario Exam
Joe collected a questionnaire from 28 students in his school on their attitudes toward the local
science fair.
FINDINGS
Research Question
The research question for this study was:
RQ1:
Null Hypothesis
The null hypothesis for this study was:
H01: There is no significant difference among the attitude toward science fairs of
students’ who either won 1st, 2nd, 3rd, or no award at all at the local science fair.
See questionnaire sheet below:
Award Question:
What award did you win? (1 = 1st place, 2 = 2nd place, 3 = 3rd place, 4 = I did not win an award)
Science Fair Attitude Questions (12 possible points):
Item 1: I enjoyed competing in the science fair: 4 = strongly agree, 3 = agree, 2 = disagree, 1 =
strongly disagree
Item 2: The science fair was exciting: 4 = strongly agree, 3 = agree, 2 = disagree, 1 = strongly
disagree
Item 3: The science fair was fun: 4 = strongly agree, 3 = agree, 2 = disagree, 1 = strongly
disagree
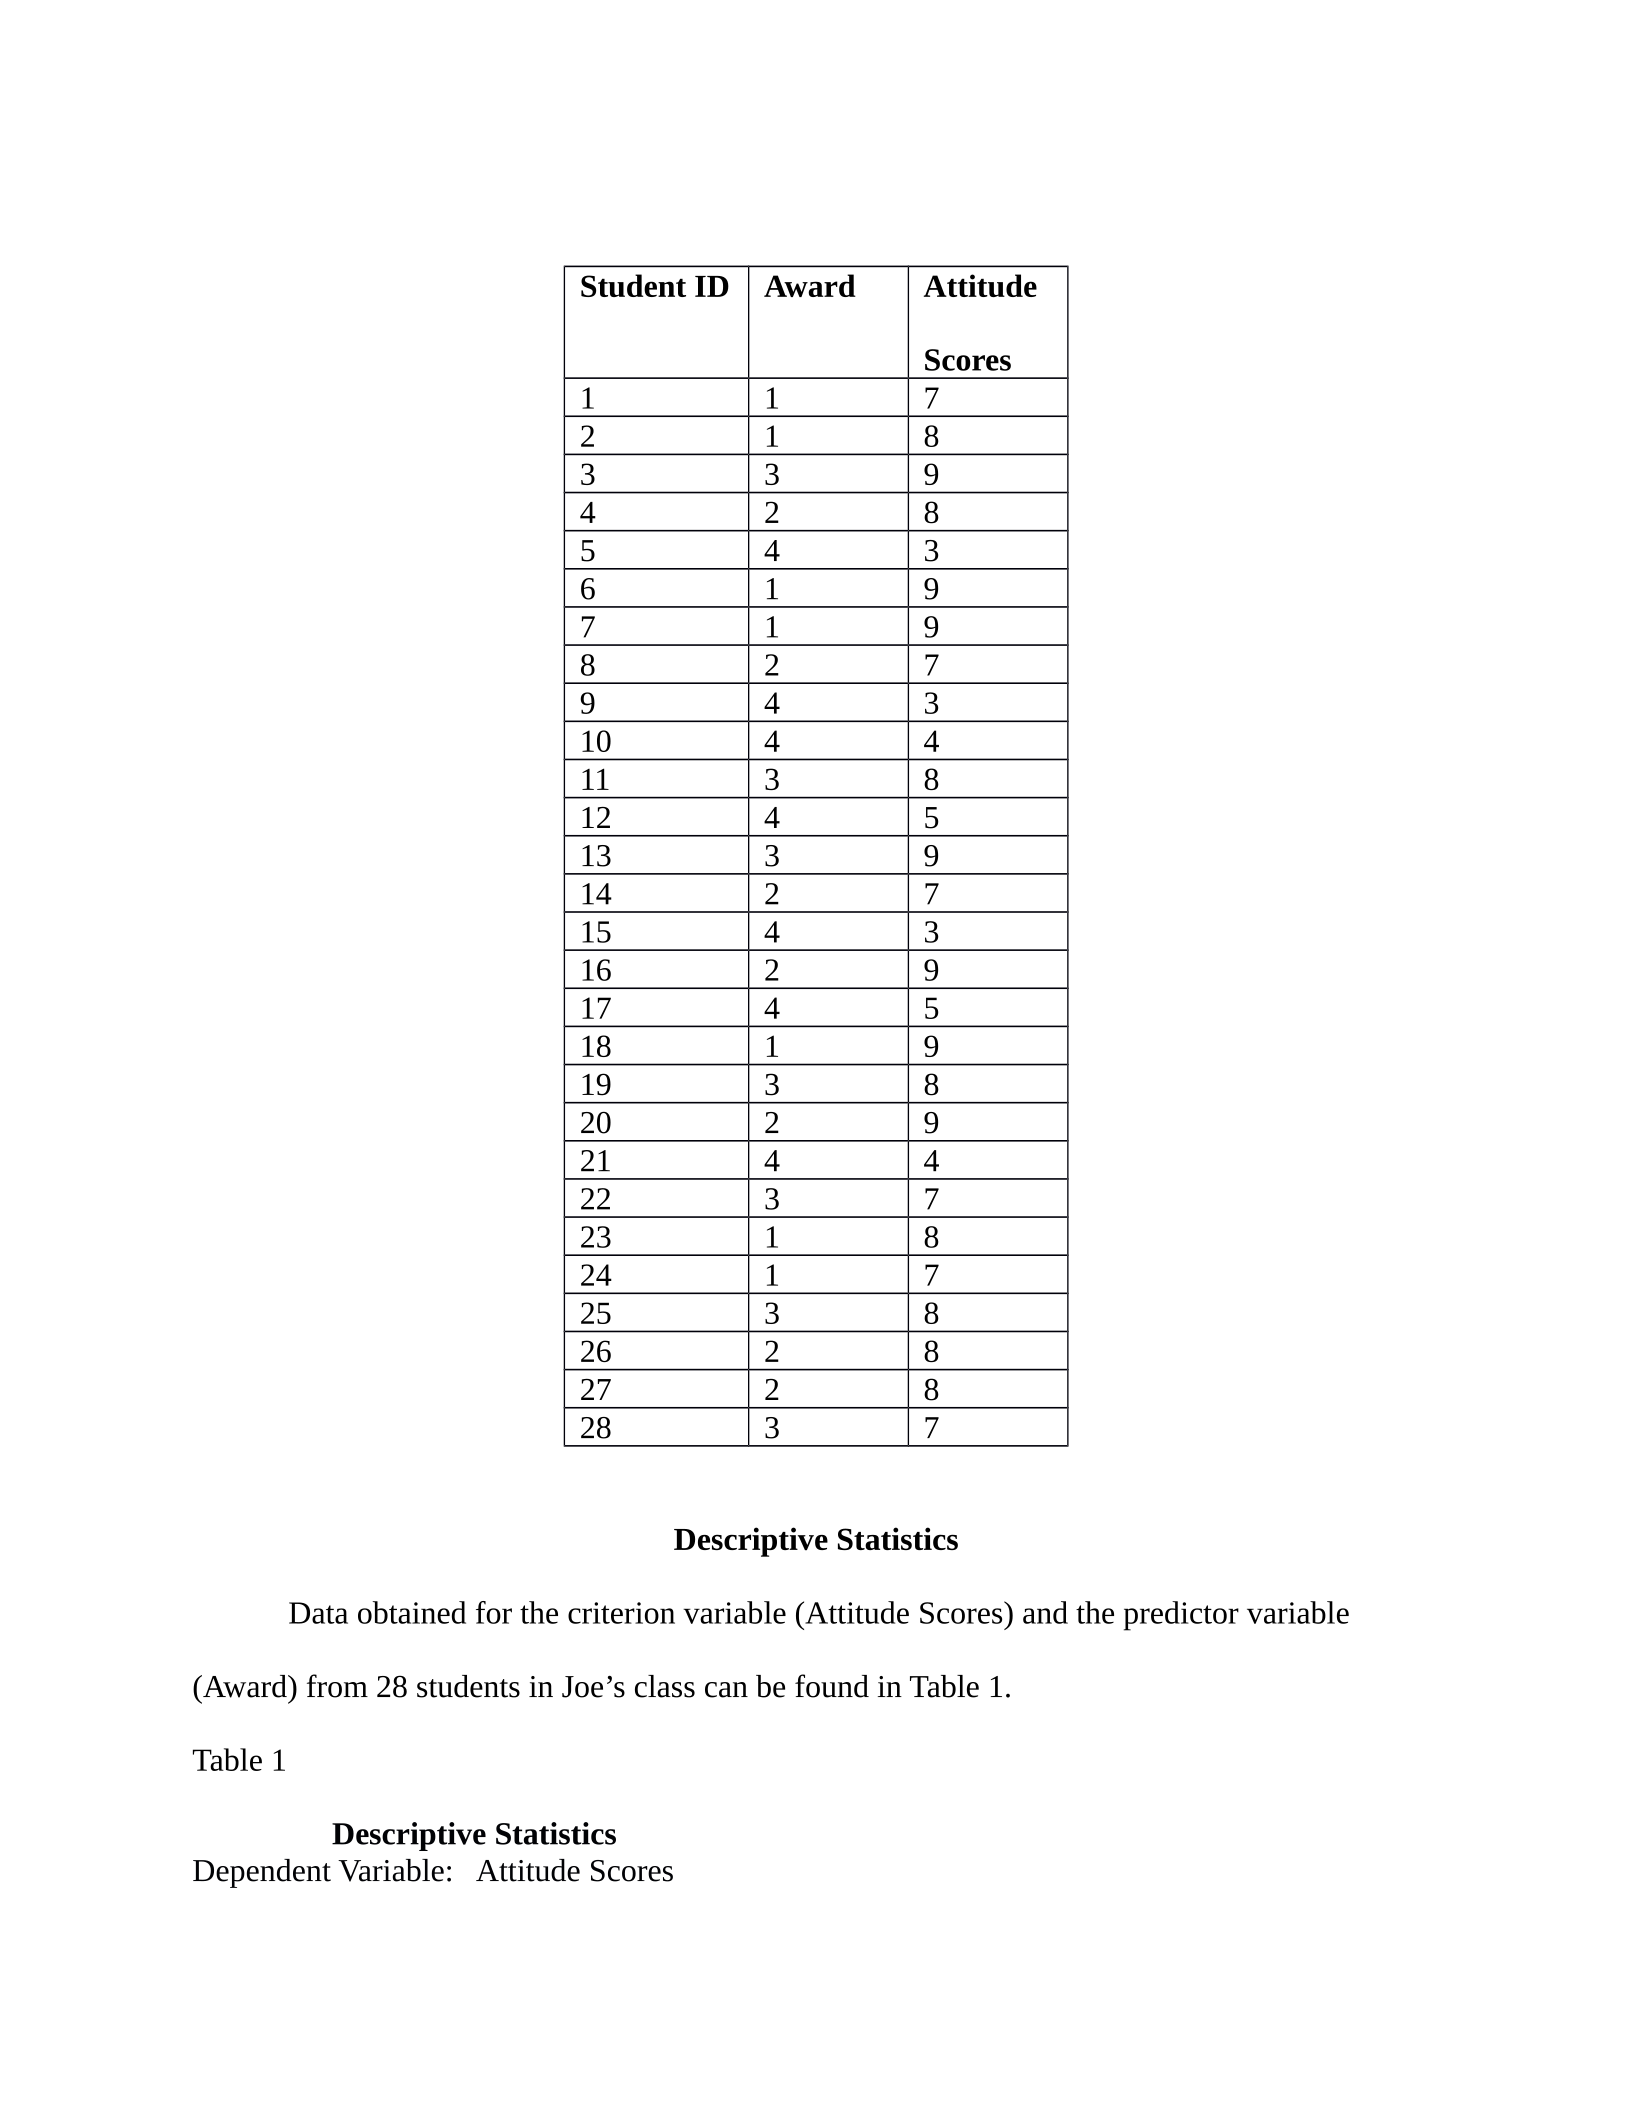
Data Collection Sheet: (Note: See the data collection sheet below. You may cut and paste or
type the data set into SPSS. Remember to leave off the header row when copying into SPSS).
Student ID Award Attitude
Scores
1 1 7
2 1 8
3 3 9
4 2 8
5 4 3
6 1 9
7 1 9
8 2 7
9 4 3
10 4 4
11 3 8
12 4 5
13 3 9
14 2 7
15 4 3
16 2 9
17 4 5
18 1 9
19 3 8
20 2 9
21 4 4
22 3 7
23 1 8
24 1 7
25 3 8
26 2 8
27 2 8
28 3 7
Descriptive Statistics
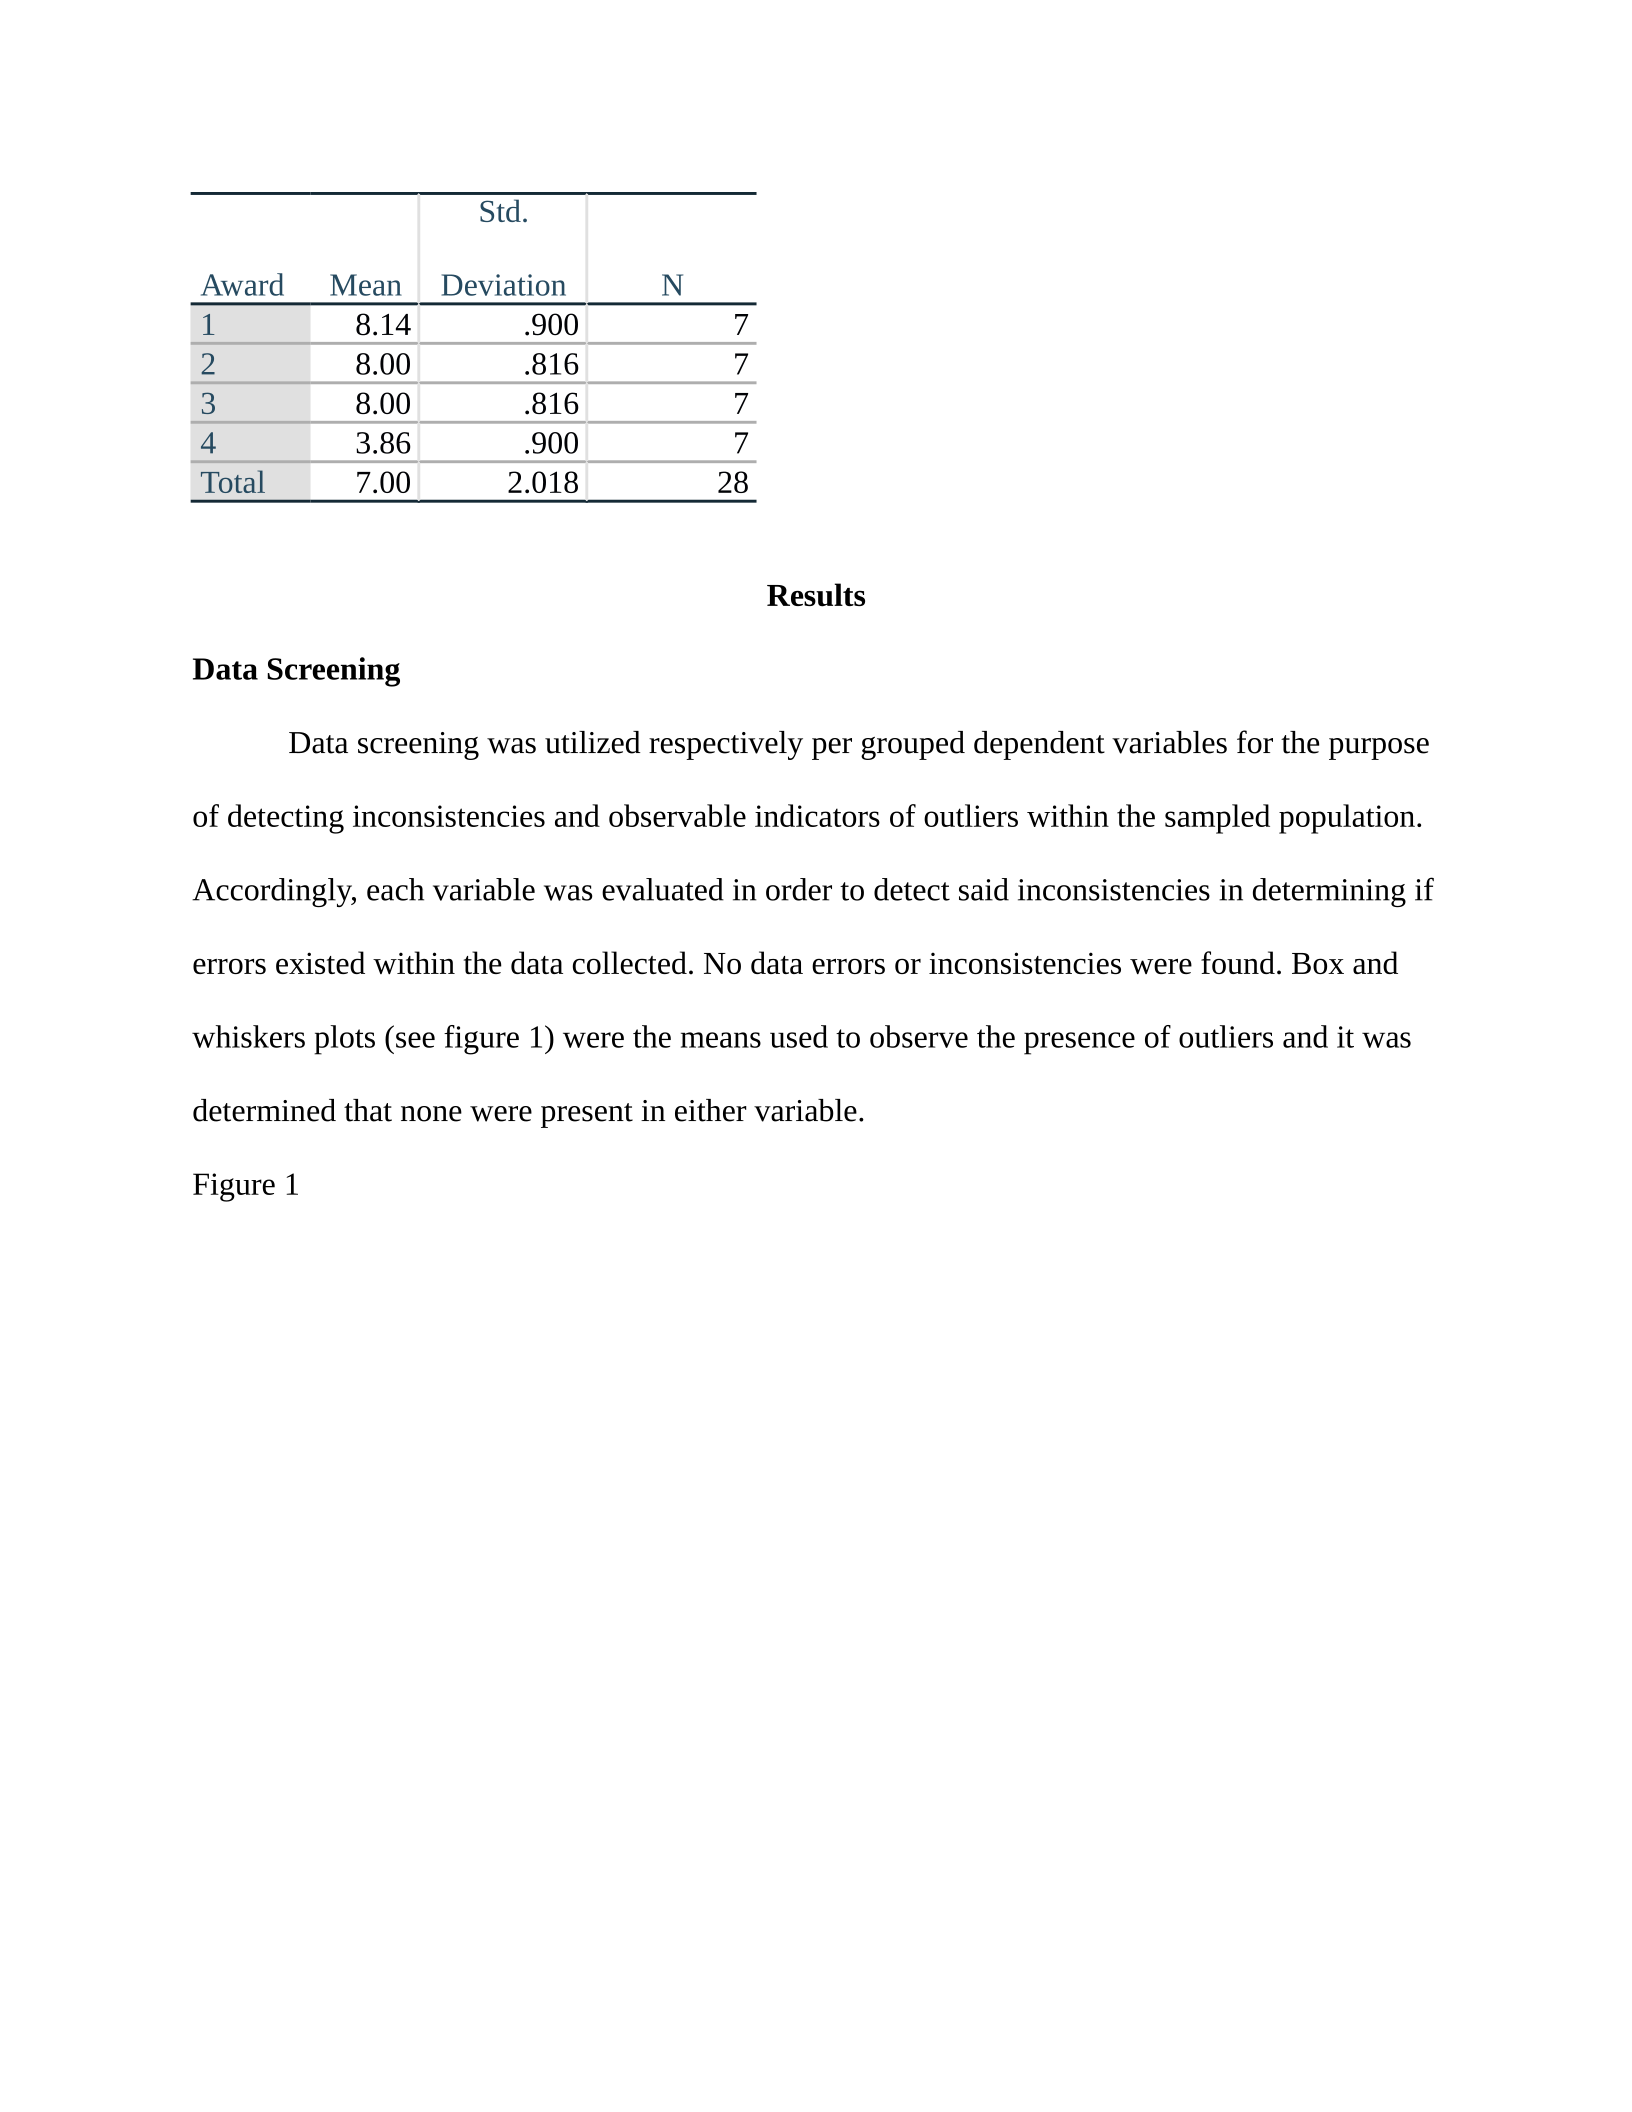
Data obtained for the criterion variable (Attitude Scores) and the predictor variable
(Award) from 28 students in Joe’s class can be found in Table 1.
Table 1
Descriptive Statistics
Dependent Variable: Attitude Scores
Award Mean
Std.
Deviation N
18.14 .900 7
28.00 .816 7
38.00 .816 7
43.86 .900 7
Total 7.00 2.018 28
Results
Data Screening
Data screening was utilized respectively per grouped dependent variables for the purpose
of detecting inconsistencies and observable indicators of outliers within the sampled population.
Accordingly, each variable was evaluated in order to detect said inconsistencies in determining if
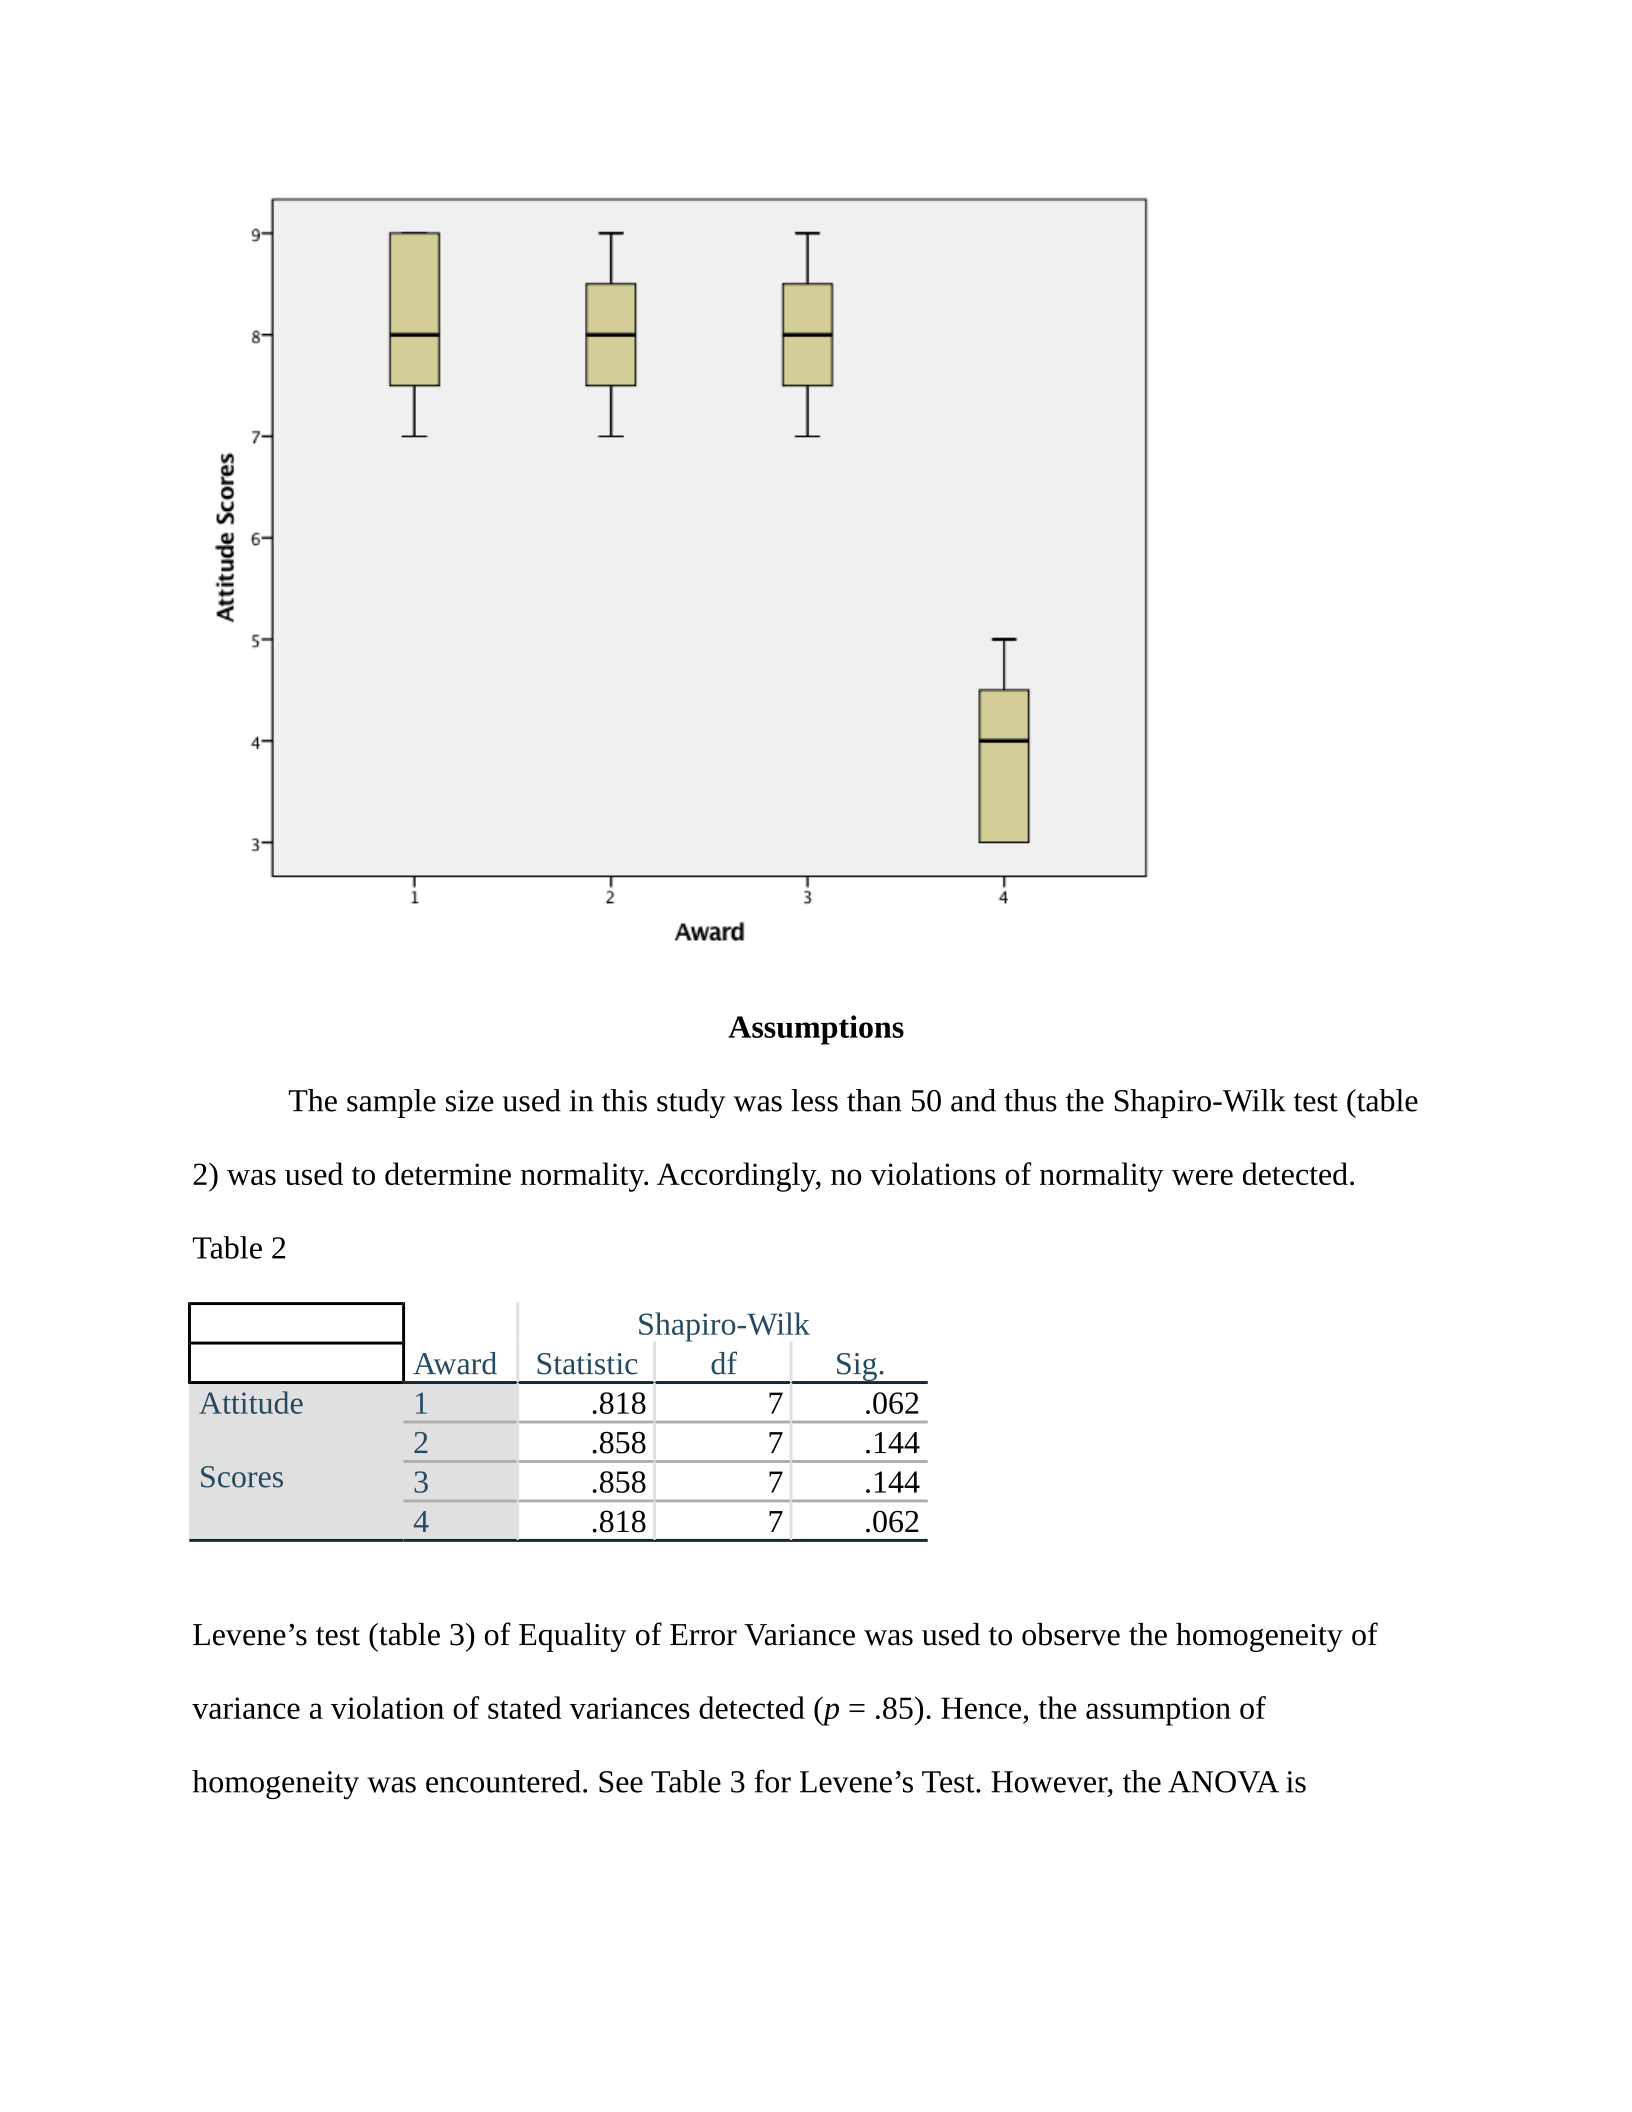
errors existed within the data collected. No data errors or inconsistencies were found. Box and
whiskers plots (see figure 1) were the means used to observe the presence of outliers and it was
determined that none were present in either variable.
Figure 1
Assumptions
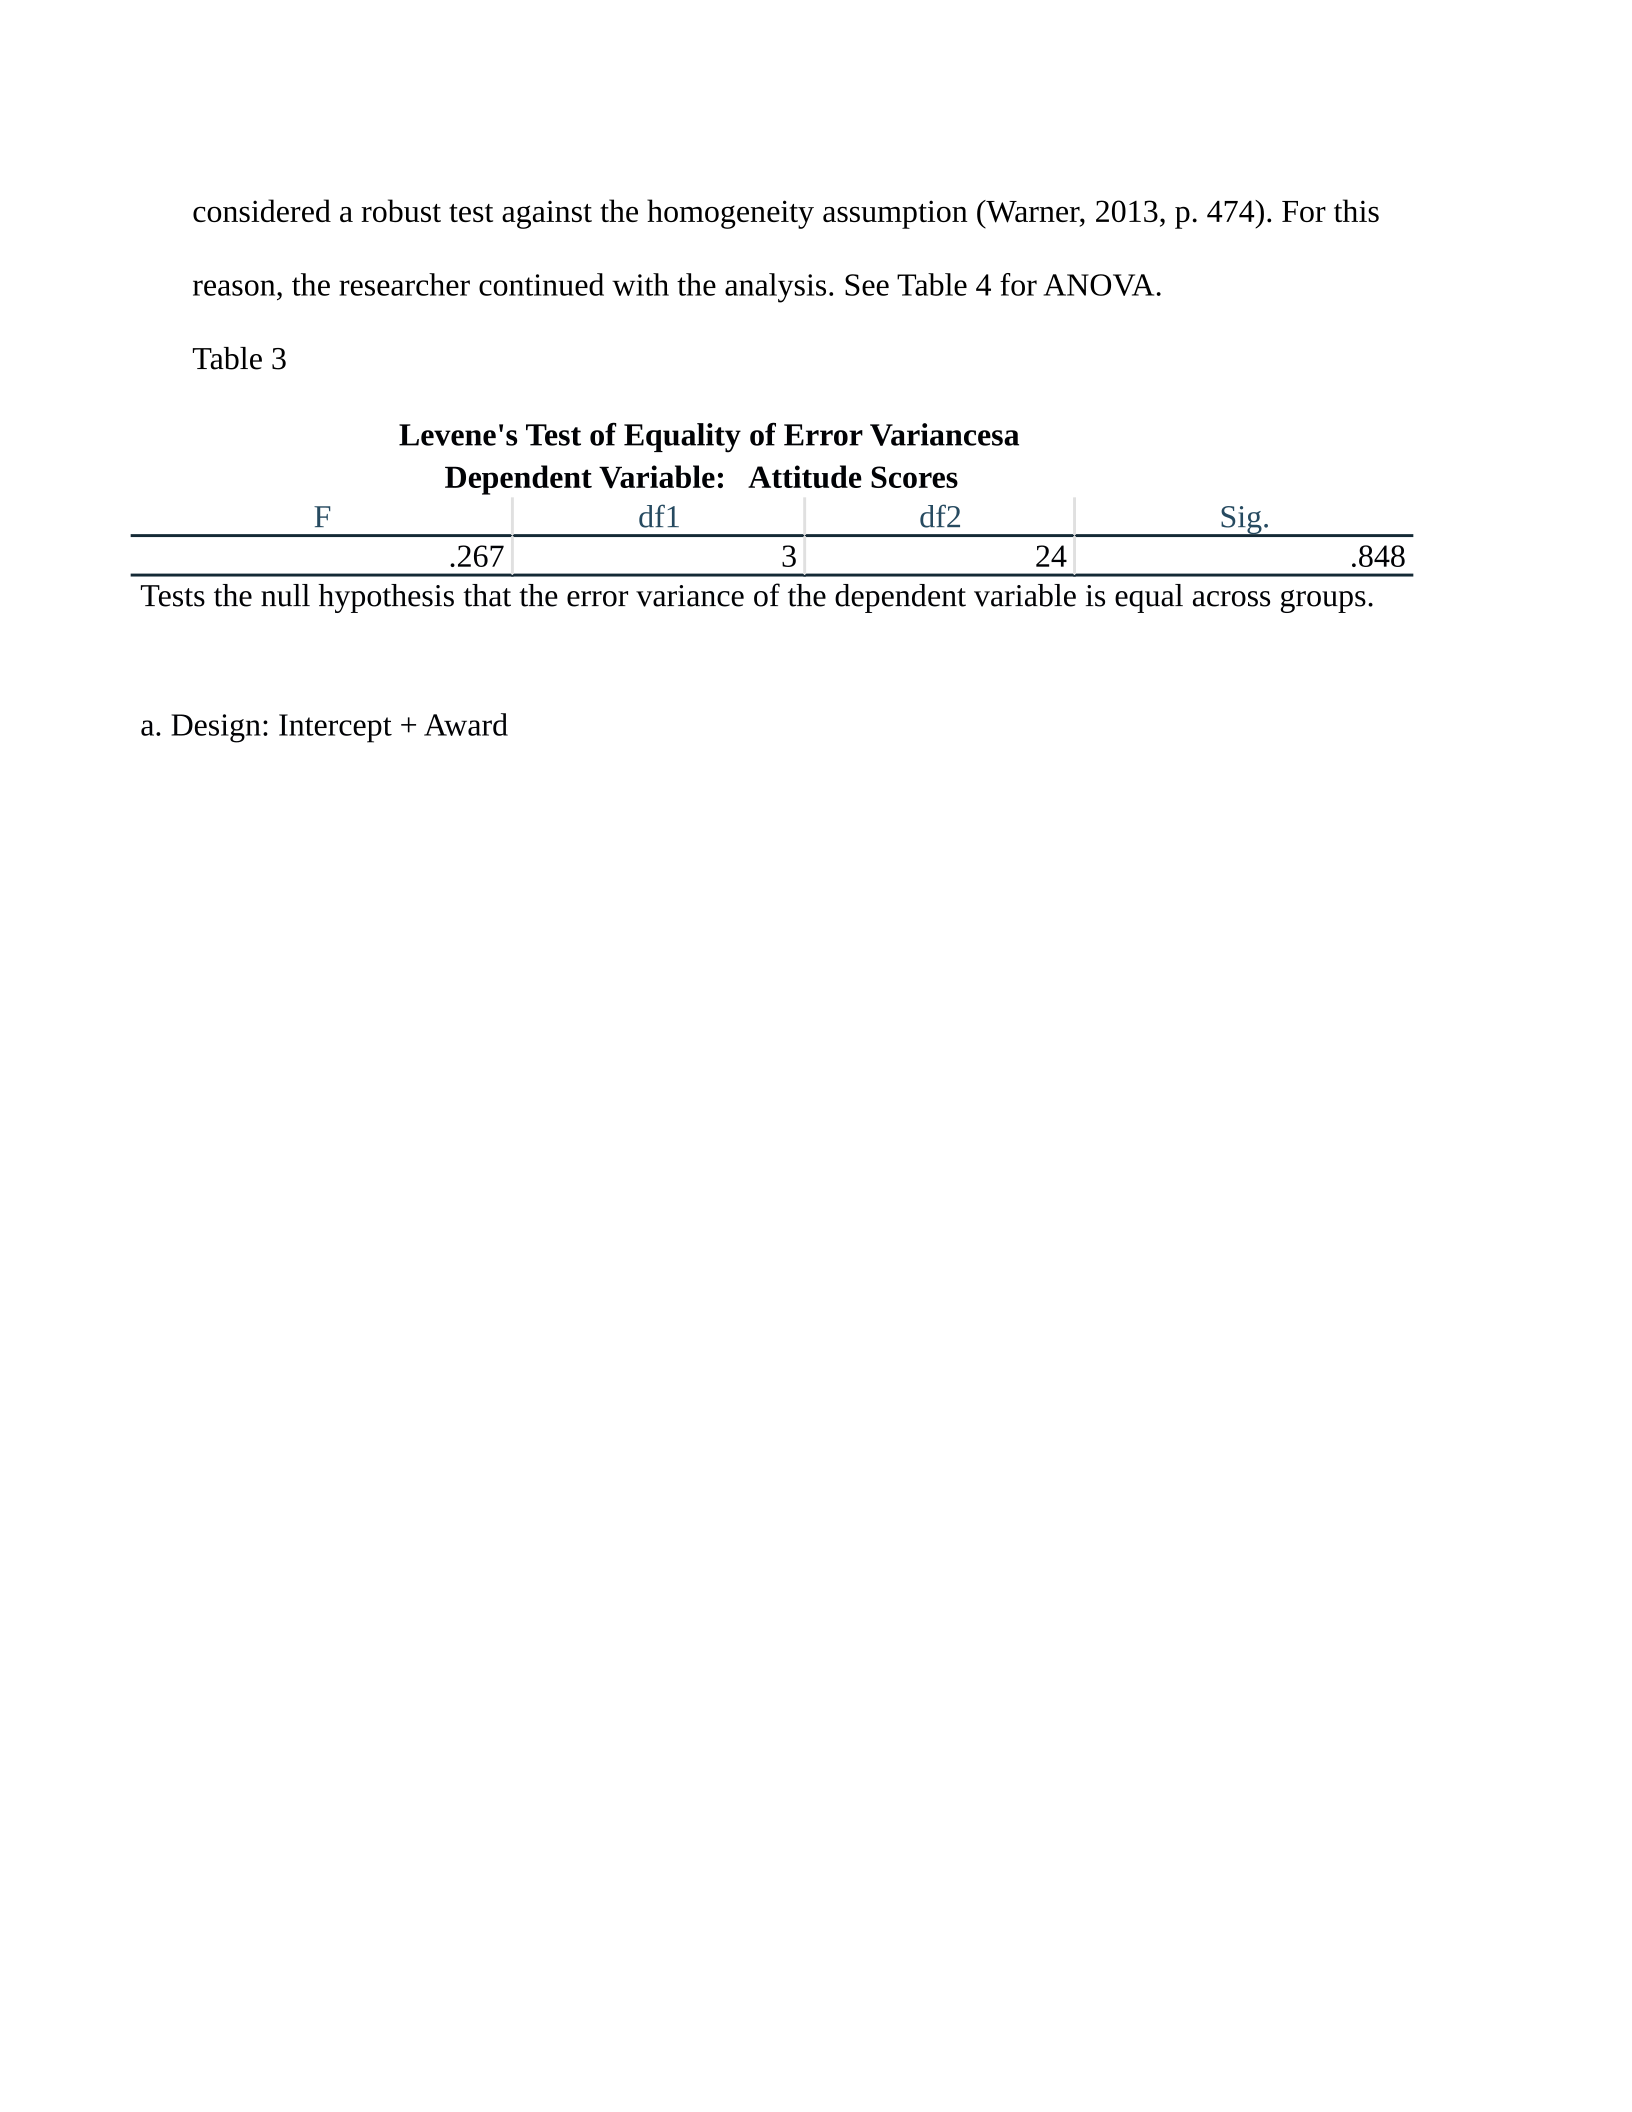
The sample size used in this study was less than 50 and thus the Shapiro-Wilk test (table
2) was used to determine normality. Accordingly, no violations of normality were detected.
Table 2
Award
Shapiro-Wilk
Statistic df Sig.
Attitude
Scores
1.818 7 .062
2.858 7 .144
3.858 7 .144
4.818 7 .062
Levene’s test (table 3) of Equality of Error Variance was used to observe the homogeneity of
variance a violation of stated variances detected (p = .85). Hence, the assumption of
homogeneity was encountered. See Table 3 for Levene’s Test. However, the ANOVA is
considered a robust test against the homogeneity assumption (Warner, 2013, p. 474). For this
reason, the researcher continued with the analysis. See Table 4 for ANOVA.
Table 3
Levene's Test of Equality of Error Variancesa
Dependent Variable: Attitude Scores
F df1 df2 Sig.
.267 3 24 .848
Tests the null hypothesis that the error variance of the dependent variable is equal across groups.
a. Design: Intercept + Award
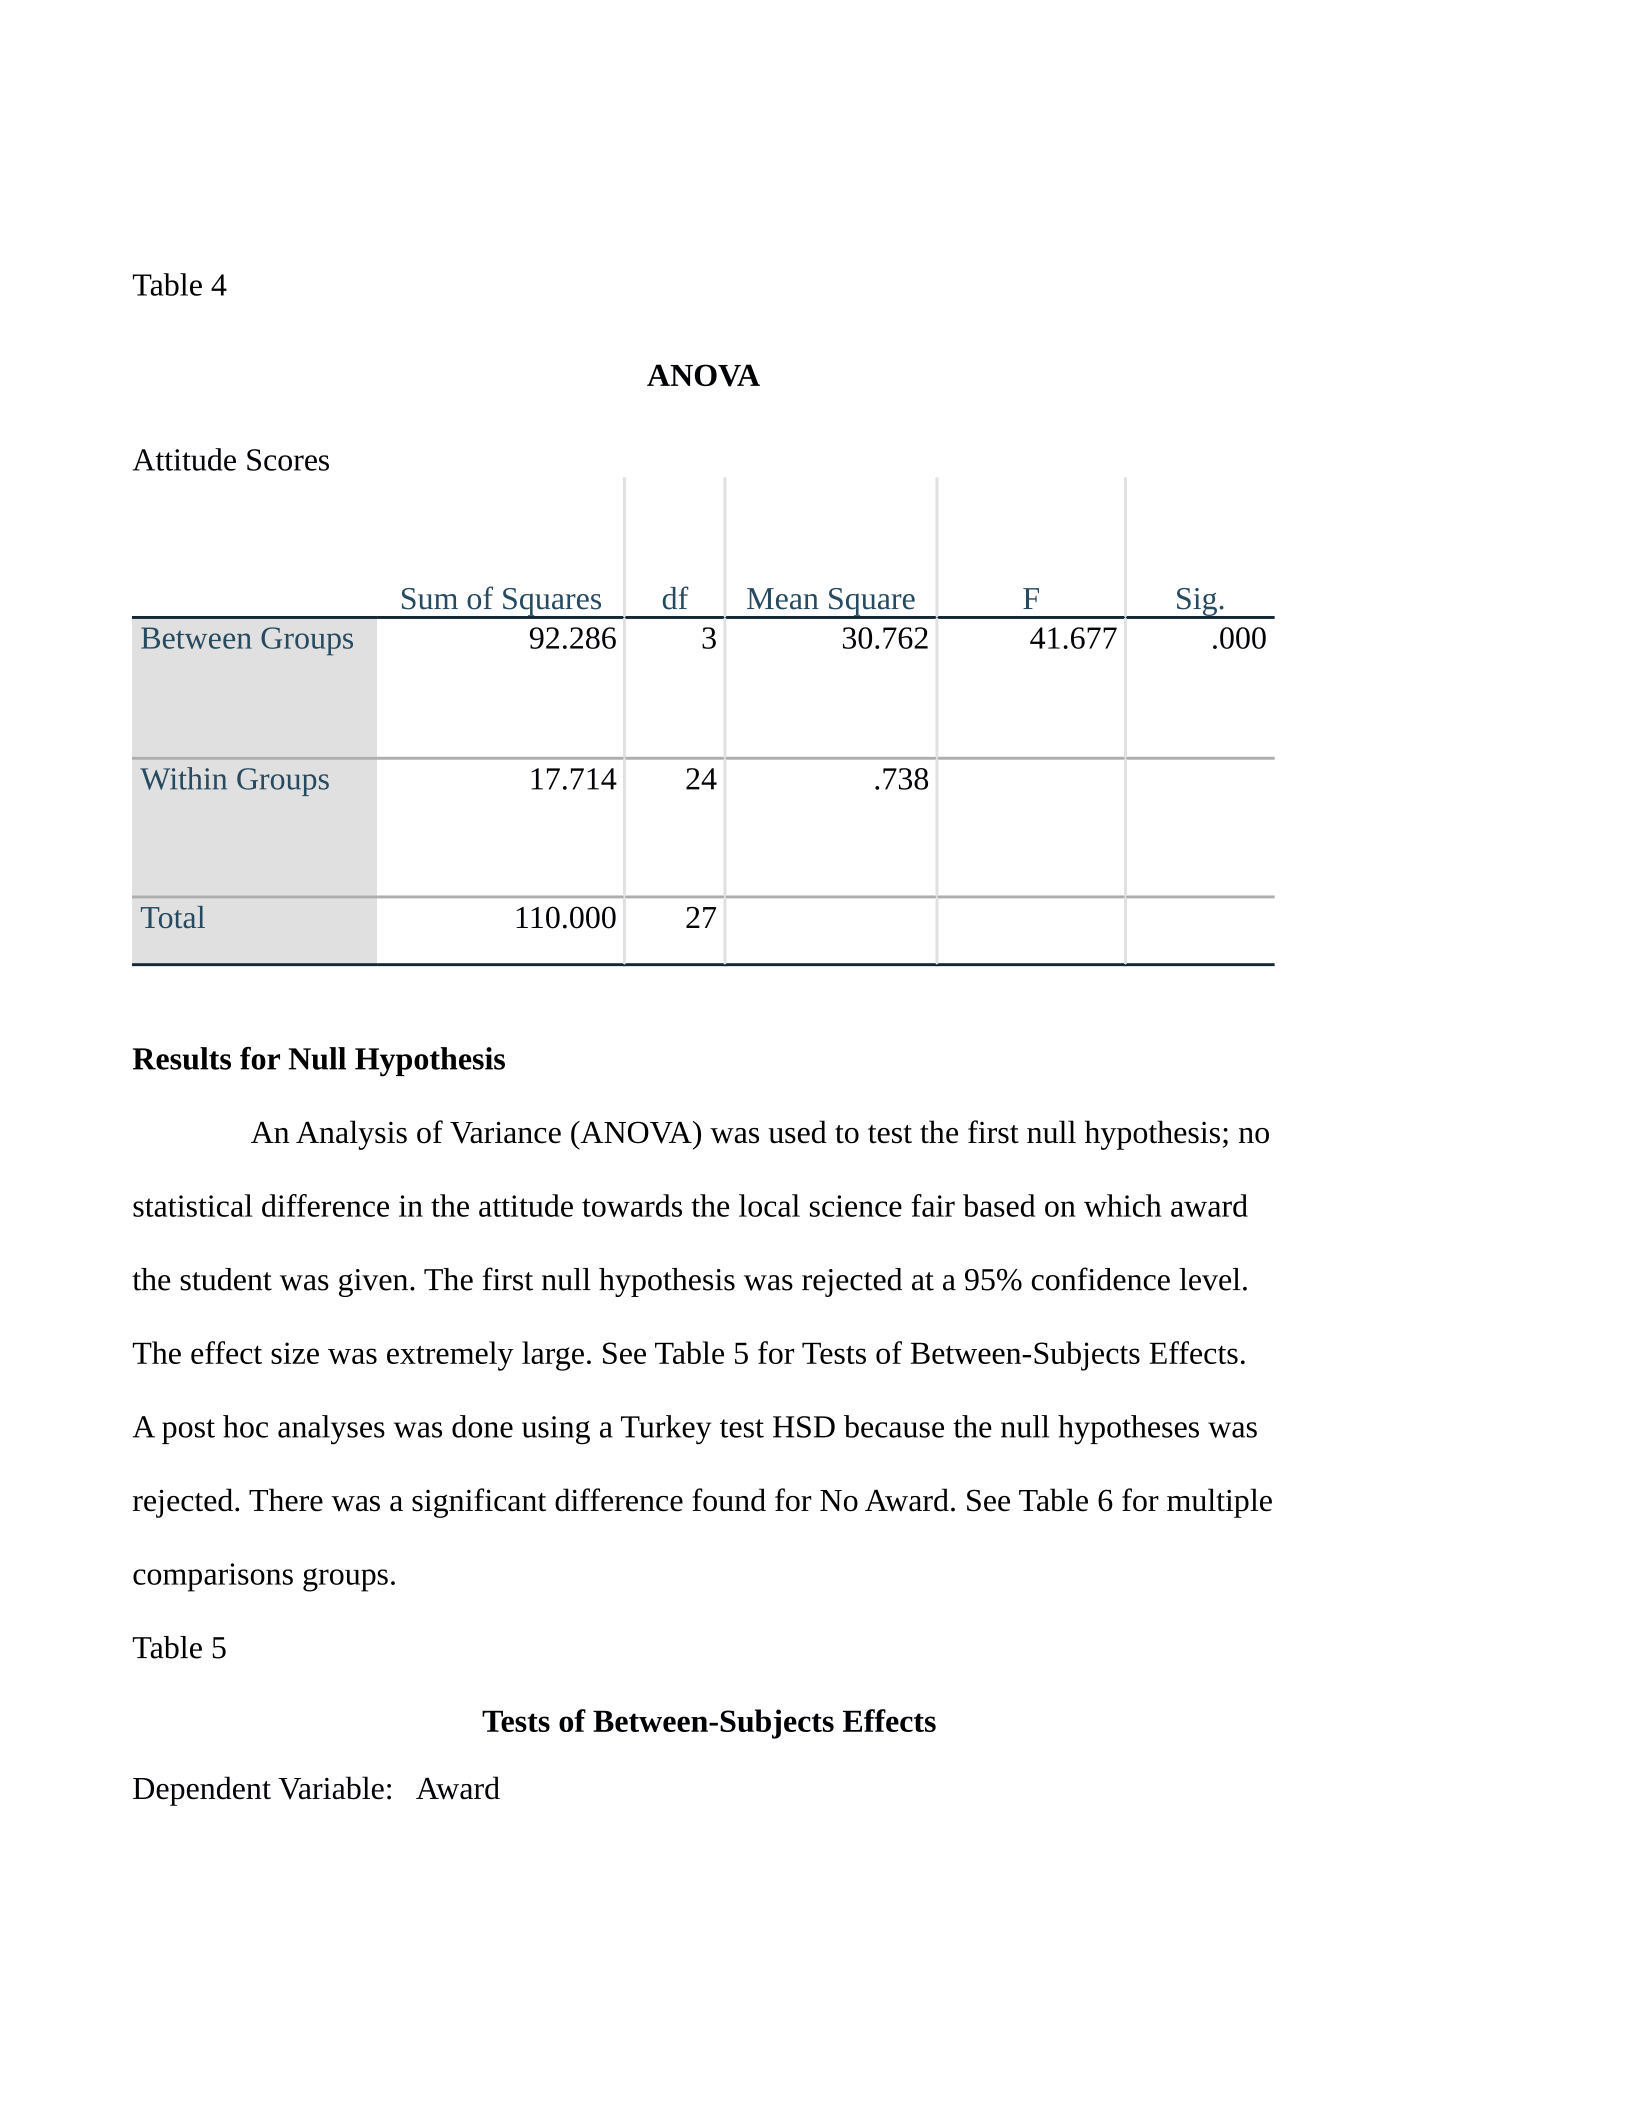
Table 4
ANOVA
Attitude Scores
Sum of Squares df Mean Square F Sig.
Between Groups 92.286 3 30.762 41.677 .000
Within Groups 17.714 24 .738
Total 110.000 27
Results for Null Hypothesis
An Analysis of Variance (ANOVA) was used to test the first null hypothesis; no
statistical difference in the attitude towards the local science fair based on which award
the student was given. The first null hypothesis was rejected at a 95% confidence level.
The effect size was extremely large. See Table 5 for Tests of Between-Subjects Effects.
A post hoc analyses was done using a Turkey test HSD because the null hypotheses was
rejected. There was a significant difference found for No Award. See Table 6 for multiple
comparisons groups.
Table 5
Tests of Between-Subjects Effects
Dependent Variable: Award
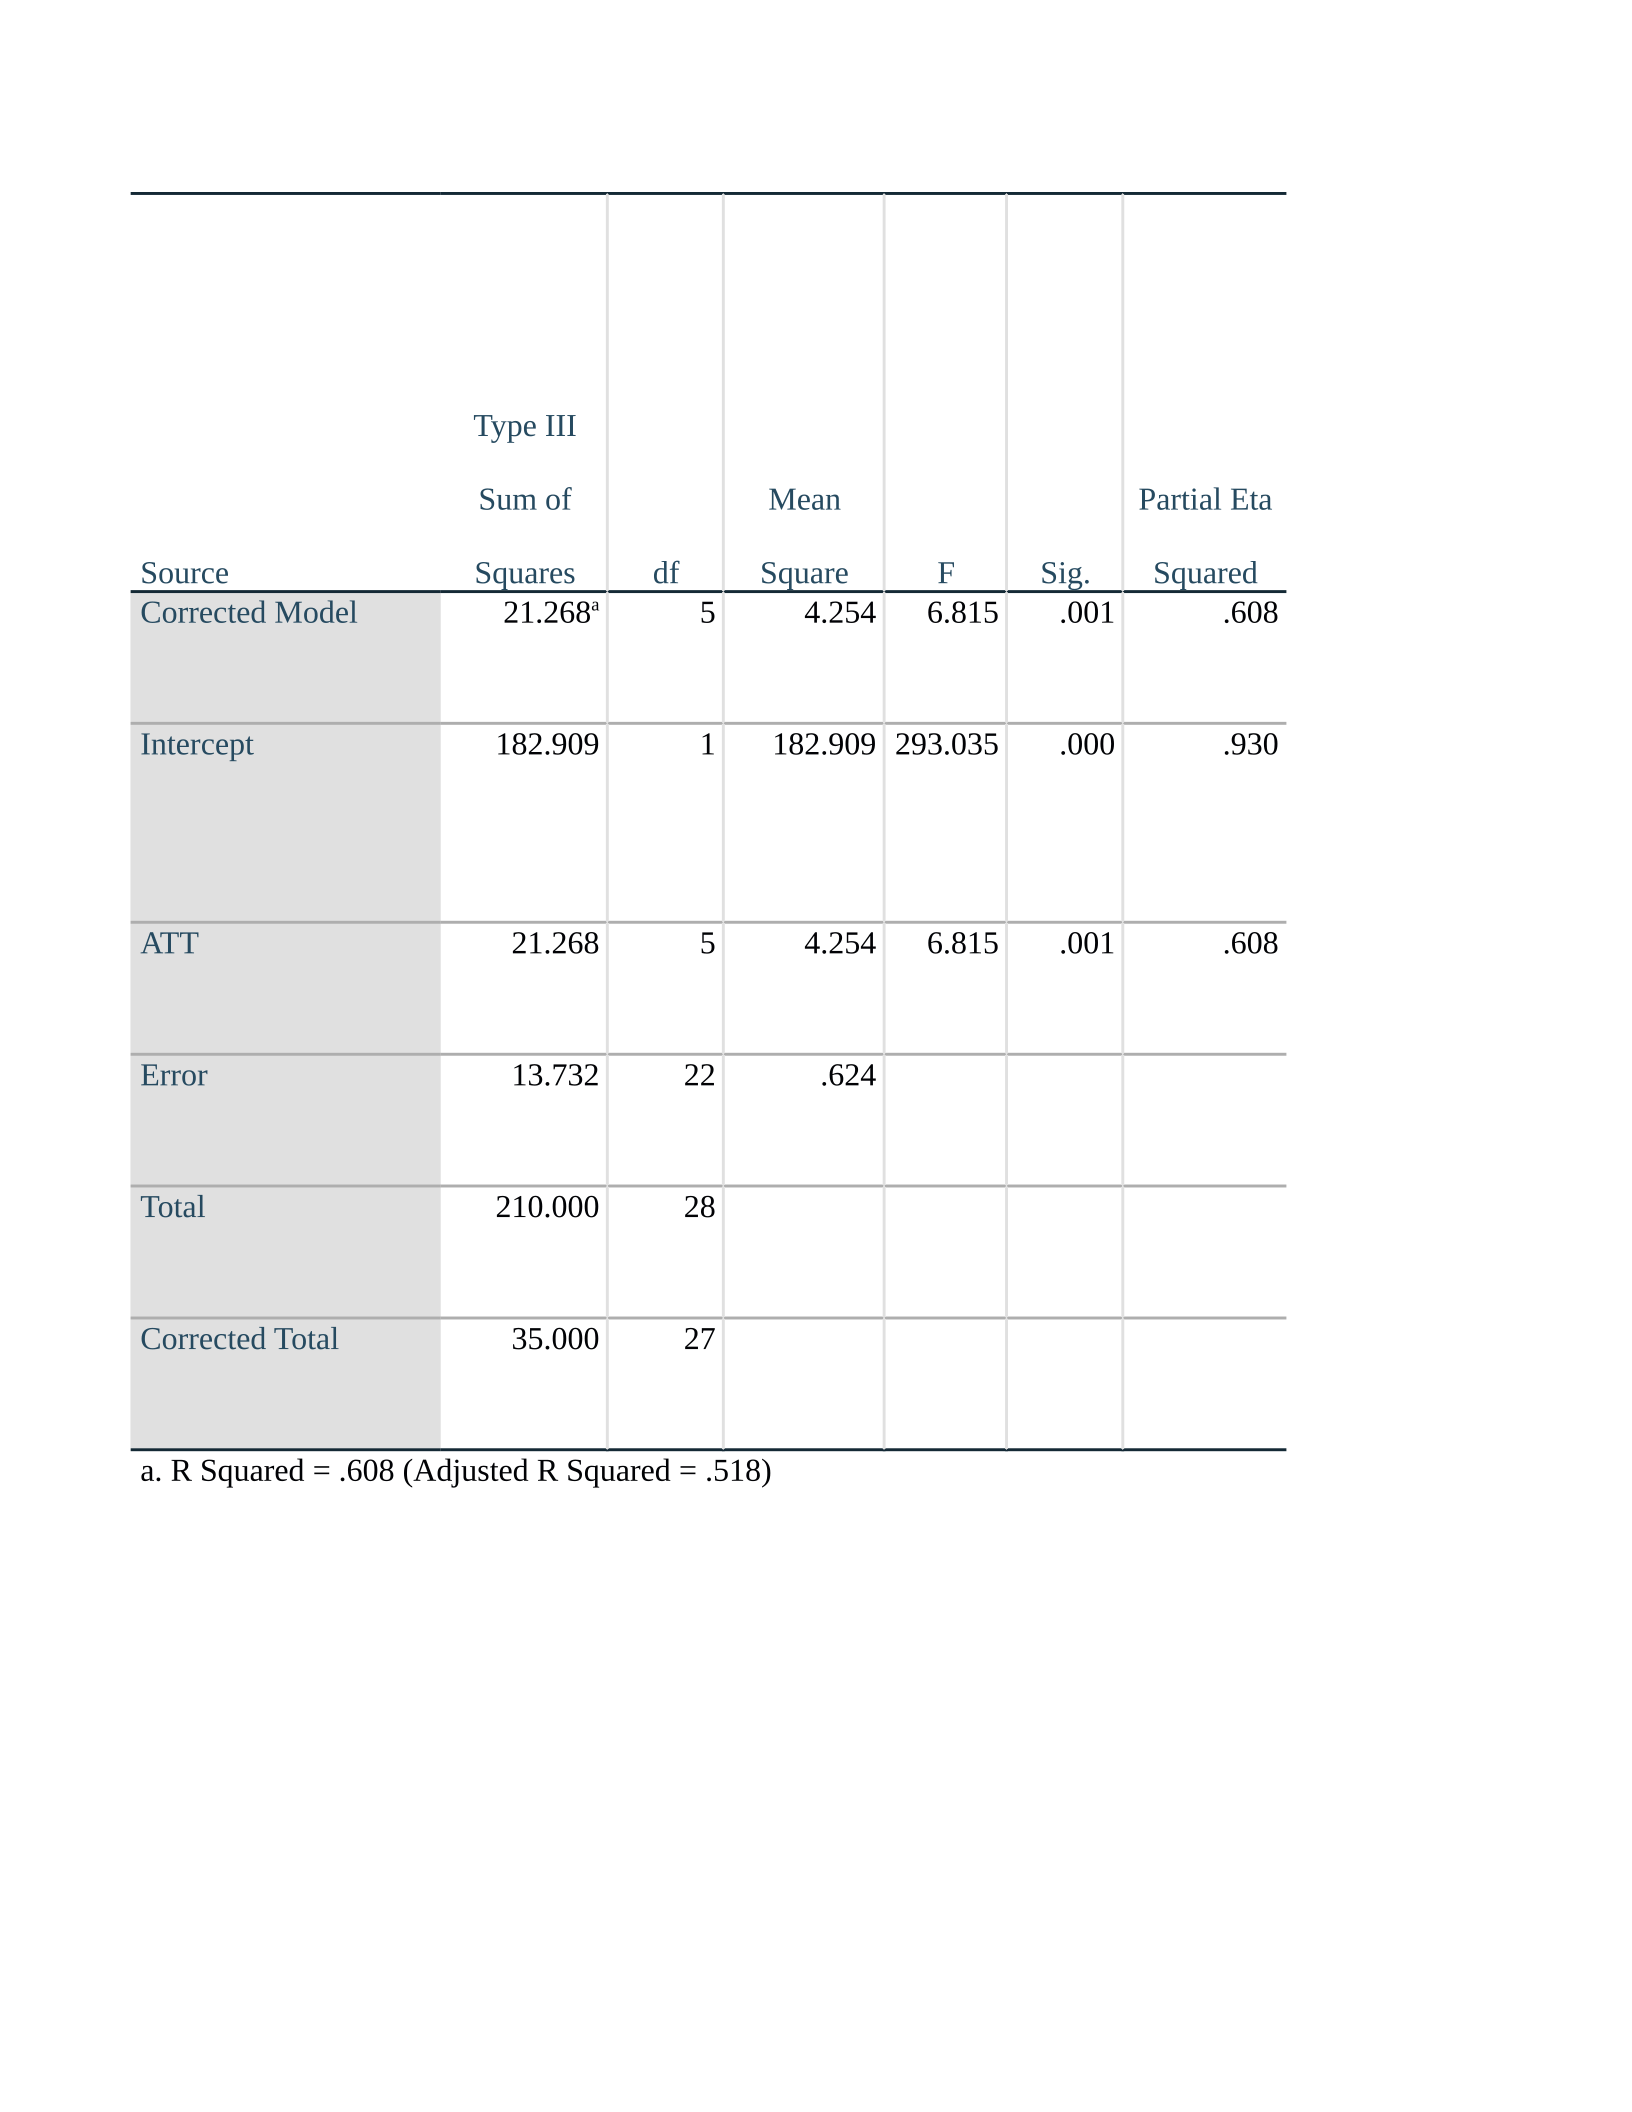
Source
Type III
Sum of
Squares df
Mean
Square F Sig.
Partial Eta
Squared
Corrected Model 21.268a5 4.254 6.815 .001 .608
Intercept 182.909 1 182.909 293.035 .000 .930
ATT 21.268 5 4.254 6.815 .001 .608
Error 13.732 22 .624
Total 210.000 28
Corrected Total 35.000 27
a. R Squared = .608 (Adjusted R Squared = .518)
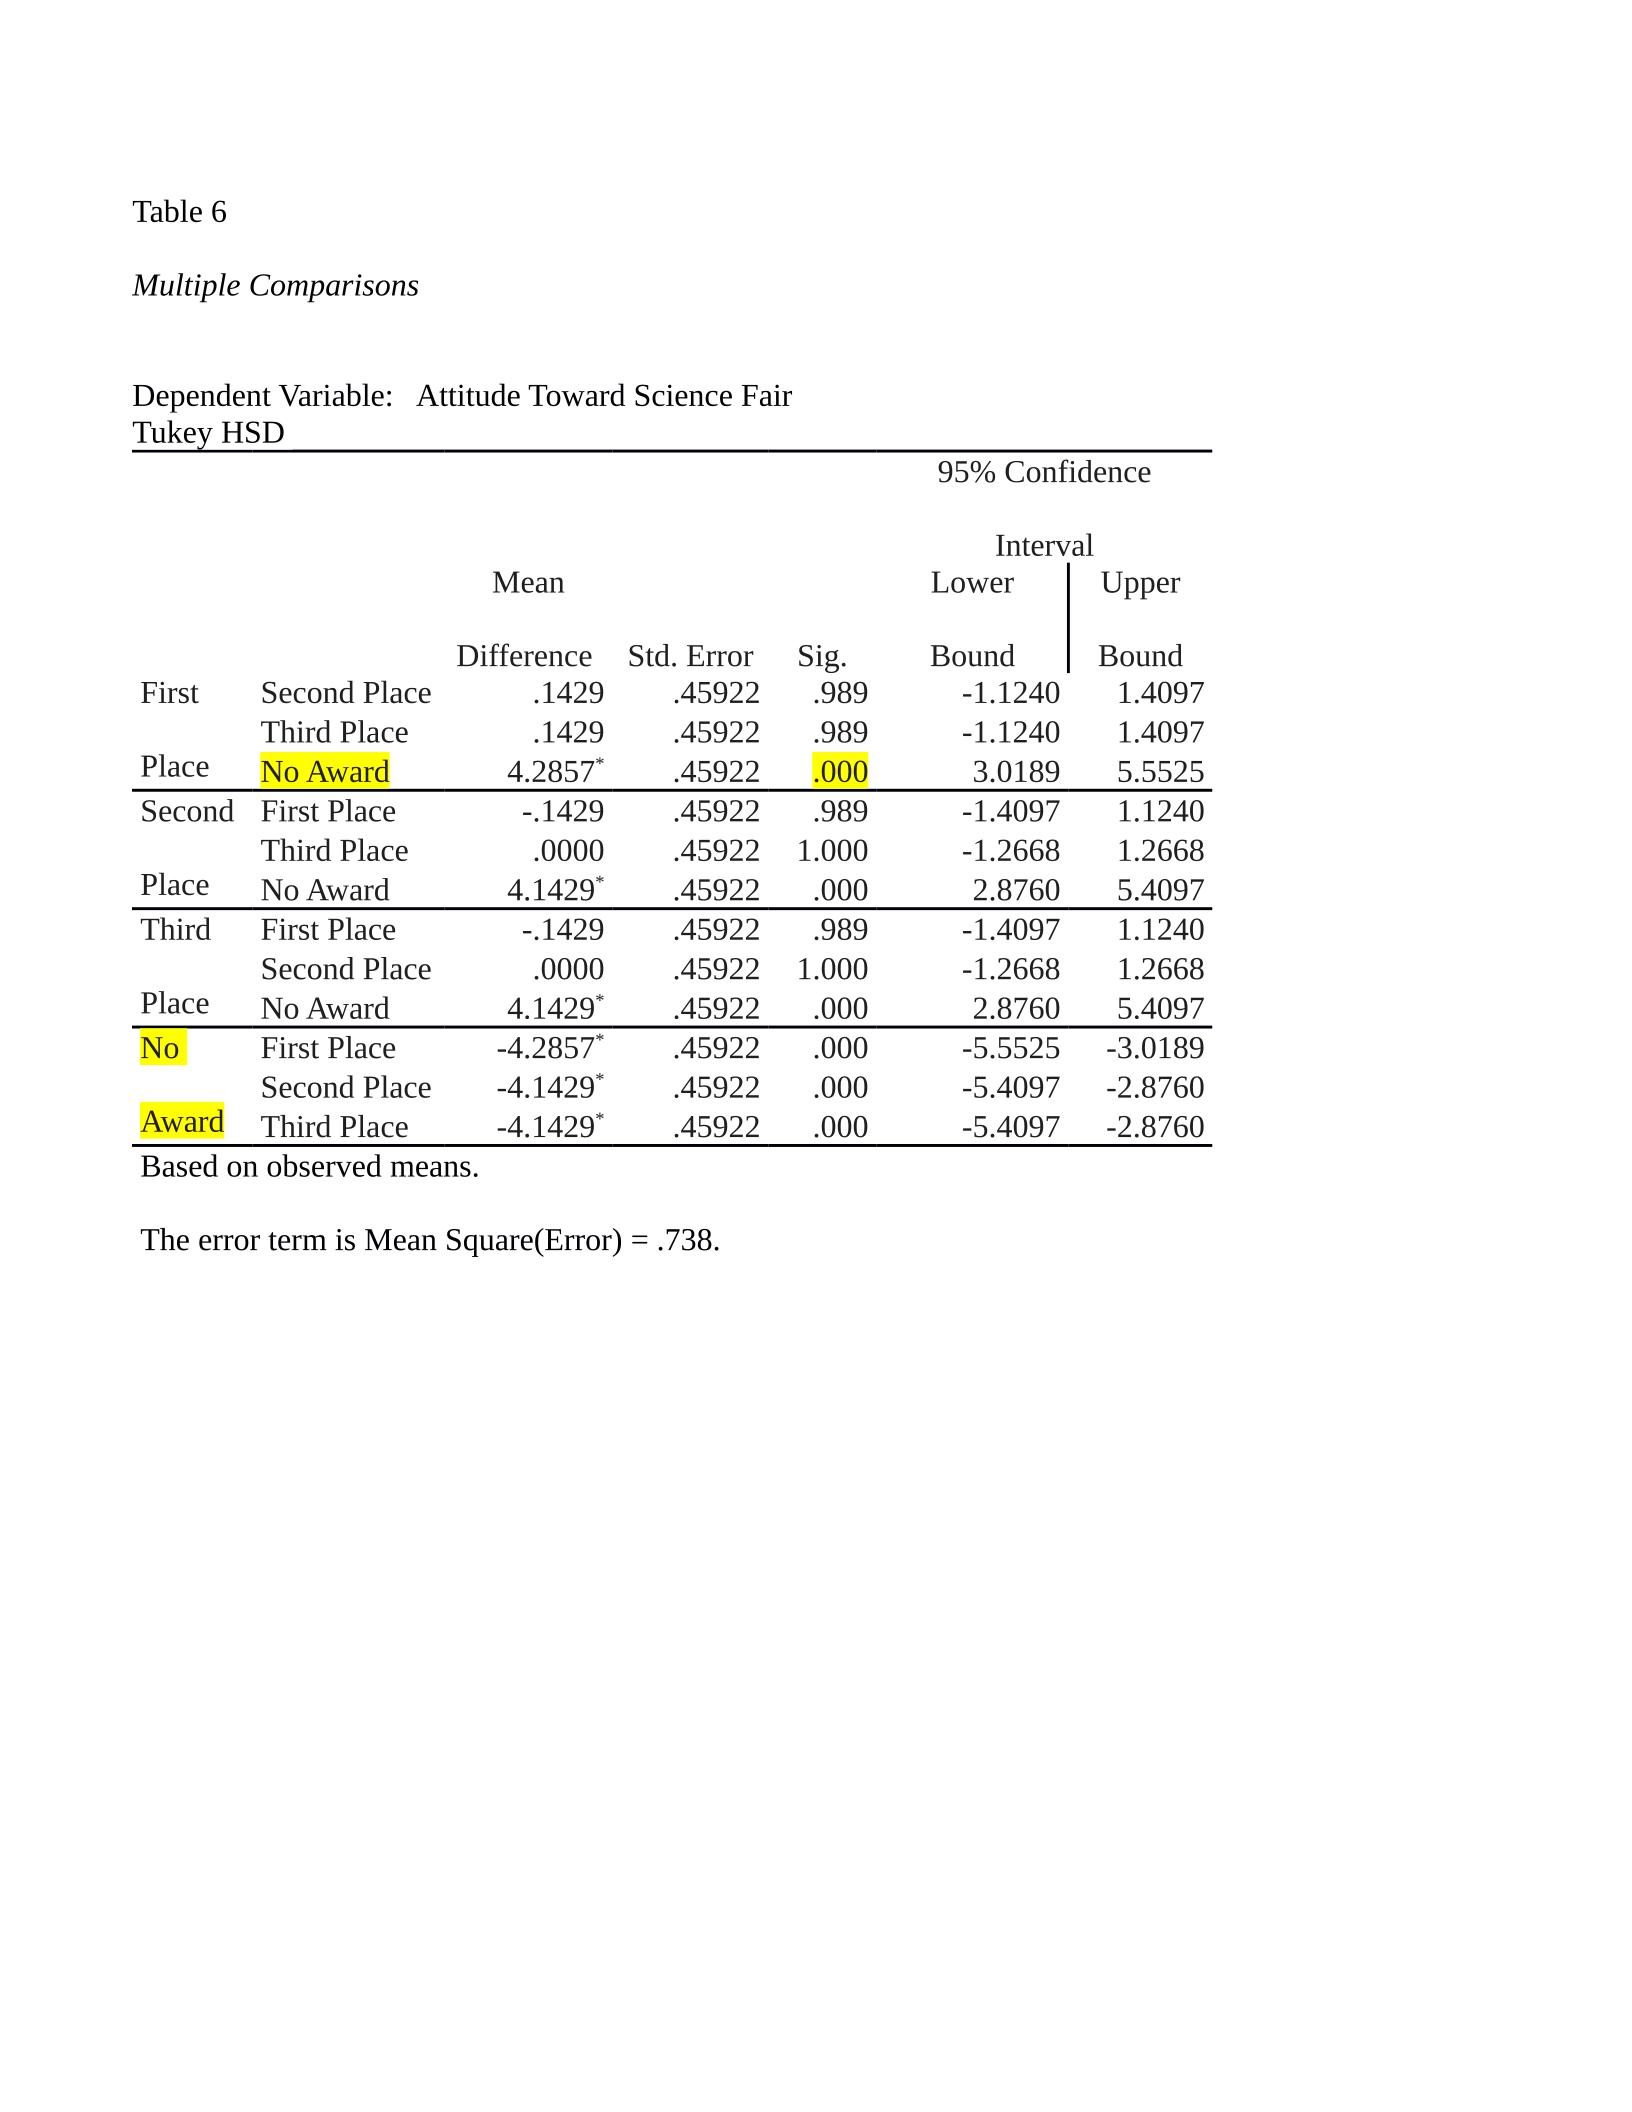
Table 6
Multiple Comparisons
Dependent Variable: Attitude Toward Science Fair
Tukey HSD
Mean
Difference Std. Error Sig.
95% Confidence
Interval
Lower
Bound
Upper
Bound
First
Place
Second Place .1429 .45922 .989 -1.1240 1.4097
Third Place .1429 .45922 .989 -1.1240 1.4097
No Award 4.2857*.45922 .000 3.0189 5.5525
Second
Place
First Place -.1429 .45922 .989 -1.4097 1.1240
Third Place .0000 .45922 1.000 -1.2668 1.2668
No Award 4.1429*.45922 .000 2.8760 5.4097
Third
Place
First Place -.1429 .45922 .989 -1.4097 1.1240
Second Place .0000 .45922 1.000 -1.2668 1.2668
No Award 4.1429*.45922 .000 2.8760 5.4097
No
Award
First Place -4.2857*.45922 .000 -5.5525 -3.0189
Second Place -4.1429*.45922 .000 -5.4097 -2.8760
Third Place -4.1429*.45922 .000 -5.4097 -2.8760
Based on observed means.
The error term is Mean Square(Error) = .738.
Powered by TCPDF (www.tcpdf.org)

