



EXAMINE VARIABLES=Salary BY Subject
/PLOT=BOXPLOT
/STATISTICS=NONE
/NOTOTAL.
Explore
Notes
Output Created 27-SEP-2020
15:06:27
Comments
Input Active Dataset DataSet2
Filter <none>
Weight <none>
Split File <none>
N of Rows in
Working Data File
18
Missing Value
Handling
Definition of Missing User-defined
missing values for
dependent variables
are treated as
missing.
Cases Used Statistics are based
on cases with no
missing values for
any dependent
variable or factor
used.
Syntax EXAMINE
VARIABLES=Salary
BY Subject
/PLOT=BOXPLOT
/STATISTICS=NON
E
/NOTOTAL.
Resources Processor Time 00:00:00.11
Elapsed Time 00:00:00.00
Subject
Case Processing Summary
Subject
Cases
Valid Missing Total
N Percent N Percent N Percent
Salary Math 6 100.0% 0 0.0% 6 100.0%
Science 6 100.0% 0 0.0% 6 100.0%
English 6 100.0% 0 0.0% 6 100.0%
Salary
EXAMINE VARIABLES=Salary BY Subject
/PLOT=BOXPLOT
/STATISTICS=NONE
/NOTOTAL.
Explore
Notes
Output Created 27-SEP-2020
15:07:01
Comments
Input Active Dataset DataSet2
Filter <none>
Weight <none>
Split File <none>
N of Rows in
Working Data File
18
Missing Value
Handling
Definition of Missing User-defined
missing values for
dependent variables
are treated as
missing.
Cases Used Statistics are based
on cases with no
missing values for
any dependent
variable or factor
used.
Syntax EXAMINE
VARIABLES=Salary
BY Subject
/PLOT=BOXPLOT
/STATISTICS=NON
E
/NOTOTAL.
Resources Processor Time 00:00:00.10
Elapsed Time 00:00:00.00
Subject
Case Processing Summary
Subject
Cases
Valid Missing Total
N Percent N Percent N Percent
Salary Math 6 100.0% 0 0.0% 6 100.0%
Science 6 100.0% 0 0.0% 6 100.0%
English 6 100.0% 0 0.0% 6 100.0%
Salary
SORT CASES BY Subject.
SPLIT FILE LAYERED BY Subject.
DESCRIPTIVES VARIABLES=Salary
/STATISTICS=MEAN STDDEV MIN MAX.
Descriptives
Notes
Output Created 27-SEP-2020
15:11:04
Comments
Input Active Dataset DataSet2
Filter <none>
Weight <none>
Split File Subject
N of Rows in
Working Data File
18
Missing Value
Handling
Definition of Missing User defined
missing values are
treated as missing.
Cases Used All non-missing data
are used.
Syntax DESCRIPTIVES
VARIABLES=Salary
/STATISTICS=MEA
N STDDEV MIN
MAX.
Resources Processor Time 00:00:00.00
Elapsed Time 00:00:00.00
Descriptive Statistics
Subject N Minimum Maximum Mean
Std.
Deviation
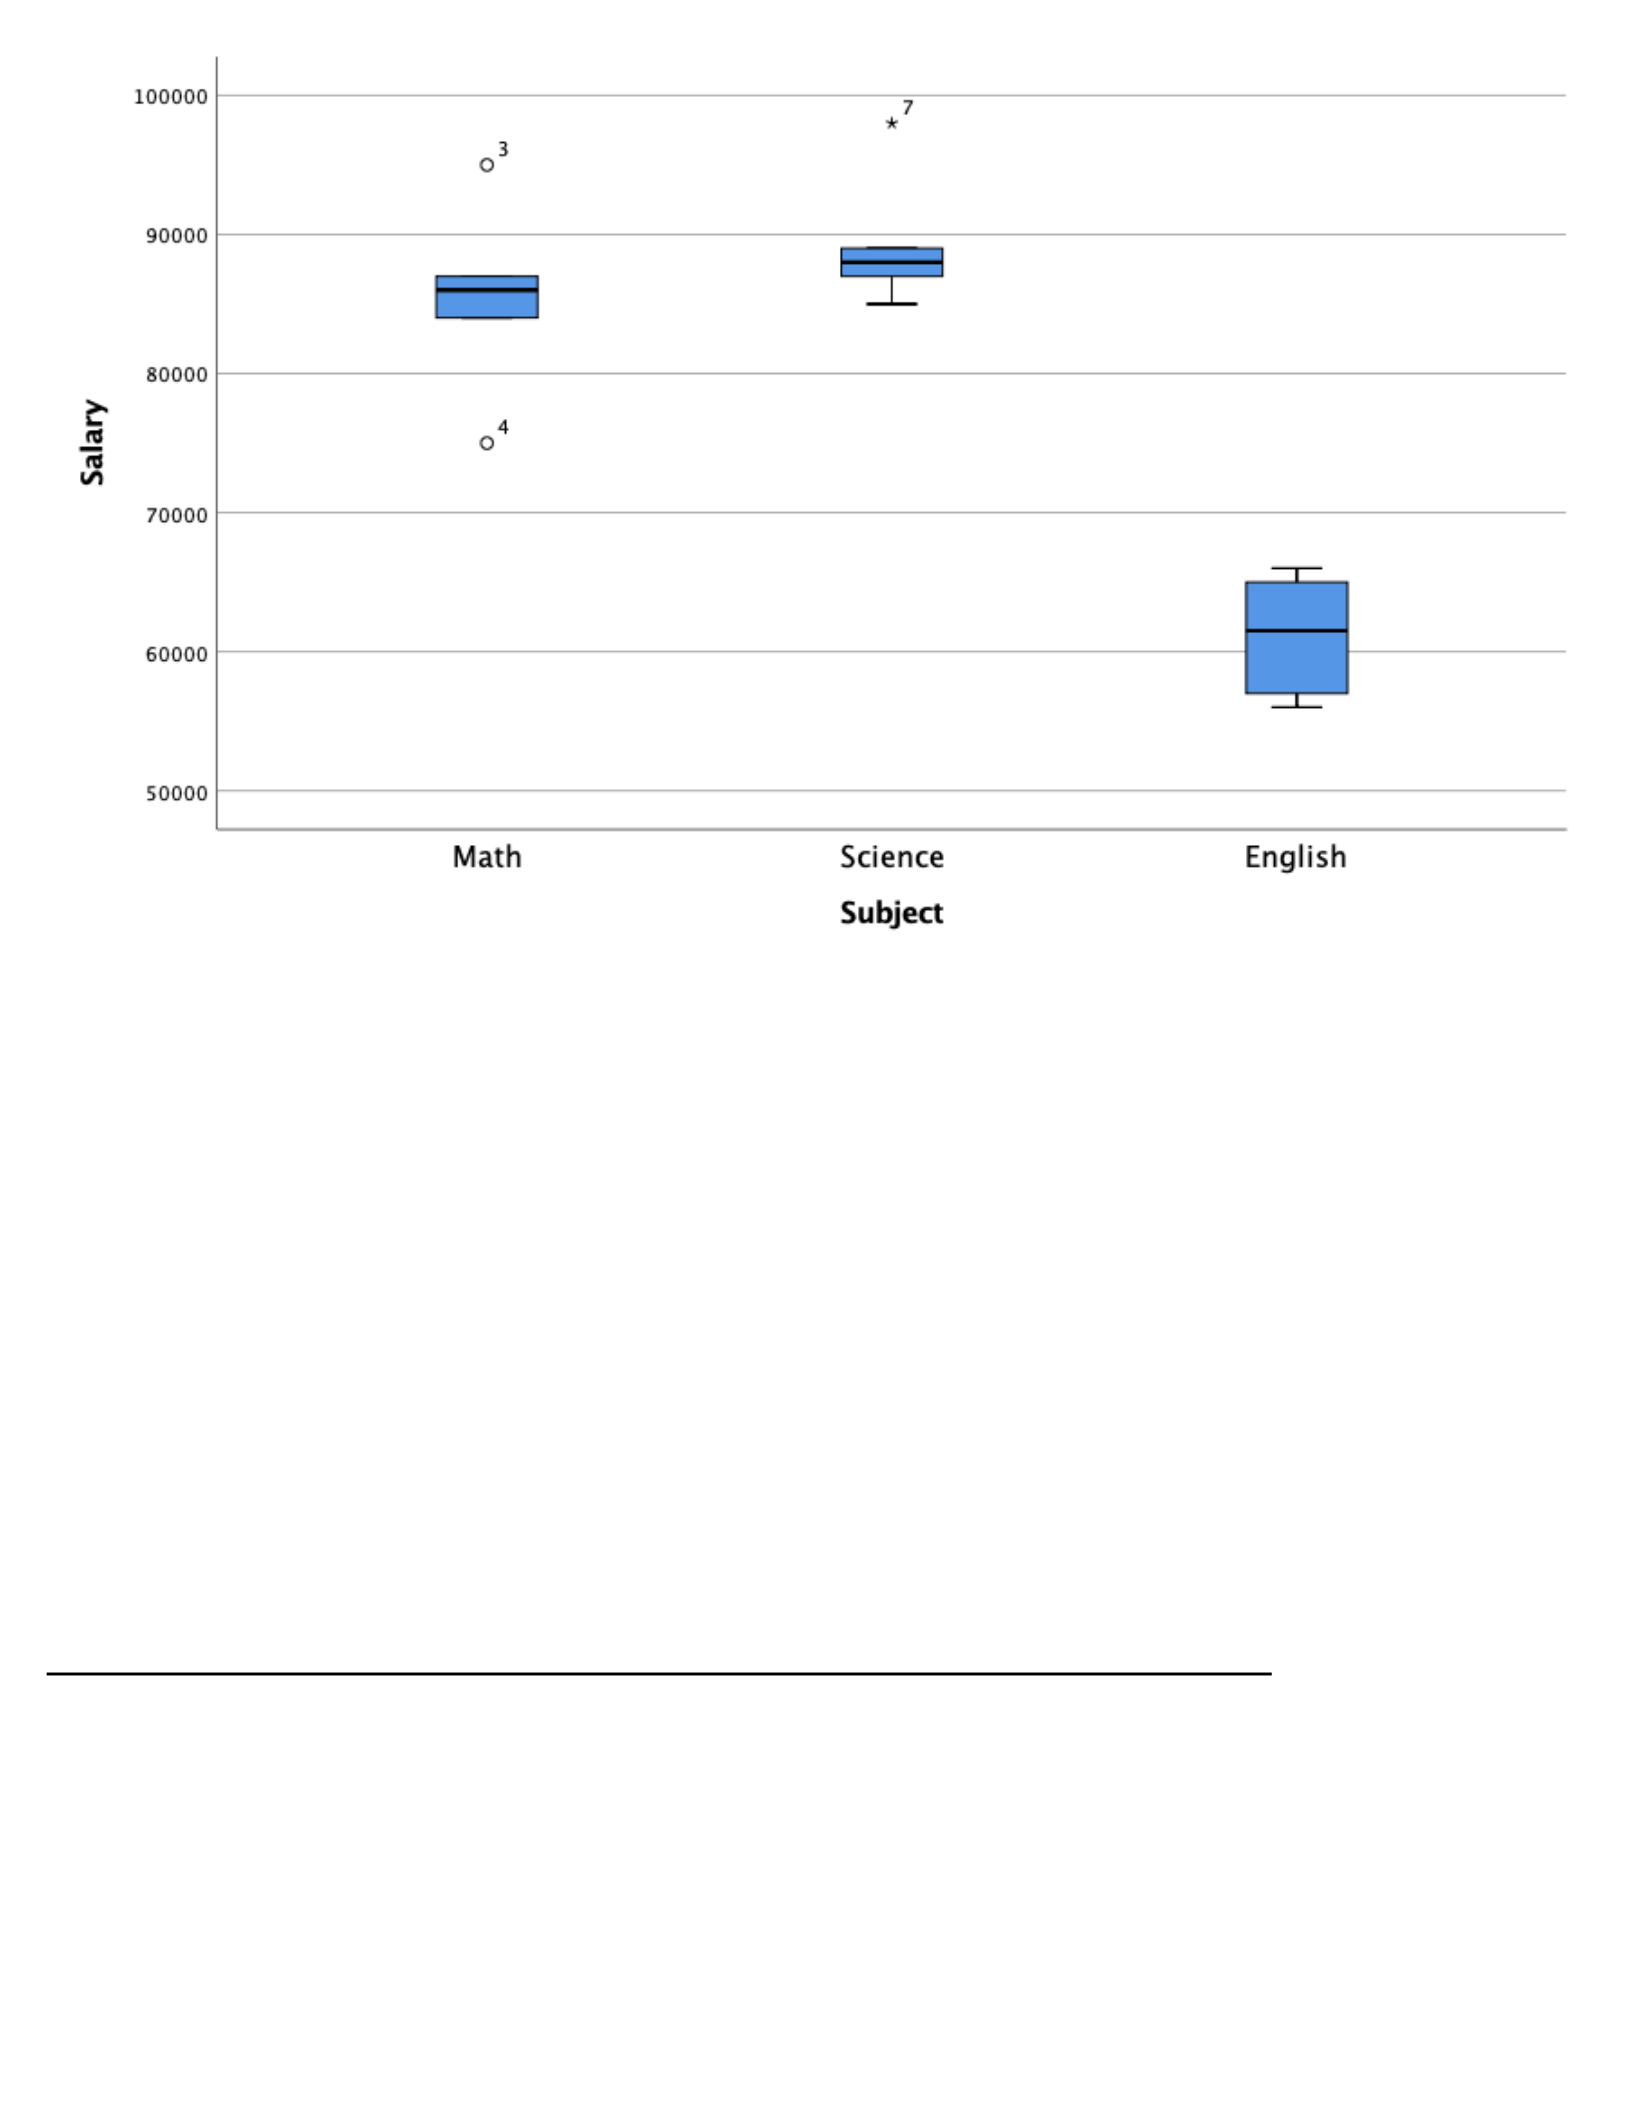
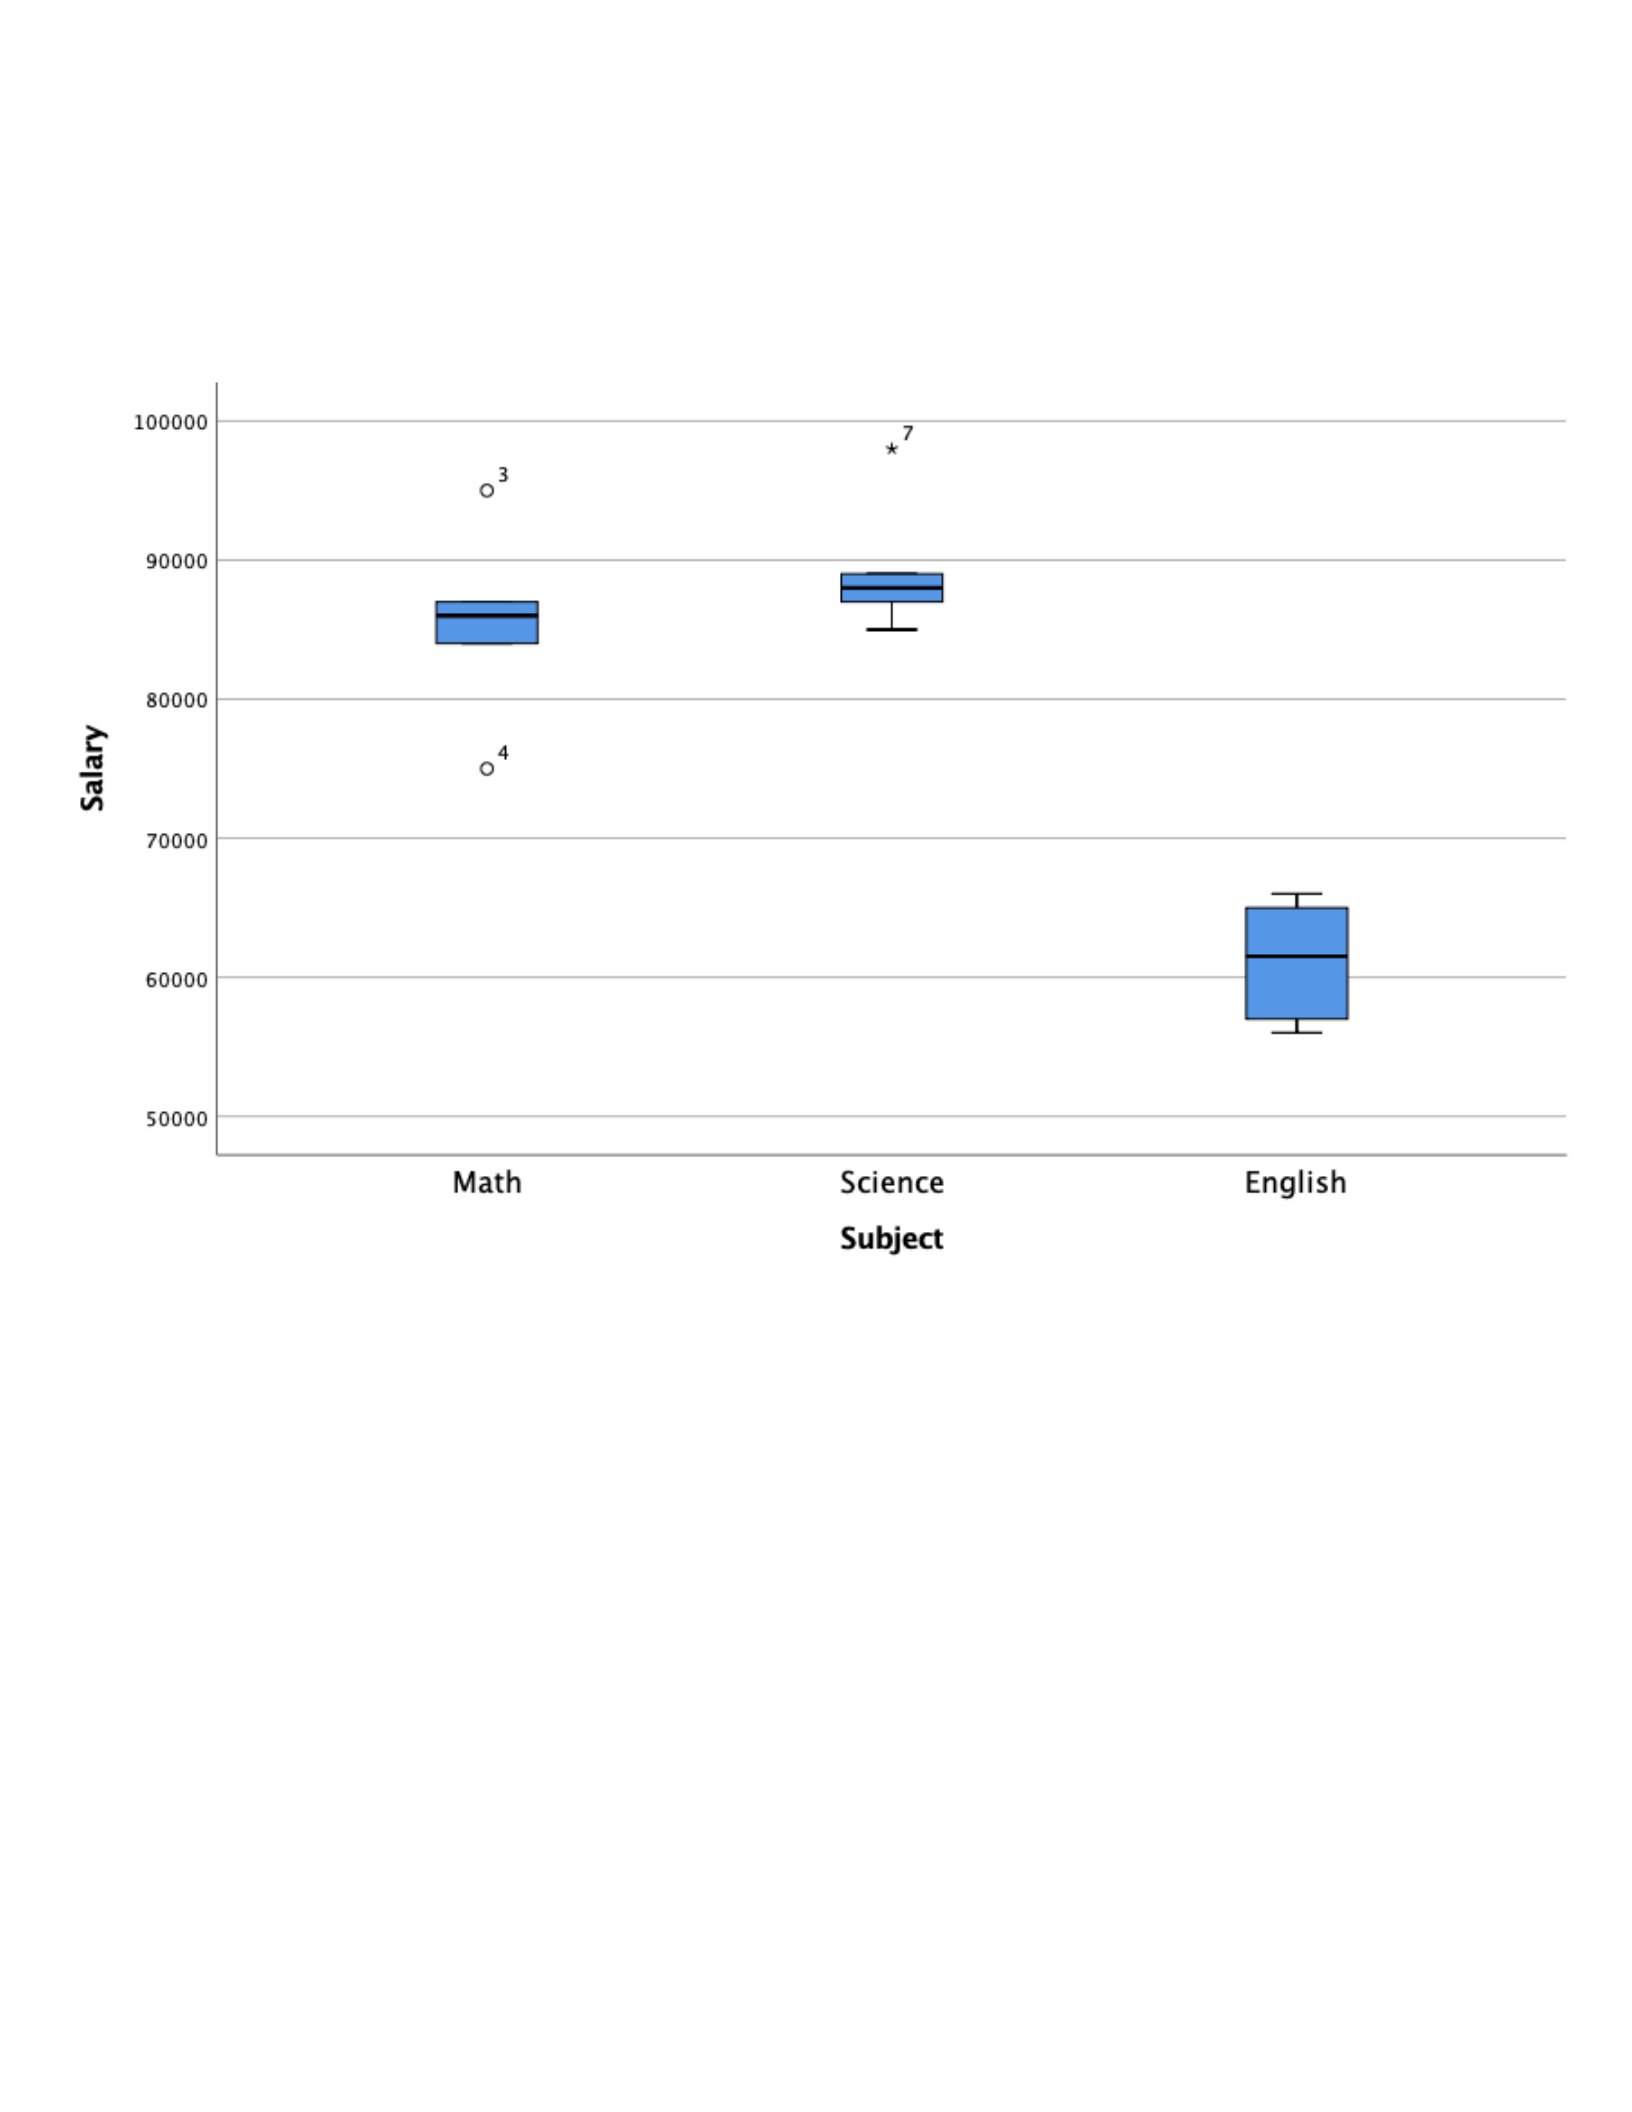
Math Salary 6 75000 95000 85500.00 6442.049
Valid N (listwise) 6
Science Salary 6 85000 98000 89166.67 4535.049
Valid N (listwise) 6
English Salary 6 56000 66000 61166.67 4622.409
Valid N (listwise) 6
SPLIT FILE OFF.
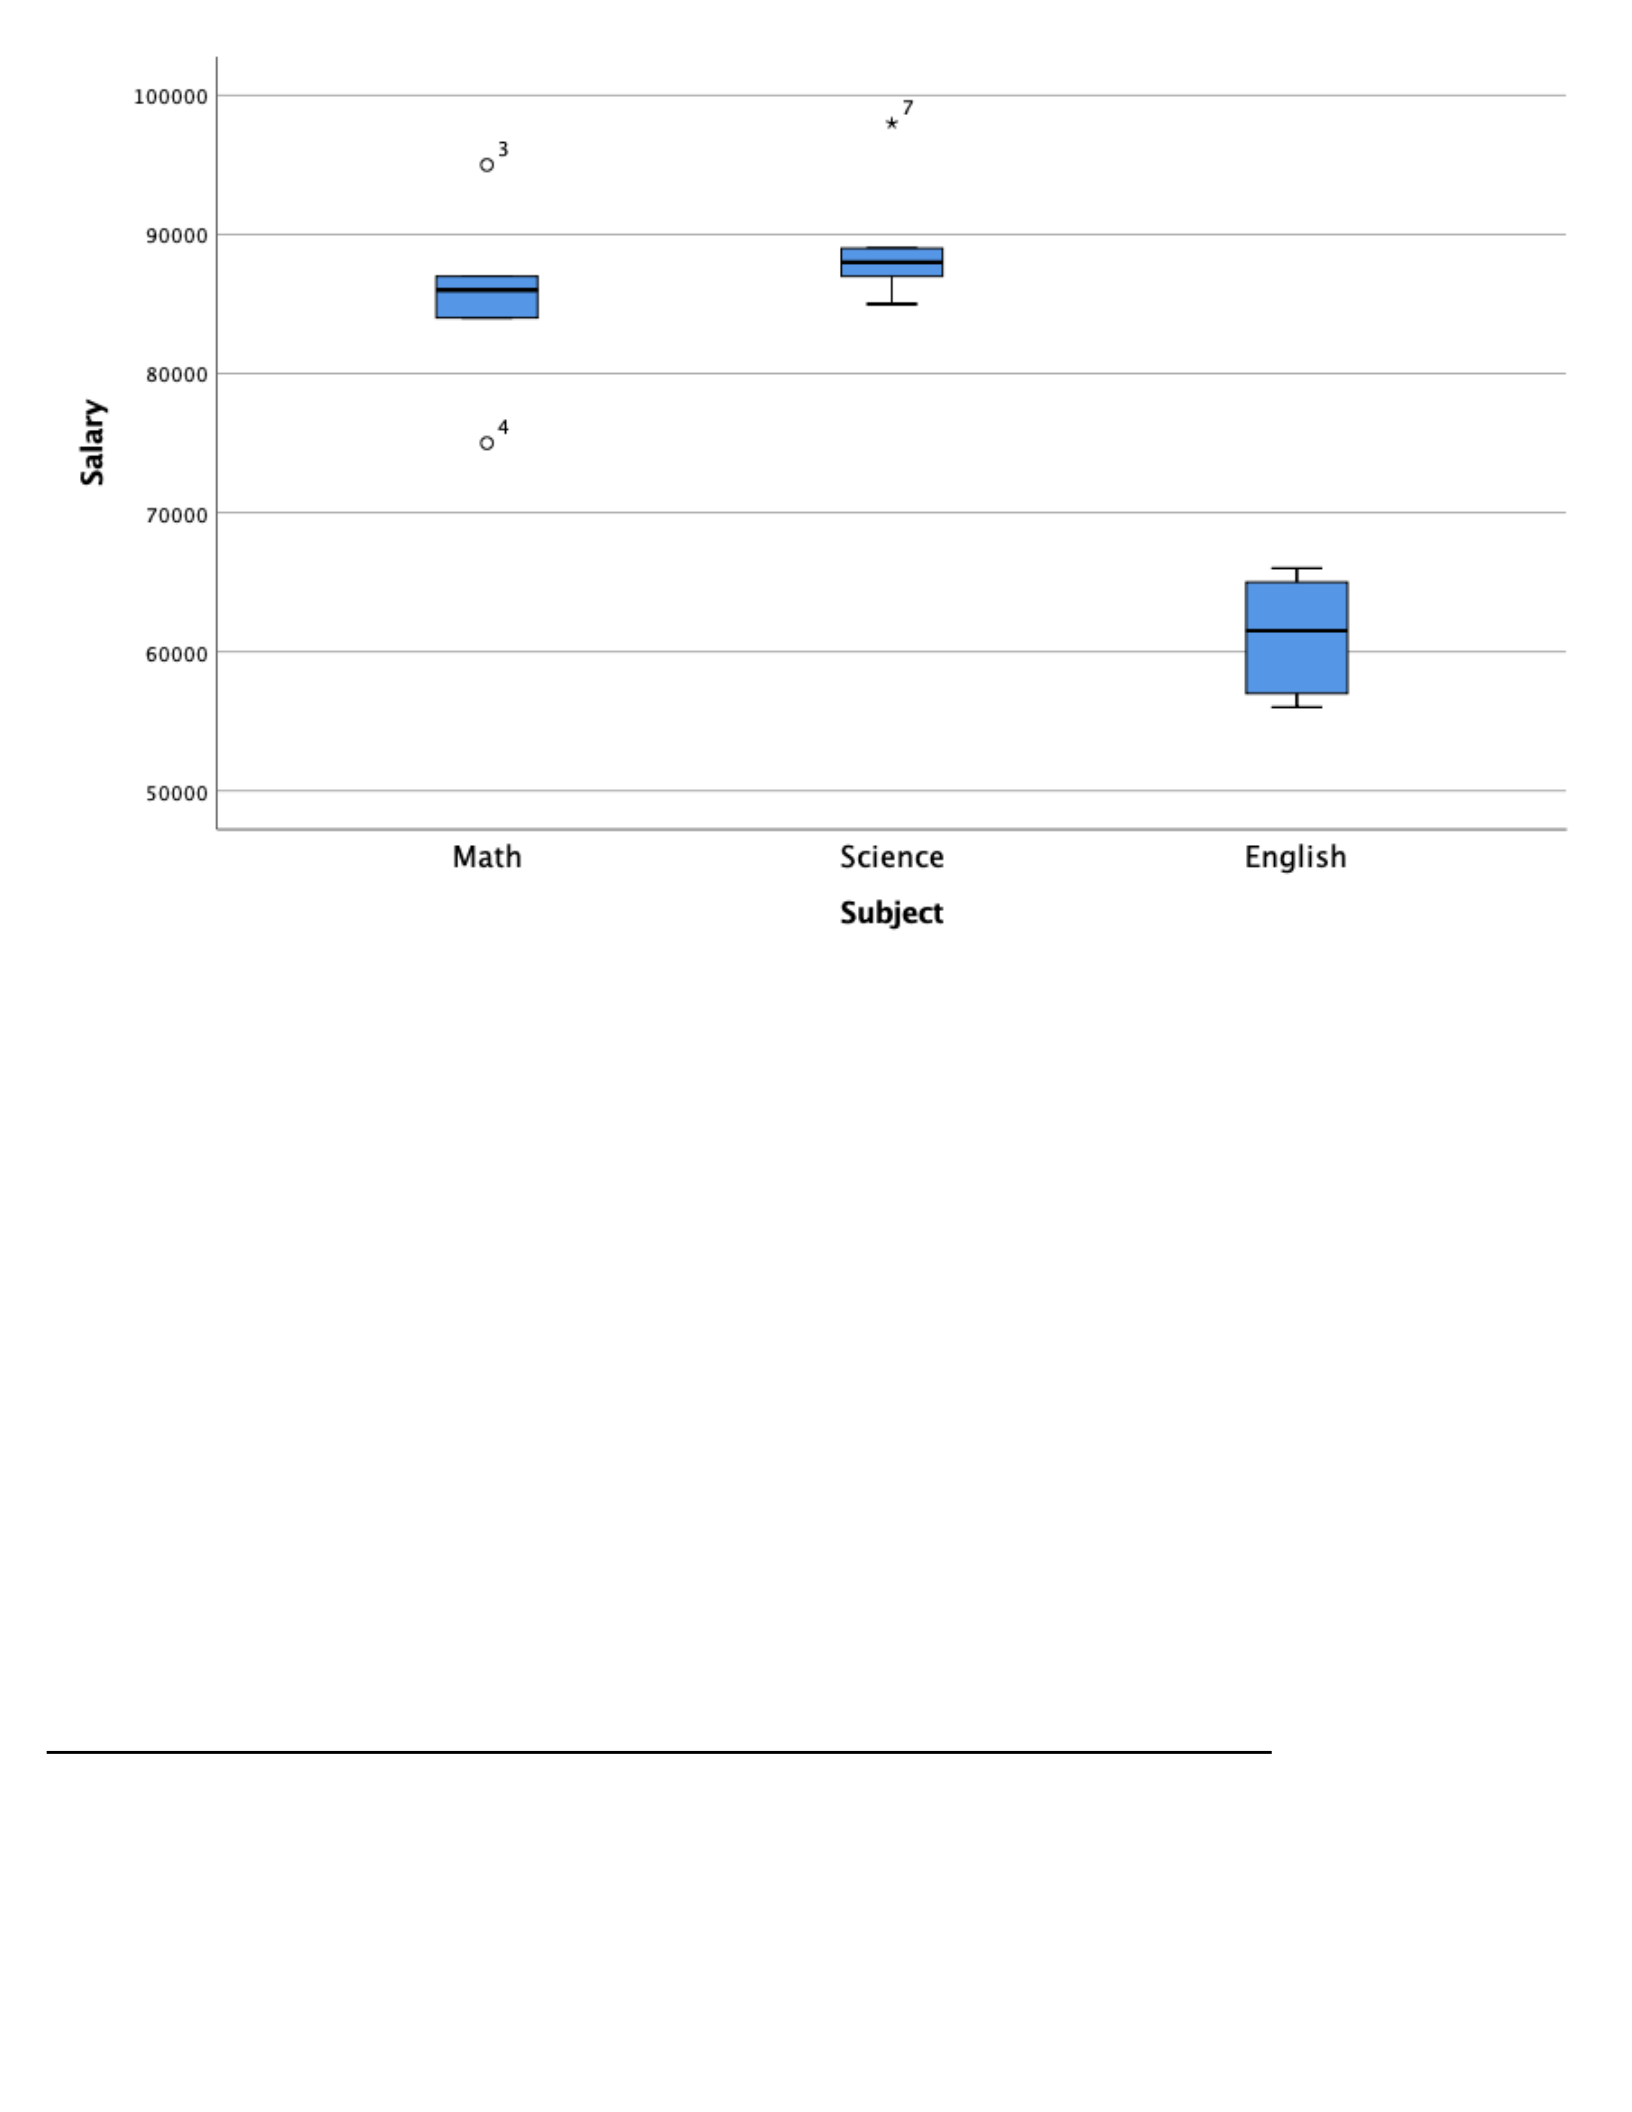
EXAMINE VARIABLES=Salary BY Subject
/PLOT BOXPLOT NPPLOT
/COMPARE GROUPS
/STATISTICS DESCRIPTIVES
/CINTERVAL 95

/MISSING LISTWISE
/NOTOTAL.
Explore
Notes
Output Created 27-SEP-2020
15:16:46
Comments
Input Active Dataset DataSet2
Filter <none>
Weight <none>
Split File <none>
N of Rows in
Working Data File
18
Missing Value
Handling
Definition of Missing User-defined
missing values for
dependent variables
are treated as
missing.
Cases Used Statistics are based
on cases with no
missing values for
any dependent
variable or factor
used.
Syntax EXAMINE
VARIABLES=Salary
BY Subject
/PLOT BOXPLOT
NPPLOT
/COMPARE
GROUPS
/STATISTICS
DESCRIPTIVES
/CINTERVAL 95
/MISSING
LISTWISE
/NOTOTAL.
Resources Processor Time 00:00:00.77
Elapsed Time 00:00:01.00
Subject
Case Processing Summary
Subject
Cases
Valid Missing Total
N Percent N Percent N Percent
Salary Math 6 100.0% 0 0.0% 6 100.0%
Science 6 100.0% 0 0.0% 6 100.0%
English 6 100.0% 0 0.0% 6 100.0%
Descriptives
Subject Statistic Std. Error
Salary Math Mean 85500.00 2629.956
95% Confidence
Interval for Mean
Lower Bound 78739.48
Upper Bound 92260.52
5% Trimmed Mean 85555.56
Median 86000.00

Variance 41500000.
000
Std. Deviation 6442.049
Minimum 75000
Maximum 95000
Range 20000
Interquartile Range 7250
Skewness -.333 .845
Kurtosis 2.007 1.741
Science Mean 89166.67 1851.426
95% Confidence
Interval for Mean
Lower Bound 84407.42
Upper Bound 93925.91
5% Trimmed Mean 88907.41
Median 88000.00
Variance 20566666.
667
Std. Deviation 4535.049
Minimum 85000
Maximum 98000
Range 13000
Interquartile Range 4750
Skewness 1.941 .845
Kurtosis 4.367 1.741
English Mean 61166.67 1887.091
95% Confidence
Interval for Mean
Lower Bound 56315.75
Upper Bound 66017.59
5% Trimmed Mean 61185.19
Median 61500.00
Variance 21366666.
667
Std. Deviation 4622.409
Minimum 56000
Maximum 66000
Range 10000
Interquartile Range 8500
Skewness -.050 .845
Kurtosis -3.042 1.741
Tests of Normality
Subject
Kolmogorov-SmirnovaShapiro-Wilk
Statistic df Sig. Statistic df Sig.
Salary Math .241 6 .200*.928 6 .566
Science .348 6 .022 .774 6 .034
English .297 6 .108 .808 6 .070
*. This is a lower bound of the true significance.
a. Lilliefors Significance Correction
Salary
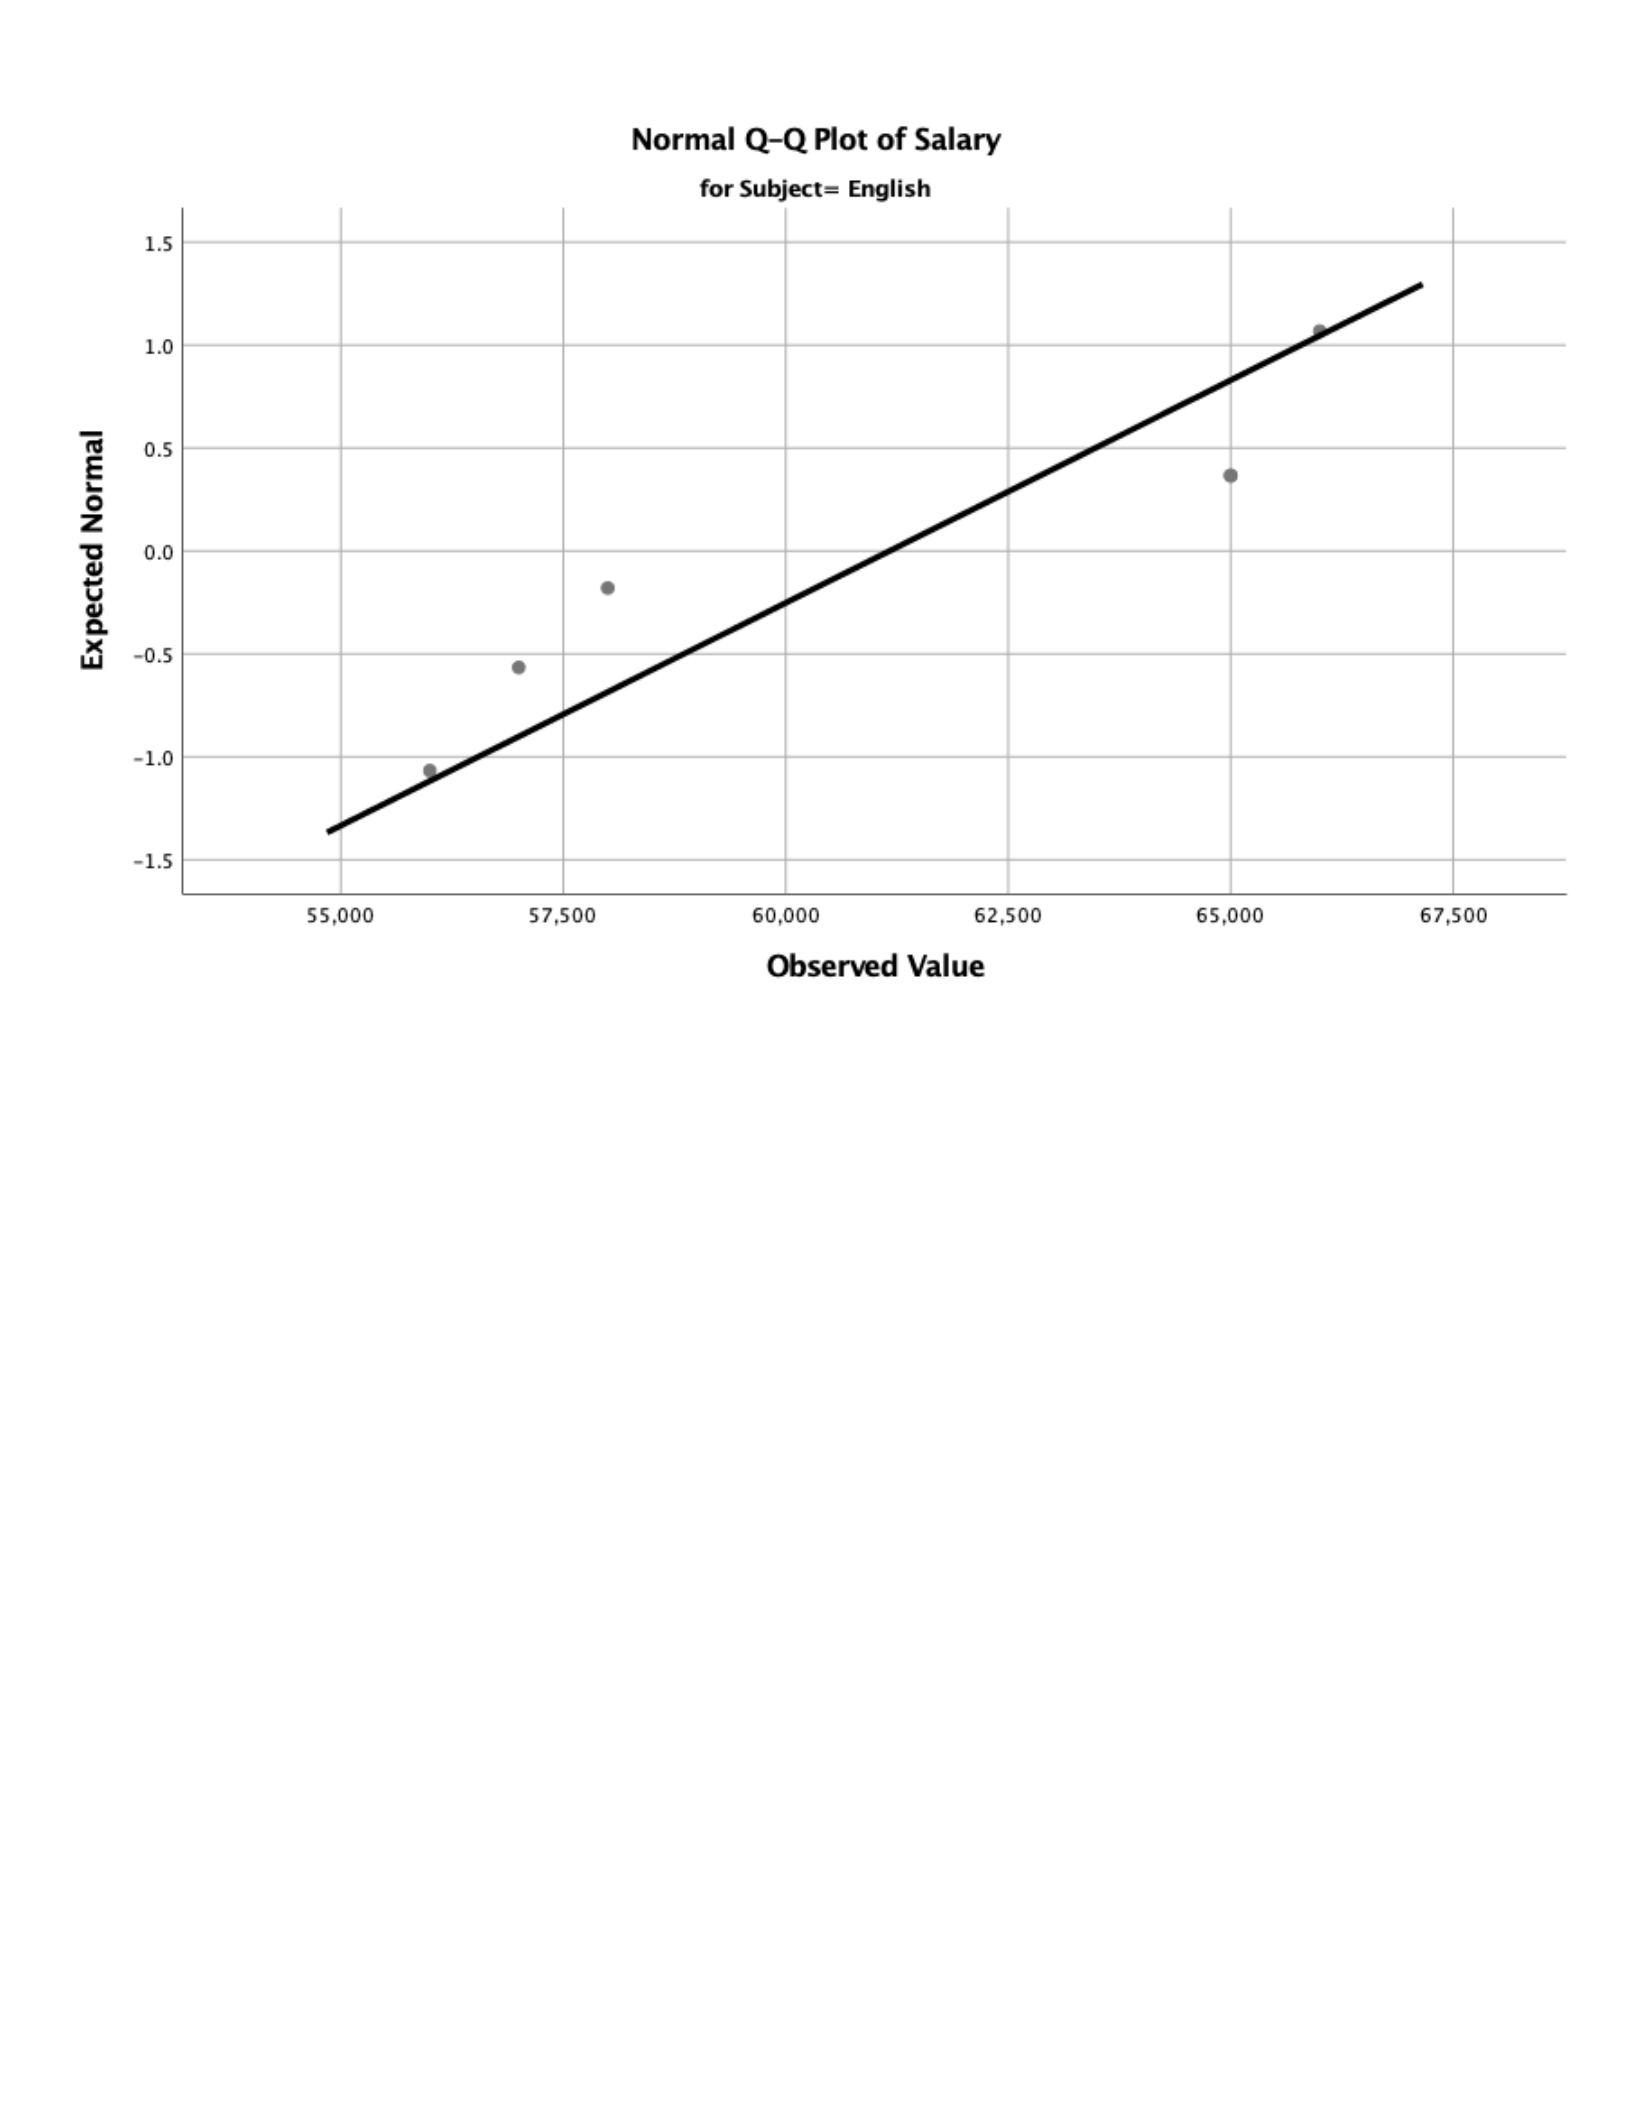
Normal Q-Q Plots
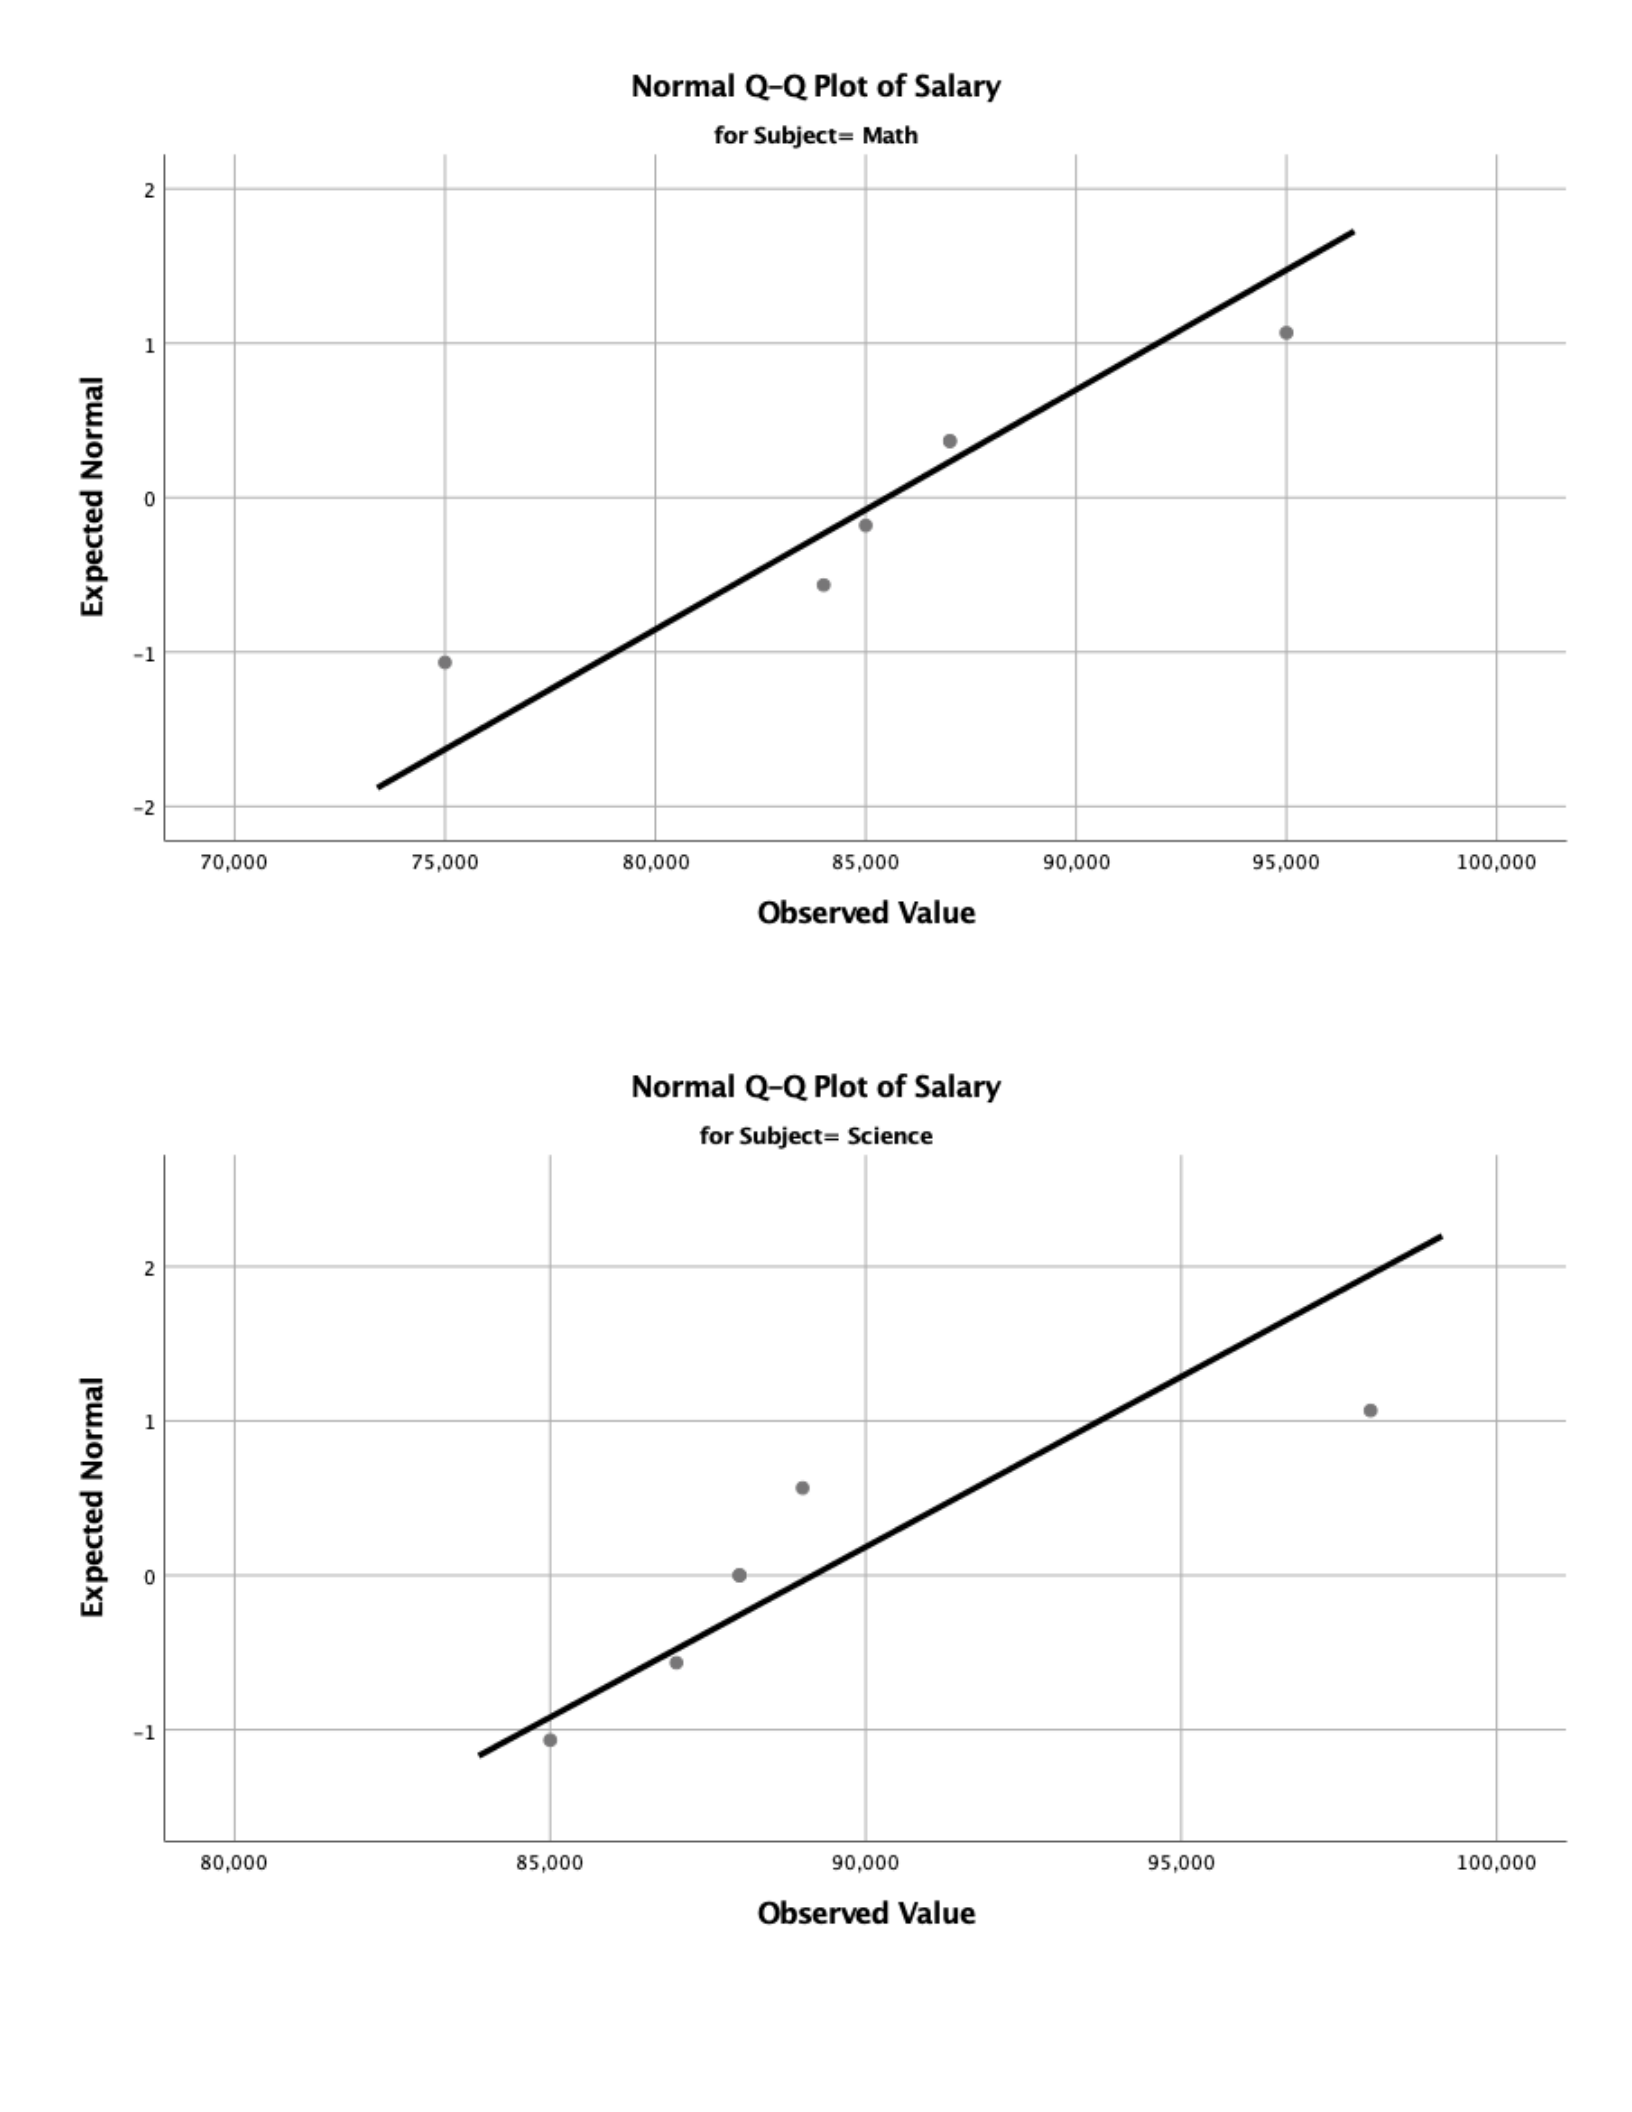
Expected
Normal
Expected
Normal
Normal
Q-Q
Plot
of
Salary
for
Subject=
Math
70,000 75,000 80,000 85,000
30.000
95,000
100,000
Observed
Value
Normal
Q-Q
Plot
of
Salary
for
Subject=
Science
80,000
85,000
90,000 95,000
100,000
Observed
Value
Detrended Normal Q-Q Plots
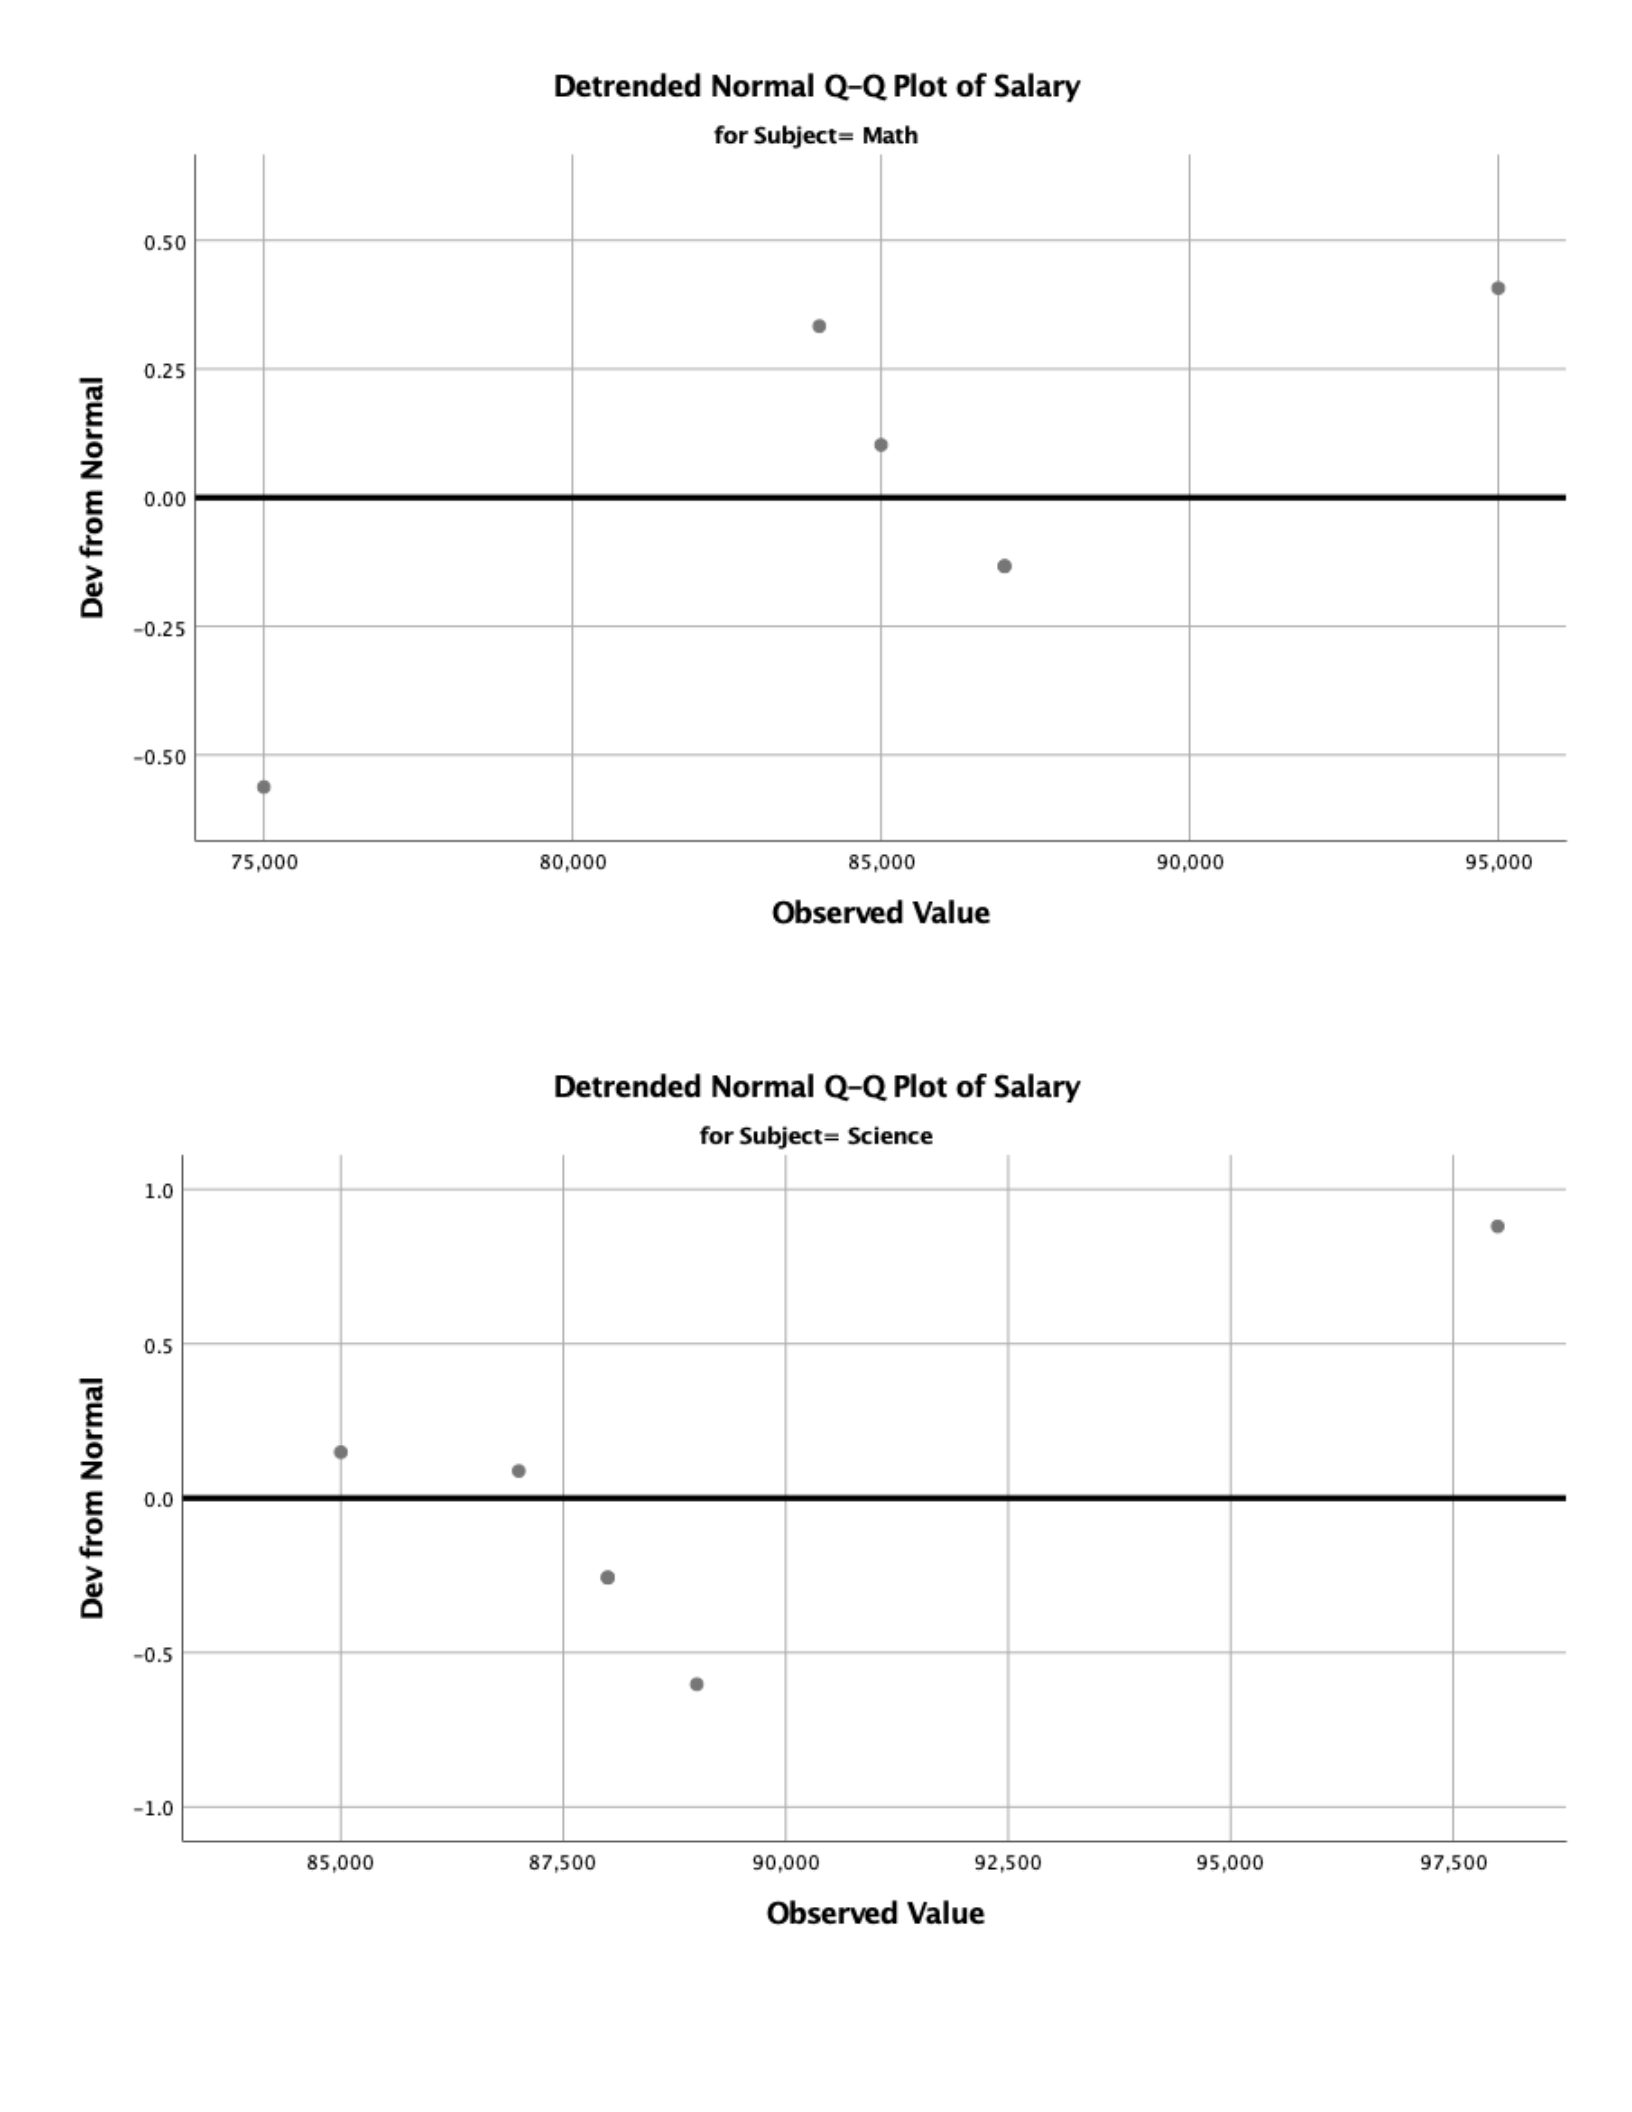
Dev
from
Normal
Dev
from
Normal
Detrended
Normal
Q-Q
Plot
of
Salary
for
Subject=
Math
0.50
:
.
0.25
:
0.00
.
-0.25
-0.50
:
75,000
80,000
85,000 90,000 95,000
Observed
Value
Detrended
Normal
Q-Q
Plot
of
Salary
for
Subject=
Science
10 .
os
:
0.0
“05 .
-10
87500
90,000
92,500 95,000 97,50085,000
Observed
Value
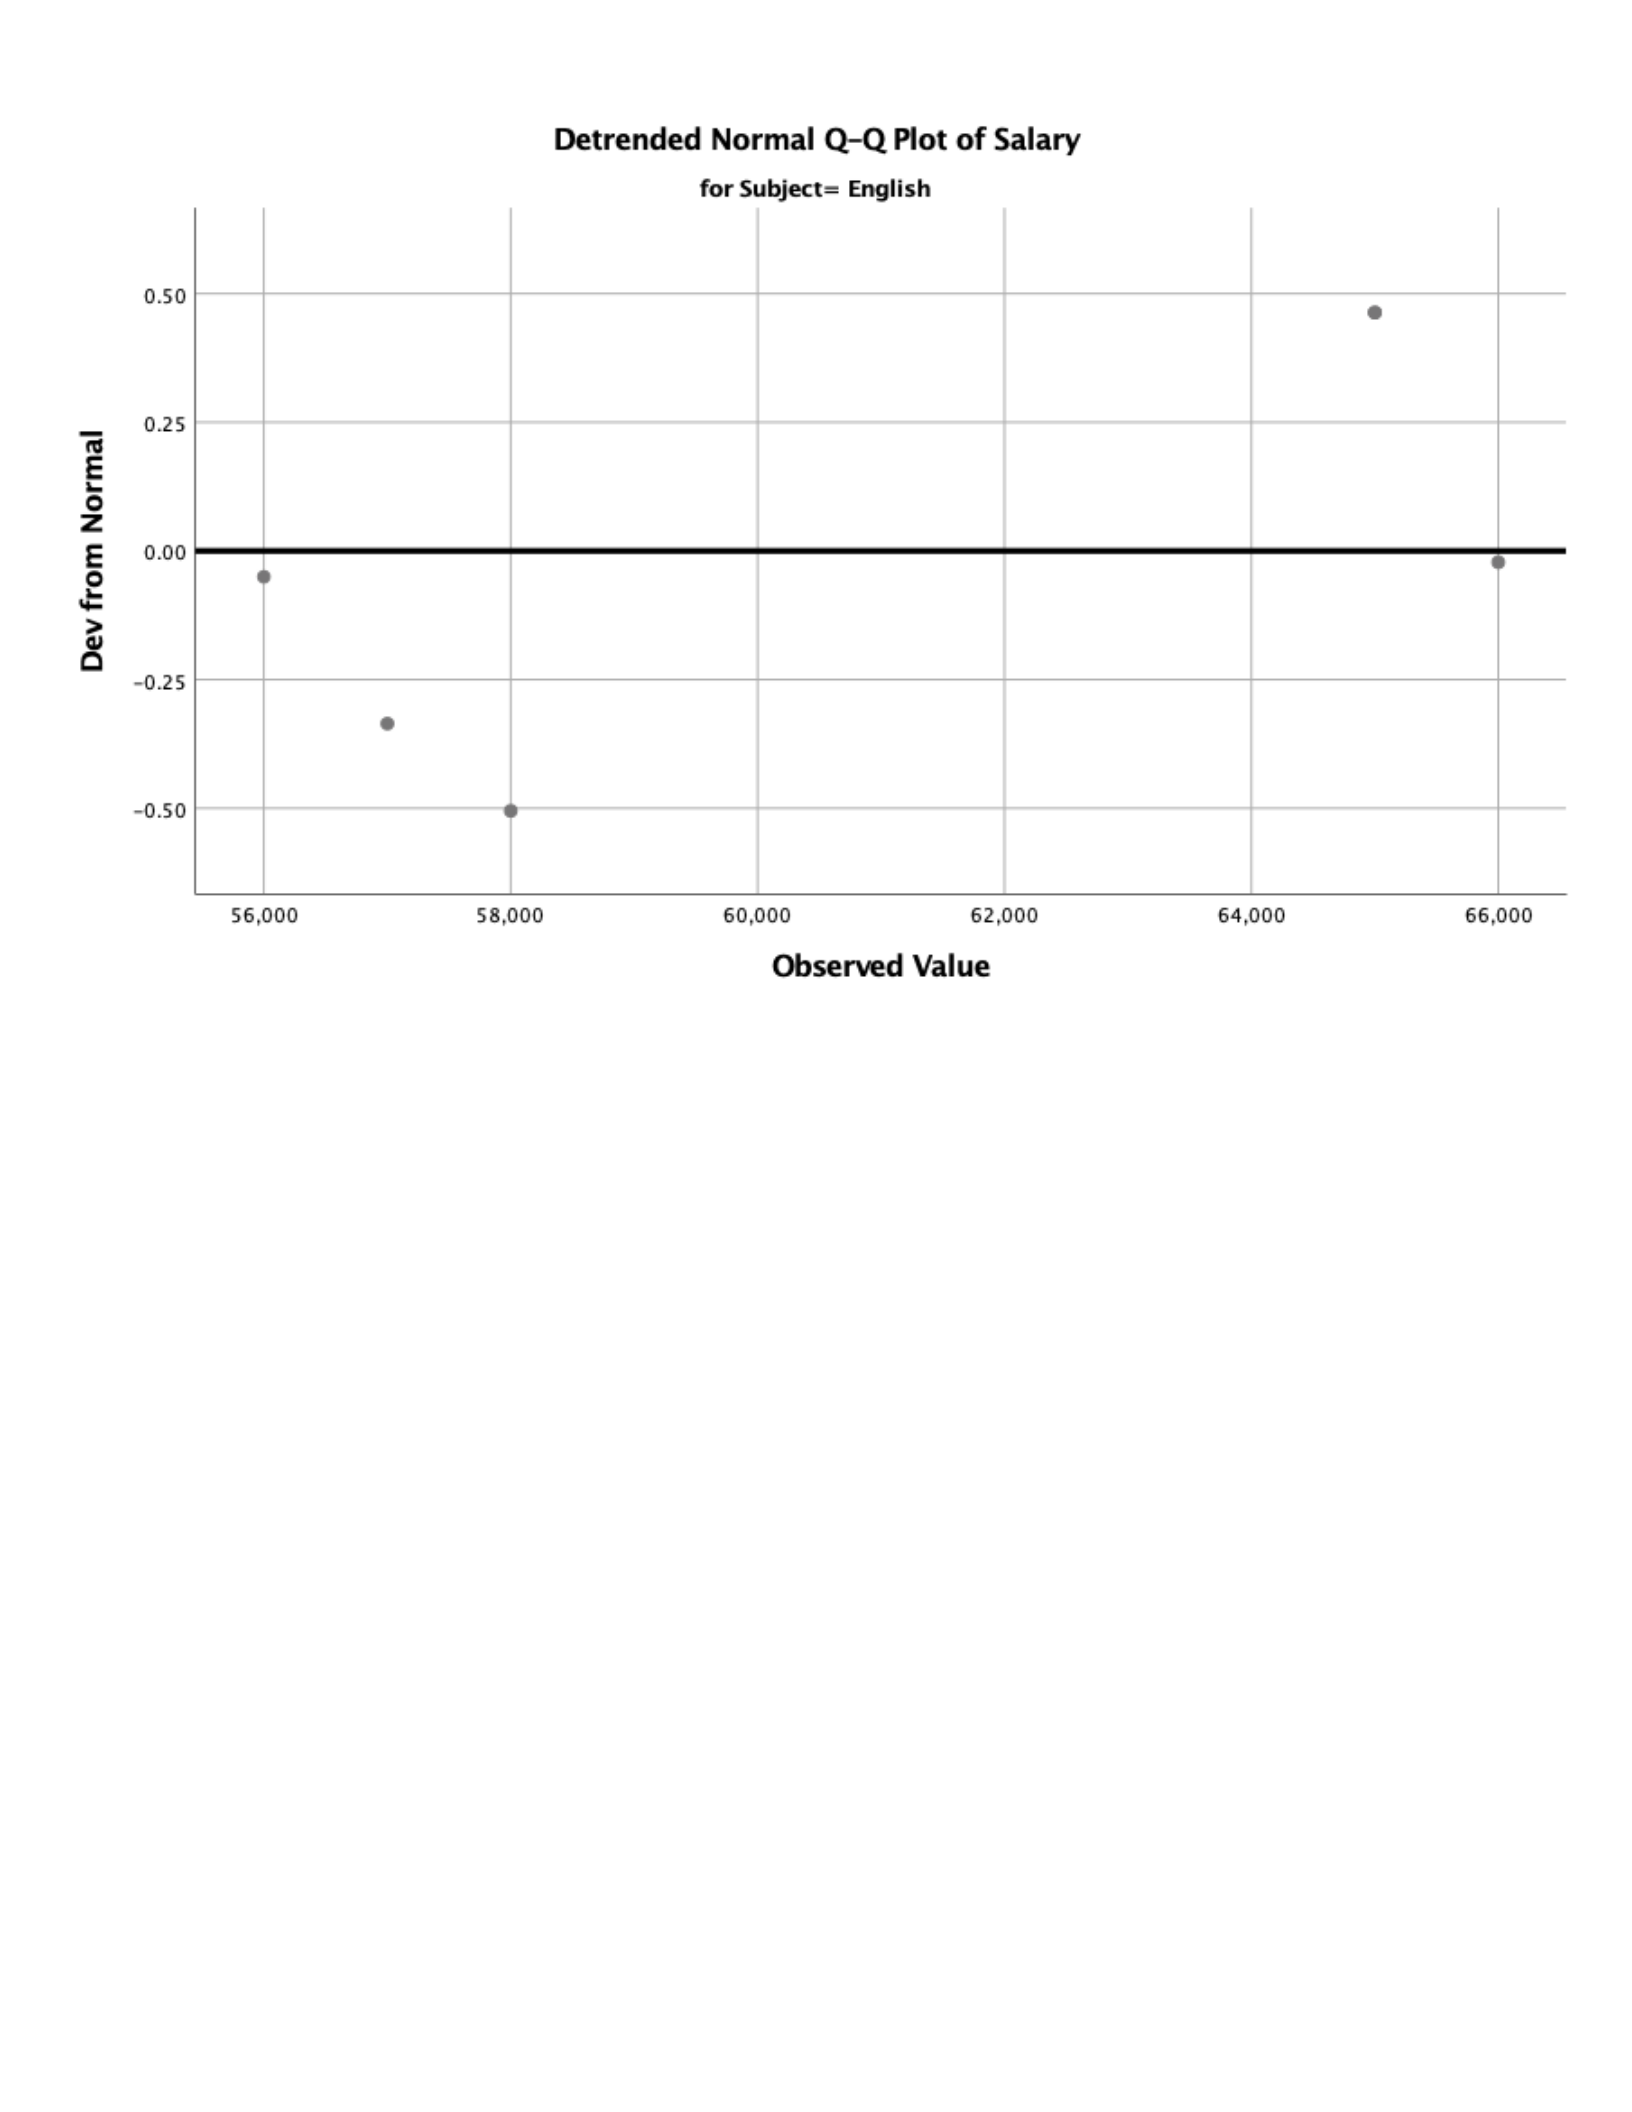
Dev
from
Normal
Detrended
Normal
Q-Q
Plot
of
Salary
for
Subject=
English
0.50
e
0.25
0.00
=
¢
-0.25
.
-0.50
*
56,000
58,000 60,000 62,000 64,000 66,000
Observed
Value
UNIANOVA Salary BY Subject
/METHOD=SSTYPE(3)
/INTERCEPT=INCLUDE
/PRINT HOMOGENEITY
/CRITERIA=ALPHA(.05)
/DESIGN=Subject.
Univariate Analysis of Variance
Notes
Output Created 27-SEP-2020
15:20:18
Comments
Input Active Dataset DataSet2
Filter <none>

Weight <none>
Split File <none>
N of Rows in
Working Data File
18
Missing Value
Handling
Definition of Missing User-defined
missing values are
treated as missing.
Cases Used Statistics are based
on all cases with
valid data for all
variables in the
model.
Syntax UNIANOVA Salary
BY Subject
/METHOD=SSTYPE
(3)
/INTERCEPT=INCL
UDE
/PRINT
HOMOGENEITY
/CRITERIA=ALPHA(
.05)
/DESIGN=Subject.
Resources Processor Time 00:00:00.00
Elapsed Time 00:00:00.00
Between-Subjects Factors
Value Label N
Subject 1 Math 6
2 Science 6
3 English 6
Levene's Test of Equality of Error Variancesa,b

Levene
Statistic df1 df2 Sig.
Salary Based on Mean .286 2 15 .755
Based on Median .459 2 15 .641
Based on Median
and with adjusted df
.459 2 10.060 .645
Based on trimmed
mean
.344 2 15 .714
Tests the null hypothesis that the error variance of the dependent
variable is equal across groups.a,b
a. Dependent variable: Salary
b. Design: Intercept + Subject
Tests of Between-Subjects Effects
Dependent Variable: Salary
Source
Type III
Sum of
Squares df
Mean
Square F Sig.
Corrected Model 277911111
1.111a
2 138955555
5.556
49.964 .000
Intercept 111234722
222.222
1 111234722
222.222
3999.650 .000
Subject 277911111
1.111
2 138955555
5.556
49.964 .000
Error 417166666.
667
15 27811111.1
11
Total 114431000
000.000
18
Corrected Total 319627777
7.778
17
a. R Squared = .869 (Adjusted R Squared = .852)
UNIANOVA Salary BY Subject
/METHOD=SSTYPE(3)
/INTERCEPT=INCLUDE
/PRINT ETASQ
/CRITERIA=ALPHA(.05)

/DESIGN=Subject.
Univariate Analysis of Variance
Notes
Output Created 27-SEP-2020
15:24:14
Comments
Input Active Dataset DataSet2
Filter <none>
Weight <none>
Split File <none>
N of Rows in
Working Data File
18
Missing Value
Handling
Definition of Missing User-defined
missing values are
treated as missing.
Cases Used Statistics are based
on all cases with
valid data for all
variables in the
model.

Syntax UNIANOVA Salary
BY Subject
/METHOD=SSTYPE
(3)
/INTERCEPT=INCL
UDE
/PRINT ETASQ
/CRITERIA=ALPHA(
.05)
/DESIGN=Subject.
Resources Processor Time 00:00:00.01
Elapsed Time 00:00:00.00
Between-Subjects Factors
Value Label N
Subject 1 Math 6
2 Science 6
3 English 6
Tests of Between-Subjects Effects
Dependent Variable: Salary
Source
Type III
Sum of
Squares df
Mean
Square F Sig.
Partial Eta
Squared
Corrected Model 27791111
11.111a
2 13895555
55.556
49.964 .000 .869
Intercept 11123472
2222.222
1 11123472
2222.222
3999.650 .000 .996
Subject 27791111
11.111
2 13895555
55.556
49.964 .000 .869
Error 41716666
6.667
15 27811111.
111
Total 11443100
0000.000
18

Corrected Total 31962777
77.778
17
a. R Squared = .869 (Adjusted R Squared = .852)
UNIANOVA Salary BY Subject
/METHOD=SSTYPE(3)
/INTERCEPT=INCLUDE
/POSTHOC=Subject(TUKEY)
/PRINT ETASQ
/CRITERIA=ALPHA(.05)
/DESIGN=Subject.
Univariate Analysis of Variance
Notes
Output Created 27-SEP-2020
15:32:33
Comments
Input Active Dataset DataSet2
Filter <none>
Weight <none>
Split File <none>
N of Rows in
Working Data File
18
Missing Value
Handling
Definition of Missing User-defined
missing values are
treated as missing.
Cases Used Statistics are based
on all cases with
valid data for all
variables in the
model.
Syntax UNIANOVA Salary
BY Subject
/METHOD=SSTYPE
(3)
/INTERCEPT=INCL
UDE
/POSTHOC=Subject
(TUKEY)
/PRINT ETASQ
/CRITERIA=ALPHA(
.05)
/DESIGN=Subject.
Resources Processor Time 00:00:00.01
Elapsed Time 00:00:00.00
Between-Subjects Factors
Value Label N
Subject 1 Math 6
2 Science 6
3 English 6
Tests of Between-Subjects Effects
Dependent Variable: Salary
Source
Type III
Sum of
Squares df
Mean
Square F Sig.
Partial Eta
Squared
Corrected Model 27791111
11.111a
2 13895555
55.556
49.964 .000 .869
Intercept 11123472
2222.222
1 11123472
2222.222
3999.650 .000 .996
Subject 27791111
11.111
2 13895555
55.556
49.964 .000 .869
Error 41716666
6.667
15 27811111.
111
Total 11443100
0000.000
18
Corrected Total 31962777
77.778
17
a. R Squared = .869 (Adjusted R Squared = .852)
Post Hoc Tests
Subject
Multiple Comparisons
Dependent Variable: Salary
Tukey HSD
(I) Subject (J) Subject
Mean
Difference
(I-J) Std. Error Sig.
95% Confidence
Interval
Lower
Bound
Upper
Bound
Math Science -3666.67 3044.728 .469 -11575.26 4241.92
English 24333.33*3044.728 .000 16424.74 32241.92
Science Math 3666.67 3044.728 .469 -4241.92 11575.26
English 28000.00*3044.728 .000 20091.41 35908.59
English Math -24333.33*3044.728 .000 -32241.92 -16424.74
Science -28000.00*3044.728 .000 -35908.59 -20091.41
Based on observed means.
The error term is Mean Square(Error) = 27811111.111.
*. The mean difference is significant at the

Homogeneous Subsets
Salary
Tukey HSDa,b
Subject N
Subset
1 2
English 6 61166.67
Math 6 85500.00
Science 6 89166.67
Sig. 1.000 .469
Means for groups in homogeneous subsets
are displayed.
Based on observed means.
The error term is Mean Square(Error) =
27811111.111.
a. Uses Harmonic Mean Sample Size =
6.000.
b. Alpha =

