


1
Mathematics Strand Project
Abby Rayner
School of Education, Liberty University
EDUC 323: Teaching Elementary and Middle School Mathematics
Professor Brevard
May 6th, 2024

2
Abstract
This mathematic strand project is centered around 2nd grade SOL 2.15 on Probability and
Statistics. Activities in the project will focus on helping students interpret and represent data on
bar graphs and pictographs. Teaching students to interpret and represent data on different graphs
is taught in different ways to reach students of different learning styles as well as integrating it
into science. Students will practice making grass from given data and interpreting what it means
in many ways during this strand. This project has many activities, assessments and note taking,
devices that support student growth and knowledge and interpreting and representing data on
graphs.
Video link for STRAND Project: URL for video listed here

3
Mathematics Strand Project
Grade Level: 2nd
Topic: Probability and statistics
SOL: 2.15 The student will a) collect, organize, and represent data in pictographs and bar
graphs; and b) read and interpret data represented in pictographs and bar graphs.
Essential questions: 1. How can we find data in everyday life? 2. How are the different types of
graphs the same/ how are they different? 3. What strategies can we use to find data and put it on
a bar graph?
Notetaking Device
VA Mathematics SOL: 2.15 The student will a) collect, organize, and represent data in
pictographs and bar graphs; and b) read and interpret data represented in pictographs and bar
graphs.
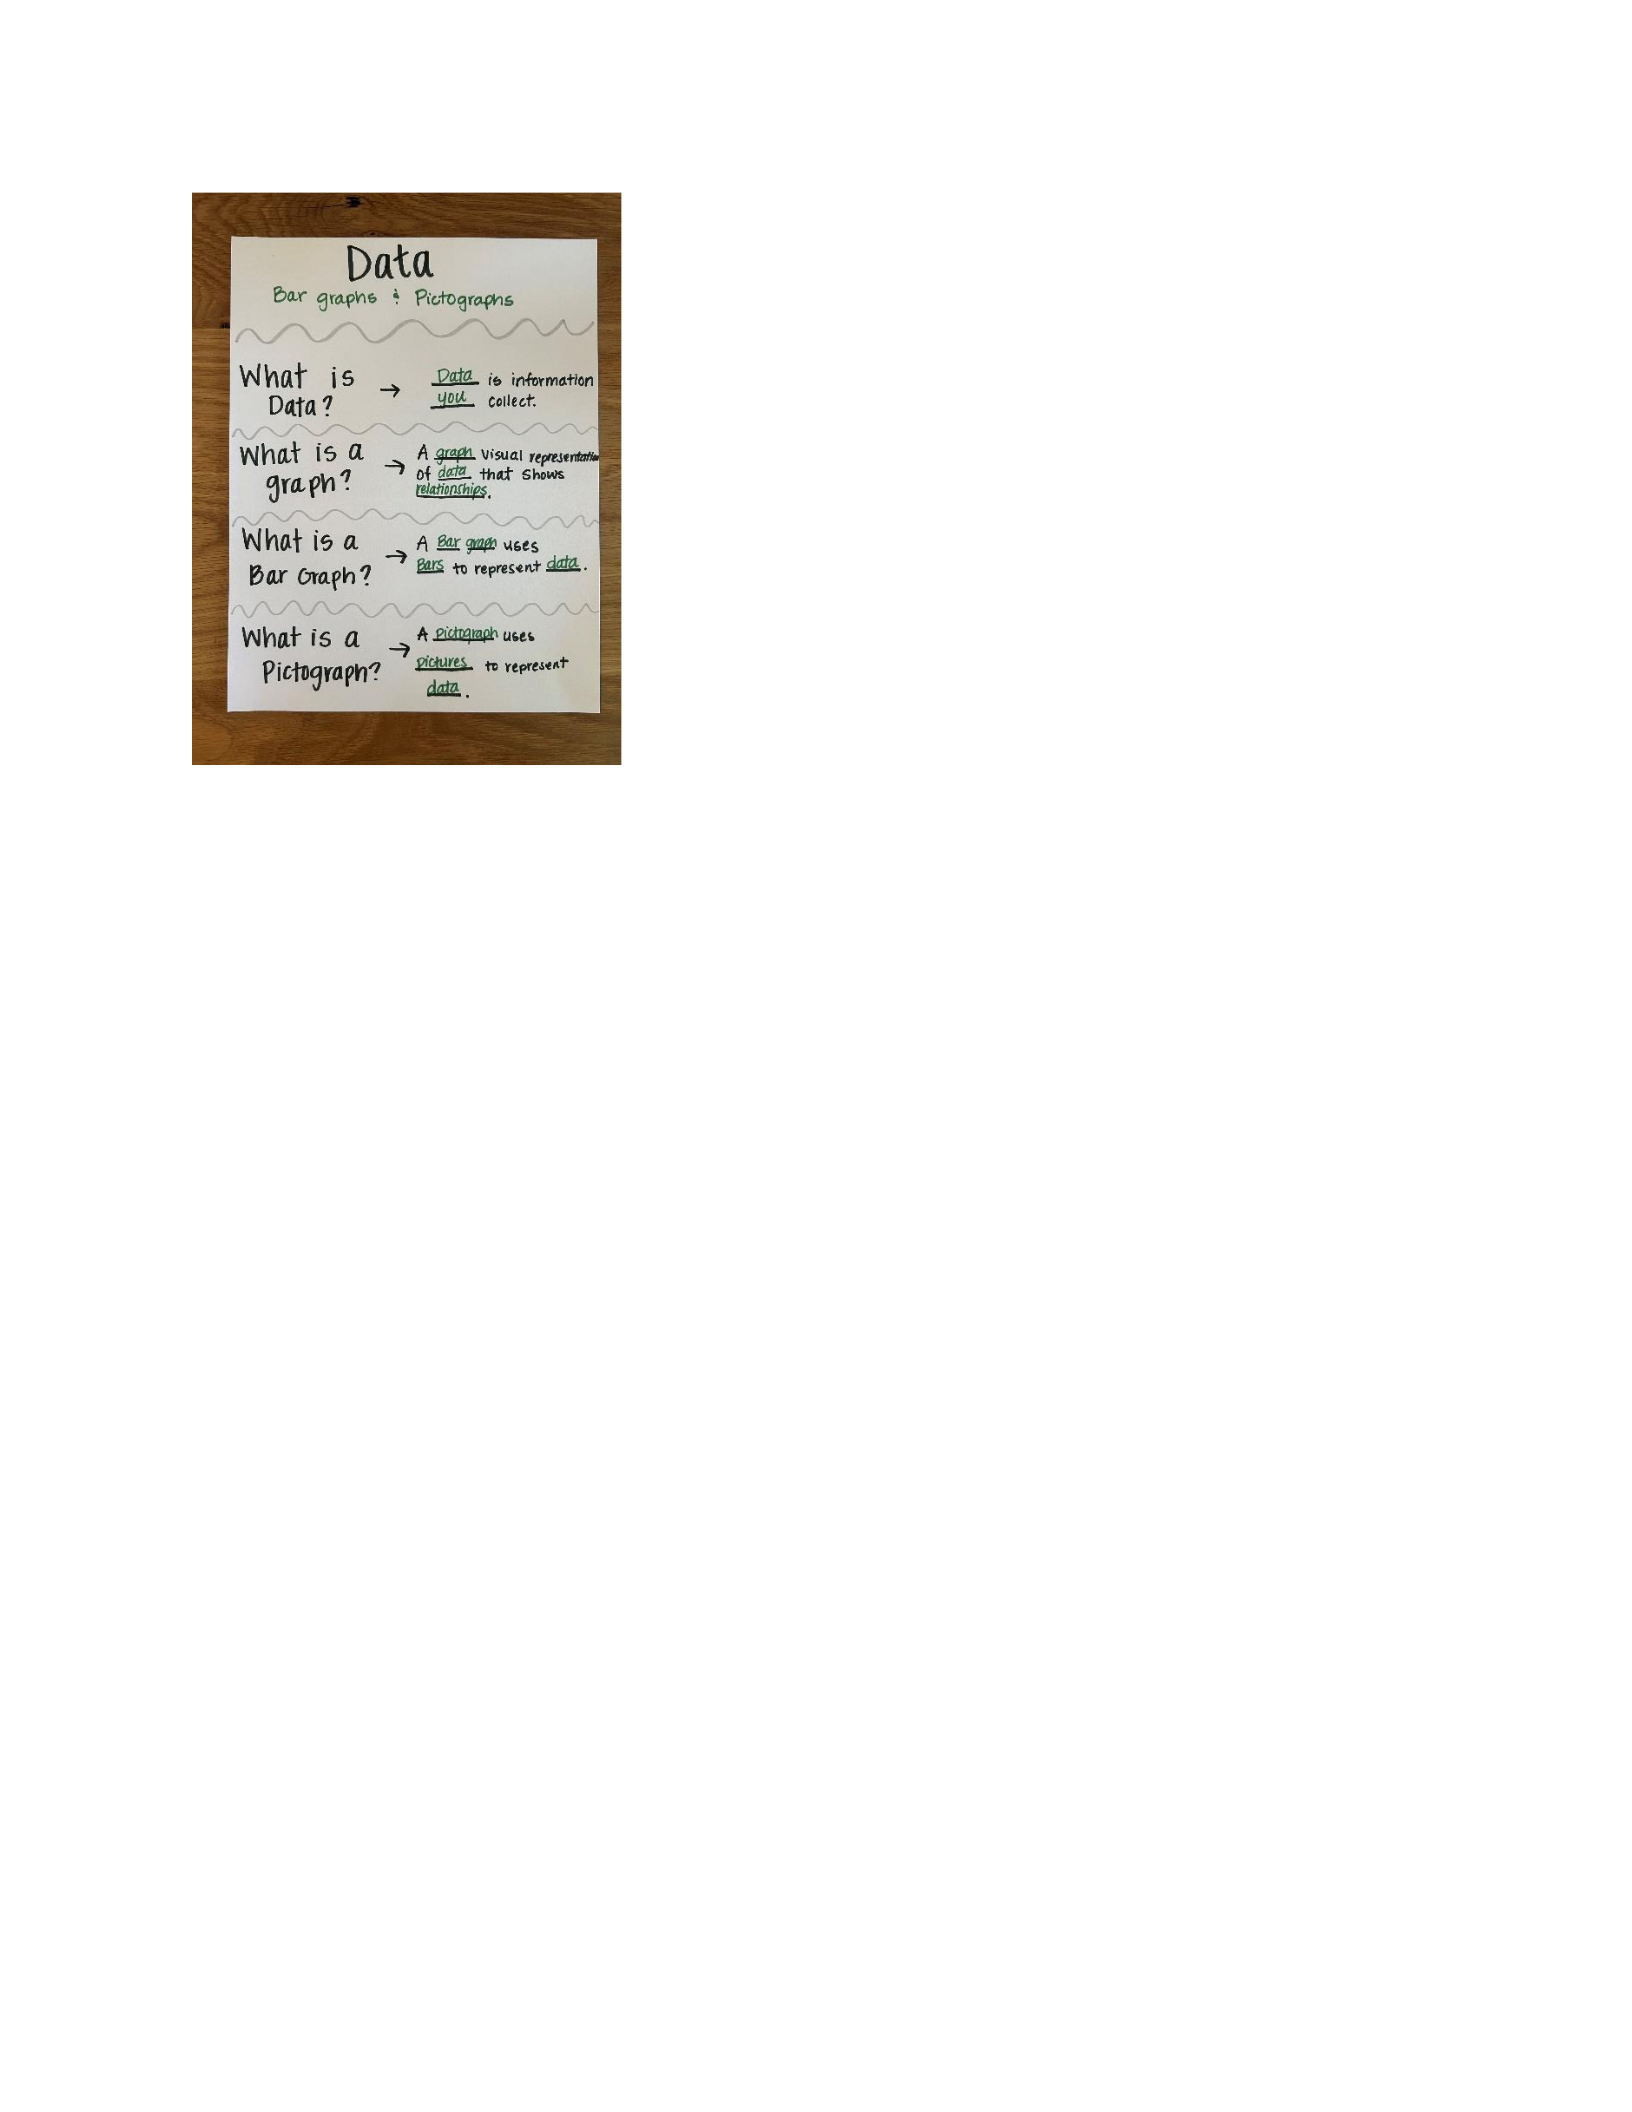
Graphic Organizer: A graphic organizer will be made for students to understand how to read and
interpret data from a bar or pictograph. Students will start with what is data, what is a graph?
And then move on to learning what a bar graph and a pictograph are. Students will fill in the
blanks as we go.
Example:
4
Science Activity
VA Science SOL: 2.6 The student will investigate and understand that there are different types of
weather on Earth. Key ideas include a) different types of weather have specific characteristics; b)
measuring, recording, and interpreting weather data allows for identification of weather patterns;
and c) tracking weather allows us to prepare for the weather and storms.
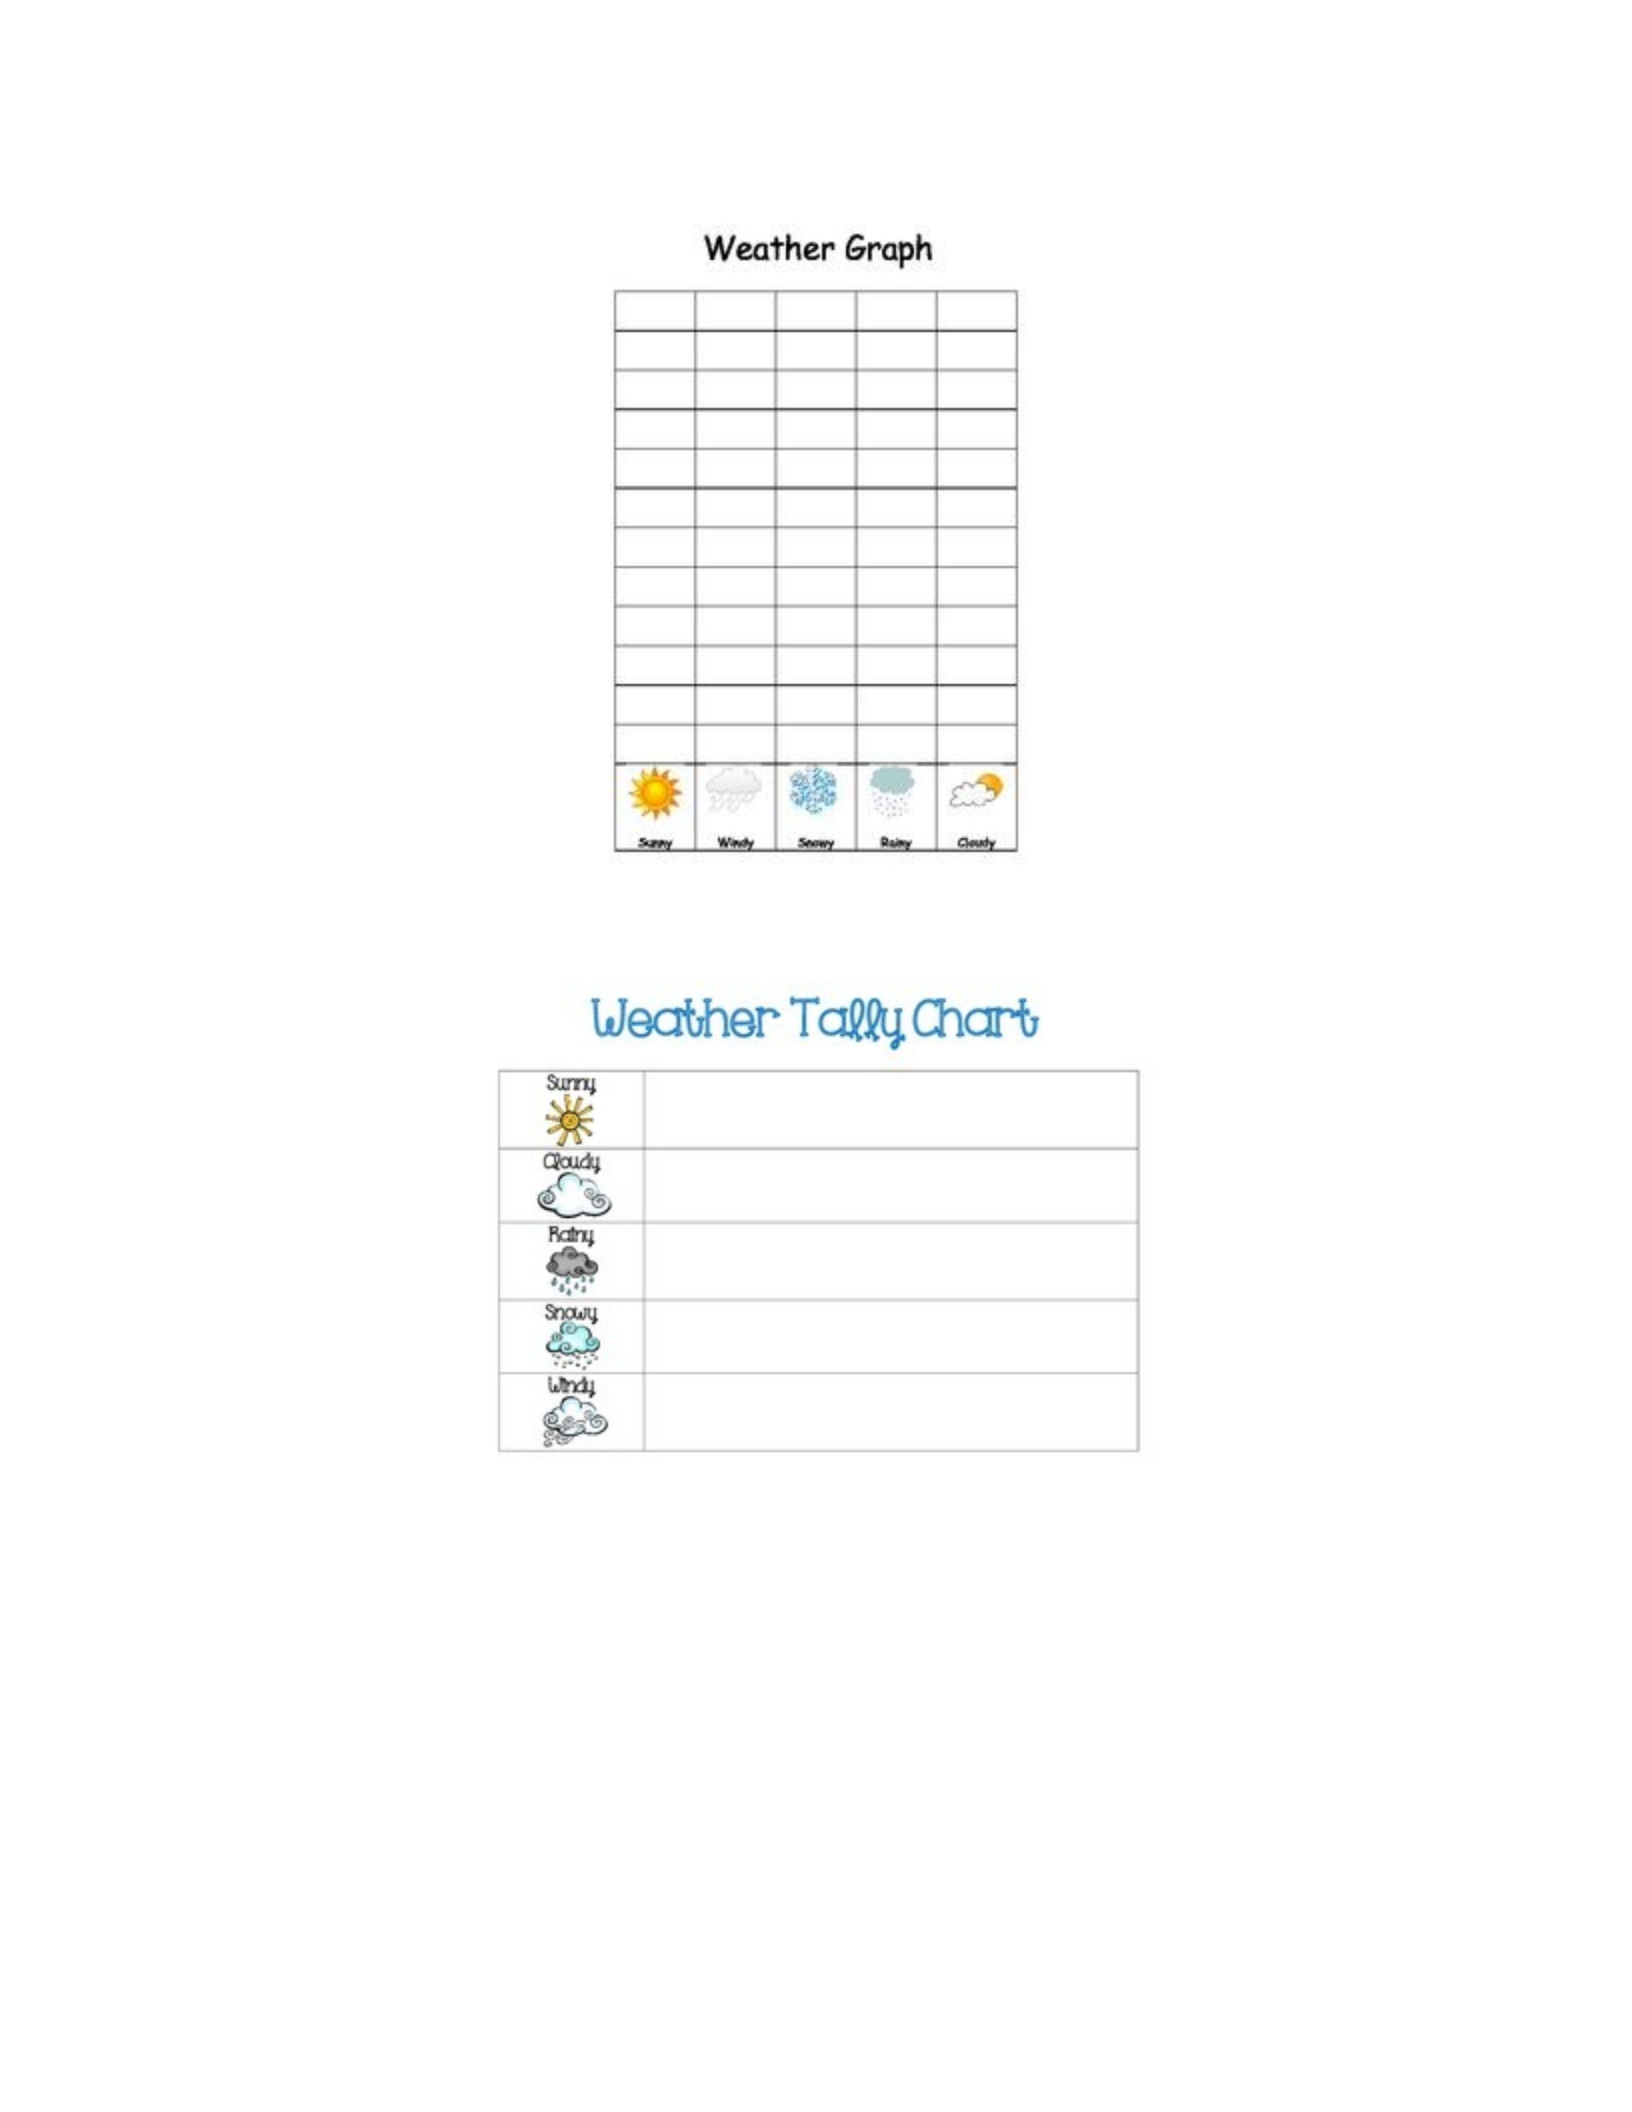
In Science, students will be learning about various types of weather. Students will keep
track of the weather over a set period of time. They will keep track of the weather as a class
using a tally chart and coloring in what the weather is like each day to create a bar graph. As a
class, we will choose different colors to represent the different types of weather. The materials
needed are the students’ eyes to look at the weather each day. They will need. Their thinking
caps. As a class we will need our bar graph that we are creating each day and our tally chart to
add to it, as well as the different colors that we are using for each type of weather. This activity
deals with gathering data and making a bar graph from that data, just as students are learning in
math.
Examples:
5
6
Math Tiered Activities
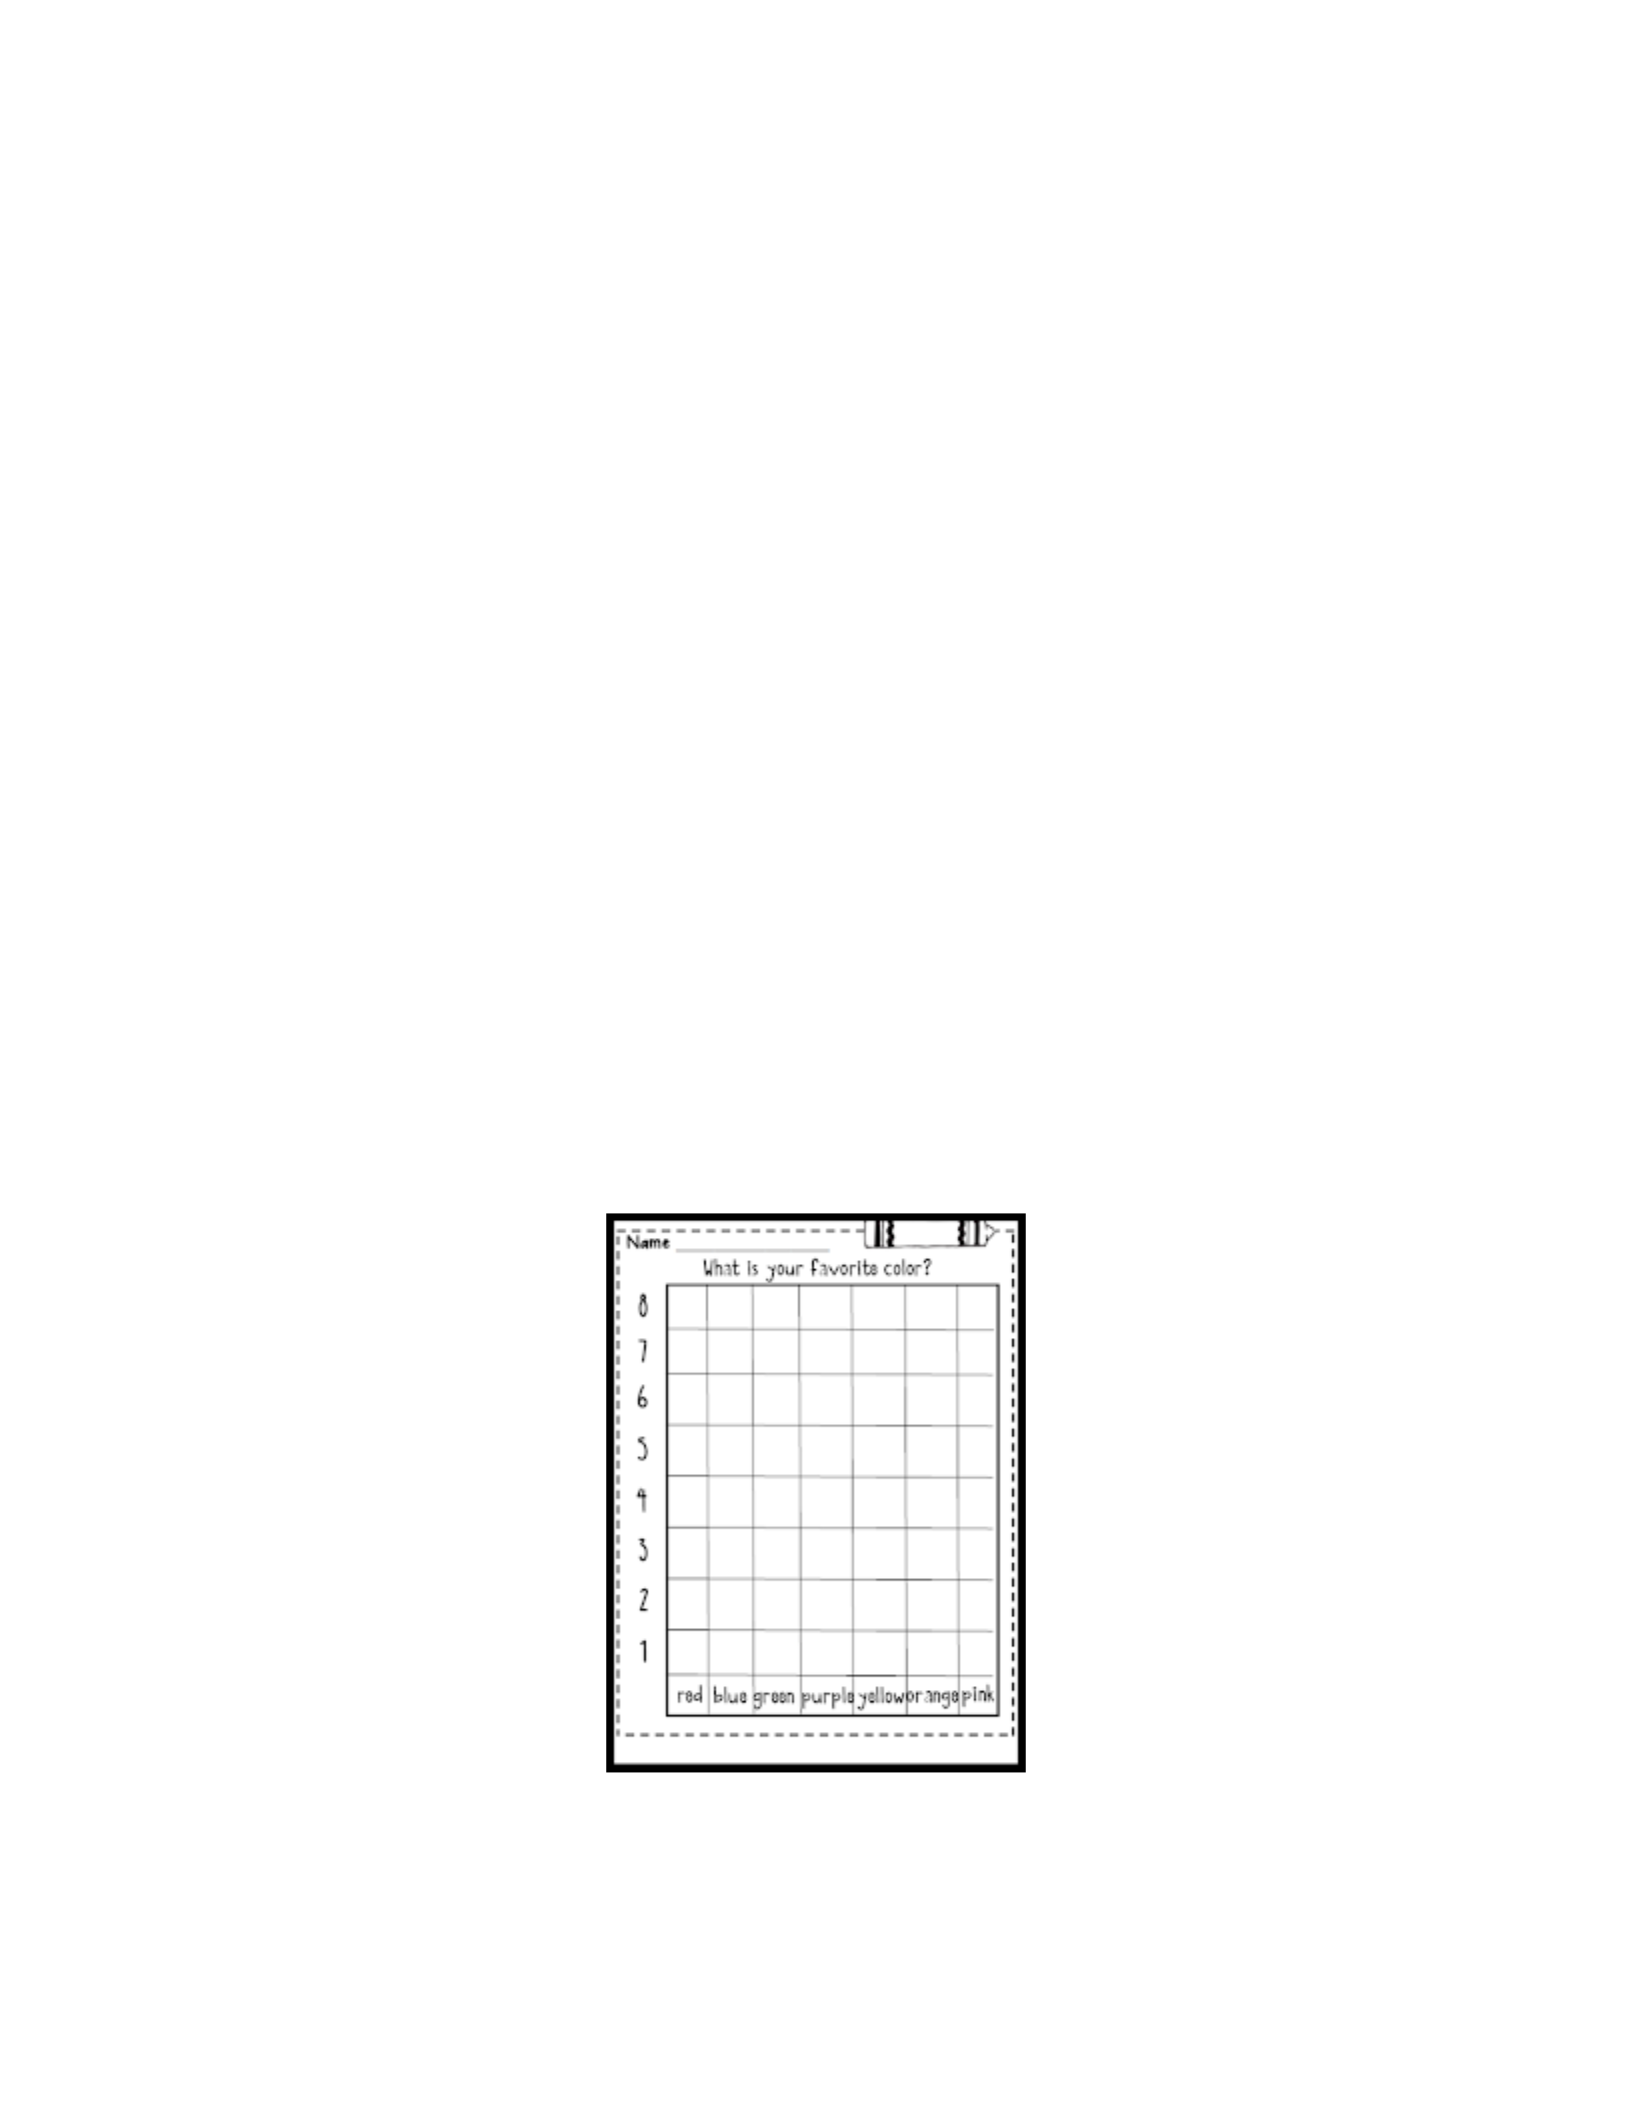
Group 1-below grade-level: For below-grade level students they will be making a bar
graph as a group. They will be basing their data and bar graph off of everyone’s favorite color.
As a group, we will create a tally chart together using the colors Pink, Green, Blue, Red, Yellow,
Purple, and black. Once the students have all cast their votes, we will begin to make our bar
graph. The teacher will ask the students how to make a bar graph. As a group, we'll work
together on the steps to make a bar graph and how to label the X&Y axis. Once our bar graph is
complete, we will then begin to count the tallies for each color. Once the tallies have been
counted, we will begin to draw our bars on our bar graph with the corresponding colors. After
our bar graph is complete the teacher can ask what the favorite color was or what was the least
favorite color. The teacher is also always making sure that the students know how and why they
got their answer.
Example:

7
Group 2-on grade level: For students who are on grade level, the teacher will have these
students create their own bar graph. Each student will have a different bag of manipulatives,
from beads to shapes to pompoms. Each bag will be different. Students will focus on how many
of each color are in the bag. Students will then need to count how much of each color
manipulative they have and record it. Once they have counted, they will need to create a bar
graph with their data. Students will have the option to make their own bar graph out of Legos
before drawing it in their notebook.
Example:
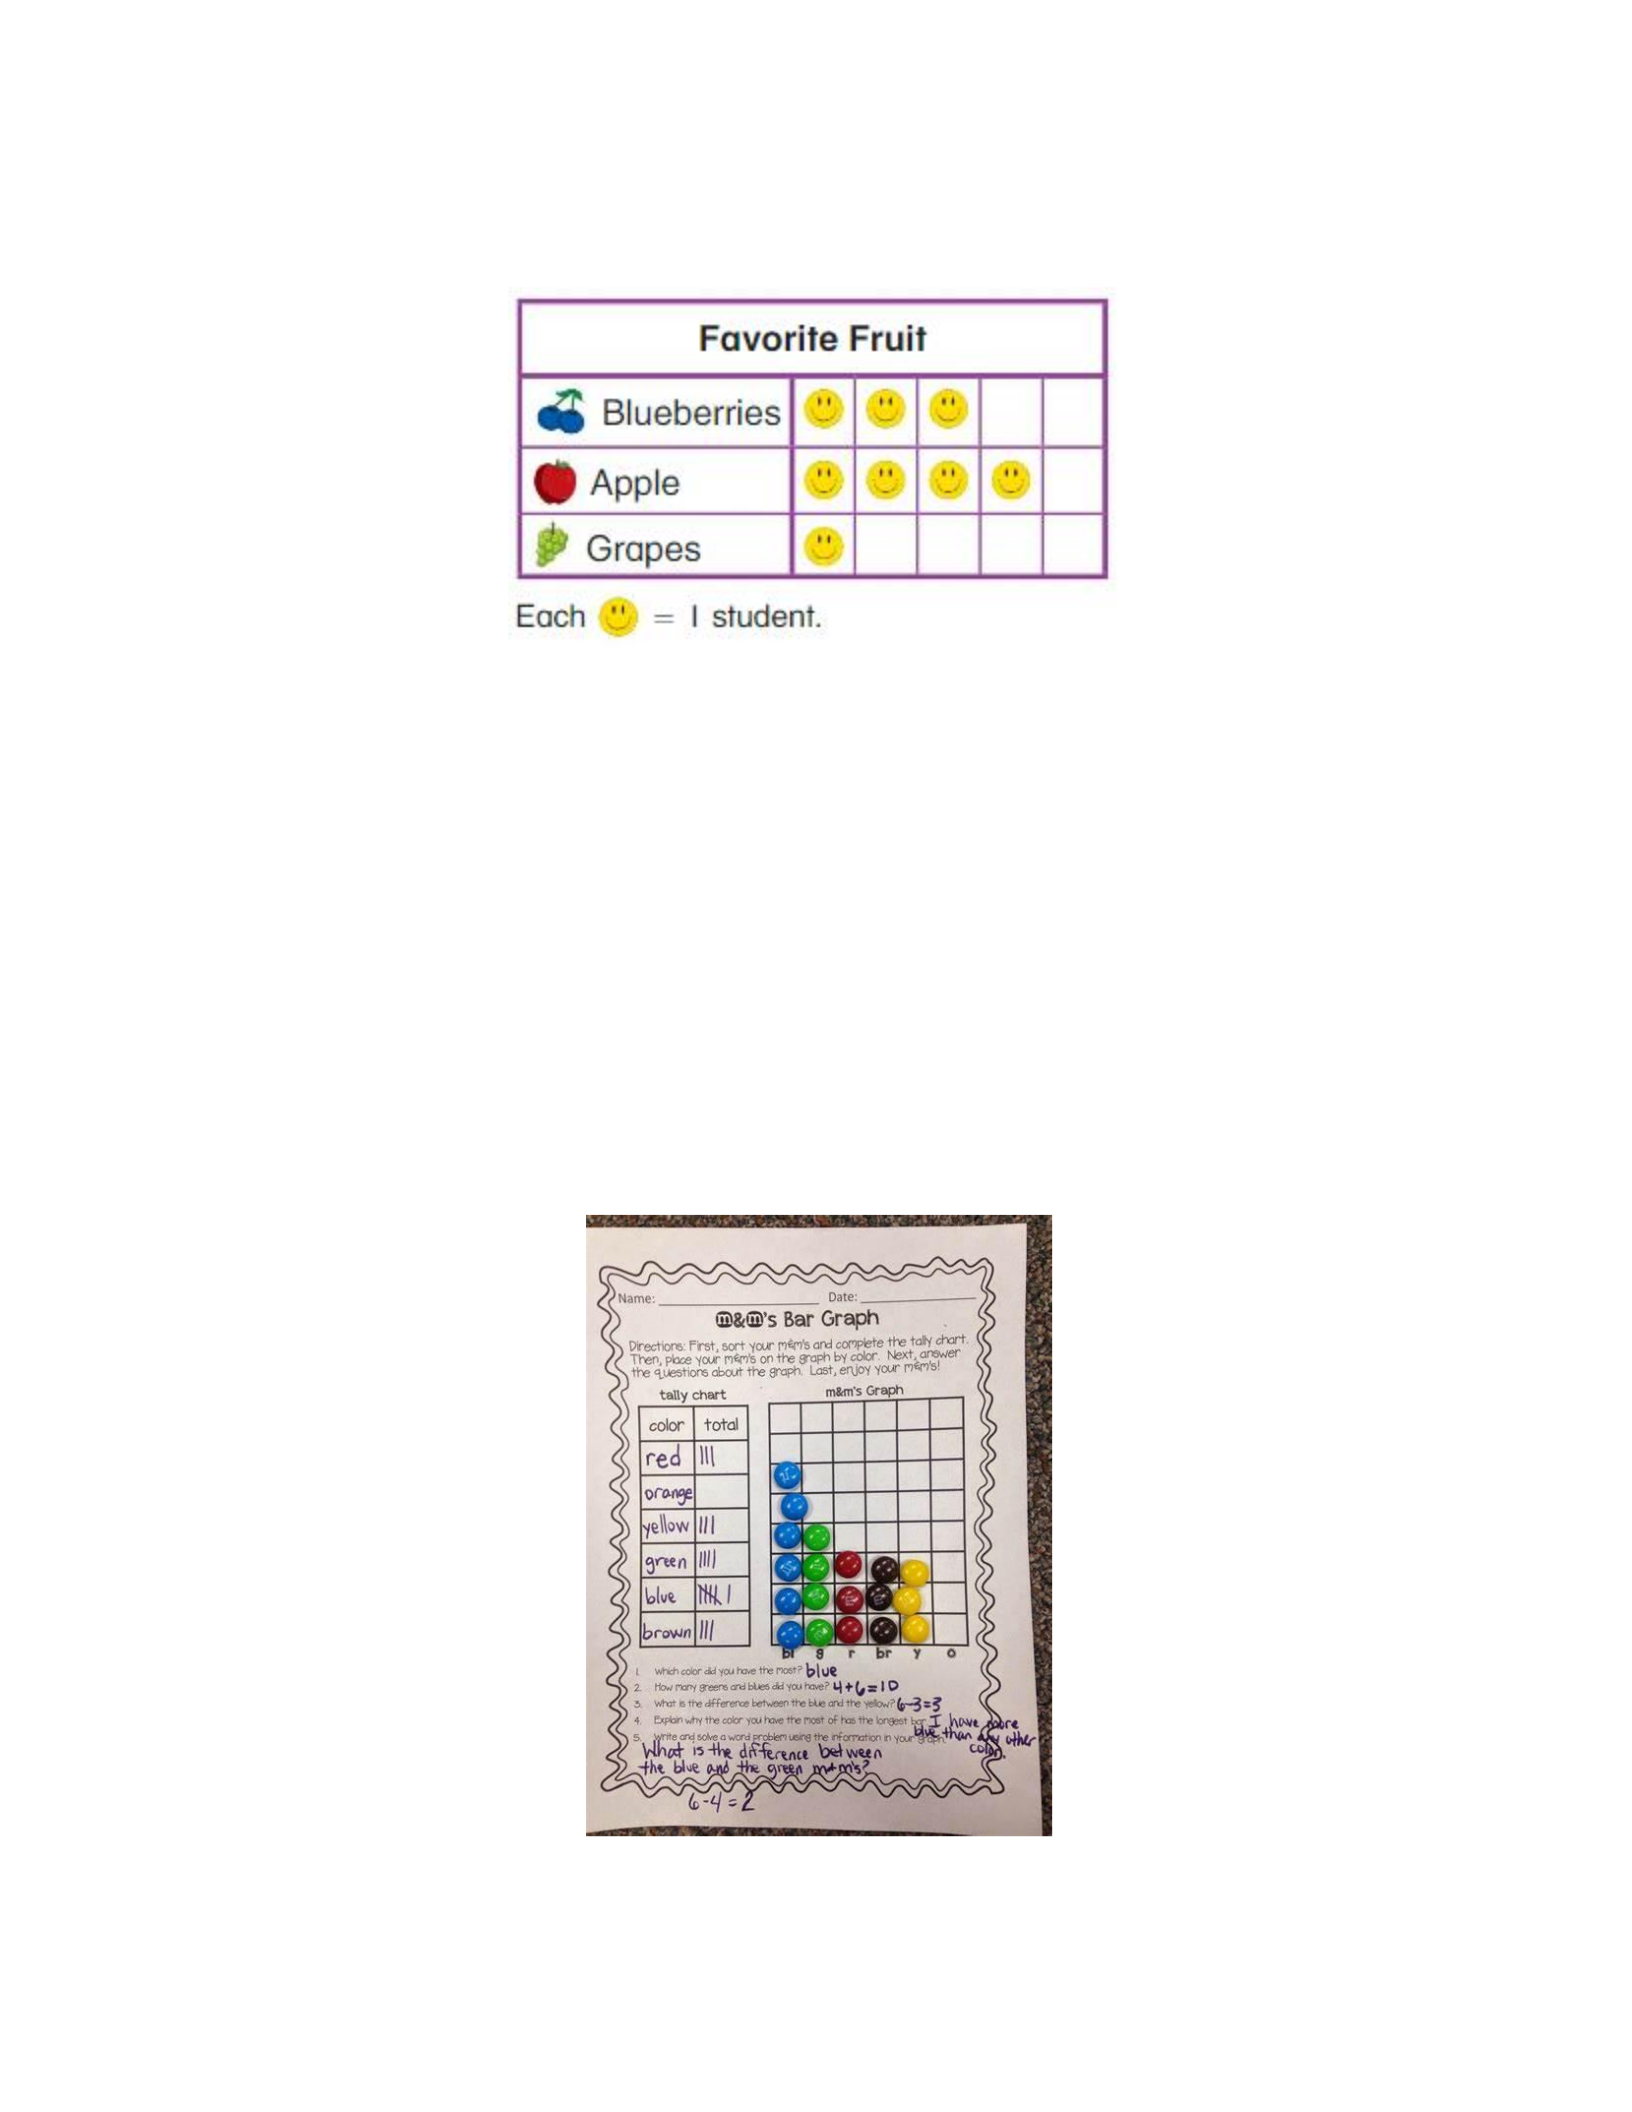
Group 3-above grade level: Students who are gifted or above grade level will complete
their own pictograph. Students can pick between asking their classmates their favorite drink or
their favorite fruit. Students will go around and record the data they collect. When they are done,
they will create their own cryptography based on their data. They will need to make sure they
choose an image and make a key with that image. They will also need to make sure that they
label their graph and their X&Y axis.
8
Example:
Assessments
Formative assessments: For the first formative assessment, the teacher will have students
complete an M&M Bar Graph. Students will sort the M&Ms they get by color and tally on their
paper. They will then create their bar graph. After their bar graph is complete students will
answer questions about it and then eat the M&Ms!
Example:

9
The second formative assessment the teacher will have students play I “can” data game.
Students will do this with a partner. Students will play the cards that have questions about data
with bar graphs and pictographs. Students will answer the questions and get to keep the card if
they get it right and have to put it back if they get it wrong. Their partner will have a chance to
steal it as well. This is a fun game for students to play without feeling like it is an assessment. It
also allows the teacher to walk around and see how students are doing answering the questions.

10
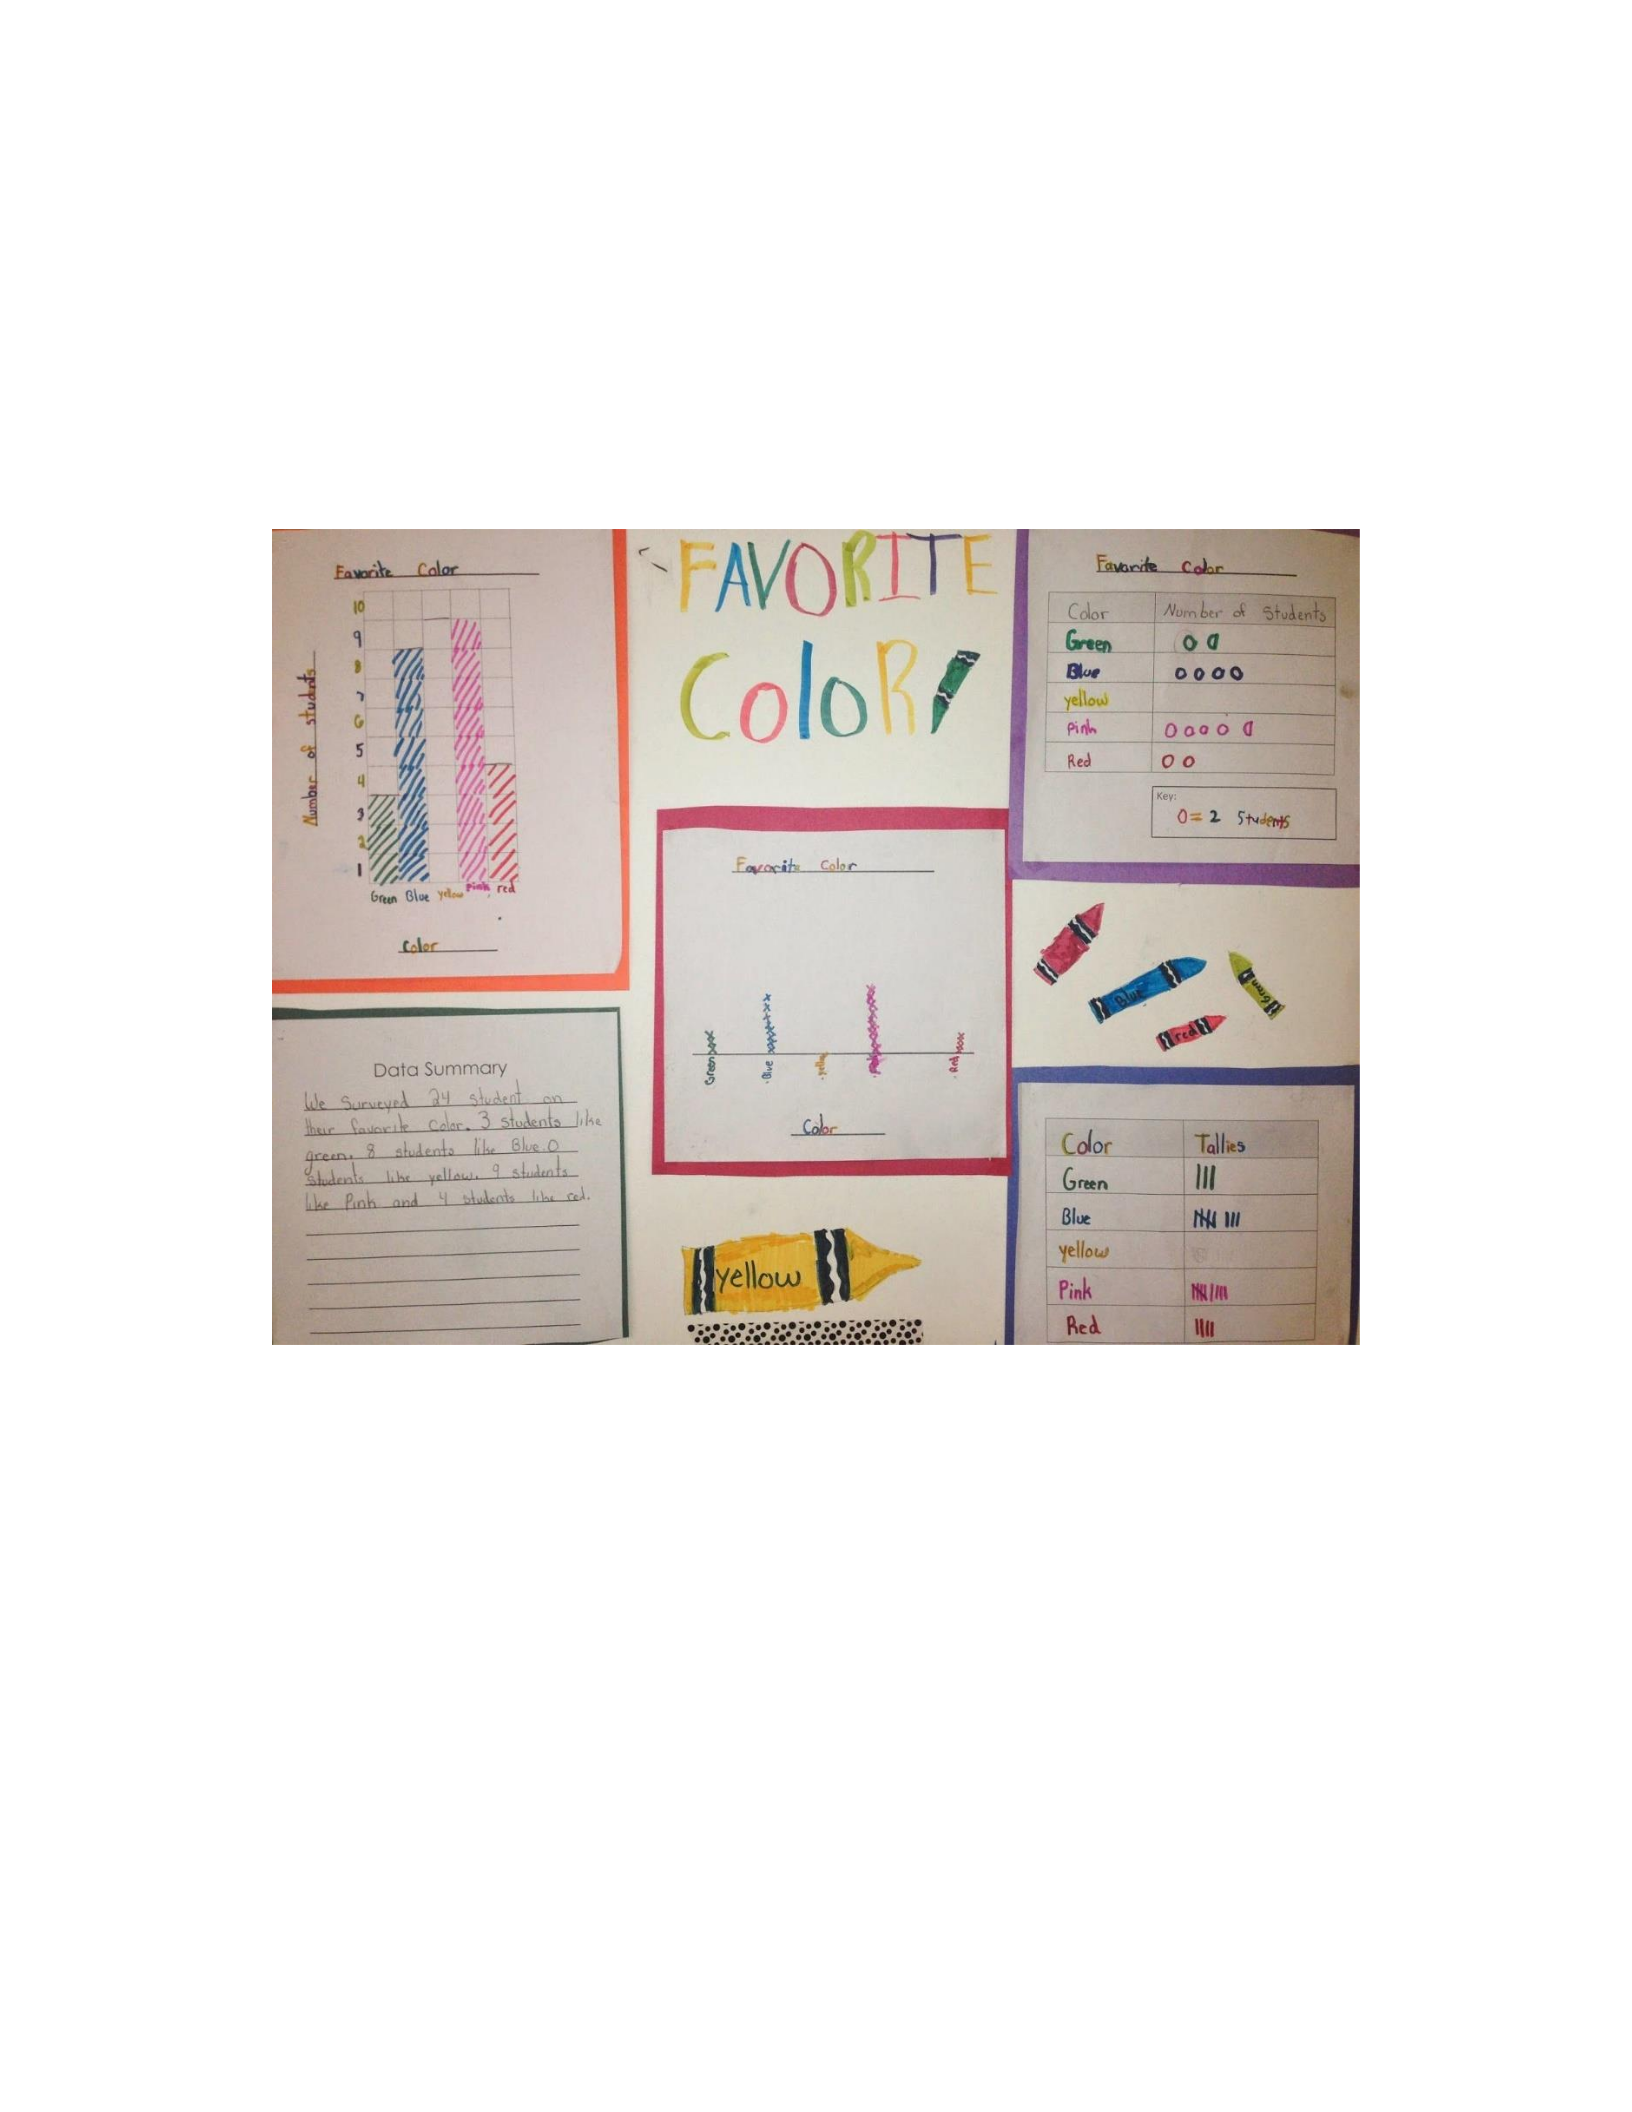
Summative assessment: As a summative assessment, the teacher will have students complete a
bar graph or pictograph project. Students will be able to choose which type of graph they would
like to use. Students will also be able to pick their topic off of a list. Students will need to collect
their data and be able to show it. They will also need to be able to make a graph from their data.
11
At the end students will show the class their graph and be able to answer a set of questions about
their graph and data. This summative assessment allows the teacher to see what the students can
complete on their own using data and graphs.
Example:

12
References
[Only include references that you cited within the assignment. Make sure all references utilize a
hanging indent and are double-spaced. Refer to the current edition APA templates and
samples located at the Online Writing Center. You can access the Online Writing Center
by clicking on the Writing Style Guides link in the left-hand menu of the course.]
13
Lesson Plan Template
LESSON #
Subject/Topic: Probability and Statistics
Grade Level: 2nd grade
Lesson Structure or Grouping:
Whole Class ☒ Small Group ☐ 1:1 ☐
Other (specify): Click or tap here to enter text.
Learning Segment Theme:
Data Collection and Representation
Resources and Materials:
-White board, Expo markers, pencil, crayons, smart board, “Talley O’Malley” by Stuart Murphy and
Cynthia Jabar, quarters
Standards:
State: 2.15 The student will a) collect, organize, and represent data in pictographs and bar graphs; and
b) read and interpret data represented in pictographs and bar graphs.
National: CCSS.MATH.CONTENT.2.MD.D.10
Draw a picture graph and a bar graph (with single-unit scale) to represent a data set with up to four
categories. Solve simple put-together, take-apart, and compare problems using information present in a
bar graph.
Objective:
Given questions and data students will collect and organize their data into a pictograph and bar
graph getting 8/10 items correct.
ACADEMIC LANGUAGE DEMANDS
Language Demands: Students will give a definition of data in their own words. Students will need to
know what tally marks are and how we use them to collect data. Students will need to know what X&Y
axis represent.
Language Supports: The teacher will give a definition of data. The teacher will also explain and
show what bar graphs and pictographs are and how we use them.
Essential Vocabulary: Data, symbol, key, tally, x-axis, y-axis, bar graph, pictograph
INSTRUCTION
Set: "Good morning. Today we are going to be reviewing data and how we represent it on bar graphs
and pictographs. Can anyone tell me what data is?” The teacher will call on a few students to give an
answer. The teacher will explain based off of the student’s answers. The teacher will then ask what
students know about graphs. The teacher will have the think pair share with a partner. Then as a class
we will discuss what graphs are and what they do.
Direct Instruction/Modeling: The teacher will introduce bar graphs and pictographs one by one. The
teacher will ask students what their favorite season is, going from summer to winter. Students will raise
their hands according to their favorite season. The teacher will keep track of how many students like
each season using a tally chart on the white board. After all of the data has been collected, the teacher
will begin to make a bar graph. The teacher will start by labeling the graph with a title and then
labeling the X&Y axis asking students for help along the way. The title of the graph will be favorite
seasons. The x-axis will be labeled seasons, and the y-axis will be labeled number of students. The
teacher will start labeling the y-axis starting with the number zero and explaining why. The teacher will
ask the class how high she should count based on the data they collected. Different students will come
up and draw the bars for the different seasons. After we are done with the bar graph, we will move onto
the pictograph using the same data. The teacher will begin to explain how the pictograph is different
from the bar graph but how it still needs a title. The teacher will ask a student what the title should be.
The title will be favorite seasons. The teacher will fill in the categories with the seasons of the year.
14
The teacher will explain how we will need a key. Students will pick a picture to represent how many
students are for each season. The teacher will have different students come up and fill in each season
with the correct number of pictures according to the key.
Guided Practice: The teacher will pass out a worksheet and tell the students to keep up with it
while reading the book Talley O’Malley. Before beginning the book, the teacher will tell the
students to pay close attention when reading because they will need to make tally marks on their
worksheet. After reading the book as a class and all of the data was collected while reading the
book. We will create a bar graph and a pictograph together. To simplify what we are making for
our graphs, we will use the number of cars. We're thinking about. To ensure that we start on the
right note, the teacher will go around and make sure that each student got the right amount of
cars with their tally marks. To make sure they all got the right amount, the teacher can ask how
many boxes we should fill for the silver cars. The answer is 6 and so students would need to color
in six boxes of silver. The teacher would go on and on with each different color of car. After we
have gone through all of the number of boxes that should be colored for each color or bar graph
should be complete. After the bar graph is complete, we'll move on to creating a pictograph. The
teacher will ask what should we title this graph? Students will have a chance to answer and
hopefully get close to what we labeled the bar graph, “car colors”. The teacher will then ask what
categories we should include for the picture. The student should answer with the color of the
cars. As a class, we'll decide to use a little picture of a car to represent each number of cars seen
in each color. We will then go through our tallies that we made to make sure that we put the
correct number of cars with each color. We will fill out our pictograph together.
Independent Practice: The pass out a worksheet with a tally chart. The tally chart is for T-shirt
tallies. The students will take the data from the tale HR and create their own bar graph and
pictograph. The students can use their notes and the guided practice to help them. Students will
be allowed to work together and ask each other questions as well as the teacher will be walking
around to observe and help when needed.
Closure: At the end of the lesson, the teacher will have a picture of a bar graph and a pictograph up on
the smart word. The teacher will ask students to come up and circle the title of each graph, the Y axis
and X axis on the bar graph, the key on the pictograph, as well as a symbol used for the pictograph.
DIFFERENTIATION
Supporting Students with Special Needs: To accommodate students with special needs, I will make
sure that those students are sitting close to the front of the room to where I can help them easily. I will
make sure that they are following along by asking questions of understanding and making sure that
they are on the same page as the rest of the class. These students will also be allowed one-on-one time
as well as another arrangements that are necessary.
Challenging Above-Average Students: Gifted students may be asked to come up with ways we use
bar graphs and pictographs in our everyday lives.
Facilitating a Classroom Environment that Supports Student Learning: The teacher will create an
environment that encourages student learning as well as making students feel comfortable and
welcomed. Teacher also create rules that help create a fair and respectful classroom environment.
Extension: Students will be asked to collect data from their families and family about their favorite
season. They will bring it back to class and we will combine all the data along with the data we got on
our original bar graph and pictograph.
ASSESSMENT
Diagnostic/Pre-Assessment: the beginning of the lesson, students will be asked if they know what
data is and if they know what graphs are. The teacher can assess what their knowledge level is of
graphs and data based on their answers. The goal for the teacher is to help students understand
and know what data is.
15
Formative Assessment: During the independent practice part of the lesson, students will be
making their own bar graph and pictograph. The teacher will be walking around and monitoring
the students as they are working. When students are done with their bar graph and pictograph,
the teacher will collect them and look over them.
Summative Assessment: At the end of the lesson to assess for students understanding the teacher
will have students participate in a blooket. The teacher will upload questions over data, bar
graphs and pictographs. Students will get to answer these questions while also getting to play a
game along the way. This allows the teacher to see how students are doing and look at the
questions students are missing the most. It allows the teacher to see if anything need to be gone
over again.
BIG IDEA:
Complete the BIG IDEA statement for your plan. This should be at the end of your lesson plan.
Today I will learn how to collect data and make a bar graph and pictograph from the collected
data. (complete this statement with what the student will learn from this lesson – what the student will be
able to do – look at the Objective.)
So that I will be able to interpret information and answer questions about the information. (provide
students with a real-life situation where this skill/concept will be needed)
I know you've got it when you are able to create a bar graph and pictograph from the data you
collected as well as answer questions based on the information interpreted with getting 8/10 correct.
(provide students with performance expectations – the way students will show they have met the
Objective)
16
Unpacking the Standard/Concept Map (corresponds with lesson plan)
What do
students need to
do
Level of Bloom’s
Taxonomy
What do
students need to
know
Objective
• Collect
• Organize
• Represen
t
• Read
• Interpret
• State
orally
and in
writing
• Remembering
• Understandin
g
• Evaluate
• Pictograph
s
• Bar graphs
• Data
• Data
Collection:
Lists,
tables,
tallies, etc.
Given questions and data students will
collect and organize their data into a
pictograph and bar graph getting 8/10
items correct
Assessments
Essential Questions
Vocabulary
How will you connect this content
to Algebra?
Students will
complete a blooket
with questions
over data, bar
graphs and
pictographs
getting 8/10
correct.
1. How can we find
data in everyday life?
2. How are the
different types of
graphs the same/ how
are they different?
3. What strategies
can we use to find
data and put it on a
bar graph?
Data, symbol, key,
tally, x-axis, y-axis,
bar graph,
pictograph
Data content will connect to algebra
because students will need to learn how
to collect and interpret data in order to
solve problems. In algebra students will
need these problems solving skills.
Why is this information
important for students to know?

17
This information is important for
students to know because it can be related
to their everyday lives. It is also
important for them to know this
information as it will be used throughout
their academic career.
2.15 T student will a) , organ , and
data in pic and graphs; and
) read and interpr data represent in
and bar grap .
C data using
of data coll such as
L , Tables, objects, pic
, telemar charts. Data
are limited 16 or
and no m than 4
.
R data in
and bar
.
O data
various
of data
(
, tables,
,
, tally
, charts.)
U less than
16 points
no more
4
.
R Data
R
P and
B Graphs. Have
to 25 data
and no
than six
.
S orally and in wri :
P and g ,
U data to make ,
P of data with special
, Categ
and data as wh .
• I
bar
.
H up to
25
and
more
six

