


Demographic Characteristics of the Study Respondents
Demographic characteristics play a key role of giving a summary of respondents who
participated in a study. This section presents demographic information of both students
and teacher counsellors who participated in the study.
Students’ Demographic Information
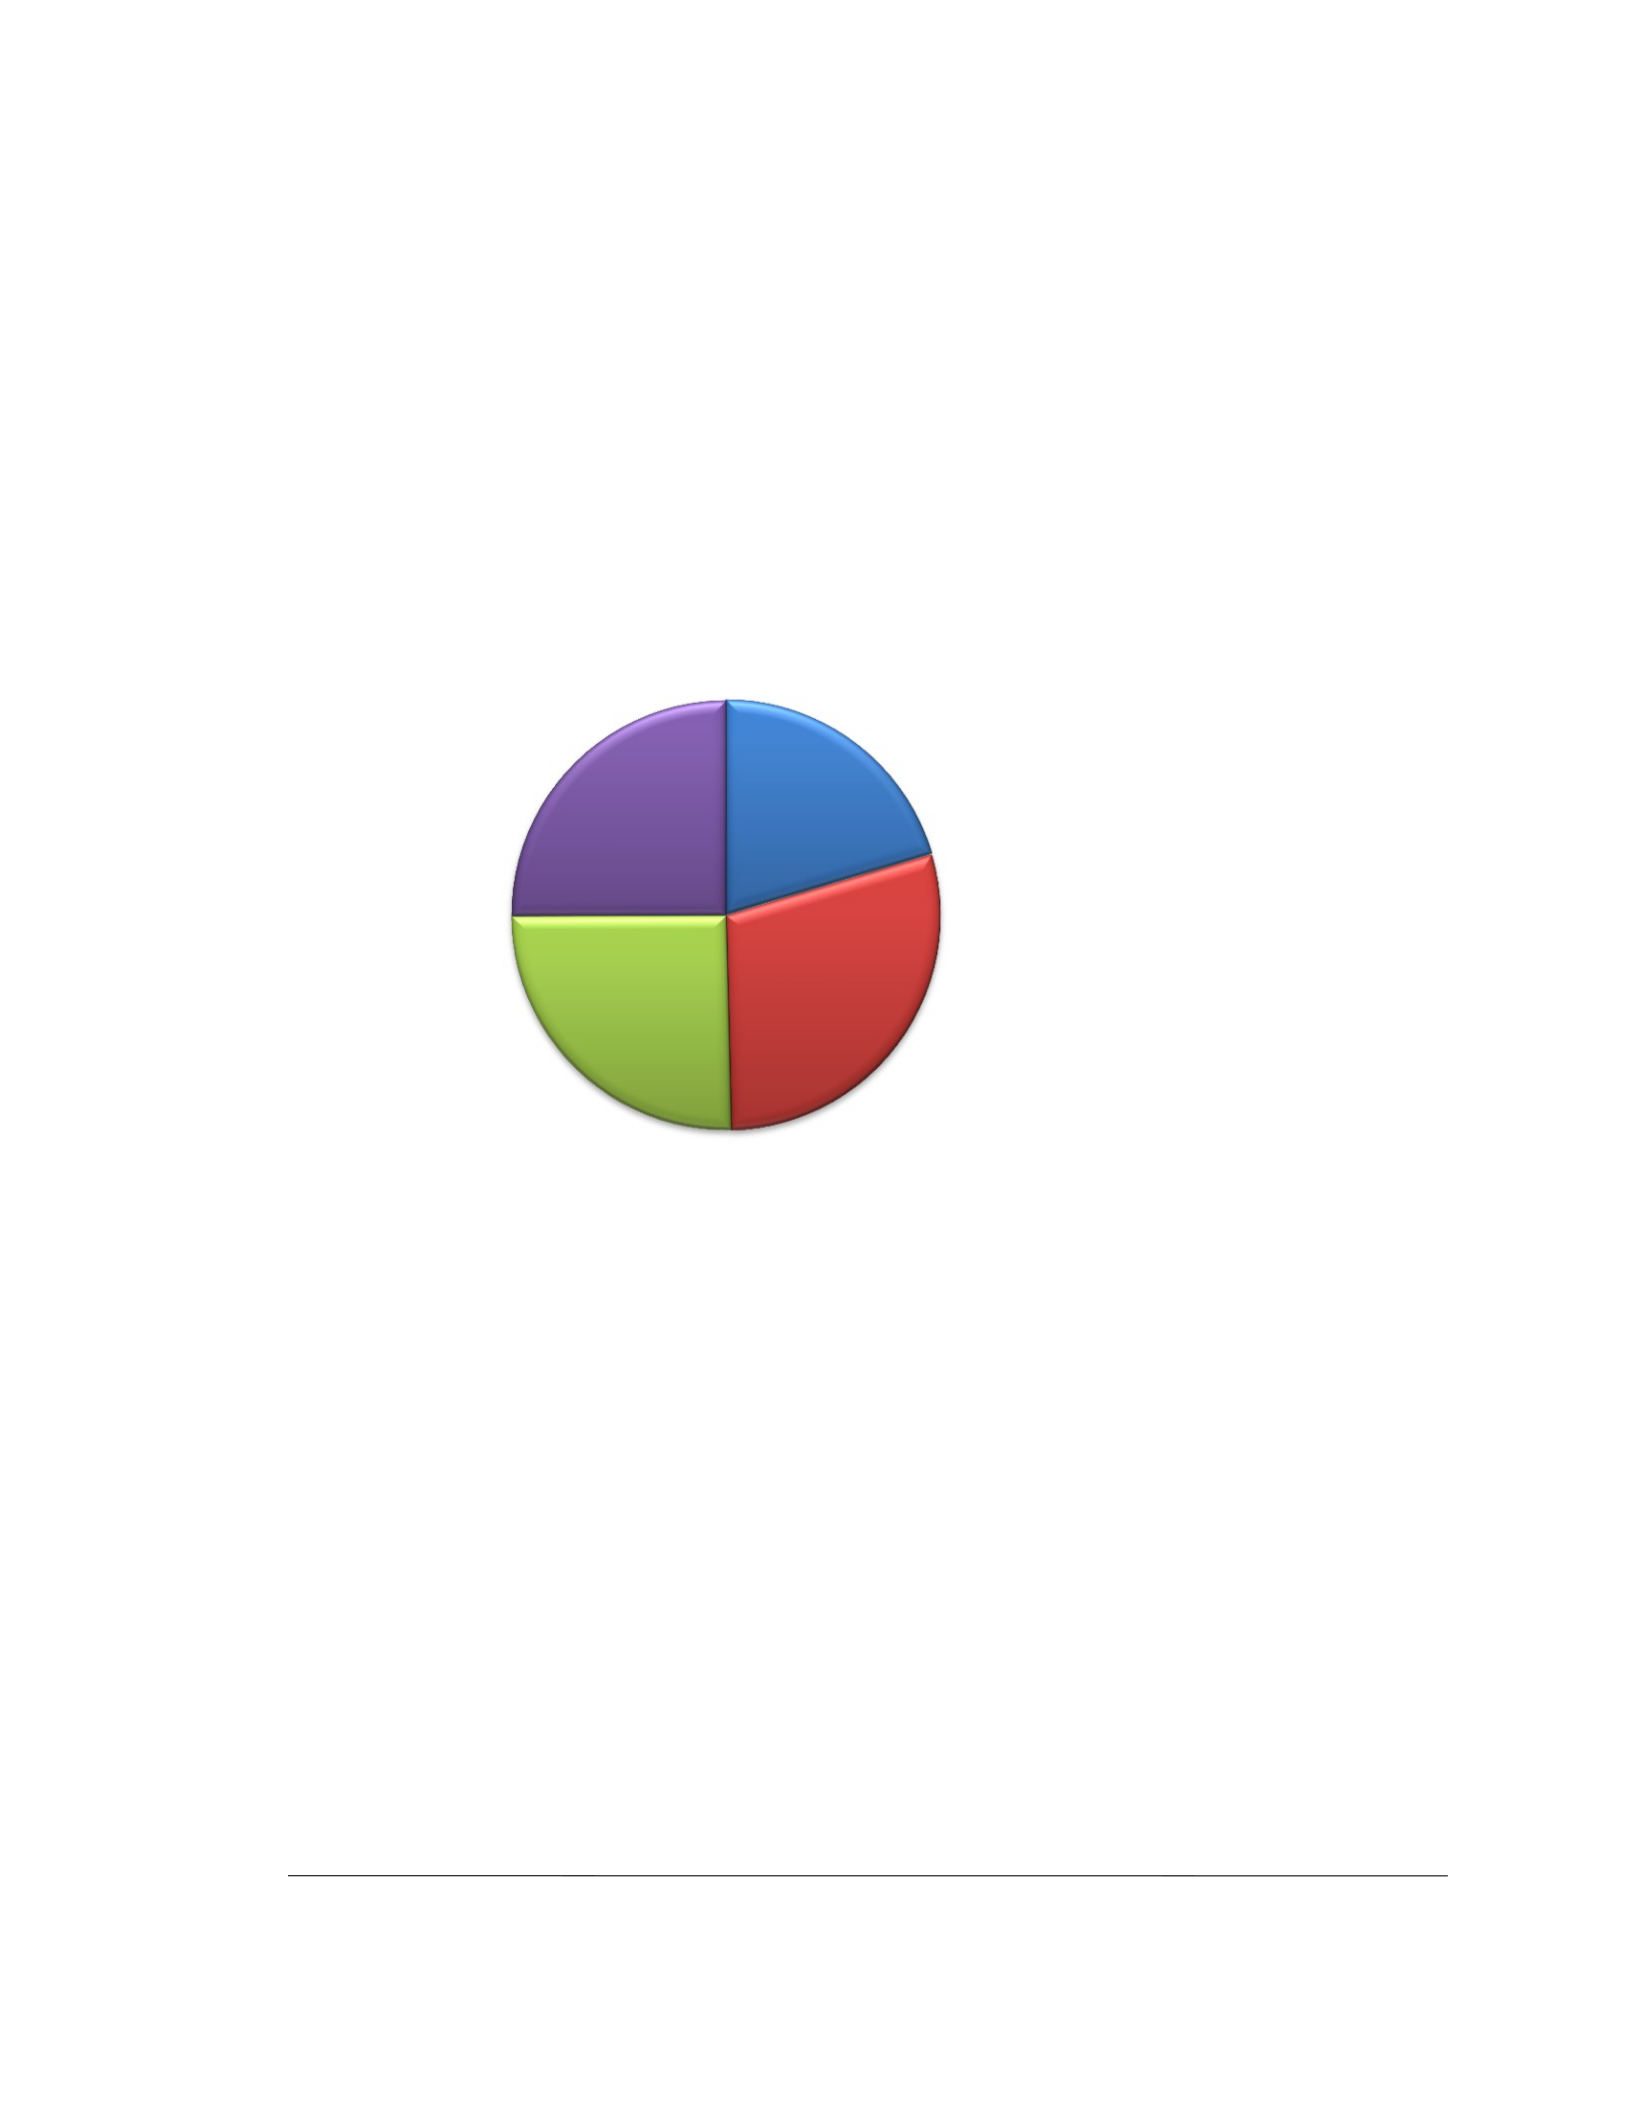
Students‟ demographic information included gender and school type. Figure 3 gives
a summary of students‟ distribution by gender in Nyeri and Nairobi Counties.
Females in
Males in
Nyeri, 79
Nairobi, 97
(20.4%)
(25.1%)
Females in Males in
Nairobi, 113
Nyeri, 98
(29.2%)
(25.3%)
Figure 3: Students‟ Distribution by Gender in Nyeri and Nairobi Counties
Results in Figure 3 show that, among the 387 students, 192 (49.6%) were males and
195 (50.4%) were females. Among the 210 students from public schools in Nairobi
County, 113 (29.2%) were male students and 97 (25.1%) were female students. Of
the 177 students from schools in Nyeri County, 79 (20.4%) were males whereas 98
(25.2%) were females. The students‟ sample used was 400 but the returned filled
questionnaires were 387, therefore 13 students did not either fill the questionnaires or
return them.
Table 3
Distribution of Students by School Type in Nairobi and Nyeri Counties
School type Counties Total

Nairobi Nyeri
f
%
f
% f %
Mixed school
78 37.1 80 45.2 158 40.8
Boys only
73 34.8 40 22.6 113 29.2
Girls only
59 28.1 57 32.2 116 30.0
Total
210 100.0 177 100.0 387 100.0
As depicted in Table 3, 78 (37.1%) students from Nairobi County were in mixed
schools, 73 (34.8%) were in Boys only schools and 59 (28.1%) were in Girls only
schools. Among the 177 students in Nyeri County, 80 (45.2%) were in mixed schools,
40 (22.6%) were in Boys only schools and 57 (32.2%) were in Girls only schools.
Teacher Counsellors Demographic Information in Nyeri and Nairobi Counties
Teachers‟ counsellors‟ demographic data described in this section include duration
they had served as teacher counsellors and level of training in counselling. Table 4
illustrates teachers‟ responses on the duration they had served as teacher counsellors.
Table 4
Number of Years Teachers Had Served as Teacher Counsellors in Nyeri and
Nairobi Counties
Duration in years Counties Total
Nairobi Nyeri
f
%
f
%
f
%
1 and below
1 5.9 1 5.3 2 5.6
2-4
1 5.9 5 26.3 6 16.7
5-7
4 23.5 6 31.6 10 27.8
8 and above
11 64.7 7 36.8 18 50.0
Total
17 100.0 19 100.0 36 100.0
According to Table 4, among the 17 teacher counsellors from the schools in Nairobi
County, 1 (5.9%) had served for 2-4 years, 4 (23.5%) had served for 5-7 years while
11 (64.7%) had served for 8 years and above. Out of the 19 teacher counsellors from
Nyeri County, 1 (5.3%) had served for 1 year and below, 6 (31.6%) had served
between 5 and 7 years while 7 (36.8%) had served for 8 years and above. Therefore,

majority (77.8%) of them had served as teacher counsellors for 5 years and above.
Table 5 depicts level of training among teacher counsellors from Nairobi and Nyeri
Counties.Table 5
Level of Training in Counselling among the Teacher Counsellors in Nyeri and
Nairobi Counties
Level of training Counties Total
Nairobi Nyeri
f
%
f
%
f
%
No counselling training
2 11.8 5 26.3 7 19.4
Certificate
5 29.4 6 31.6 11 30.6
Diploma
3 17.6 1 5.3 4 11.1
Bachelor‟s degree
5 29.4 2 10.5 7 19.4
Master‟s degree
2 11.8 4 21.0 6 16.7
Capacity building workshops
0 0.0 1 5.3 1 2.8
Total
17 100.0 19 100.0 36 100.0
From Table 5, 29.4.0% of the teacher counsellors from Nairobi County had a Certificate
in counselling, 11.8% had attained Diploma qualifications while another 11.8% of them
had Master‟s Degree. Among those from Nyeri County, 31.6% had attained Certificate
in Counselling, 10.5% had Bachelor‟s degree while another 21.1% had Masters‟ degree.
Two (11.8%) teacher counsellors from Nairobi County and 5 (26.3%) teacher
counsellors from Nyeri had not attained any training in counselling.

