


1
The Application of the Six Sigma Through DMAIC Phases on Saucy Lodge &
Restaurant
Name
Institution
Professor
Course
Date

2
Table of Contents
Abstract ................................................................................................................................ 4
1 Introduction ................................................................................................................... 5
2 Case Study ‘Plan’ ........................................................................................................... 5
3 Define phase .................................................................................................................. 7
3.1 Defining the problem .............................................................................................. 7
4 Measure phase ............................................................................................................ 10
4.1 Mapping out the Currently Process ................................................................... 10
4.2 Defects ................................................................................................................. 11
4.3 Opportunities ...................................................................................................... 11
4.4 Data Collection Plan ........................................................................................... 11
4.5 Validating the measurement system ...................................................................... 13
5 Analyze phase ............................................................................................................. 13
5.1 Performance Objectives ........................................................................................ 13
5.2 Value Vs NVA ..................................................................................................... 13
5.3 Opportunities to Improve Root Cause ................................................................... 14
6 Improvement phase .................................................................................................... 15
6.1 Experiments Solutions .......................................................................................... 15
6.2 Operating Tolerances ......................................................................................... 17
7 Control phase ............................................................................................................. 17
7.1 Process Control and Capability Plan ..................................................................... 17
8 Conclusion ................................................................................................................... 18


4
Abstract
This paper presents a case study of the Saucy lodge. This company has experienced
various weaknesses. One of the weaknesses that affect the company and which has led to the
dwindling of its profits is the use of an aged and obsolete reservation system. Also, the
company does not have an online booking system. With this in mind, the six sigma tools
could help the company to improve on its services and ensure that the expectations of the
guests are met. Using the six sigma tools, a new model was proposed for the company that
would allow guests to seamlessly access the lodge at all times. In addition, the six signal tools
helped to recommend investment technology that would enable guests to the hotel to do
online booking and reservations.

5
1 Introduction
The majority of contemporary organizations are attempting to enhance their overall
performance amid the ever-rising competition intensity (Kim, 2021). In doing this, the
organizations are striving to employ suitable strategies in their entire endeavors. Among the
strategies being employed by modern organizations is a continuous quality improvement
(CQI). Companies are deploying CQI to have a competitive edge over their competitors
(Wong & Headrick, 2020). For organizations to deploy the CQI approach, they have to
deploy the total quality management (TQM). When applying TQM, firms have adopted as
well as applied several utilities that fall under various names, including tools, methods and
systems among others; most of these have enabled organizations to achieve TQM. However,
hardly have these utilities enabled firms to realize profitability. For organizations to achieve
profitability through the application of TQM, they have to use the Six Sigma model. This
model facilitates organizations to realize almost zero defects in manufacturing, which results
in high profit for organizations (Srinivasan et al., 2016). Besides, this method leads to
increased quality since it permits organizations to make mistakes that are less than 3.4 defects
per million opportunities (DPMO). For organizations to realize this goal, they have to follow
the define, measure, analyze, improve and control (DMAIC) phases approach. One of the
companies that could benefit from this approach is the Saucy Restaurant chain. This project
aims at conducting a study on Saucy Restaurant, analyzing the service system in Saucy
Restaurant and employing the SIX sigma tools, such as service quality (SERVQUAL) and
service blueprint to deliver high-quality service with improvised client satisfaction.
2 Case Study ‘Plan’
This paper is based on the case study research design. This research design was used
after considering various factors, including the benefits that the case study offers. First, the
case study was chosen as the most appropriate research design because it enables a researcher

6
to gain concrete, contextual as well as in-depth know-how regarding a certain real-world
subject (Yin, 2018). According to Yin (2018), a case study allows for the exploration of key
characteristics, implications and meanings of a certain case.
It is worth noting that the Six Sigma DMAIC approach has not yet been employed in
the hotel industry. The case study employs DMAIC tools for purposes of redesigning an
enhanced service system for Saucy Restaurant operation in the United States. This is meant
for ensuring that the company can reliably deliver superior services to meet their client
expectations.
Saucy Restaurant offers a wide range of products and services that include lodging,
beverage and beverage. In addition, it offers catered events for individuals coming from
across the globe. It is renowned for its amazing products and services. However, the
company’s customer service remains its leading weakness. The company has been unable to
keep and retain top-notch talent. Employees at the Saucy Restaurant stay at the organization
for an average of 2.2 before they leave. The main reason for the high employee turnover is
the seasonality of the restaurant; it only has frequent clients during summer. It experiences
client scarcity during winter because it is located in Prospect Creek Camp, Alaska, which is
the coldest part of the United States. Because of the seasonality, the organization is forced to
cut by half the employees’ wages. As a result, many employees choose to quit the
organization.
To enhance or improve the prevailing service process at the organization, the
company must first comprehend and understand all the aspects that need enhancement. The
company can put a procedure in place in order to ensure that the employees are effectively
trained in order to provide better services from their first contact with the clients until the
clients leave. Both a training program as well as comprehensive acquiescence to service

7
enhancement recommendations are supposed to pledge that the client would have a greater
experience, and that will eventually aid the company in realizing immense profits.
Moreover, the company must differentiate itself from its competitors in order to gain a
competitive edge. It could do this by offering top-notch service and thus raising the overall
product’s quality. In addition, in order to ensure that the company offers consistent, top-notch
service, it would need a system to be prudently designed and implemented by both
technology and people. In addition, to streamline its services to guests, it should streamline
its operational system. It could achieve that through the implementation of both procedures as
well as policies that would ensure the consistent provision of the best customer service to its
guests. This can better be achieved through the use of the DMAIC approach. The next part of
the case study discusses how the services at the company could be improved or enhanced
using the DMAIC approach. The part will explain each of the phases of the DMAIC
approach.
3 Define phase
During this phase, the project leaders create a “Project Charter”, the process’ a high-
level view and they start to comprehend the needs of the process customers. This is an
important phase since it is the phase where teams define the outline of their efforts for both
themselves as well as the leadership of the organization (Smętkowska & Mrugalska, 2018).
3.1 Defining the problem
Several problems affect the organization. The main weakness that affects the
company and that which has led to the dwindling of its profits is the use of an aged and
obsolete reservation system. In addition, the company does not have an online booking
system. Lack of an online reservation system is a limiting factor for the organization. Thus,
there is a need for the development of an effective and dynamic online reservation system.
8
When developing the new system, the company CEO can act as the Project Champion to
oversee the project completion.
Goal Statement
To discontinue the existing aged and obsolete reservation system and introduce an
advanced booking and reservation system
Value Stream Mapping
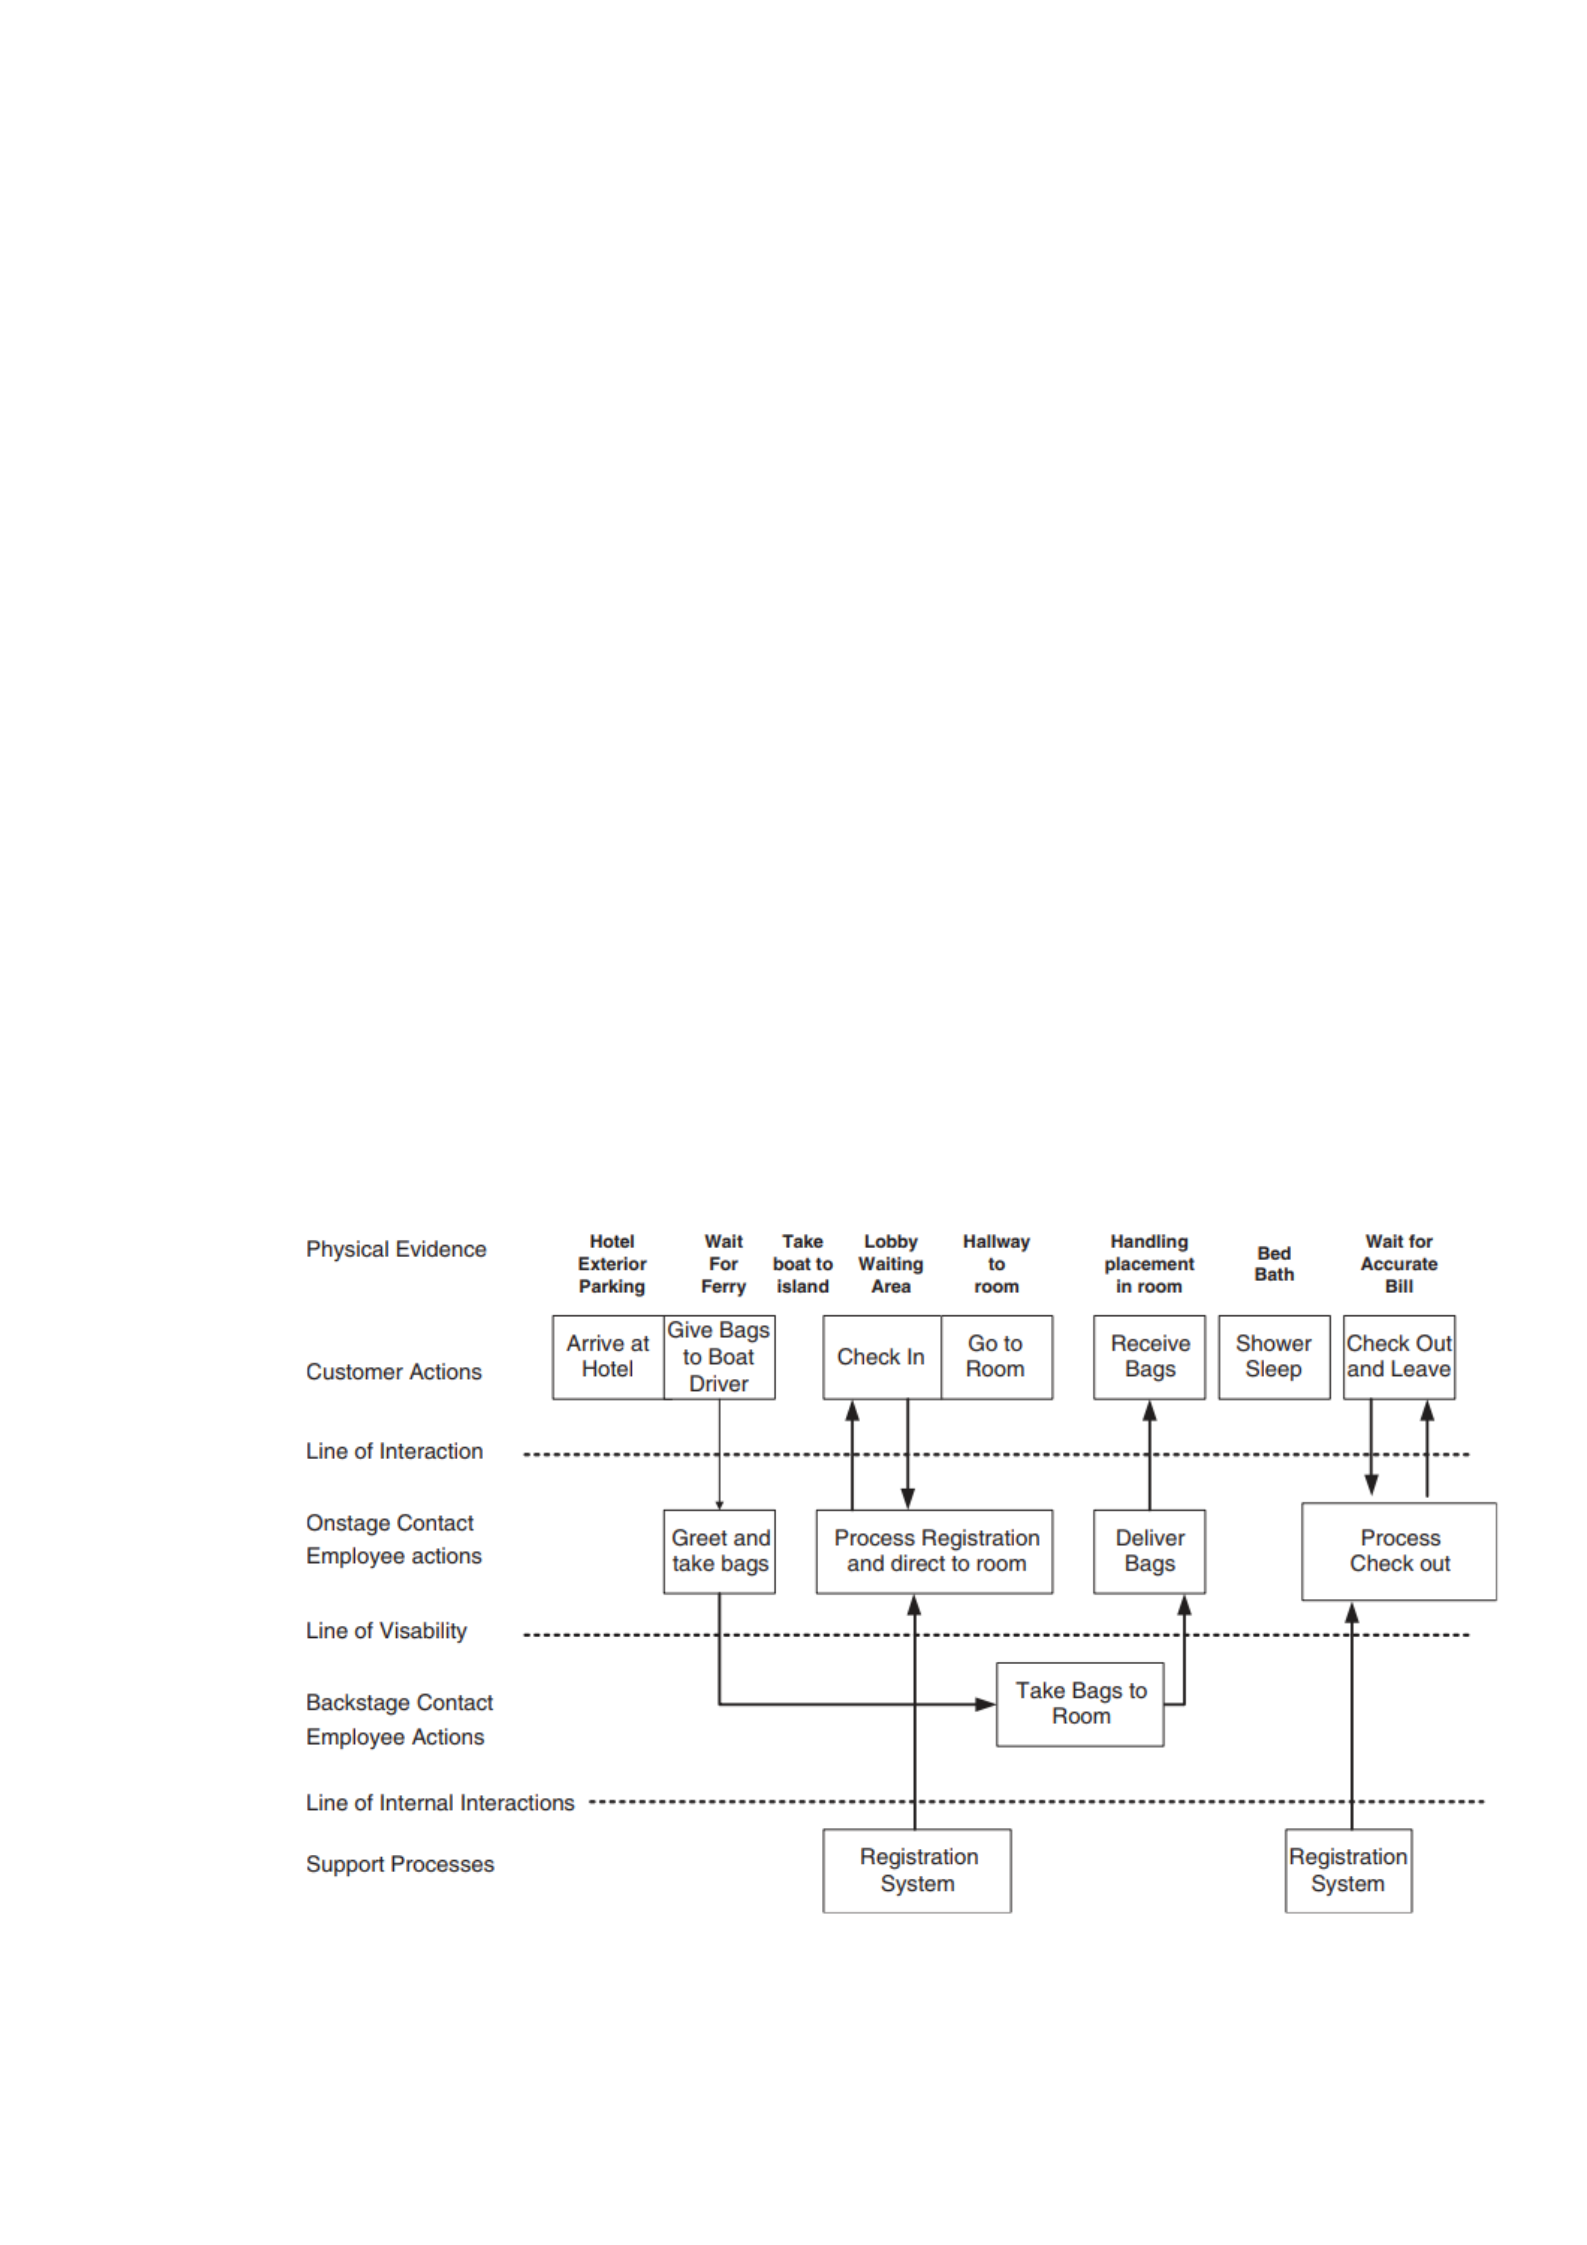
Figure 1 below is the Value Stream Mapping of the restaurant. It illustrates the current
processes at the restaurant from the time a client arrives at the restaurant until he or she
checks out. It starts when a client enters the hotel up to when he/she leaves the restaurant
after spending some time in the restaurant. As evident in the figure below, the process can be
slightly complex in case the client has some food or beverage. As evident, the system is
currently set for producing bills for beverage and lodging and food, instead of a single
merged bill. This is one of the areas within the restaurant that needed to be improved.
Figure 2: Value Stream Mapping for Saucy Lodge

9
Customer and their Requirements
The customer includes adults who would like to try the restaurant’s products and
services. The customers are drawn from across the globe. For the clients, the old system has
brought about inconvenience in booking and making reservations. This is what has
necessitated the need for the creation of a new system.
Figure 3 demonstrates the current process and procedure for managing guest
reservations all through business hours. With this process, the client gets information from
varied sources, which may include websites, social media or referrals from a friend. After
getting the information, they call for reservations. They have to call because they cannot
make reservations online since the restaurant does not currently have this service. Once the
call is made, the receptionist at the restaurant replies to the phone call, processes the
reservation and then plugs the new reservation into the booking system.
Figure 4: Saucy Lodge prevailing process of managing guest reservations
The contemporary service process at the restaurant shows that there is room for
improvement. Even though the company has staff to aid the client through the peak season,
they are at large danger of leaving out on sales, especially when there exists no employee to

10
serve the clients when they call. Furthermore, the company risk a high level of customer
dissatisfaction by not being consistently available to serve their needs. Besides, the company
needs to find accurate people as well as invest in training them to deliver top-notch client
service; the company should make this a priority even though seasonality makes this difficult.
One of the most important changes that should be implemented by the company is the
introduction of the online booking engine. This would help to save the company the need for
employing people to be on standby to receive reservations (Foris, Crihălmean & Foris, 2020).
Online booking is important because it is not time and resource-sensitive (Foris, Crihălmean
& Foris, 2020; Motter & Downes,2021). In addition, booking online helps an organization to
reach a bigger audience simply by linking to internet restaurant websites and travel engines.
What is more, in most cases, it is increasingly convenient for the client.
4 Measure phase
Measurement occurs throughout the project’s life cycle. However, a critical question
that needs to be answered during the Measure Phase centres on the current performance of
the process. Does it seek to answer questions such as what is the problem’s magnitude? How
bad is the problem? When the team begins gathering data, they primarily focus on the process
in addition to what clients care about. The two major targets during this phase are reducing
lead time or enhancing quality. In addition, during this phase, the team refines all the
definitions of every measure. Similarly, the team determines the prevailing performance, that
is, the baseline of the process.
4.1 Mapping out the Currently Process
The figure below shows the mapping out of the current system.

11
Figure 5:Current reservation process
Since there is no online booking or reservation, the guests make a call to the
organization’s reception. After receiving the call, the recipient updates the caller if there is
vacant room for reservation. The recipient allocates a room to the caller if available,
otherwise, the client is informed that all the rooms have been booked.
4.2 Defects
The main defect in the organization is that they are using an aged and obsolete
reservation system. Also, the company does not have an online booking system. Therefore,
return clients and potential clients have to first call the organization in order to determine if
there are spaces available for booking. These two aspects need of the organization will need
to be improved for the organization to realize its full potential.
4.3 Opportunities
The company can realize its full potential by investing in a modern booking and
reservation system. The new reservation and booking system will allow people from across
the globe to book at their comfort.
4.4 Data Collection Plan
The method that would be used is the Servqual survey data collection method. This
method will be used to collect data regarding service quality and it would help to compare

12
Saucy Lodge and ideal Lodges and restaurants. This study will not be in isolation, instead,
various reports show that service quality is among the most searched aspect of management
research (Raza et al., 2020; Rita Oliveira & Farisa, 2019). For that reason, numerous studies
have been done geared at knowing the different factors that determine service quality.
Similarly, studies have been done to determine how service quality affects customer
perceptions (Herhausen et al., 2020; Kumar & Hundal, 2019). For that reason, scholars have
come up with the Servqual Survey, which is a standard approach to measuring service
operations (Talavera, 2020; Yildirim, Yildirim & Ozcan, 2019). The survey’s purpose entails
asking clients what they expect in the services that are being offered against what their
perception is of the services being received (Talavera, 2020; Pekkaya, Pulat İmamoğlu &
Koca, 2019).
A Servqual Survey was conducted for the Saucy Lodge Restaurant that compared
clients’ prospects of a perfect restaurant to their perceptions of the Saucy Lodge Restaurant.
A weighted average method was used for the analysis of the gap score by providing a higher
weight or significance to the question valued more by the clients. This is evident in the Figure
below. As evident from the figure, the entire five dimensions contain negative results; this
implies that the services at the Saucy Lodge Restaurant do not meet the clients’ expectations.
In addition, as evident from the dimension, the empathy measurement has the slightest
weighed median gap score. On the other hand, the tangibility service length has the utmost
weighted score.
Figure 6: median servqual study outcomes based on service facet.

13
4.5 Validating the measurement system
This process ensured that the measure is a suitable numerical characterization of the
entire claimed attributes by showing that the representation condition is satisfied. The
measurement used for validating the measurement system was the size of the sample. The
sample size of large enough and therefore the data was a true representation of the
population.
5 Analyze phase
The analysis phase helps project teams to identify issues or problems in the
production process that causes product or system defects. The phase is loaded with tools to
aid spot the issues in the production processes as well as to determine if the problems are
defects’ root causes. It relies on the data collected in the measure phase in order to identify
the product defects’ cause. Some of the activities in this phase include identifying
performance objectives, value vs NVA and opportunities to improve the root cause.
5.1 Performance Objectives
i. To ensure that clients can book their services online by December 2022
ii. To introduce a new and modern reservation system that will increase the number
of people served every day
5.2 Value Vs NVA
Value-added activities are tasks that increase the market function and form. Some
examples of such activities include upgrading the information system, making the reservation
process clear and transparent and facilitating online booking. On the other hand, the NVA
activities include tasks that do not raise or increase the market function and form. Some of

14
the examples include filing, copying and recording. Others include waiting, inspecting,
reviewing as well as obtaining approvals. Such tasks and activities need to be eliminated or
reduced.
5.3 Opportunities to Improve Root Cause
This phase entailed the analysis of the restaurant's service operation issues. In this
phase, a fishbone diagram was developed. The diagram identifies the reason why the services
provided by the restaurant are inconsistent and the areas that face the highest inconsistent
levels. To start with, in the booking part of the figure, it is clear that the booking system is not
linked to an online reservation engine; this makes the booking-taking capability to be limited
only to the time when an employee is available at the reception. Considering the delay
challenge that it exposes the organization to, this should be an area that should be improved.
Thus, this provides the organization with an opportunity to improve the root cause.
Also, the system does not trace client preferences or behaviour. Therefore, the
customers may fail to feel or have the perception that their preferences or loyalty is being
considered. In addition, in the people part of the diagram, one can see that both the rural
location as well as the seasonality of the restaurant makes it challenging to hire as well as
obtain a highly dedicated staff; these two factors lead to a high turnover as well as high
training costs. Employee turnover leads to a need for the recruitment of new employees and
training of the same. Employee training is an expensive undertaking (Yin, 2018). As evident
in the defined section or phase, it is clear that the restaurant does not provide any kind of
service guarantees. In addition, there is no sufficient staff who can help in handling the entire
reservations coming in. In addition, the phase shows that there exists no system that could
help in handling all the incoming reservations, especially when there is no present staff.

15
Figure 7: Fishbone diagram for Saucy Lodge
6 Improvement phase
The main task or activity in the improvement phase is determining the solutions to the
problems that have been identified during the first three phases. During this step, teams focus
on eliminating the root causes. In addition, it entails the implementation of the improvements.
Furthermore, the team should design the action plan for purposes of monitoring the
continuous enhancements.
6.1 Experiments Solutions
This part of the case study shows proposed service blueprints. One of the proposed
strategies is for the restaurant to provide an increased streamlined service system. The
system could be achieved by investing in recruiting as well as retaining top-notch talent
notwithstanding the challenges the organization faces. In addition, it is recommended that
the company should consider raising the hours during which their employees are present in
the reception so as to answer calls and take reservations. Similarly, it is recommended that
the company should invest in an online booking engine; this is important since it would
ensure that the guests are responded to even when the restaurant is closed or after staff leave
the facility. What is more, the company should also consider consistently determining to

16
enhance the company’s service as well as investing in the training of the entire staff. This is
what Yin (2018) recommends. The proposed blueprint is evident in the figure below. The
figure shows the projected changes from check-in to check out. As evident from the figure,
the primary distinction between the current and the proposed system is the fact that by having
an online reservation system, the client experience is likely to be increasingly flawless. The
proposed system helps in producing a precise itemized bill that contains all charges in one
instead of providing several multiple bills.
Figure 8: Saucy Lodge projected service proposal from check-in to check-out.
In addition, the figure below shows the proposed service process of the restaurant.
Even though with the proposed system the guest could still make a reservation using their
phones, the system also provides them with an option of making a reservation online by using
travel agencies, via the restaurant websites as well as other travel websites that the saucy
restaurant is linked to.

17
Figure 9: Saucy Lodge proposed process of managing guest reservations
6.2 Operating Tolerances
There are various operating tolerances that the new system will work with. Some of
these include slow internet that could affect the working of the system and possible hacking.
7 Control phase
This step entails implementing the actual changes, regardless of whether they are
behavioral, physical or both. It entails rewriting procedures as well as work instructions.
Also, it may include retraining staff on new procedures, installing systems to measure as well
as monitor new processes and finally writing an action plan.
7.1 Process Control and Capability Plan
The control phase would be very important for the organization. During this phase, a
plan would require to be inaugurated for unceasing training, investing in a top-notch labour
force as well as investing in both systems and support. Currently, there is an increase in
employee turnover at the organization. This is a real challenge to the organization because the

18
company will always lose its top-notch employees to competitor organizations. The company
should consider resolving the issues that lead to employee turnover. One of the issues is the
seasonality of the restaurant, which leaves some of the employees without income during or
getting so little income during the low-peak seasons. To improve the seasonality of the
restaurant, the management should consider the introduction of services that could be
accessed and enjoyed throughout the year. This would help to ensure that all the employees
remain engaged in the organization throughout the year. As a result, employee turnover is
expected to decline.
Continuous training is another important activity during the control stage. The hotel
industry keeps on changing. The changing environment in the hotel industry calls for new
skills. For this reason, an organization in this industry should ensure continuous training to
ensure that employees could handle the new expectations as recommended by Yin (2018).
The training should be done every six months and should be department specific. This would
ensure employees in each of the departments have the skills required to meet the customer
expectations.
8 Conclusion
The significance of the DMAIC approach cannot be understated. It is an effective
technique that could help in structured management. The primary emphasis of this tool is the
measurement as well as the analysis, which helps in ensuring that opportunities for growth
and improvement are implemented in a manner that ensures the utmost positive impact. One
of the features that give the tool a competitive edge is the fact that it contains faster cycle
times. The DMAIC tool takes the friction out of improvement. This results in faster cycles as
well as a shorter time towards the realization of a positive change. The augmented visibility,
communication as well as accountability that the solution affords implies that there will be
decreased downtime between all the steps in the enhancement cycle. The faster every

19
enhancement goes from the beginning to the end, the sooner the organization can benefit
from the impact and proceed to the next initiative.
The six sigma tools could help the Saucy lodge improve its service process and ensure
guests’ expectations of the highest-quality service are met. The new model proposed for the
Saucy Lodge would allow guests to access the lodge at all times and is expected to make their
knowledge increasingly faultless and pleasurable. In addition, the recommended investment
in technology would enable clients to do online reservations. However, the introduction of
the new system will call for fresh employee training to ensure the new system does not lead
to new problems, including delays in the delivery of services. It was also proposed that the
company’s management should ensure that the company is connected to travel sites and tour
agents; this would ensure that the company reaches a wide and bigger audience.
Nevertheless, it should be noted that the new changes, especially the linking of the company
to travel agents and travel websites is costly and it calls for new extensive training.
The fact that the organization decided to change to be more effective could be
compared to Jesus’ teachings in Romans 12:2. In this verse, “Change your mind” is the core
theme and he challenges people to change their way of thinking since regardless of how
many times they read the bible if their minds do not change, they would simply impose their
biases as well labels on what they read. The company seemed to have heeded the teachings of
this bible verse and chose to change. The change will lead to seamless access to services and
a consequent increase in customer satisfaction.

20
References
Foris, D., Crihălmean, N., & Foris, T. (2020). Exploring the Environmental Practices in
Hospitality through Booking Websites and Online Tourist Reviews. Sustainability,
12, 10282.
Herhausen, D., Emrich, O., Grewal, D., Kipfelsberger, P., & Schoegel, M. (2020). Face
Forward: How Employees’ Digital Presence on Service Websites Affects Customer
Perceptions of Website and Employee Service Quality. Journal of Marketing
Research, 57, 917 - 936.
Kim, I. (2021). An Empirical Study on the External Environment, Brand Expansion Strategy,
and Core Competence of Business.
Kumar, V., & Hundal, B.S. (2019). Evaluating the service quality of solar product companies
using SERVQUAL model. International Journal of Energy Sector Management.
Motter, D., & Downes, S. (2021). 1189 ENT Emergency Clinic: The Introduction of The
Online Booking System. British Journal of Surgery.
Pekkaya, M., Pulat İmamoğlu, Ö., & Koca, H. (2019). Evaluation of healthcare service
quality via Servqual scale: An application on a hospital. International Journal of
Healthcare Management, 12, 340 - 347.
Raza, S.A., Umer, A., Qureshi, M.A., & Dahri, A.S. (2020). Internet banking service quality,
e-customer satisfaction and loyalty: the modified e-SERVQUAL model. The TQM
Journal, 32, 1443-1466.
Rita, P., Oliveira, T., & Farisa, A. (2019). The impact of e-service quality and customer
satisfaction on customer behavior in online shopping. Heliyon, 5.
Smętkowska, M., & Mrugalska, B. (2018). Using Six Sigma DMAIC to improve the quality
of the production process: a case study. Procedia-Social and Behavioral
Sciences, 238, 590-596.

21
Srinivasan, K., Muthu, S.S., Devadasan, S.R., & Sugumaran, C.P. (2016). Six Sigma through
DMAIC phases: a literature review. International Journal of Productivity and Quality
Management, 17, 236-257.
Talavera, M.G. (2020). Measuring Service Quality in Philippine Banks: An Exploratory
Study Using SERVQUAL and Q-Methodology. Philippine Management Review, 27,
37-56.
Wong, B.M., & Headrick, L.A. (2020). Application of continuous quality improvement to
medical education. Medical Education, 55, 72 - 81.
Yildirim, K.E., Yildirim, A., & Ozcan, S. (2019). Integrated Usage of the SERVQUAL and
Quality Function Deployment Techniques in the Assessment of Public Service
Quality: The Case of Ardahan Municipality. Business and Economics Research
Journal.
Yin, R. K. (2018). Case study research and applications: Design and methods (6th edition).
SAGE, Thousand Oaks, California.

Full Terms & Conditions of access and use can be found at
https://www.tandfonline.com/action/journalInformation?journalCode=tmse20
International Journal of Management Science and
Engineering Management
ISSN: 1750-9653 (Print) 1750-9661 (Online) Journal homepage: https://www.tandfonline.com/loi/tmse20
Application of Lean Six-Sigma methodology
to reducing production costs: case study of a
Portuguese bolts manufacturer
Maria do Rosário Cabrita, João Pedro Domingues & José Requeijo
To cite this article: Maria do Rosário Cabrita, João Pedro Domingues & José Requeijo (2016)
Application of Lean Six-Sigma methodology to reducing production costs: case study of a
Portuguese bolts manufacturer, International Journal of Management Science and Engineering
Management, 11:4, 222-230, DOI: 10.1080/17509653.2015.1094755
To link to this article: https://doi.org/10.1080/17509653.2015.1094755
Published online: 13 Nov 2015.
Submit your article to this journal
Article views: 1106
View related articles
View Crossmark data
Citing articles: 2 View citing articles

InternatIonal Journal of ManageMent ScIence and engIneerIng ManageMent, 2016
Vol. 11, no. 4, 222–230
http://dx.doi.org/10.1080/17509653.2015.1094755
Application of Lean Six-Sigma methodology to reducing production costs: case
study of a Portuguese bolts manufacturer
Maria do Rosário Cabrita, João Pedro Domingues and José Requeijo
unIdeMI, department of Mechanical and Industrial engineering, faculty of Science and technology, fct, universidade nova de lisboa, 2829-516
caparica, Portugal
ABSTRACT
This study describes a procedure that applies the Lean Six-Sigma approach to reducing the production
costs of a Portuguese bolts manufacturer. The project was proposed by the product’s customer,
who suggested improving some parameters of the processes associated with its manufacture. The
customer’s expectations and requirements are called ‘Voice Of the Customer’ (VOC) focusing on the
reduction of production costs. Bolts manufacturing has some particularities, such as the considerable
lot-size and the high level of products produced. Some of the important Six-Sigma and Lean tools are
discussed, which will be of help to Six-Sigma practitioners. The empirical study illustrates methods
used to Define, Measure, Analyse, Improve and Control (DMAIC) the Six-Sigma approach. This study
consolidates the efficiency and the excellence of the DMAIC methodology, providing arguments to
demonstrate its usefulness for the implementation of improvements, both in terms of quality and in
terms of the effectiveness and efficiency of the processes. This case reveals that there exists an important
complementarity between the methodology used and the Lean Six-Sigma concepts when dealing
with a continuous improvement project in the context of bolts manufacturing. The findings reinforce
conclusions from other studies that the DMAIC methodology can be used in any improvement project,
and not just for Six-Sigma projects, whence the methodology emerged.
© 2015 International Society of Management Science and engineering Management
JEL CLASSIFICATION
l23; l60; d24; M20
ARTICLE HISTORY
received 22 May 2015
accepted 12 September 2015
CONTACT Maria do rosário cabrita [email protected]
1. Introduction
Implementation of the Lean management paradigm in man-
ufacturing is a way of allowing an organization to attain its
objectives and, consequently, better competitiveness in the
market. This paradigm, along with the various methodologies
associated with it, allows an organization to focus on rational-
ization of its resources and on the elimination of all activities
that do not aggregate value to the product. Thereby, with the
elimination of waste, it is possible to verify an increase in pro-
duction flexibility, as well as in product quality. The aim of Lean
is to create simplified, efficient value-adding processes while
sharing information. It can be assumed that the implementa-
tion of Lean on the manufacturing systems allows a company
to attend, in a competitive way, the demand of the clients,
reducing at the same time the production costs. Most of the
applications and case studies in this field are descriptions of
how companies have adopted, created, and implemented Lean
principles in their organizations or industry.
Lean manufacturing is a management philosophy derived
mostly from the Toyota Production System (TPS). Lean man-
ufacturing uses less of everything compared with mass produc-
tion. A Lean manufacturing system works with interconnected
processes. Improvement in one area will improve the system as
a whole. A widely accepted definition of Lean manufacturing
is a ‘systematic approach to identify and eliminate waste (non
value-adding activities) through continuous improvement by
flowing the product at the pull of the customer in the pursuit
of perfection’ (Brue & Howes, 2006; Weigel, Suen, & Gupte,
2013). It focuses on reducing the business cycle time so as to
become more responsive to customer demand, while using
fewer resources and improving products and processes. These
materialize in lower costs, increased productivity and highly
profitable and flexible production capability – i.e. overall, in
increased operational efficiency.
Lean production is a production system that aims at con-
tinuously reducing the time between client order and delivery,
and eliminating everything that adds unnecessary costs and
time to the production of the products. Broadly speaking, Lean
production aims to increase the organization’s productivity,
maximizing the output and minimizing the input, so improv-
ing the efficiency and effectiveness of its processes (Bhasin &
Burcher, 2006; Corbett, 2007).
Six Sigma as a powerful business strategy has been well rec-
ognized as an imperative for achieving and sustaining oper-
ational and service excellence (Aghili, 2009; Kumar, Antony,
Madu, Montgomery, & Park, 2008). Lean Six Sigma is the
application of Lean techniques to increase speed and reduce
waste, while employing Six Sigma processes to improve quality
and focus on the Voice Of the Customer (VOC). Therefore,
both Lean and Six Sigma together are proven methodologies
that increase efficiency, effectiveness and quality, resulting in
continuous improvement to increase value for the customer
(Assarlind, Gremyr, & Bäckman, 2013).
Existing literature explicitly identifies higher customer sat-
isfaction as a significant benefit from the integration of Lean
and Six Sigma concepts (Teresko, 2008; Thomas, Barton, &
Chuke-Okafor 2009) but it does not demonstrate a consensus
on how to create such integration. The purpose of this study is
KEYWORDS
dMaIc methodology; lean
Six Sigma; Portuguese bolts
manufacturing; process
improvement; value; Voice of
the customer (Voc)

InTeRnATIOnAL JOuRnAL Of MAnAgeMenT SCIenCe AnD engIneeRIng MAnAgeMenT 223
measuring, analysing, improving and controlling processes
(Kwak & Anbari, 2006).
Six Sigma is a discipline with formal steps for improving
process performance. The sequential steps are called The Six
Sigma Improvement Model, or the Define, Measure, Analyse,
Improve and Control Methodology (DMAIC), as developed
in the following section.
3. DMAIC methodology
Existing literature explicitly identifies higher customer satis-
faction as a significant benefit from the integration of Lean
and Six Sigma concepts (Teresko, 2008; Thomas et al., 2009)
but it does not demonstrate consensus on how to create such
integration. The first step to implement Lean Six-Sigma is to
identify the critical elements of a process. Then the team anal-
yses its capability and tries to stabilize itself by reducing or
eliminating variations. The basic transfer function is applied,
which depends on a few vital factors. The foundation of Lean
Six Sigma is to look at products/services through the customer’s
eyes and determine how improvements can eliminate ‘waste’.
The Lean Six Sigma process is broken down into five inter-
connected stages: Define, Measure, Analyse, Improve and
Control (DMAIC), as depicted in Figure 2. This sequence of
events for any project makes the process systematic, scientific,
fact based and data driven. The DMAIC process is the centre-
piece of the Six-Sigma problem-solving methodology, and is
recommended for the systematic handling of any project. The
tools of Six Sigma and operational excellence are most often
applied within the framework of DMAIC. As such, DMAIC is
an integral part of a Six Sigma initiative. It is systematic and fact
to explore the application of Lean Six Sigma tools aiming at the
reduction of production costs in bolts manufacturing via the
Define–Measure–Analyse–Improve–Control (DMAIC) meth-
odology. In adressing this objective, each phase of the DMAIC
cycle follows the principles proposed in the literature. Beyond
the current section, the paper has been structured as follows:
Section 2 introduces the Lean Six-Sigma benefits; Section 3
explores the principles followed using the DMAIC methodol-
ogy; Section 4 describes the application of case study in PSF
company, and; Section 5 ends the article with the conclusion
and managerial implications.
2. Lean Six-Sigma benefits
Lean Six Sigma is a blend of two improvement methods: Lean
and Six Sigma. Lean and Six Sigma complement each other.
Lean accelerates Six Sigma, delivering greater results than
would typically be achieved by Lean or Six Sigma individually.
Combining these two methods we build a comprehensive tool
set to increase the speed and effectiveness of any process within
your organization – resulting in increased revenue, reduced
costs and improved collaboration. Pepper and Spedding (2010)
argue that Lean was the contributor of strategy and structure
that would drive improvements, while Six Sigma contained the
‘tools to leverage improvement to its full potential’. Arnheiter
and Maleyeff (2005) referred to Lean Six Sigma as an inte-
grated entity that incorporates the benefits of both Lean and
Six Sigma.
In essence, the principles of Six Sigma have been derived
from Total Quality Management (TQM) theory. However,
its structured and systematic framework, combined with the
employment of statistical techniques, makes it an excellent
tool for process diagnostics. Central components of Lean Six
Sigma’s two underlying concepts have been derived theoreti-
cally, which is one of several ways of deconstructing Six Sigma
and Lean.
We may say that Lean is anchored in four concepts: Lean
tools and techniques – notably value stream mapping (Alukal,
2003; Womack, 2006), involvement of people (Holbeche, 1997),
continuous improvement (Ricondo & Viles, 2005) and removal
of waste (Alukal, 2003). Similarly, Six Sigma can be said to be
based on seven elements: DMAIC (Hoerl, 2004), the Six Sigma
toolbox (Magnusson, Kroslid, & Bergman, 2003), Six Sigma
organization (Hoerl, 2004; Magnusson et al., 2003), reduction
of variation (Nave, 2002), customer focus (Bergman & Klefsjö,
2003), decisions based on facts (Goh & Xie, 2004) and bottom
line focus (Goh, 2002).
Organizations can utilize Lean Six Sigma for continuously
improving their business processes (Aguezzoul & Nyoungue,
2012; Snee, 2010). Lean is a philosophy that reduces or elim-
inates unnecessary time, materials and effort. Six-Sigma is
a concept designed to improve the overall effectiveness by
defining, measuring, analysing, improving and controlling pro-
cesses. Lean Six Sigma allows organizations to reduce expenses
and improve productivity, as defined in Figure 1.
Therefore, Lean Six Sigma refers to an analytical business
process that enables companies drastically to improve their
profitability by designing and monitoring everyday business
activities in ways that minimize waste and resources (Habidin
et al., 2012). The prime directive is continually to seek out and
eliminate waste and wasteful practices. Six Sigma is a concept
designed to improve the overall effectiveness by defining,
Figure 1. the benefits of using lean Six Sigma.
Figure 2.the dMaIc methodology.

224 M. D. R. CABRITA eT AL.
based and provides a rigorous framework of results-oriented
project management.
At the definition step, a problem is identified and it is deter-
mined which aspect of a particular process is to be improved.
At the measurement step, a baseline is developed of how that
system, process or issue is functioning. At the Analyse step,
the root causes of the problem are analysed by using the data
gathered during the measurement phase. Step 4 is the improve-
ment process. Changes are identified and implemented during
this phase. The changes (or solutions) are designed collectively
to improve the process. Changes may include the complete
removal of some steps in a process or the introduction of tools
to improve those that remain. Finally, control is the handover
to the process owner who commissioned the project.
The DMAIC cycle provides an organized sequence of actions
that are used in the implementation of process improvements
and problem solving. Following a structured method like this,
the creation of hasty conclusions is avoided and an adequate
investigation of alternative solutions to a given problem is
ensured. Through frequent and continuous revisions at each
stage of the DMAIC cycle, organizational leaders can monitor
and ensure the proper execution of each phase of project imple-
mentation (Schroeder, Linderman, Liedtke, & Choo, 2008).
4. Case study
The case study is developed with a Portuguese bolts manu-
facturer. For reasons of confidentiality, the company is called
PSF herein. By adoptin the Six-Sigma method, PSF was able to
understand fluctuations in a process that allowed it to pinpoint
the causes of the problem. This case study demonstrates that
there is a need for manufacturing companies to have a system-
atic methodology in carrying out the improvement processes
through the Six-Sigma concept. A suitable process improve-
ment methodology based on Six Sigma is needed to ensure
proper and systematic process flow to achieve the improvement
(Chakravorty, 2009; Goffnett, 2004; Schroeder et al., 2008).
Therefore, in order to demonstrate the applicability of the pro-
cess improvement methodology, the methodology was adopted
in a phase-by-phase approach as shown in Figure 2. Detailed
discussion of each phase is given as follows.
Define
Our study discusses the processes associated with a particular
product (the MSC screw), manufactured by the company PSF,
whose production is standard but not continuous. The project
was suggested by the product’s customer, who felt the need to
improve some parameters of the processes associated with its
manufacturing. Therefore, in this case, the project definition
was accomplished by a final customer, who is very important
for PSF, representing a quite significant percentage of its sales
(the product is the second most manufactured by PSF). Thus,
this project has automatically become a priority and sponsored
by the administration of both companies (PSF and the client
company). The needs and expectations of this product’s cus-
tomer were established, which served as the basis for delineat-
ing the project’s goals. The mission of the project was to attain a
global improvement of several parameters associated with MCS
manufacture, namely the improvement of the effectiveness and
efficiency of the procedural processes through the implemen-
tation of Lean Six Sigma tools and methodologies. Basically, it
was expected that Lean Six Sigma would help to maximize the
organization’s efforts toward delivering a satisfactory product to
the customer, allowing the company to allocate resources/reve-
nue produced from newly improved processes towards growing
its business. More specifically, the client requested that PSF’s
administration improve some parameters associated with the
manufacture of this product as shown in Figure 3, which repre-
sents the tool ‘Voice Of the Customer’ (VOV). The importance
of this tool is considerable, since it consists in setting the data
that represent the needs and expectations of customers and
their perceptions regarding the products manufactured by the
company (Chakravorty, 2009).
Based on the improvement requirements provided by the
customer, it was possible to define the critical quality char-
acteristics, represented in the tool critical-to-quality tree in
Figure 4. Such characteristics compose the metrics that should
be monitored throughout the project in order to improve
them.
The characteristics to be improved that were identified
as having a direct influence on the production costs of the
company comprized the production downtime and the stock
level along the production flow. These two characteristics were
defined because both have had significant impact in the com-
pany’s performance. The aim of reducing the stock level by
10% was derived from the analysis of the company’s histor-
ical reports. In line with the customer’s requirements, it was
intended that providing a better service to the customer would
require reduced stock levels, resulting in streamlined processes
with products being completed faster and more efficiently at
no cost to quality.
Focusing on those two characteristics, improvements in
the parameters requested by the customer were expected to
be obtained. Having defined the characteristics to be improved,
a statement of the project can then be reported (Table 1), based
on what the project is intended to achieve. This tool can be
considered the identity card of the entire project (Chakravorty,
2009).
Measure
Measure is the second step of the Six-Sigma methodology.
A baseline measure is taken using actual data. This measure
becomes the origin from which the team can gauge improve-
ment. It is within the Measure phase that a project begins to
take shape and much of the hands-on activity is performed. The
goal of Measure phase is to establish a clear understanding of
VOC
Characteristic
Demand is expected to increase in the coming years.
For this reason, it is considered important to negotiate
a reduction of the purchase cost of the product
Production Costs
Figure 3.Voice of the customer (Voc).
Figure 4.critical-to-quality tree.

InTeRnATIOnAL JOuRnAL Of MAnAgeMenT SCIenCe AnD engIneeRIng MAnAgeMenT 225
(3) Heat treatment buffer. The part is taken to an inter-
mediate output buffer for heat treatment. This buffer
is supplied by production teams and emptied by the
team responsible for heat treatment.
(4) Heat treatment. At this stage, the part is introduced
into quenching and tempering furnaces, which have
a processing capacity of, respectively, 1000 kg/h and
2000 kg/h. Tempering is one of the processes used
in the heat treatment of metals for increasing hard-
ness and endurance by heating to high temperature
and then fast cooling. Quenching is a heat treatment
that aims to correct flaws resulting from tempering,
which can make the steel overly rigid and fragile and
cause internal stress in the material.
(5) Intermediate buffer. The part is placed in an inter-
mediate buffer and is not yet in its final shape.
This buffer has the function of supplying the team
responsible for surface treatment, which is under
subcontract.
(6) Surface treatment. In this phase, the part is shipped
for the company responsible for this process, in
which the part is the target of zinc and nickel bathing.
(7) Sorting and packaging. The part returns to a buffer
in the factory and is taken for quality control. The
parts are unitarily verified and all the relevant meas-
ures – already specified by the customer – are ana-
lysed. The control is made automatically. Parts that
lie outside specifications are replaced at the input of
the machine, because good part rejection is possible.
This kind of error is due to inadequate positioning
of the product while being analysed by the machine,
resulting in a high rate of rework (in order of 30%).
Good parts are automatically placed in packages that
the current state of the process the company wants to improve.
In this phase, a detailed study of the MCS product production
flow was developed. For that, the Value Stream Map (VSM) is
a very useful tool, which gathers all information for the exe-
cution of the tasks to be performed at this stage of the meth-
odology (Rother & Shook, 2009). A simplified VSM includes
all the metrics identified at the Define stage, as well as others
that can be relevant for the project’s scope. Theoretically, many
authors consider that there will be a lack of reliability of existing
company data, so there will be a need to verify this reliability.
To accomplish this requirement, the company uses an infor-
mation system that aims at continuous data updating, which
entails the assumption that its collection is reliable and feasible.
The production flow in the VSM is detailed in the following
steps.
(1) Supply. The raw material used in the manufacturing
of this product is bought from one supplier, being
steel coils of 80 meters length. The delivery lead time
of this raw material, after placement of the order, is
about eight weeks. However, the delivery frequency
is usually three months. The coils are kept outside the
factory, in a park specifically for that purpose.
(2) Fabrication. Each coil of raw material is first sub-
jected to a pickling treatment in order to remove
inorganic impurities and rusting. The target of the
wiredrawing process is to reduce its cross section.
The material is continuously and automatically cut,
then introduced into the stamping machine where
the part undergoes plastic deformation in two stages.
Finally, the part is subjected to a process of thread-
ing, where it undergoes a process of deformation by
combs. Each coil enables the production of about
200,000 bolts.
Table 1.Project charter.
Name of the project:
Improvement of the effectiveness and efficiency of the processes associated with McS manufacturing.
End date of the project: September 2013
Mission of the project:
global improvement of several parameters associated with McS manufacturing, aiming at the improvement of the effectiveness and efficiency of the practice of
processes, through the implementation of lean Six-Sigma tools and methodologies.
Scope of the project:
It is intended to meet the customer’s improvement requirements for the costs of production in order to achieve an expected decrease in purchase cost and
increase in future demand.
Description of the problem:
the customer wants to improve the parameters of McS manufacturing processes in order to reduce production costs and, consequently, purchase cost.
Definition of goals:
the following target is proposed to be achieved by September 2013: 10% reduction in stock level.
History of problems:
History of stock levels – see appendix B;
Restrictions and assumptions:
Impossibility of monitoring all phases of the dMaIc cycle (specifically the control phase), due to the short timeline of the project.Implementations will be done
on a small scale and on one particular product, so the improvements obtained do not involve global processes. the extrapolation of the improvements carried
out shall be made in the future.
Team for the project:
champion – general managerMaster black belt – Production managerBlack belt – two technicians for continuous improvement Pivot element – one technician
for production operations
Preliminary schedule:
Proposed dates of completion for each phase: Define – 1 february 2013; Measure – 15 March 2013; Analyse – 30 april 2013; Improve – 31 July 2013; Control –
31 december 2013

226 M. D. R. CABRITA eT AL.
registered, the raw material buffer and the occurrence of some
desynchronization in its supply to the stamping machines, the
implementation of a two Kanban cards system was devloped,
linking the processes related to pickling and stamping with
a supermarket principle regulating the production. Thus, the
methodology consists on the following sequence of operations:
when an operator (A) has only one coil of feedstock in the
stamping machine, he should make a request for a new coil, by
completing a transport Kanban and placing it on the Kanban
board. An operator responsible (B) for the transport of material
in the factory, which has a set route, collects the card filled out
by operator A when he passes by the Kanban board. Operator B
carries the collected card to the supermarket where the pickled
material is, placing the card on another Kanban board in the
inlet section (this board has an input section and an output
section) and removing the desired item from the supermar-
ket, which is taken to the stamping machine that requested
it. The operator responsible for the pickling (C), depending
on the material removed from the supermarket, initiates the
processing of a coil with the same kind of material as the one
that was removed, after collecting the transport Kanban that,
at that moment, was converted to a production Kanban. After
pickling, the coil is replaced by operator C in the supermarket.
Theoretically, it is a supply system driven by two Kanban cards
with different functions, but in practice the system is coordi-
nated by only one card that has different functions depending
on its position.
The Kanban system used is associated with two col-
ours– green and red. Each column of the Kanban boards
corresponds to a different stamping machine. Each machine
is programmed to take two coils of pickled material, with
one being processed and another in the input buffer. When
the coil in processing is fully processed, the coil at the input
buffer comes to processing and a Kanban card is issued to
order a new pickled coil for placement in the input buffer.
This Kanban card is placed in the column of the respective
machine in the green zone. If the pickled coil that has been
placed in processing is fully consumed without a new coil hav-
ing reached the input buffer, a new Kanban card is issued and
placed in the red zone, meaning that the machine is stopped
for lack of pickled material.
It is important to determine the route to be taken by the
forklift in the supply of pickled materials. For this, the con-
sumption of raw material by the stamping machines was cal-
culated, considering the maximum possible cadence. In this
case, the calculation was based on the following data, belonging
to a machine that manufactures product other than MCS, yet
belonging to the same section of stamping machines where the
Kanban system is being implemented.
• Maximum cadence of the machine: 160parts/minute;
• Number of machines: 5 stamping machines;
• Maximum daily output:
• 160 parts/minute × 60 minutes × 16 hours = 153,600
parts/day;
• Number of parts per coil: 65,574 parts/coil;
• Number of coils needed per day:
• (153,600parts/day)/(65,574parts/coil)=2.34coils/day;
• Consumption time of one coil:
• (65,574 parts/coil)/(160 parts/minute) = 6 hours and
50minutes;
• Maximum number of coils per day: 2.34coils/day×5
machines = 12coils/day;
have previously been positioned in the machine for
that purpose.
(8) Final storage and shipping. The final product is
placed in the warehouse, ready for shipping to the
final customer. Each lot is composed of 48,000
bolts and deliveries are usually made twice a week,
depending on the number of lots ordered. Stock is
controlled by computer and supermarket principles
are followed, whereby maximum and minimum lev-
els of stock are established. This implies that the sort-
ing process supplies the supermarket depending on
the existing stock of final products.
Analyse
The previous steps evidence that a desynchronized process
exists concerning the supply of raw material to the stamping
machine, together with the occurrence of downtimes of that
machine. This finding was obtained through the analysis of
data available on the company’s computer system, whence it
is possible to determine the causes of losses related to machine
availability. Table 2 lists the itemized causes that led to stop-
page of the stamping machine throughout 2012, as well as the
respective downtime. It can be seen that the major cause of
machine stoppage is due to the lack of raw material, with a
relative percentage of occurrence of about 29.5%, this being
the failure on which improvement actions will be taken. At the
same time, high and unbalanced stock levels were recorded,
taking into account the existence of various types of raw mate-
rial according to their composition.
To meet the goals outlined for this project, in particular
the reduction of production costs, it is important to adopt
measures to improve the production’s synchronization and
to avoid production stoppages, which only entail costs and
no benefits. The main cause for the occurrence of these two
problems is related to the difficulty of communication between
the worker responsible for the supply of stamping machines,
the workers responsible for stamping and the workers respon-
sible for pickling. Taking into account the fact that the buffer
of pickled material is located in a different building from the
one where the stamping process takes place, communication
between these two workstations and the supply are irregular
and desynchronized. The failures associated with this section
of the production flow, as well as their effects and their causes,
are shown in Table 3, which sets forth the application of the tool
Failure Modes and Effects Analysis (Stamatis, 2003). Based on
these problems, the implementation of a system driven by two
Kanban cards between these two workstations can be a viable
solution to the problems found.
Improve
Recently the organization adopted a pull system instead of
push system, which was the basis of the old production system.
Currently, with this system yet to be totally implemented in the
mindset of the entire organization, production is carried out on
the basis of orders from customers, with a well-organized flow
of information going through the whole production flow in the
downstream direction. For the cementation of this type of pro-
duction system, the use of Kanban is fundamental and there-
fore should be implemented (Cimorelli, 2006; Panneerslevam
& Kumar, 2007). Taking into account the high level of stock

InTeRnATIOnAL JOuRnAL Of MAnAgeMenT SCIenCe AnD engIneeRIng MAnAgeMenT 227
of one steel coil in the supermarket of the supply system used
to manufacture the MCS product. Analysing the weekly con-
sumption of the previous year, excluding the special causes
mentioned above, it appears that only four times during the
year were more than three coils consumed in a week. With
the implementation of the supermarket, even if there is a
need to use more than three coils, the pickling process has
sufficient production capacity to meet this need quickly and
without any risk of stock rupture. In periods when the pro-
duction of MCS is not performed, to avoid immobilization
of stock, the pickled material for the manufacture of this
product may be used in the manufacture of other products
with the same type of material, until there are forecasts of
new MCS production.
With the implementation of this tool, it was possible to
obtain the differences shown in Figure 5.
The benefits achieved are as follows.
• Improvement in transparency of processes and in the
ease of its visual management, as well as in the system
of communication between the workstations. There is
a greater independence of each workstation, since they
can manage their work depending on the level of mate-
rial in the supermarket.
• Increased delivery capacity, with reduced possibility of
production downtime due to lack of raw material in the
stamping machine.
• Increased control in the amount of existing stock and a
reduction of its level – a previous average of 1 million
parts to a current average of 500,000 parts – and of the
respective storage space required.
• This supply system also contributes to increasing the
value of the stamping machine’s availability, as it elim-
inates the possibility the machine having to be stopped
for lack of raw material.
• Working hours of the stacker = 8hours/day
• Transport capacity of the forklift: one coil
Thus, the route of the stacker was set to check Kanban board
40 in 40minutes, so there is no risk of delay in supplies (8hours
per day/12coils per day=0.67hours/coil). Besides the route,
it is also necessary to calculate the value of stock that must
exist in the supermarket without having the risk of stock rup-
ture or having an excessive amount of stock. To do this, it is
necessary to take into account the daily consumption of each
type of raw material, as well as the productive capacity of the
pickling process, so that production levelling can be assured.
In this project, it is intended to analyse only improvements in
MCS production flow, which is manufactured on only one of
the stamping Machines, and as such this study will focus on
that product and on its type of material. For this, the compa-
ny’s information system data were used; more specifically, the
values of weekly consumptions of pickled steel coils recorded
in 2012.
Regarding MCS product stamping, being as the machine’s
maximum cadence is 160parts per minute and that it is pos-
sible to manufacture 200,000 parts from one coil, it may be
deduced that the maximum production in a normal working
week (16hours a day, 5days a week) is 3.84 coils or 768,000
parts, under perfect operating conditions. It must be noted
that, in weeks 20 and 28, the consumption of pickled mate-
rials was, respectively, 5 and 4.43 coils. These values exceed
the theoretical maximum due to the execution of overtime
hours during those weeks, thus representing a special cause
of variation. Excluding the null values due to stoppages in
manufacturing the product, it is estimated that the average
weekly consumption of coils in the stamping machine is 2.37.
As such, taking into consideration that there are always two
coils in the stamping machine (one in processing and another
in the input buffer), it is suggested to maintain the existence
Table 2.detail of losses related to stamping machine downtime (in hours).
Month (2012) Lack of raw material end of shift Changeover time Lack of tool exchange of consumable Damaged tool
Others
(<5%)
January 52.77 – – – – – –
february – – – – – – –
March – 34.33 7.83 – – – 0.57
april 170.37 36.73 0.95 – 28.25 31.28 19.57
May 2.38 41.07 3.3 0.4 2.23 43.53 6.25
June – – 41.25 – – – –
July 1.15 – 19.45 13.33 28.67 – 19.95
august – – – 1.8 5.3 – 4.35
September – – 22.9 – 6.4 – 7.83
october – – – – – – –
november 1.25 – 0.75 63.78 9.2 – 40.85
december – – – 3.45 0.02 – 0.83
total 227.92 112.13 96.43 82.77 80.07 74.82 100.2
Percentage 29.5 14.51 12.48 10.71 10.36 9.68 12.97
Table 3.failure modes and effects analysis (feMa) for coil supply for stamping.
fMeA Possible failures Product Process
Process function Mode (s) effect (s) Cause (s)
Current
control S O D nPR
Supply of
coils to the
stamping
machine
raw material delay in
supplying
stamping
machine
Production
stoppage
communica-
tion failures
non-existent 9 7 7 441
High level of
stock
Higher
production
costs
lack of
control in
the existing
stock level
non-existent 5 7 7 245
notes: S – severity level; O – frequency of occurrence; D – detection probability; nPr – number of Priority risk (=S×O×D), e.g. 9×7×7=441.

228 M. D. R. CABRITA eT AL.
calculating the average of the measurements recorded in the
company’s computer system.
When such measurements are made, it is suggested that the
tasks shown in the diagram represented in Figure 6 be applied.
The last phase of the methodology used in this case study
is of the utmost importance and is vital to ensuring the main-
tenance of the improvements made. Since this phase is an
untimed step, because it can only be considered concluded
when the new methods are totally intrinsic to the organization
and when the improved metrics demonstrate a strong stability,
it was not possible to follow up on this phase for the purposes
of this paper. However, the proposals related to the tasks that
must be performed in the future ensure the correct execution
of this phase.
5. Conclusions
This paper expands the theoretical foundation for combining
Lean and Six Sigma by studying and analysing a practical appli-
cation of the concept. As a result, it provides new factors of
importance for successful Lean Six-Sigma applications, such
as having a clear structure that guides the company in terms
of what components of Lean Six Sigma to apply. Detailing
the practices of the five phases of the DMAIC, the Six-Sigma
empirical study describes and studies the functions and the
efficiency of the bolts manufacturing processes and the same
Control
This phase is the longest stage of the DMAIC cycle, which
requires considerable levels of commitment and involvement
by the team responsible for the project and for the workers. At
this stage, the implementation of control measures regarding
the new parameters of the processes is required, ensuring that
they continue to be practiced. As such, continuous monitoring
of the processes is necessary, focusing on the observation of
the performance of the production flow’s new parameters. In
this sense, several members from the PSF team were respon-
sible for ensuring that the schedule of action items sustained
the improvement(s) that had been achieved. Moreover, to
this selected group were allocated the role of monitoring the
performance of this process. Their role was to maintain close
supervision and training of operatives to achieve further
improvements. SPC charts were used to analyse the down-
time of the stamping machine by plotting data points, control
limits and a centreline. The objective was to monitor process
performance and maintain control with adjustments only when
necessary. SPC charts are used as predictive tools and are part
of a mature predictive maintenance program. Special cause
variation, as distinct from common cause variation, refers to
changes in process performance due to sporadic or rare events
indicating that a process is not ‘in control’. To sustain improve-
ments, the PSF team monitored the level of stocks with the
charts developed in the Measure and Analyse phases of the
improvement process. A review of these charts indicated that
there had been noticeable improvements in most of the activ-
ities – specifically, less variability in activity durations.
In this case study, the implemented Kanban system requires
a strong component of education and continuous training to
pass on to the workers, so that they can learn and interiorize
the new working methods. It is important to maintain control
over the amount of stock between these processes, that being
the main goal of the implemented improvement. Therefore,
for the control of this improvement, it is only necessary to fol-
low up the registration of the amounts of stock, which is quite
affordable and trivial by consulting the computer system that
the company provides. Thus, it is possible to control its evo-
lution over time and, if there is any irregularity, to explore the
possible causes of this decline and take steps to reverse them.
To ensure the monitoring and maintenance of the improve-
ments made, it is essential to measure regularly the parameters
of the processes that have been improved, so the improved
Key Performance Indicators must be measured monthly by
Figure 5.Improvement in parametres.
Measurement and
quantification of Key
Performance Indicators
(monthly average)
Do the values exhibit a
considerable variation?
Control
performed
successfully
Determine the causes of
variation (using Lean
Six Sigma tools)
Solve the problems by
eliminating the causes
of variation and
generating prevention
measures
Yes
No
Figure 6.diagram representing the control tasks to be performed.
Table 4. comparison between the main target of the project and the results
obtained.
Characteristic established goal Result obtained
Stock level -10% -10.75%

InTeRnATIOnAL JOuRnAL Of MAnAgeMenT SCIenCe AnD engIneeRIng MAnAgeMenT 229
implementation of the integrated approach throughout the
organization.
Disclosure statement
No potential conflict of interest was reported by the authors.
Funding
We gratefully acknowledge the support given by UNIDEMI, R&D
unit, Mechanical and Industrial Engineering, Faculty of Science and
Technology, FCT, New University of Lisbon, Portugal.
ORCID
Maria do Rosário Cabrita http://orcid.org/0000-0001-8394-2260
References
Aghili, S. (2009). A six sigma approach to internal audits. Strategic Finance,
90(8), 38–43.
Aguezzoul, A., & Nyoungue, A. (2012). A preliminary analysis on Lean Six
Sigma application in healthcare. In Proceedings of the 9th International
Conference on Service Systems and Service Management (ICSSSM), 2–4
July 2012, Shanghai, PR China (pp. 714–717). Piscataway, NJ: IEEE.
http://dx.doi.org/10.1109/ICSSSM.2012.6252333.
Alukal, G. (2003). Create a lean mean machine. Quality Progress, 36(4),
29–34.
Arnheiter, E. D., & Maleyeff, J. (2005). The integration of lean management
and Six Sigma. The TQM Magazine, 17(1), 5–18.
Assarlind, M., Gremyr, I., & Bäckman, K. (2013). Multi-faceted views
on a Lean Six Sigma application. International Journal of Quality &
Reliability Management, 30(4), 387–402.
Bergman, B., & Klefsjö, B. (2003). Quality from customer needs to customer
satisfaction. Lund: Studentlitteratur.
Bhasin, S., & Burcher, P. (2006). Lean viewed as a philosophy. Journal of
Manufacturing Technology Management, 17(1), 56–72.
Brue, G., & Howes, R. (2006). Six Sigma. New York: McGraw-Hill.
Chakravorty, S. (2009). Six Sigma programs: An implementation model.
International Journal of Production Economics, 119, 1–16.
Cimorelli, S. (2006). Kanban for the supply chain – Fundamental
practices for manufacturing management. New York: Productivity
Press.
Corbett, S. (2007). Beyond manufacturing: The evolution of lean
production. The McKinsey Quarterly, 2007(3), 95–96. http://www.
documents.dgs.ca.gov/opsc/Publications/Newsletters/Links/Beyond_
Manufacturing.pdf
Goffnett, S. (2004). Understanding Six Sigma: Implications for industry
and education. Journal of Industrial Technology, 20(4), 1–10.
Goh, T. N. (2002). A strategic assessment of Six Sigma. Quality and
Reliability Engineering International, 18(5), 403–410.
Goh, T. N., & Xie, M. (2004). Improving on the Six Sigma paradigm. The
TQM Magazine, 16(4), 235–240.
Habidin, N. F., Yusof, S. M., Omar, C. M. Z. C., Mohamad, S. I. S., Janudin,
S. E., & Omar, B. (2012). Lean Six Sigma initiative: Business engineering
practices and performance in Malaysian automotive industry. IOSR
Journal of Engineering, 2(7), 13–18.
Hoerl, R. (2004). One perspective on the future of Six Sigma.
International Journal of Six Sigma and Competitive Advantage, 1(1),
112–119.
Holbeche, L. (1997). Motivating people in lean organizations. Oxford:
Butterworth-Heinemann.
Kumar, M., Antony, J., Madu, C. N., Montgomery, D. C., & Park, S. H.
(2008). Common myths of Six Sigma demystified. International Journal
of Quality and Reliability Management, 25(8), 878–895.
Kwak, Y. H., & Anbari, F. T. (2006). Benefits, obstacles and future of six
sigma approach. Technovation, 26, 708–715.
Magnusson, K., Kroslid, D., & Bergman, B. (2003). Six Sigma. The
pragmatic approach. Lund: Studentlitteratur.
Nave, D. (2002). How to compare Six Sigma, Lean and the theory of
constraints. Quality Progress, 35(3), 73–78.
methodology can be extended to numerous other examples
in the industry.
Lean Six Sigma possesses a vast array of tools to improve
productivity and reduce variability in manufacturing compa-
nies. Without a systematic model, such as the one proposed
based on the DMAIC process, companies begin to implement
these philosophies with the misplaced belief that it does not
matter where they start. The proposed model described in this
paper allows companies to adopt a systems approach to the
implementation of Lean Six Sigma.
This case study emphasizes the importance and the rele-
vant impact that the implementation of Lean Six-Sigma phi-
losophy can have on improving the processes of a company.
Thus, the implementation of this management paradigm is a
way that aims at achieving considerable improvements in the
effectiveness and efficiency of the processes carried out by an
organization and it can be an important contribution to the
company’s growth and to establishing a distinguished position
in the market. It was also demonstrated that the DMAIC cycle
is an organized and effective methodology for defining and
implementing improvement opportunities, creating at the same
time a global mentality of continuous improvement.
In this project, we analysed the main causes responsible for
the downtime of the stamping machine. For that, the histori-
cal records of the machine’s downtime in 2012 were analysed,
leading to the identification of a lack of raw material as the
main factor responsible for production stoppages (representing
29.5% of total stoppage time in 2012). Simultaneously, by ana-
lysing the VSM a high average level of stock was found between
the processes of pickling and stamping. The existence of a high
level of stock and the occurrence of line stoppages due to lack
of raw material can only be due to the occurrence of irregu-
larities in communication between the two workstations. As
such, a Kanban supply system was implemented driven by two
cards, which allowed all the problems identified to be solved.
The application of this system resulted in a reduction of 50%
in the average stock level between the two workstations men-
tioned, as well as an increase of 10% in the level of availability
of the stamping machine by eliminating the possibility of lack
of material. This increase resulted in an improvement in the
hourly production capacity of 15%.
It can be argued that the goals initially set for this project
were completed successfully. Implementation of the Lean Six-
Sigma framework in PSF provided an impetus for establishing
best practice within the company. Moreover, it also provided the
company with a performance benchmark on which it could base
future performance enhancement programmes. The proposed
framework for Lean Six-Sigma implementation needs to be val-
idated in different scenarios to establish its validity. This can be
considered as one of the limitations of the proposed framework.
Six Sigma placed a clear focus on getting bottom-line
results. With this project, the company was able to increase
the production capacity of the stamping machine and reduce
production costs while meeting customer requirements. By
reducing the costs of production, it was possible to negoti-
ate the purchase cost of the MCS product with the customer,
implying benefits for both parties. In short, Table 4 summarizes
a comparison between the main target of this project and the
results obtained.
Finally, successful implementation of the proposed inte-
grated framework of Lean and Six Sigma provided an impetus
for bringing a cultural change in the company with systematic

230 M. D. R. CABRITA eT AL.
Snee, R. D. (2010). Lean Six Sigma – Getting better all the time.
International Journal of Lean Six Sigma, 1(1), 9–29.
Stamatis, D. (2003). Failure mode and effect analysis: FMEA from theory
to execution. Milwaukee, WI: American Society of Quality.
Teresko, J. (2008). How to organize for Lean/Six Sigma. Industr y Week,
257(11), 38–41.
Thomas, A., Barton, R., & Chuke-Okafor, C. (2009). Applying lean six
sigma in a small engineering company – A model for change. Journal
of Manufacturing Technology Management, 20(1), 113–129.
Weigel, C., Suen, W., & Gupte, G. (2013). Using lean methodology to
teach quality improvement to internal medicine residents at a safety net
hospital. American Journal of Medical Quality, 28(5), 392–399.
Womack, J. P. (2006). Value stream mapping. Manufacturing Engineering,
136(5), 145–155.
Panneerslevam, R., & Kumar, C. (2007). Literature review of JIT–Kanban
system. International Journal of Advanced Manufacturing Technology,
32, 393–408.
Pepper, M. P. J., & Spedding, T. A. (2010). The evolution of Lean Six
Sigma. International Journal of Quality and Reliability Management,
27(2), 138–155.
Ricondo, I., & Viles, E. (2005). Six Sigma and its link to TQM, BPR, Lean
and the Learning Organization. International Journal of Six Sigma and
Competitive Advantage, 1(3), 323–354.
Rother, M., & Shook, J. (2009). Learning to see: Value stream mapping to add
value and eliminate MUDA. Cambridge, UK: Lean Enterprise Institute.
Schroeder, R., Linderman, K., Liedtke, C., & Choo, A. (2008). Six Sigma:
Definition and underlying theory. Journal of Operations Management,
26, 536–554.

DMAIC Case Study (DRAFT) Grading Rubric
Criteria
Ratings
Pts
Case Study ‘Plan’
view longer description
5 to >4 pts
Advanced
Section provides a topic sentence for doing a case study and the
study ‘plan’.
4 to >3 pts
Proficient
Section provides either the topic sentence for doing a case study
or the study ‘plan’.
3 to >0 pts
Developing
Section provides a bullet for doing a case study or the study
‘plan’.
0 pts
Not Present
Not completed.
5 / 5 pts
Define Phase
view longer description
6 to >5 pts
Advanced
Section provides a topic sentence for the Define Phase (with
bullets for key steps such as: customers, problem statement,
resources, crucial support, high-level process map, etc.).
5 to >4 pts
Proficient
Section provides a topic sentence for the Define Phase (with
bullets for only a few key steps such as: customers, problem
4 / 6 pts

statement, resources, crucial support, high-level process map,
etc.).
4 to >0 pts
Developing
Section provides a topic sentence for the Define Phase (with no
bullets for key steps such as: customers, problem statement,
resources, crucial support, high-level process map, etc.).
0 pts
Not Present
Not completed or not related to requirements for the section.
Measure Phase
view longer description
6 to >5 pts
Advanced
Section provides a topic sentence for the Measure Phase
(includes key steps such as: defects, opportunities, units, metrics,
data collection plan, validating the measurement system, etc.).
5 to >4 pts
Proficient
Section provides a topic sentence for the Measure Phase (with
bullets for only a few key steps such as: defects, opportunities,
units, metrics, data collection plan, validating the measurement
system, etc.).
4 to >0 pts
Developing
Section provides a topic sentence for the Measure Phase (with no
bullets for key steps such as: defects, opportunities, units,
metrics, data collection plan, validating the measurement system,
etc.).
0 pts
Not Present
4 / 6 pts

Not completed or not related to requirements for the section.
Analyze Phase
view longer description
6 to >5 pts
Advanced
Section provides a topic sentence for the analyze phase (includes
key steps such as: performance objectives, value vs NVA,
opportunities to improve root cause, variation, etc.).
5 to >4 pts
Proficient
Section provides a topic sentence for the analyze phase (with
bullets for only a few key steps such as: performance objectives,
value vs NVA, opportunities to improve root cause, variation,
etc.).
4 to >0 pts
Developing
Section provides a topic sentence for the analyze phase (with no
bullets for key steps such as: performance objectives, value vs
NVA, opportunities to improve root cause, variation, etc.).
0 pts
Not Present
Not completed or not related to requirements for the section.
4 / 6 pts
Improve Phase
view longer description
6 to >5 pts
Advanced
Section provides a topic sentence for the Improve Phase
(includes key steps such as: experiments, solutions, operating
tolerances, implementing the best solution, etc.).
5 to >4 pts
Proficient
4 / 6 pts

Section provides a topic sentence for the Improve Phase (with
bullets for only a few key steps such as: experiments, solutions,
operating tolerances, implementing the best solution, etc.).
4 to >0 pts
Developing
Section provides a topic sentence for the Improve Phase (with no
bullets for key steps such as: experiments, solutions, operating
tolerances, implementing the best solution, etc.).
0 pts
Not Present
Not completed or not related to requirements for the section.
Control Phase
view longer description
6 to >5 pts
Advanced
Section provides a topic sentence for the Control Phase (includes
key steps such as: standards, process control/capability,
documentation/report, etc.).
5 to >4 pts
Proficient
Section provides a topic sentence for the Control Phase (with
bullets for only a few key steps such as: standards, process
control/capability, documentation/report, etc.).
4 to >0 pts
Developing
Section provides a topic sentence for the Control Phase (with no
bullets for key steps such as: standards, process
control/capability, documentation/report, etc.).
0 pts
Not Present
Not completed or not related to requirements for the section.
4 / 6 pts

ID’d the Lean Six Sigma Tools
view longer description
5 to >4 pts
Advanced
ID’d 3 or more Lean Six Sigma Tools.
4 to >3 pts
Proficient
ID’d 2 Lean Six Sigma Tools.
3 to >0 pts
Developing
ID’d 1 Lean Six Sigma Tool.
0 pts
Not Present
No Lean Six Sigma Tools.
5 / 5 pts
References and Citations
view longer description
5 to >4 pts
Advanced
References >10
4 to >3 pts
Proficient
References = 10
3 to >0 pts
Developing
References <10
0 pts
Not Present
No References
5 / 5 pts
APA Format & Structure
view longer description
5 to >4 pts
Advanced
Required section headings included.
4 to >3 pts
3 / 5 pts

Proficient
Most required section headings included.
3 to >0 pts
Developing
Partial section headings included.
0 pts
Not Present
No structure provided.
Total Points: 38

BUSI 830
Page 1 of 3
DMAIC CASE STUDY (FINAL) ASSIGNMENT INSTRUCTIONS
OVERVIEW
In this final Module: Week, you will synthesize the qualitative research methodology of Case
Study research (and applications) (Yin, 2018) as well as the practical use of Lean Six Sigma
(Hall & Scott, 2016; George et al., 2005) to develop a business-facing DMAIC-based case study.
Also, the seven article readings and your own supporting research has provided a variety of
example designs to include single-case holistic to multiple-case embedded case studies.
INSTRUCTIONS
After reviewing the Learn material for this Module: Week and review of the rest of the course, in
current APA format, design a comprehensive (non-Kaizen) DMAIC Case Study integrated with
Lean Six Sigma tools and biblical worldviews. This must include a plan overview section, as
well as design, measure, analyze, improve, control phases.
Create a real-world case (that is, make sure the story is believable, i.e. it consists of sequence of
time and events, problems and issues to solve, identities [positions/titles] and so on.) Sanitize all
names and use only fictitious data. Use at least 3 Lean Six Sigma tools (George et al. (2005) by
chapter [e.g. a value stream mapping and process flow tool, a data collection tool, an identifying
and verifying causes tool, etc.]) and show your work (i.e. if using a value stream map,
measurement selection matrix, scatter plot, etc.; design a graph, chart, or figure as appropriate,
insert, and refer to such as per APA.) If there could be any doubt, the emphasis of this project is
the DMAIC Case Study process. (HINT: The Cabrita et al. (2016) article serves as an excellent
example.)
Required Format
This 2400 minimum, 3000 maximum word paper needs to be written with these main sections:
Cover page
Abstract
Introduction
Case Study ‘Plan’
Define Phase
Measure Phase
Analyze Phase
Improve Phase
Control Phase
Conclusion
References
Other Requirements
Materials submitted to fulfill requirements in one course may not be submitted in another course.
Concerns about the propriety of obtaining outside assistance and acknowledging sources should

BUSI 830
Page 2 of 3
be addressed to the instructor of the course before the work commences and as necessary as the
work proceeds.
The cover page must include this statement as an author’s note: “By submitting this
assignment, I attest this submission represents my own work, and not that of another
student, scholar, or internet source. I understand I am responsible for knowing and
correctly utilizing referencing and bibliographical guidelines. I have not submitted this
work for any other class.”
In addition to the course textbook(s) and the Bible, this paper must include at least 10
references from scholarly articles that have publication dates no older than 5 years. Do
not use any books other than the Bible and the textbooks. Do not conduct interviews.
There should be at least one instance of biblical integration (at least one scripture
reference).
In-text citations are required to support your statements, points, assertions, issues,
arguments, concerns, paragraph topic sentences, and statements of fact and opinion.
The required cover page, abstract and the reference pages are not included in the required
assignment word count but are required as part of your paper.
The APA required abstract and conclusion section headings and subject headings (see
above) are expected. For papers this length, there should be at least three (3) ‘levels of
headings’.
The introduction and conclusion sections should not be longer than ½ page each since the
assignment is short in word count.
The required abstract should be written as a stand-alone document and not written as an
introduction since an introduction section is required. Therefore, refrain from using
phrases such as, “in this paper,” and do not use citations. See example in APA manual.
Sources of information from Wikipedia, dictionaries, and encyclopedia will not be
accepted.
Paragraph lengths: Each paragraph should have a topic sentence unless it continues from
or provides support to the prior paragraph. A paragraph is defined in this course as being
at least 4 sentences in length.
All parts of the assignment must be based on scholarly and biblical literature.
Avoid clichés, slang, jargon, exaggerations, abbreviations, figurative language, and
language that is too informal and too subjective.
Submit your final document for grading with file name syntax: Last NameFirst Initial
Project#. For example: PhilebaumJ Project8.doc (no .pdfs)
Grading Metrics
Consult the accompanying rubric for how your instructor will grade this assignment. Also, any
form of plagiarism, including cutting and pasting, will result in zero points for the entire
assignment. All quoted materials must be properly cited in current APA format.
Note: Your assignment will be checked for originality via the Turnitin plagiarism tool. The tool
is a starting point for instructors to check overall Academic Integrity and higher scores generally
indicate a higher probability of Academic Misconduct. The higher a score, the higher the

BUSI 830
Page 3 of 3
probability that there are too many quotations included in the narrative, and/or there are passages
that have not been properly cited.

