



Quantitative Analysis: Data Coding, Entry, and Checking
Quantitative Analysis: Data Coding, Entry, and Checking Assignment
BUSI 820: Quantitative Research Methods (B08)
Morgan Littleton – L28044716
Liberty University
February 8, 2026
Respectfully submitted to: Professor Felicia Olagbemi
Author Note
I have no known conflict of interest to disclose.
Correspondence concerning this article should be addressed to Morgan G. Littleton.
Email: mlittleton2@liberty.edu
BUSI 820 - Assignment 1 1

Quantitative Analysis: Data Coding, Entry, and Checking
Table of Contents
Chapter 2: Interpretation Question………………………………………………………..……….4
A1. Chapter 2, Problem 2.1. What steps or actions should be taken after you collect data and
before you run the analyses aimed at answering your research questions or testing your research
hypotheses?………………………………………………………………………………………..4
A1. Chapter 2, Problem 2.2. Why should you label the values of nominal variables?................4-5
A1. Chapter 2, Problem 2.3. Why would you print a codebook or dictionary? ………………….5
A1. Chapter 2, Problem 2.4. What do you do if you look at your data file and see words or
letters instead of numbers? Why is this important to do?.............................................................5-7
A1. Chapter 2, Problem 2.5. Why would you use the Mean function to create a variable, as
we did for the pleasure scale?..........................................................................................................7
A1. a. Chapter 2, Problem 2.6. Why is it important to check your raw (questionnaire) data
before and after entering them into the data editor?.....................................................................7-9
A1. b. Chapter 2, Problem 2.6. What are ways to check the data before entering them?
After entering them…………………………………………………………………………….9-10
Chapter 2: SPSS Problems……………………………………………………………………….10
Q1. Compute the N, minimum, maximum, and mean for all the variables in the College
StudentData.sav files…………………………………………………………………………10-11
Q2. How many students have complete data?…………………………………...…………...11-12
Q3. Identify any statistics on the output that are not meaningful?……………...……………….12
Q4. What is the mean height of the students?..........................................................................12-13
Q5. What is the average height of the same-sex parents?..............................................................13
Q6. What percentage of students are males?.................................................................................13
BUSI 820 - Assignment 1 2

Quantitative Analysis: Data Coding, Entry, and Checking
Conclusion.....................................................................................................................................14
References......................................................................................................................................15
Chapter 2: Interpretation Questions
BUSI 820 - Assignment 1 3

Quantitative Analysis: Data Coding, Entry, and Checking
A1.2.1: Data Preparation Steps
Research Question: What steps or actions should be taken after you collect data and before you
run the analyses aimed at answering your research questions or testing your research hypotheses?
Response
After entering data, researchers compare it to the original questionnaires and perform
descriptive statistics to ensure the minimum and maximums fall within a set range, and any out
of range values means there are errors. Impossible values in categorical variables are identified
through frequency distributions, while the examination of N values uncovers any missing data
that comes as a surprise. Researchers are expected to manually inspect the data view for patterns
that are strange, manually check that the variables that were recoded are transformed correctly,
and check that the saved syntax is correct. The assumption of normality can be checked by
looking at the skewness and kurtosis, and a second independent person checking the work gives
them some triangulation. Researchers must also be watchful for anomalies. Unexpected results
are often the result of data entry errors and they will need to be verified against the raw data. The
underlying data on which statistical analyses are built must be verified to ensure the analyses
support valid conclusions (Morgan et el., 2020).
A1.2.2: Labeling Nominal Variables
Research Question: Why should you label the values of nominal variables?
Response
Upon entering data, researchers must cross-reference what was entered against the
original questionnaires and derive descriptive statistics to ensure the min and max values fall
within the expected. Frequency distributions point out impossible values, while reviewing the N
values indicates missing data that was not expected. Researchers must look out for odd patterns
BUSI 820 - Assignment 1 4

Quantitative Analysis: Data Coding, Entry, and Checking
in the Data View, ensure the transformed recoded variables are correct, check the recode syntax
is correct, and assess skewness and kurtosis to confirm normality. Having a second person
independently check the work offers cross-validation. Researchers must remain vigilant for
outlier data. Data entry errors must be corrected before any further analysis (Morgan et el.,
2020).
A1.2.3: Purpose of Codebook
Research Question: Why would you print a codebook or dictionary?
Response
The codebook records all details related to specific variables, including the names, labels,
value, measurement levels, and statistics. This codebook creates a record that allows other
researchers to understand the variables and replicate the study. It also improves the quality of the
research by finding errors and/or inconsistencies related to the measurement levels. It documents
the institution's knowledge that can be used in longitudinal studies, and provides a means to
increase efficiency when conducting analyses. The codebook is a critical and indispensable tool
to ensure quality and integrity in the research process from prep to publication (Morgan et el.,
2020).
A1.2.4: String to Numeric Conversion
Research Question: What do you do if you look at your data file and see words or letters instead
of numbers? Why is this important to do?
Response
What to Do: If a data file has strings (words or letters) instead of numbers, the
researchers will have to change them to numbers using the Transform → Recode into Different
Variables function in SPSS. Start from the Variable View, search the Type column for the string
BUSI 820 - Assignment 1 5

Quantitative Analysis: Data Coding, Entry, and Checking
variables; for the Input Variable box, group the variables that have the same rating scale, and
give new numeric variable names as well as some descriptive labels. Then, assign numeric codes
to the text responses (ex. “Strongly Disagree” = 1 to “Strongly Agree” = 5) such that the bigger
the number, the more it represents the construct you are measuring, and then click “Add” after
each coded response (Morgan et el., 2020).
After naming the file to save the syntax and describing it, you will have to execute your
recode and confirm that the variables are the new numeric variables. Then, you will need to
assign value labels, set the correct measurement level, and spot check to ensure that you are
correct. Most of the statistical procedures need to have numeric data, which is why this is
needed. Also, just switching the Type column from “String” to “Numeric” will cause all the data
to disappear. The Transform → Recode will help to code all of the participants in the same way,
it provides a documented way of doing this as the syntax will be saved, and most importantly, it
will allow for the analysis to be done while keeping the data as it is and allowing the research to
be replicable and transparent.
Why This Is Important: String variable conversion is vital since most procedures in
SPSS are based on numeric data. Analyses of discrimination, description, and association such as
means, correlations, t-tests, and regressions are not possible without conversion. Using
Transform → Recode, means data integrity is uninterrupted. In contrast, transforming the Type
column from "String" to "Numeric" results in irreversible data loss. With the recode function, the
same code is applied across participants which helps to eliminate bias and create permanent
syntax. This supports transparency and replicability. Other advantages of the numeric format
include faster calculations, consistent coding for the same results across studies, easier
BUSI 820 - Assignment 1 6

Quantitative Analysis: Data Coding, Entry, and Checking
comparisons and meta-analyses. This is the reason why conversion is important in quantitative
analysis and scientific rigor.
A1.2.5: Using the Mean Function
Research Question: Why would you use the Mean function to create a variable, as we did for
the pleasure scale?
Response
The Mean function builds composite scale variables by averaging the responses from the
items available to each participant rather than providing missing values when an item is blank.
For instance, MEAN(item02, item06r, item10r, item14) enabled all 75 respondents to get scores
on the pleasure scale, which would not have been the case if any participant had been given a
missing score on this item. Scores would have been unnecessarily truncated, which would have
caused bias in the results. By preserving the response range for the individual items (in this case
a 1-4 rating) composite scales that average multiple items are more reliable than single items
because they reduce random error. SPSS allows specifying averaging thresholds to balance
sample size with measurement validity. For example, MEAN.3 would require at least 3 out of 4
items to be scored (in a case where the average is calculated). However, it is the responsibility of
the researcher to ensure that participants have enough measurements to represent the underlying
construct (Morgan et el., 2020).
A1.2.6: Checking Raw Data
Research Question: (a) Why is it important to check your raw (questionnaire) data before and
after entering them into the data editor? (b) What are ways to check the data before entering
them? After entering them?
Response
BUSI 820 - Assignment 1 7

Quantitative Analysis: Data Coding, Entry, and Checking
Part A: Importance of Checking Raw Data
Before Data Entry: Verifying the initial questionnaire raw data allows the researcher to
document the data collection context, clarify data collection ambiguities, and avoid unclear
instructions as to how to deal with specific data collection concerns. Having consistent, defined
criteria allows the researcher to avoid biases in the systematic approach as opposed to the ad-hoc
approach that can occur during data entry.
Identifying double-tap issues, responses made between rating intervals, and unclear
handwriting in early stages allows the researcher to clarify participant intent and/or decide on
case resolution, especially in the absence of a well-defined guideline. Recognizing certain
patterns of high response frequencies also points to issues that can be addressed concerning
either poor questionnaire design, assisting the researcher in developing the subsequent data
collection plan (Morgan et el., 2020).
After Data Entry: Post data entry verification is a must. No matter how intentional the
entry, human error always exists. Some of the most damaging data entry errors that can ruin the
entire statistical analysis include transposed entries (for example, entering "2.67" in place of
"9.67"), skipped fields, or misguiding handwriting.
In post-entry checking, the entered values are compared to the values on the source
documents to determine if they are within the acceptable range. This stage identifies both
systematic errors (e.g. entering values in the wrong column, which occurs consistently) and
random errors to prevent them from contaminating analyses. The detection and correction of
errors at this stage is much more efficient than the detection after a series of complicated
statistical analyses, which would mean that all affected analyses would have to be redone.
BUSI 820 - Assignment 1 8

Quantitative Analysis: Data Coding, Entry, and Checking
Post-entry checking also ensures that data transformations (recoding, reverse scoring, and
the computation of a composite variable) have been done correctly, thus providing, the certainty
that the variables to be analyzed do indeed measure what the researchers intend them to measure.
Part B: Techniques for Verifying Data
Before Entering Data: Before researchers can enter data, they must perform a visual
inspection of each questionnaire for omissions, poor clarity, or invalid responses, each of which
must be systematically recorded and managed through a separate, identified master list. Each
researcher must document how they would systematically answer each of the categorized issues
(for example, “enter the midpoint for responses between two values” or “exclude questionnaires
with three or more blank items”) and be consistent in doing so for each participant. Each coding
decision must be documented on the questionnaires (best made with a pen of a colour different
from the questionnaires and different from any colour already on the documents) to guide and
help the data entry staff who will be entering data for that particular participant. Finally, each
researcher must check that the answers to each questionnaire are within the range of the pre-
determined acceptable values so that the range of out-of-range responses does not suggest
problems or errors on the part of the respondents.
After Data is Entered: Once data is entered, researchers check the data against the
original questionnaires, run descriptive statistics, and confirm the values are within an acceptable
range. Any irrelevant values, such as a GPA of 9.67, indicate a data entry error. In SPSS,
frequency distributions show out of range values for a given category, and the N values show
unaccounted for missing data. This also confirms SPSS correctly coded the missing values.
Researchers should visually scroll through Data View for unusual patterns, spot-check
problematic cases, manually verify that recoded variables transformed correctly, and review
BUSI 820 - Assignment 1 9
Quantitative Analysis: Data Coding, Entry, and Checking
saved syntax to ensure commands and variable names are accurate. Checking skewness and
kurtosis verifies normality assumptions, and independent verification by a second person
provides cross-validation (Morgan et el., 2020).
Throughout analysis, researchers must remain vigilant for anomalies, as unexpected
results often indicate data entry errors requiring verification against raw data before proceeding,
ensuring statistical analyses rest on accurate data and support valid conclusions.
Chapter 2: SPSS Problems
Problem 2.1: Descriptive Statistics for College Student Data
Q1. Compute the N, minimum, maximum, and mean for all the variables in the
CollegeStudentData.sav file.
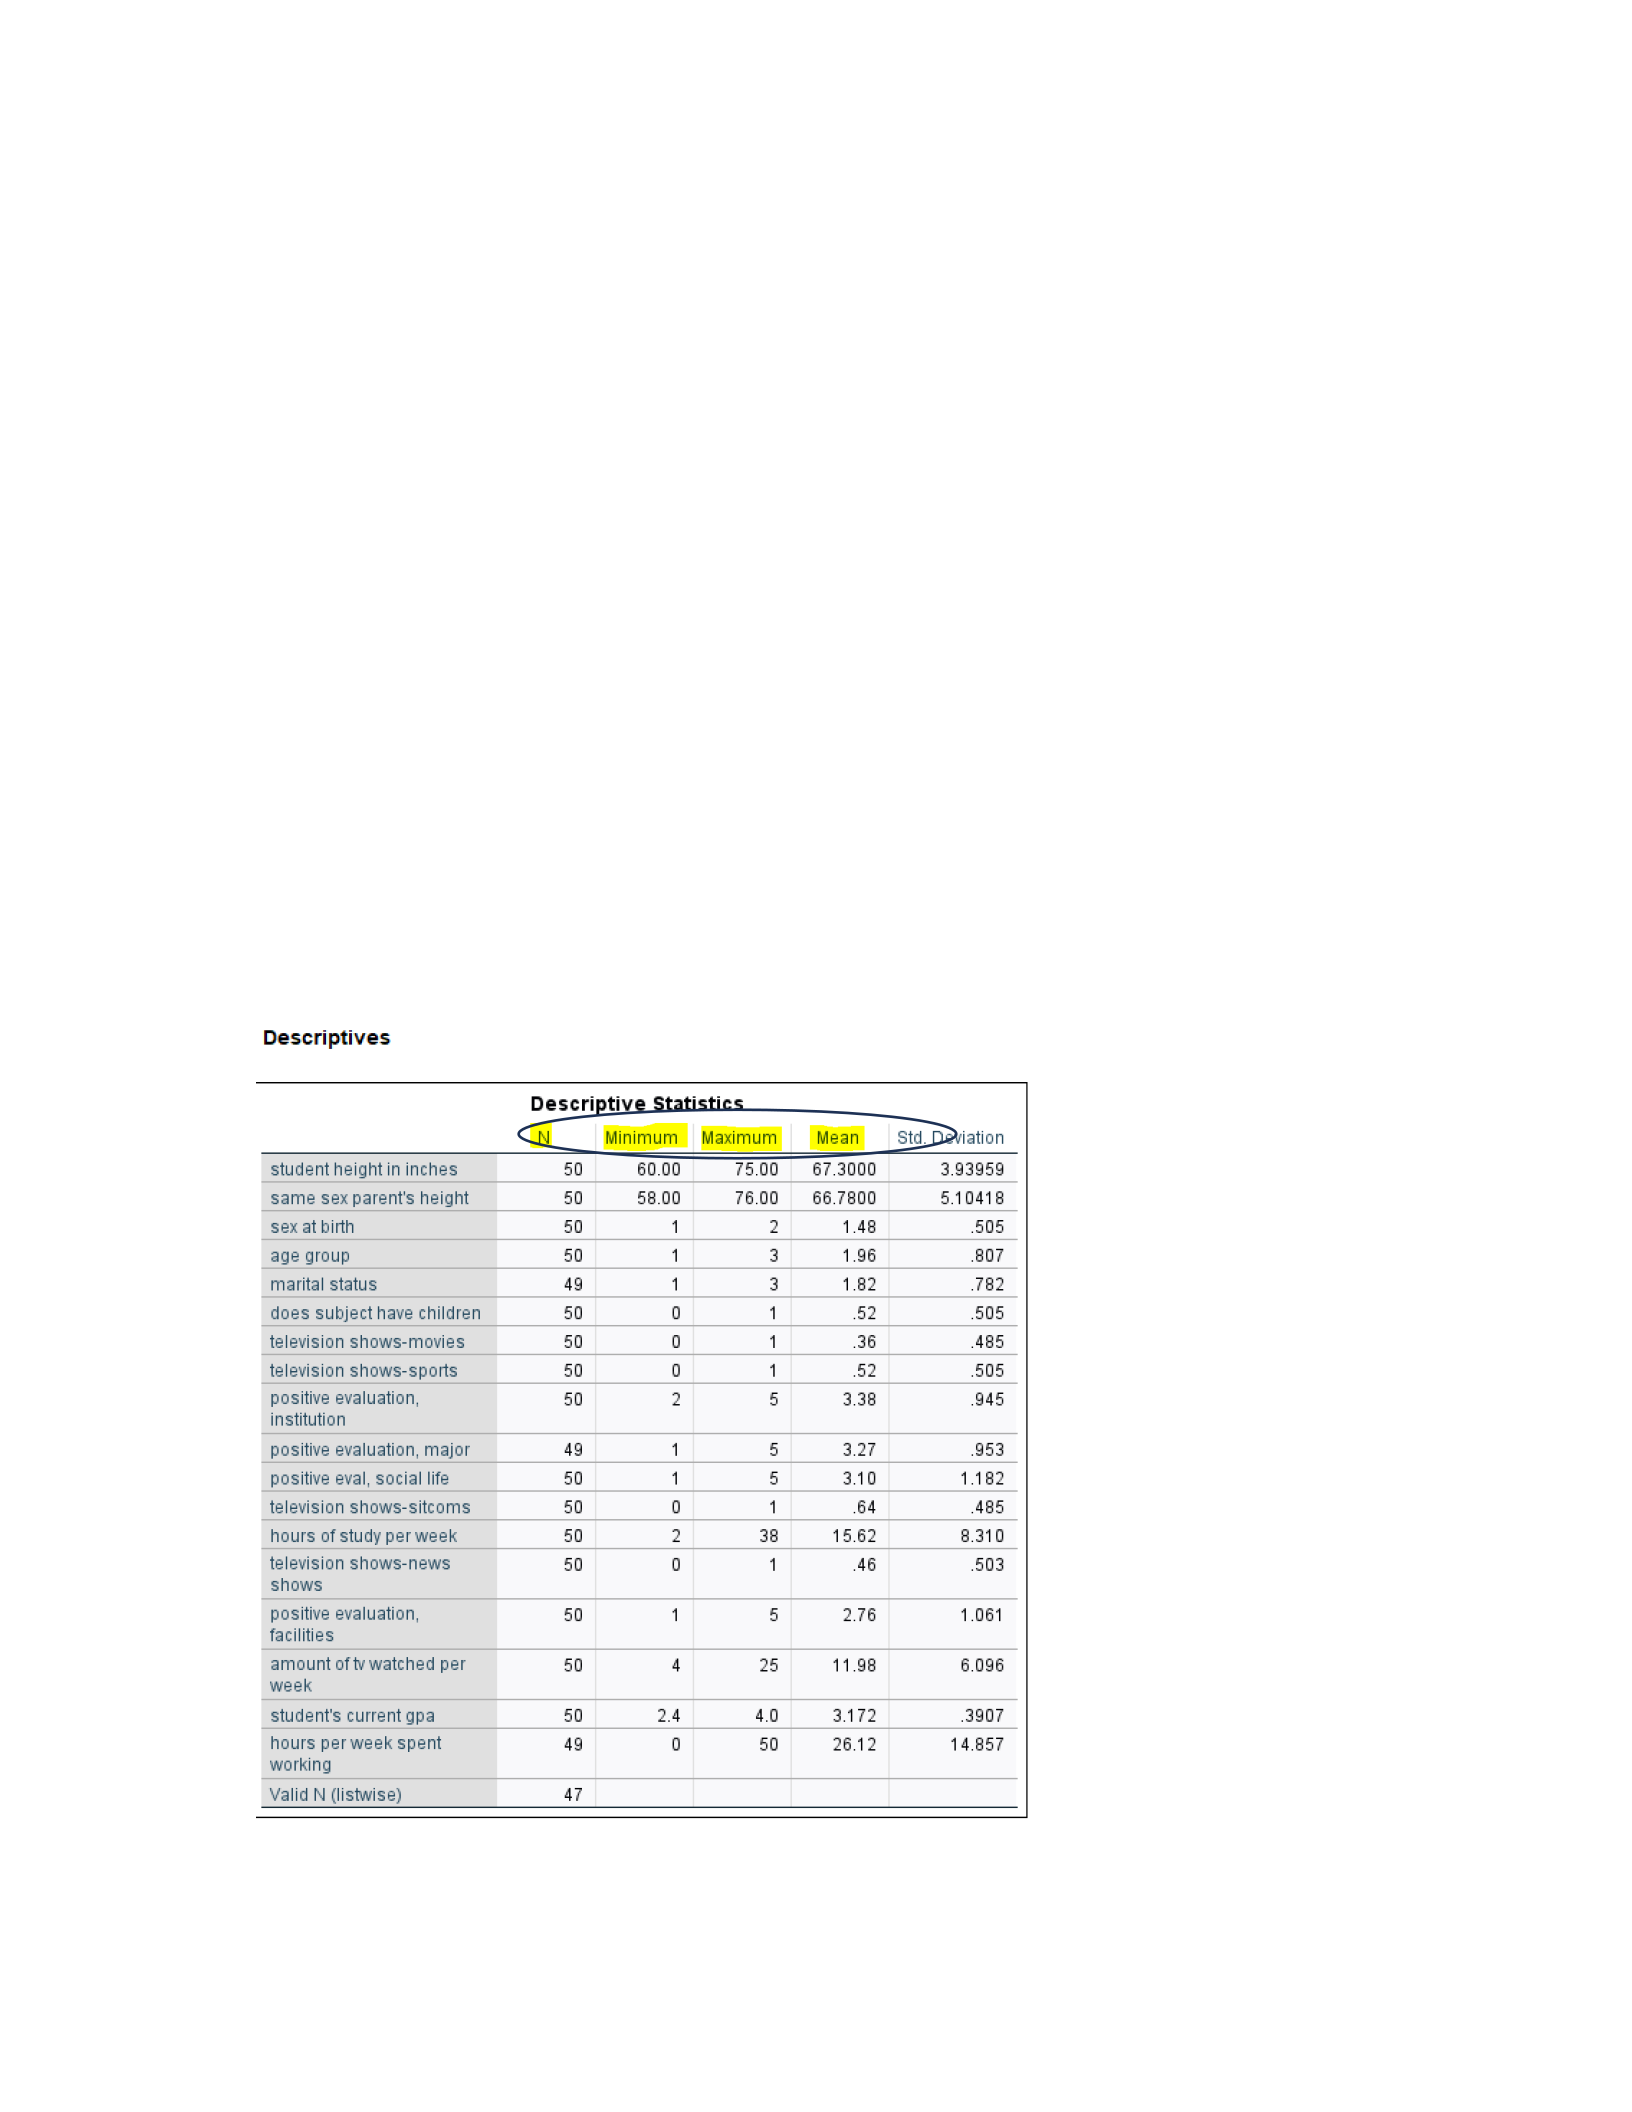
Figure 1 - Descriptive Statistics
BUSI 820 - Assignment 1 10

Quantitative Analysis: Data Coding, Entry, and Checking
The result above in Figure 1, using SPSS, I computed descriptive statistics (N, minimum,
maximum, and mean) for all variables in the CollegeStudentData.sav file through Analyze →
Descriptive Statistics → Descriptives. Several labels and variables under discussion are
presented. It also captures relevant analytical data by illustrating the participant’s height
compared to that of their parents of the same sex. Figure 2 shows all variables in the study. These
values range from 0 to 5, depending on whether the variable is measured in terms of scale,
nominal, or ordinal. Some data among the values may be null. This means that some respondents
did not provide all the data. Moreover, the numerical categories of the values indicate the
presence of only digits and the absence of letters or words.
Figure 2 - Variable View
Q2. How many students have complete data?
The dataset resulting from the student survey of themselves and their parents has missing
values for some variables. Of the 50 students, 47 students have complete data. One student had a
missing value pertaining to the “marital status” of their parents, and another student had a
BUSI 820 - Assignment 1 11

Quantitative Analysis: Data Coding, Entry, and Checking
missing value of “hours per week spent working.” The last student with a missing value has the
label “positive evaluation, major” missing. Figure 3 shows the missing values.
Figure 3 - Missing Values
Q3. Identify any statistics on the output that are not meaningful. Explain.
I have reviewed the output, and I believe that all the data is consistent and reasonable
except for the variance. Variance is not required, and, therefore, there is no need for the variance
in the report.
Q4. What is the mean height of the students?
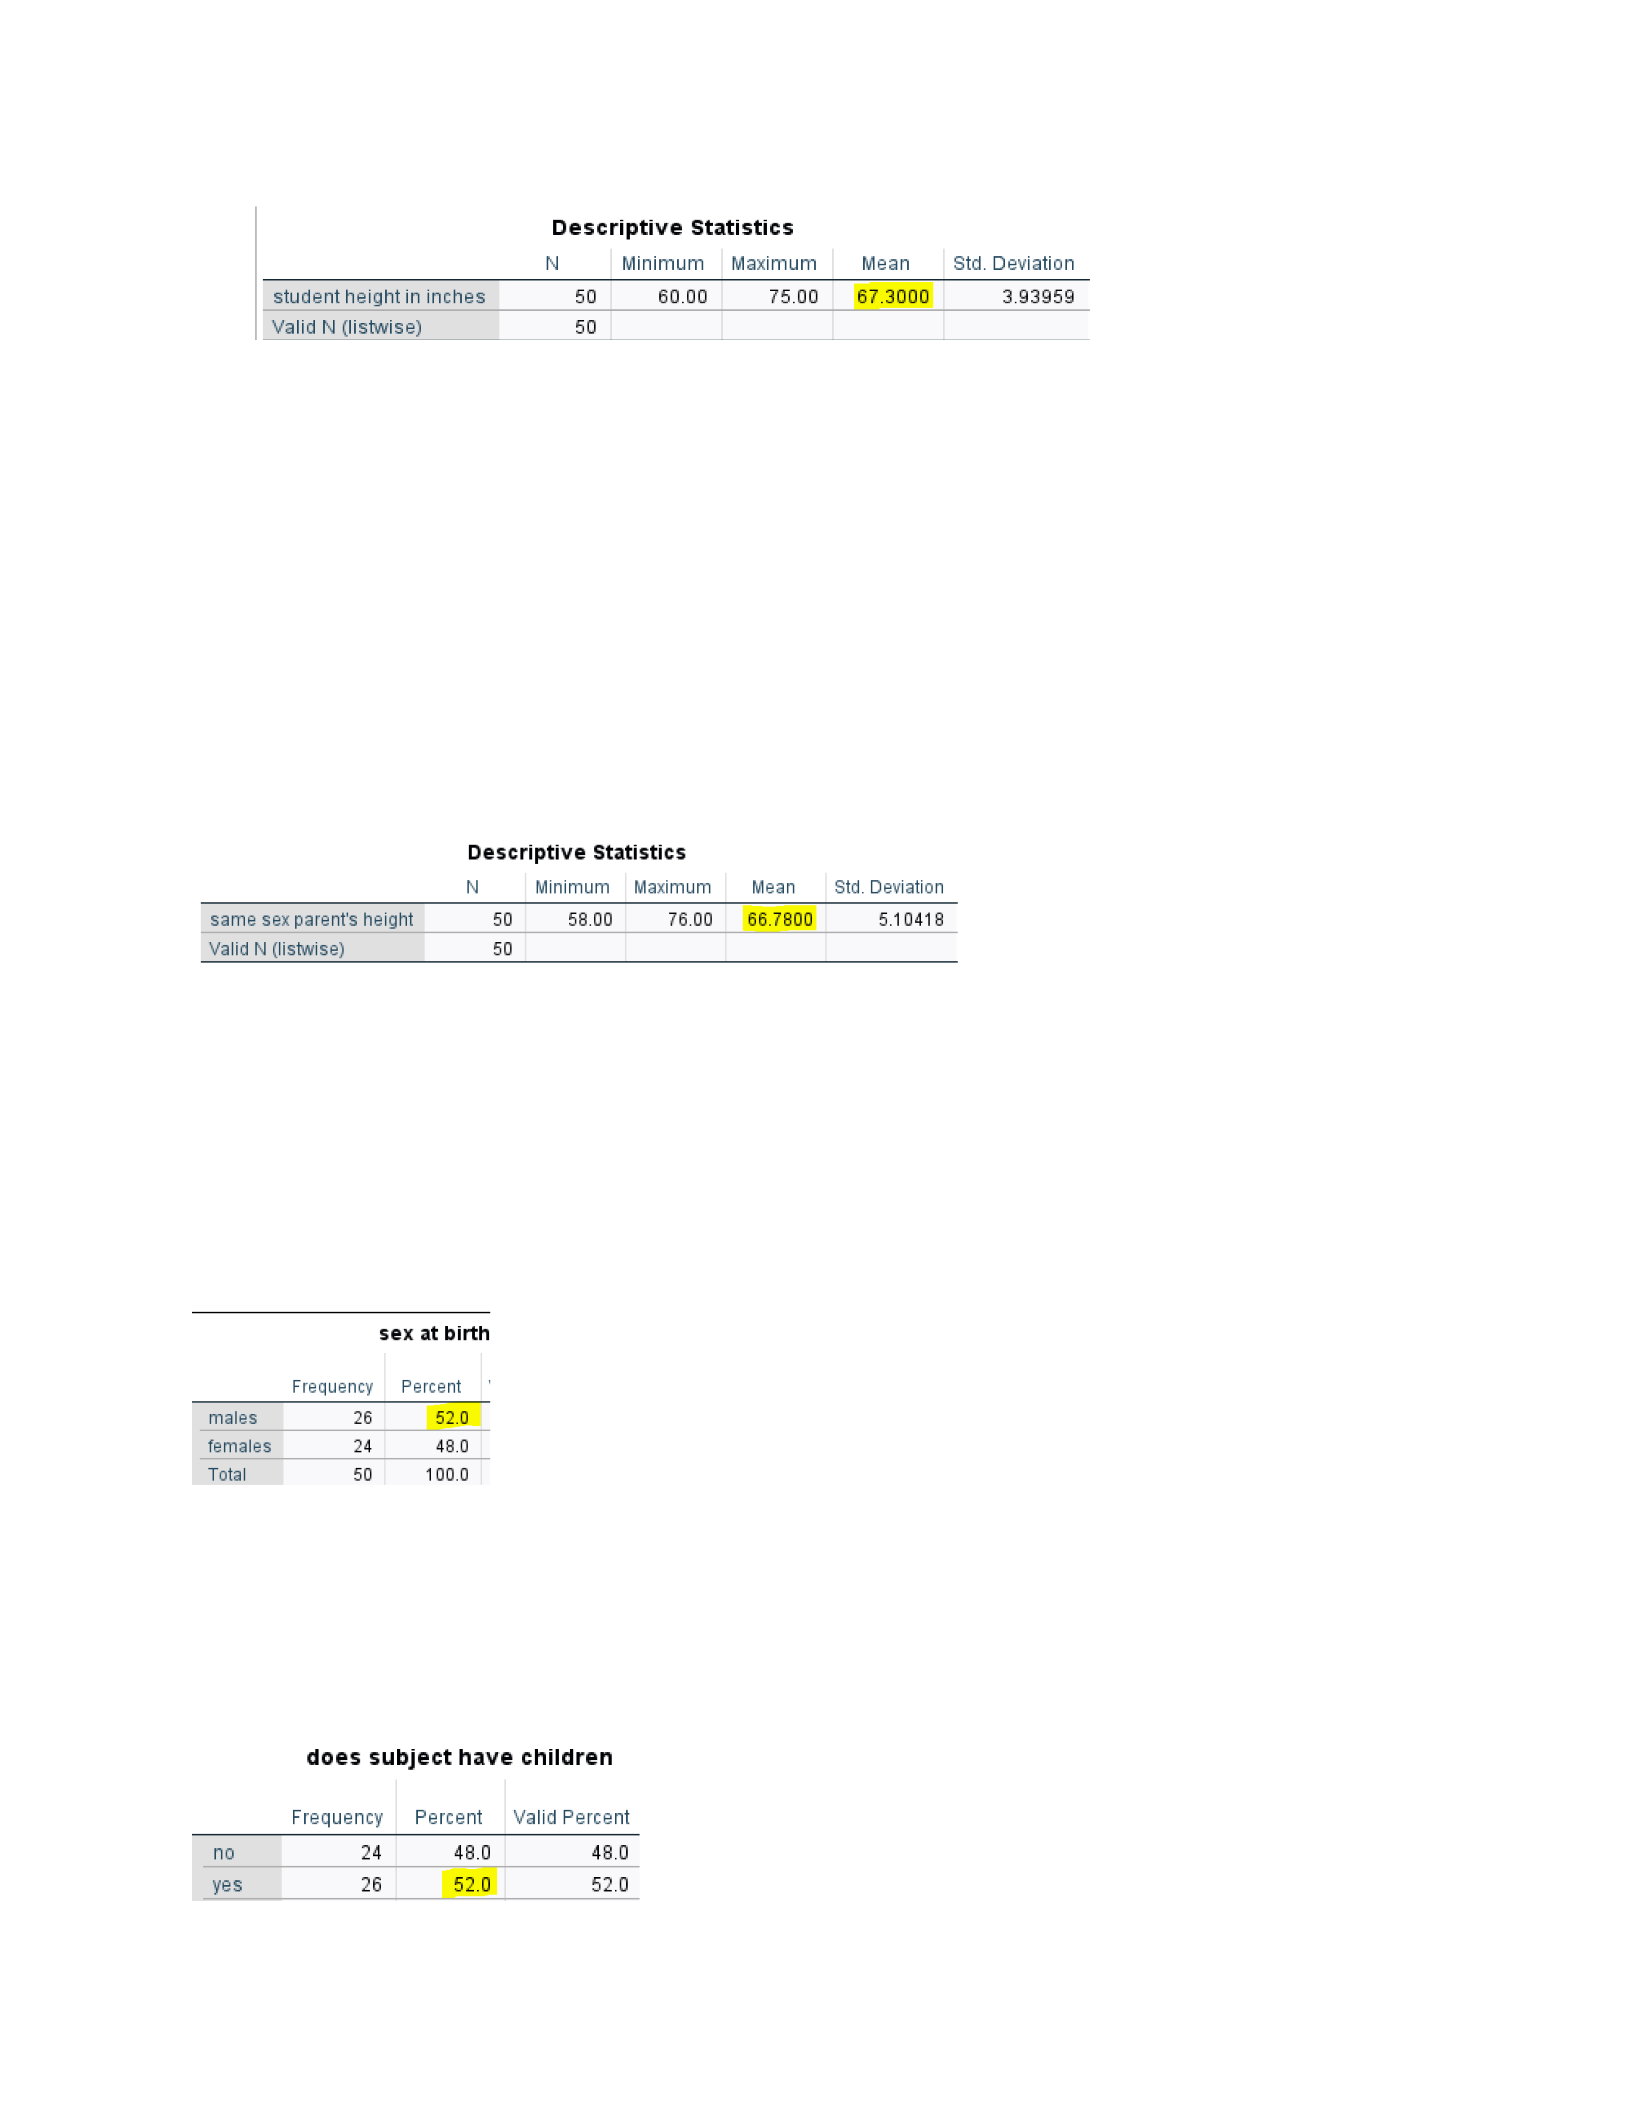
Research findings indicated that the average height of the child participants was 67.3
inches. The height range of the participants was between 60 inches and 75 inches. The mean
height of the participants was computed from the average of the 50 heights of the participants.
The mean height of the participants and the height range are illustrated in Figure 4.
Figure 4 – Mean Height
BUSI 820 - Assignment 1 12
Quantitative Analysis: Data Coding, Entry, and Checking
Q5. What about the average height of the same-sex parent?
Research findings indicated that the mean height of the same-sex parents was 66.78
inches. The height range was between 58 inches and 76 inches. The mean height of the same-sex
parents was computed from the average of the 50 participants' same-sex parents. The mean
height of the same-sex parents is illustrated in Figure 4.
Figure 5 – Mean height of the same-sex parent
Q6. What percentage of students are males?
The male participant percentage is 52%. Figure 6 shows this according to details in the
codebook.
Figure 6 – Male Student Percentage
Q7. What percentage have children?
According to the data collected from the codebook, shown in Figure 7, 52% of the
participants have children.
BUSI 820 - Assignment 1 13

Quantitative Analysis: Data Coding, Entry, and Checking
Conclusion
The use of SPSS software helps to provide the information needed during research. The
program allows the user to get the necessary information for a study. The program is a little
tricky, even when using the book. However, as it is being used more, you start to understand the
use of the program.
BUSI 820 - Assignment 1 14

Quantitative Analysis: Data Coding, Entry, and Checking
Reference
Morgan, G. A., Leech, N., Gloeckner, G., & Barrett, K. C. (2020). IBM SPSS for introductory
statistics: Use and interpretation (6th ed.). Routledge.
BUSI 820 - Assignment 1 15

