


Assignment 2
Richard S. Stainback Jr.
BUSI820(B01) Quantitative Research Methods
School of Business, Liberty University
May 20, 2023

Quantitative Research Methods: Assignment 2
Table of Contents
A2.1 Chapter 3, SPSS Problem 3.1…..………...…………………………………………………3
A2.2 Chapter 3, SPSS Problem 3.2...……………………………………………………………..4
A2.3 Chapter 3, SPSS Problem 3.3.……………...……………………………………………….5
A2.4 Chapter 3, SPSS Problem 3.4………….……………………………………………………6
A2.5 Chapter 3, SPSS Problem 3.5……………………..………………………………………...9
Reference………………………………………………………………………………………...10
2
5/28/2023
Quantitative Research Methods: Assignment 2
A2.1: Chapter 3, SPSS Problem 3.1
Nominal data is better suited for bar graphs to represent the frequency table since there is
no necessity for order and the points do not need to connect in any way (Morgan et al., 2020).
The four variables referenced in the assignment are math achievement, mother’s education,
ethnicity, and academic track. Of these four variables mother’s education. academic track and
ethnicity would serve use as a bar graph. Math achievement offer ordinal data and is better
served by other means such as a histogram or scatter plot. The purpose of the graph is to offer the
reader an easily understood picture of the data from which to draw conclusions.
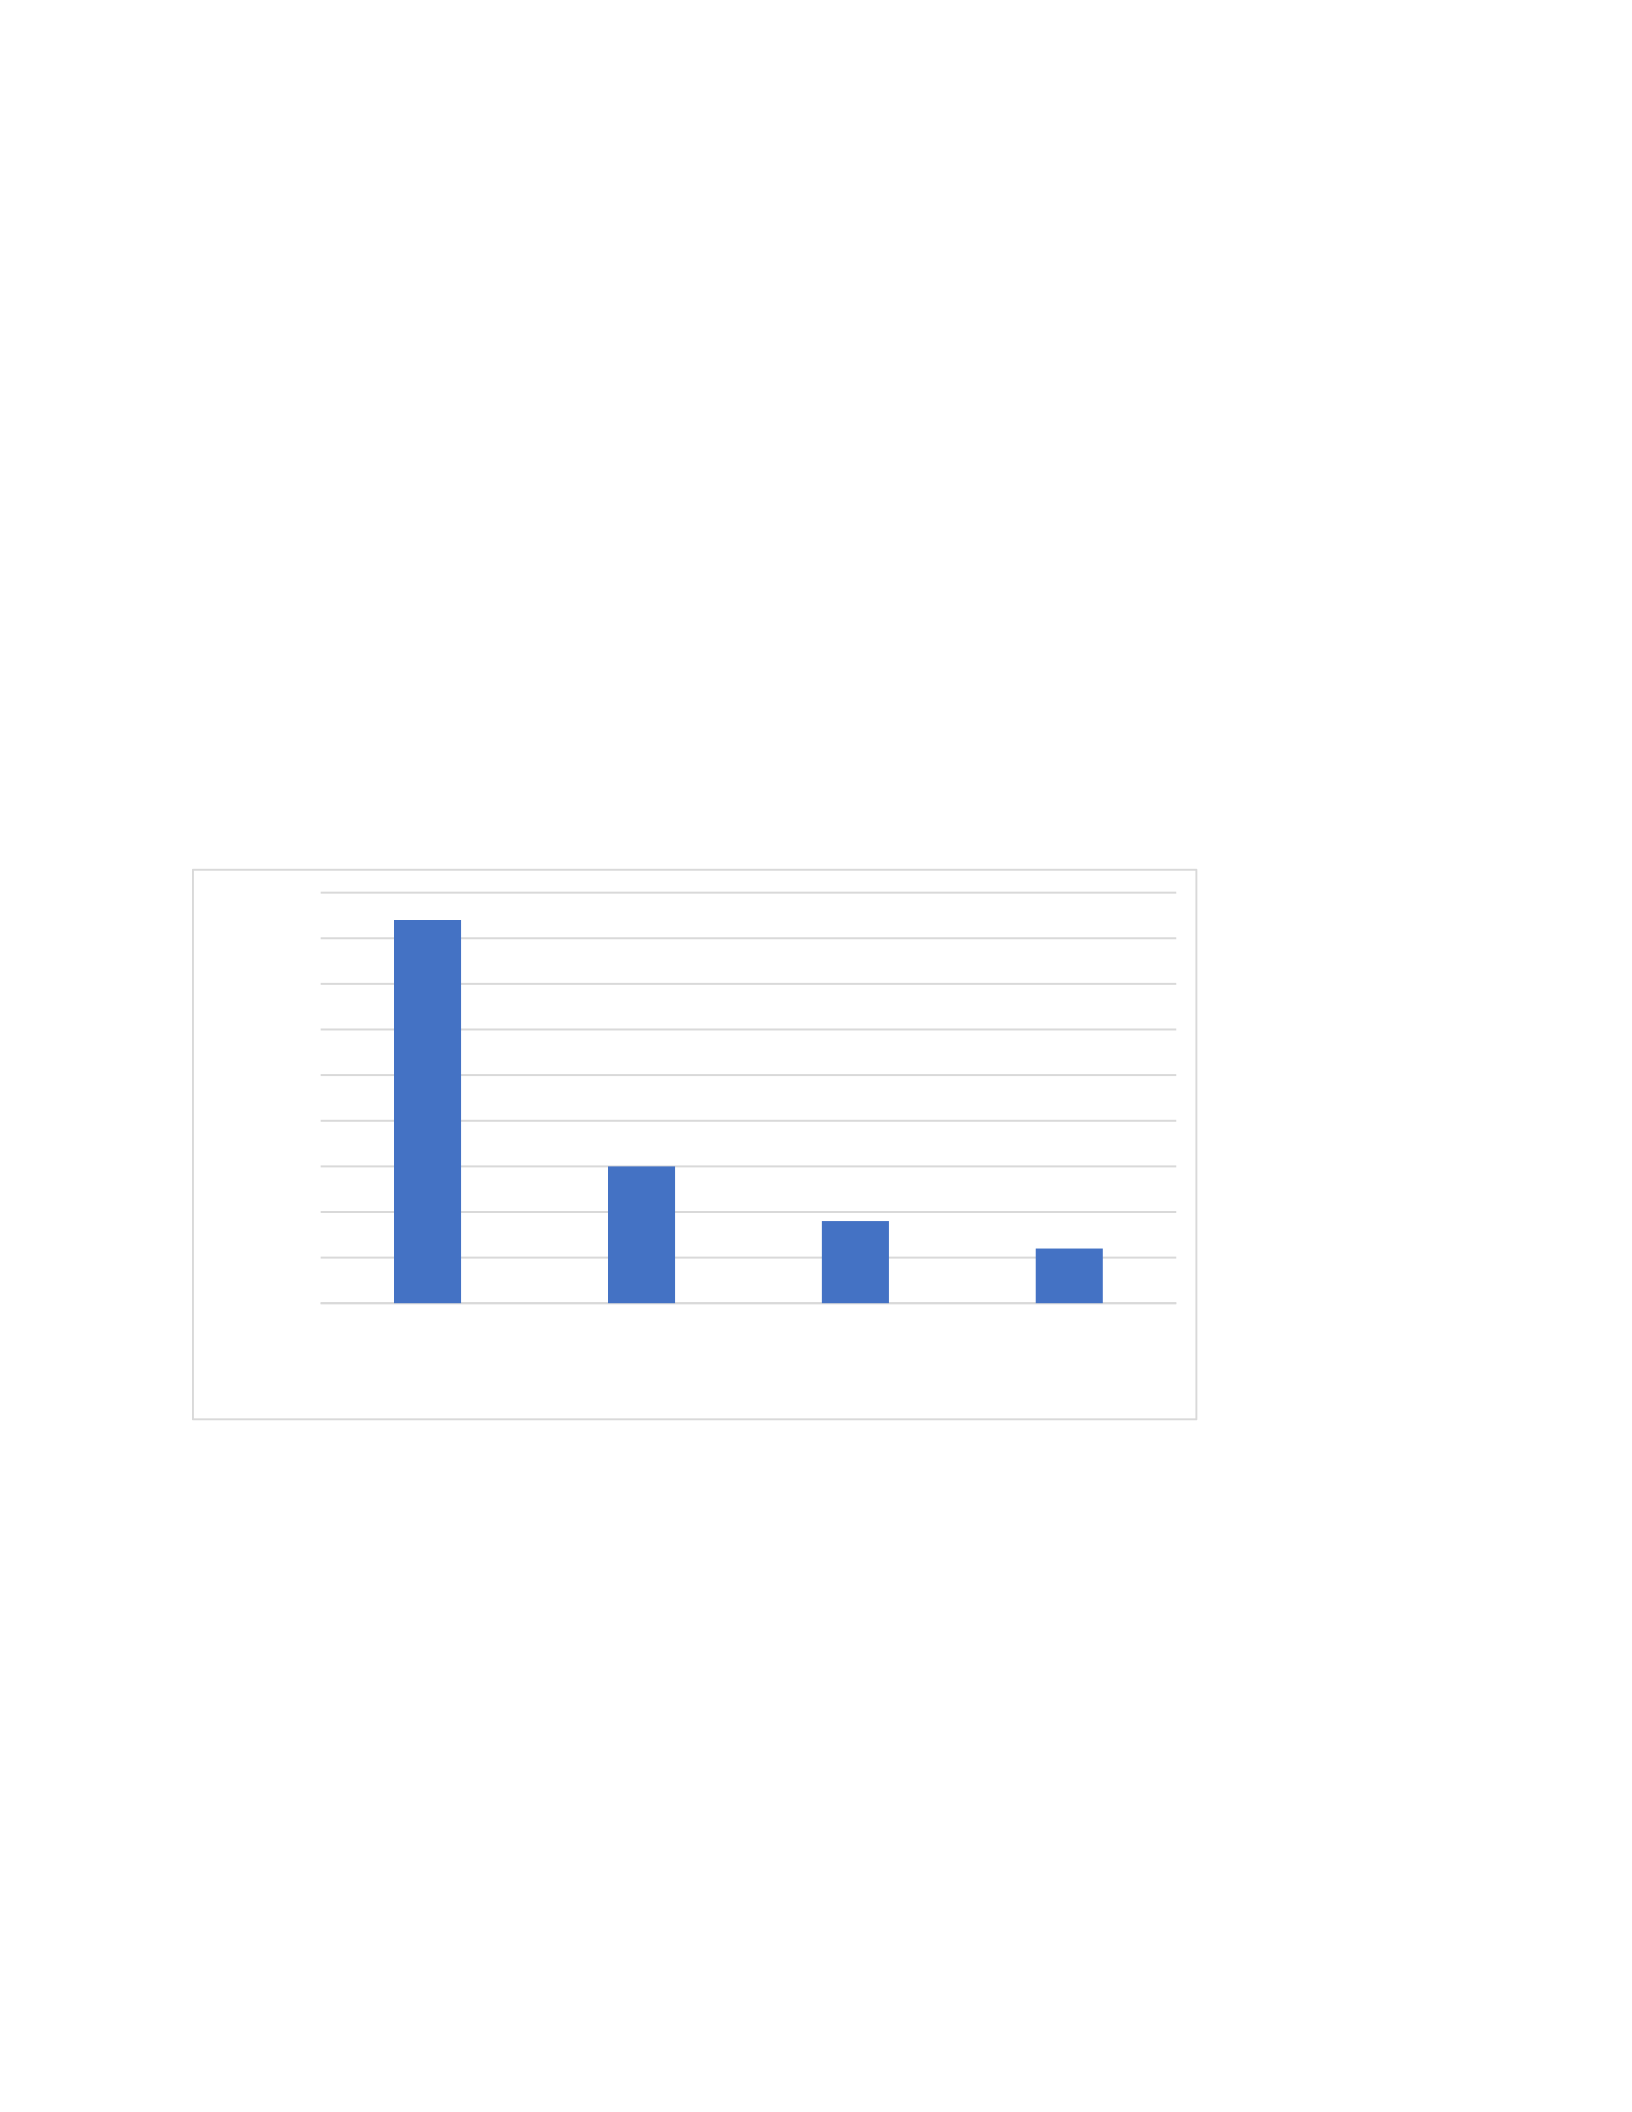
Figure 1: Ethnicity Graph
Euro-Amer Afican-Amer Latino-Amer Asian-Amer
0
5
10
15
20
25
30
35
40
45
ethnicity reported by student
Count
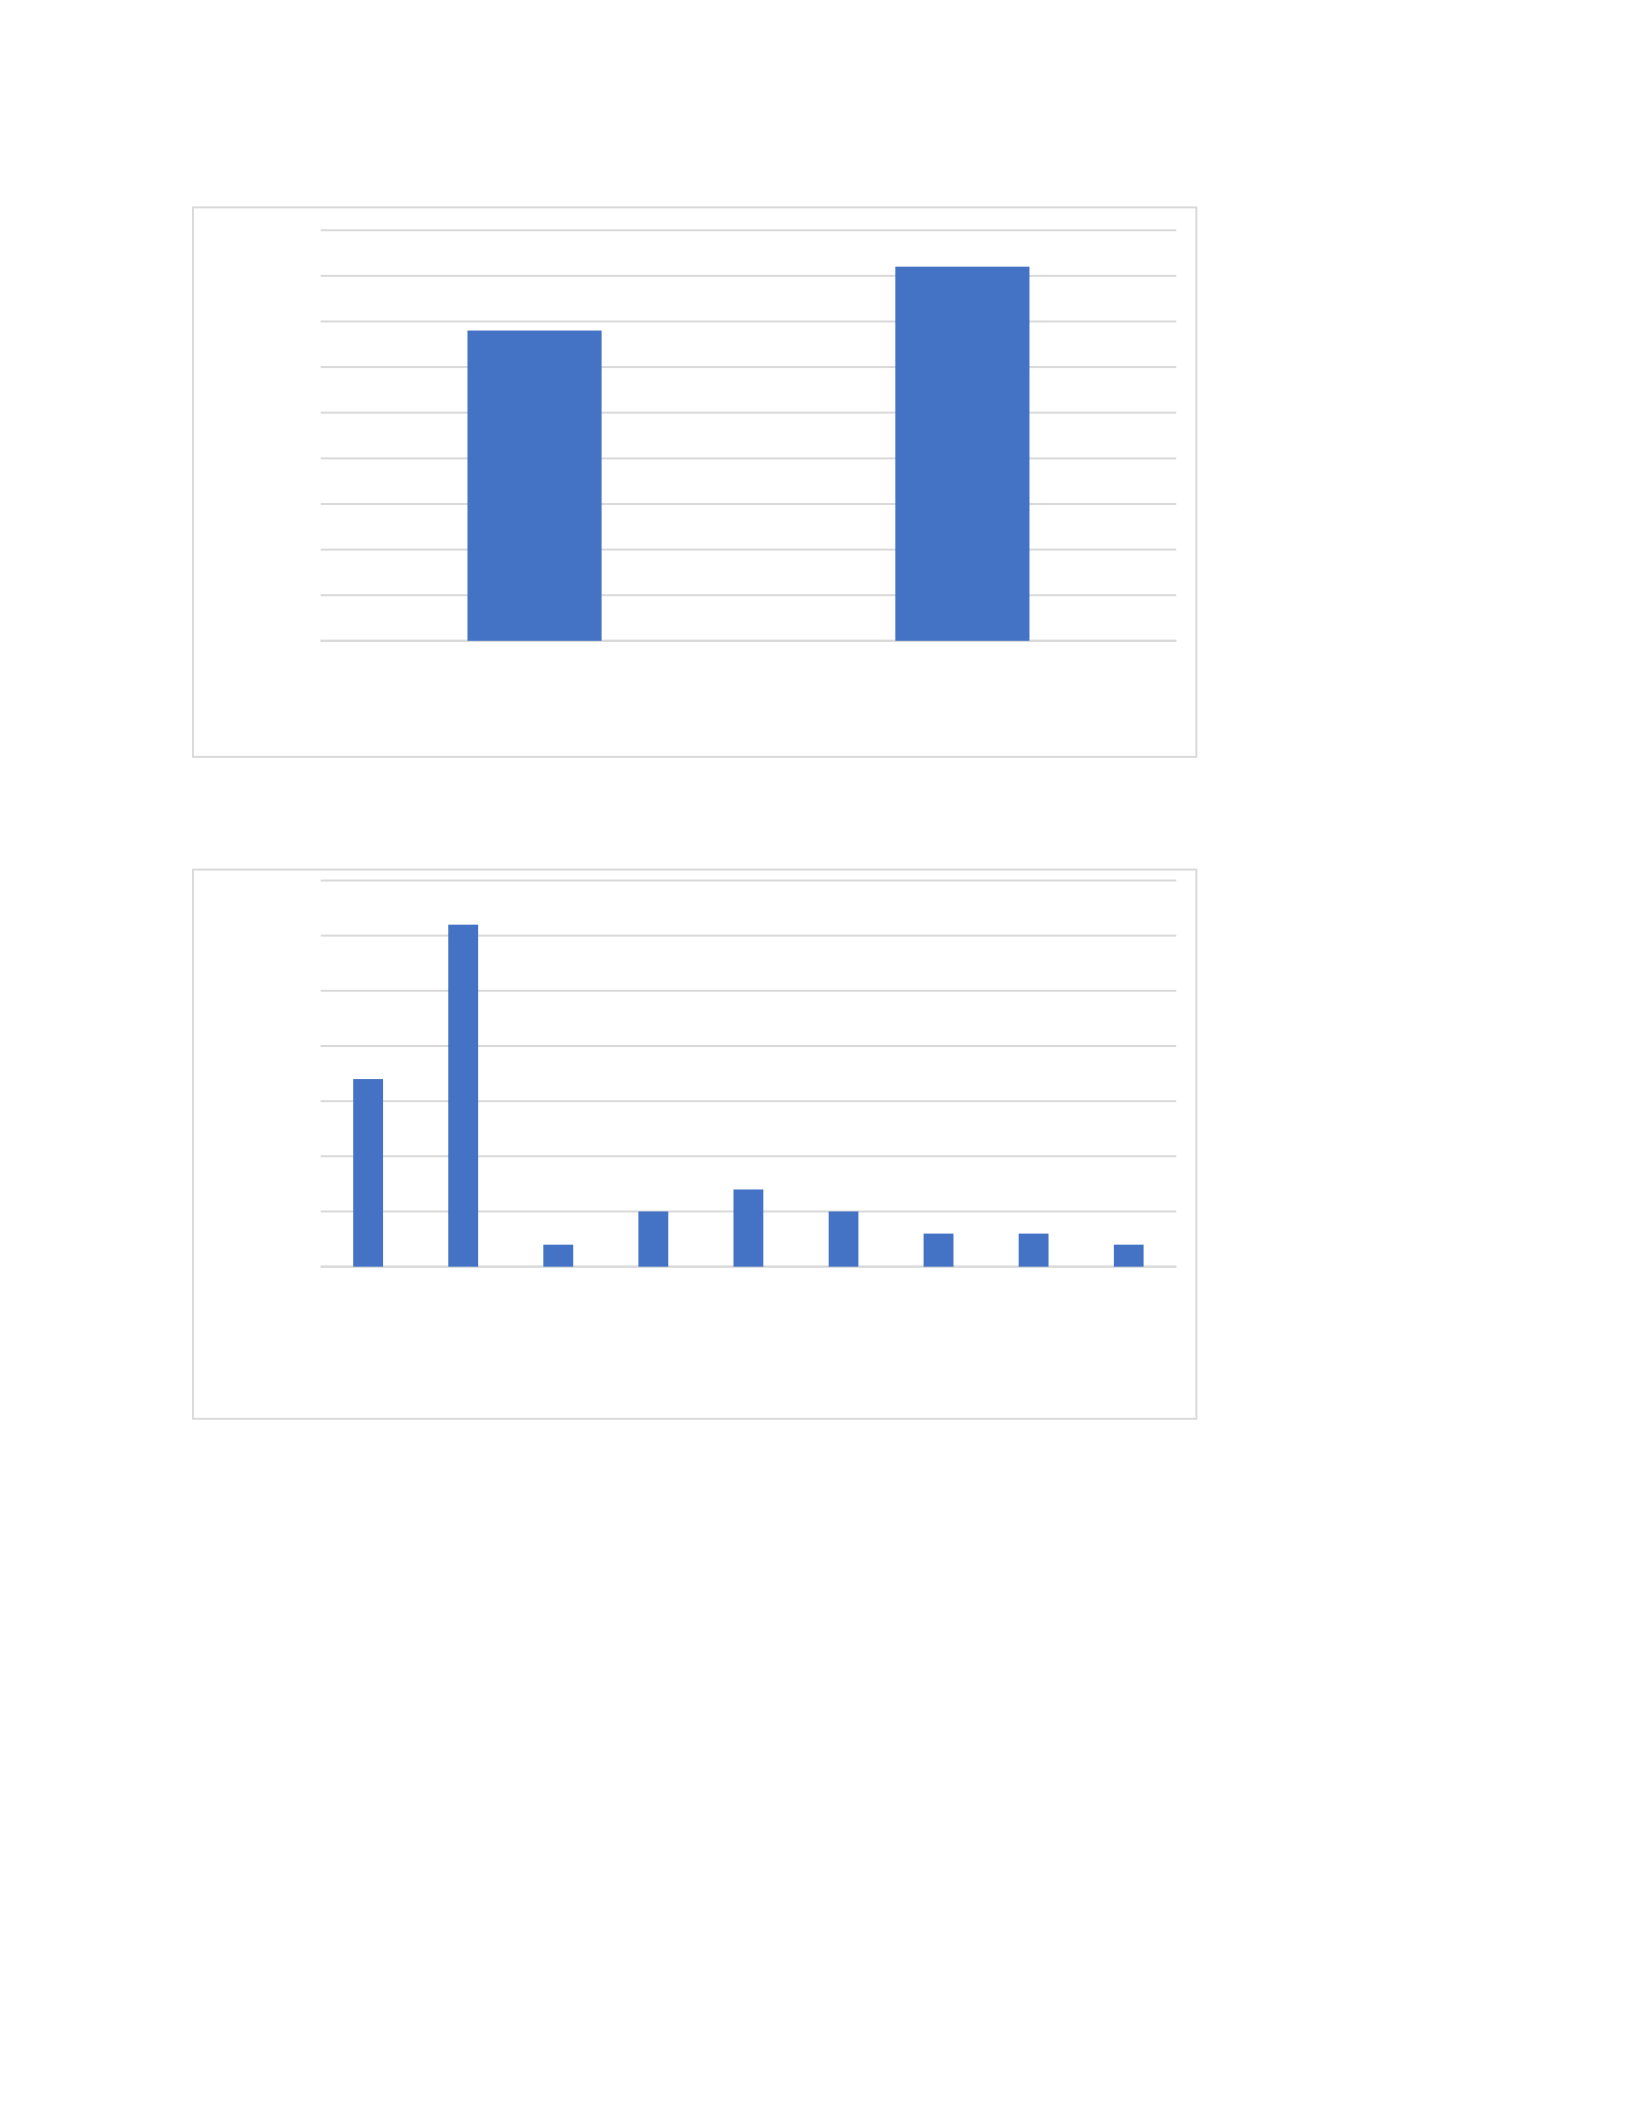
Figure 2: Academic Track Graph
3
5/28/2023
Quantitative Research Methods: Assignment 2
fast track regular track
0
5
10
15
20
25
30
35
40
45
academic track
Count
Figure 3: Mother’s Education
< h.s. h.s. grad < 2 yrs
voc
2 yrs voc < 2 yrs
coll
> 2 yrs
coll
coll grad master's MD/PhD
0
5
10
15
20
25
30
35
mother's education
Count
A2.2: Chapter 3, SPSS Problem 3.2
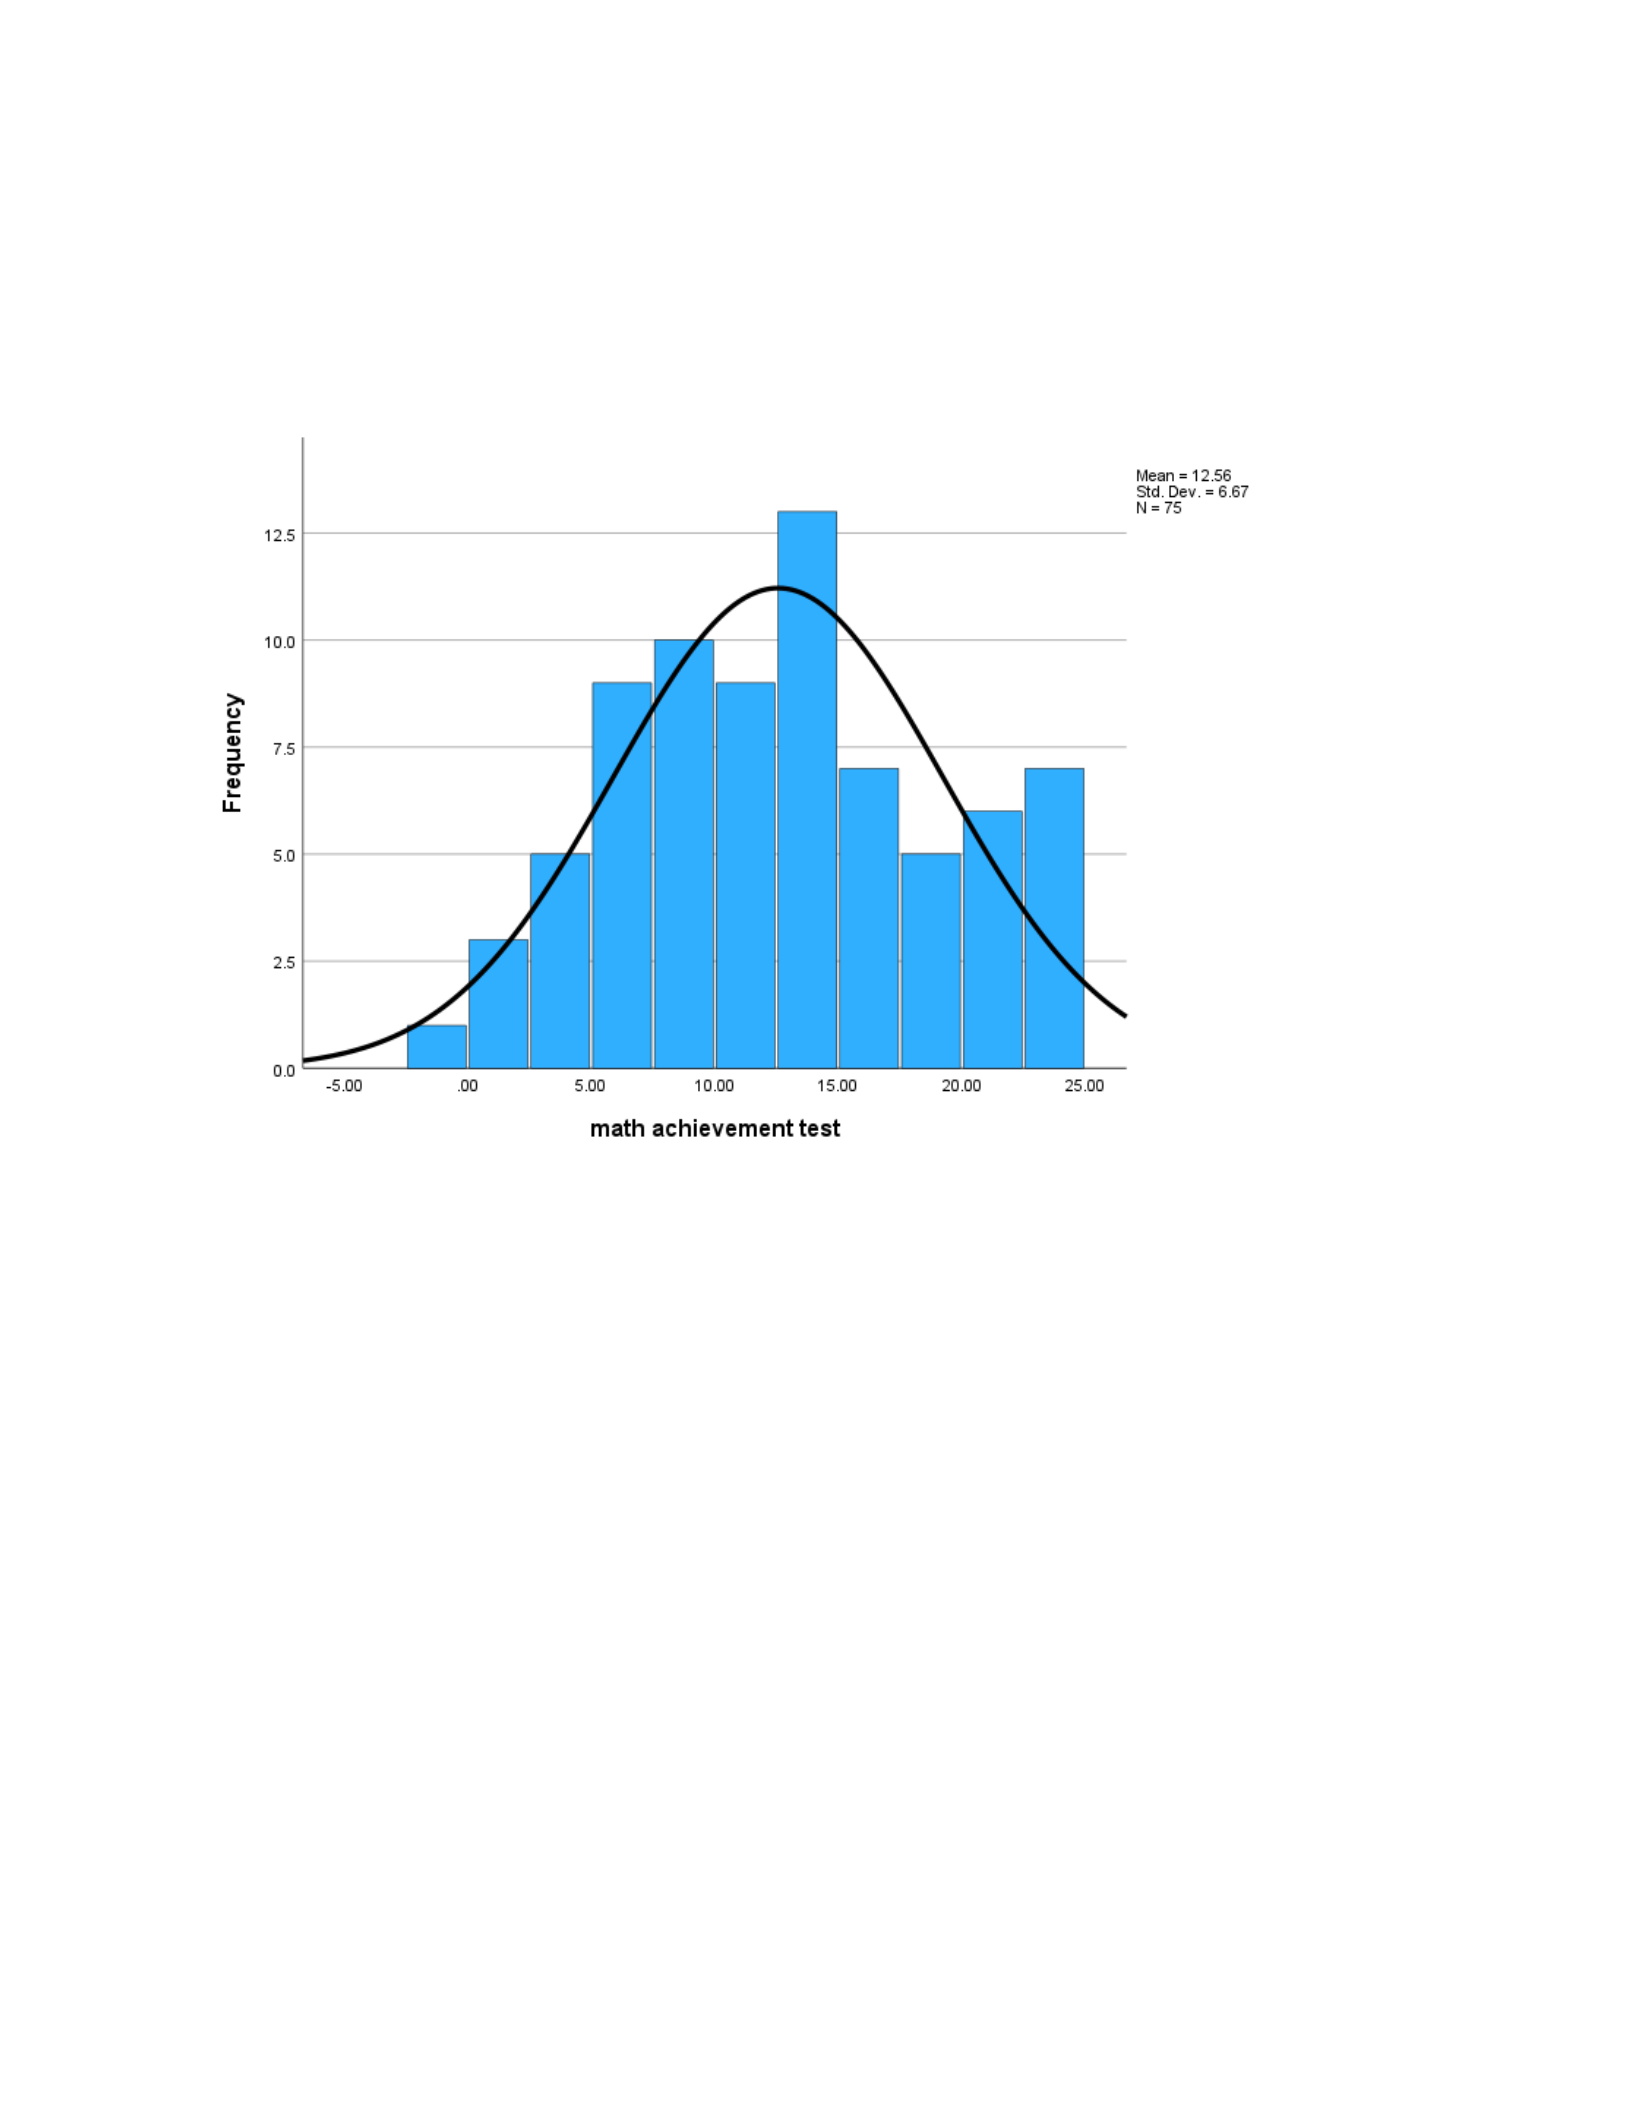
Histograms look much like bar graphs without separation, thus symbolizing the presence
of a continuous variable (Morgan et al., 2020). Histograms are not to be used with nominal or
dichotomous variables and should be used with ordinal and standard variables (Li et al., 2020).
For this dataset the math achievement scores are designed for a histogram since the score range
4
5/28/2023
Quantitative Research Methods: Assignment 2
has a measured beginning and end, and students can score anywhere in that defined range.
Histograms would not be used for ethnicity or academic track since the data is nominal.
Figure 4: Math Achievement Histogram
A2.3: Chapter 3, SPSS Problem 3.3
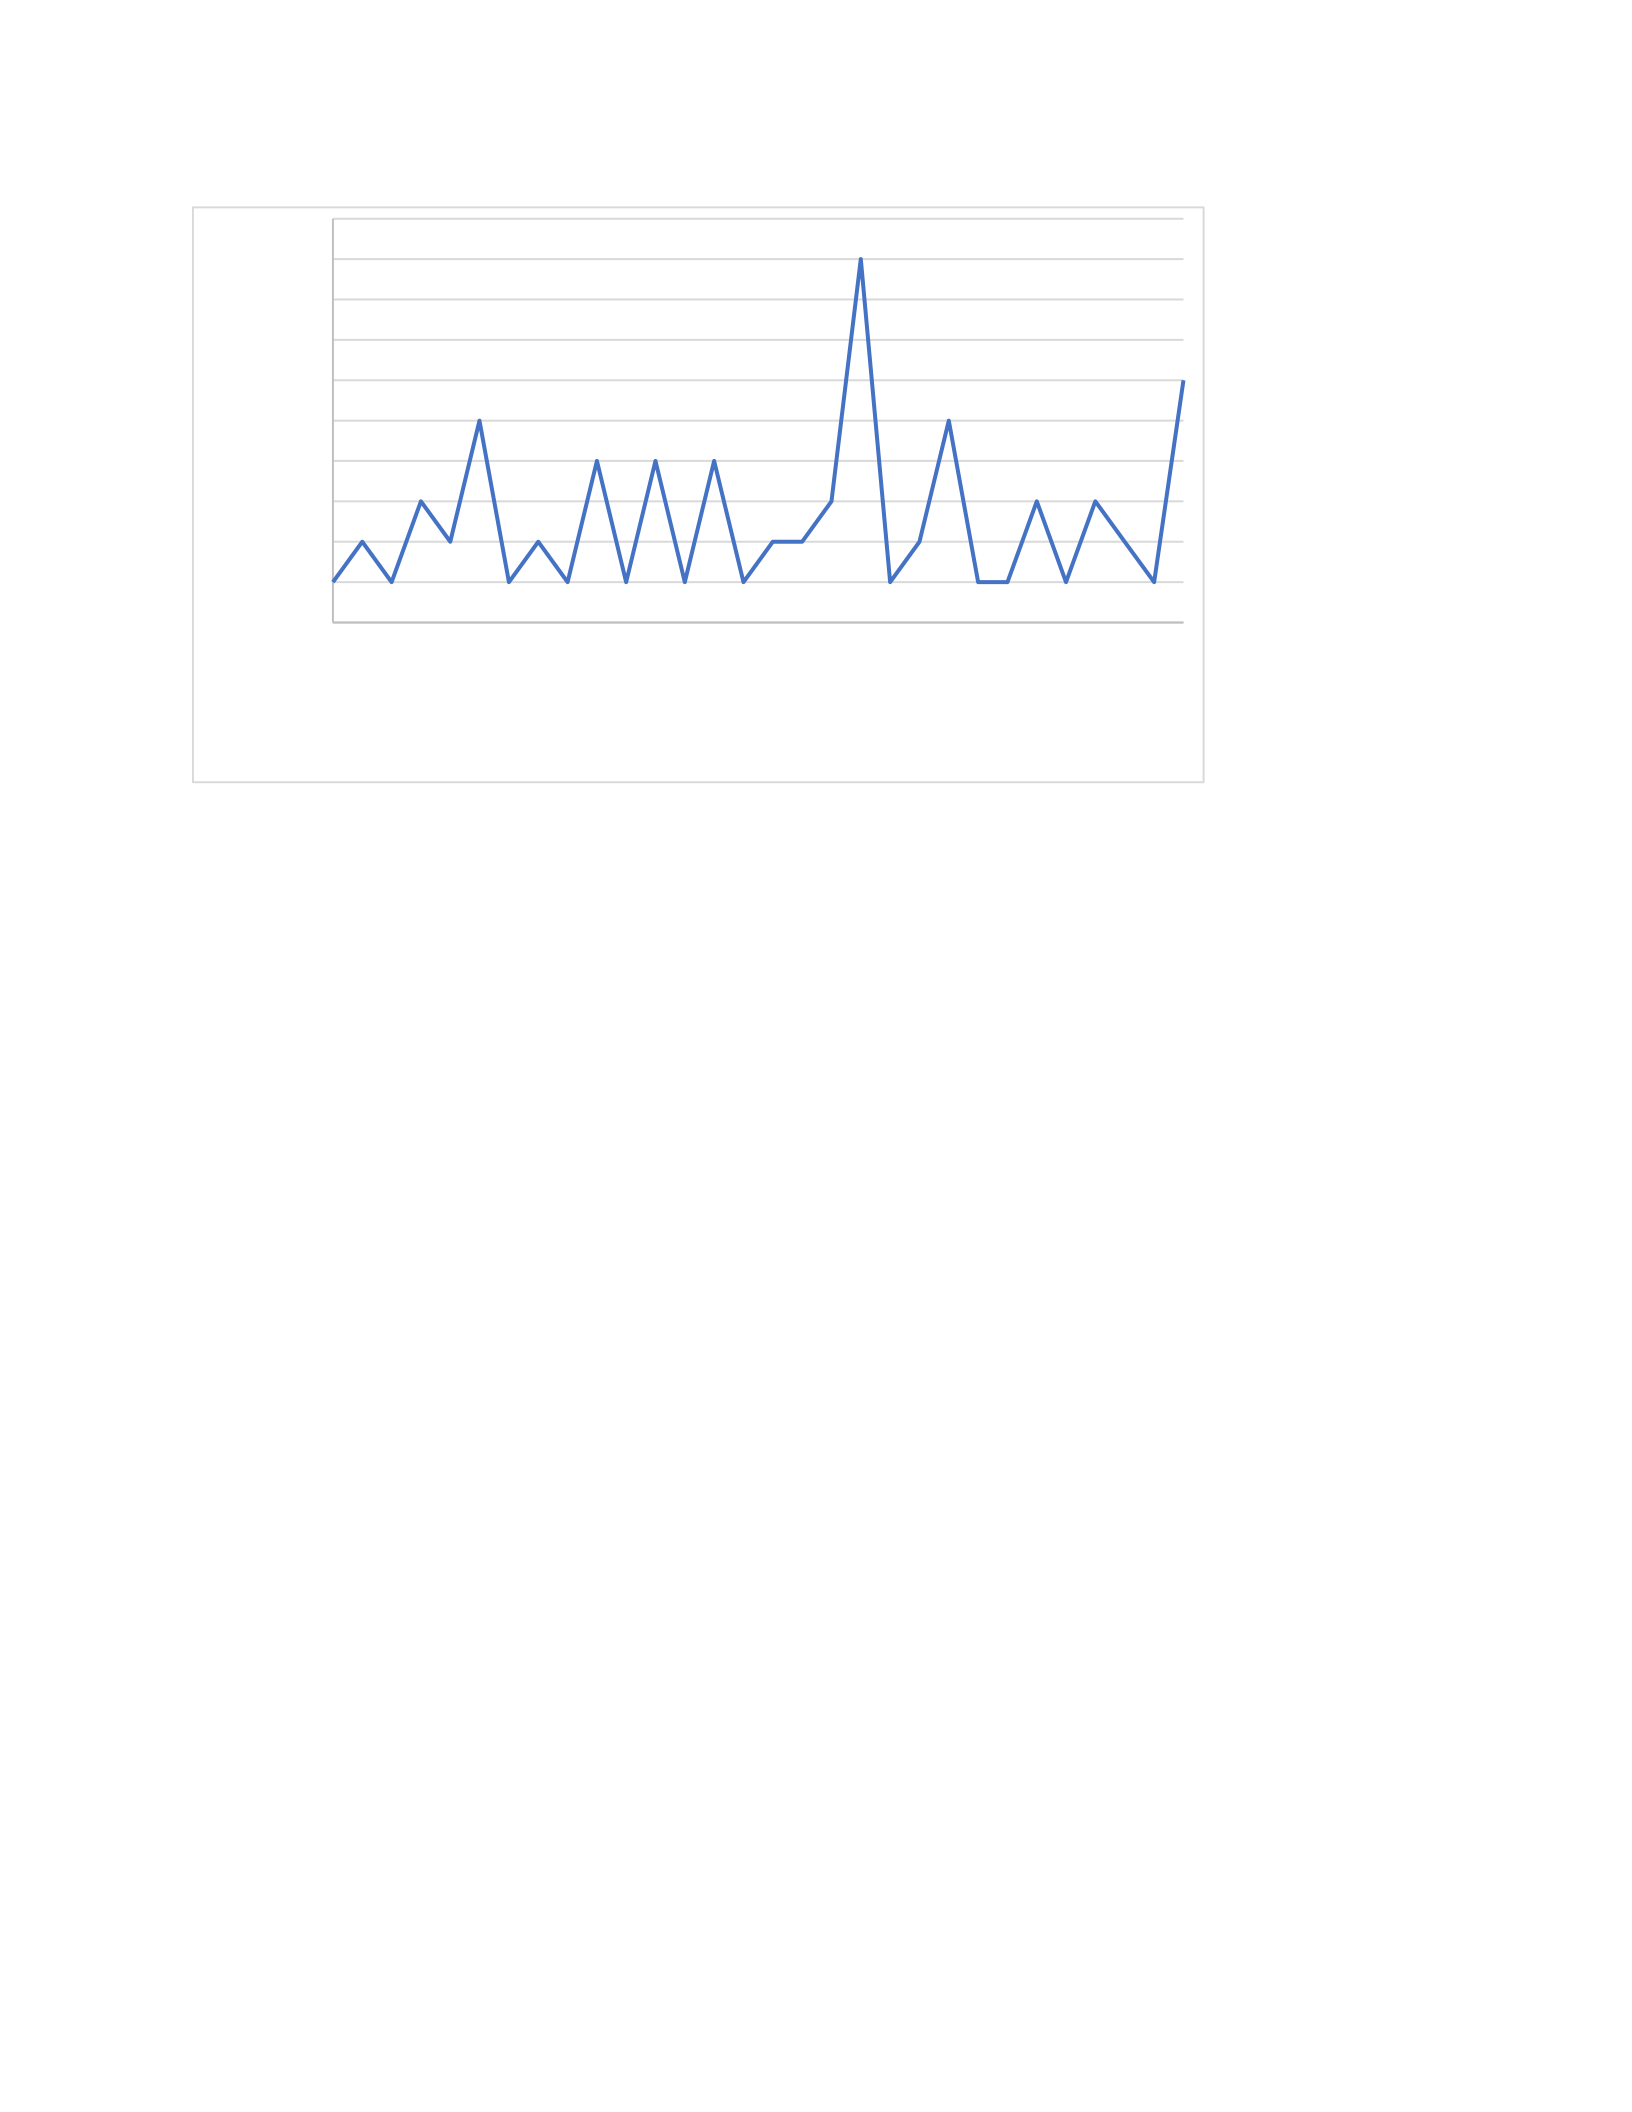
Frequency polygons connect the points of data and are best used with normal data and
ordinal data (Morgan et al., 2020). This definition precludes both academic track and ethnicity
from being used for frequency polygons since that is nominal and dichotomous data. Mother’s
education is also excluded since the variable is not constant and the data points cannot be
connected. Math achievement scores is valid for a frequency polygon since the test scores are
constant and it stands to reason that any point on the test scoring scale could be a valid score.
Therefore, connecting the points on the math achievement data does not offer a negative
visualization or interpretation.
Figure 5: Math Achievement Frequency Polygon
5
5/28/2023
Quantitative Research Methods: Assignment 2
-1.67
2.33
4
5.33
6.67
8
9.33
10.67
12
14.33
15.67
18.33
19.67
21
22.67
0
1
2
3
4
5
6
7
8
9
10
math achievement test
Count
The plots in 3.1 represent nominal data for ethnicity, academic track, and mother’s
education. These representations offer a visualization of descriptive variables frequency without
any real numeric value. The plots in 3.2 offer a histogram showing the continuous variable of
math achievement scores. This histogram is appropriate as a touching bar graph since the data
points are continuous in nature. The plot in 3.3 is a better representation of the math achievement
scores since the visual shows the continuation of the variable and speaks to the point that
anywhere on the line could be an acceptable response.
A2.4: Chapter 3, Problem 3.4
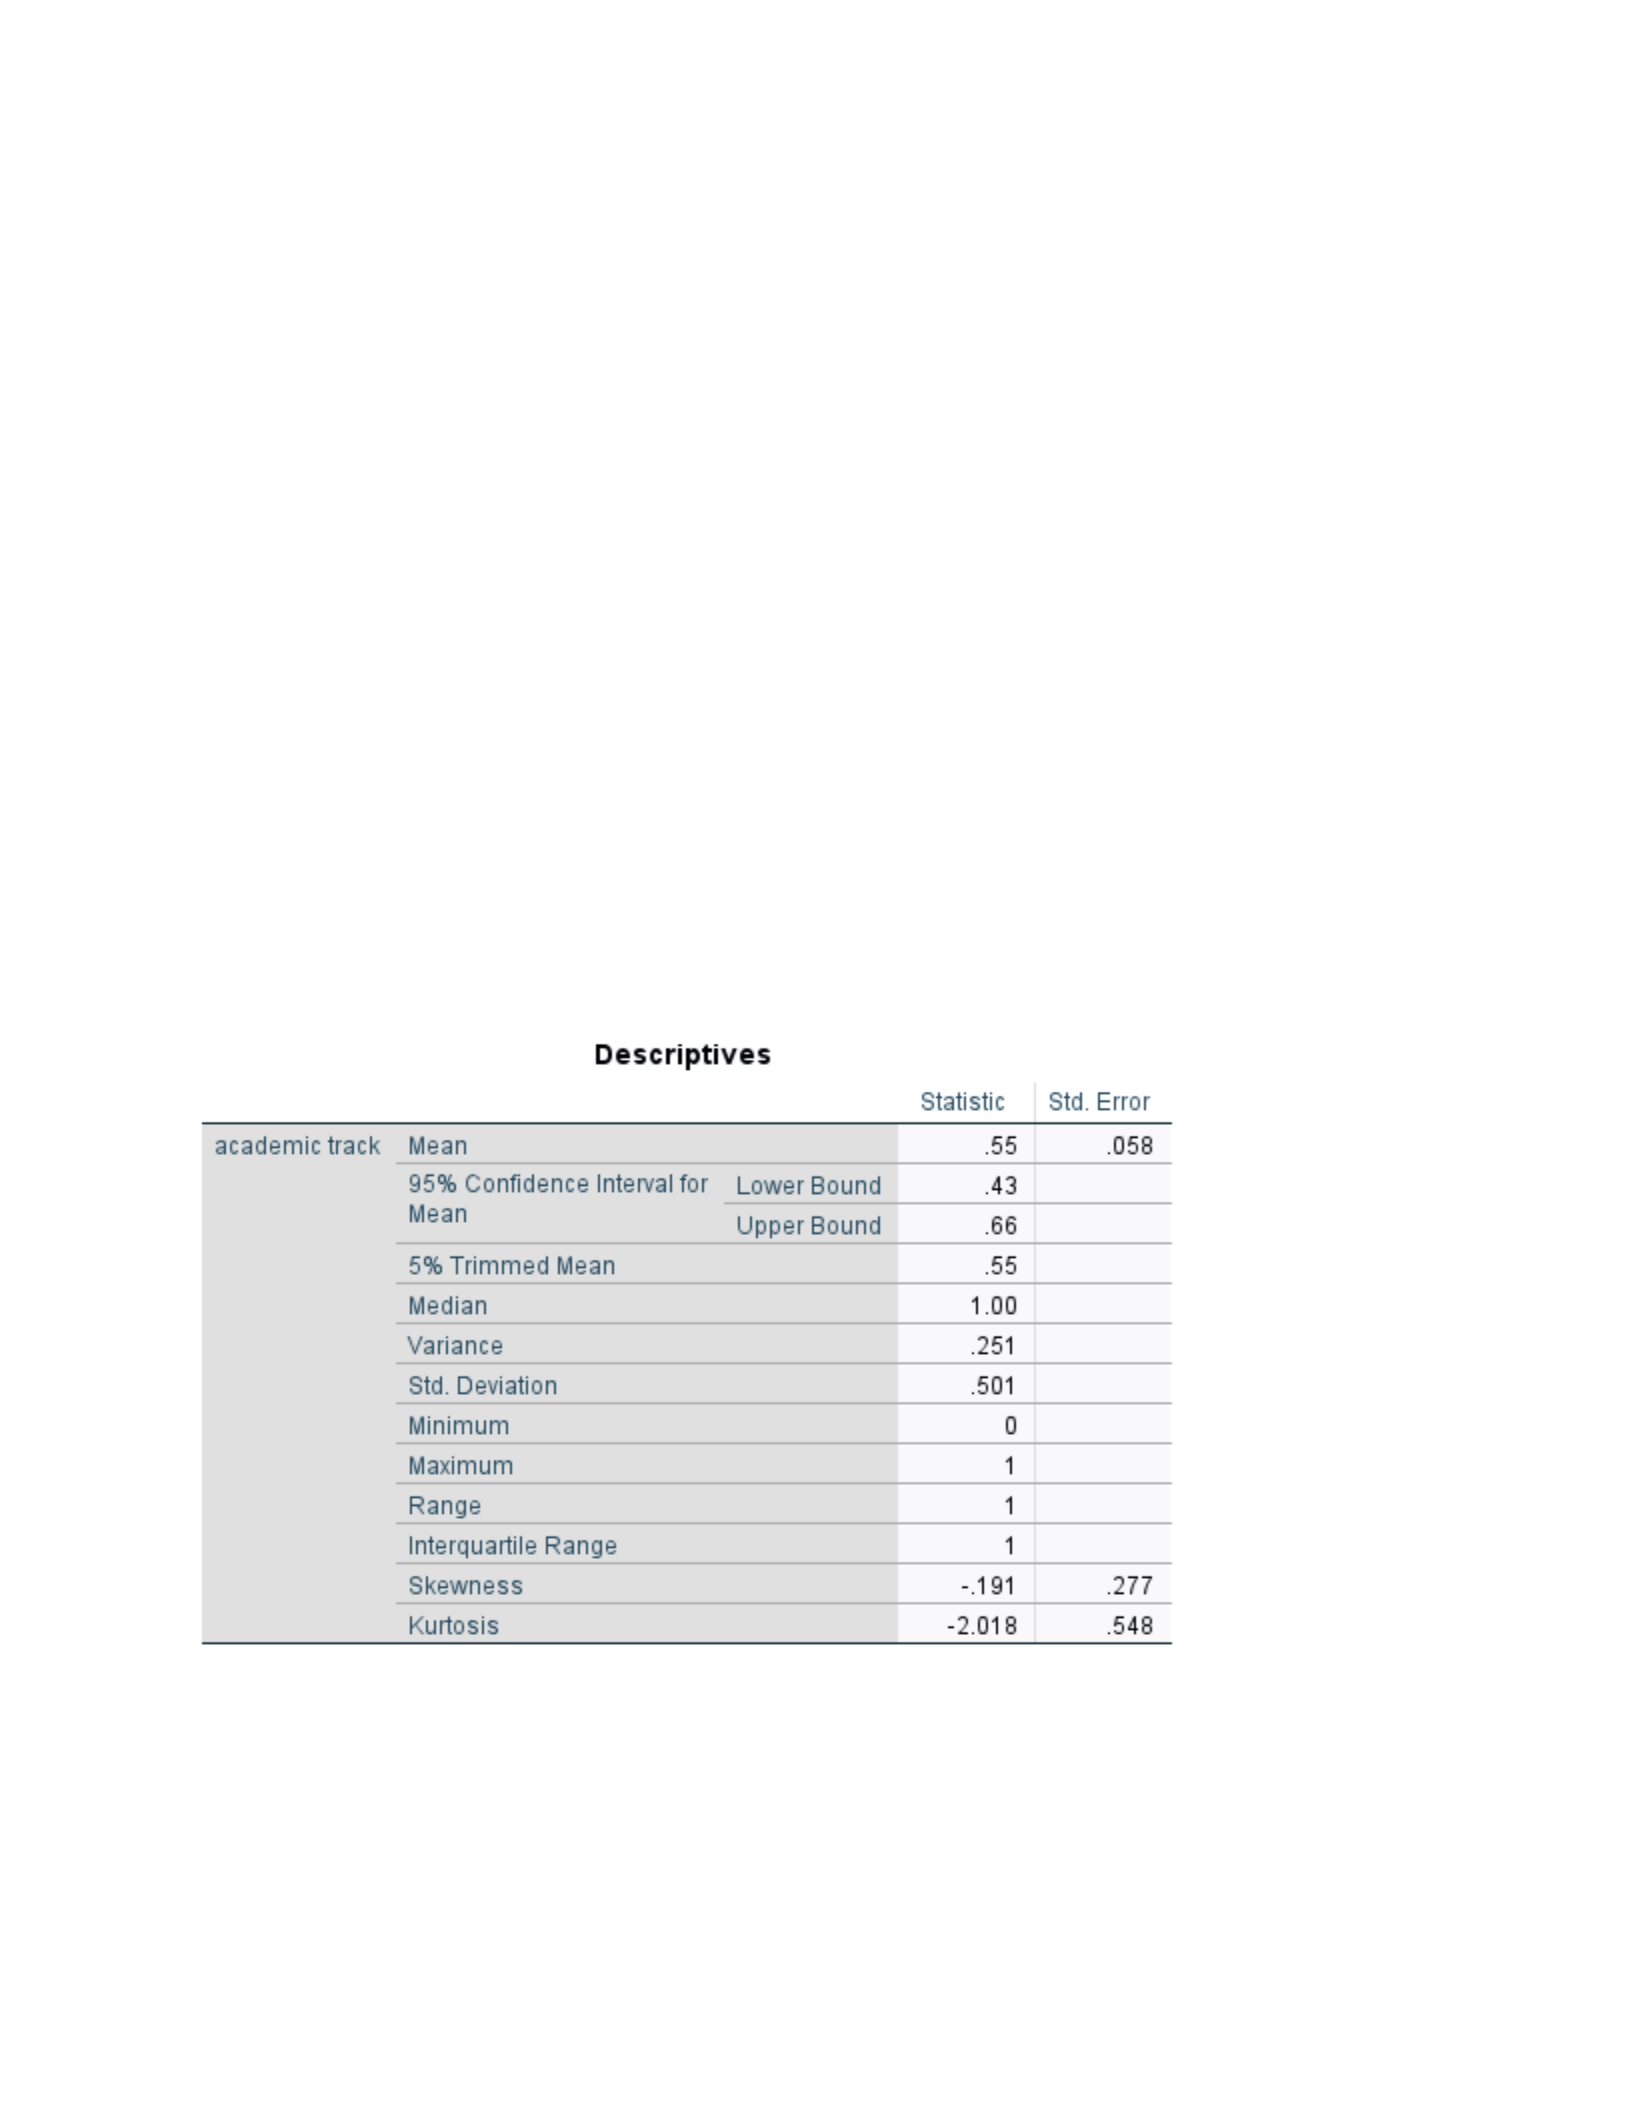
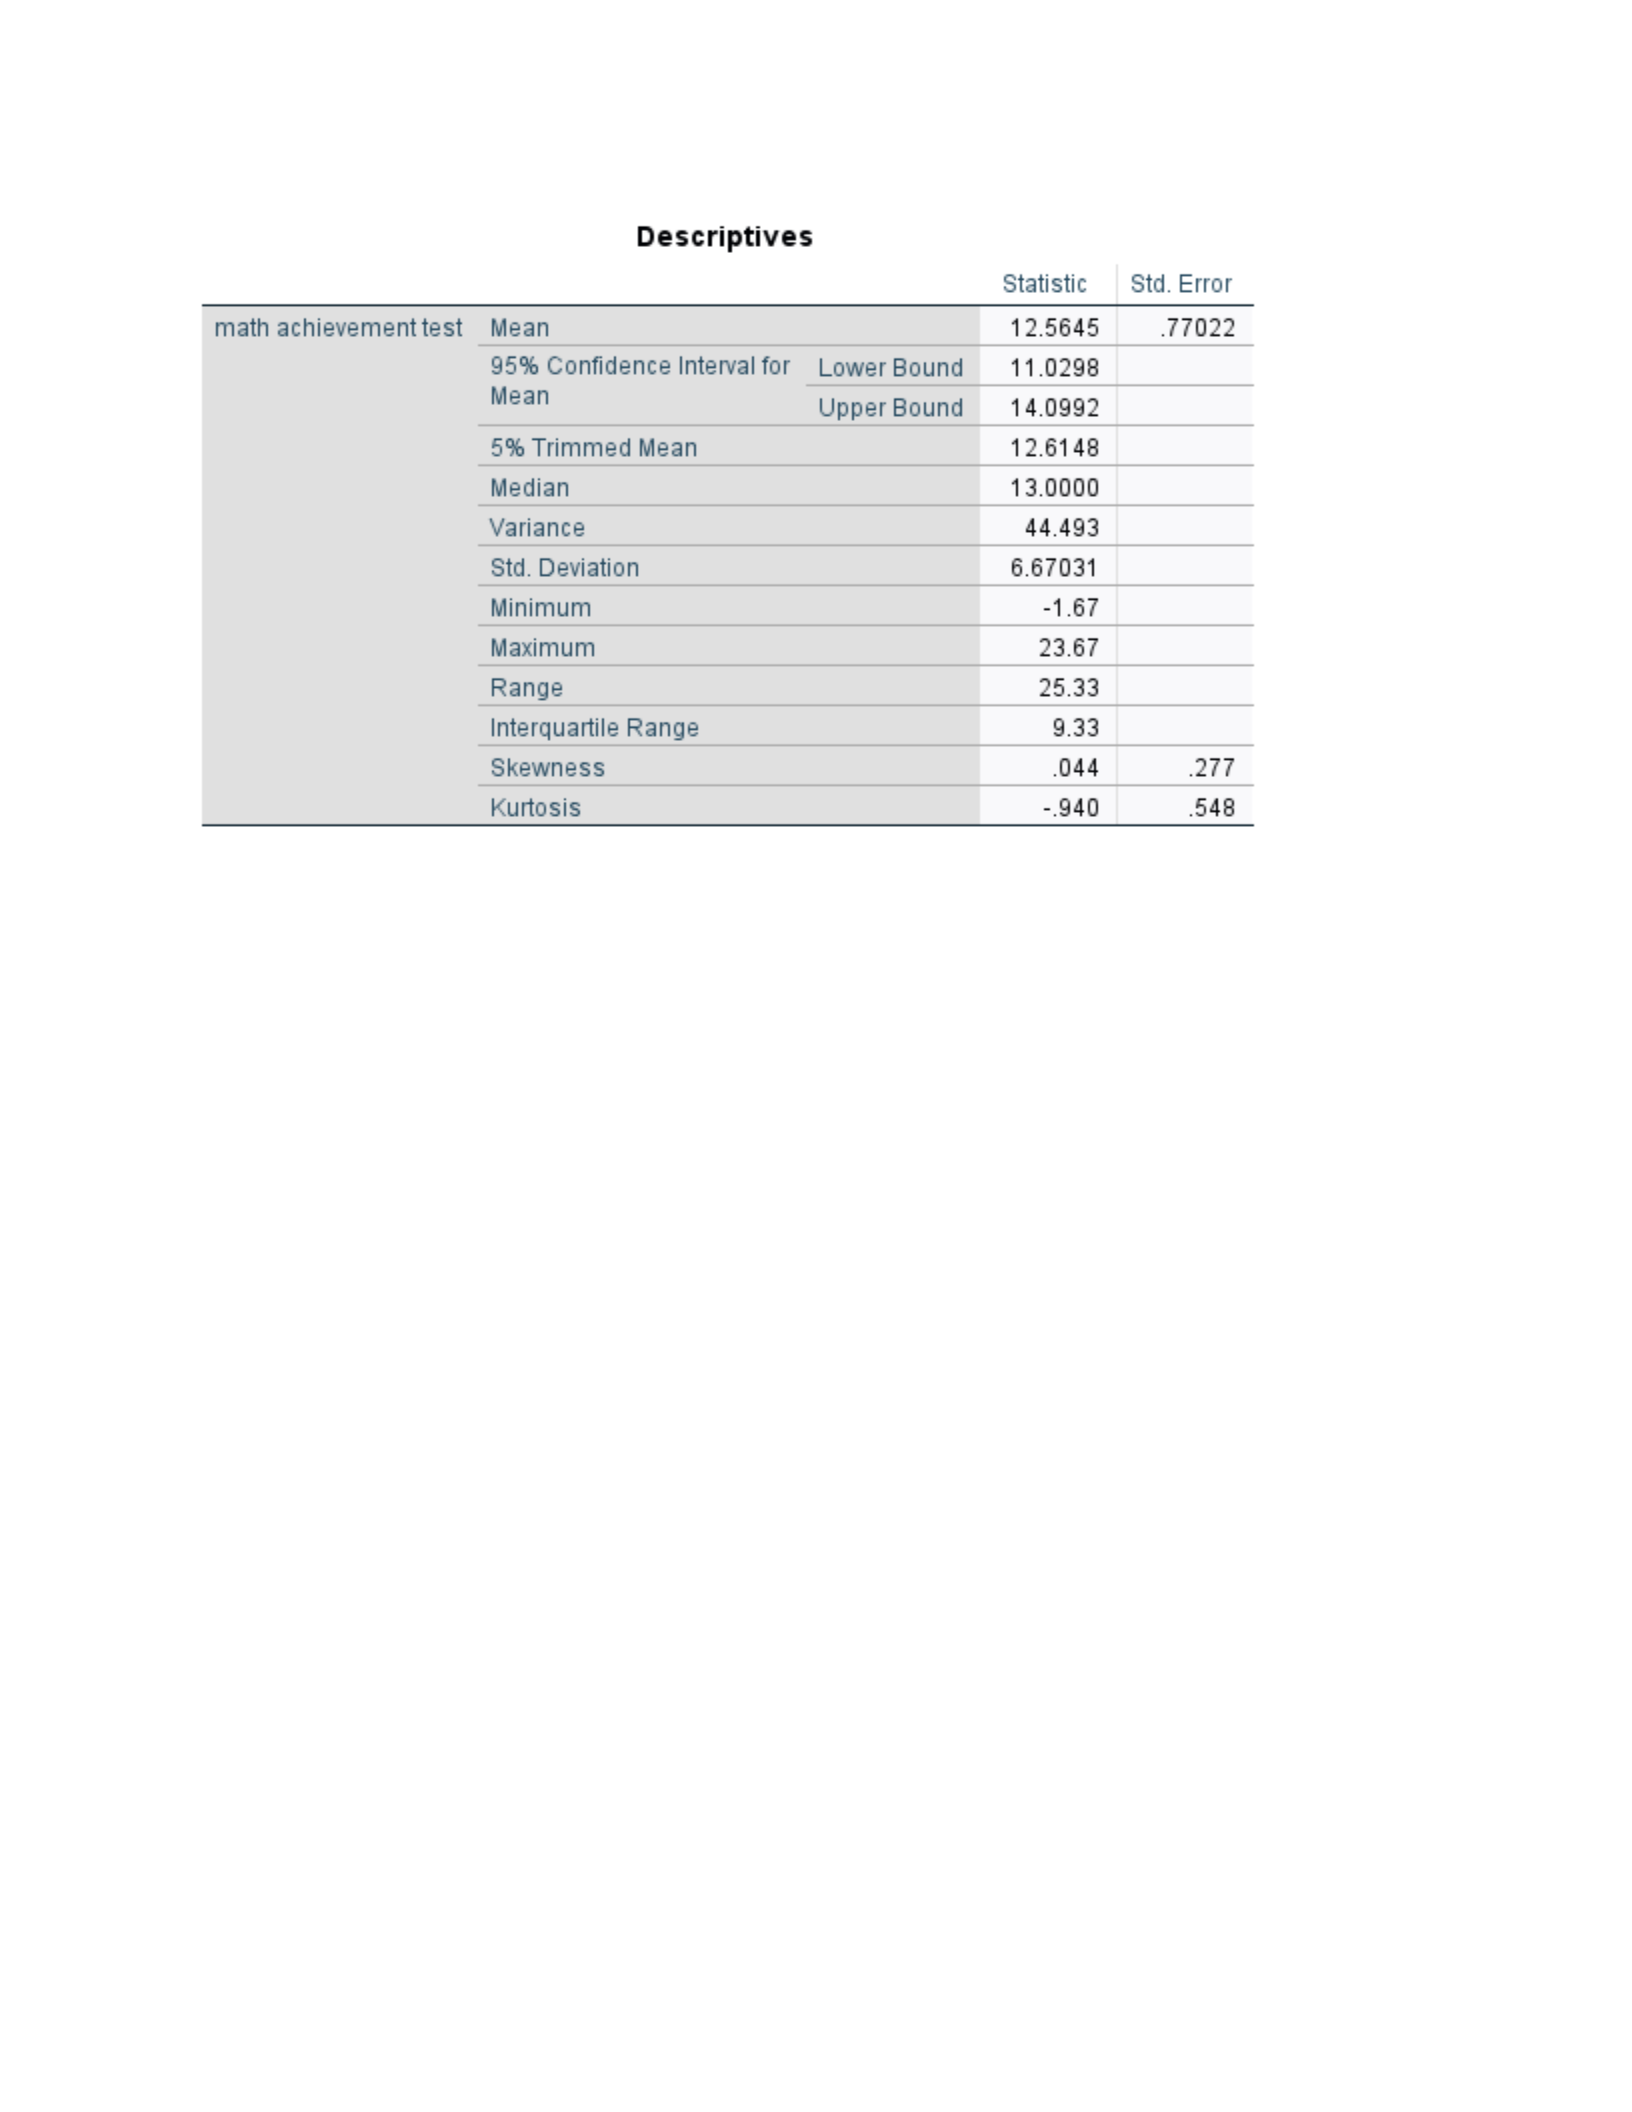
The following figures represent the descriptive data for all four variables. The data being
evaluated is range, standard deviation, and skewness. For nominal variables the range will be
equal to the number of choices available when subtracting the max and min for the variable.
Dichotomous data typically has two groups and will likely have a range of 0-1. Ordinal and
approximately normal data may have a range that is congruent with the limits of the
measurement being taken. Standard deviation is important for ordinal and approximately normal
data and represents the points within defined percentages of the mean. Skewedness refers to
6
5/28/2023
Quantitative Research Methods: Assignment 2
distributions where the mean and median are very different shifting the curve left or right
(Morgan et al., 2020).
Figure 6: Academic Track Descriptive Data
Figure 7: Mother’s Education Descriptive Data
7
5/28/2023

Quantitative Research Methods: Assignment 2
Figure 8: Ethnicity Descriptive Data
Figure 9: Math Achievement Descriptive Data
8
5/28/2023
Quantitative Research Methods: Assignment 2
For figures 6-8 the meaningful data is the range. This concurs that the data is accurate
and complete. Since the data used for these variables is nominal (ethnicity and mother’s
education) and dichotomous (academic track) standard deviation and skewness has no bearing on
the statistical value. The math achievement test is comprised of ordinal data and can be applied
to a bell curve for analysis. This makes the descriptors standard deviation and skewness pertinent
data for the handling of this information.
A2.5: Chapter 3, Problem 3.5
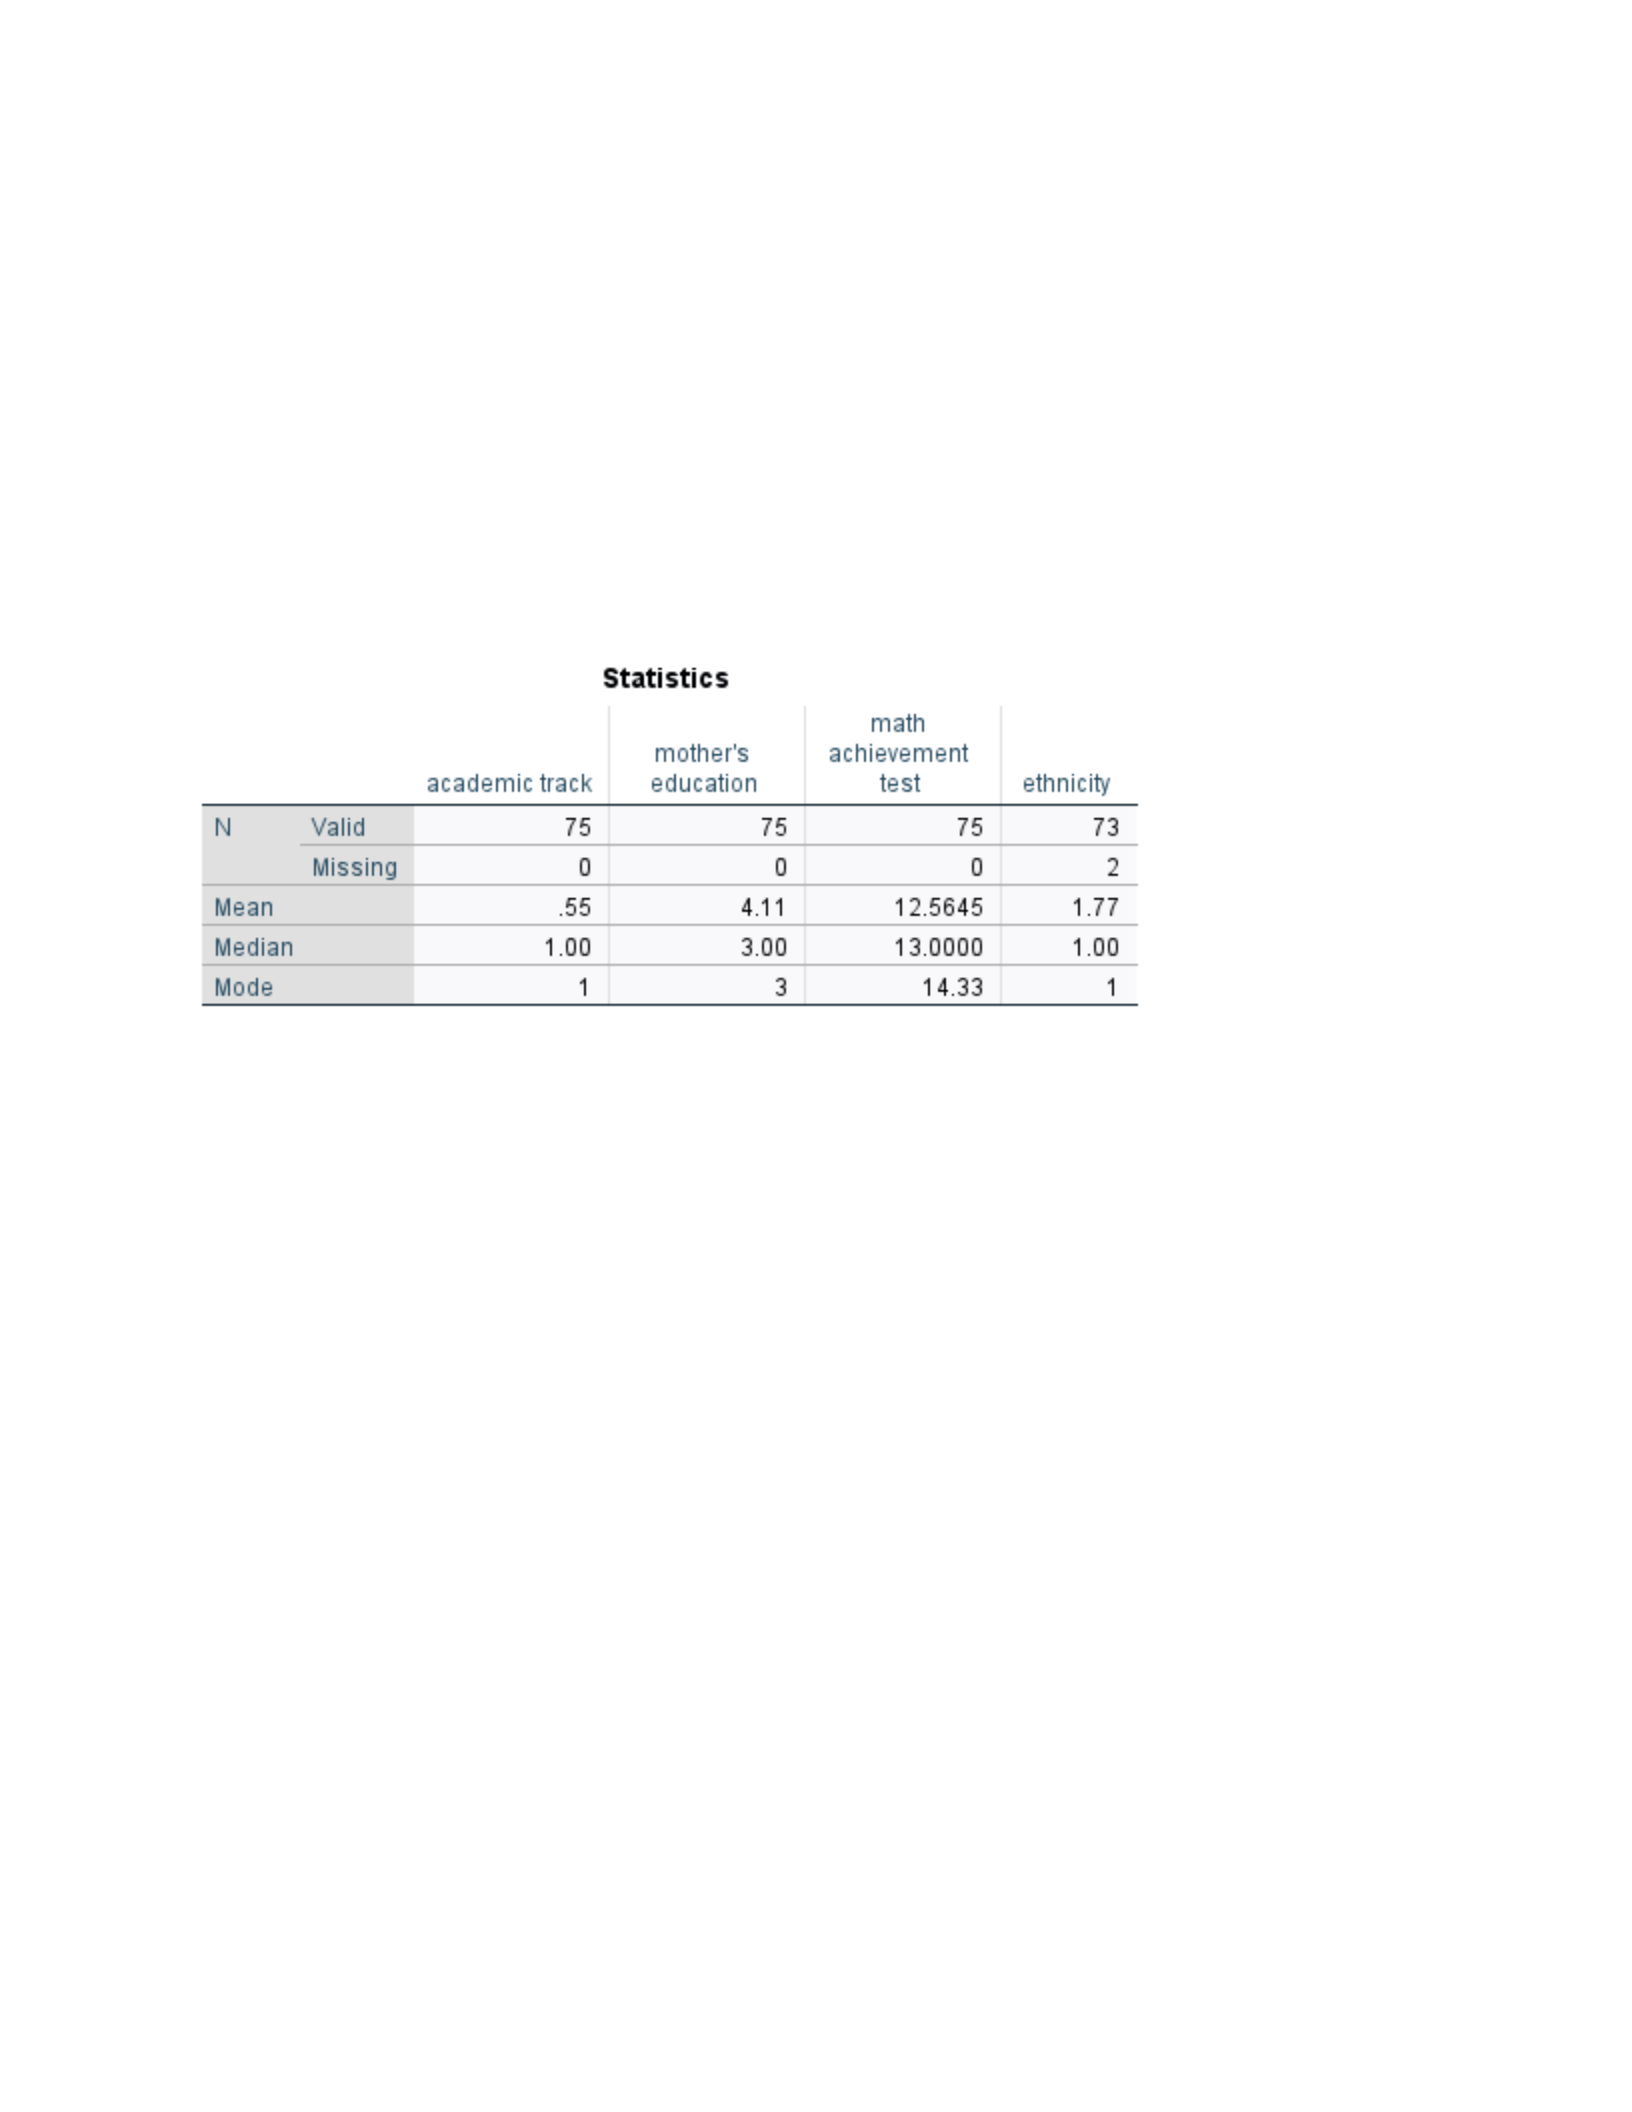
The mean, median, and mode are descriptive measures that aid in the measure of central
tendency. Mean is the most common measure used in measuring central tendency of normal data
and is highly accurate as long as the data does not present with a high level of skewedness
(Morgan et al., 2020). Median is the best descriptor to measure central tendency with raw ordinal
data when skewed distribution is present (Morgan et al., 2020). Mode is only valid with nominal
data. Considering the variables analyzed, mode is meaningful for mother’s education, ethnicity,
and academic track since the best statistical value is derived from which choice was chosen the
9
5/28/2023
Quantitative Research Methods: Assignment 2
most. These three variables also represent nominal data variables that are assigned numeric
values assigned to a category with no numerical significance. The math achievement test data is
ordinal in nature and the mean can be used to represent the central tendency. The mean and
median are close enough that the skewedness of the data is not significant enough to require the
use of the median as the central tendency indicator.
Figure 10: Mean, Median, and Mode Data
Reference
Li, H., Munk, A., Sieling, H., & Walther, G. (2020). The essential histogram. Biometrika,
107(2), 347–364. https://doi.org/10.1093/biomet/asz081
Morgan, G. A., Barrett, K. C., Leech, N. L., & Gloeckner, G. W. (2020). IBM SPSS for
introductory statistics: Use and interpretation (6th ed.). Routledge.
10
5/28/2023

