


QUANTITATIVE ANALYSIS: DATA CODING, ENTRY, AND CHECKING 1
Marcos Reis Campos, MBA
BUSI 820
Liberty University
May 19, 2024
Table of Contents

QUANTITATIVE ANALYSIS: DATA CODING, ENTRY, AND CHECKING 2
Interpretation Questions: Chapter 2.................................................................................................3
A1. 2.1. Steps/actions taken after data collection and before running analyses to answer research
questions/testing research hypotheses?............................................................................................3
A1. 2.2. Why should you label the values of nominal variables?....................................................4
A1. 2.3. Why would you print a codebook or dictionary?...............................................................4
A1. 2.4. What if data file contains words/letters instead of numbers?............................................4
A1. 2.5. Why use Mean to create a variable?..................................................................................5
A1. 2.6. (a) Why is it important to check raw data before/after entering them?.............................5
A1. 2.6. (b) What are ways to check data before/after entering them?...........................................5
SPSS Problems: Chapter 2...............................................................................................................6
2.1 (a) Compute N, minimum, maximum, and mean for all variables............................................6
2.1 (b) How many students have complete data?............................................................................6
2.1 (c) Identify any statistics on the output that are not meaningful. Explain.................................6
2.2 (d) What is the mean height of the students?.............................................................................6
2.2 (e) What about the average height of the same-sex parent?......................................................7
2.2 (f) What percentage of students are males?...............................................................................7
2.2 (g) What percentage have children?..........................................................................................7
References........................................................................................................................................8
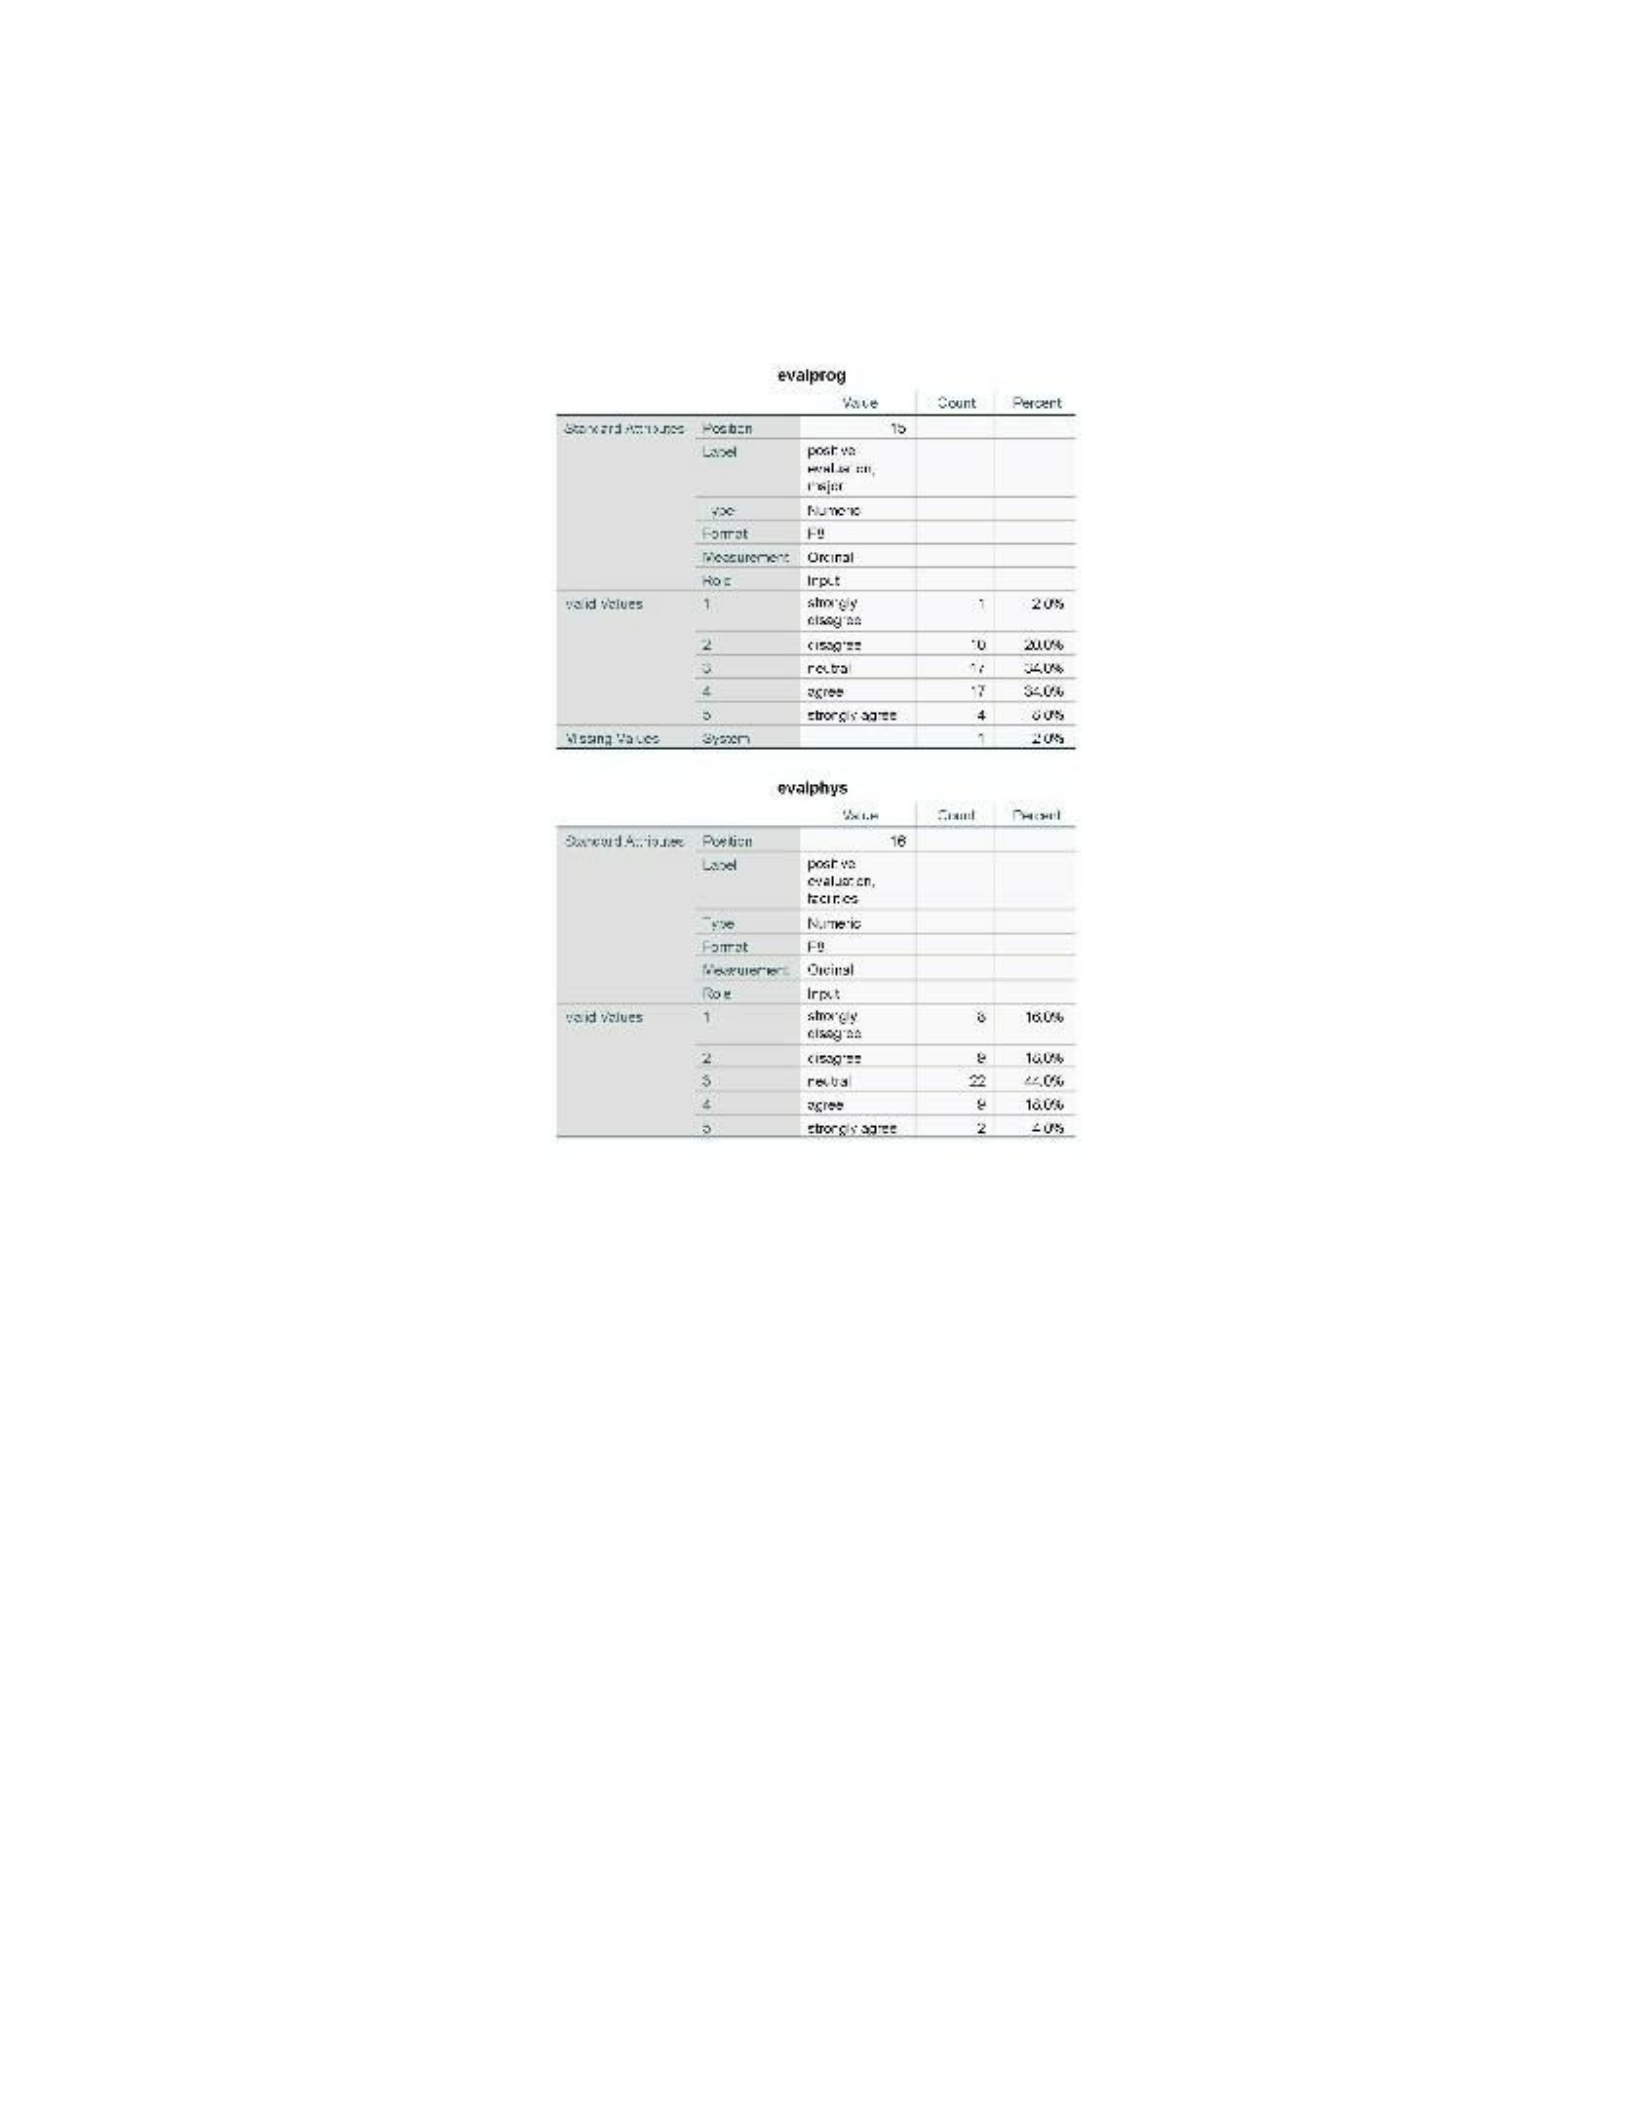
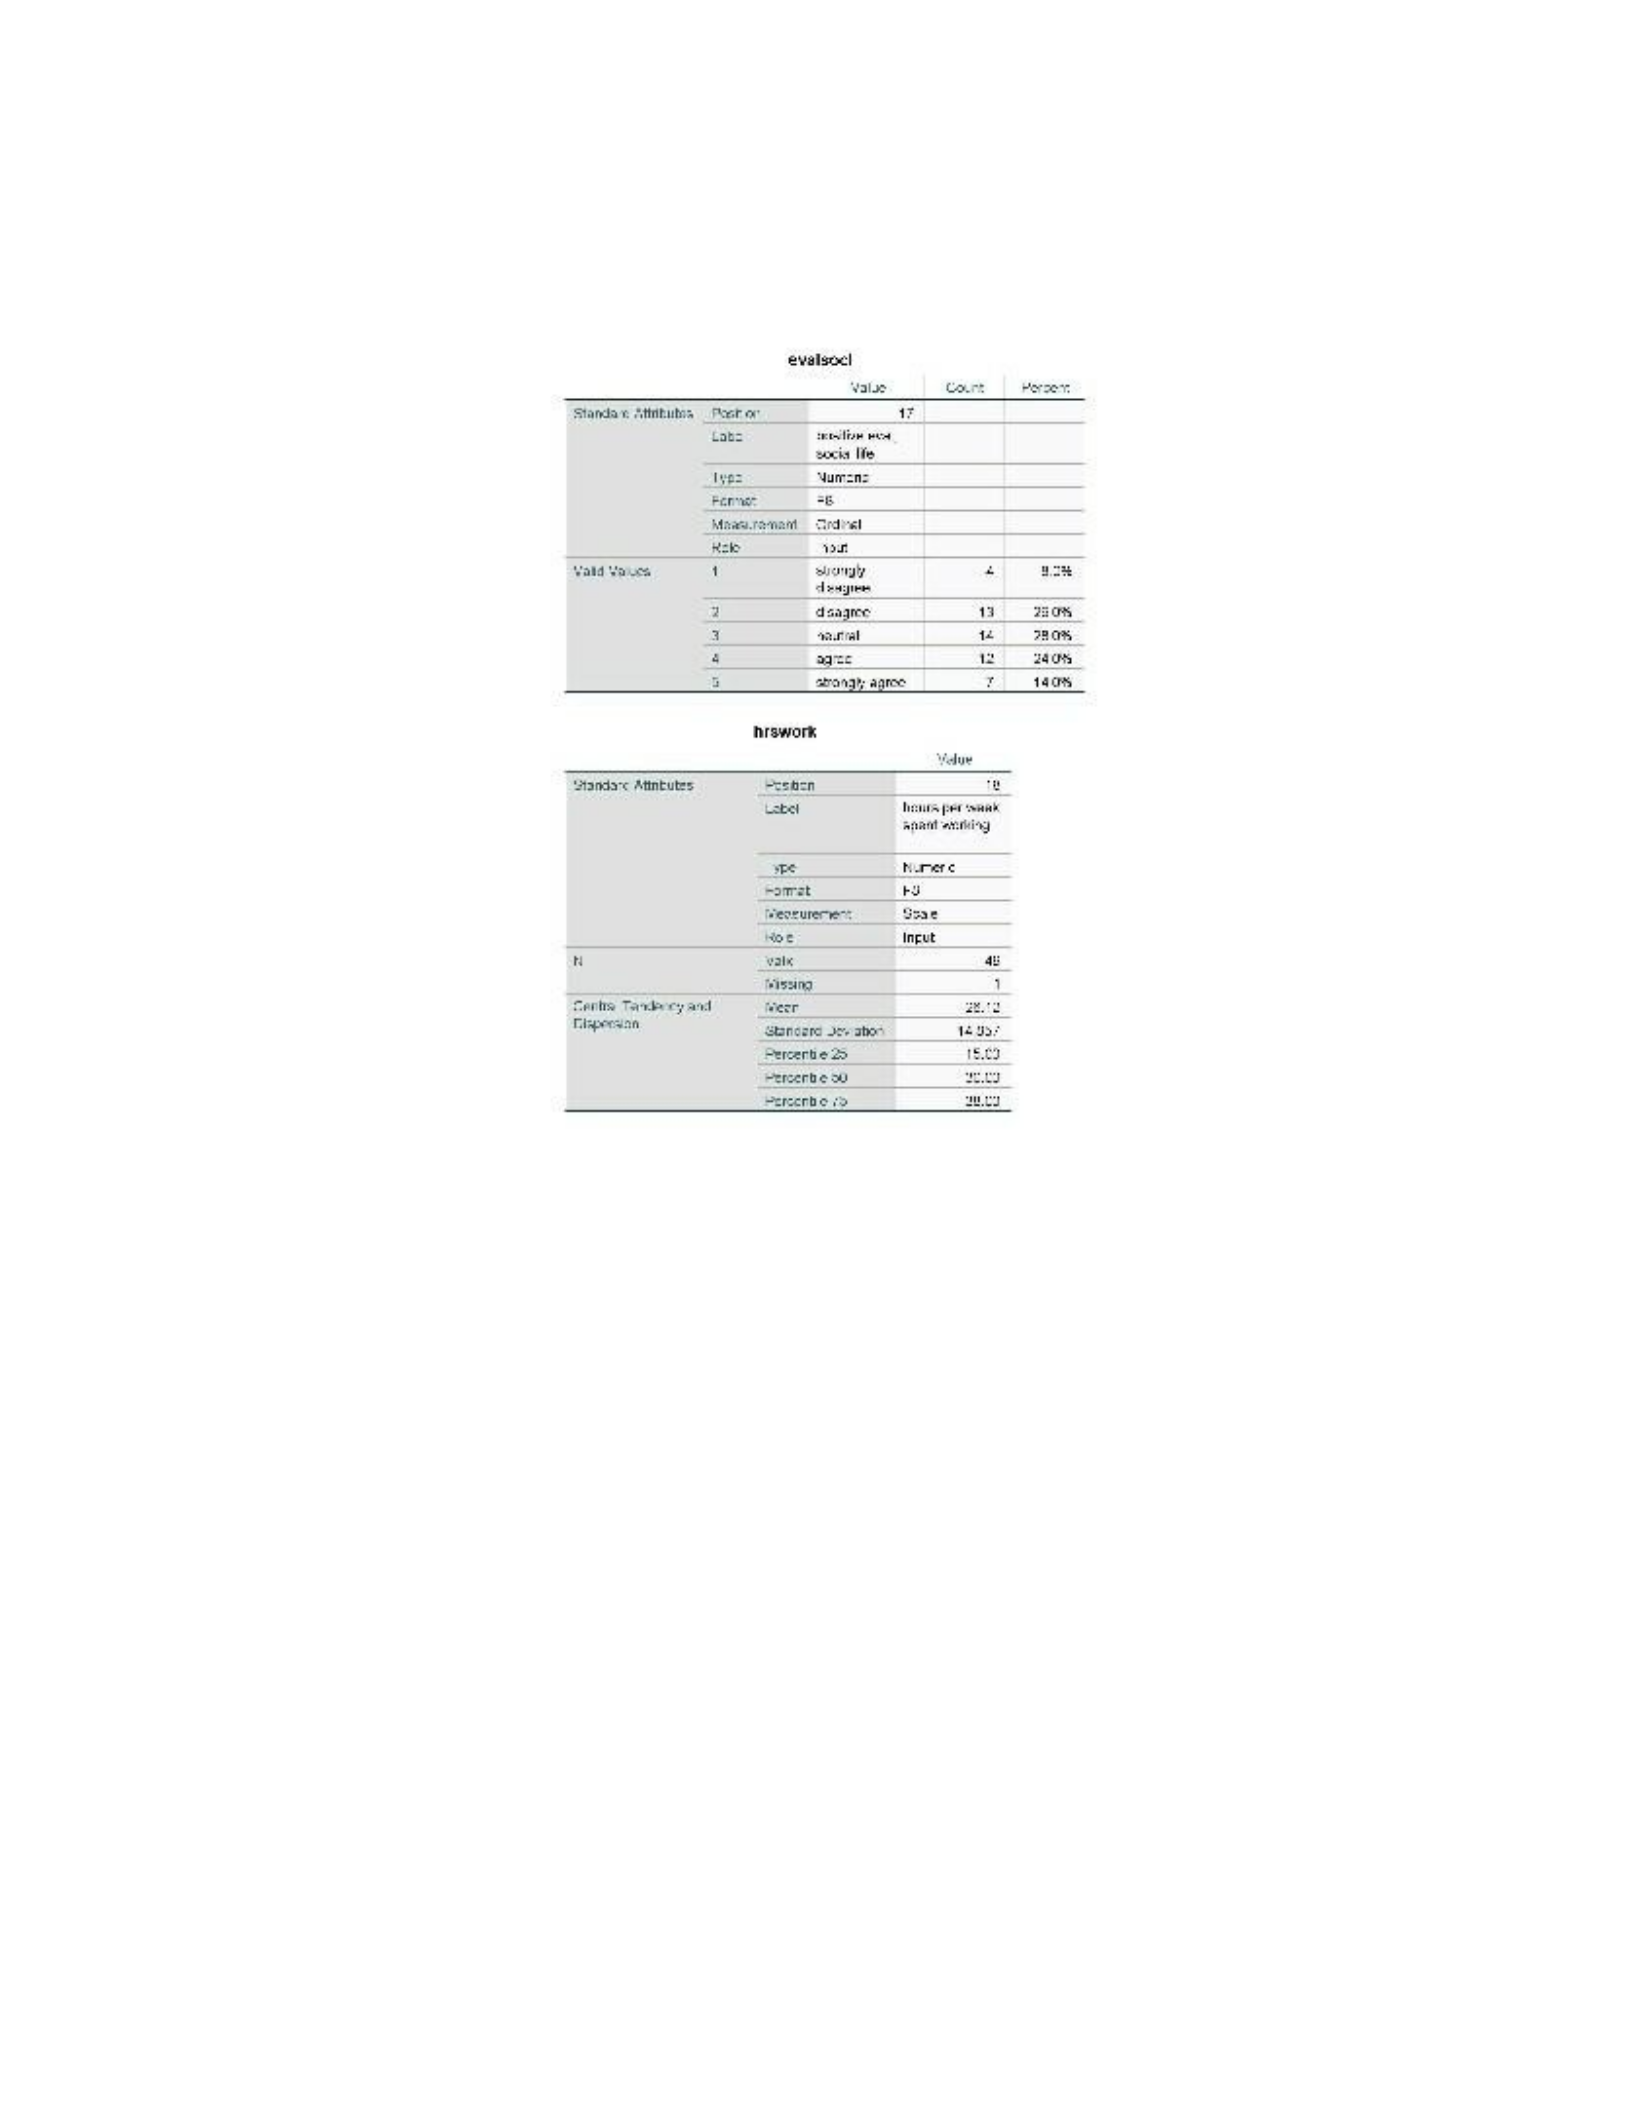
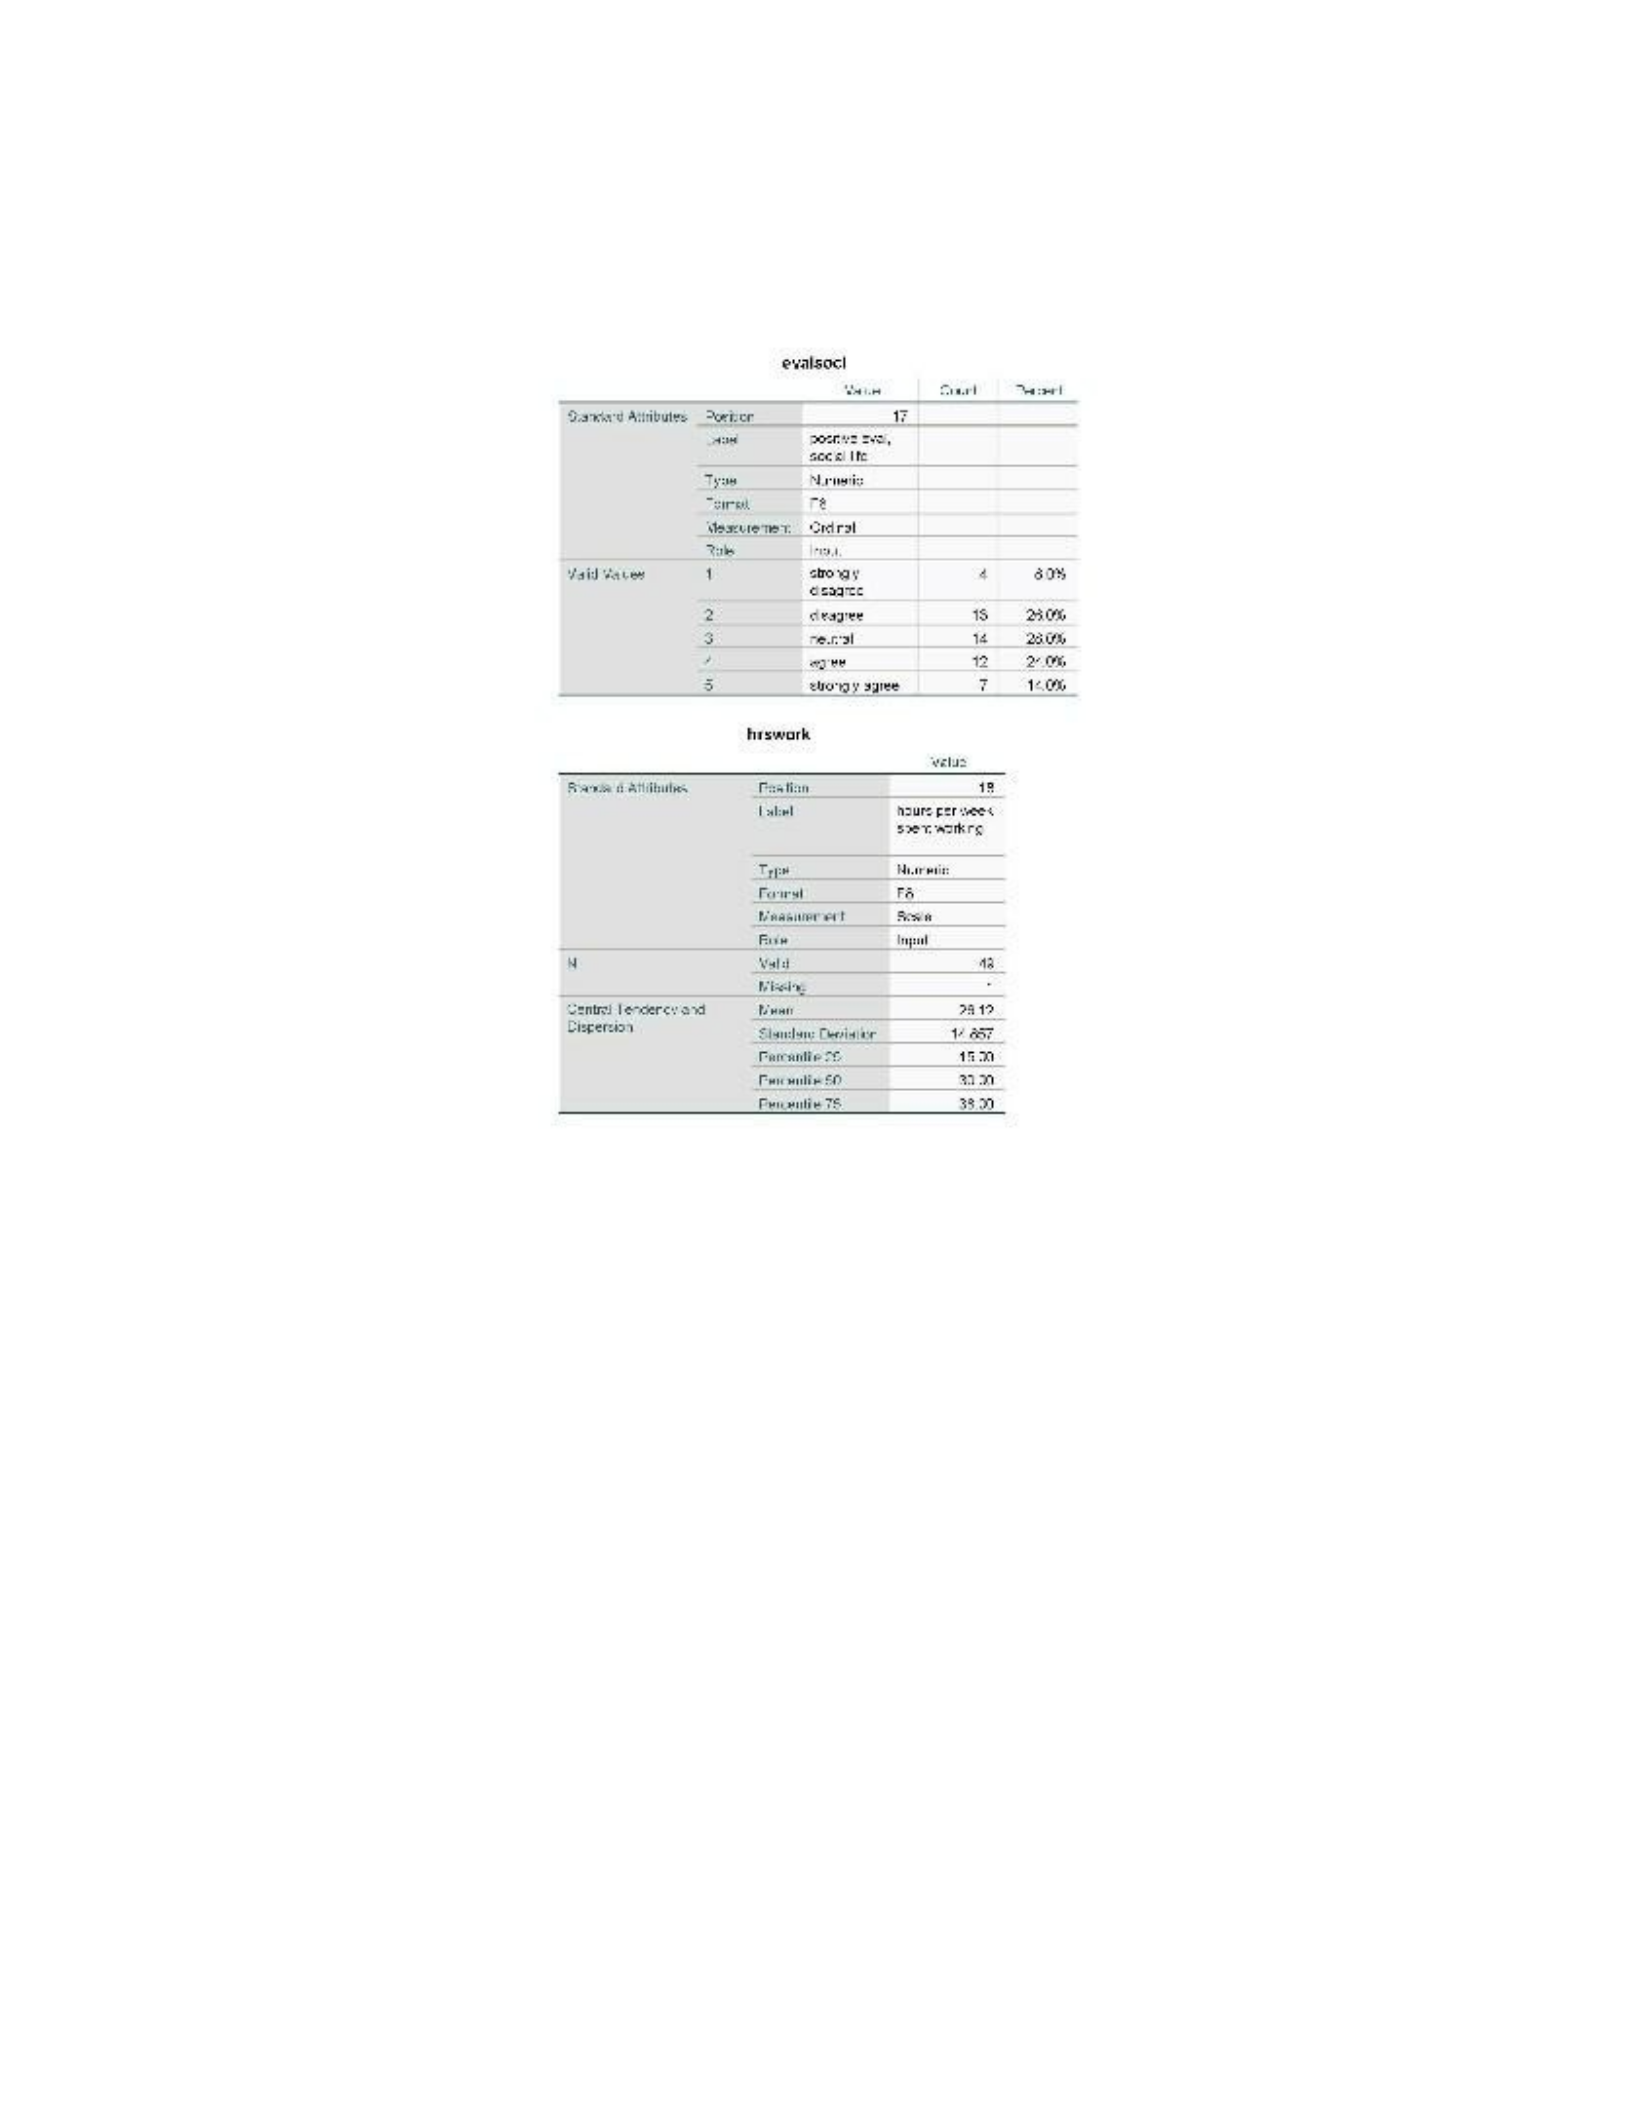
Figure 1: 2.3 – Codebook.................................................................................................................9
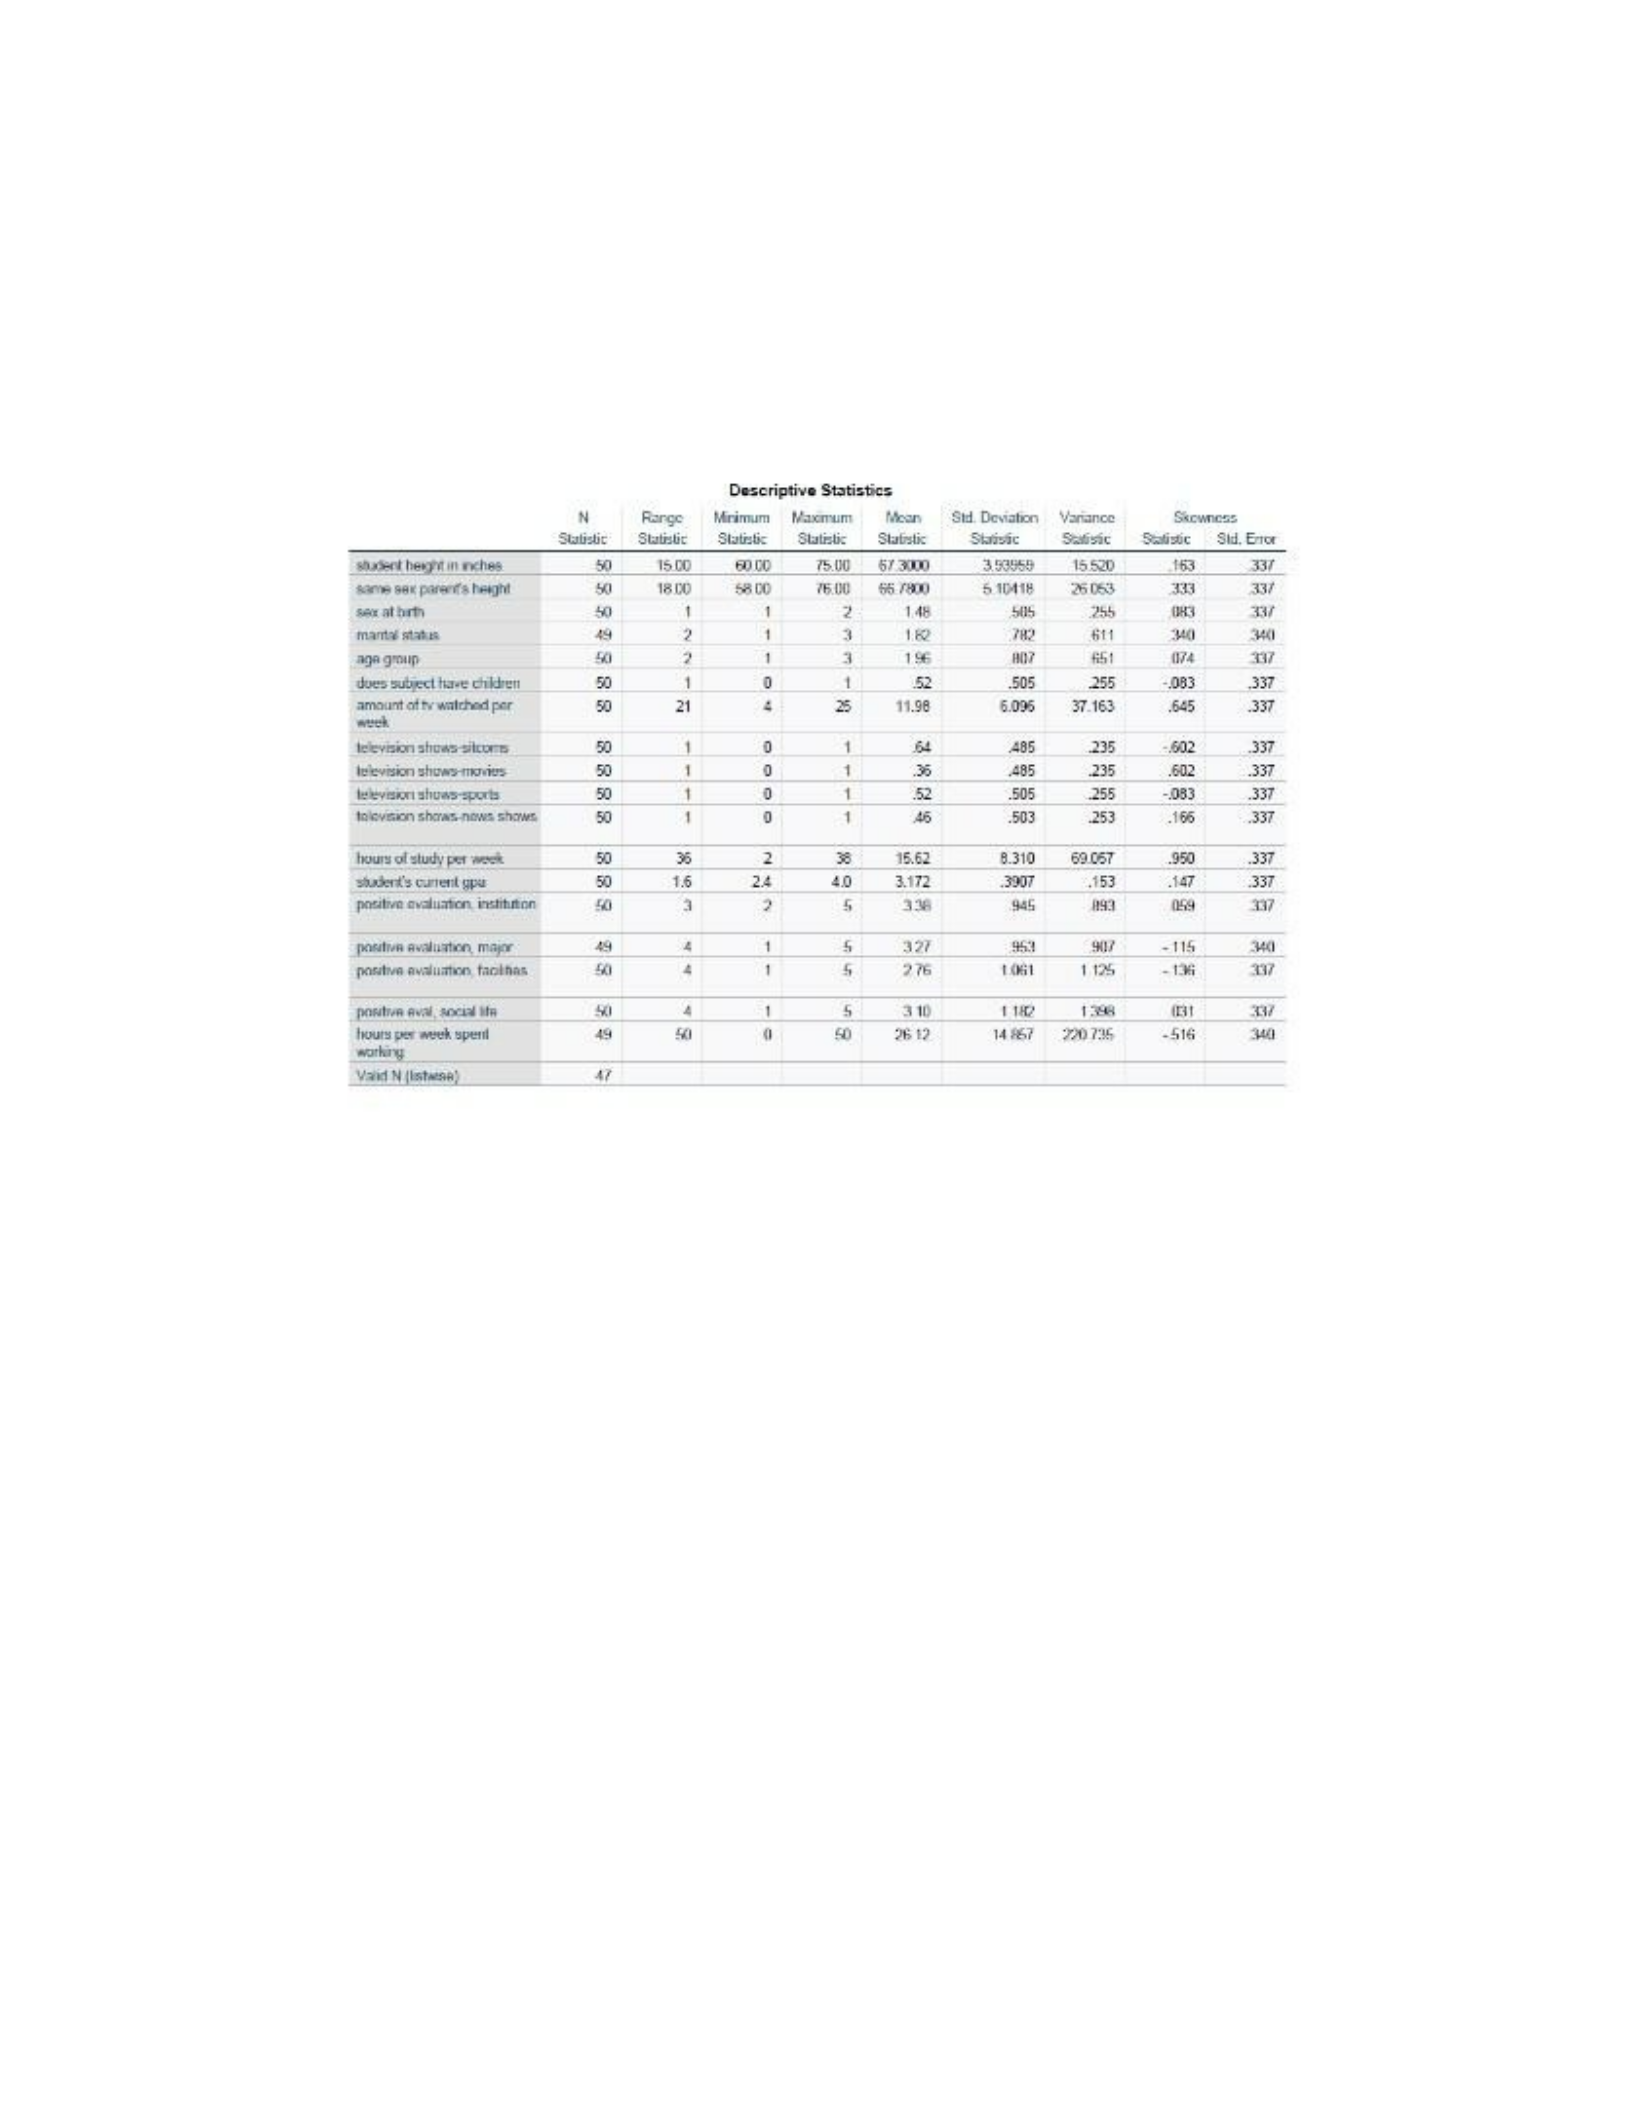
Figure 2: 2.1 (a): N, Minimum, Maximum, and Mean..................................................................16
Interpretation Questions

QUANTITATIVE ANALYSIS: DATA CODING, ENTRY, AND CHECKING 3
Chapter 2
A1. 2.1. Steps/actions taken after data collection and before running analyses to answer
research questions/testing research hypotheses?
In order to prepare data for subsequent procedures, it is necessary to consolidate and
integrate information from numerous sources into a unified system. Data processing is critical for
the identification and correction of unprocessed or tainted data. Data transformation to the
intended format facilitates subsequent testing and analysis subsequent to data purification and
processing. A number of procedures must be completed subsequent to data collection in order to
prepare the data for analysis. Some examples include:
● Generation of databases
● Input of data into a computing system.
● Eliminating data
● Handling incomplete or absent data
● Assigning a desired outcome through the modification or manipulation of data is referred
to as "data manipulation."
● By analyzing, cleansing, manipulating, and modeling data, the objective of data analysis
is to uncover insights, draw conclusions, and facilitate decision-making.
The extent and magnitude of empirical investigations are limited. As researchers, our
objective is to enhance our comprehension of the society in which we exist, our position within
it, the subjects we are investigating, and our individual encounters. The subject of our study is
actions and their outcomes (Kilbourne et al., 2019)
A1. 2.2. Why should you label the values of nominal variables?

QUANTITATIVE ANALYSIS: DATA CODING, ENTRY, AND CHECKING 4
Detail-oriented note-taking will prove advantageous to both your future self and any
other individual assessing your study. Your future personality is an integral component of this.
Time will pass and the entire data set will become more difficult to comprehend, as the absence
of identifiers will obscure the data's true significance. Moreover, more comprehensible outcomes
can be achieved through the meticulous classification of the data (Dupont, 2021).
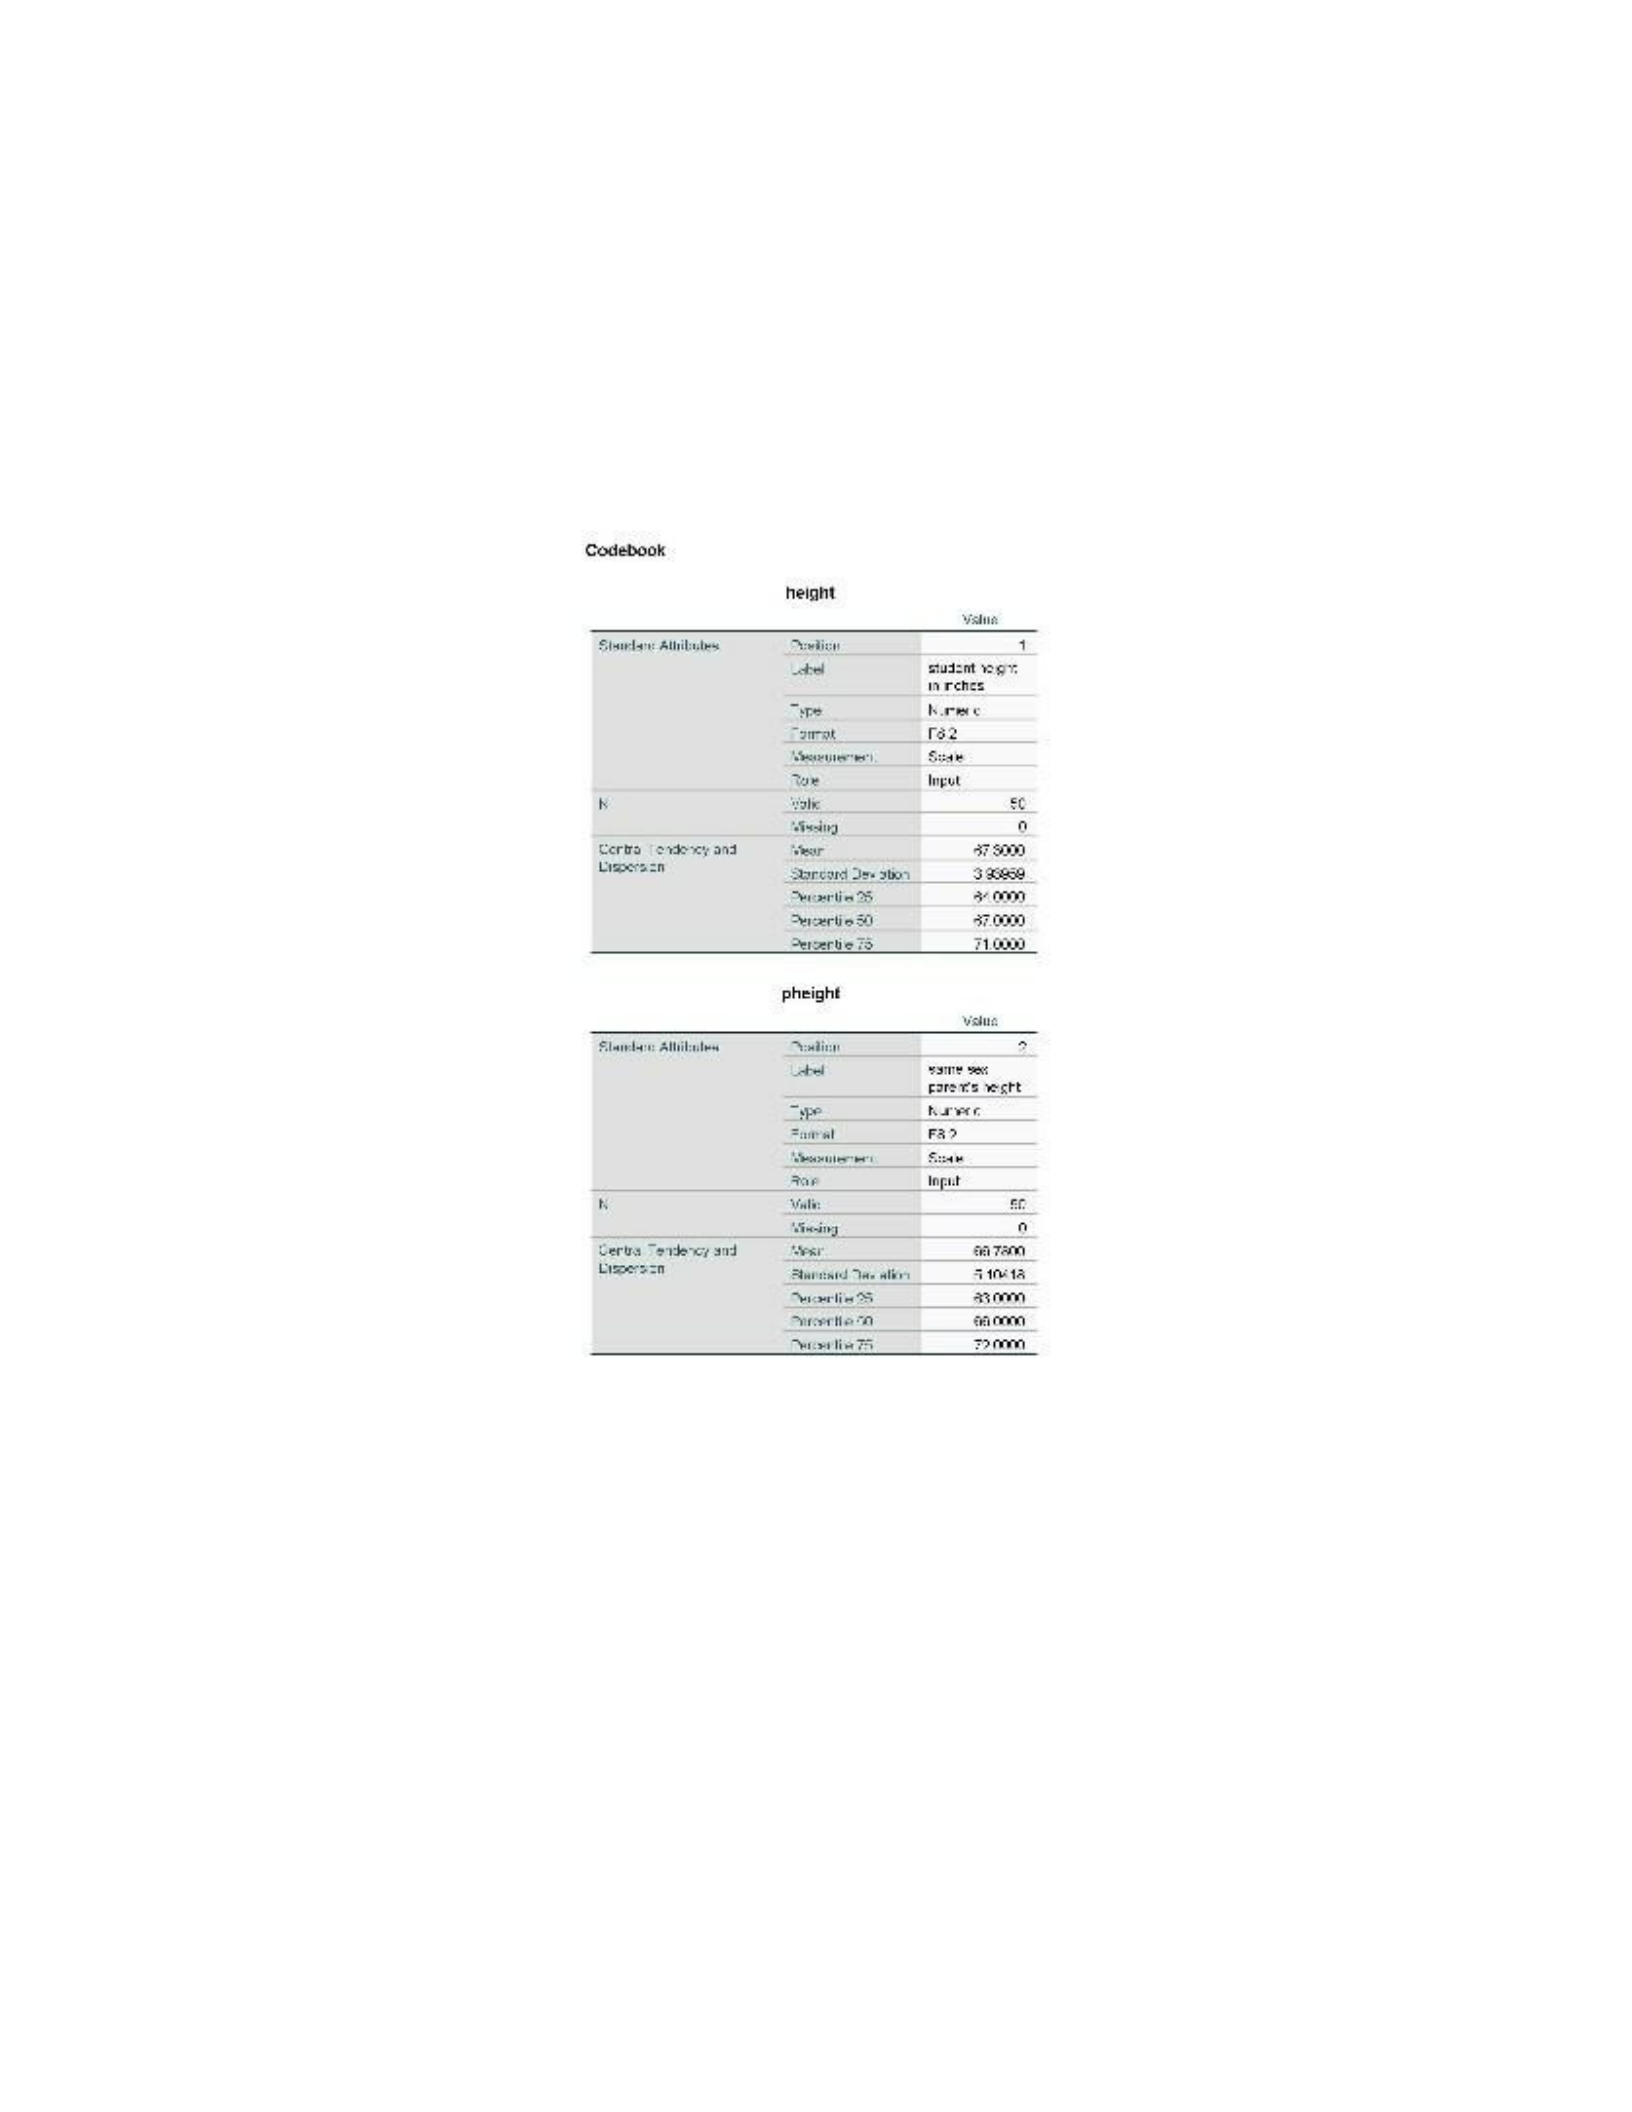
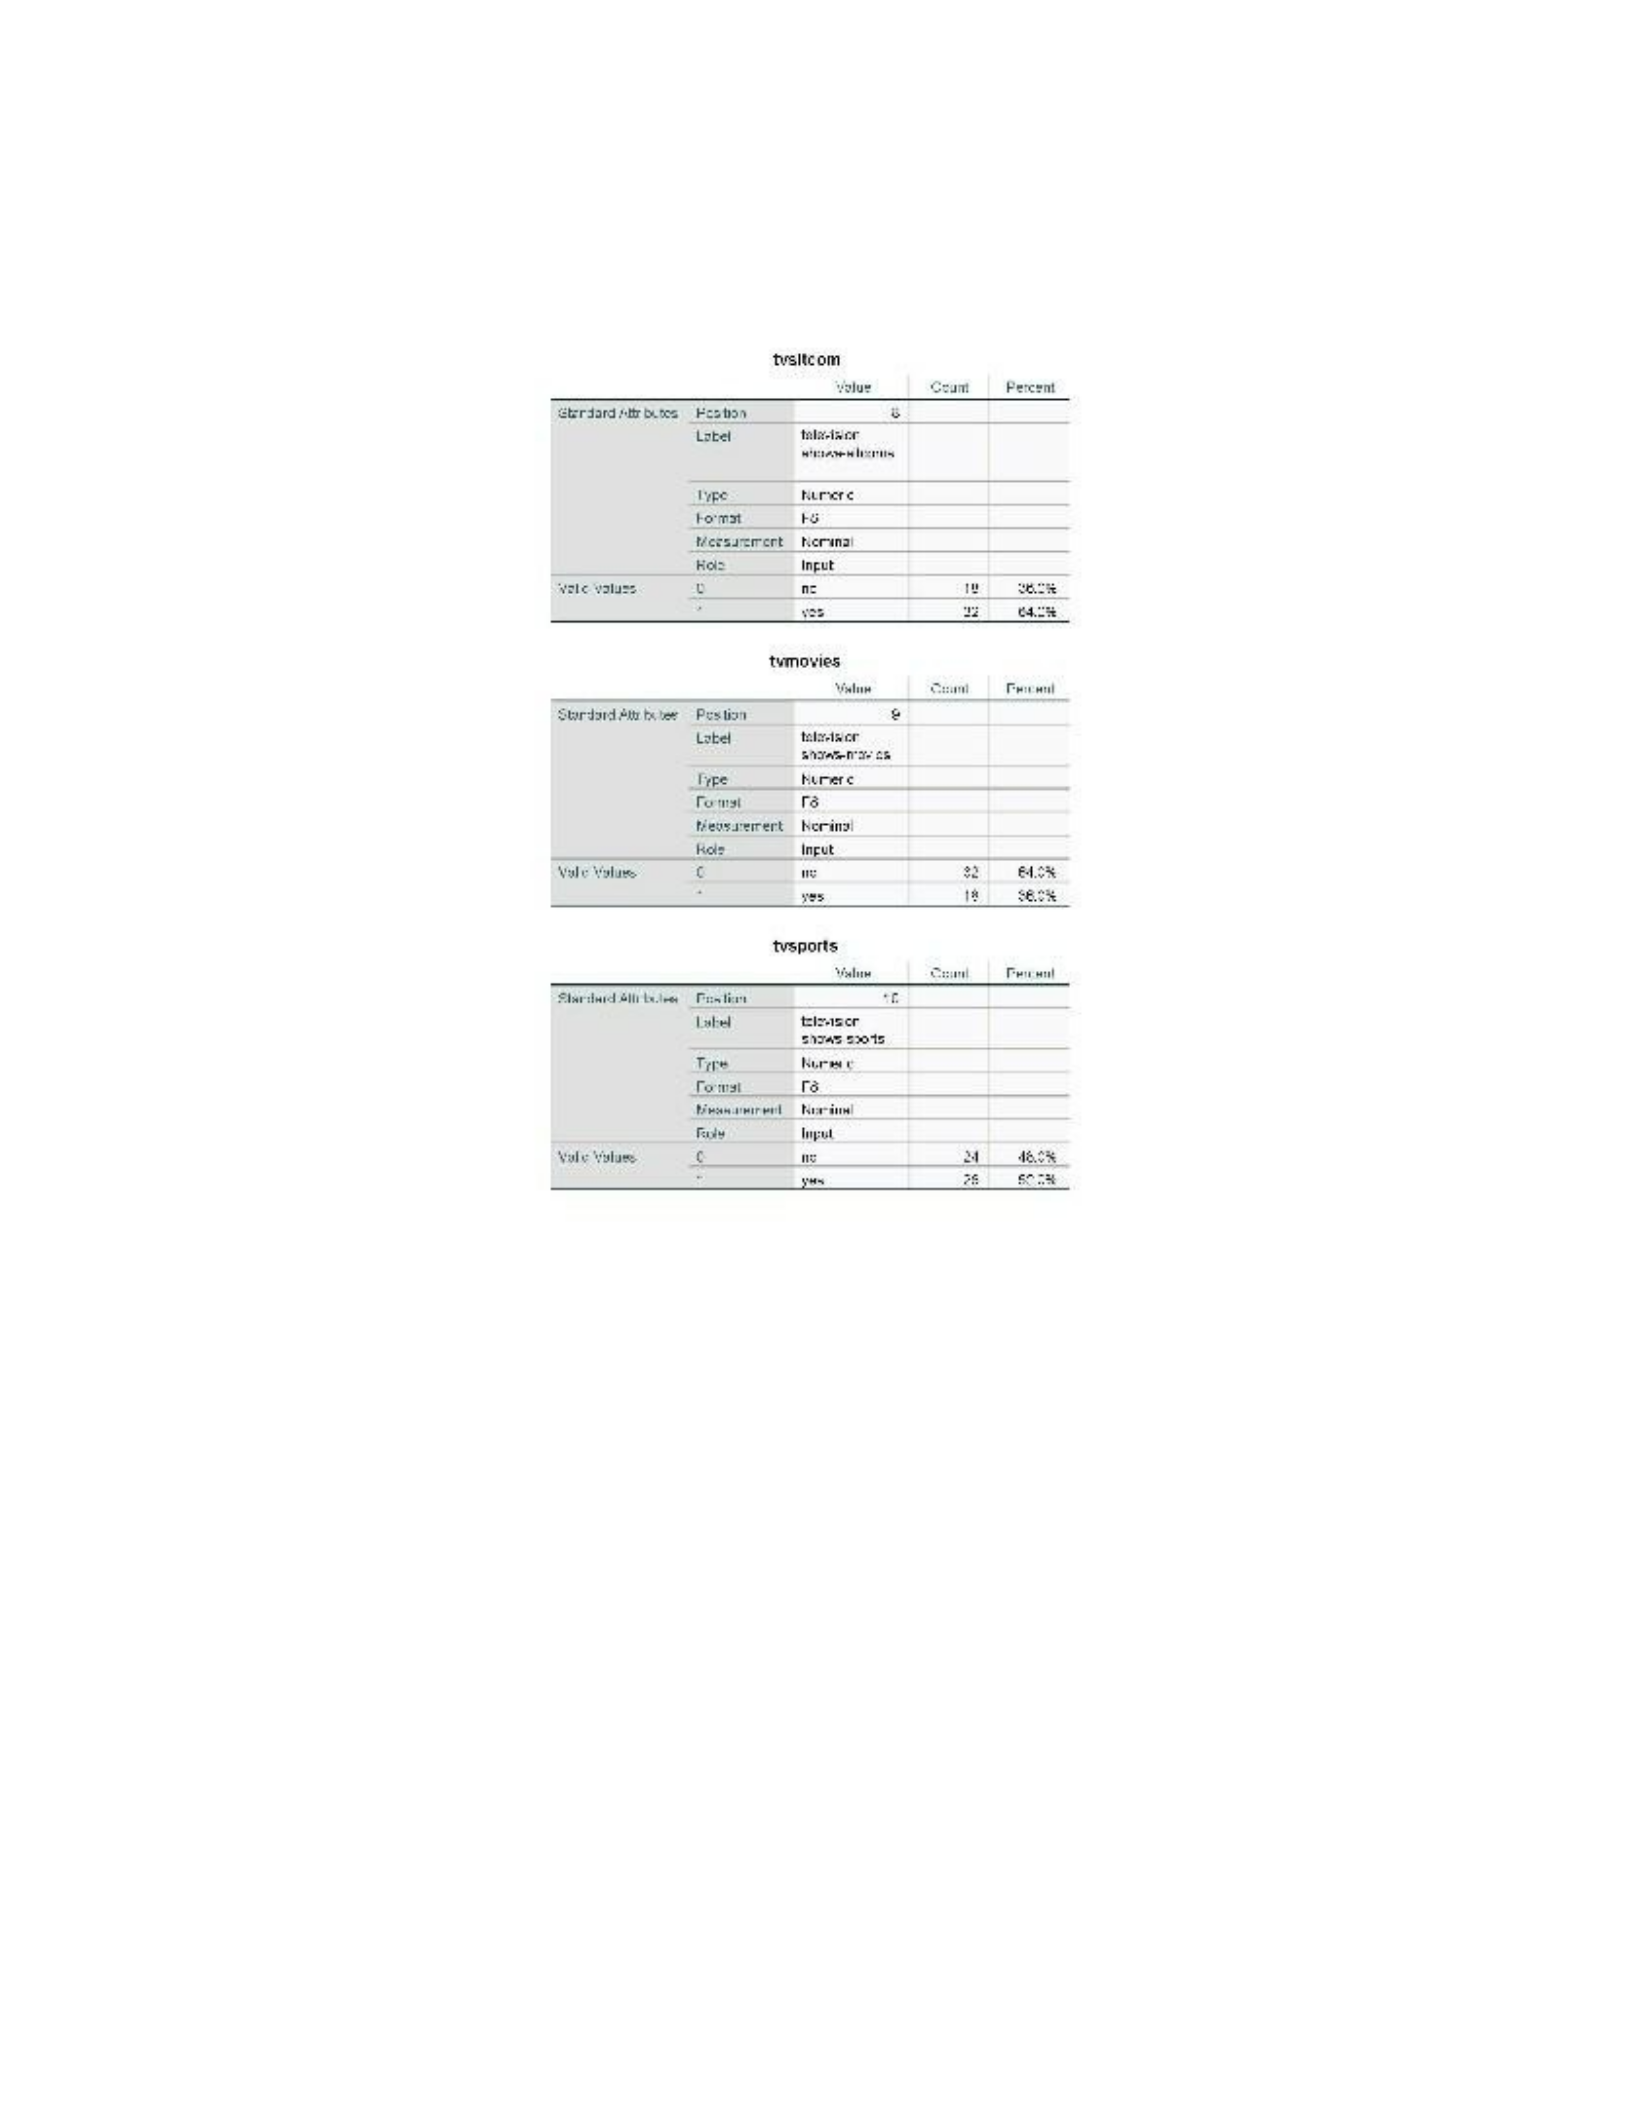
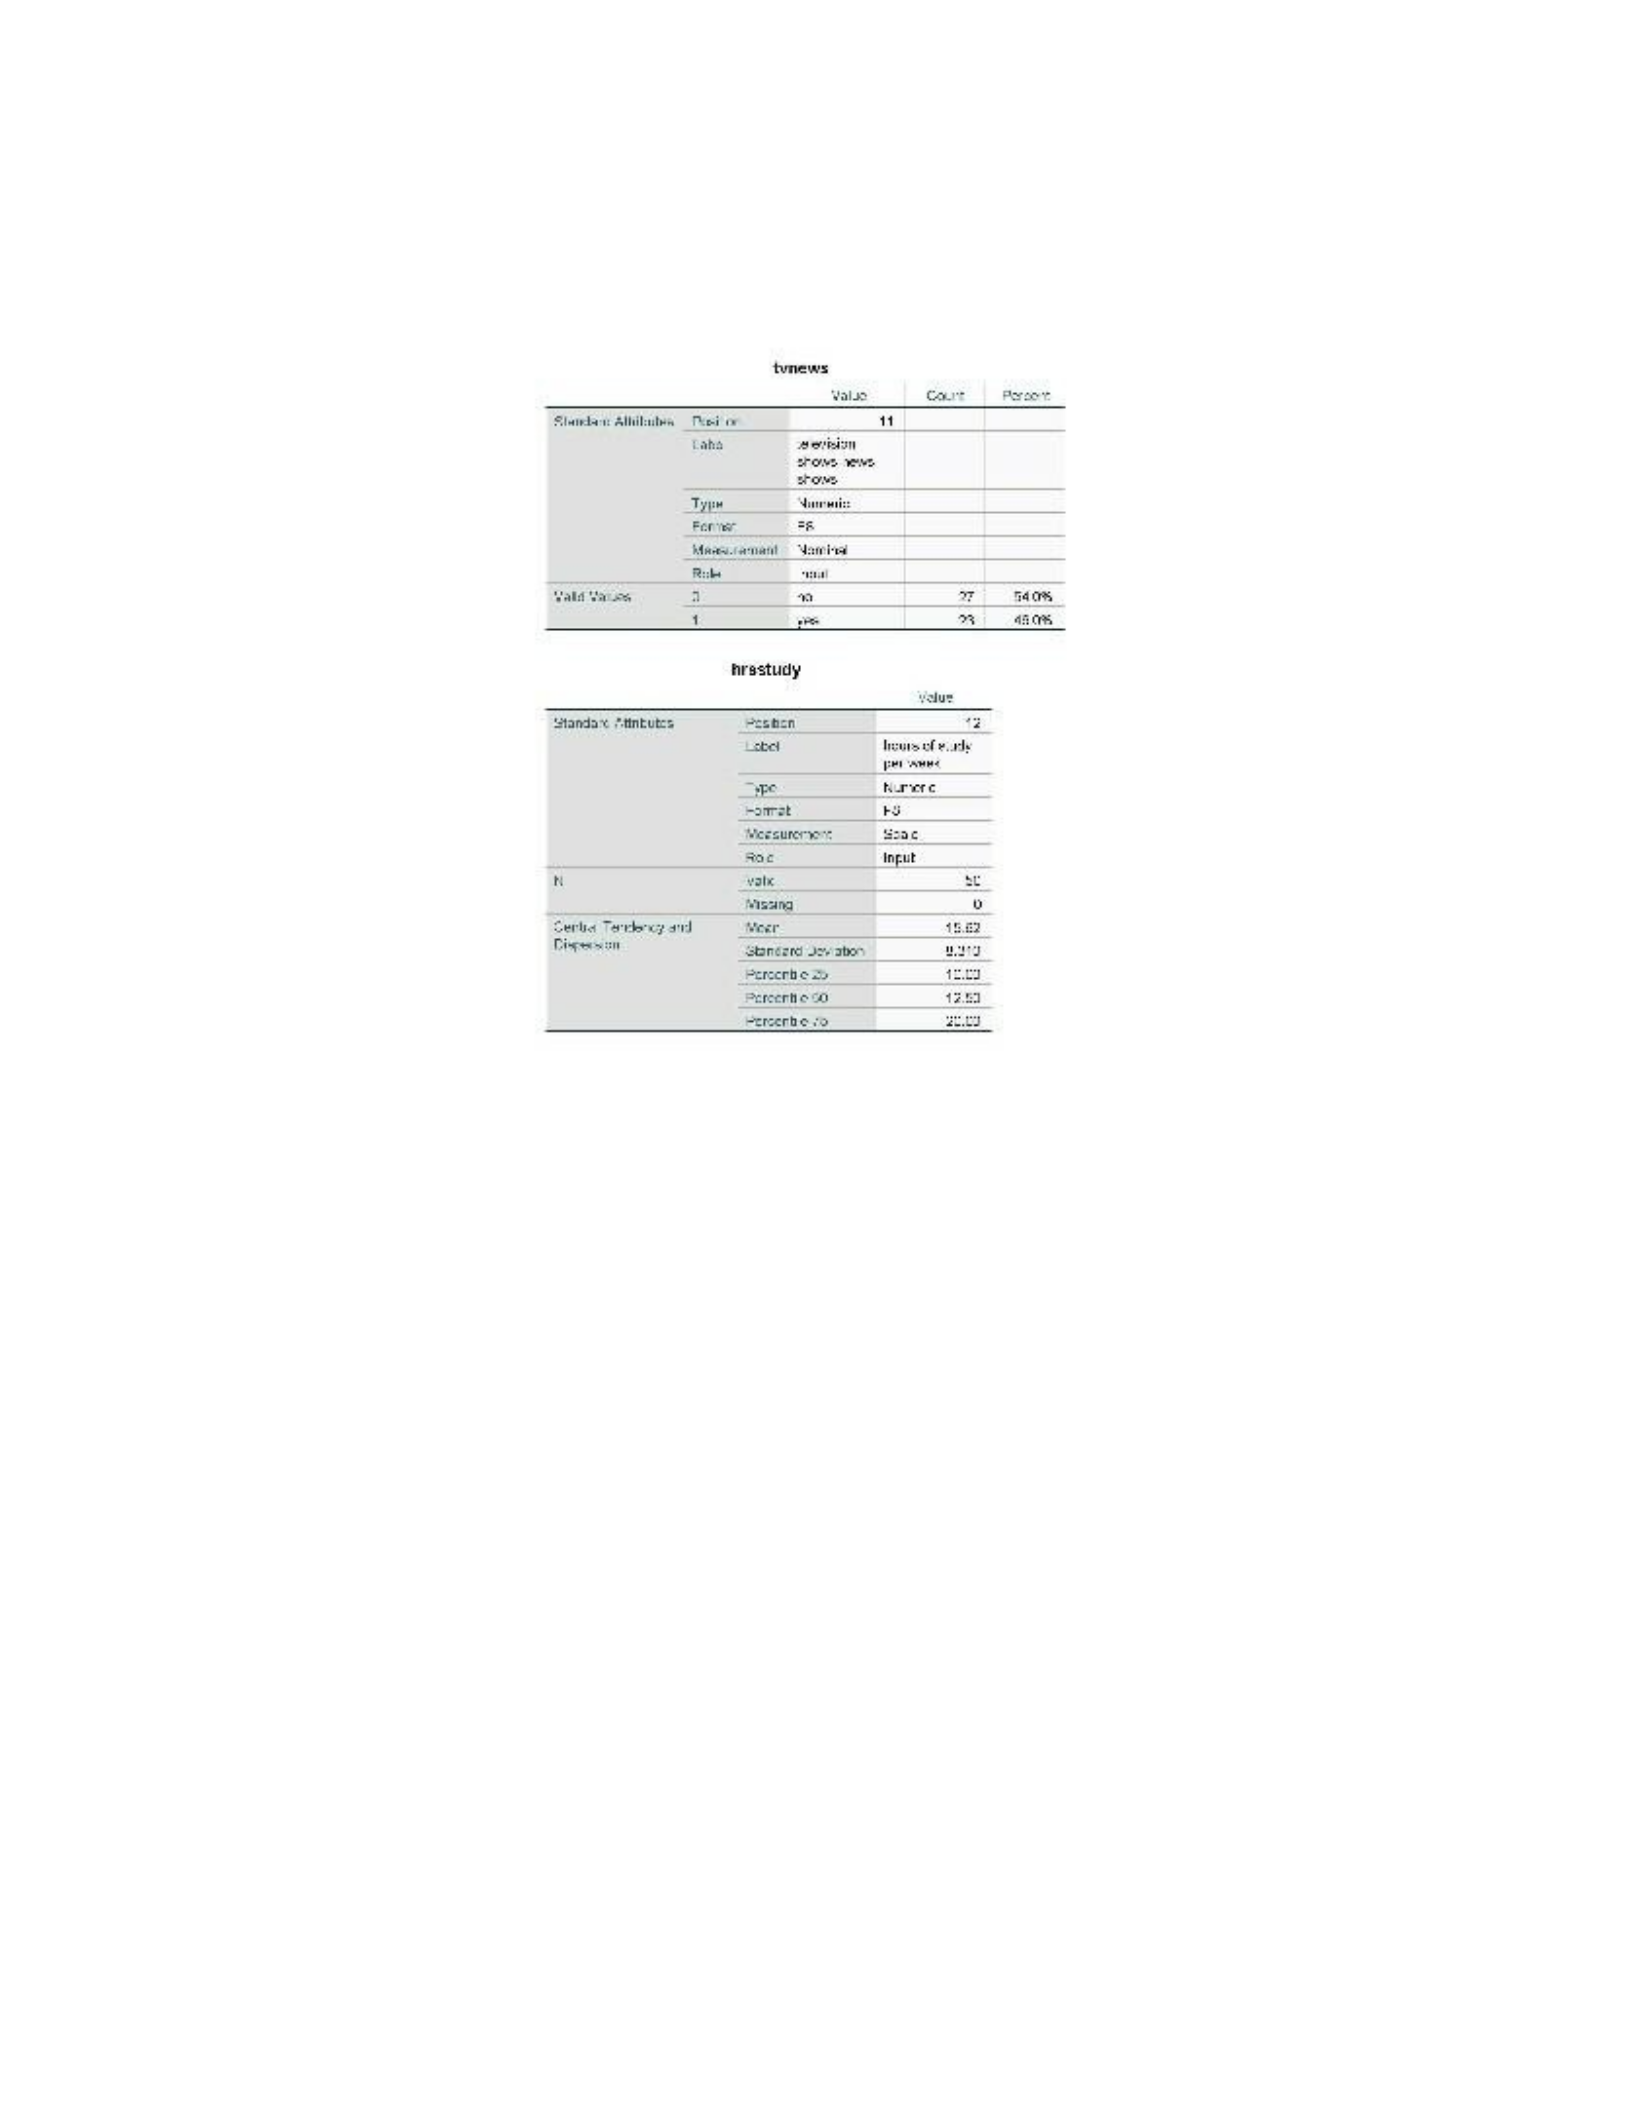
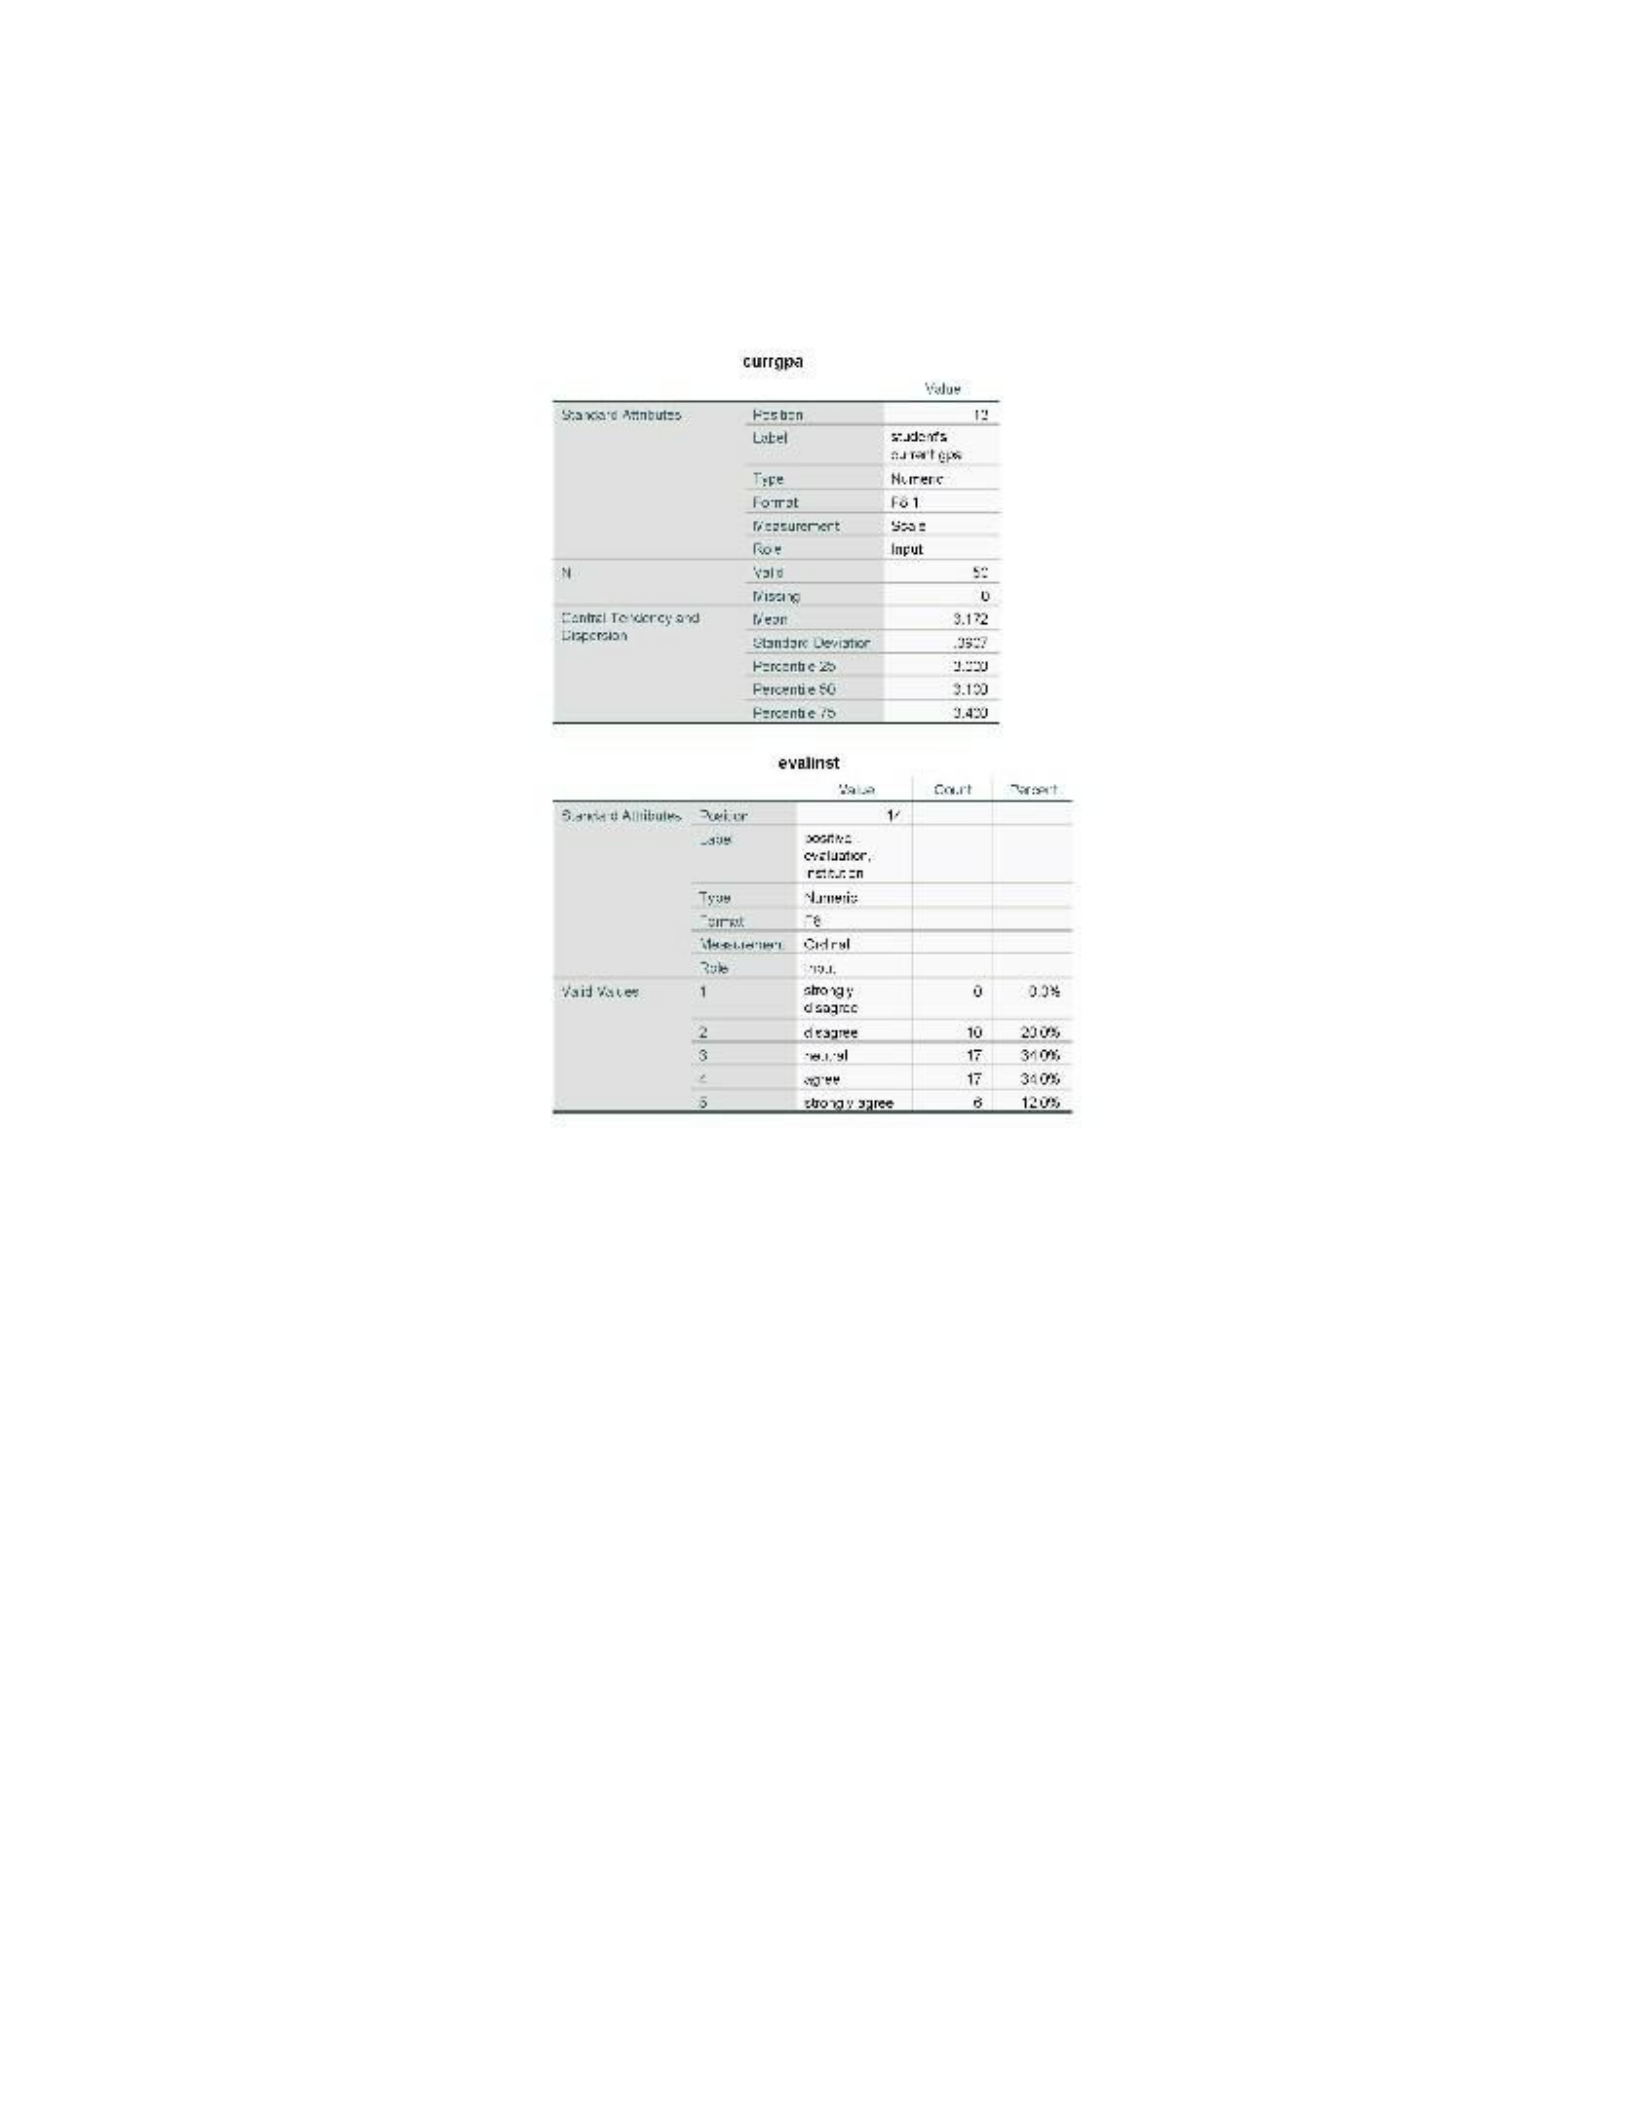
A1. 2.3. Why would you print a codebook or dictionary?
Every variable within a dataset is comprehensively described in a codebook. The data
provided consists of the variable's designated name, its values, and any other relevant
information. Comprehensive details are presented with respect to the subsequent: the precise
recording procedure for the variable in the raw data, the units of measurement, the numerical
coding scheme, and the definitions of the numerical codes; the conceptual definition of the
variable; and the measurement methodology employed. In addition to data collection and
arrangement procedures, codebooks may encompass documentation pertaining to the time period
and methodology employed. A well-organized codebook facilitates the comprehension and
exposition of research findings in a succinct and comprehensible manner (Morgan et al., 2020).
Increasing the likelihood of comprehending and appropriately evaluating the data is enhanced.
A1. 2.4. What if data file contains words/letters instead of numbers?
Recoderization becomes necessary when input consists of letters or words as opposed to
numerical values. Re-encoding a variable could be necessary in an assortment of circumstances.
It may be necessary for an individual to pay attention to the possibility that errors were present in
the initial data classification. To ascertain which variables require recoding due to errors,
scholars may employ frequency distribution analysis or descriptive statistics (Morgan et al.,
2020).

QUANTITATIVE ANALYSIS: DATA CODING, ENTRY, AND CHECKING 5
A1. 2.5. Why use Mean to create a variable?
After the participants have completed the data collection items, the "Mean" function of
SPSS is utilized to compute the mean score of a scale or construct comprising multiple queries.
In the dataset, SPSS will compute the mean by averaging all responses, irrespective of the
presence of absent or partial values. When constructing a multi-item scale, it is imperative to
refrain from employing the Mean function, especially in cases where certain respondents have
provided incomplete responses. The results would be distorted if respondents responded to only
three of the requirements for the Mean function in SPSS. Because the construct under
investigation, dread, consists of seven distinct components, this is the case. Utilizing an item's
mean can help determine its overall average (Morgan et al., 2020).
A1. 2.6. (a) Why is it important to check raw data before/after entering them?
It is imperative to conduct a thorough data validation and verification process prior to
inputting the questionnaire responses into the data editor. A final review must be performed prior
to inputting the data into the editor. This provides an opportunity to rectify any errors that may
have occurred during the data entry procedure, thereby safeguarding it against blunders. You will
have the opportunity to rectify any errors or omissions that occurred during the initial phase of
data verification.
A1. 2.6. (b) What are ways to check data before/after entering them?
The process of data cleansing ensures the presence of precise and succinct data to
substantiate inputs, thereby resulting in a more accurate dataset. Compared to a spreadsheet, the
Data Editor displays the imported data as you input it. Morgan et al. (2020) assert that users are
granted an extensive array of functionalities, which encompass the ability to modify existing data
and supplant it with fresh information. The changeability of labels, names, and value labels is

QUANTITATIVE ANALYSIS: DATA CODING, ENTRY, AND CHECKING 6
one of the previously mentioned features. Additionally, prior to inputting the data into the data
editor, you can verify the accuracy of the information by performing a cursory review. Reexecute
the program to verify that every variable and label are accurate. Verify the data for accuracy
through visual inspection once the data submission process is complete. You might observe the
entirety of the data you inputted when you access the codebook or data editor. We will then be
able to exhaustively verify all identifiers and variables, and any errors will be corrected
immediately. A user is typically notified via error message when data import errors transpire,
specifying that the imported data is erroneous (Morgan et al., 2020).
SPSS Problems
Chapter 2
Using the CollegeStudentData.sav file do the following problems.
Print your outputs and circle the key parts for discussion
2.1 (a) Compute N, minimum, maximum, and mean for all variables.
2.1 (b) How many students have complete data?
47
2.1 (c) Identify any statistics on the output that are not meaningful. Explain.
Because it is inherently unethical to know the television viewing patterns of another
person, it is improper for an individual to possess such knowledge. Specific information
regarding the pupils and their immediate surroundings is of the utmost importance. Information
associated with television has no impact on the aforementioned domains, as it neither contributes
to nor detracts from them.
2.2 (d) What is the mean height of the students?
67.30” = 5’6”

QUANTITATIVE ANALYSIS: DATA CODING, ENTRY, AND CHECKING 7
2.2 (e) What about the average height of the same-sex parent?
66.78 = 5’56”
2.2 (f) What percentage of students are males?
1.48
2.2 (g) What percentage have children?
.52

QUANTITATIVE ANALYSIS: DATA CODING, ENTRY, AND CHECKING 8
References
Dupont, W. D. (2021). Review of michael N. Mitchell’s data management using stata: A
practical handbook, second edition. The Stata Journal, 21(3), 814-817.
https://doi.org/10.1177/1536867X211045581
Kilbourne, A. M., Braganza, M. Z., Bowersox, N. W., Goodrich, D. E., Miake-Lye, I., Floyd, N.,
Garrido, M. M., Frakt, A. B., Bever, C. T., Vega, R., & Ramoni, R. (2019). Research
lifecycle to increase the substantial real-world impact of research: Accelerating
innovations to application. Medical Care, 57 Suppl 10 Suppl 3(Suppl 3), S206-S212.
https://doi.org/10.1097/MLR.0000000000001146
Morgan, G. A., Barrett, K. C., Leech, N. L., & Gloeckner, G. W. (2020). IBM SPSS for
Introductory Statistics Use and Interpretation (6th ed.). New York, NY, USA: Routledge.
Ceadebook
height
Wraith
Steuelace:
Slthilubey
Taniicn
1
|
siudint
wag
In
reches
ee
huree
“amma
[a2
ee
ed
Suge
Tue
Input
k
Valic
et
esd
a
Corba
Dowdy
and
‘wir
oy
30
steesemma
arcard
less
sto
ese
Fercarlie
2
e000
seperlig
3
47
0000)
Sererte
7s
71.00o0
pheight
Walle
Flarelan:
Allilnles
Tali
2
abel
Same
Seat
fore
75
egret
are
oer:
Fniiral
Fai
2
beset
ELSE
ical
TF
Input
_
k
Valin
jal
:
aera
cml
Derina
Teddescy
and
“ear
ann
TAO
Liseers=n
Sainte
Tae
ales
We
1s
Serer
lie
25
So
On
Tnicertie
oo fe
OO
Terai
lie
75
Ton
QUANTITATIVE ANALYSIS: DATA CODING, ENTRY, AND CHECKING 9
Figure 1: 2.3 – Codebook
yas
-
-
-
-o
2
Tislic
om
volue
oun
Percent
SErdardsitbites
Feston G
Locel
filer
Wiese
d
dss
lype
Hererc
borat
bi
Héersurcrert
hernai
Hel>
Input
velo
Valuzs
t
nz
ee:
ves
wz
B4lh
TwMOVIeS
Walun
wim
Fereanl
Shurdard
Alo
betes
Pesan
o
Label
telyeisor
Sieve
[ite
25
Tepe
Kumere
Pornsl
Ps
Begeuerert
Heringl
Role
Ingut
Vale
Volue
C
We fe
Bq
yes
{8
BET
Ttvsports
Walue
al
Fewanil
Starla
ell
betes
Pistia
Fi
Label
tele-sior
sivas
sods
Tere
Burke
Poona
Ta
Besaumeirerl
Aisin
Fu
Inpul
Vale
Volues-
C
We
ad
4i.0%,
ze
ee.
QUANTITATIVE ANALYSIS: DATA CODING, ENTRY, AND CHECKING
10
news
VWalac
Cart
Poracet:
Slandac:
Albilulea
Ted
oe
i
Laks
Aer
Sh
Ee
etic.
Type
un
atis:
Fenvear
=F
Maascamanl
“Yard-al
Fascha
“nul
‘weld
Wa
il
“Kl
ay
Tors
1
ee
cin]
qtr
hrastudy
value
Standac
Stinkutcs
Fesicn
Te
Lobe
humps
at
each
peD
ses
“ape
hurerec
onrst
Fa
WCE
SURE
Snac
Sac
Input
a
eee
EL
I
AASoa
ne
u
Serle
Taridoricy
arr
‘cer
10.82
Dipesaon
Stoneend
Jee
abo
nity
ecco
ECE
Porcini
oo
12.2)
Percent
ro
2u.0d
QUANTITATIVE ANALYSIS: DATA CODING, ENTRY, AND CHECKING
11
CHrrg]
pr
Value
S73
eked
Atinbutss
Fosbin
I
Lakel
made
far
h
ipa
Tepe
Homrenc
Porat
Fe.
Wegsurermert
a
oe
Input
i
alo
st
Tiss
b
Cantrell
Te
dorcy
srr
feean
Dispersion
wtandare
Devishor
Ferconbbe
ie
Percents
So
Fercenbe
fm
evalinst
‘aad
et
Cort
Thad
Seat
Sua
eed
Aliiiboles,
Soeiior
1
au
eA
crrluatior,
reitncn
True
“Lamers
im
“8
Meee
idral
Sule
TL,
Val
Vate
1
shovg
y
ou
Is
disagree
2
deagree
1
pel!
3
“ul
i
SON
e
yee
i
300
ml
siroagy
agree
S
Wu
QUANTITATIVE ANALYSIS: DATA CODING, ENTRY, AND CHECKING
12
coed
es
wkd
vilues
sisuing
‘Vacs
Sync
Deane
Asie
nid
values
“a
Fanrat
(eer
be
Roe
Ue
he
Is
pogir
an
coalia
on,
feces
Pacts
EB.
ieinal
Irpat
alrniy
clans
CiSay
2s
reciva
ores
shorgiy
agree.
co
Bone
RE
ee
Ta
2.06
Sz
sis
QUANTITATIVE ANALYSIS: DATA CODING, ENTRY, AND CHECKING
13
Sarda:
Athihubes
wuld
Sooucs
Handa
Atin-ubes
Tens
Taskers
srl
Glapersinn
Pook
or
Cabs
Inp=
Mircea
Rk
Be ji
BS
Lt
ovals!
1F
tetvlive
Be
socks
life
unm=ont
=E.
ordinal
1
sdunghe
eleayiens
25
OFS
Sar
29069
14075
disagrees
ve
ral
mye
1a
shroanghy
agnec
hrework
Welw
-csih=cn
am
tl
hiriits
pet
Hae
anid
-aithing
hurmerc
bu
STae
see
-onmret
(See
ures
ioe
gale
helsing
f
1
hccrr
Stondard
Jor
ahor
Percerbe
20
Merccnbe
0S
Ingut
QUANTITATIVE ANALYSIS: DATA CODING, ENTRY, AND CHECKING
14
evalsocl
Vale Thar
Tea
el
Svancacd
Aint
=e
or
ir
aul
nos
Sec’,
foe)
Ife
Te
=a:
tnt
SITE
ra
VWeaeuretedt
'irdral
—
Hales
rsd,
Yatl
fares
1
sito
wy
4
au%
sage
:
2
ceayee
15
20
Se
rval
i
2
2
ee
Tz
20h
Ee]
slerpy
sy
7 12
hrswaork
welut
Sara
i
siiihiles
Paatian
1a
Label
WOUPS
PEP
whe
See
ake
Typv
Har
wiit:
Ferrall
Fa
MV
aaaiiier
et
Aiwa
Fuiw
Input
4
Wald
qa
Be
iseieee
a
‘eante
benderce
acd
Maan
PAI
eet
“Silanshan:
Dlersiatior
1
ar
Faitanlie
St
14
00
Fan
sulin
on
20
Porsulie
TS.
a0
QUANTITATIVE ANALYSIS: DATA CODING, ENTRY, AND CHECKING
15
fH
Range:
Minimum
Mawar
fica
Si.
Deviahon
‘Yananoc
Sacwnnss
Batic
Stalstic
Slatistic
Saline
Surtrsic
Siateic
Seite
Stalistic
Sid,
Error
Budent
begin
mehes
50
15.00
BO
00
Bi
6,300 50559
1S
San
tg aa
Aarne
BAK
parents
heaght
4
18.00
5
00
7h
Fa
LE
a
A
a0 ag
secr
at
berth
40
1 1
2
148
SS
bh
a
war
martial
slats
44 ?
1
4
1a
tH?
au
ul
Hal
aay
evap
Hi 2
1
4
156
an
fal
ra
ach
dees
subgect
tae
coker
a
i
a
|
2
505
255
~
053
AF
eee
ee
50
21
é
s
11.98
609
BT-163
1685
a7
Jeievmion
shows-siicors
ca
1
a
1
Sa
485
25
602
AF
fetevision
shows-meavies.
50
1
a
1
i)
485
25
Aid 337
fekevenon
shues-sporks:
oO
1
a
1
52
505
255
0
T
television
shows-nows
shows
sO
1
a
1
46
03
289 166
a
hoursal
study
per
week
Ea
%
Zt)
¥
415.62
£310
Boer
550
aT
“Suadent’s
current
gpat
Tb
240
40
3172
SSA
peciivvn
cvaluction.
instituton
Hl 4
3
i
438
sab
naa
freee
a
_
posites
evaluation,
maj
4s 4
1
oS
de
ee
posta
avalumhon,
tanbhas
A
4
i
§
776
bakit
1195
a
a
_peteitren
aval,
seca
he
4
4
1
5
310
ti
1388
i
ce
routs
pet
week
spent
45
“i
a
a a
2
Wit
20S
AN
a
warkaryg
‘Wahel
NM
[lstataa)
Af
QUANTITATIVE ANALYSIS: DATA CODING, ENTRY, AND CHECKING
16

