BUSI 820: ASSIGNMENT 8
2 | March 6, 2025
Table of Contents
SPSS Problems 3
A8: Chapter 9, Problem 9.5. 3
Figure 1……………………………………………………………………………………3
Figure 2……………………………………………………………………………………4
A8: Chapter 9, Problem 9.6. 4
Figure 3………………………………………………...………………………………….5
A8: Chapter 9, Problem 9.7 5
Figure 4...………………………………………………………………………….……....6
A8: Chapter 9, Problem 9.8 6
Figure 5…………………………………………………………….……………………...7
Figure 6-7……………………………………………………….………………. ……….8
References 9
BUSI 820: ASSIGNMENT 8
3 | March 6, 2025
A8: Chapter 9, Problem 9.5 Identify an example of a variable measured at the
scale/normally distributed level for which there is a statistically significant overall
difference (F) between the three marital status groups. Complete the analysis and interpret
the results.
The one-way ANOVA test is particularly helpful when comparing multiple dependent
variables. According to Morgan et al. (2020), it is used to examine the relationships between
population means and the means of different groups. Several factors must be considered when
conducting this test, including the groups of independent variables, the order in the data, the
observations of the variables, whether the dependent variables are identical, and if the dependent
variables follow a normal distribution. Morgan et al. (2020) also notes that if the last two
conditions are not met, additional tests may be necessary. The data includes three marital statuses
of single, married, and divorced. By applying a one-way ANOVA test, we can assess the
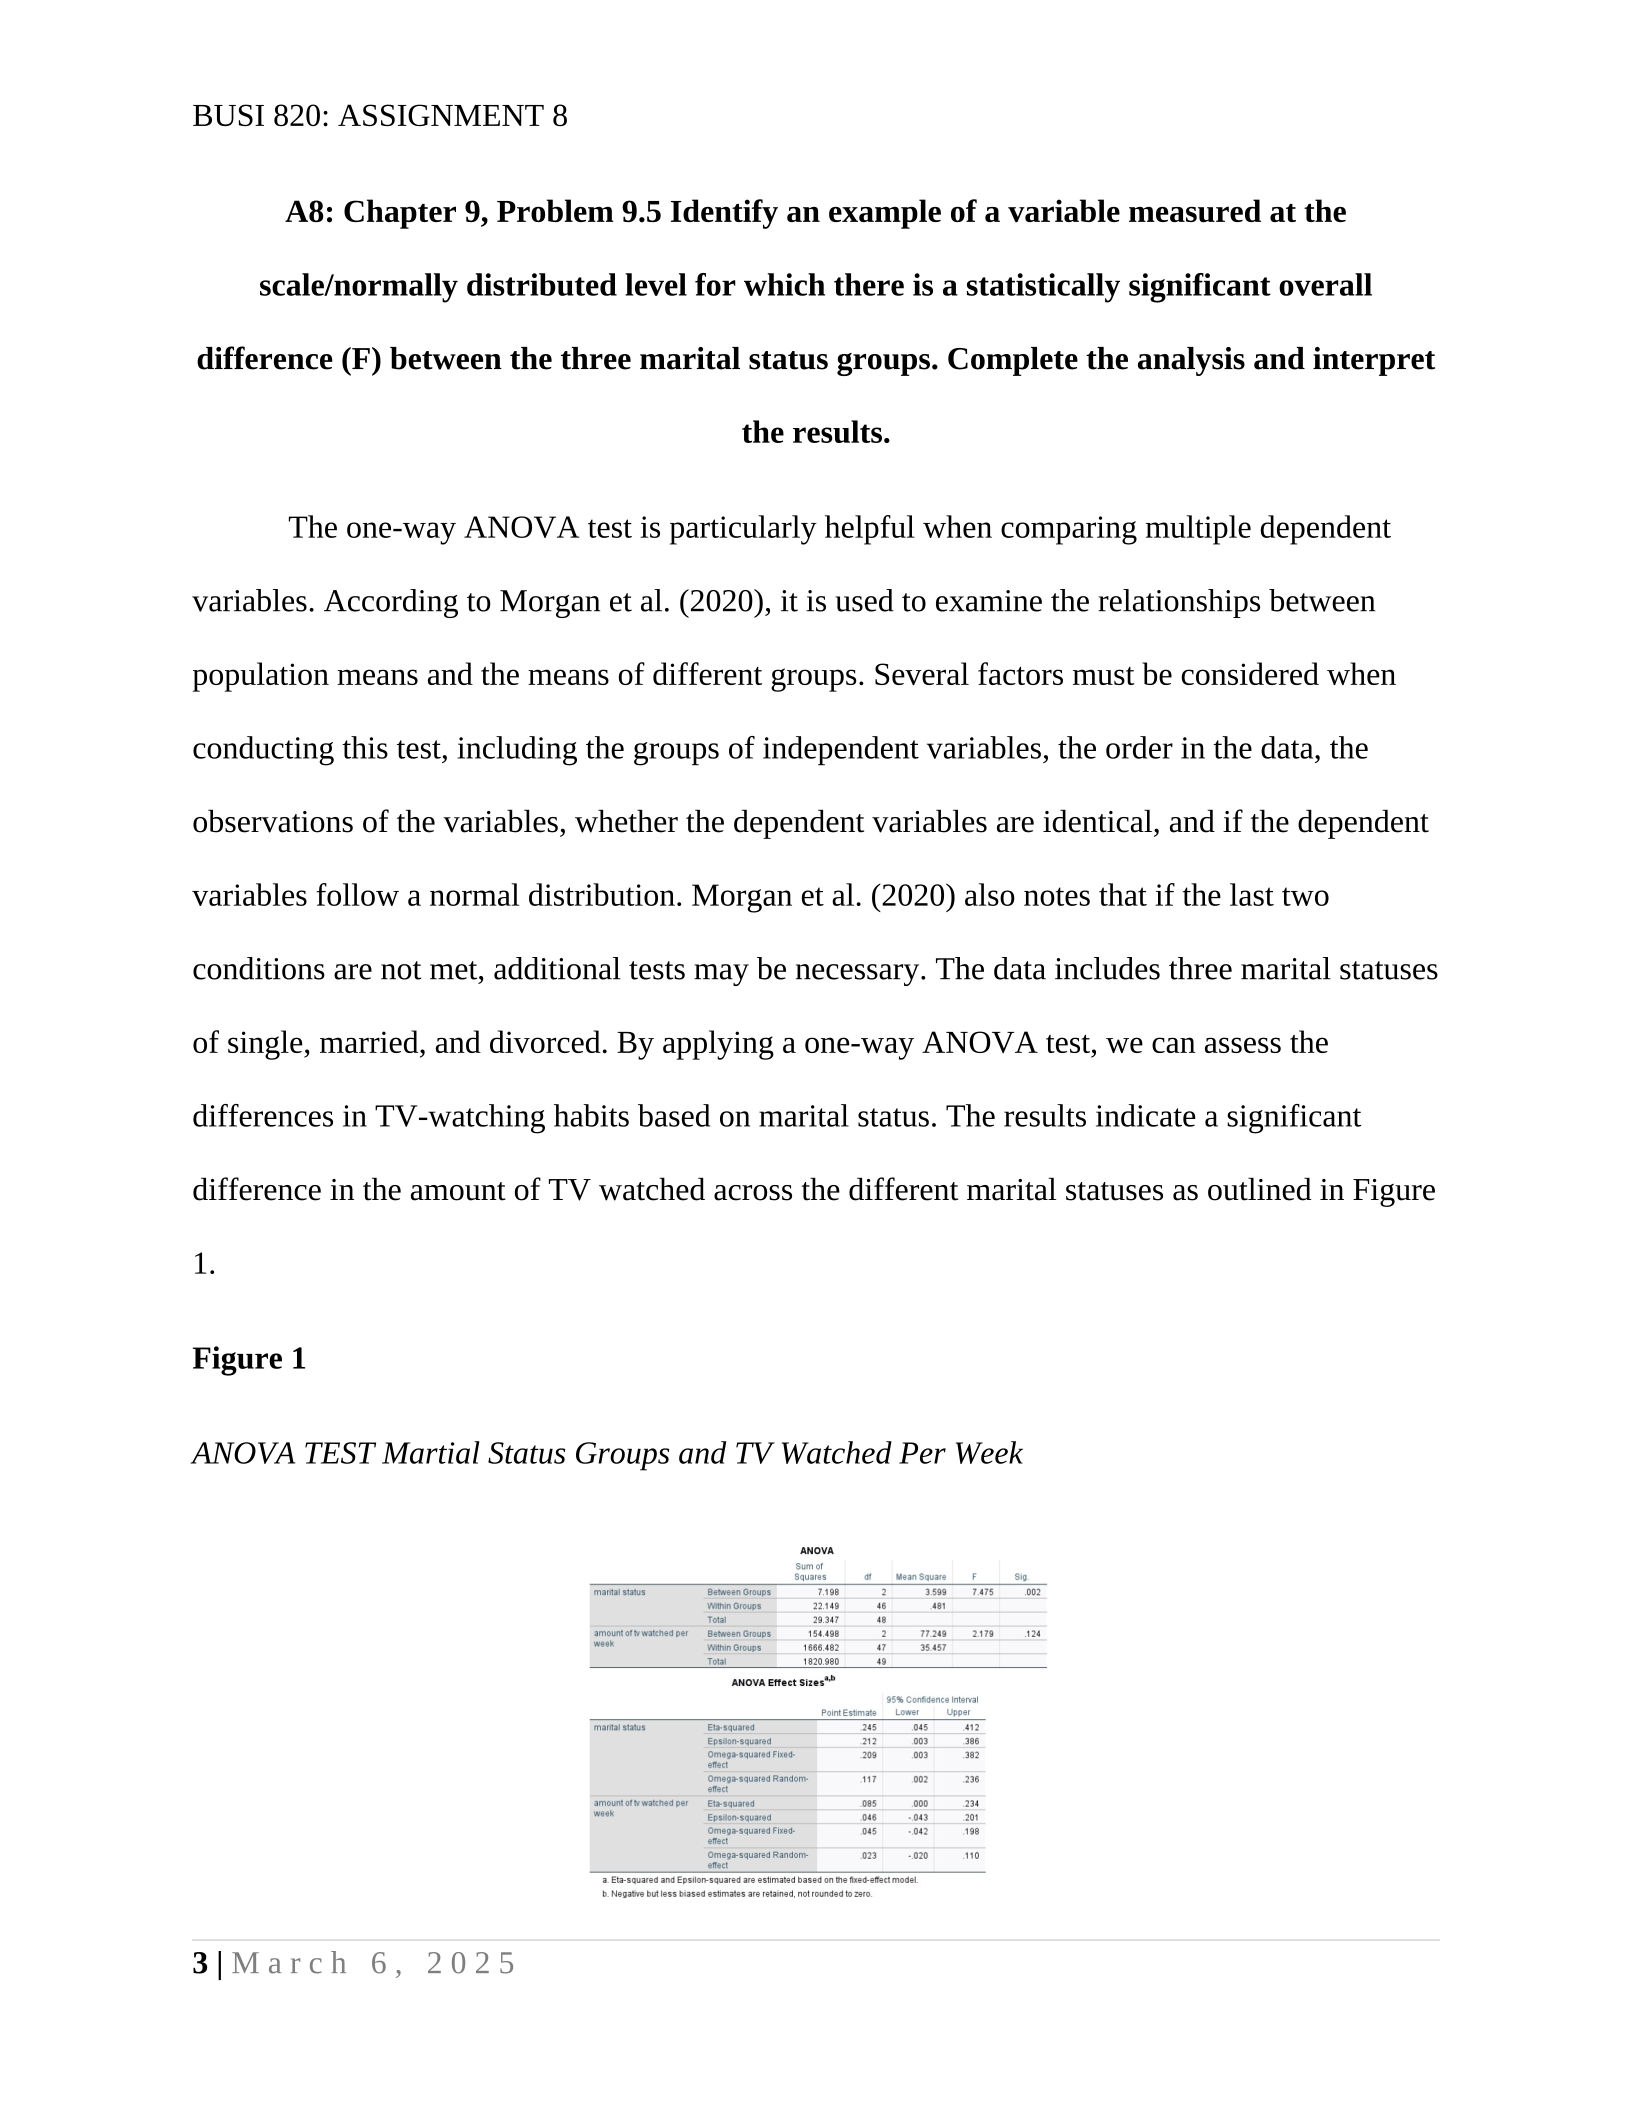
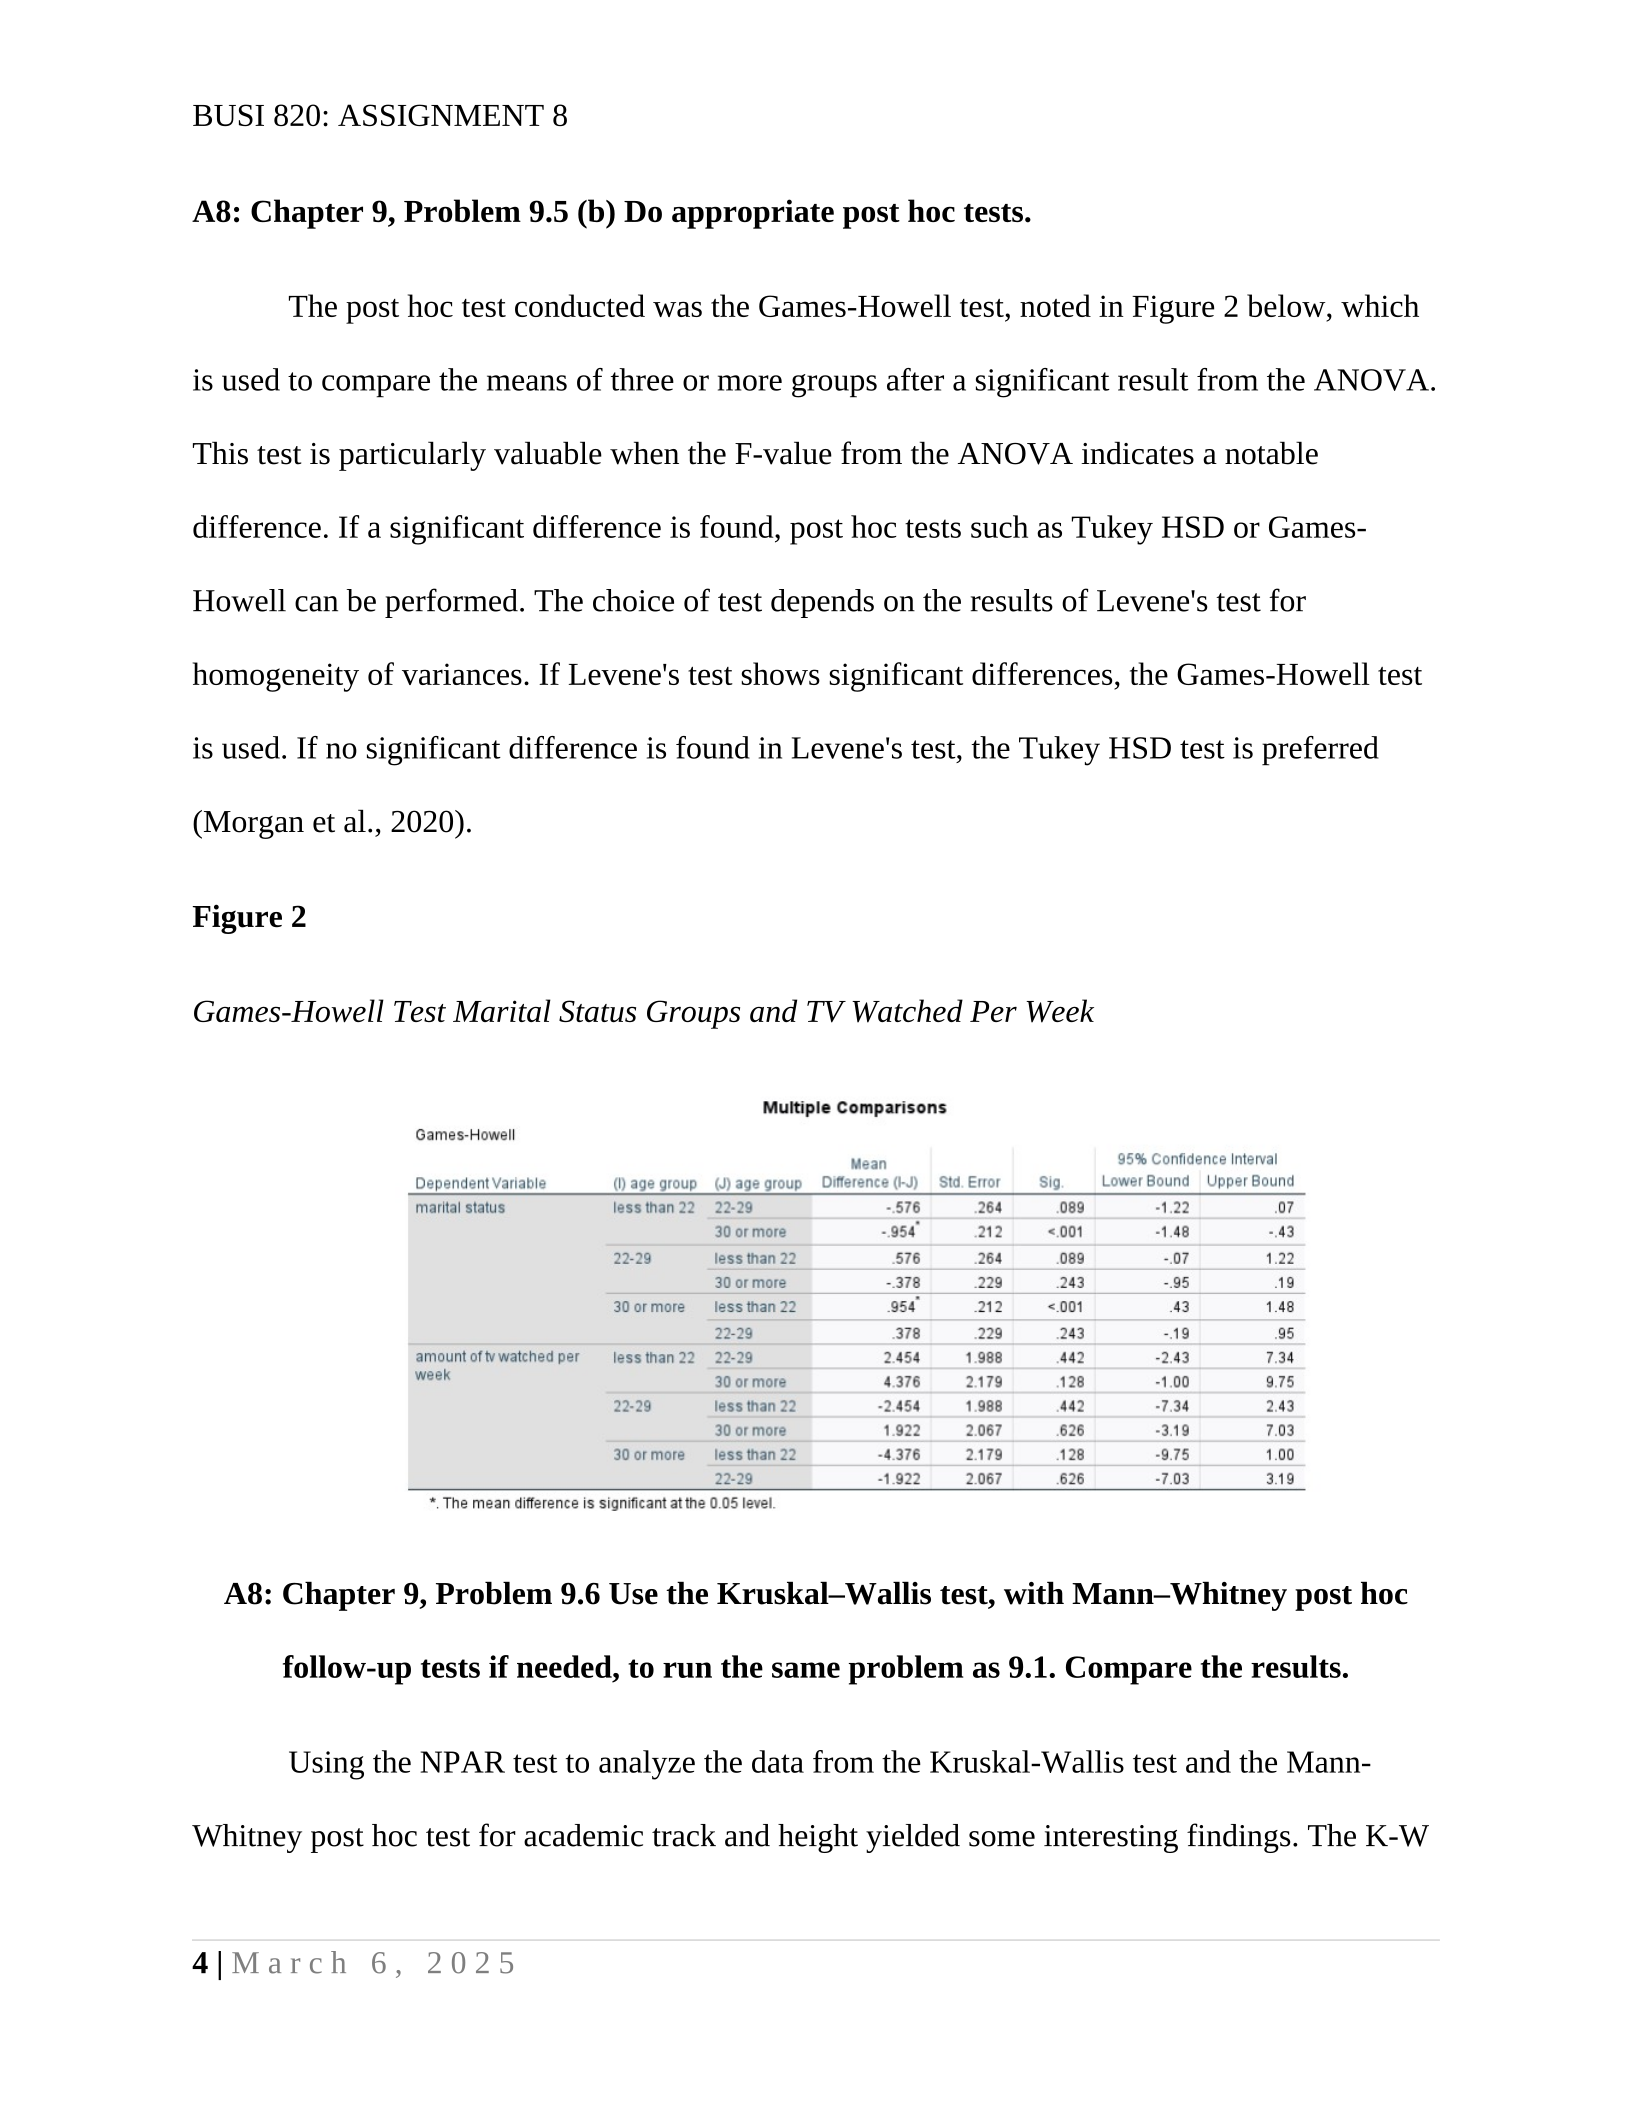
differences in TV-watching habits based on marital status. The results indicate a significant
difference in the amount of TV watched across the different marital statuses as outlined in Figure
1.
Figure 1
ANOVA TEST Martial Status Groups and TV Watched Per Week
BUSI 820: ASSIGNMENT 8
4 | March 6, 2025
A8: Chapter 9, Problem 9.5 (b) Do appropriate post hoc tests.
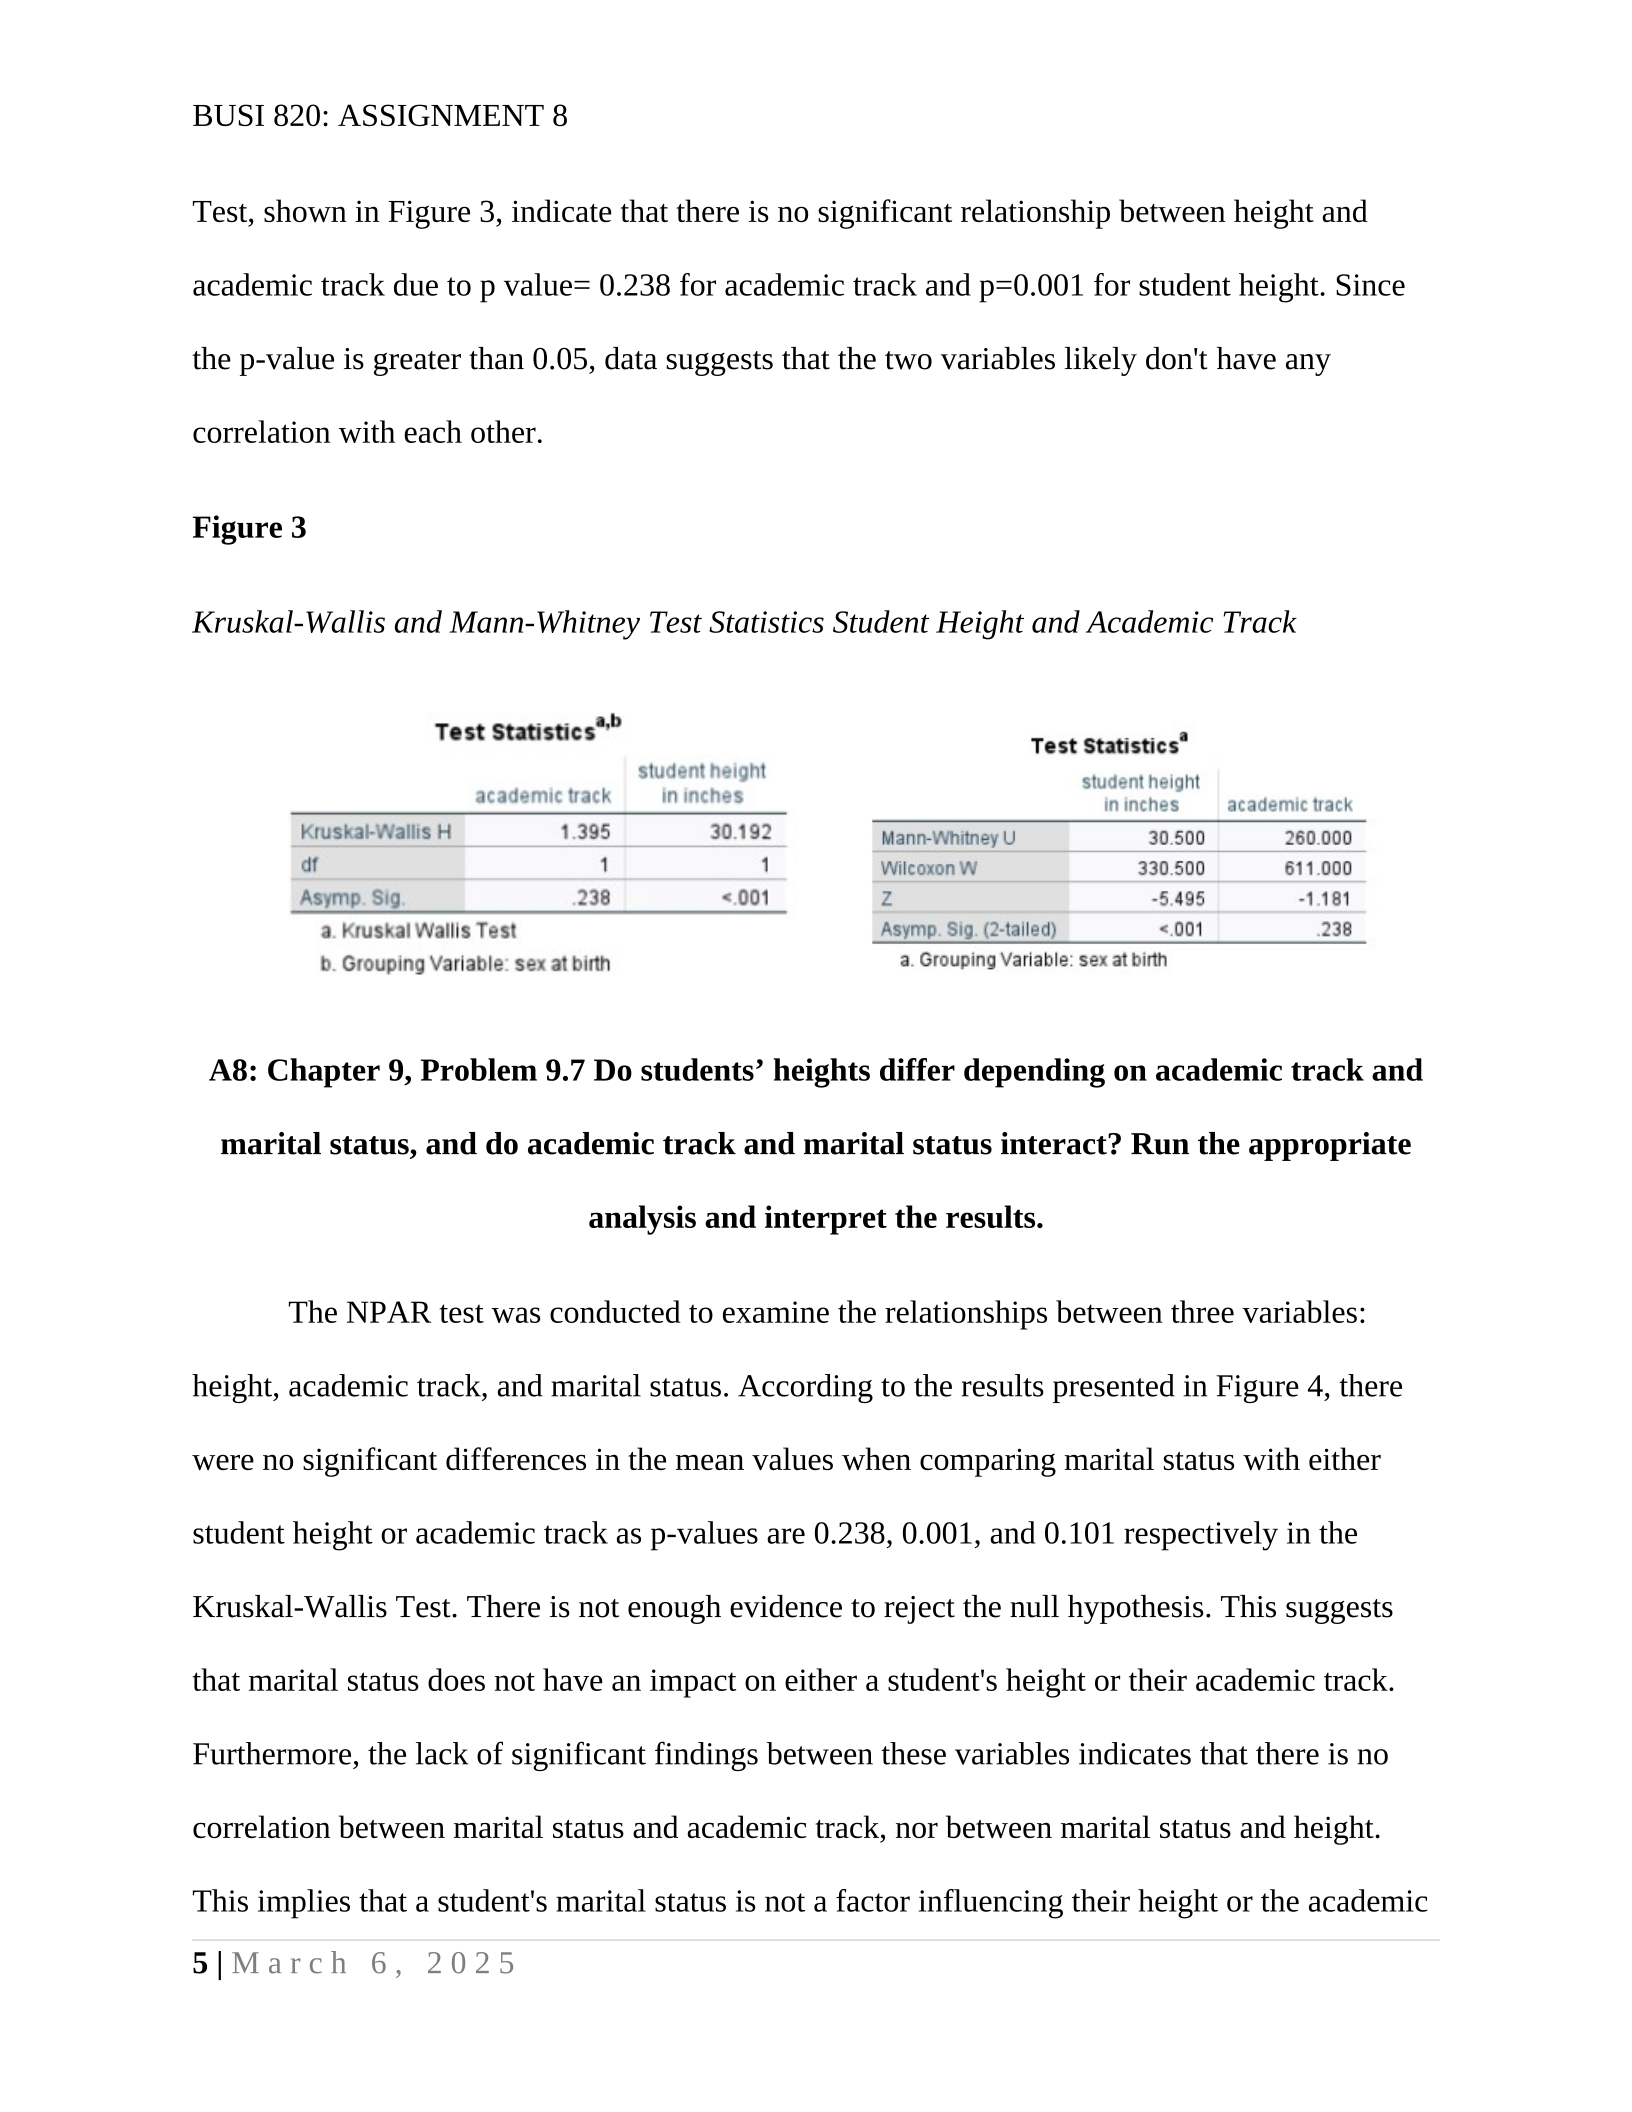
The post hoc test conducted was the Games-Howell test, noted in Figure 2 below, which
is used to compare the means of three or more groups after a significant result from the ANOVA.
This test is particularly valuable when the F-value from the ANOVA indicates a notable
difference. If a significant difference is found, post hoc tests such as Tukey HSD or Games-
Howell can be performed. The choice of test depends on the results of Levene's test for
homogeneity of variances. If Levene's test shows significant differences, the Games-Howell test
is used. If no significant difference is found in Levene's test, the Tukey HSD test is preferred
(Morgan et al., 2020).
Figure 2
Games-Howell Test Marital Status Groups and TV Watched Per Week
A8: Chapter 9, Problem 9.6 Use the Kruskal–Wallis test, with Mann‒Whitney post hoc
follow-up tests if needed, to run the same problem as 9.1. Compare the results.
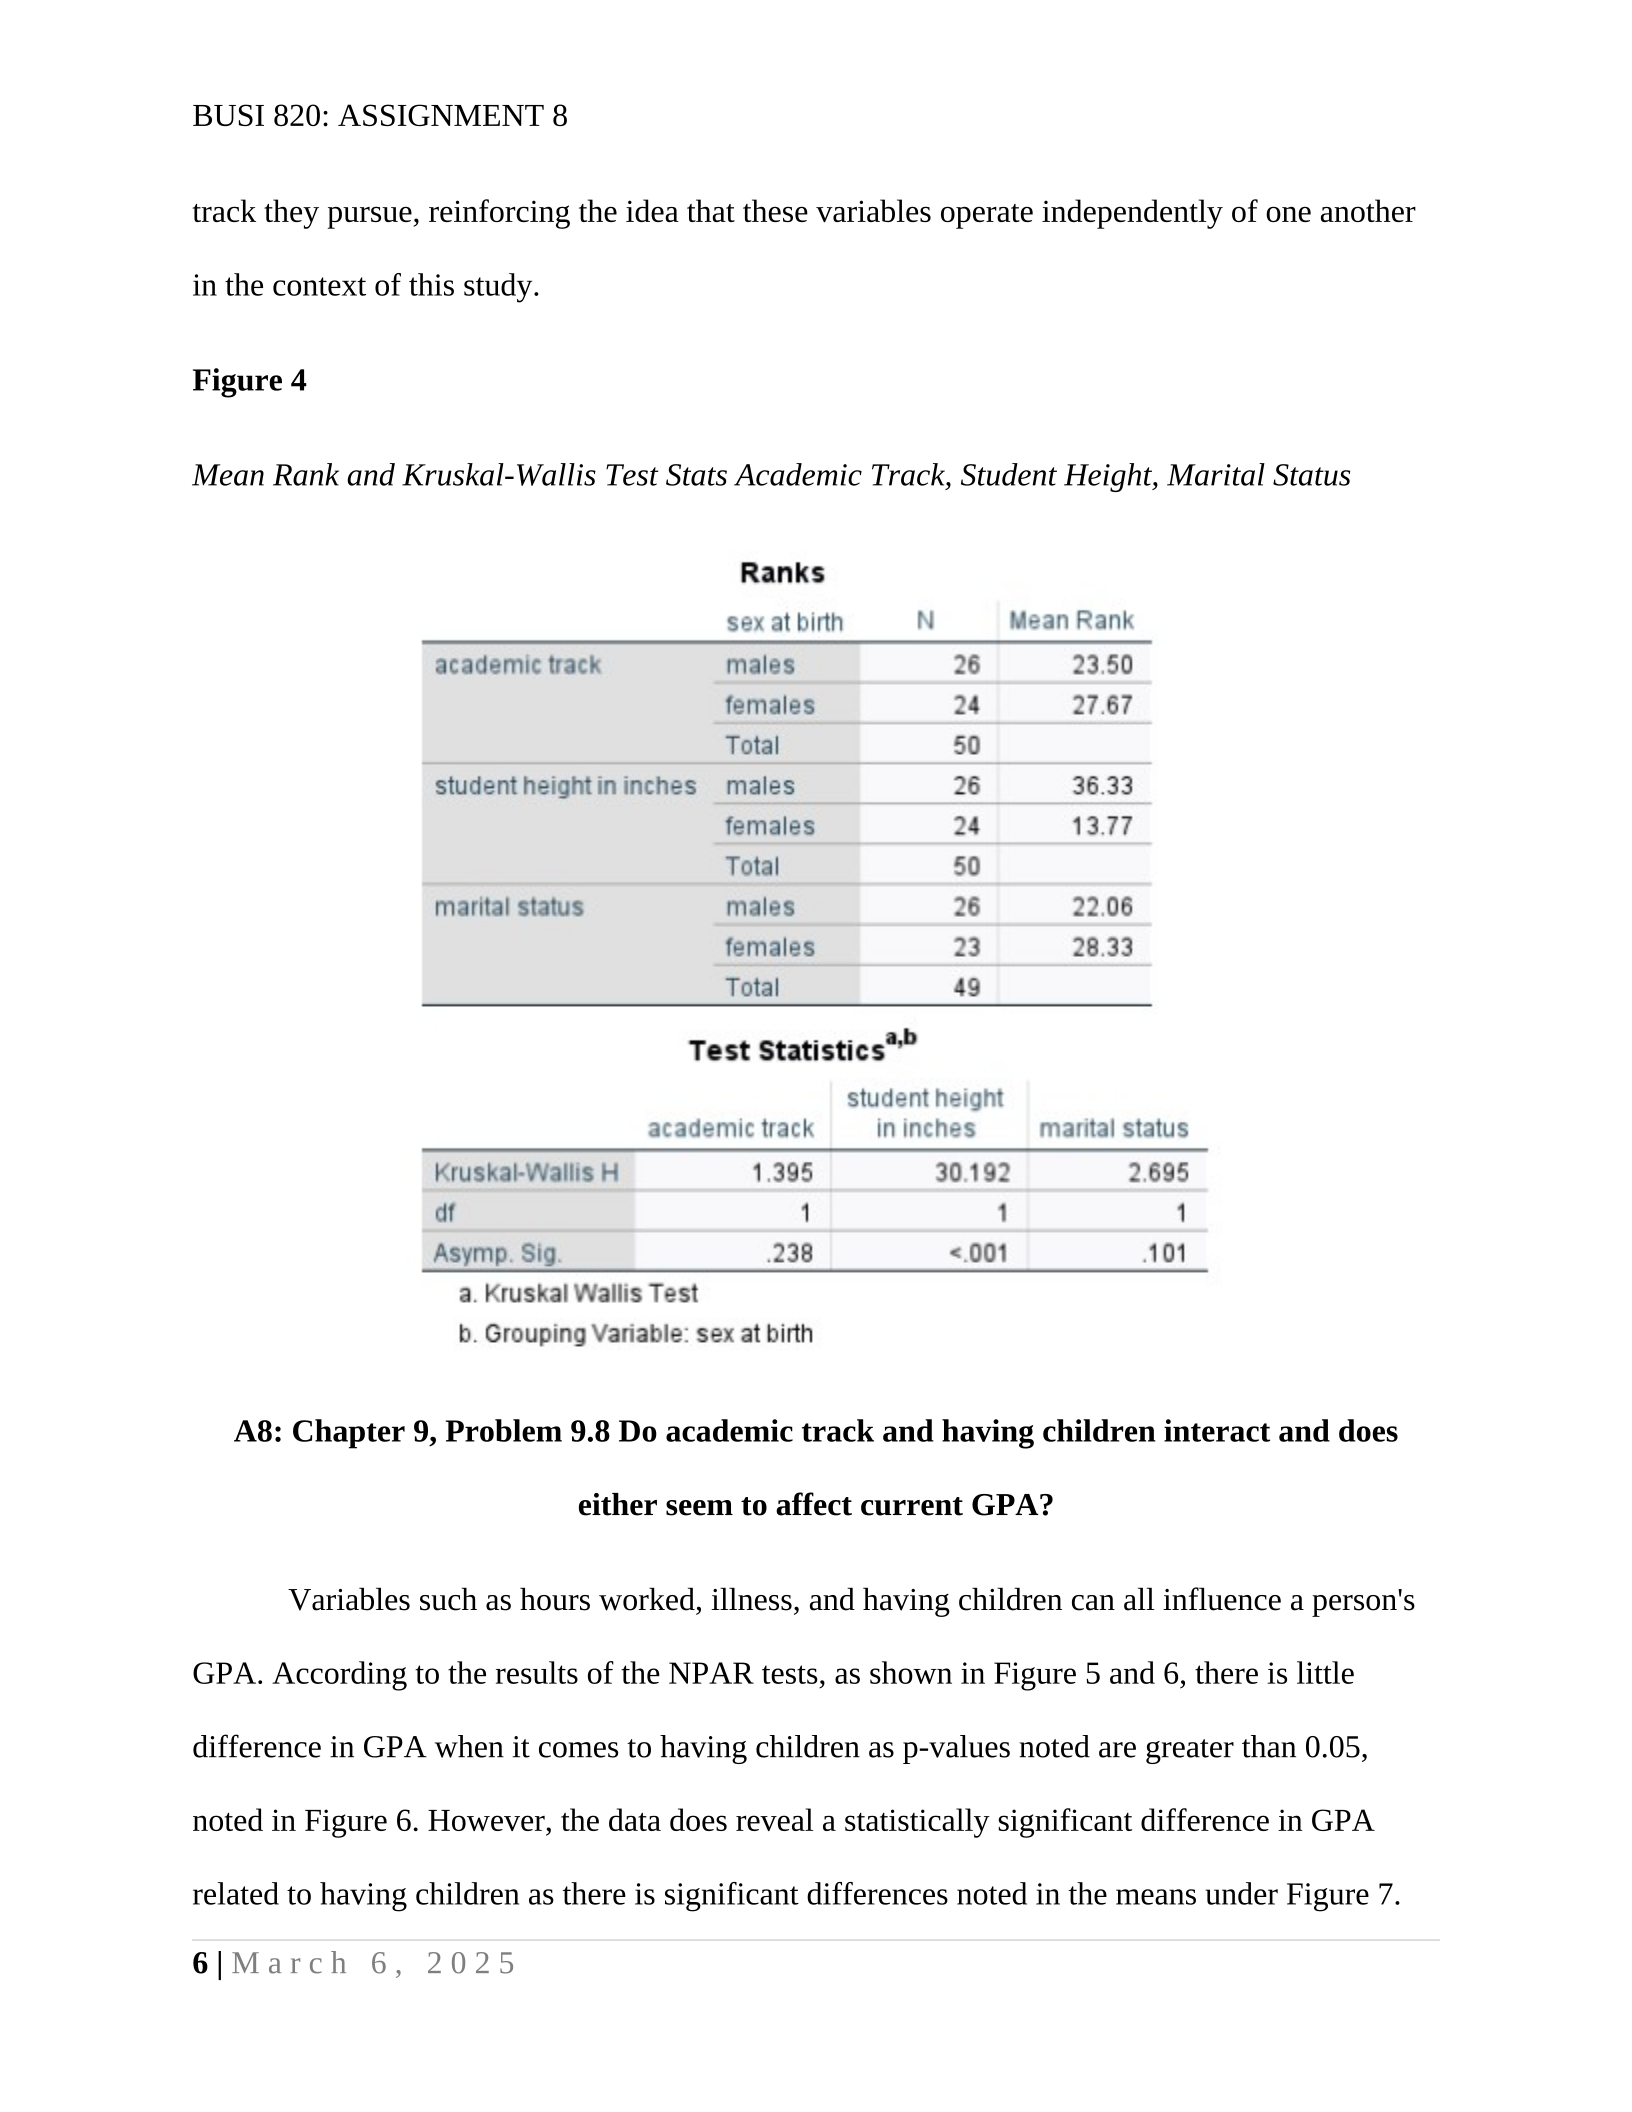
Using the NPAR test to analyze the data from the Kruskal-Wallis test and the Mann-
Whitney post hoc test for academic track and height yielded some interesting findings. The K-W
BUSI 820: ASSIGNMENT 8
5 | March 6, 2025
Test, shown in Figure 3, indicate that there is no significant relationship between height and
academic track due to p value= 0.238 for academic track and p=0.001 for student height. Since
the p-value is greater than 0.05, data suggests that the two variables likely don't have any
correlation with each other.
Figure 3
Kruskal-Wallis and Mann-Whitney Test Statistics Student Height and Academic Track
A8: Chapter 9, Problem 9.7 Do students’ heights differ depending on academic track and
marital status, and do academic track and marital status interact? Run the appropriate
analysis and interpret the results.
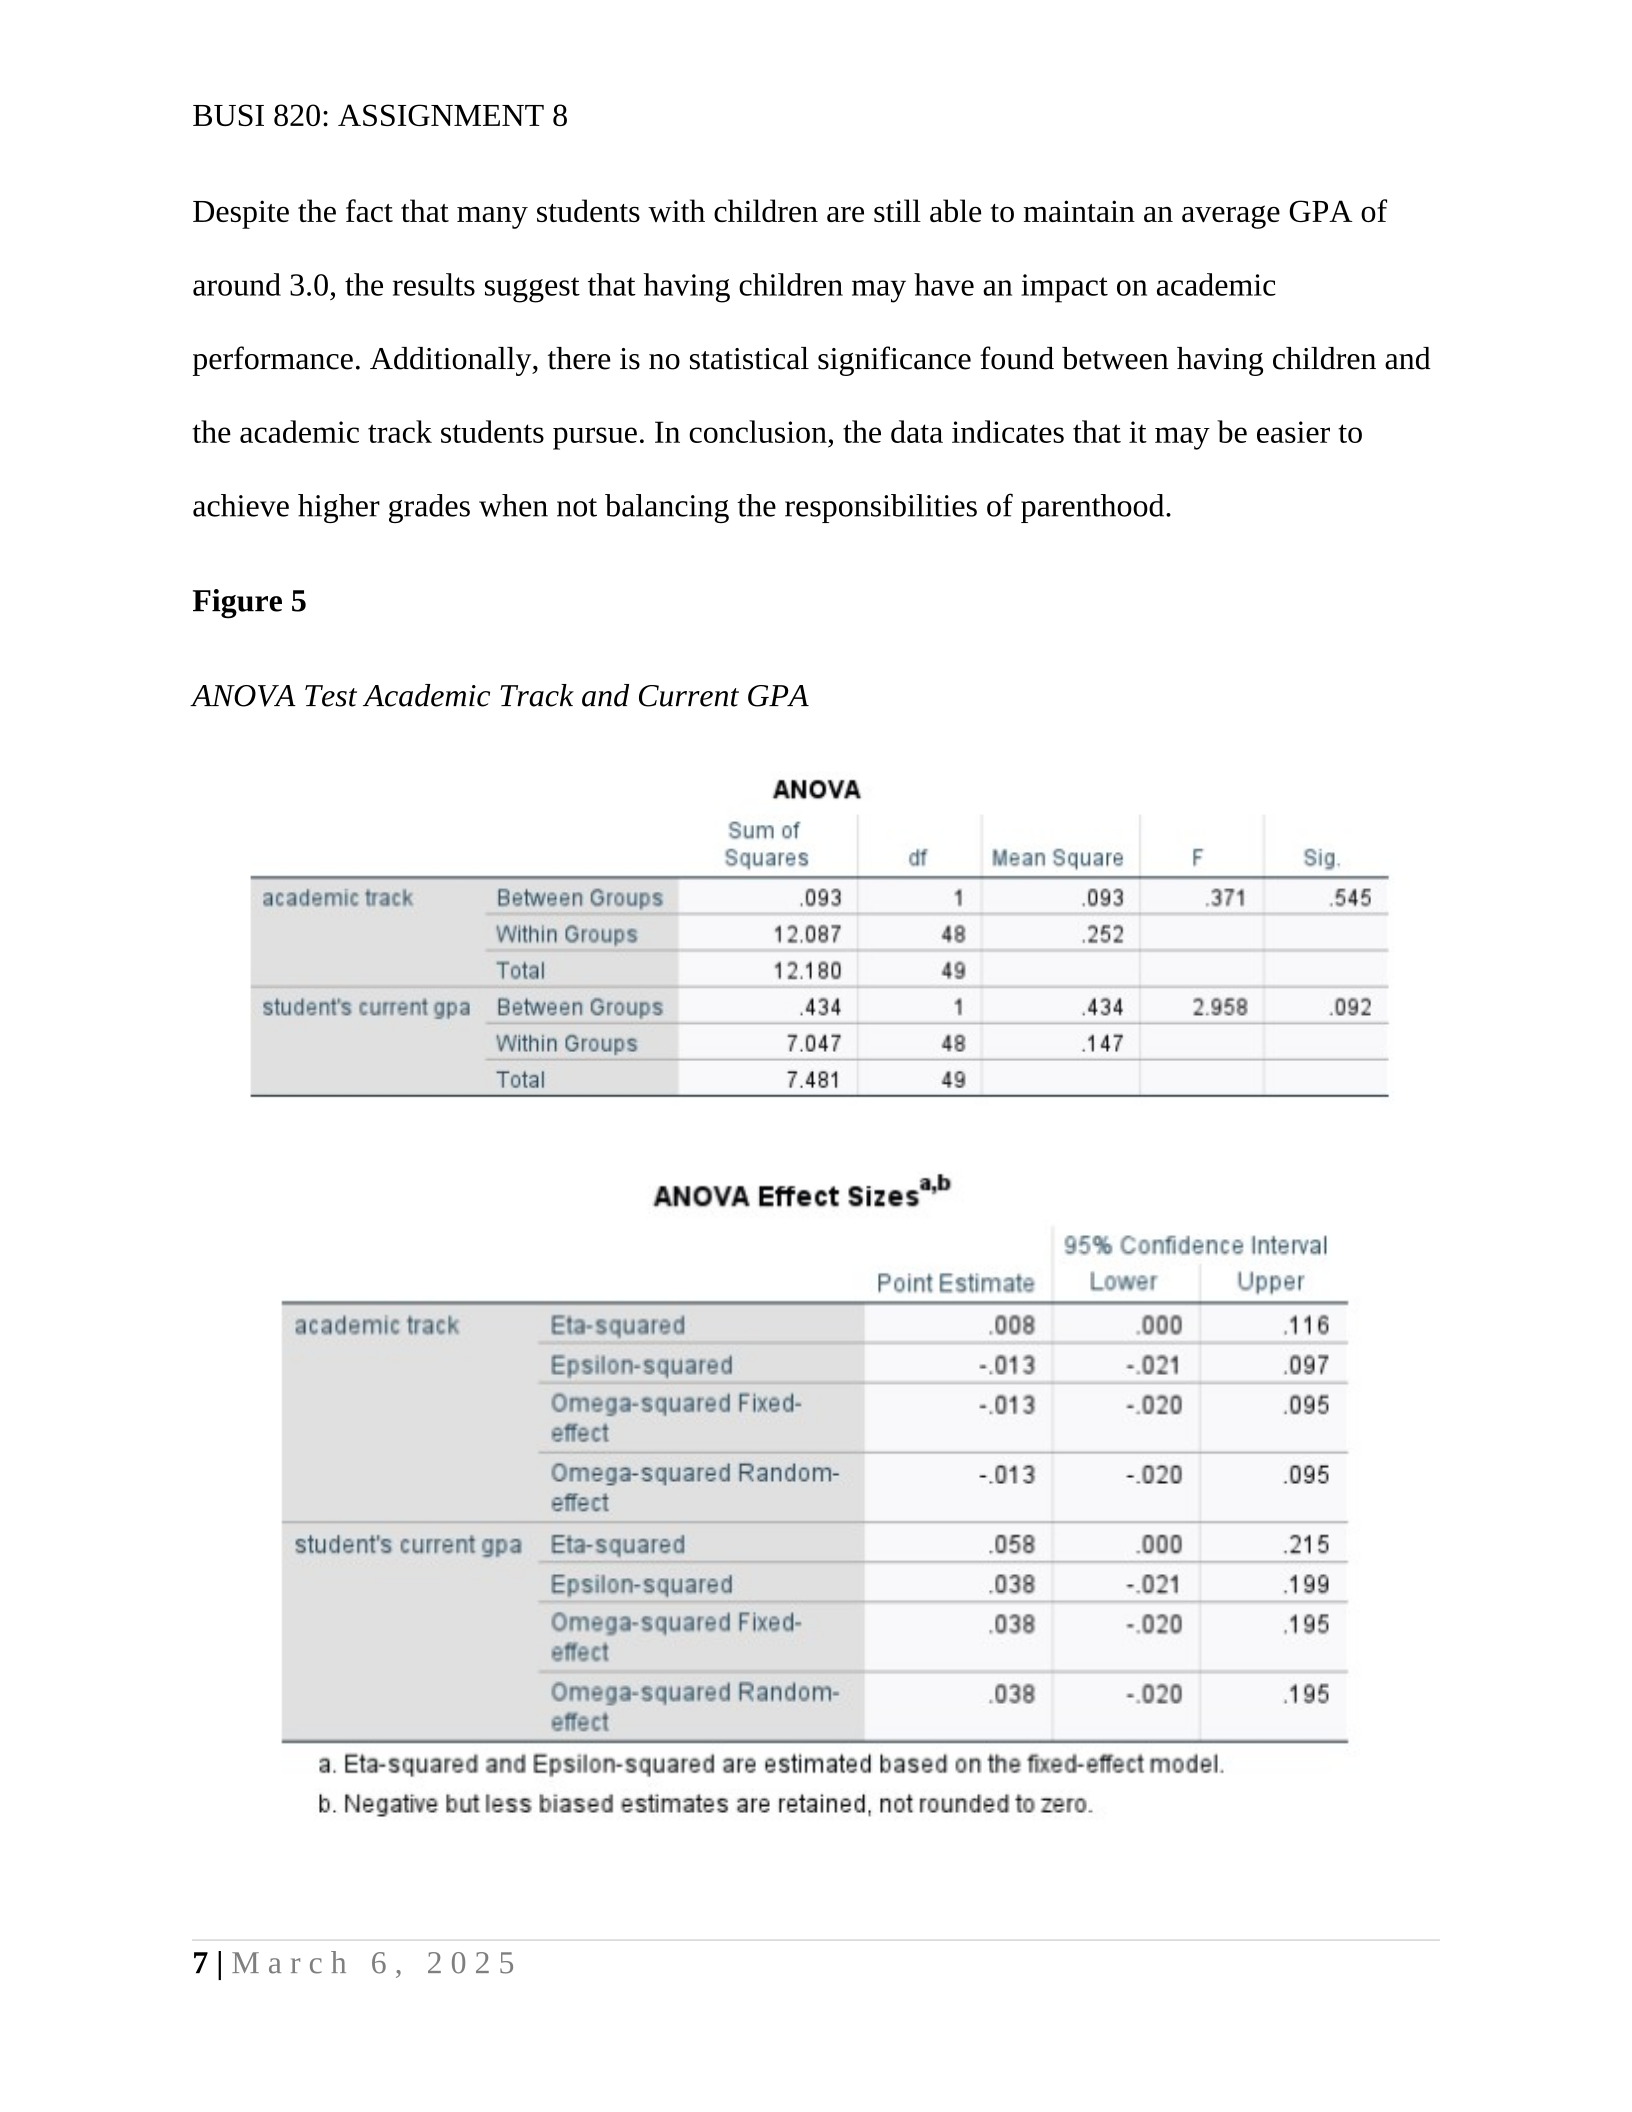
The NPAR test was conducted to examine the relationships between three variables:
height, academic track, and marital status. According to the results presented in Figure 4, there
were no significant differences in the mean values when comparing marital status with either
student height or academic track as p-values are 0.238, 0.001, and 0.101 respectively in the
Kruskal-Wallis Test. There is not enough evidence to reject the null hypothesis. This suggests
that marital status does not have an impact on either a student's height or their academic track.
Furthermore, the lack of significant findings between these variables indicates that there is no
correlation between marital status and academic track, nor between marital status and height.
This implies that a student's marital status is not a factor influencing their height or the academic
BUSI 820: ASSIGNMENT 8
6 | March 6, 2025
track they pursue, reinforcing the idea that these variables operate independently of one another
in the context of this study.
Figure 4
Mean Rank and Kruskal-Wallis Test Stats Academic Track, Student Height, Marital Status
A8: Chapter 9, Problem 9.8 Do academic track and having children interact and does
either seem to affect current GPA?
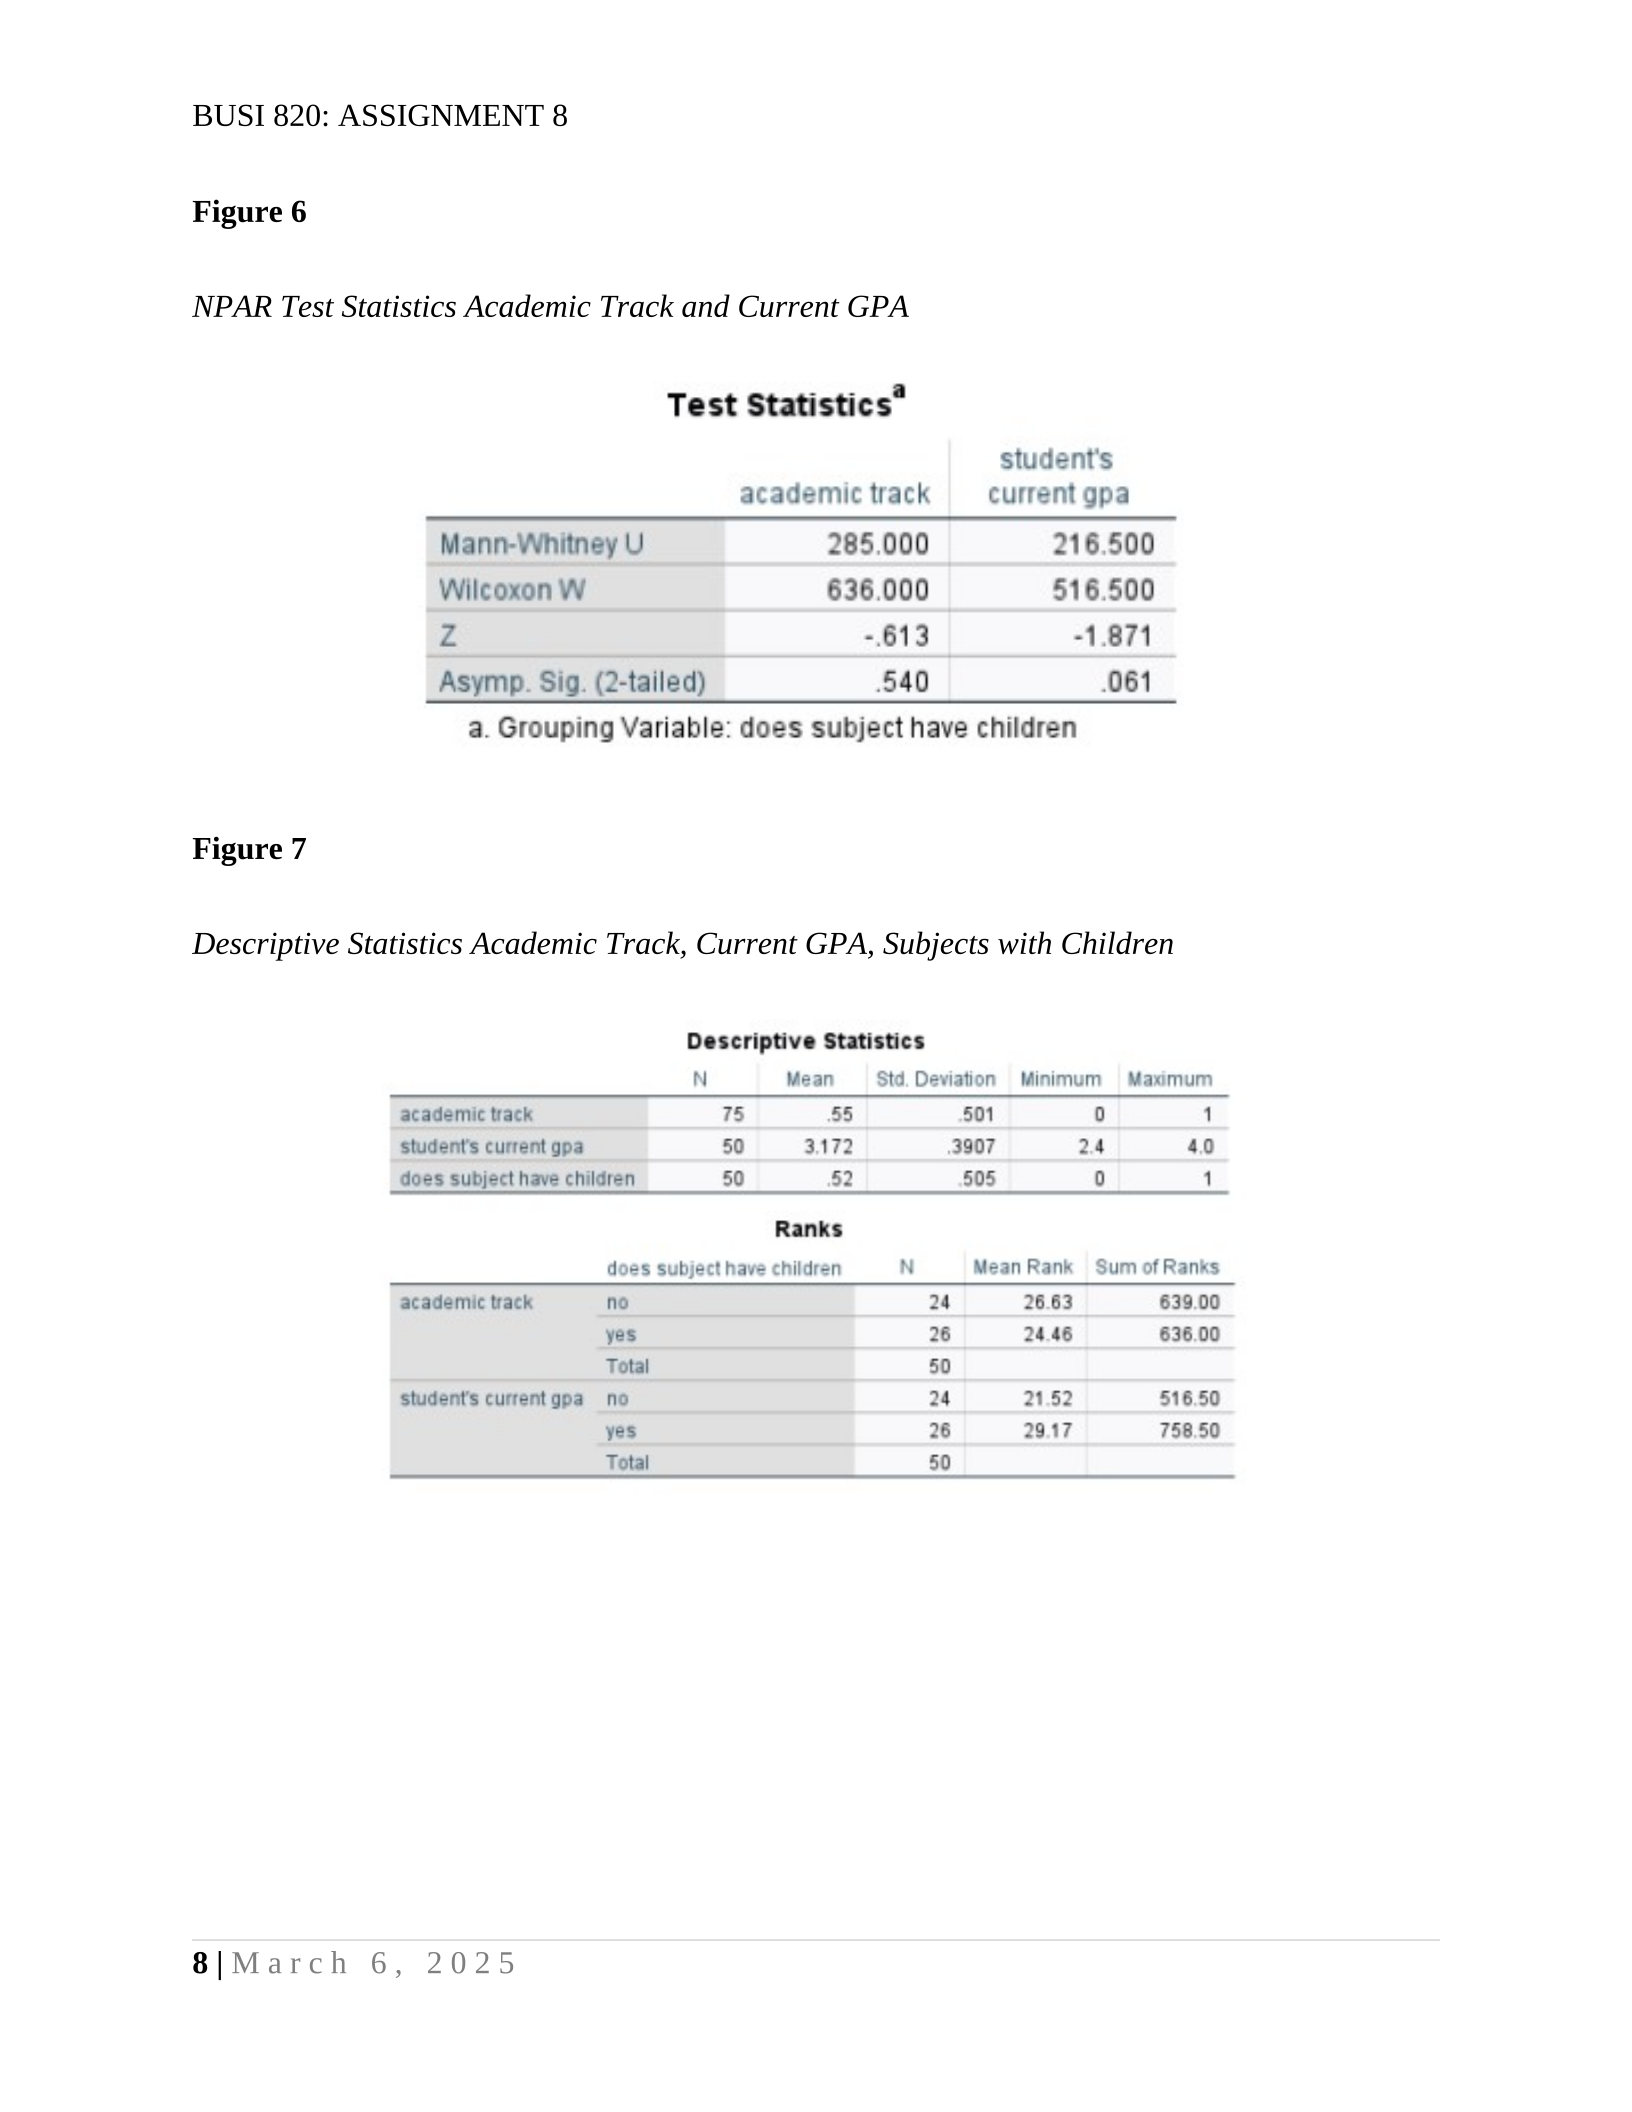
Variables such as hours worked, illness, and having children can all influence a person's
GPA. According to the results of the NPAR tests, as shown in Figure 5 and 6, there is little
difference in GPA when it comes to having children as p-values noted are greater than 0.05,
noted in Figure 6. However, the data does reveal a statistically significant difference in GPA
related to having children as there is significant differences noted in the means under Figure 7.
BUSI 820: ASSIGNMENT 8
7 | March 6, 2025
Despite the fact that many students with children are still able to maintain an average GPA of
around 3.0, the results suggest that having children may have an impact on academic
performance. Additionally, there is no statistical significance found between having children and
the academic track students pursue. In conclusion, the data indicates that it may be easier to
achieve higher grades when not balancing the responsibilities of parenthood.
Figure 5
ANOVA Test Academic Track and Current GPA