


Course and Assignment Number
Assessing Reliability with Nominal Data, Exploratory Factor Analysis and Cronbach’s Alpha
Student’s Name
Institutional Affiliation
Tutor
Date
15/02/2021 1

Course and Assignment Number
Table of Contents
A4.1: Chapter 7, Problem 7.1, Cohen’s Kappa to Assess Reliability with Nominal Data..............3
A4.2: Chapter 7, Problem 7.2, Correlation and Paired t to Assess Interrater Reliability................4
A4.3: Chapter 7, Problem 7.3, Exploratory Factor Analysis to Assess Evidence for Validity.......6
A4.4: Chapter 7, Problem 7.4, Cronbach’s Alpha to Assess Internal Consistency Reliability.....10
A4.5, Application Problem ‐ Measuring Reliability and Validity.................................................12
The following are the analysis results for this;..............................................................................14
References......................................................................................................................................17
15/02/2021 2

Course and Assignment Number
A4.1: Chapter 7, Problem 7.1, Cohen’s Kappa to Assess Reliability with
Nominal Data
Checking the reliability of data is essential to determine whether the data is viable for further
analysis using different statistical techniques. The case processing summary, cross-tabulation,
and symmetrical tables are done using the descriptive option of the SPSS software. The
following are the results of the analysis;
Case Processing Summary
Cases
Valid Missing Total
N Percent N Percent N Percent
ethnicity * ethnicity reported
by student 71 94.7% 4 5.3% 75 100.0%
Symmetric Measures
Value
Asymp. Std.
ErroraApprox. TbApprox. Sig.
Measure of Agreement Kappa .858 .054 11.163 .000
N of Valid Cases 71
a. Not assuming the null hypothesis.
b. Using the asymptotic standard error assuming the null hypothesis.
15/02/2021 3

Course and Assignment Number
Ethnicity * Ethnicity Reported by Student Cross-tabulation
ethnicity reported by student
TotalEuro-Amer Afican-Amer Latino-Amer Asian-Amer
ethnicity Euro-Amer Count 40 1 0 0 41
% of Total 56.3% 1.4% .0% .0% 57.7%
African-Amer Count 2 11 1 0 14
% of Total 2.8% 15.5% 1.4% .0% 19.7%
Latino-Amer Count 0 1 8 0 9
% of Total .0% 1.4% 11.3% .0% 12.7%
Asian-Amer Count 0 1 0 6 7
% of Total .0% 1.4% .0% 8.5% 9.9%
Total Count 42 14 9 6 71
% of Total 59.2% 19.7% 12.7% 8.5% 100.0%
The total number of students who participated in the activity are 71 which means there exists a
number of missing values in the variables elected for analysis. Majority of the students are
European-American as represented by 56.3% of the total students. The Kappa symmetric
measure is 0.858 which is greater than 0.70, which implies that the data under analysis is reliable
for giving informative inferences (Morgan et al. 2013).
A4.2: Chapter 7, Problem 7.2, Correlation and Paired t to Assess Interrater Reliability
The correlation analysis is conducted to showcase the strong of relationships between pairs of
variables in the dataset. In this case, the correlation analysis will be used to compare the scores
for the visualizations and mosaic tests to indicate whether there was some level of association
between variables in the selected pairs. The paired sample statistics indicates the general
insights of variable, hence giving comparisons on the means, standard deviation, and standard
15/02/2021 4

Course and Assignment Number
errors. The paired T-tests also showcases whether there exist significant differences in means of
different groups selected from a population under study.
Paired Samples Statistics
Mean N Std. Deviation Std. Error Mean
Pair 1 visualization test 5.2433 75 3.91203 .45172
visualization 2 5.1067 75 3.77518 .43592
Pair 2 mosaic, pattern test 27.413 75 9.5738 1.1055
mosaic pattern test 2 27.4800 75 9.34816 1.07943
Paired Samples Correlations
N Correlation Sig.
Pair 1 visualization test & visualization 2
75 .938 .000
Pair 2 mosaic, pattern test & mosaic pattern
test 2 75 .957 .000
15/02/2021 5

Course and Assignment Number
Paired Samples Test
Paired Differences
t df
Sig. (2-
tailed)Mean
Std.
Deviation
Std. Error
Mean
95% Confidence Interval
of the Difference
Lower Upper
Pair 1 visualizatio
n test -
visualizatio
n 2
.13667 1.36331 .15742 -.17700 .45033 .868 74 .388
Pair 2 mosaic,
pattern test -
mosaic
pattern test
2
-.06667 2.77334 .32024 -.70476 .57142 -.208 74 .836
The paired sample statistics results indicate that the descriptive statistics are not different and the
difference is significantly minimal. The correlation analysis indicates a strong relationship
between the visualization and mosaic tests whereby the correlation coefficient is more than 0.90
which is very close to 1 (Morgan et al. 2013). This implies that the scores of the two courses are
individually highly associated. The Paired T-tests indicates that the P-values for the analysis are
all greater than the statistical significance level 0.05 which implies that there exist no significant
differences in the means of the two courses.
A4.3: Chapter 7, Problem 7.3, Exploratory Factor Analysis to Assess Evidence for Validity
The following are the results for the exploratory factor analysis;
Descriptive Statistics
15/02/2021 6
Course and Assignment Number
Mean Std. Deviation Analysis N
gender .54 .502 71
item01 motivation 2.99 .918 71
item02 pleasure 3.58 .822 71
item03 competence 2.82 .915 71
item04 low motiv 2.21 .909 71
item05 low comp 1.61 .948 71
item06 low pleas 2.44 .996 71
item07 motivation 2.77 1.072 71
item08 low motiv 1.96 .917 71
item09 competence 3.32 .770 71
item10 low pleas 1.41 .748 71
item11 low comp 1.38 .763 71
item12 motivation 2.99 .837 71
item13 motivation 2.68 .807 71
item14 pleasure 2.86 .723 71
15/02/2021 7

Course and Assignment Number
KMO and Bartlett's Test
Kaiser-Meyer-Olkin Measure of Sampling
Adequacy. .764
Bartlett's Test of
Sphericity
Approx. Chi-Square 446.725
Df 105
Sig. .000
Rotated Factor Matrixa
Factor
123
item05 low comp -.902
item03
competence .778
item01 motivation .776
item11 low comp -.582 .349
item12 motivation .742
item13 motivation .642
item08 low motiv -.617
item04 low motiv -.592
item07 motivation .417 .576
item09
competence .347
gender
item14 pleasure -.819
item10 low pleas .571
item06 low pleas .524
item02 pleasure .497 -.497
Extraction Method: Principal Axis Factoring.
Rotation Method: Varimax with Kaiser
Normalization.
a. Rotation converged in 5 iterations.
15/02/2021 8

Course and Assignment Number
Total Variance Explained
Factor
Rotation Sums of Squared Loadings
Total % of Variance Cumulative %
1 3.060 20.402 20.402
2 2.367 15.781 36.184
3 1.802 12.015 48.199
Extraction Method: Principal Axis Factoring.
Factor Transformation Matrix
Factor 1 2 3
1 .753 .550 -.362
2 -.177 .699 .693
3 .634 -.457 .624
Extraction Method: Principal Axis Factoring.
Rotation Method: Varimax with Kaiser Normalization.
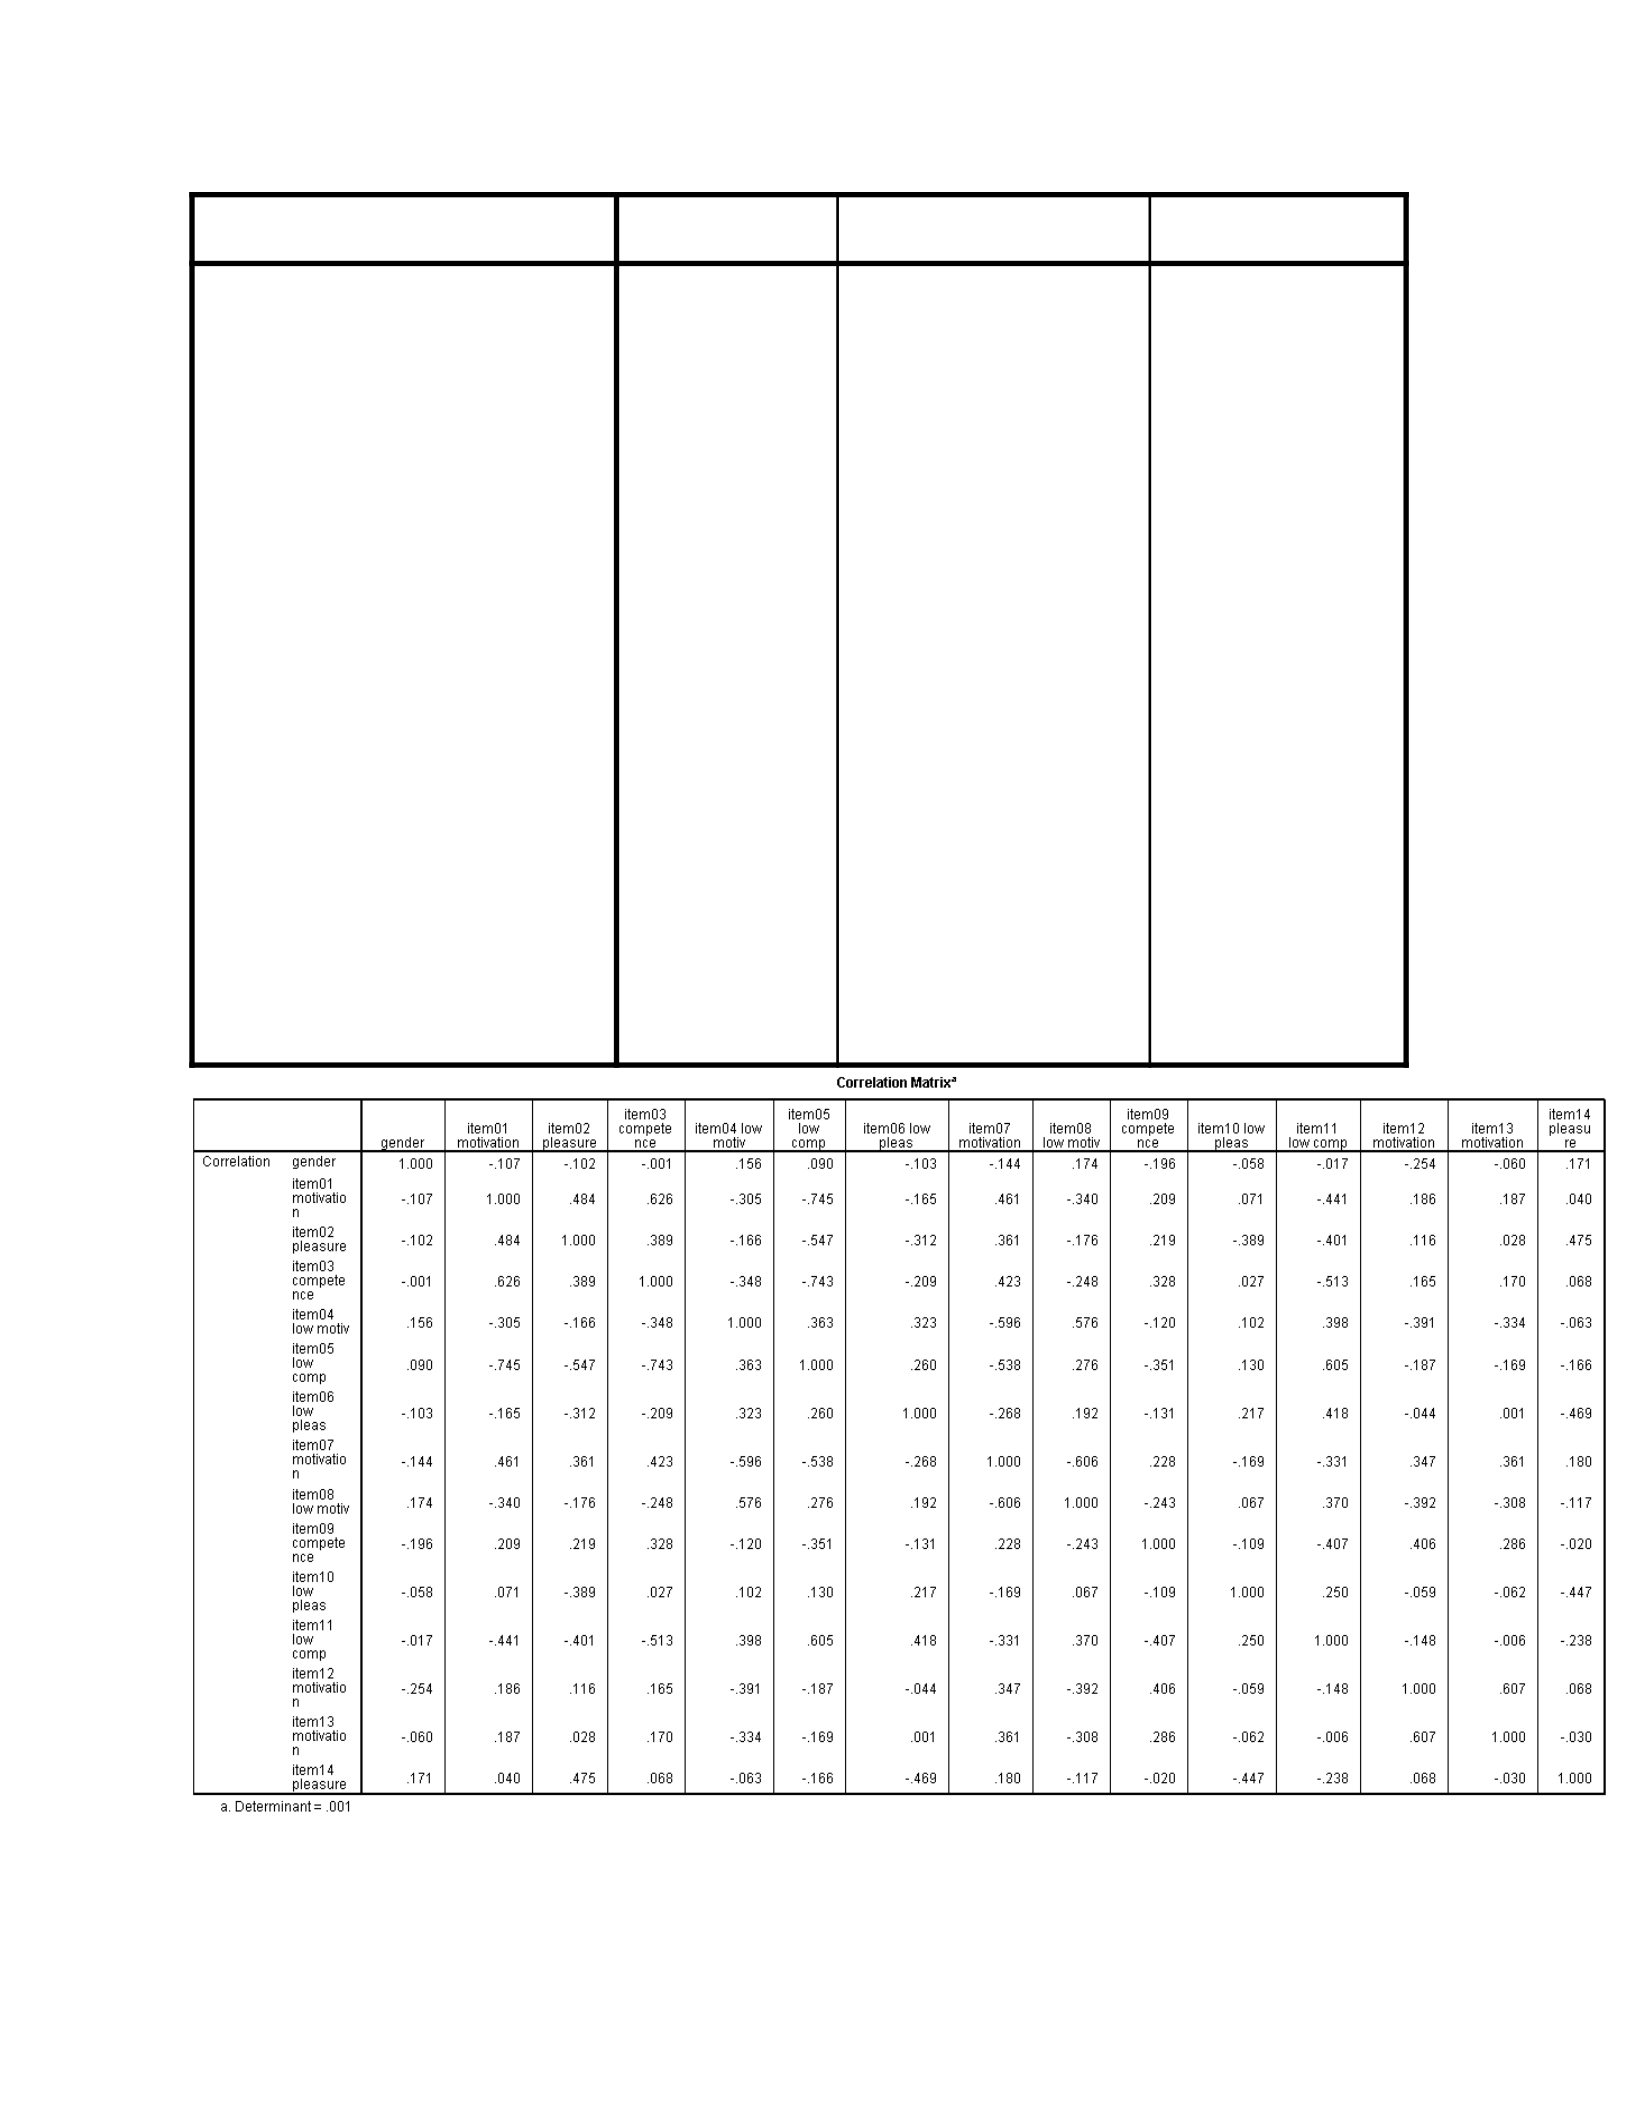
The descriptive statistics tables indicate that the total number of participants is approximately 71.
The correlation matrix indicates a p-value of 0.001 which is less than the statistical significance
level 0.05 which implies that all the variables are highly correlated with each other (Morgan et
al. 2013) . The KMO and Bartlett's Test indicates the tests of assumption of multicolinearity
which is proven by the significance level which is less than 0.01, therefore meaning that the
collinearity assumption is met (Morgan et al. 2013). Enough factors are predicted based on the
Kaiser-Meyer-Olkin Measure of Sampling Adequacy, which is greater than 0.70. The total
variance explained is indicated by 20.40%, 36.184, and 48.199% for the three factors selected.
15/02/2021 9

Course and Assignment Number
A4.4: Chapter 7, Problem 7.4, Cronbach’s Alpha to Assess Internal Consistency Reliability
For each of the following Scales; 7.4a Alpha for the Revised Competency Scale, 7.4b Alpha for
the Revised Motivation Scale, and 7.4c Alpha for the Revised Pleasure Scale, complete the
following: Write a short narrative of your process, an interpretation of your findings, and write
your results. Cut and paste the Case
Processing Summary, Reliability Statistics, Item Statistics, Inter‐Item Correlation Matrix, and
Item‐Total Statistics tables directly into your document and refer to them in your interpretation.
Include appropriate headings to clearly show each separate reliability test completed.
Case Processing Summary
N %
Cases Valid 73 97.3
Excludeda2 2.7
Total 75 100.0
a. Listwise deletion based on all
variables in the procedure.
The reliability Statistics Table
Reliability Statistics
Cronbach's
Alpha
Cronbach's
Alpha Based
on
Standardized
Items N of Items
.856 .853 4
The Cronbach’s reliability statistics confirms the reliability of the measurements selected
because the statistic is 0.856 which is more than 0.70 (Morgan et al. 2013). The reliability
15/02/2021 10

Course and Assignment Number
measures for all the 4 variable have been determined and this implies that further analysis can be
done on these variables because their corresponding reliability is appropriate.
Descriptive Statistics of the Variables
Item Statistics
Mean
Std.
Deviation N
item01 motivation 2.96 .934 73
item03
competence 2.82 .903 73
item05 reversed 3.37 .979 73
item11 reversed 3.63 .755 73
The item Statistics indicates the overall insights of the items such as the mean, standard
deviation, and the total numbers represented by N. The total number of items is 73 which implies
the number of participants is 73, and the missing values are excluded. The Mean (Standard
deviation) for tem01motivation, item03, competence, item05 reversed, and item11 reversed is
2.96(0.934), 2.82(0.903), 3.37(0.979), and 3.63(0.755), respectively.
Correlation Matrix
Inter-Item Correlation Matrix
item01
motivation
item03
competence
item05
reversed
item11
reversed
item01 motivation 1.000 .600 .761 .411
item03
competence .600 1.000 .704 .513
item05 reversed .761 .704 1.000 .564
item11 reversed .411 .513 .564 1.000
Strong positive correlation is observed between the three items because the correlation
coefficients are all greater than 0.50 implying significant association between the variables. The
correlation coefficient between competence and item05 revised is 0.704 which indicates a strong
15/02/2021 11

Course and Assignment Number
positive association between the variables. The high correlation is adversely observed in all the
four variables analyzed.
Item-Total Statistics
Scale Mean if
Item Deleted
Scale
Variance if
Item Deleted
Corrected
Item-Total
Correlation
Squared
Multiple
Correlation
Cronbach's
Alpha if Item
Deleted
item01 motivation 9.82 5.121 .706 .589 .814
item03
competence 9.96 5.207 .718 .527 .808
item05 reversed 9.41 4.551 .831 .705 .756
item11 reversed 9.15 6.296 .558 .347 .869
The table above from the analysis indicates the overall statistics of the data such as the scale
variance and the Cronbach’s Alpha values for indicating reliability of the measurements.
A4.5, Application Problem ‐ Measuring Reliability and Validity.
a.) Write a research question and a null hypotheses relating to the variables “mosaic” and
“mosaic2” that could be answered using a paired sample t test. Run the t test and provide
a full interpretation if the findings to include the outputs.
The following is the research question;
Are there any differences between the means of the Mosaic and Mosaic 2 tests?
The following is the null and alternative hypothesis;
H0: There exists no significant differences in the means of the Mosaic and Mosaic 2
tests.
H1: There exists significant differences in the means of the Mosaic and Mosaic 2 tests.
The paired samples T-test is run on SPSS and this is the output;
15/02/2021 12
Course and Assignment Number
Paired Samples Statistics
Mean N Std. Deviation Std. Error Mean
Pair 1 mosaic, pattern test 27.413 75 9.5738 1.1055
mosaic pattern test 2 27.4800 75 9.34816 1.07943
The means of the Mosaic Patterns are approximately similar and the total number of students
considered is 75. The Mean (Standard deviation) of the Mosaic pattern test and Mosaic pattern
test 2 is 27.413(9.5738), and 27.48 (9.34816), respectively.
Paired Samples Correlations
N Correlation Sig.
Pair 1 mosaic, pattern test &
mosaic pattern test 2 75 .957 .000
The correlation analysis indicates that the coefficient is 0.957 which implies a strong positive
correlation between Mosaic test and Mosaic s tests. The association between the variables is
strong because the correlation coefficient is very close to positive one.
Paired Samples Test
Paired Differences
t df
Sig. (2-
tailed)Mean
Std.
Deviation
Std. Error
Mean
95% Confidence Interval
of the Difference
Lower Upper
Pair 1 mosaic, pattern
test - mosaic
pattern test 2
-.06667 2.77334 .32024 -.70476 .57142
-
2.082
E-1
74 .836
15/02/2021 13

Course and Assignment Number
The P-value corresponding to the T-test is approximately 0.83 which is greater than the statistical
significance level 0.05 (Morgan et al. 2013). Therefore, the null hypothesis is accepted and it is
concluded that there exist no significant differences in the means of the Mosaic and Mosaic 2
tests.
b.) Combine “item01”, “item07”, “item12”, “item13” to form a summated scale. Run the
Cronbach’s alpha for that scale and provide a full interpretation of the findings to include the
outputs.
The following are the analysis results for this;
Case Processing Summary
N %
Cases Valid 74 98.7
Excludeda1 1.3
Total 75 100.0
a. Listwise deletion based on all
variables in the procedure.
Reliability Statistics
Cronbach's
Alpha
Cronbach's
Alpha Based
on
Standardized
Items N of Items
.677 .681 4
15/02/2021 14

Course and Assignment Number
Item Statistics
Mean
Std.
Deviation N
item01
motivation 2.96 .928 74
item07
motivation 2.76 1.057 74
item12
motivation 3.00 .828 74
item13
motivation 2.66 .799 74
Inter-Item Correlation Matrix
item01
motivation
item07
motivation
item12
motivation
item13
motivation
item01
motivation 1.000 .464 .178 .166
item07
motivation .464 1.000 .344 .356
item12
motivation .178 .344 1.000 .580
item13
motivation .166 .356 .580 1.000
15/02/2021 15

Course and Assignment Number
Item-Total Statistics
Scale Mean if
Item Deleted
Scale
Variance if
Item Deleted
Corrected
Item-Total
Correlation
Squared
Multiple
Correlation
Cronbach's
Alpha if Item
Deleted
item01
motivation 8.42 4.411 .367 .216 .670
item07
motivation 8.62 3.471 .537 .312 .556
item12
motivation 8.38 4.375 .475 .359 .603
item13
motivation 8.72 4.453 .479 .364 .602
The Cronbach’s reliability statistics confirms the non-reliability of the measurements selected
because the statistic is 0.677 which is less than 0.70. The item Statistics indicates the overall
insights of the items such as the mean, standard deviation, and the total numbers represented by
N. In this case the total number of students included is 74. Strong positive correlation is
observed between the three items because the correlation coefficients are all greater than 0.50
implying significant association between the variables (Morgan et al. 2013).
15/02/2021 16

Course and Assignment Number
References
Morgan, G., Leech, N., Gloeckner, G., Barrett, K. (2013). IBM SPSS for Introductory Statistics
(5th Ed.). New York, NY
15/02/2021 17

