


Amazon.com
Amazon.com
Name:
Institutional Affiliation:
Date:

Amazon.com 2
Executive Summary
Amazon is one of the most important and valuable companies in the world. It’s the world leader
in online commerce, but it still trails Walmart in total retail sales. One of Amazon’s biggest threats is that
its business model can be replicated relatively easily. A Canadian company, Shopify, has grown
significantly over the last couple of years and has become the second largest online retailer, managing
sales of over $400 billion per year.
Shopify’s business model is different than Amazon’s since it doesn’t have the resources to offer
any logistics services and can only offer online platform services that allow other firms to operate. That
results in very low profit margins, but the company is growing steadily. When analysing both companies’
financial ratios and financial reports, it is important to notice that Shopify has barely taken any debt. This
means that if it decides to compete against Amazon on its core business, it could chip away a significant
portion of its market share.
As George Washington once said, “the best defence is a good offense.” Right now, Amazon’s
financial and market position is much better than Shopify’s, but Shopify is growing at a much faster rate.
Amazon must at quickly to not only protect its core market, but also to try to gain some of Shopify’s
market share.
This paper provides the financial analysis and strategic objectives in order for Amazon to
compete in providing complete services that include selling platforms and logistics. This way, the new
project will conclude services that Shopify cannot currently match and will provide the advantage of
international presence.
Carrying out this proposed expansion project should help to increase Amazon’s profits and
consolidate the company as the leader in both online sales within in platform and provider of online
platform services and logistics to companies that wish to handle its online sales independently. This new
project will improve the company’s financial performance and increase the company’s value.

Amazon.com 3
Table of Contents
Mission, Objectives and Strategies 4
New Mission Statement with Nine Components 6
The Existing Business Model 7
Amazon SWOT Analysis 8
Porter's Five Forces Analysis 9
Historical Financial Statements 10
Financial Ratios 13
Alternative Strategies 15
Projected Financial Statements 16
NPV or Enterprise Value 18
Implementation Strategy 19
Recommended Strategy 20
References 21
Appendices 23

Amazon.com 4
Mission, Objectives and Strategies
Amazon is a reputable multinational organisation that operates in multiple countries across the
globe. The firm's operations have enabled it to gain a competitive advantage based on leveraging diverse
resources into developing a reliable long-term strategy. Its reputation is supported by the prevailing
values and capacity to deliver low price products and services to the underlying consumers. It is vital to
appreciate the idea that the firm has invested heavily in various resources like technology which have
enabled it to accomplish the desired goals in growth and development. The multinational has used various
technologies to leverage the prevailing trends within the market, which promotes competitiveness (Ives,
Cossick & Adams, 2019).
The firm competes with various players according to their industries and the services offered. The
core competitors which influence the firm's operations include Walmart, eBay and but not limited to
Alibaba (Robischon, 2017). These firms enjoy significant market share depending on their positioning
and abilities to attract and sustain consumers. Their success in achieving the desired goals comes from
promoting awareness amongst the various consumers, which sustains a broader market share than the
rivals.
Amazon operates in various industries, which enable it to deliver products and services to diverse
consumers. The firm's existence in multiple dimensions and industries has enabled it to achieve better
returns concerning performance and alignment with the prevailing consumer demands. Some of the
industries where the firm operates include e-commerce, cloud computing, digital distribution,
entertainment and but not limited to, artificial intelligence and associated technologies (Anh, 2019). The
firm delivers resources and products depending on the needs of consumers from each segment. While the
firm is based in the United States, it delivers products and services in the global market, enabling it to
grow according to the increasing consumer consumption trends. The firm's core products include Echo,
Fire OS, Kindle, and Fire tablet. These resources are a foundation for the firm's operations based on
achieving the intended outcomes in market penetration and domination.

Amazon.com 5
The core services that the firm offers to its consumers are Alexa, AWS, Prime, Prime Video and
but not limited to Music. These services are strategically distributed across the market, which creates a
foundation for achieving and sustaining a larger share than the rivals (Sadq, Sabir & Saeed, 2018).
Similarly, the firm enjoys superior recognition in the retail sector because of the eCommerce platform.
This platform enables the firm to achieve better returns due to reaching out to more consumers within the
broader geographical regions. The superior eCommerce platform has supported the firm's operations in
reaching out to consumers regardless of their geographical location. In addition, the investment in
technology has promoted speedy deliveries and reduced operational costs, translating into a lower price in
its core products.
Amazon operates under a reliable mission that focuses on empowering the consumers through
various interventions. The firm's mission is to provide a foundation for serving the consumers through
physical and online outlets where the main focus is promoting selection, convenience and price
(Amazon.com, 2022). It follows that the corporate mission is based on the three core elements, which are:
1. Product pricing
2. Improving selection
3. Enhancing convenience
This mission has enabled the firm to work towards enhancing the consumer experience. The firm
understands that its success relies on leveraging the available resources to promote consumer engagement
and satisfaction. Similarly, the firm understands that achieving better returns depends on creating the
ideal foundation for enhancing consumer engagement. This approach has allowed the firm to explore
ways to promote the ability to achieve maximum consumer satisfaction and engagement. Selection deals
with the engagement of the variety of its products to its consumers. Amazon today boasts a wide selection
of products and services that consumers can locate online through the corporate eCommerce framework.
Similarly, the firm has ventured into a strategic approach which has enabled it to sustain the consumers
through favourable pricing. Overall, Amazon operates under a strategic framework that reduces its
operational costs. The overall operational costs will reduce the pricing of the products and services that
the consumers purchase from the various environments. Reducing operations costs translates into lower

Amazon.com 6
prices of the products and services offered to the consumers. Such a strategy enables the firm to achieve
better returns focused on promoting strategic alignment with the market (Sadq, Sabir & Saeed, 2018).
The core objectives driving the firm and its operations are related to the capacity to deliver value
according to the increasing demands. The primary long-term goal which drives the firm relates to the
ability to create a foundation that promotes more products, cheaper prices and faster delivery. This
approach has enabled Amazon to concentrate on strategies that promote awareness about the pricing of
the products and services offered to the consumers. This statement implies that while Amazon has worked
towards improving its consumer relationships, it has invested in technologies and solutions that respond
to the market's increasing demands from a product delivery dimension. The objective mentioned above is
a part of the grand strategy, which focuses on investing in technologies to improve logistics involved in
product delivery processes.
New Mission Statement with Nine Components
“Improve customers’ buying experience by offering innovative solutions that focus on quality, price, and
convenience.”
The proposed mission statement is based on nine of the following elements:
Customers: The firm will target individuals, households, organisations, and industrial users in this
mission.
Products and services: The core products and services offered by the firm will depend on the consumer
needs. The firm will deliver products ranging from consumer households to industrial interventions. Also,
the firm will deliver core services like AWS and cloud computing.
Markets: The primary markets that the firm will target include the middle and upper-class consumer
groups. These groups provide sufficient demographics and resources like income to support progressive
consumption. Likewise, the firm will target the industrial environment, which will benefit from large
scale technological solutions in computers, artificial intelligence, automation and cloud services

Amazon.com 7
Technology: The increased focus on technology will promote the firm's market relationships and ability
to achieve sustainability (Sadq, Sabir & Saeed, 2018). The continued investment in technology has
offered the firm a foundation for promoting its operations regardless of the increasing competition.
Concern for survival: Amazon is concerned about its survival which has triggered the adoption of a low-
cost strategy to support sustainability.
Philosophy: Amazon has invested in a singular mission that places the consumer as the main concern and
focus.
Self-concept: The main competitive advantage for Amazon is the low-cost strategy which provides its
products at reduced prices (Cattero & D'Onofrio, 2018).
Concern for public image: Corporate social responsibility programs are vital for enhancing the capacity
to achieve the intended goals. In addition, the engagement in environmental protection and awareness
interventions has enabled the firm to promote sustainability and positive community connections.
Concern for employees: Changes in the human resources management strategies for handling the
employees in order to promote lasting relationships.
The Existing Business Model
Amazon operates a platform business model. This model allows the company to sell its products
to the consumers while offering third party commodities. Third-party sellers can utilise the platform to
sell their consumers to the intended consumers depending on their demands. Such a platform has
increased the overall abilities to achieve better market relationships within the underlying environments.
Also, the firm generates revenues through advertising which create a foundation for its positive market
relationships. Other revenue-generating streams are retail web services and subscriptions (Cattero &
D'Onofrio, 2018). Further, the firm has physical stores that directly engage with the consumers and its
platform.
Amazon SWOT Analysis
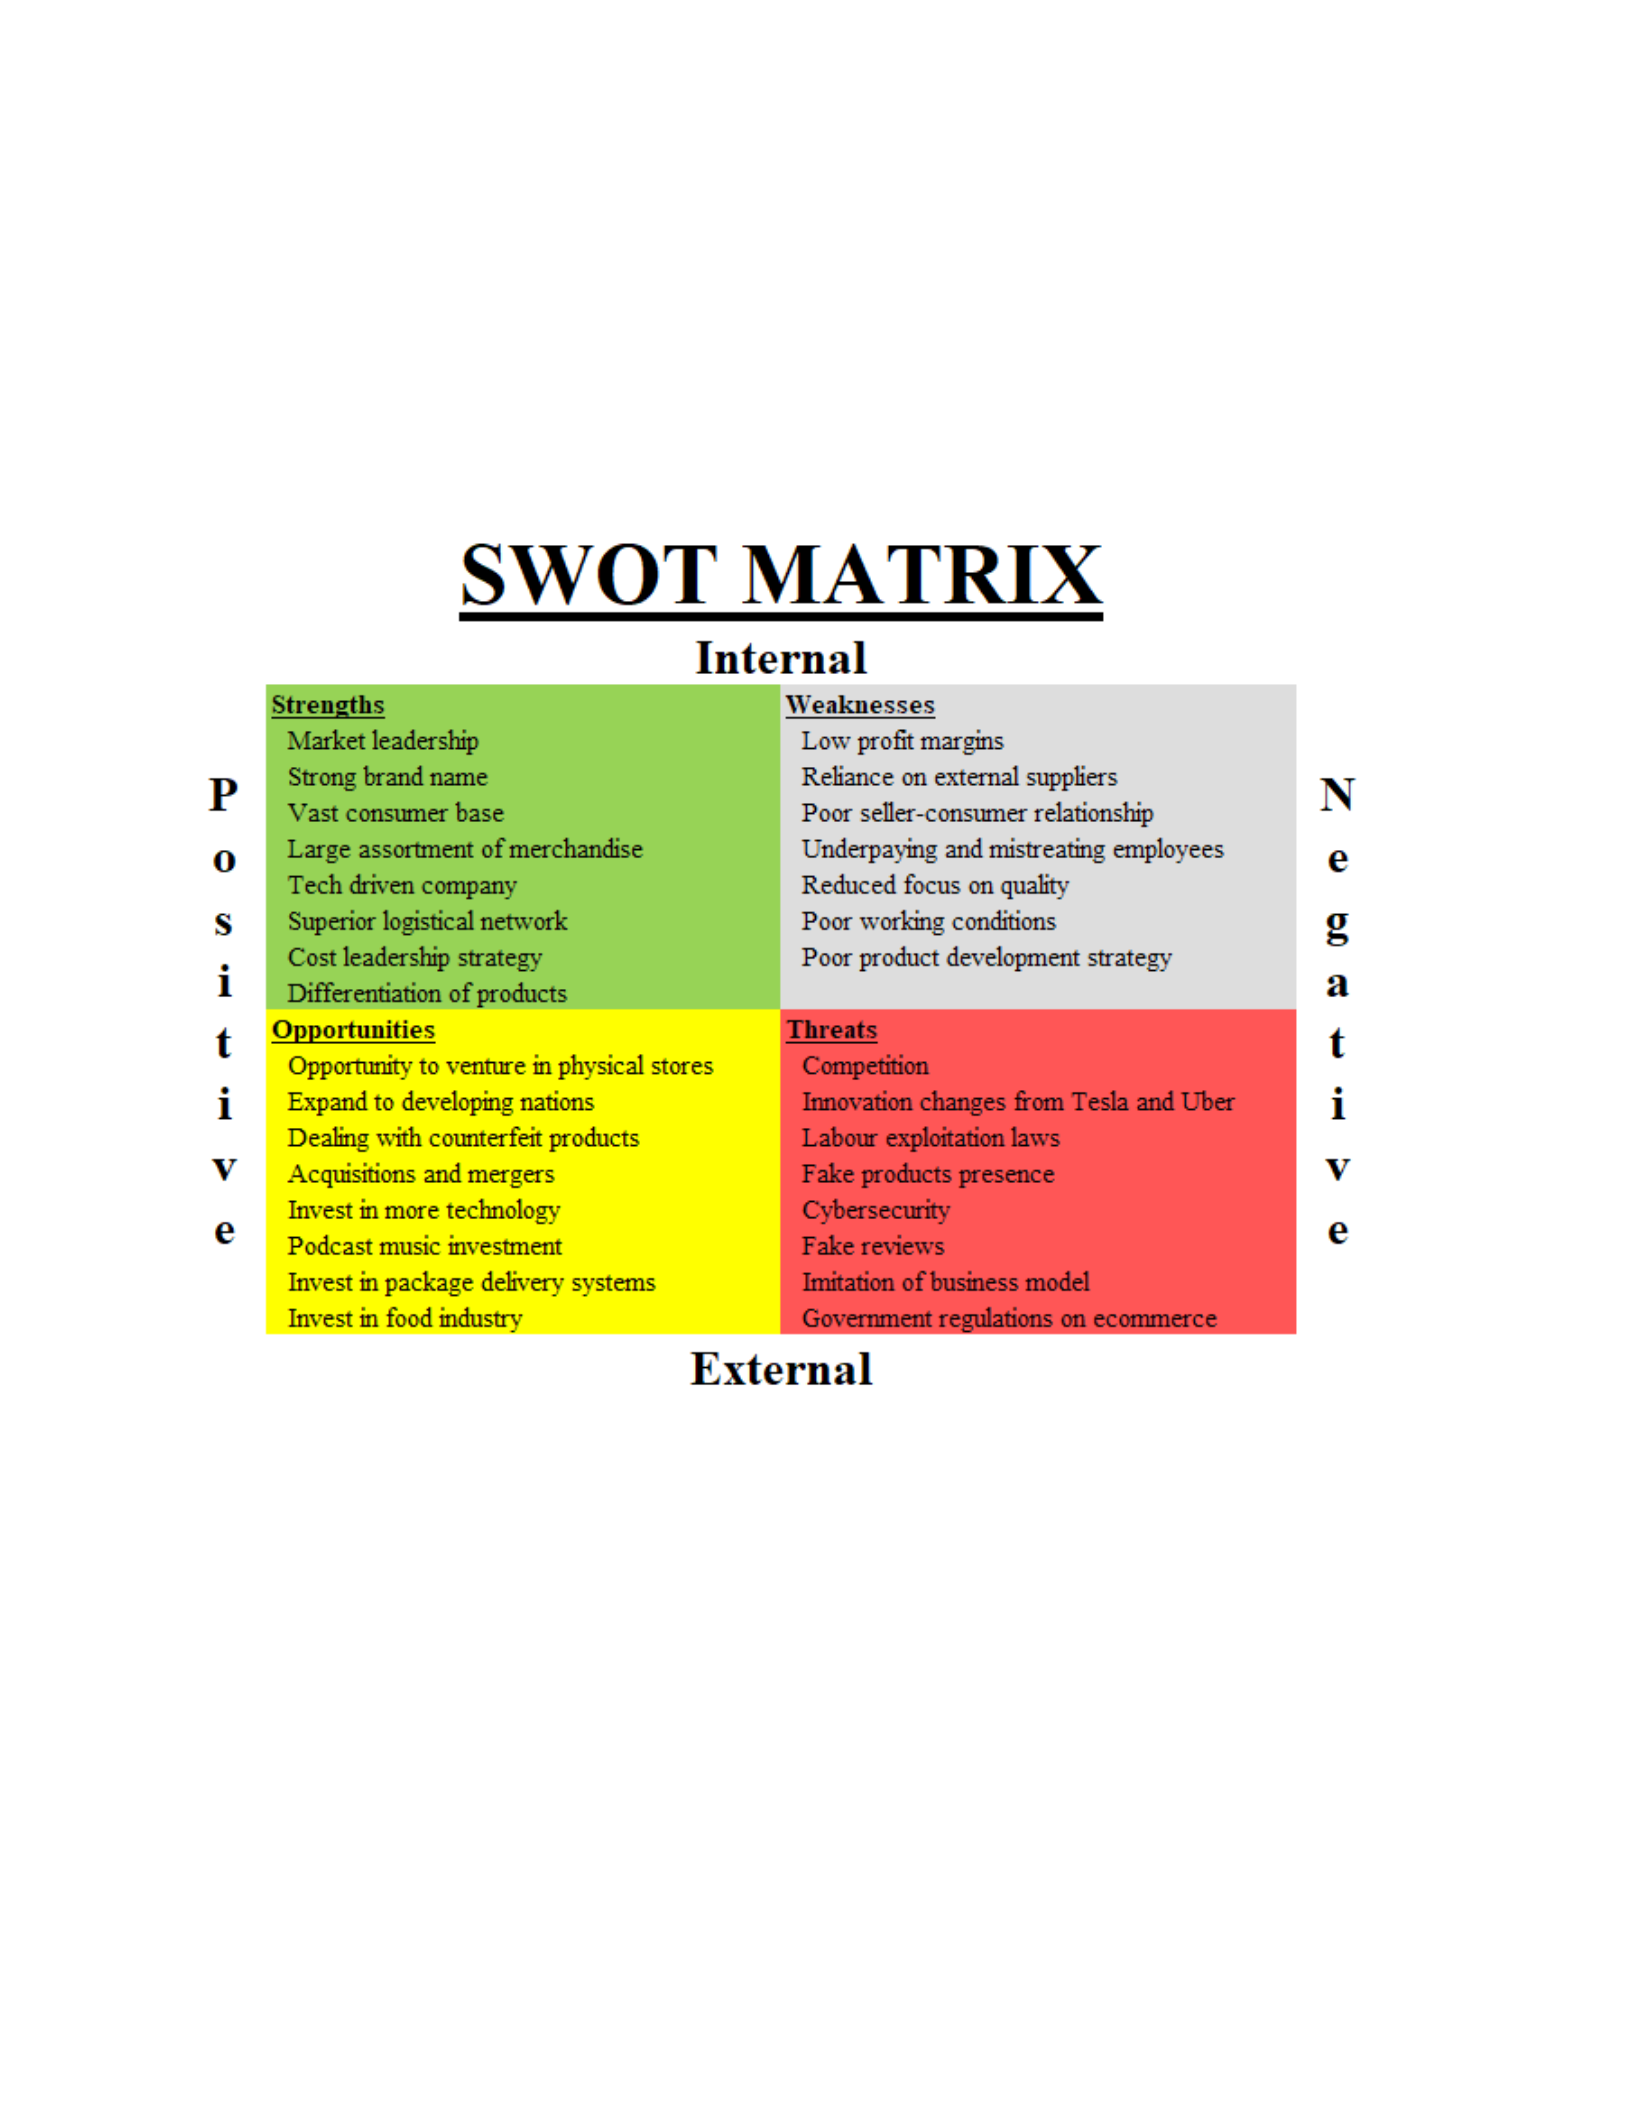
Strengths: One of the strengths of Amazon is that it is a market leader. It has over 386 billion us dollars
in revenue and over 1.6 million dollars in market capitalisation annually. This trend, therefore, gives it a

Amazon.com 8
competitive edge against other competitors. Amazon has a firm brand name. It is known worldwide and
has created a superior image globally over the years. Amazon is commonly known as an e-commerce
giant because most transactions and interactions are done online. Amazon has a vast consumer base. It
has a vast range of customers, and its prices are fair and are therefore consumer oriented. Its customer
orientation is based on its low-price strategy such that products are cheap and therefore satisfy consumers
through cost leadership. Amazon also has a large merchandise selection which attracts consumers to make
purchases than using other online platforms. It has an extensive product mix and has sold over 75 million
products in its marketplace. Amazon is a tech-driven firm. It comes up with new updated ideas that best
suit the consumer. It is innovative and adapts to current trending technologies, which reach many
customers (Cattero & D'Onofrio, 2018). The firm enjoys a superior logistics and distribution network,
promoting its overall market relationship and capacity to deliver value to the underlying consumers.
Weaknesses: Amazon has low-profit margins. This pattern is risky because other companies increase
their market shares and revenue, which may affect the firm's sustainability. Amazon over relies on
external vendors, which expose it to challenges in dealing with the different suppliers. For example, the
pandemic has disrupted its supply chain, affecting its product offering. The Amazon model can easily be
imitated. There is a poor seller-consumer relationship since most transactions are done online. The sellers
are also concerned with increasing their profit margins rather than addressing customers' issues. Amazon
employees are underpaid. This approach reduces employee morale since their hourly wages are so low,
and they sometimes strike due to the low wages. People, therefore, opt for other firms where there is no
employee neglect. The firm has reduced focus on the quality of its products and services because of the
large selection and increased demand for shipping speeds. Similarly, the firm has a poor competition-
driven working culture (Berman, 2019).
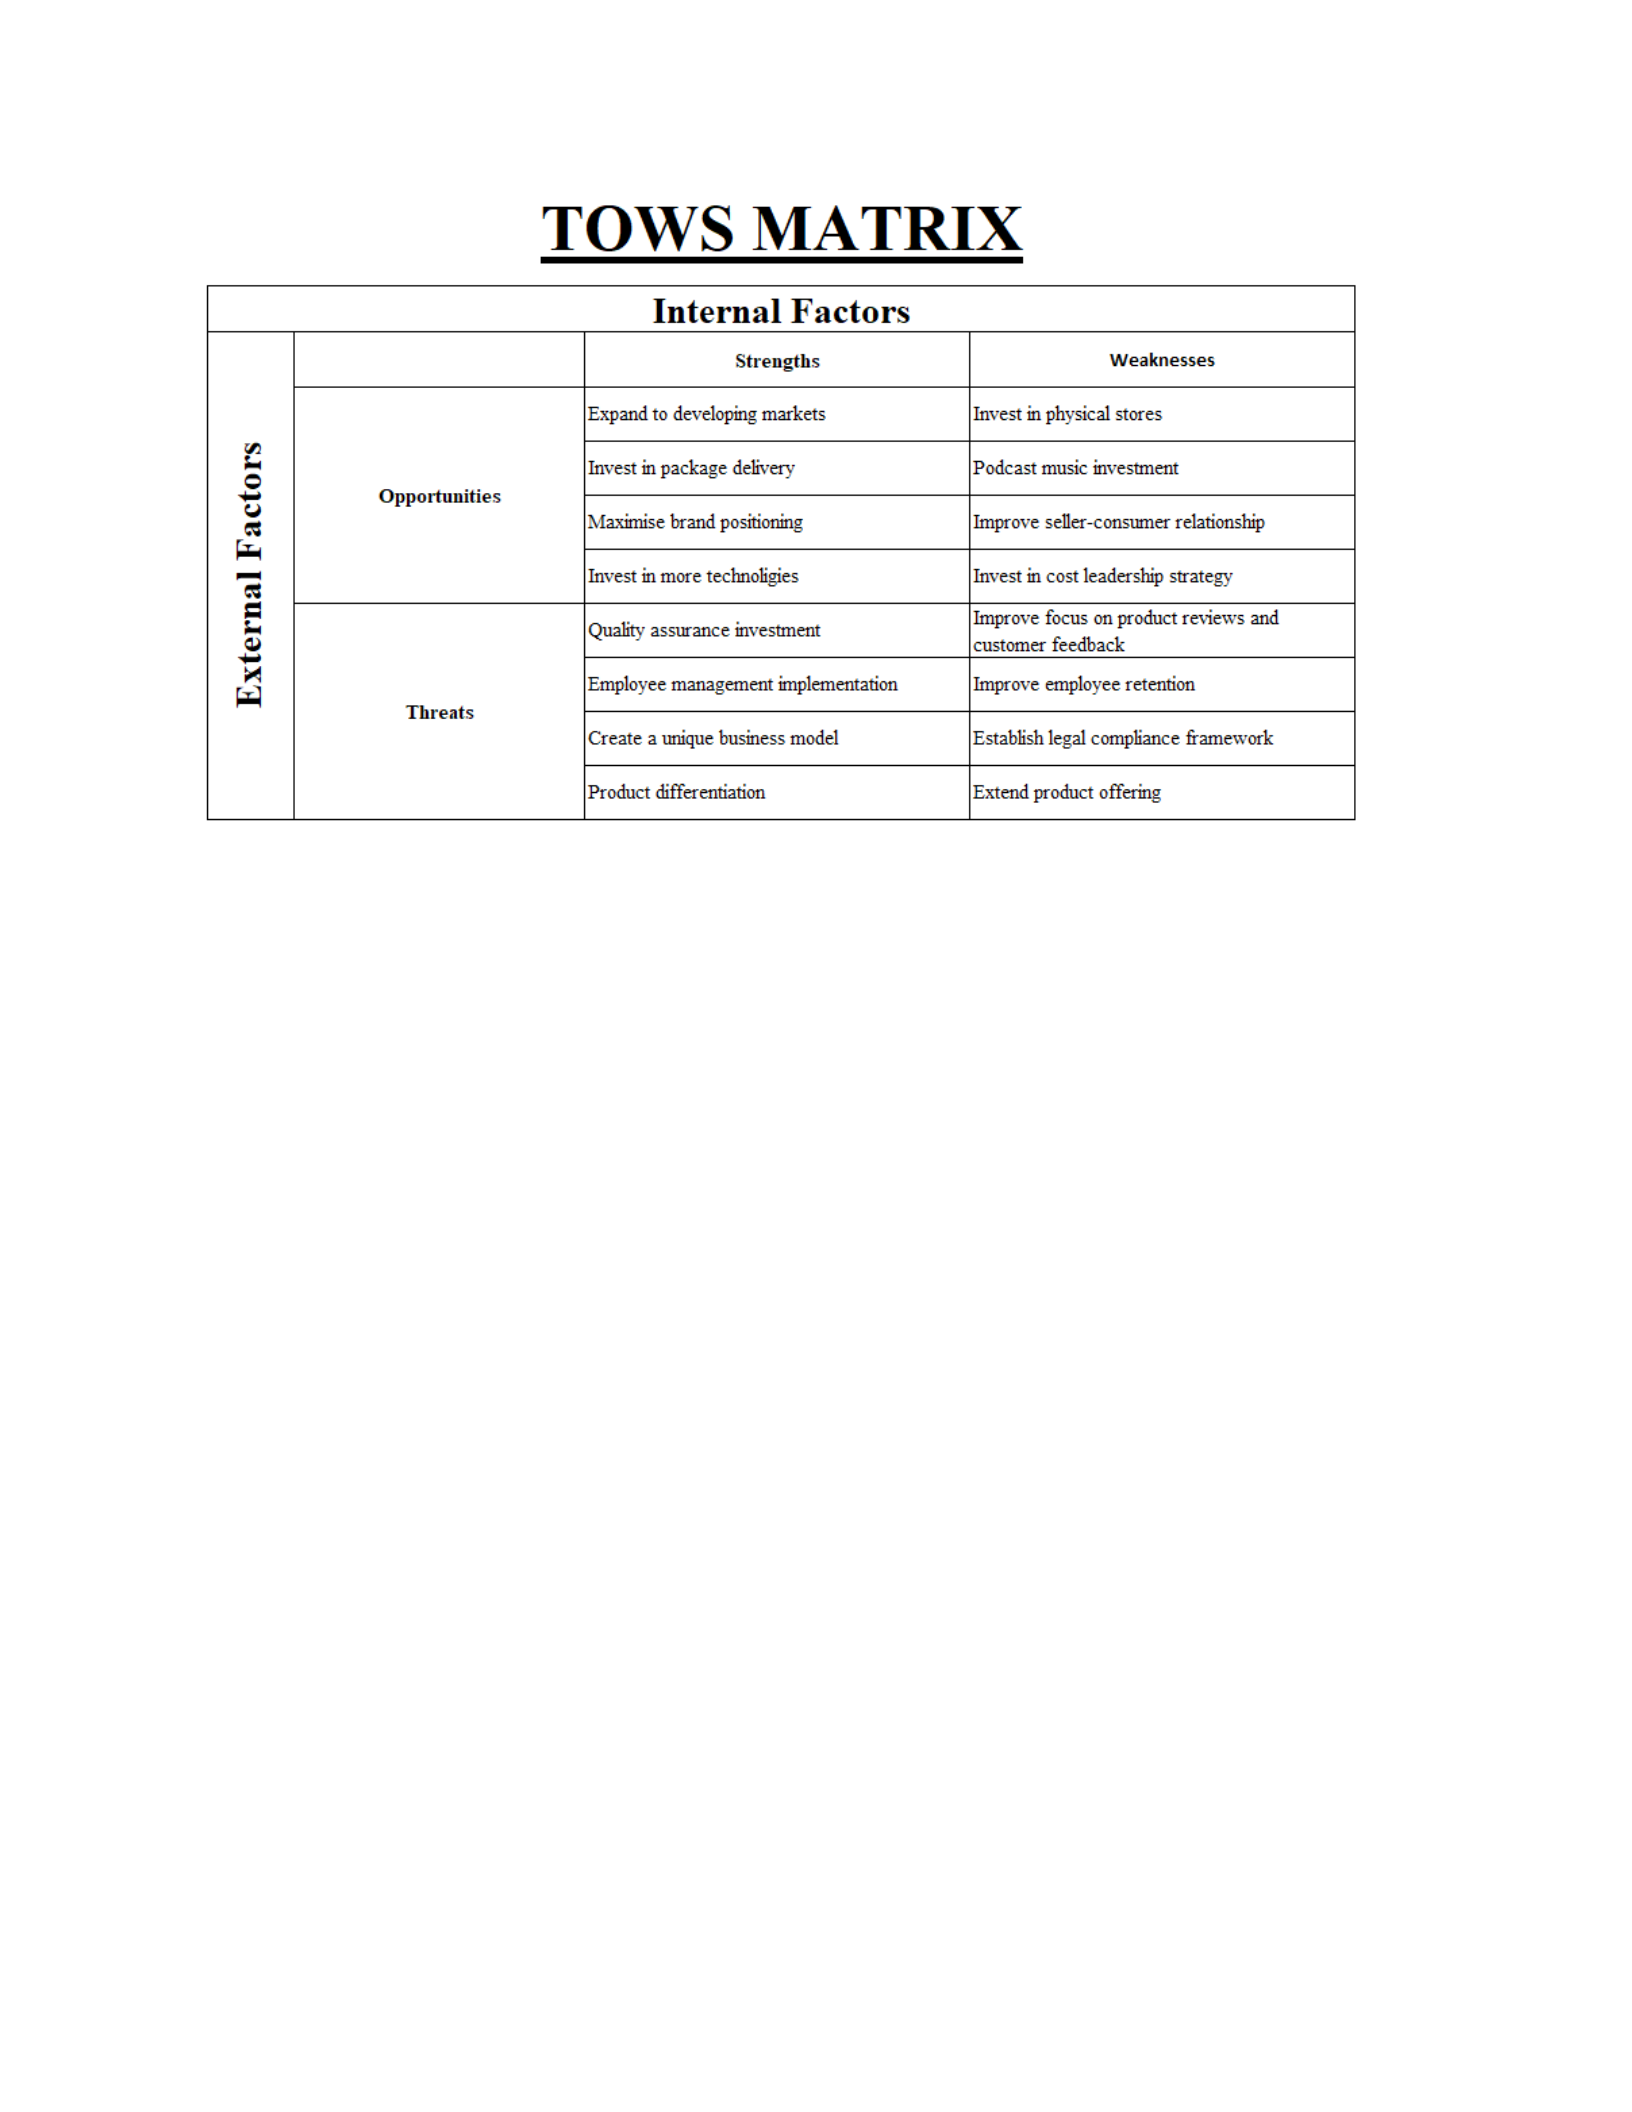
Opportunities: Amazon can go physical by using online platforms, competing with other firms, and
interacting directly with their consumers. Amazon can also expand its operations worldwide, especially in
developing countries (Cattero & D'Onofrio, 2018). Amazon can set strategies and policies that better its
sales and reduce counterfeit sales through quality checks. This strategy can be deployed by dealing with

Amazon.com 9
counterfeit products and setting a quality assurance standard. Amazon can make more acquisitions with e-
commerce companies to increase profit margins and market share. Improvement in technology can also
give Amazon a competitive edge against its competitors (Ives, Cossick & Adams, 2019). Its business
model should have restrictions such that not anyone can copy or imitate through strategic research and
development. Amazon can venture into the package delivery segment because of its established shipping
and logistics network (Berman, 2019).
Threats: Government regulations restrict shipment into certain countries such as North Korea, which
threatens amazon's business capacity. Imitation from new entrants is a threat to amazon because they pick
up its business model. The presence of fake products undermines customer relations. When people buy
fake products from Amazon, their satisfaction reduces. Poor customer satisfaction reduces sustainability.
Amazon sometimes gets fake reviews, and this could deter customers, which would, in turn, lead to low-
profit margins. Competition from companies such as Walmart, Alibaba, and eBay reduce amazon's
market share. Labour exploitation regulations may affect the corporate progress in the various industries.
For example, the firm risks human rights legal actions by exploiting young labour in its core areas.
Porter's Five Forces Analysis
Amazon operates in an industry that has low threats of entrants. New entrants pose limited threats
to the already established entities because of the large initial investment requirements and the vast market
share for firms like Amazon. Likewise, the industry has substitute products that present a high challenge
to the existing firms. For example, the existing firms offer similar products and services that may provide
consumers with alternatives, especially in the physical stores. On the other hand, the suppliers have low
bargaining power. As a result, the industry comprises many sellers where the firms can select.
Similarly, the switching costs across suppliers is low for the firms. The buyers have low
bargaining power because there are multiple players. However, the buyers who purchase in bulk have a
high bargaining power within the industry. The industry, on the other hand, has many sellers. These
sellers compete for the same market and consumers. These firms use diverse strategies like differentiation
to create a competitive advantage due to the high competition.
Amazon.com 10
Historical Financial Statements
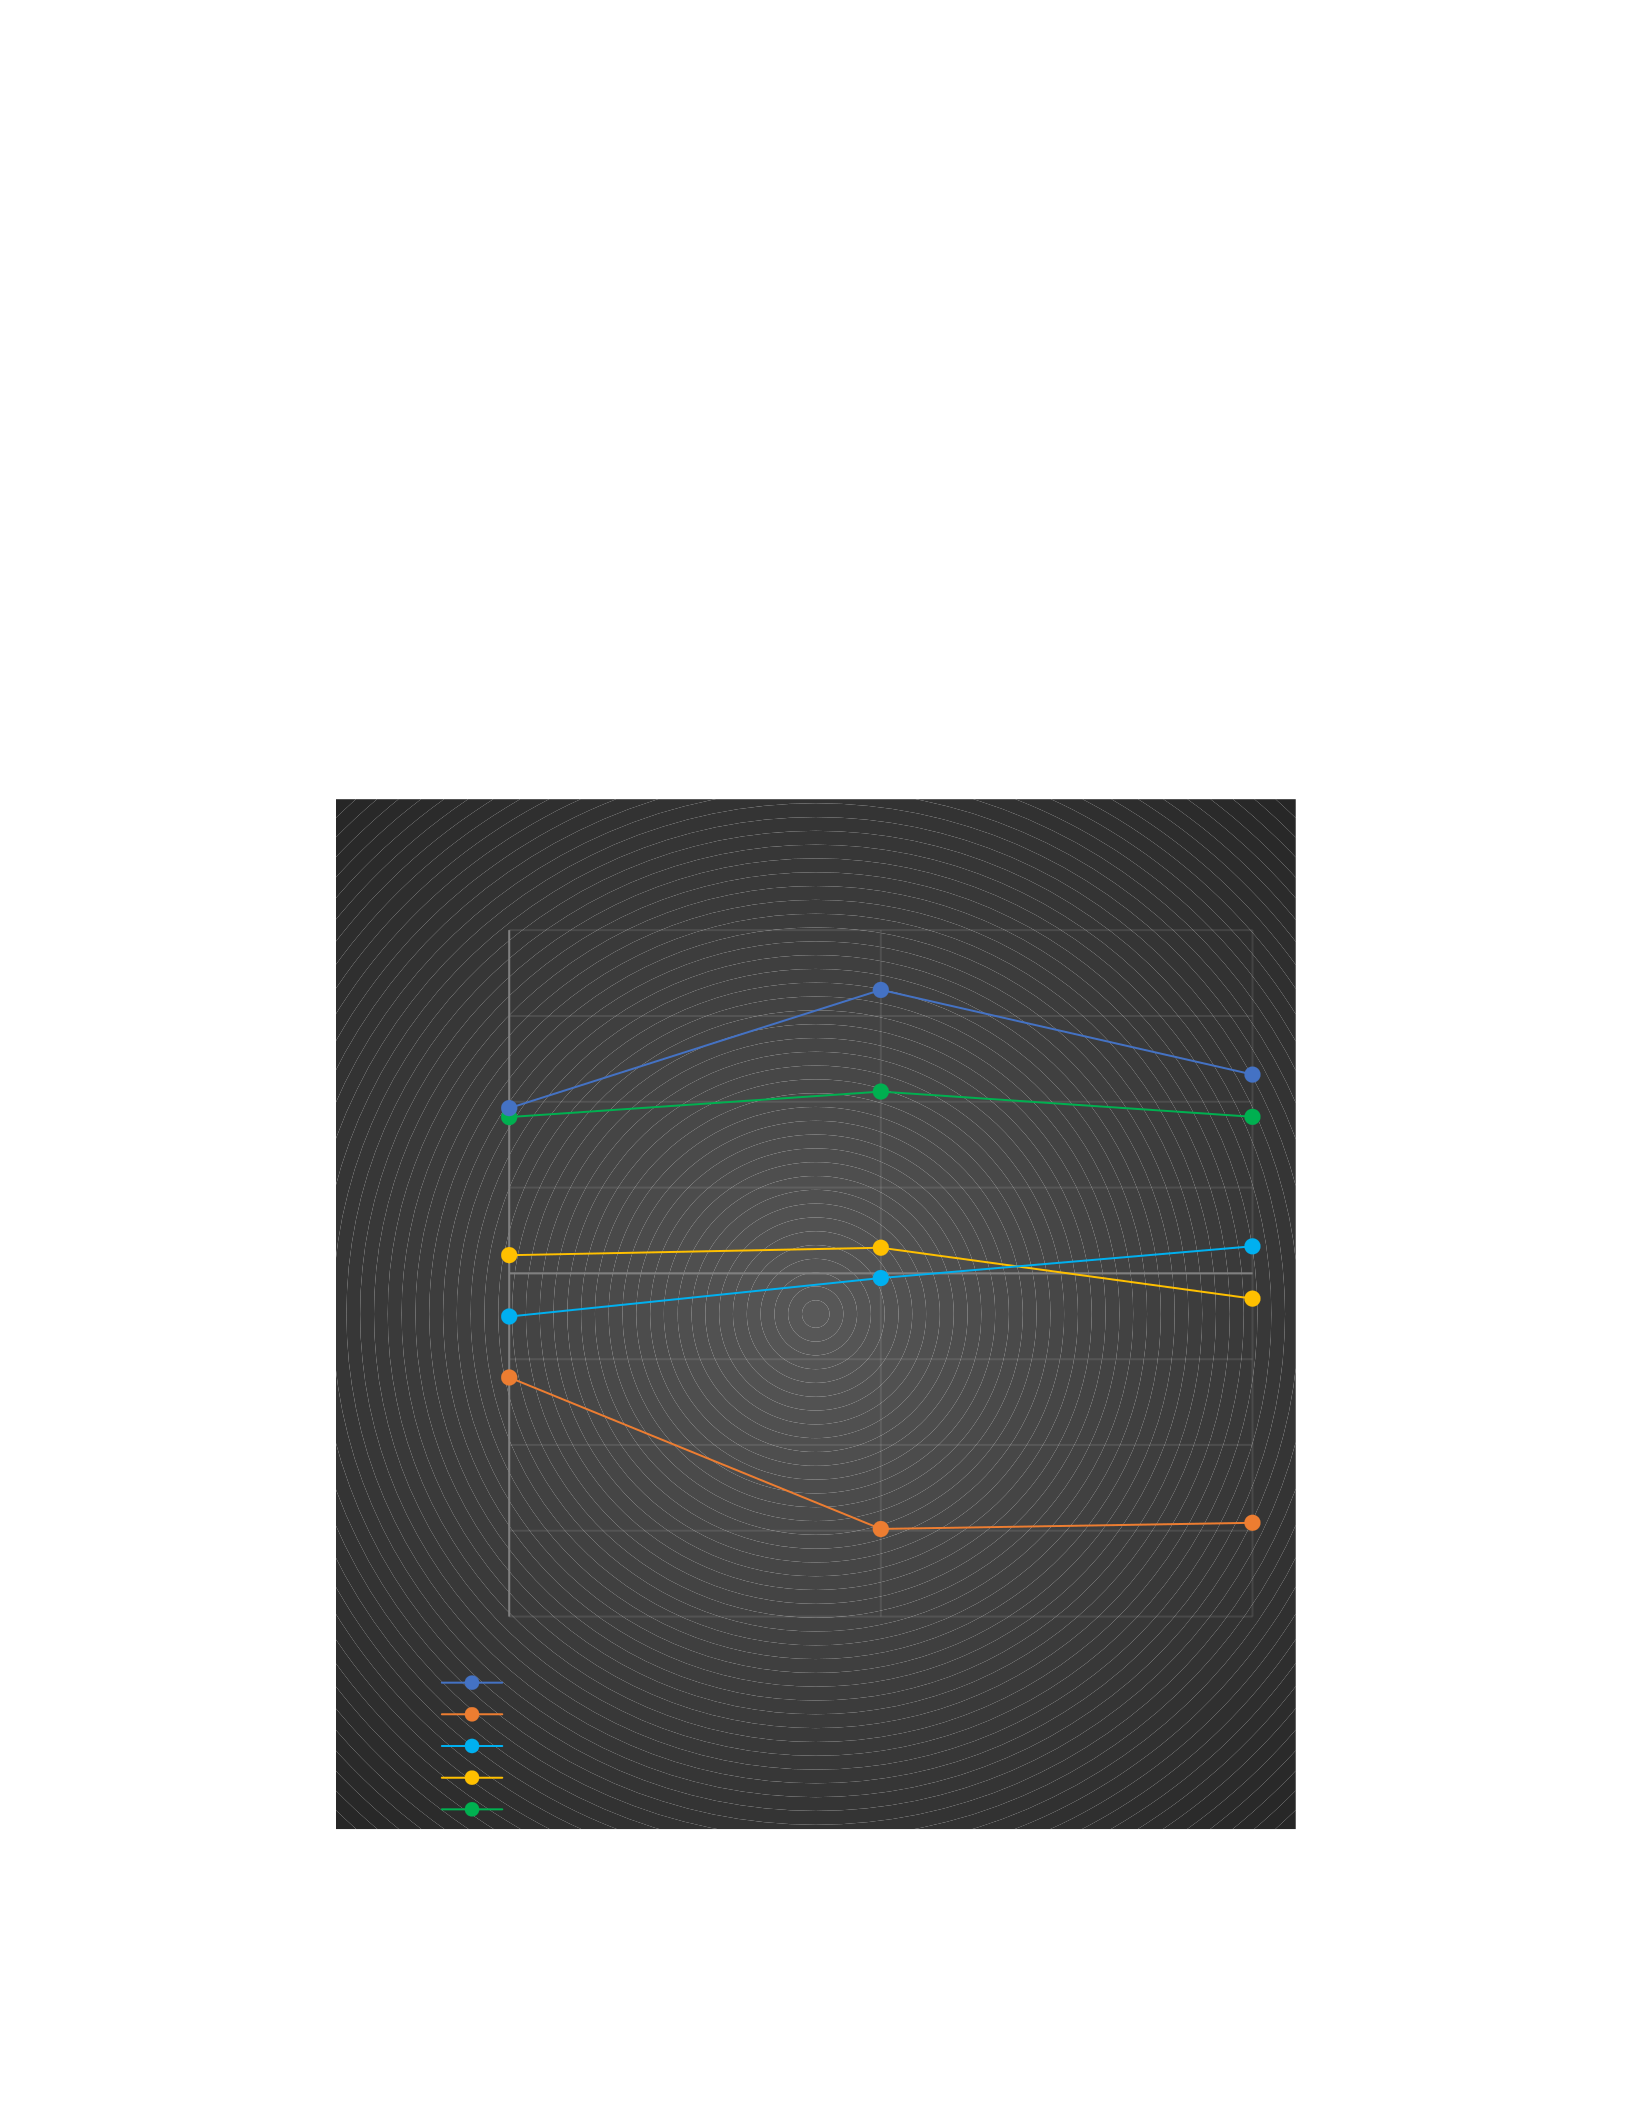
Amazon’s financial performance has improved over the years and the following charts show the
evolution of a few selected accounts from the financial statements that show financial trends. The first
chart shows how the company needed to issue debt due to the huge capital investments carried out and a
decrease in operating cash flows (Amazon.com, 2022). Operating cash decreased during 2021 relative to
2020, but 2020 was an atypical year due to the Covid pandemic and the strict lockdowns that fostered
online sales. Even though operational cash flows decreased 2021, their capital investments remained
almost the same at unprecedented levels. The following chart was elaborated using data from Amazon’s
10K annual report for 2021.
2019 2020 2021
-80000
-60000
-40000
-20000
0
20000
40000
60000
80000
Statement of Cash Flows
Net cash provided by (used in) operating activities
Net cash provided by (used in) investing activities
Net cash provided by (used in) financing activities
Net increase (decrease) in cash, cash equivalents, and restricted cash
Cash, cash equivalents, and restricted cash, end of period
in millions of US$
Amazon.com 11
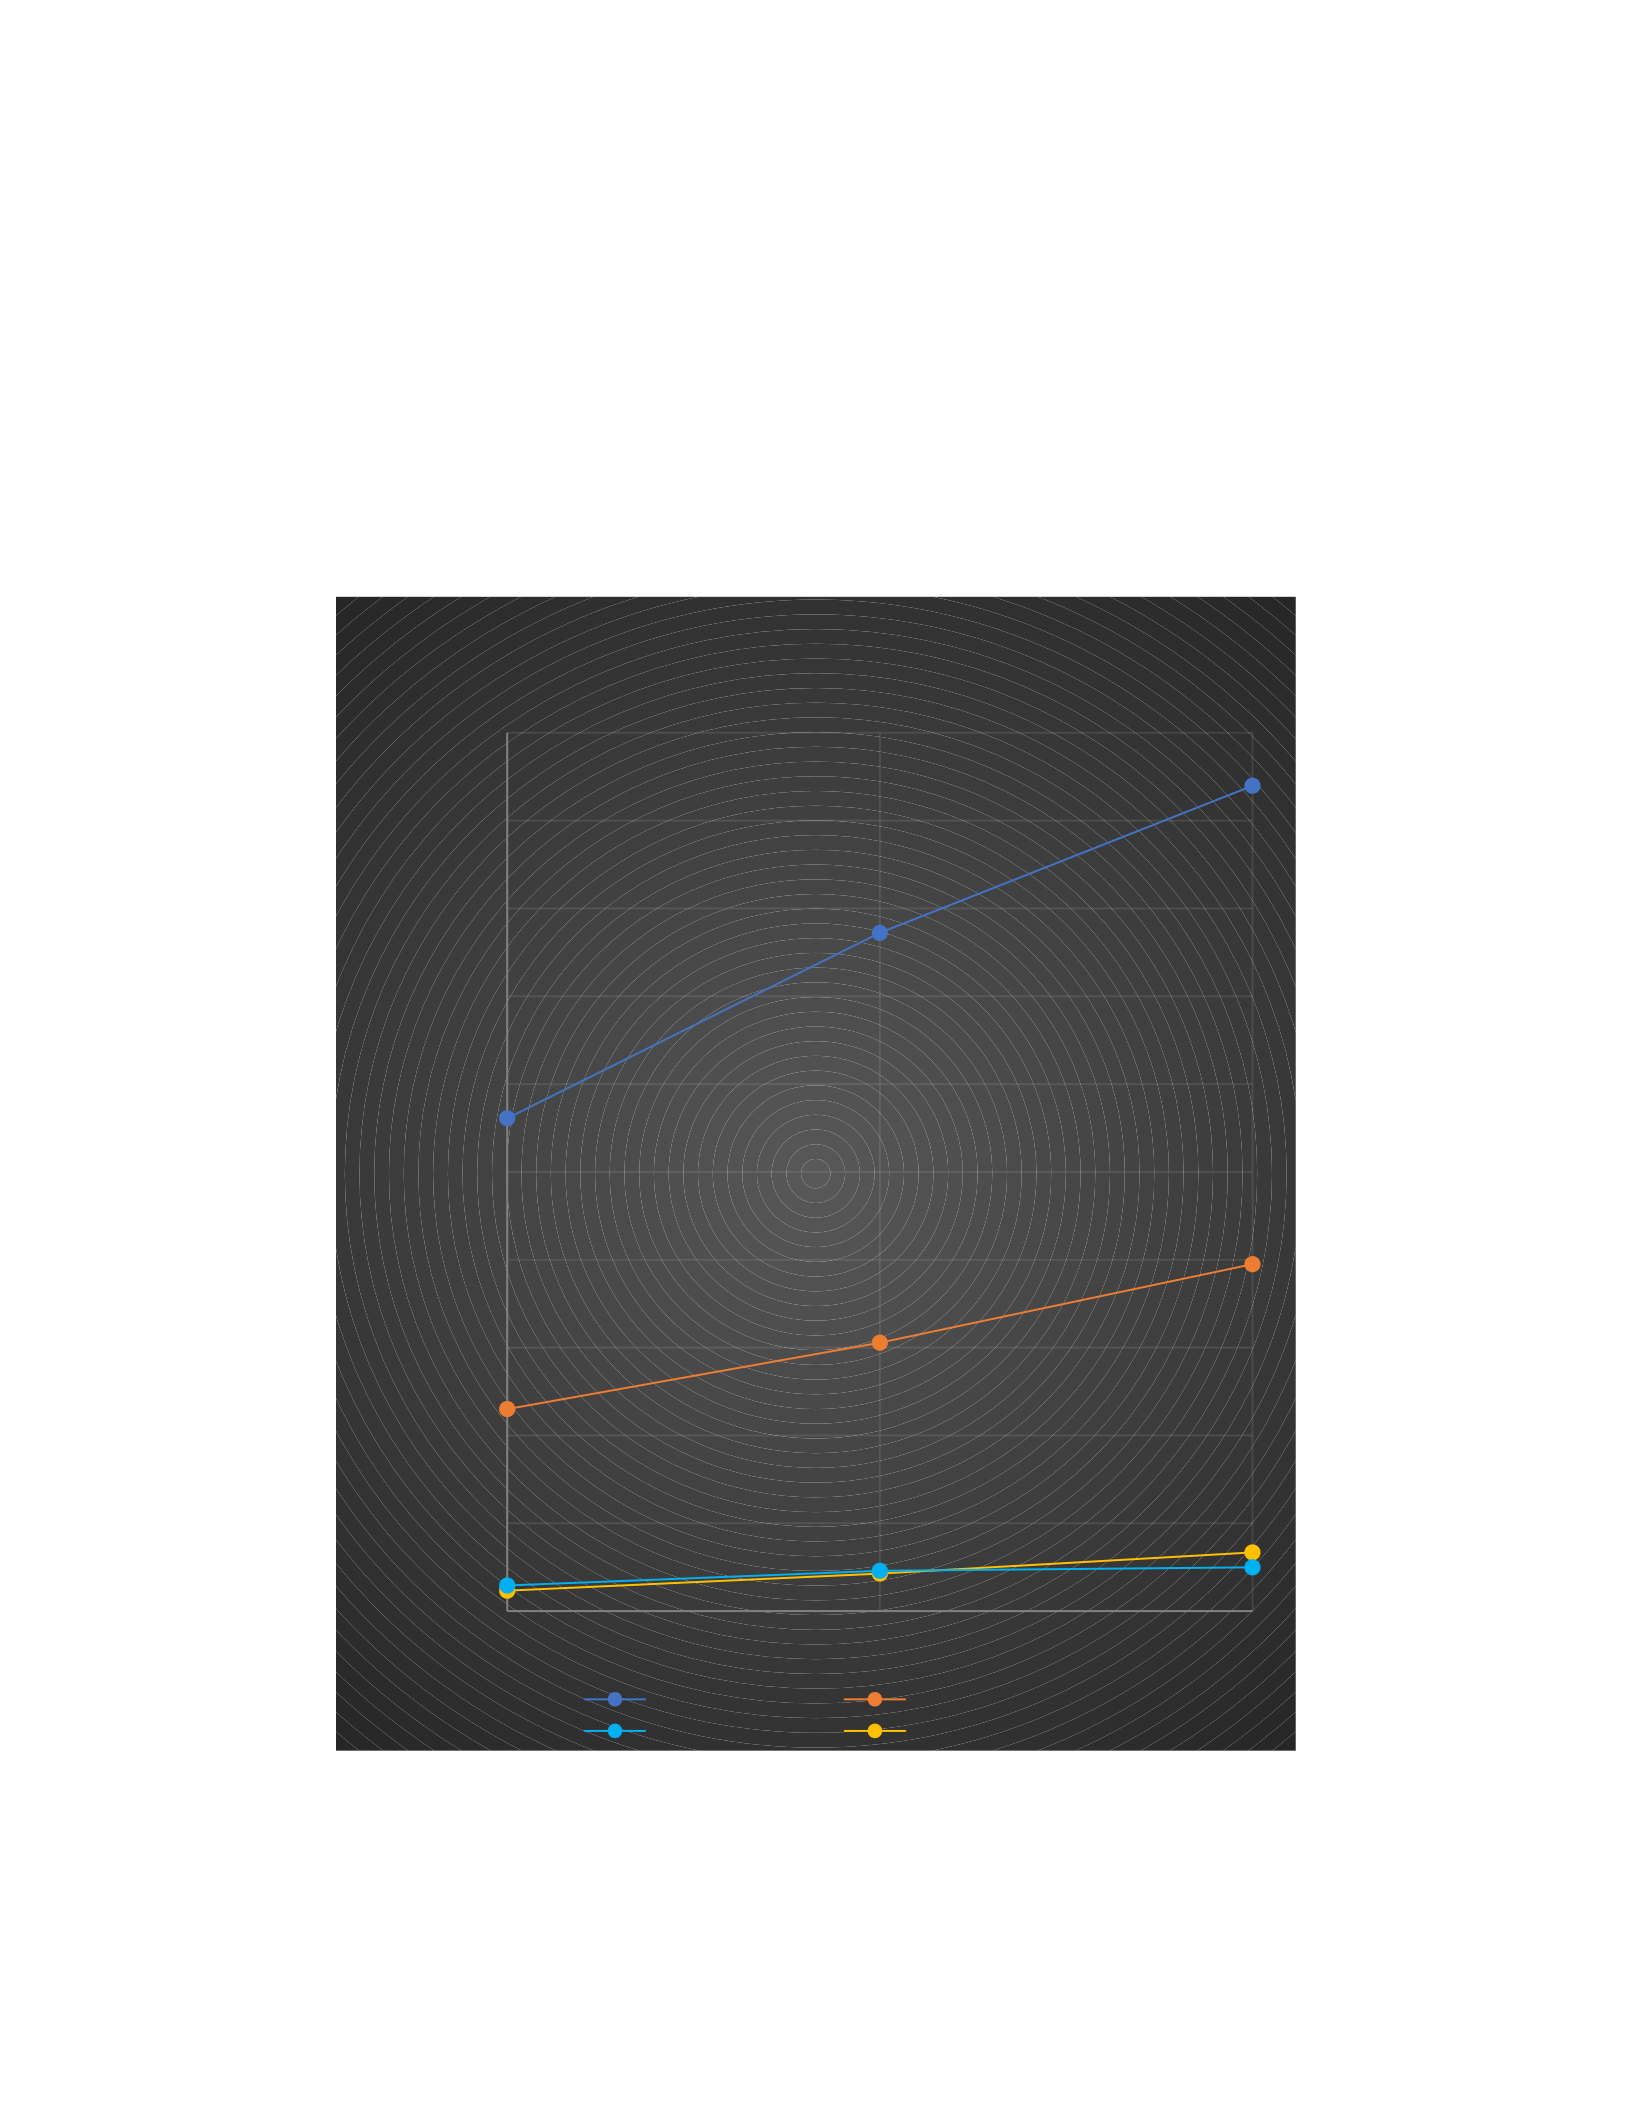
The following charts show the evolution of the company’s Statement of Operations. Total
revenues, gross income, operating income, and net income have increased over the past years. This is a
very positive trend since it shows that Amazon is selling more products and making more money every
year. During 2021, Amazon’s net income was higher than its operating income due to significant
increases in the profits received from investing in other companies. The following chart was elaborated
using data from Amazon’s 10K annual report for 2021.
2019 2020 2021
0
50000
100000
150000
200000
250000
300000
350000
400000
450000
500000
Statement of Operati ons
Total net sales Gross income
Operating income Net income
in millions of us$

Amazon.com 12
The company’s balance sheet accounts show a more solid financial position with assets and
equity growing at a much higher rate than liabilities. The following chart was elaborated using data from
Amazon’s 10K annual report for 2021.
2019 2020 2021
0
50000
100000
150000
200000
250000
300000
350000
400000
450000
Balance Sheet
Total assets Total liabilities
Total stockholders' equity
in millions of us$
The financial statements show that Amazon’s financial performed is steadily improving over the
past years. Profits are increasing, and the fact that Amazon does not distribute dividends helps them to
raise funds for expansion projects. When we look at the slope of how assets and liabilities are increasing,
assets are growing much faster. This should help the company consolidate its market position and finance
expansion projects that can help the firm overtake Walmart as the world’s largest retailer.
Amazon.com 13
Financial Ratios
Analysing financial ratios allows comparisons between Amazon’s annual performance based on
relative figures, not absolute numbers. It also allows for comparisons with other industry rivals.
Amazon’s financial ratios will be compared against Shopify’s, since it is the second largest online retailer
in the world. Shopify expects to manage over $400 billion in online sales during 2021 (Shopify, 2021),
but its business model is different. It provides a sales platform to other companies and charges for its
services. It doesn’t sell products directly to consumers. In order to determine if Amazon’s financial ratios
are good or bad, the best way is to compare them with the ratios of a direct competitor that trades its stock
in the same markets. The following table compares Amazon’s ratios against Shopify’s. It is normal that
some ratios will be better while other will be worse since they are different companies but comparing can
single major operating differences.
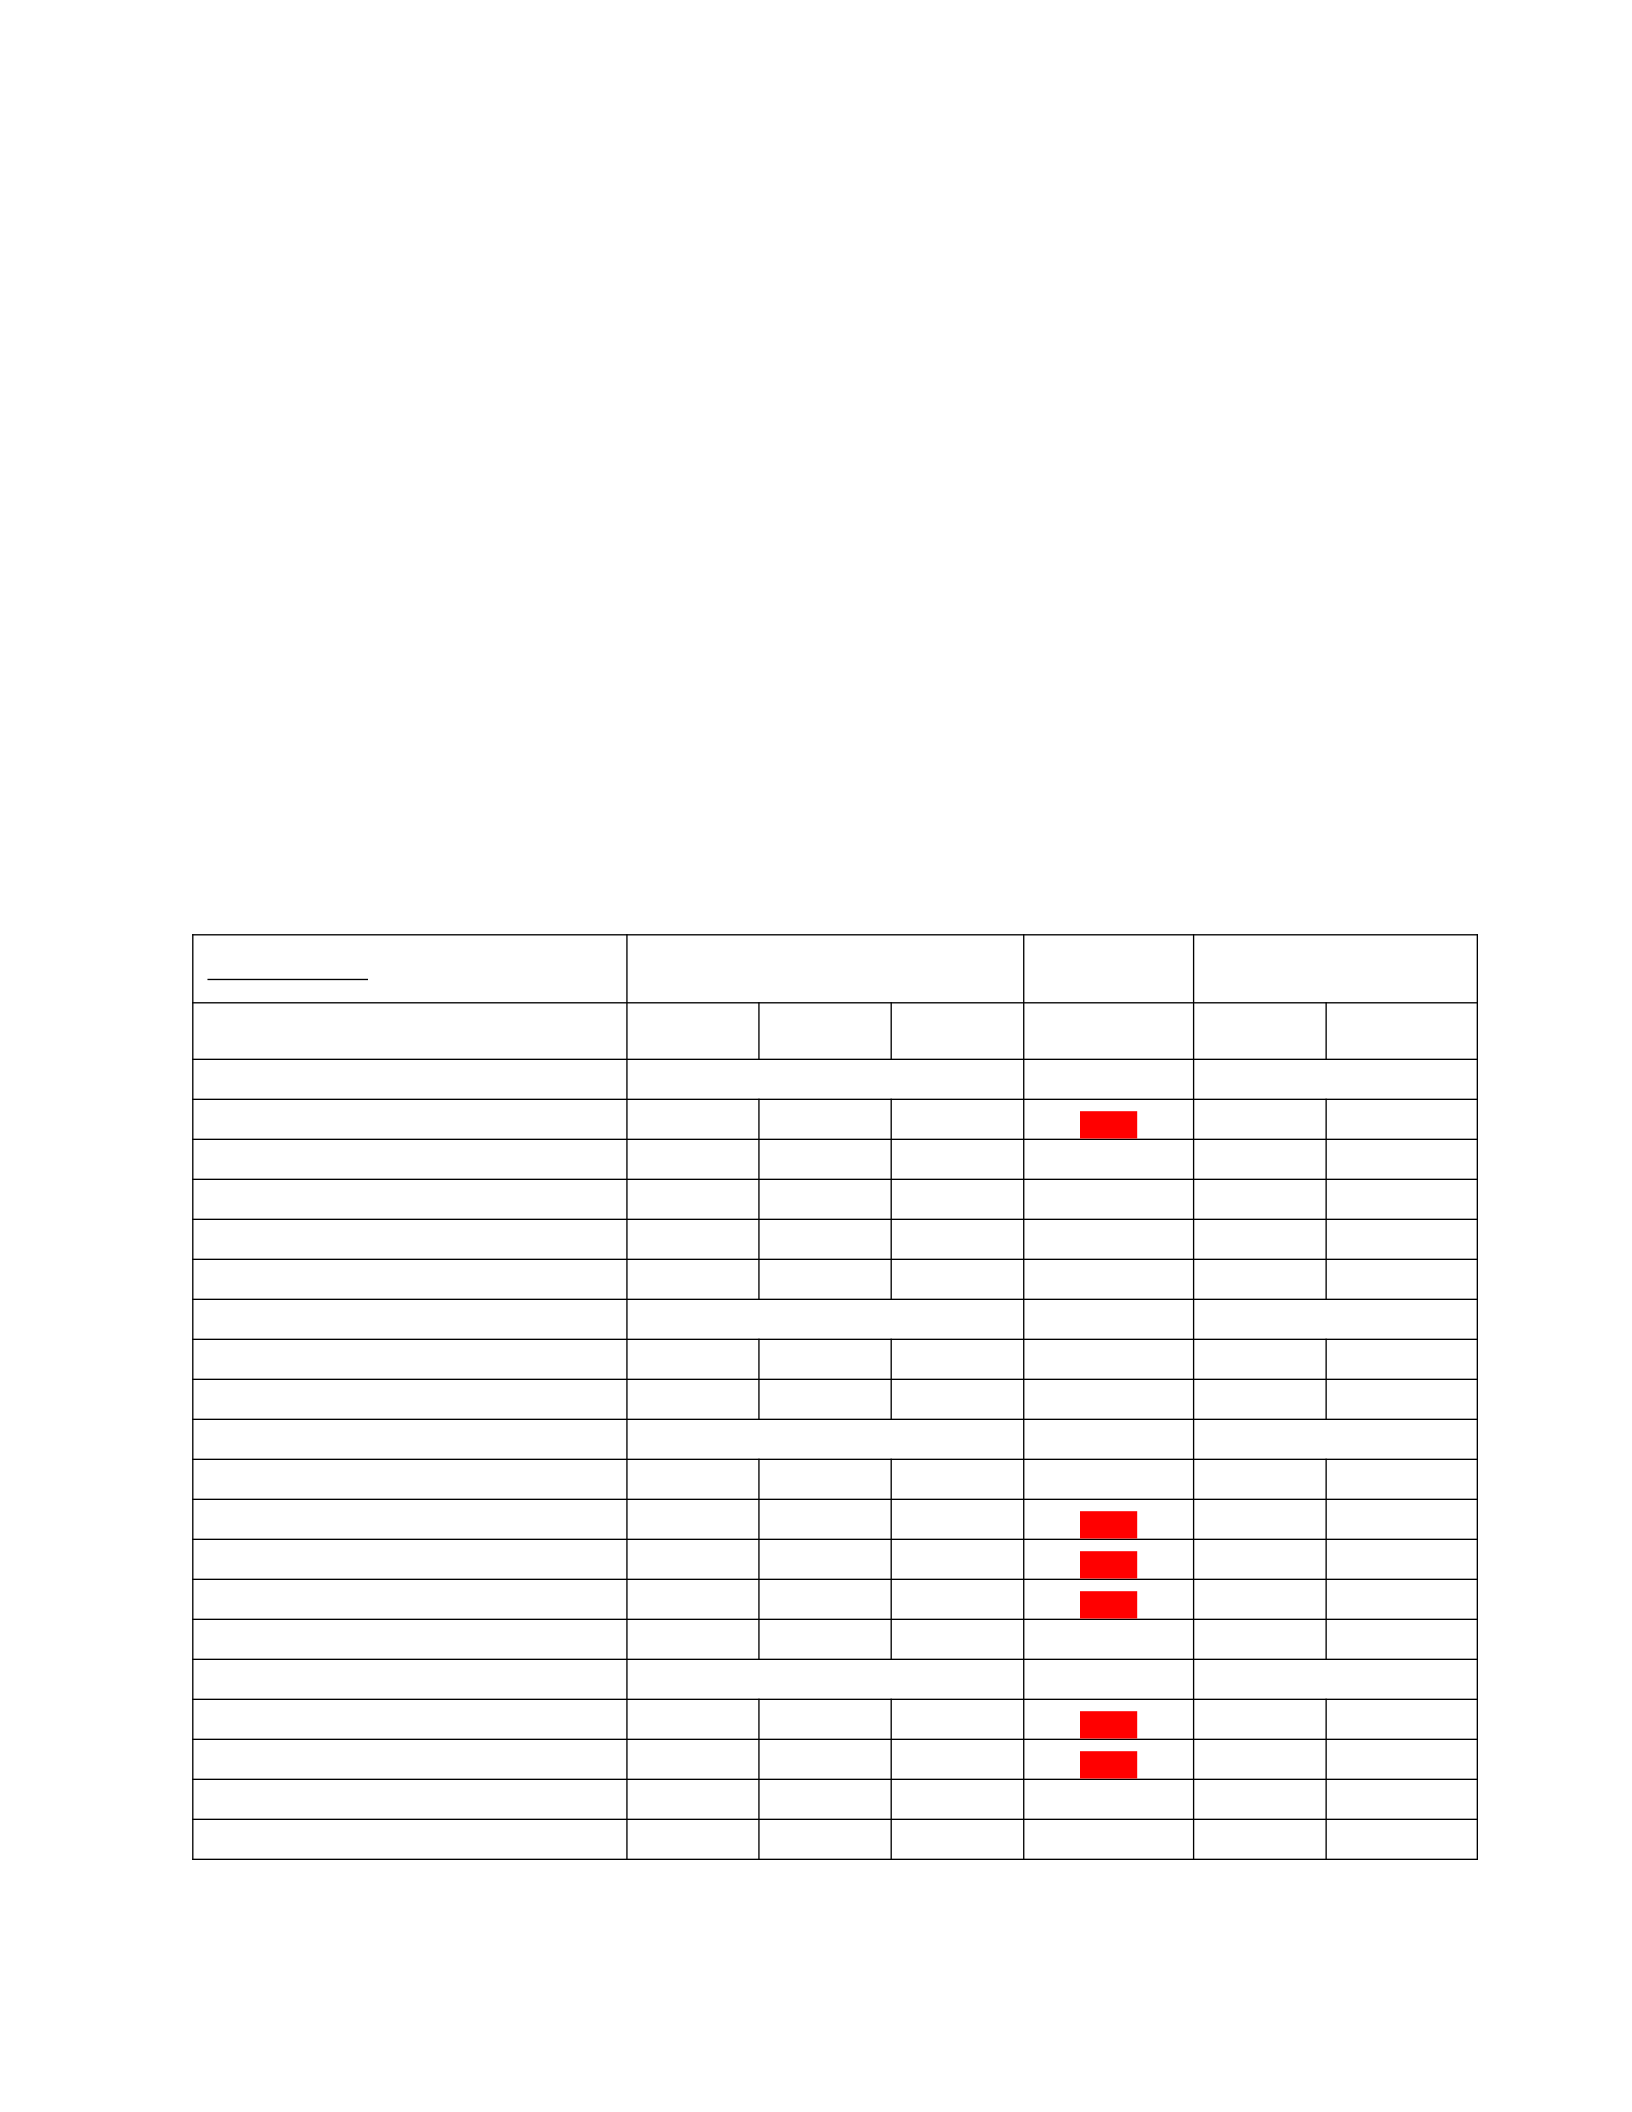
Financial ratios Amazon.com .Shopify
.
2021 2020 2019
Amazon's
performance 2020 2019
Profitability ratios . G G
Gross profit margin 42% 40% 41% worse 53% 78%
Operating profit margin 5% 6% 5% better 3% -164%
Profit margin 7% 6% 4% better 3% -356%
Return on equity 24% 23% 19% better 5% -4%
Return on assets 8% 7% 5% better 4% -4%
Liquidity ratios . G G G G
Current ratio 1.14 1.05 1.10 better 15.69 8.67
Acid test ratio 0.91 0.86 0.86 better 15.69 8.67
Activity ratios . G G
Inventory turnover ratio 8.34 9.80 8.08 NA NA NA
Accounts receivable turnover ratio 14.28 15.73 13.48 worse 24.26 17.43
Average collection period 25.55 23.20 27.08 worse 15.05 20.94
Fixed assets turnover 2.93 3.41 3.86 worse 31.81 14.17
Total assets turnover ratio 1.12 1.20 1.25 better 0.38 0.45
Leverage ratios . G G
Total debt to equity ratio 204% 244% 263% worse 21% 16%
Total debt to assets ratio 67% 71% 72% worse 0.18 0.14
Times interest earned ratio 18.28 20.97 18.93 better NA NA
Price earnings ratio 50.55 76.38 78.77 better 423.95 NA

Amazon.com 14
Amazon’s profitability ratios are much better and the only ratio that shows a worse performance
is the gross margin since Shopify does not sell any products itself. That is also the reason why it has no
inventory turnover ratio. Besides Amazon being much more profitable and having lower proportional
costs, it also generates more income per dollar invested in both equity and assets.
Amazon’s liquidity ratios are also better not because they are impressive, but because Shopify is
not using its current assets properly. Liquid ratios over 15 mean that the company is not managing its
assets adequately, and the company hasn’t disclosed any acquisition plans nor has significant debts that it
can repay (Shopify, 2021).
Activity ratios show mixed results since Shopify is able to collect its receivables faster, even
though Amazon’s are not bad ratios. Simply Shopify is very efficient since it charges most sales using
credit cards and has very few fixed assets, while Amazon’s web services (AWS) are sales on credit and
they represent almost half of total sales (Amazon.com, 2022). Amazon’s uses its total assets much more
efficiently than Shopify does, and it also shows that Shopify is not managing its assets correctly.
Amazon’s debts are significant although the y have been decreasing, which is a positive sign. On
the other hand, Shopify is mostly financed through equity which decreases its operating expenses but also
results in lower profitability. Even though Amazon’s debt is significant, it is also able to generate profits
that can cover them. On the other hand, Shopify has very low debts, but it isn’t able to generate operating
profits, and that is not sustainable. 2020 was a great year for both companies and it would be necessary to
check how Shopify operated without mandatory lockdowns.
Amazon’s P/E ratios are high, but they have been decreasing. This means that the market
considers that it is a consolidated company, and it is good because it shows that it is not necessarily
overvalued (Mishkin, 2021). On the other hand, a P/E ratio of over 400 is clearly extremely high.
Theoretically, it would take Shopify centuries of earnings to justify its stock price. 2020 represent a
milestone for Shopify since it was finally able to make a profit, but I consider that the market probably
overreacted to the positive news.

Amazon.com 15
It is not easy to find a company to compare Amazon with. Shopify’s business model is different
since it manages 1.7 million different websites that other companies operate, but at the same time, it is the
only company whose online sales are even close to Amazon’s. The rest of the major online retailers
including Amazon, Ebay, or Best Buy are dwarfed by Amazon. Comparing them to Amazon is like
comparing an elephant to an ant. Walmart is still America’s largest retailer, but the vast majority of its
sales take place on their brick-and-mortar stores.
Alternative Strategies
Amazon is the world’s leader in online retailing, and it has been growing at very high rates over
the past years and it has also established a large and efficient network of distribution centers. In order for
the company to boost earnings and increase annual revenues, it should follow the following strategies:
1. Expand Whole Foods supermarkets from current 500 locations (Whole Foods, 2022) to at least
2,000 in the next 5 years. This way, the company could be better suited to compete against large
brick-and-mortar chains like Walmart, Target, or Kroger.
2. Expand Amazon Web Services (AWS) to include providing platform services to online retailers
instead of requiring them to sell on Amazon’s platform. In order to differentiate themselves from
Shopify; Amazon can include its own delivery services benefiting from its extensive logistics
network.
The advantages of implementing both strategies is that they are complements to Amazon’s
existing services. Expanding Whole Foods would also increase Amazon’s brand awareness since the
company is associated to organic products and a healthy lifestyle (Whole Foods, 2022). The disadvantage
of expanding Whole Foods supermarkets is that it requires a significant investment. It will also result in
the reallocation of financial resources that will shift from online services to traditional retailing.
Trying to compete directly with Shopify’s model is advantageous because it has the potential to
increase overall sales by hundreds of billions per year and the cost of implementing the new project will
be much lower than the first alternative. On the other hand, the disadvantage of implementing this new
project is potential cannibalization of sales that shift from Amazon’s platform to individual’s companies’
website. I believe that this alternative yields the highest cost-benefit ratio since the cost of implementing
the project is low while the potential for increasing revenues is approximately 5% per year. Amazon

Amazon.com 16
profits can be higher than Shopify’s since it can provide its logistics services and charge for them, while
Shopify is limited to provided online services only (Shopify, 2022) which decreases their operating
margins.
Projected Financial Statements
The following table summarizes the effects of implementing the new project vs operating in the
same manner. The complete projected financial statements are in the attached Excel spreadsheet.
AMAZON.COM, INC.
FORECASTED CONSOLIDATED STATEMENTS OF CASH FLOWS
(in millions)
. Year Ended December 31,
.2026 2025 2024 2023 2022
.Without
NP
With NP Withou
t NP
With NP Withou
t NP
With
NP
Without
NP
With
NP
Withou
t NP
With NP
CASH, CASH EQUIVALENTS,
AND RESTRICTED CASH,
BEGINNING OF PERIOD
$22,289 $127,335 $12,493 $61,758 $2,697 $29,618 $15,352 $23,188 $36,220 $36,220
OPERATING ACTIVITIES: G G G G G G G G G G
Net income $75,703 $194,936 $61,779 $143,817 $49,811 $102,700 $39,550 $69,842 $30,782 $43,785
Adjustments to reconcile net income
to net cash from operating activities:
$32,256 $39,560 $26,880 $31,648 $22,400 $25,318 $18,667 $20,255 $15,556 $16,204
Net cash provided by (used in)
operating activities
$107,960 $234,496 $88,660 $175,465 $72,211 $128,018 $58,217 $90,097 $46,337 $59,989
GG G G G G G G G G G
INVESTING ACTIVITIES: G G G G G G G G G G
Net cash provided by (used in)
investing activities
-$74,221 -$116,968 -$70,687 -$101,712 -$67,321 -$88,445 -$64,115 -$76,909 -$61,062 -$66,877
GG G G G G G G G G
FINANCING ACTIVITIES: G G G G G G G G G G
Net cash provided by (used in)
financing activities
-$8,995 -$8,995 -$8,177 -$8,177 -$7,434 -$7,434 -$6,758 -$6,758 -$6,144 -$6,144
GG G G G G G G G G G
Net increase (decrease) in cash, cash
equivalents, and restricted cash
$24,744 $108,533 $9,796 $65,576 -$2,544 $32,140 -$12,656 $6,430 -$20,868 -$13,032
CASH, CASH EQUIVALENTS,
AND RESTRICTED CASH, END
OF PERIOD
$47,033 $235,868 $22,289 $127,335 $153 $61,758 $2,697 $29,618 $15,352 $23,188

Amazon.com 17
AMAZON.COM, INC.
FORECASTED CONSOLIDATED STATEMENTS OF OPERATIONS
(in millions, except per share data)
.Year Ended December 31,
.2026 2025 2024 2023 2022
.Without
NP
With NP Without
NP
With NP Without
NP
With NP Without
NP
With NP Without NP With NP
Total net sales $827,987 $1,030,060 $739,274 $880,393 $660,066 $752,473 $589,345 $643,139 $526,201 $549,692
Cost of sales $500,242 $500,242 $446,644 $446,644 $398,790 $398,790 $356,062 $356,062 $317,913 $317,913
Gross margin $327,745 $529,819 $292,630 $433,749 $261,276 $353,683 $233,283 $287,077 $208,288 $231,779
Operating expenses $260,728 $326,535 $240,081 $287,443 $221,069 $253,031 $203,563 $222,738 $187,443 $196,072
Operating income $67,017 $203,283 $52,549 $146,306 $40,207 $100,653 $29,720 $64,339 $20,845 $35,707
Total non-operating income
(expense)
$19,501 $19,501 $18,056 $18,056 $16,719 $16,719 $15,480 $15,480 $14,334 $14,334
Income before income taxes $86,518 $222,784 $70,605 $164,363 $56,926 $117,372 $45,200 $79,819 $35,179 $50,040
Provision for income taxes $10,815 $27,848 $8,826 $20,545 $7,116 $14,671 $5,650 $9,977 $4,397 $6,255
Net income $75,703 $194,936 $61,779 $143,817 $49,811 $102,700 $39,550 $69,842 $30,782 $43,785
AMAZON.COM, INC.
FORECASTED CONSOLIDATED BALANCE SHEETS
(in millions, except per share data)
. December 31,
.2026 2025 2024 2023 2022
.Without
NP
With
NP
Withou
t NP
With
NP
Withou
t NP
With
NP
Withou
t NP
With NP Withou
t NP
With
NP
ASSETS G G G G G G G G G G
Current assets: G GGGGGGG GG
Cash and cash equivalents $47.033 $235.86
8
$22.289 $127.33
5
$153 $61.758 $2.697 $29.618 $15.352 $23.188
Total current assets $431.948 $431.94
8
$354.83
2
$354.83
2
$291.48
3
$291.48
3
$239.44
5
$239.445 $196.69
6
$196.69
6
Property and equipment, net $345.898 $436.72
9
$310.11
0
$368.28
6
$273.88
0
$307.49
5
$236.99
1
$253.216 $199.20
8
$204.44
2
Other non-current assets $119.956 $119.95
6
$114.24
4
$114.24
4
$108.80
4
$108.80
4
$103.62
2
$103.622 $98.688 $98.688
Total assets $897.801 $988.63
2
$779.18
6
$837.36
1
$674.16
7
$707.78
2
$580.05
8
$596.283 $494.59
3
$499.82
7
GGGGGGGG GGG
LIABILITIES AND
STOCKHOLDERS' EQUITY
GGGGGGG GGG
Current liabilities $354.003 $354.00
3
$295.00
3
$295.00
3
$245.83
6
$245.83
6
$204.86
3
$204.863 $170.71
9
$170.71
9
Long-term debt $108.953 $168.33
7
$99.048 $140.28
1
$90.043 $116.90
1
$81.858 $97.417 $74.416 $81.181
Total liabilities $462.956 $522.34
1
$394.05
1
$435.28
4
$335.87
9
$362.73
7
$286.72
1
$302.280 $245.13
5
$251.90
0
.G G G G G G G G G G
Stockholders' equity $434.845 $466.29
2
$385.13
5
$402.07
7
$338.28
8
$345.04
5
$293.33
7
$294.002 $249.45
7
$247.92
6
GG G G G G G G G G
Total liabilities and stockholders'
equity
$897.801 $988.63
2
$779.18
6
$837.36
1
$674.16
7
$707.78
2
$580.05
8
$596.283 $494.59
3
$499.82
7

Amazon.com 18
The following table summarizes the effects of carrying out the new expansion project vs continuing to
operate without it.
Financial ratios Amazon.com
2026 2025 2024 2023 2022
Withou
t NP
With
NP
Without
NP
With
NP
Withou
t NP
With
NP
Withou
t NP
With
NP
Withou
t NP
With
NP
Profitability ratios . . . . .
Gross profit margin
39.6% 51.4% 39.6% 49.3% 39.6% 47.0% 39.6% 44.6% 39.6% 42.2%
Operating profit margin
8.1% 19.7% 7.1% 16.6% 6.1% 13.4% 5.0% 10.0% 4.0% 6.5%
Profit margin
9.1% 18.9% 8.4% 16.3% 7.5% 13.6% 6.7% 10.9% 5.8% 8.0%
Return on equity
17.4% 41.8% 16.0% 35.8% 14.7% 29.8% 13.5% 23.8% 12.3% 17.7%
Return on assets
8.4% 19.7% 7.9% 17.2% 7.4% 14.5% 6.8% 11.7% 6.2% 8.8%
Liquidity ratios . . . . .
Current ratio
1.22 1.22 1.20 1.20 1.19 1.19 1.17 1.17 1.15 1.15
Activity ratios . . . . .
Fixed assets turnover
2.4 2.4 2.4 2.4 2.4 2.4 2.5 2.5 2.6 2.7
Total assets turnover
ratio
0.9 1.0 0.9 1.1 1.0 1.1 1.0 1.1 1.1 1.1
Leverage ratios . . . . .
Total debt to equity ratio
1.1 1.1 1.0 1.1 1.0 1.1 1.0 1.0 1.0 1.0
Total debt to assets ratio
0.52 0.53 0.51 0.52 0.50 0.51 0.49 0.51 0.50 0.50
We can observe that carrying out the expansion project and increasing online services provided
will affect profitability ratios positively. Amazon’s business model is based on low-prices and low-costs
and expanding its offer will increase its profitability since revenues will increase as a higher rate than
relevant costs. Other financial ratios like liquidity, activity, and leverage are barely affected by the new
project.
NPV or Enterprise Value

Amazon.com 19
The most popular method used to determine a corporation’s enterprise value is the discounted
cash flow method which basically discounts future cash flows by the company’s discount rate (Mishkin,
2021). In this case, the discount factor was determined by historic risk-free rates and market premiums
which are 3.5% and 6.5% respectively. The company’s beta was obtained from Yahoo Finance, and it is
1.13. Using the CAPM formula, Amazon’s discount rate = 3.5% + 6%*1.13 = 10.28%.
The company’s enterprise value without the proposed expansion project will assume and
investment cost of $0, while the enterprise value with the expansion project will assume an initial
investment of $8.723 billion which represents the difference in capital expenditures required to start this
project.
AMAZON.COM, INC.
ENTERPRISE VALUE
(in millions)
. .
.
Year Ended December 31,
.2021 2022 2023 2024 2025 2026
.Without
NP
With NP Without
NP
With
NP
Without
NP
With
NP
Without
NP
With
NP
Without
NP
With
NP
Without
NP
With
NP
Initial investment $ - -$8,723 G G ....... .
G G G G G G G G G G G G G
Operating cash
flows
G G $46,337 $59,989 $58,217 $90,097 $72,211 $128,01
8
$88,660 $175,465 G G
G G G . . . . . . . . . .
Terminal value G G ........$107,960 $234,496
Terminal value at
year 5
G G . . . . . . . . $1,050,190 $2,281,092
G G G
Discount rate G G 10.28% 10.28% 10.28% 10.28% 10.28% 10.28% 10.28% 10.28% 10.28% 10.28%
Discount factor G G 1.10 1.10 1.22 1.22 1.34 1.34 1.48 1.48 1.63 1.63
G G G G G G G G G G G G G
Discounted cash
flows
G G $42,018 $54,397 $47,869 $74,082 $53,841 $95,451 $59,943 $118,633 $643,849 $1,398,489
NPV $847,520 $1,732,329 G G G G G G G G G G
Carrying out the new expansion project actually results in an enterprise similar to the current
market capitalization value. Amazon’s market capitalization value on February 24, 2022 is $1.54 trillion
(Yahoo Finance, 2022a). There is a technical limitation to calculating the terminal value since eventually
the company’s growth rate will start to decrease and settle in much lower numbers (Brigham and

Amazon.com 20
Ehrhardt, 2019). But determining when this will happen is very complicated and not even professional
analysts agree upon possible future growth rates (Yahoo Finance, 2022a).
Implementation Strategy
Probably the most important reason why I believe that this expansion strategy is feasible is that
Amazon already provides the services separately and only to major clients (Amazon.com, 2022).
Expanding its operations to offer the new services to smaller firms will require a significant investment
and additional infrastructures, but it is not something unrealistic for a company of this size.
The project could start almost immediately since the company’s current facilities can handle the
first months of operations. As the new project gains traction and attracts more firms, Amazon will require
a larger infrastructure including larger servers and larger distribution centers. The company should be
able to carry out the necessary expansions within a six-month period.
Recommended Strategy
Amazon’s is the world’s leader in online retailing, but it is trailing Shopify in providing services
to companies that do not want to sell on third-party platforms like Amazon or Ebay. Shopify has been
very successful even though its operations are mostly limited to North America (small international
presence), and it lacks the logistics capacity to provide complementary services that can be more
profitable (Shopify, 2022). On the other hand, Amazon has a much larger international presence and has
the resources to offer full services. Amazon’s long-term strategy would be to capture at least 50% of
Shopify’s market and double those sales in international markets where Amazon’s presence is very
strong. This project will allow the company to use its operational capacity at almost 100% and will yield a
significant increase in profits since costs will increase at a proportionally lower rate than revenues. In
other words, Amazon will benefit from economies of scale (Brigham and Ehrhardt, 2019). The main
challenge is to avoid cannibalization of services. Amazon should cater these new services to new
customers which are generally smaller, and do not offer their services in Amazon’s platform already. It
can also offer both services: selling products on their platform and providing external services.

Amazon.com 21
References
Amazon.com. (2022). Amazon.com, Inc. - SEC filings. Amazon.
https://ir.aboutamazon.com/sec-filings/default.aspx
Anh, T. (2019). Artificial intelligence in e-commerce: Case Amazon.
Berman, J. (2019). FedEx will not renew Express US domestic contract with Amazon: Company says it is
a strategic decision, with a focus on serving broader e-commerce customers. Logistics
Management (Highlands Ranch, Co.),G58(7), 13-15.
Brigham, E. F., & Ehrhardt, M. C. (2019). Financial Management: Theory & Practice (16th ed.).
Cengage Learning.
Cattero, B., & D’Onofrio, M. (2018). Organising and collective bargaining in the digitised "tertiary
factories" of Amazon: a comparison between Germany and Italy. InGWorking in digital and smart
organisationsG(pp. 141-164). Palgrave Macmillan, Cham.
Ives, B., Cossick, K., & Adams, D. (2019). Amazon Go: disrupting retail?.GJournal of Information
Technology Teaching Cases,G9(1), 2-12.
Mishkin, F. S. E. (2021). Financial Markets & Institutions (9th ed.). Pearson.
Robischon, N. O. A. H. (2017). Why Amazon is the world's most innovative company of 2017.GFast
Company Magazine,G2.
Sadq, Z. M., Sabir, H. N., & Saeed, V. S. H. (2018). Analysing the Amazon success strategies.GJournal of
process management and new technologies,G6(4).
Shopify, Inc. (2021). Shopify - Financials. Shopify.
https://investors.shopify.com/financial-reports/default.aspx

Amazon.com 22
Whole Foods. (2022). Whole Foods. https://eu.wholefoodsmarket.com/?
destination=www.wholefoodsmarket.com%2F
Yahoo Finance. (2022a). Amazon.com, Inc. (AMZN). https://finance.yahoo.com/quote/AMZN?
p=AMZN&.tsrc=fin-srch
Yahoo Finance. (2022b). Shopify Inc. (SHOP). https://finance.yahoo.com/quote/SHOP/history?
period1=1549843200&period2=1613001600&interval=1d&filter=history&frequency=1d&includ
eAdjustedClose=true
Amazon.com 23
Appendices
Amazon.com 24

