Expected Return of a Security and Its Risk
Financial Management
Major risk involved in a security is systematic risk and greater the relevant risk of that security,
the greater the return required. In other words, the required rate of return for a security is equal to
the return required by the market for a riskless investment plus a risk premium.
The risk premium is the function of:
(1) The expected market return less the risk-free rate, which represents the risk premium
required for the typical security in the market; and
(2) The beta coefficient.
Relationship between and individual security’s expected return and its systematic risk can
be expressed with the help of the following formula:
We can take an example to explain the relationship. Suppose, the expected return on Treasury
securities is 10%, the expected return in the market portfolio is 15% and the beta of a company is
1.5. The beta indicates that A has more systematic risk than the typical security (i.e., a security
with a beta of 1.0).
The required return on A’s stock would be:
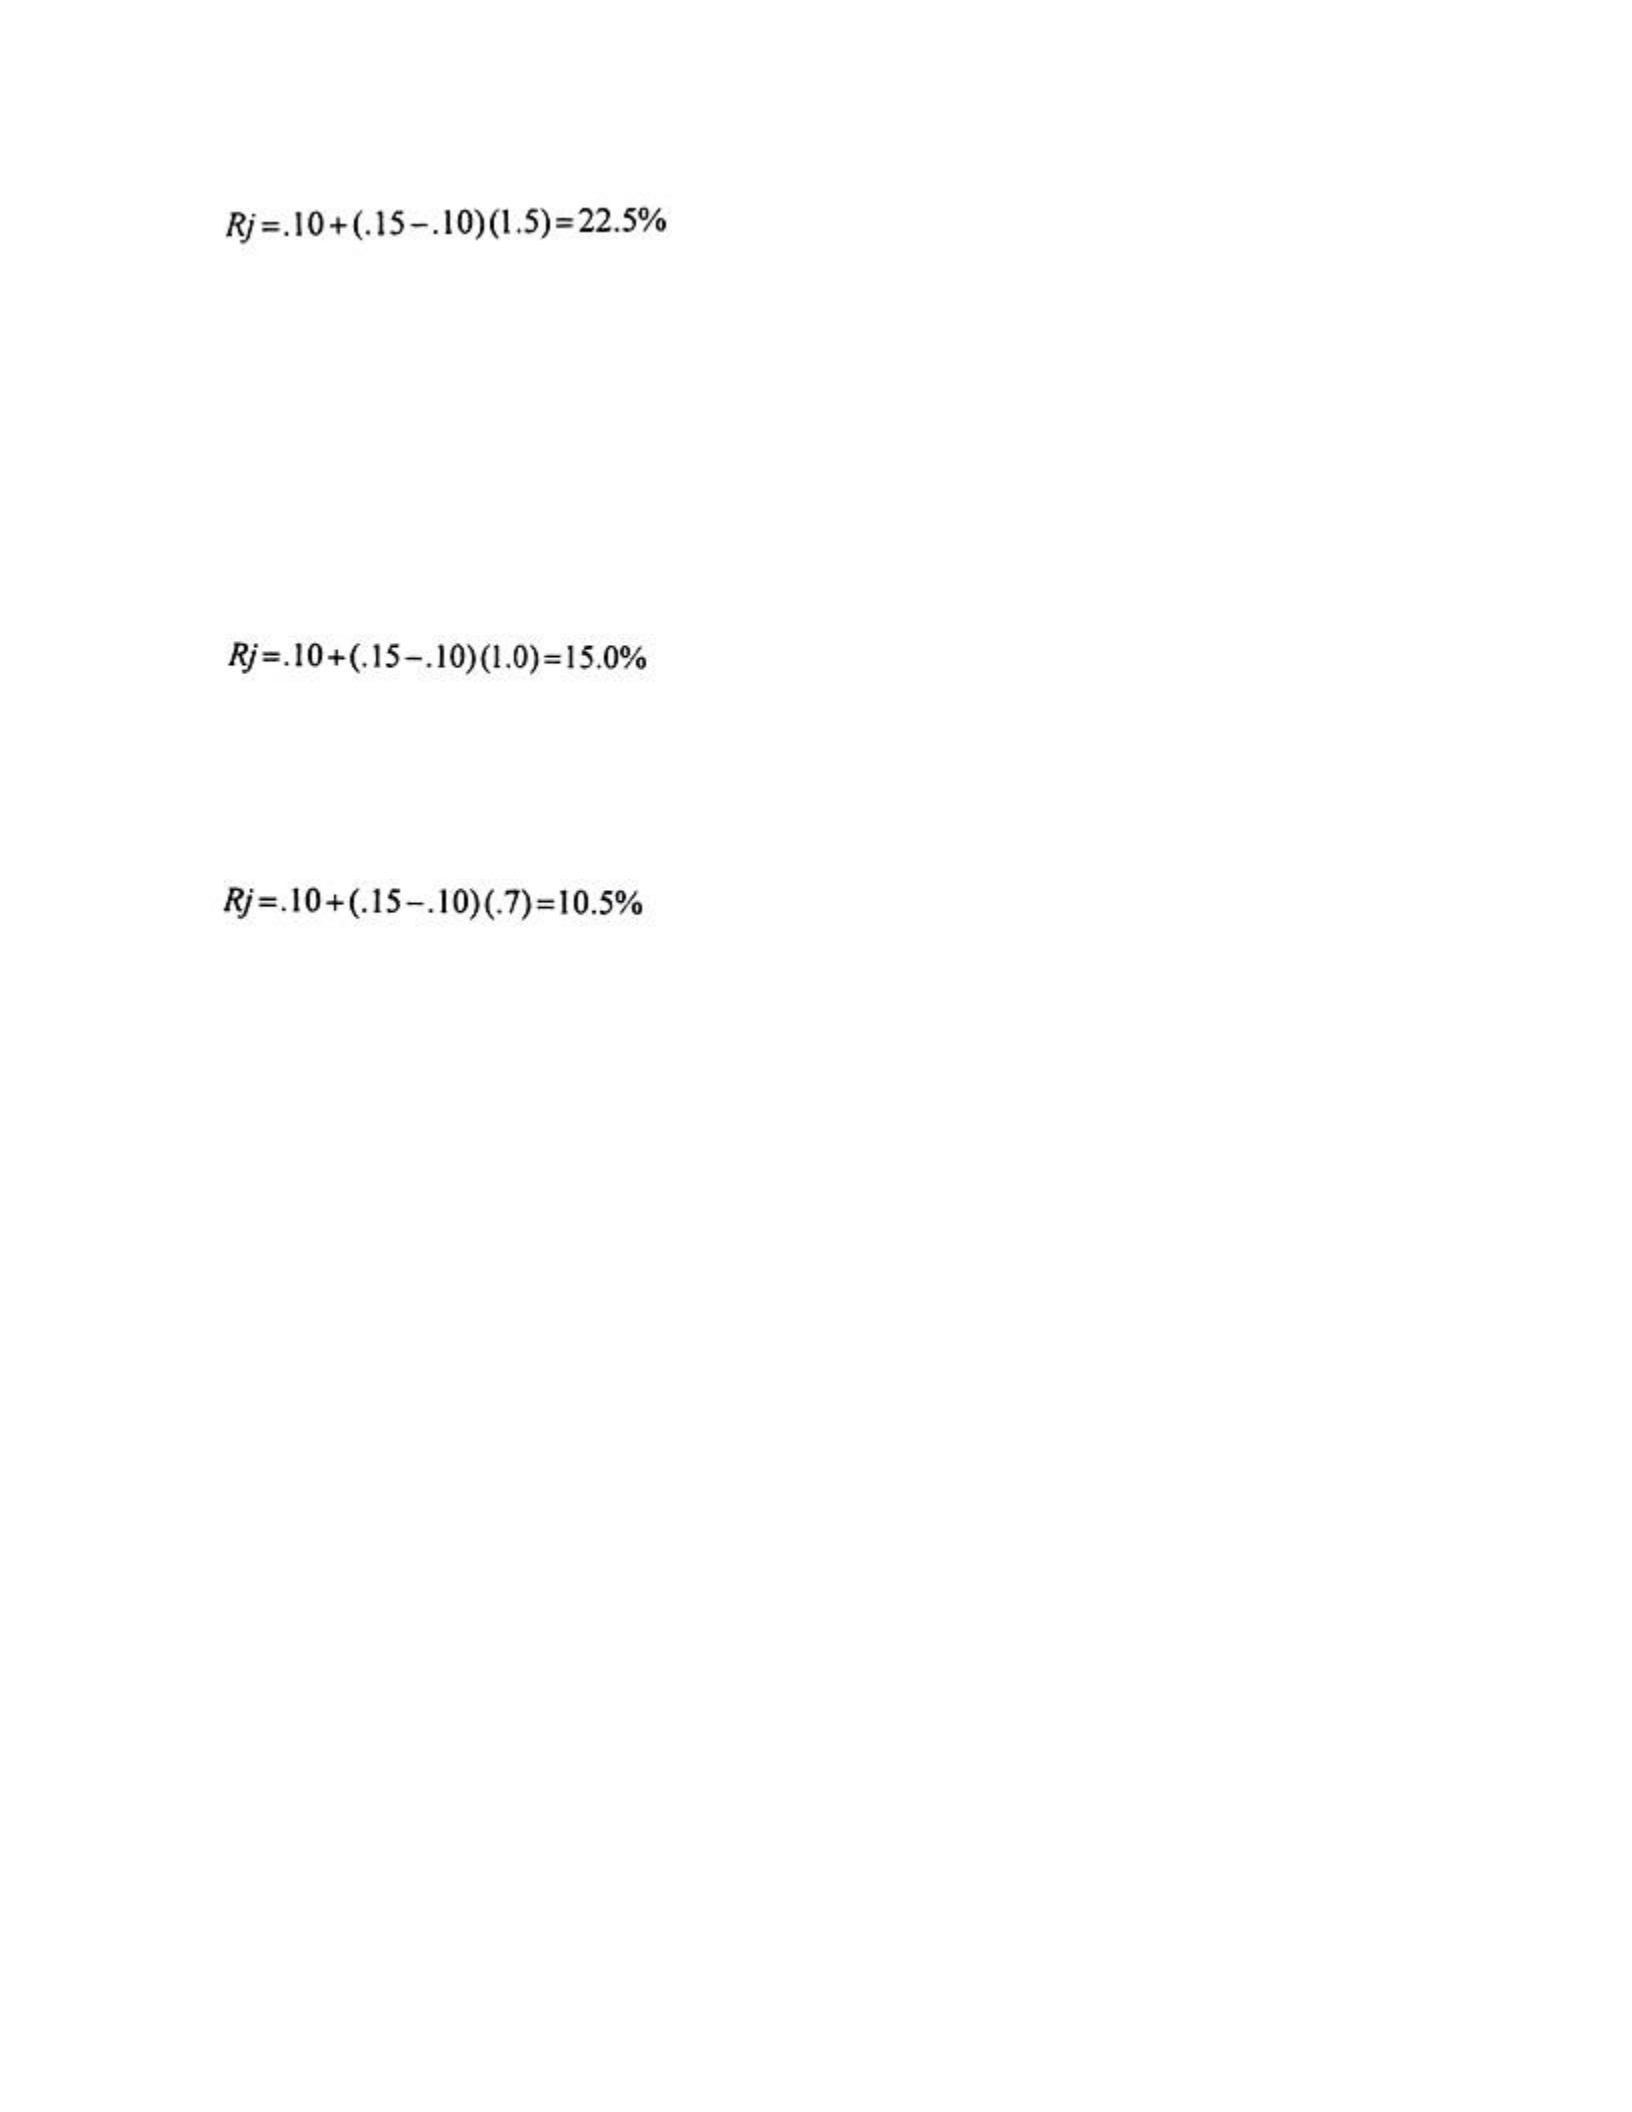
The market expects A to show a 2.5% annual return. Since A has more systematic risk, this
return is higher than expected of the typical security in the market.
For the typical security, the expected return would be:
If beta coefficient of a security is only .7, its expected return would be:
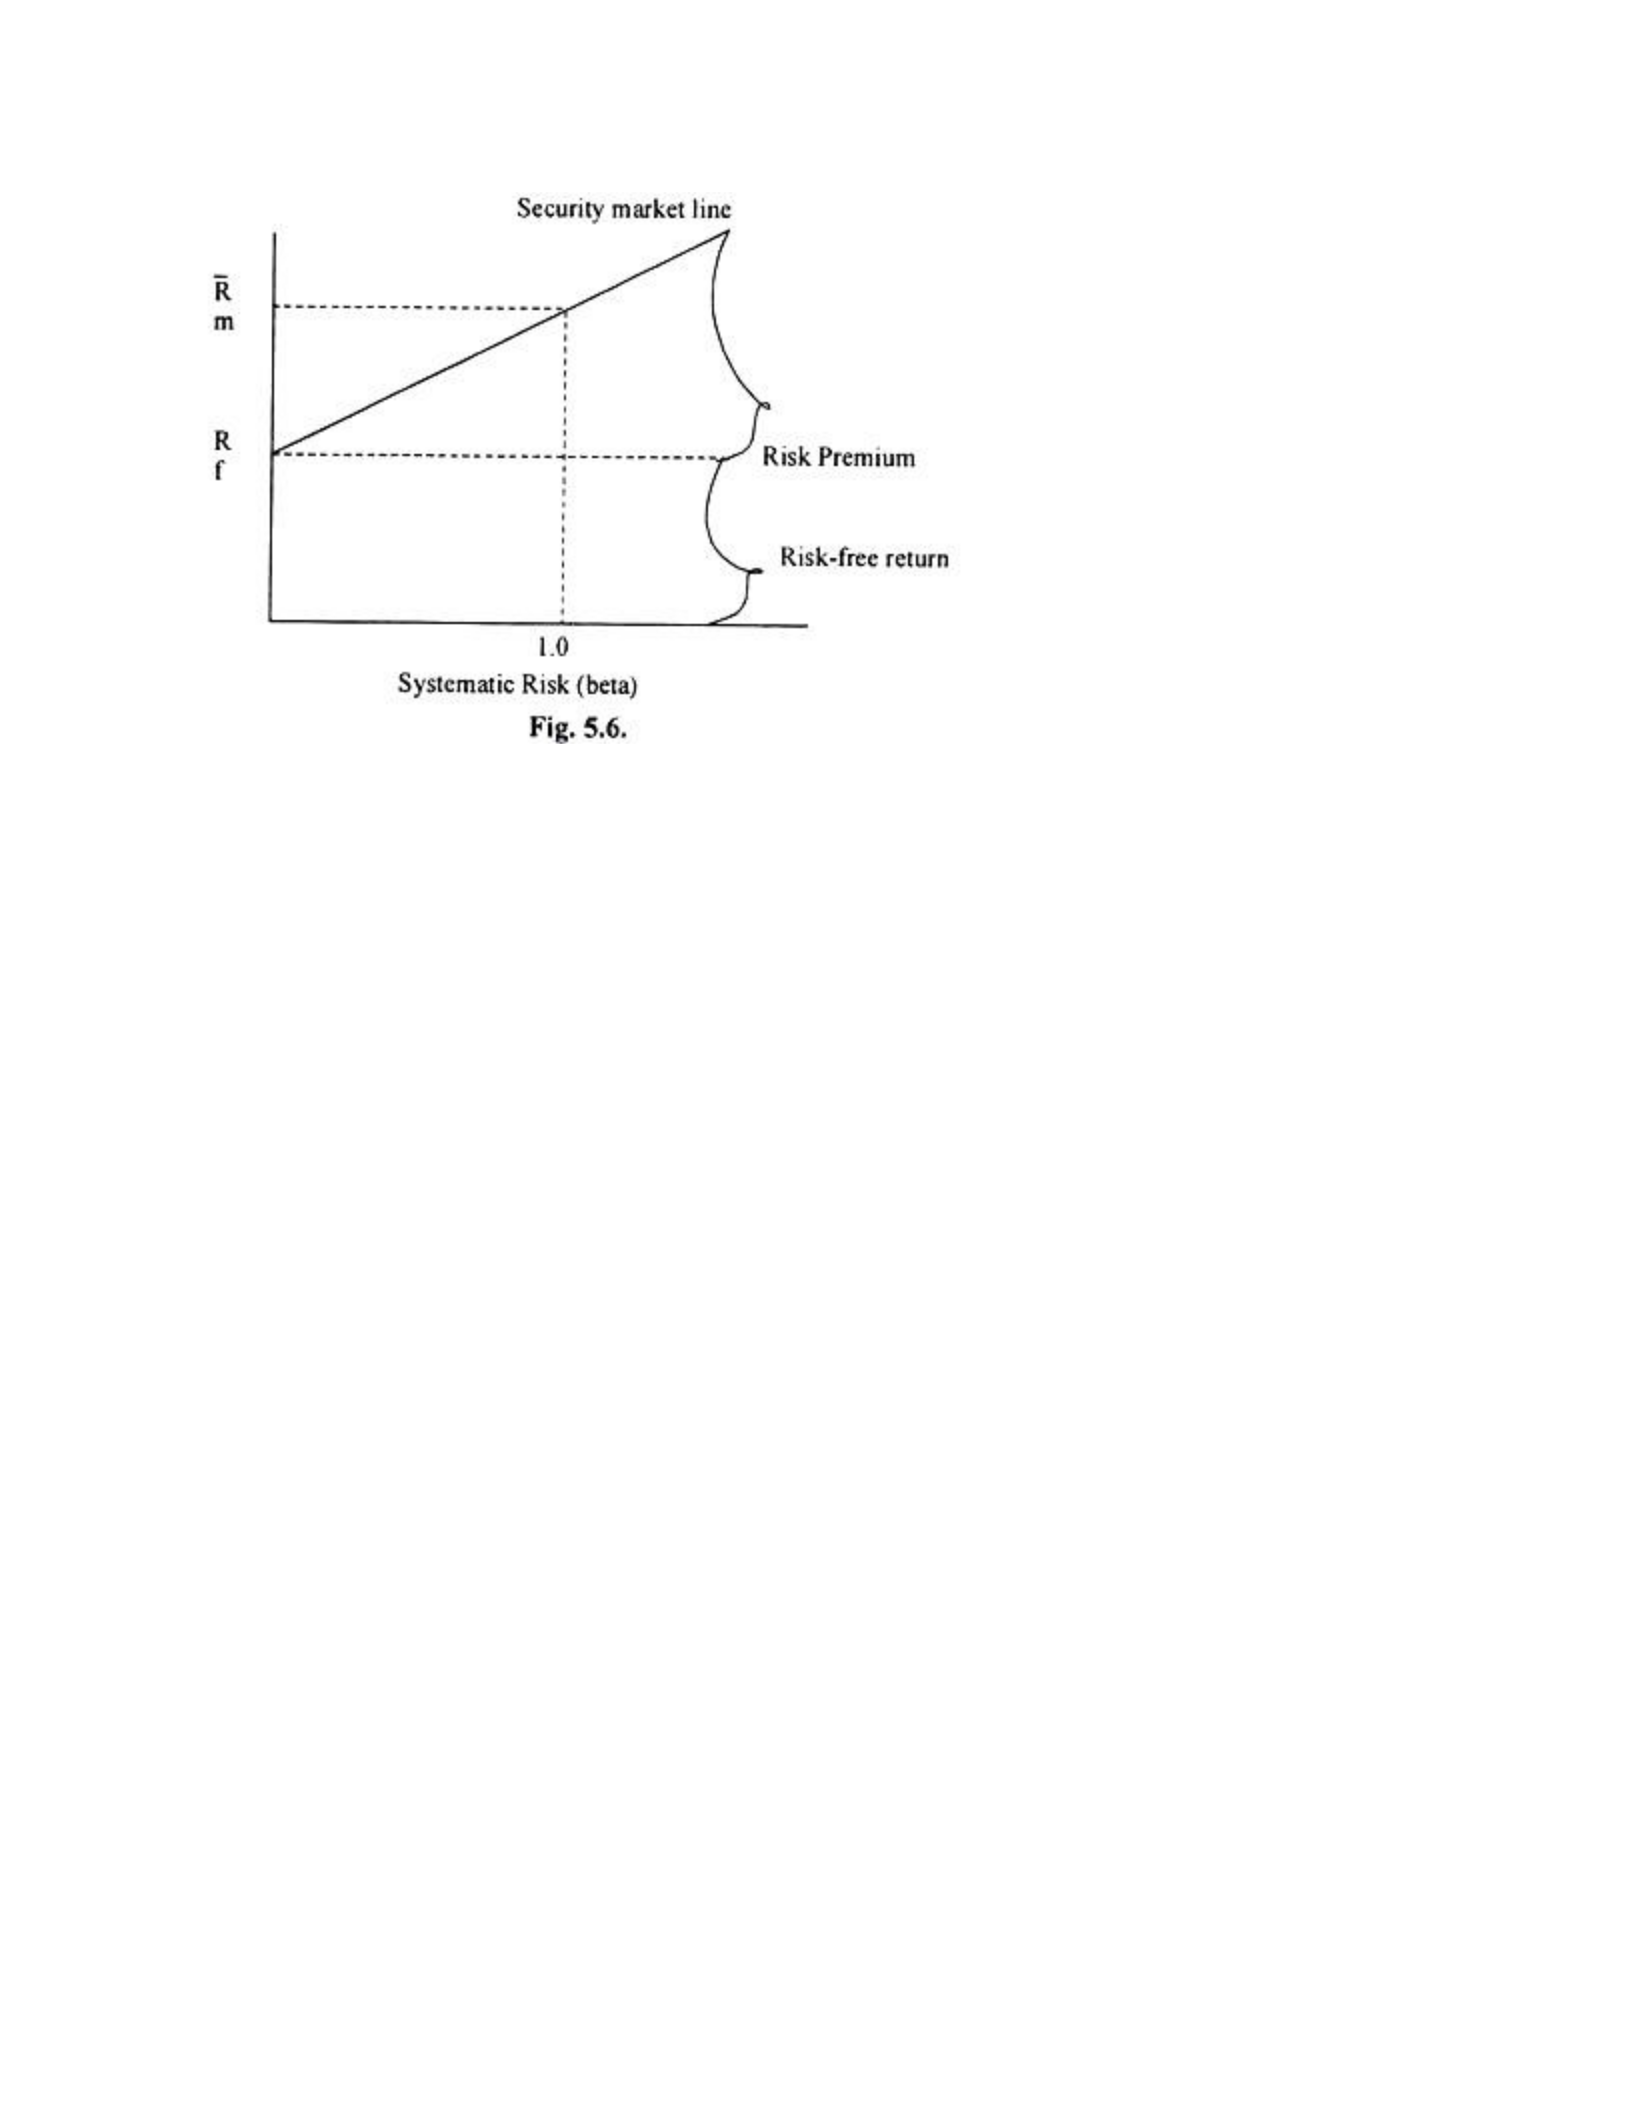
There, thus, exists linear relationship between an individual security’s expected return and its
systematic risk, as measured by beta. This linear relationship is called as the Security Market
Line (SML). Figure 5.6 depicts SML. The expected one-year return is exhibited on the vertical
axis. Beta, index of systematic risk, is shown on horizontal axis.
At zero risk, the security market line intercepts on the vertical axis equal to the risk-free rate.
Even when no risk is entailed, investors still expect to be compensated for the time value of
money. With increase in risk, the required rate of return tends to go up, as shown in the above
figure.
The above discussion on CAPM leads us to make following inferences:
1. A security’s risk is composed of systematic risk and unsystematic risk.
2. Unsystematic risk is diversifiable and hence can be eliminated through diversification, either
by holding a large portfolio or by purchasing shares in a mutual fund.
3. Systematic risk is non-diversifiable risk and is therefore relevant to a rational investor.
4. There exists a linear relationship between expected return on a security and its systematic risk
in market equilibrium.
5. Investors would like to be compensated for systematic risk which they cannot diversify.
6. The market risk of a security is measured by its beta coefficient, which is an index of a
security.

7. The degree of systematic risk that a security possesses can be determined by drawing a
characteristic line.
8. The relationship between the required rate of return for a security and its beta is called the
security market line.
International Capital Asset Pricing Model (CAPM) | Forex Management
The Capital Asset Pricing Model (CAPM) indicates that the investors in a security are
compensated only for the systematic risk of the security. And it is assumed that the unsystematic
risk can be diversified by the investor by investing in different group of assets. The unsystematic
risk is a unique risk pertains to a specific firm, for example, labour strike, non-availability of raw
materials, etc.
The systematic risk is applicable to the all units or firms in the economy, which cannot be
omitted by any action. For example, the economic and monetary policy of the countries of globe
at large, the world recession, etc. The systematic risk is measured on the basis of the beta of the
security. The beta of a security is the sensitivity in the return of the security to a change in the
market returns.
The international CAPM takes the globe as a market instead of domestic market. According to
the CAPM theory, the market portfolio consists of all the securities available in any of the
country of the globe, and the beta of a security measures the sensitivity of the security returns to
a change in the returns on the extended or global market portfolio.

If the investor restricts its investments to the domestic market only, then it would imply that, the
return earned by investor would be below the efficiency frontier.
According to the international CAPM, the return on a security is given by:
Ri = rf + βw (rw – rf)
Where rf = World risk-free rate of return
bw = World beta of the security
= Cov (ri, Fw)/Var(rw)
rw = Return on the world-market portfolio
In real life, it is very difficult to apply the model, due to the difficulties in estimating the various
variables involved in model. The implications of the model are very important for the purpose of
evaluation of the usefulness of international investments. If the model would hold goods at a
particular point of time or passage of time, then holding a purely domestic portfolio would
involve foregoing some higher return or taking on additional risk which is not in commensurate
with the returns.
Difference: Capital Market Line and Security Market Line
Figure 17.11 shows the efficient frontier, the investor can invest either in point A and B or in
point B and C.
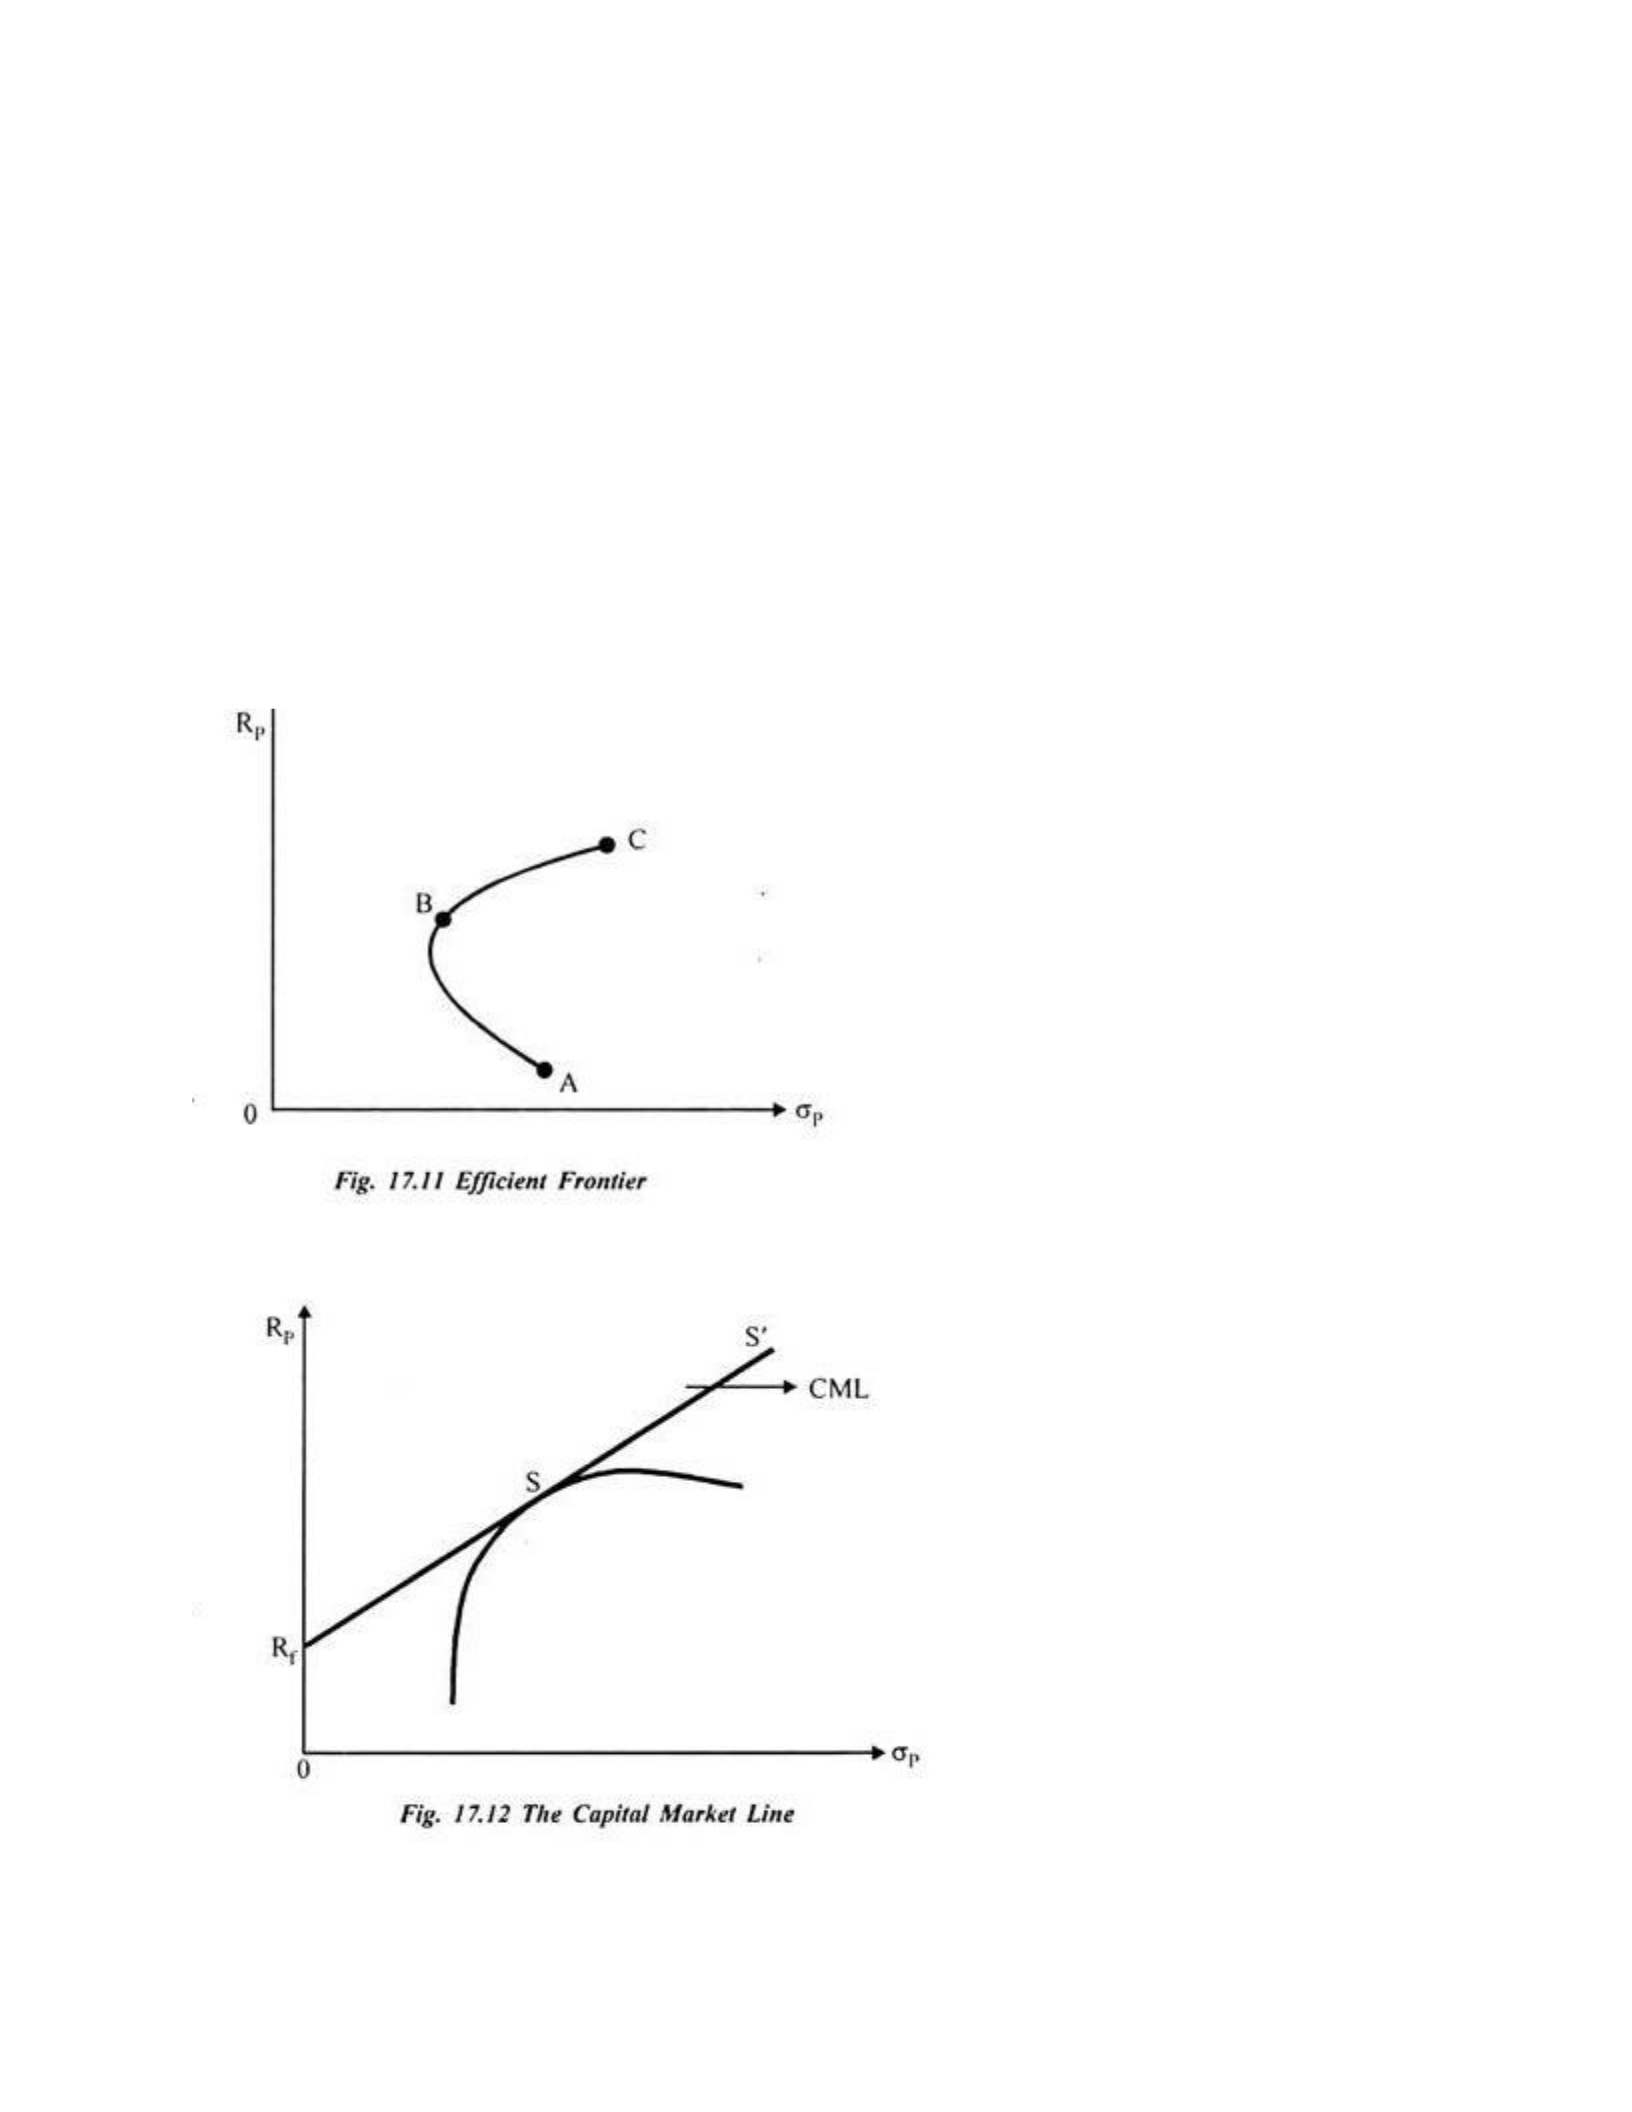
According to this figure, the preference of the investor would be to invest and securities between
B and C. The reason for this is that A and C have the same level of risk. However, point C
provides a higher return than A. Therefore, C should be preferred over A.
The investor should combine the risky and risk-less securities and prepare his portfolio. In figure
17.12, the straight line showing RfS’ is called the capital market line. RfS shows risk-free assets
and the line from S to S’ consists of borrowing portfolio and risky investments.
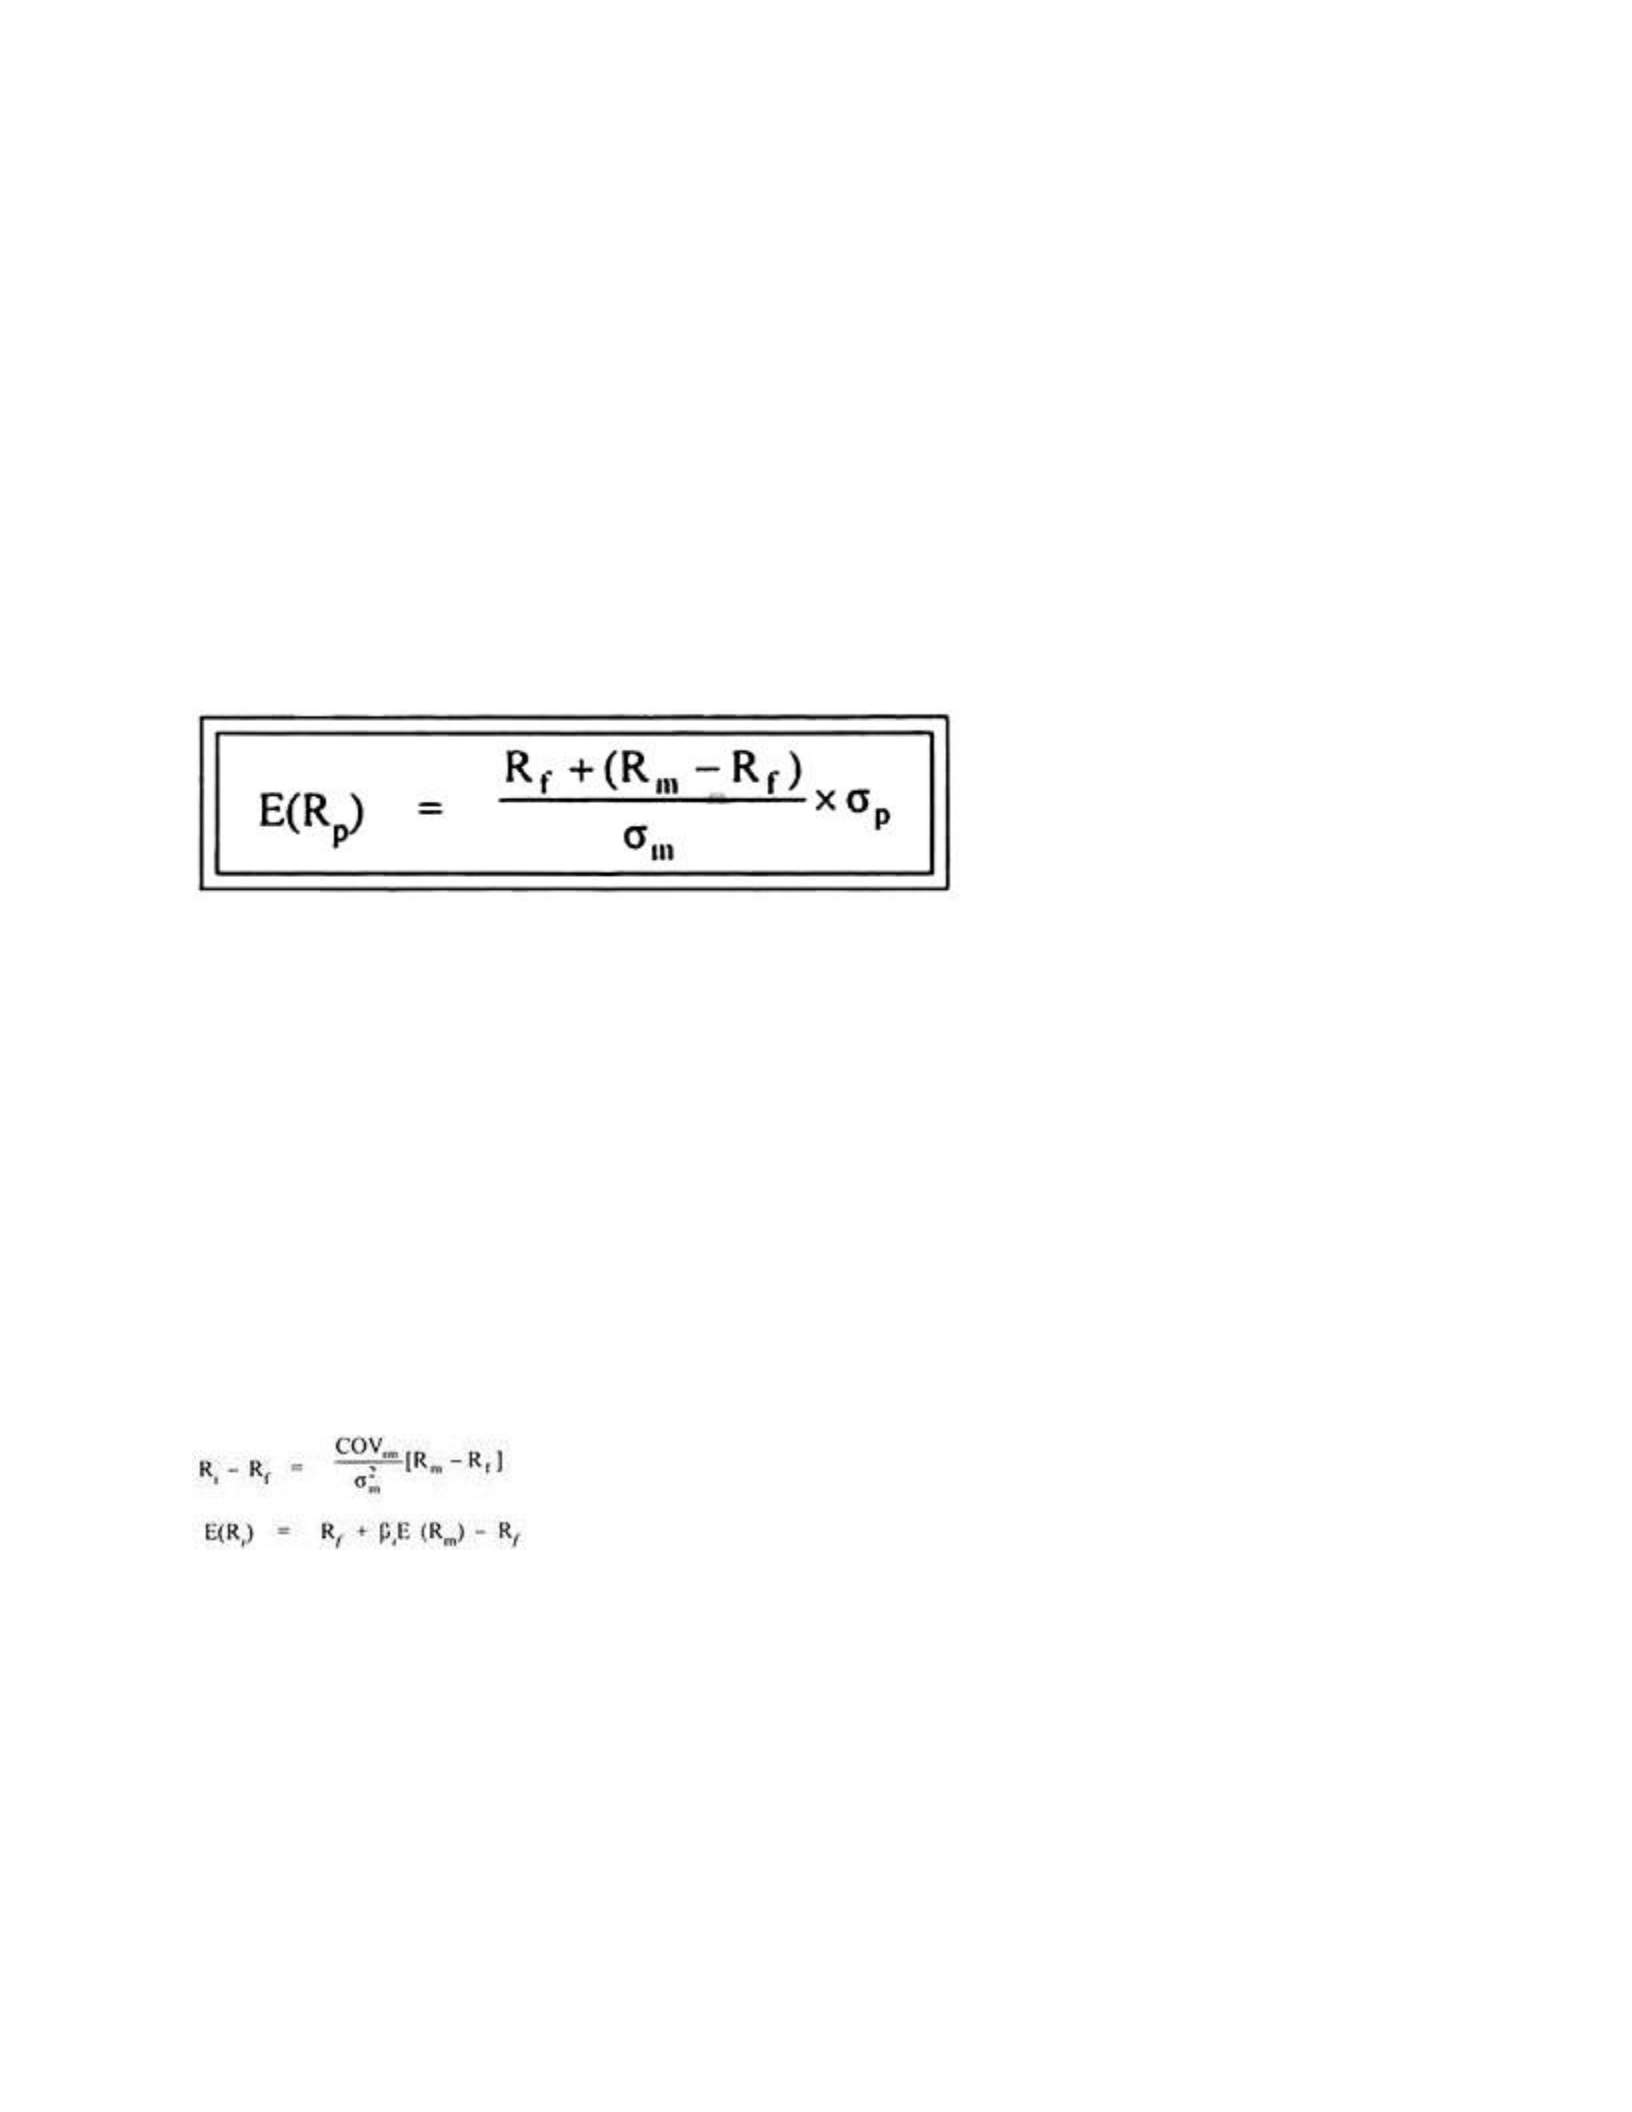
Thus, the capital market line depicts a linear relationship between the required rates of return for
efficient portfolios and their standard deviations.
Therefore, the portfolios which are presented on the capital market line show the price of the risk
through the slope of the line and the expected rate of return which is in excess of the risk-free
rate will be in proportion to the standard deviation of the portfolio in terms of the market called
market portfolio.
E(Rp) = portfolio’s expected rate of return
Rm = expected return on market portfolio
σm = standard deviation of market portfolio
σp = standard deviation of the portfolio
The security market line in addition to the efficient portfolios measured by the capital market
line shows the risk the inefficient portfolios are not depicted on the capital market line, their risk
and return relationship is not analysed by the capital market line.

The major contribution of the security market line is that it measures individual securities
whether efficient or inefficient. The security market line determines the expected returns for or
given security beta and the systematic risk can be measured by beta. The unsystematic risk can
be diversified as it is not market related but beta risk cannot be diversified and therefore it
requires an analysis.
The security market line determines the security that is over-priced and the security which is
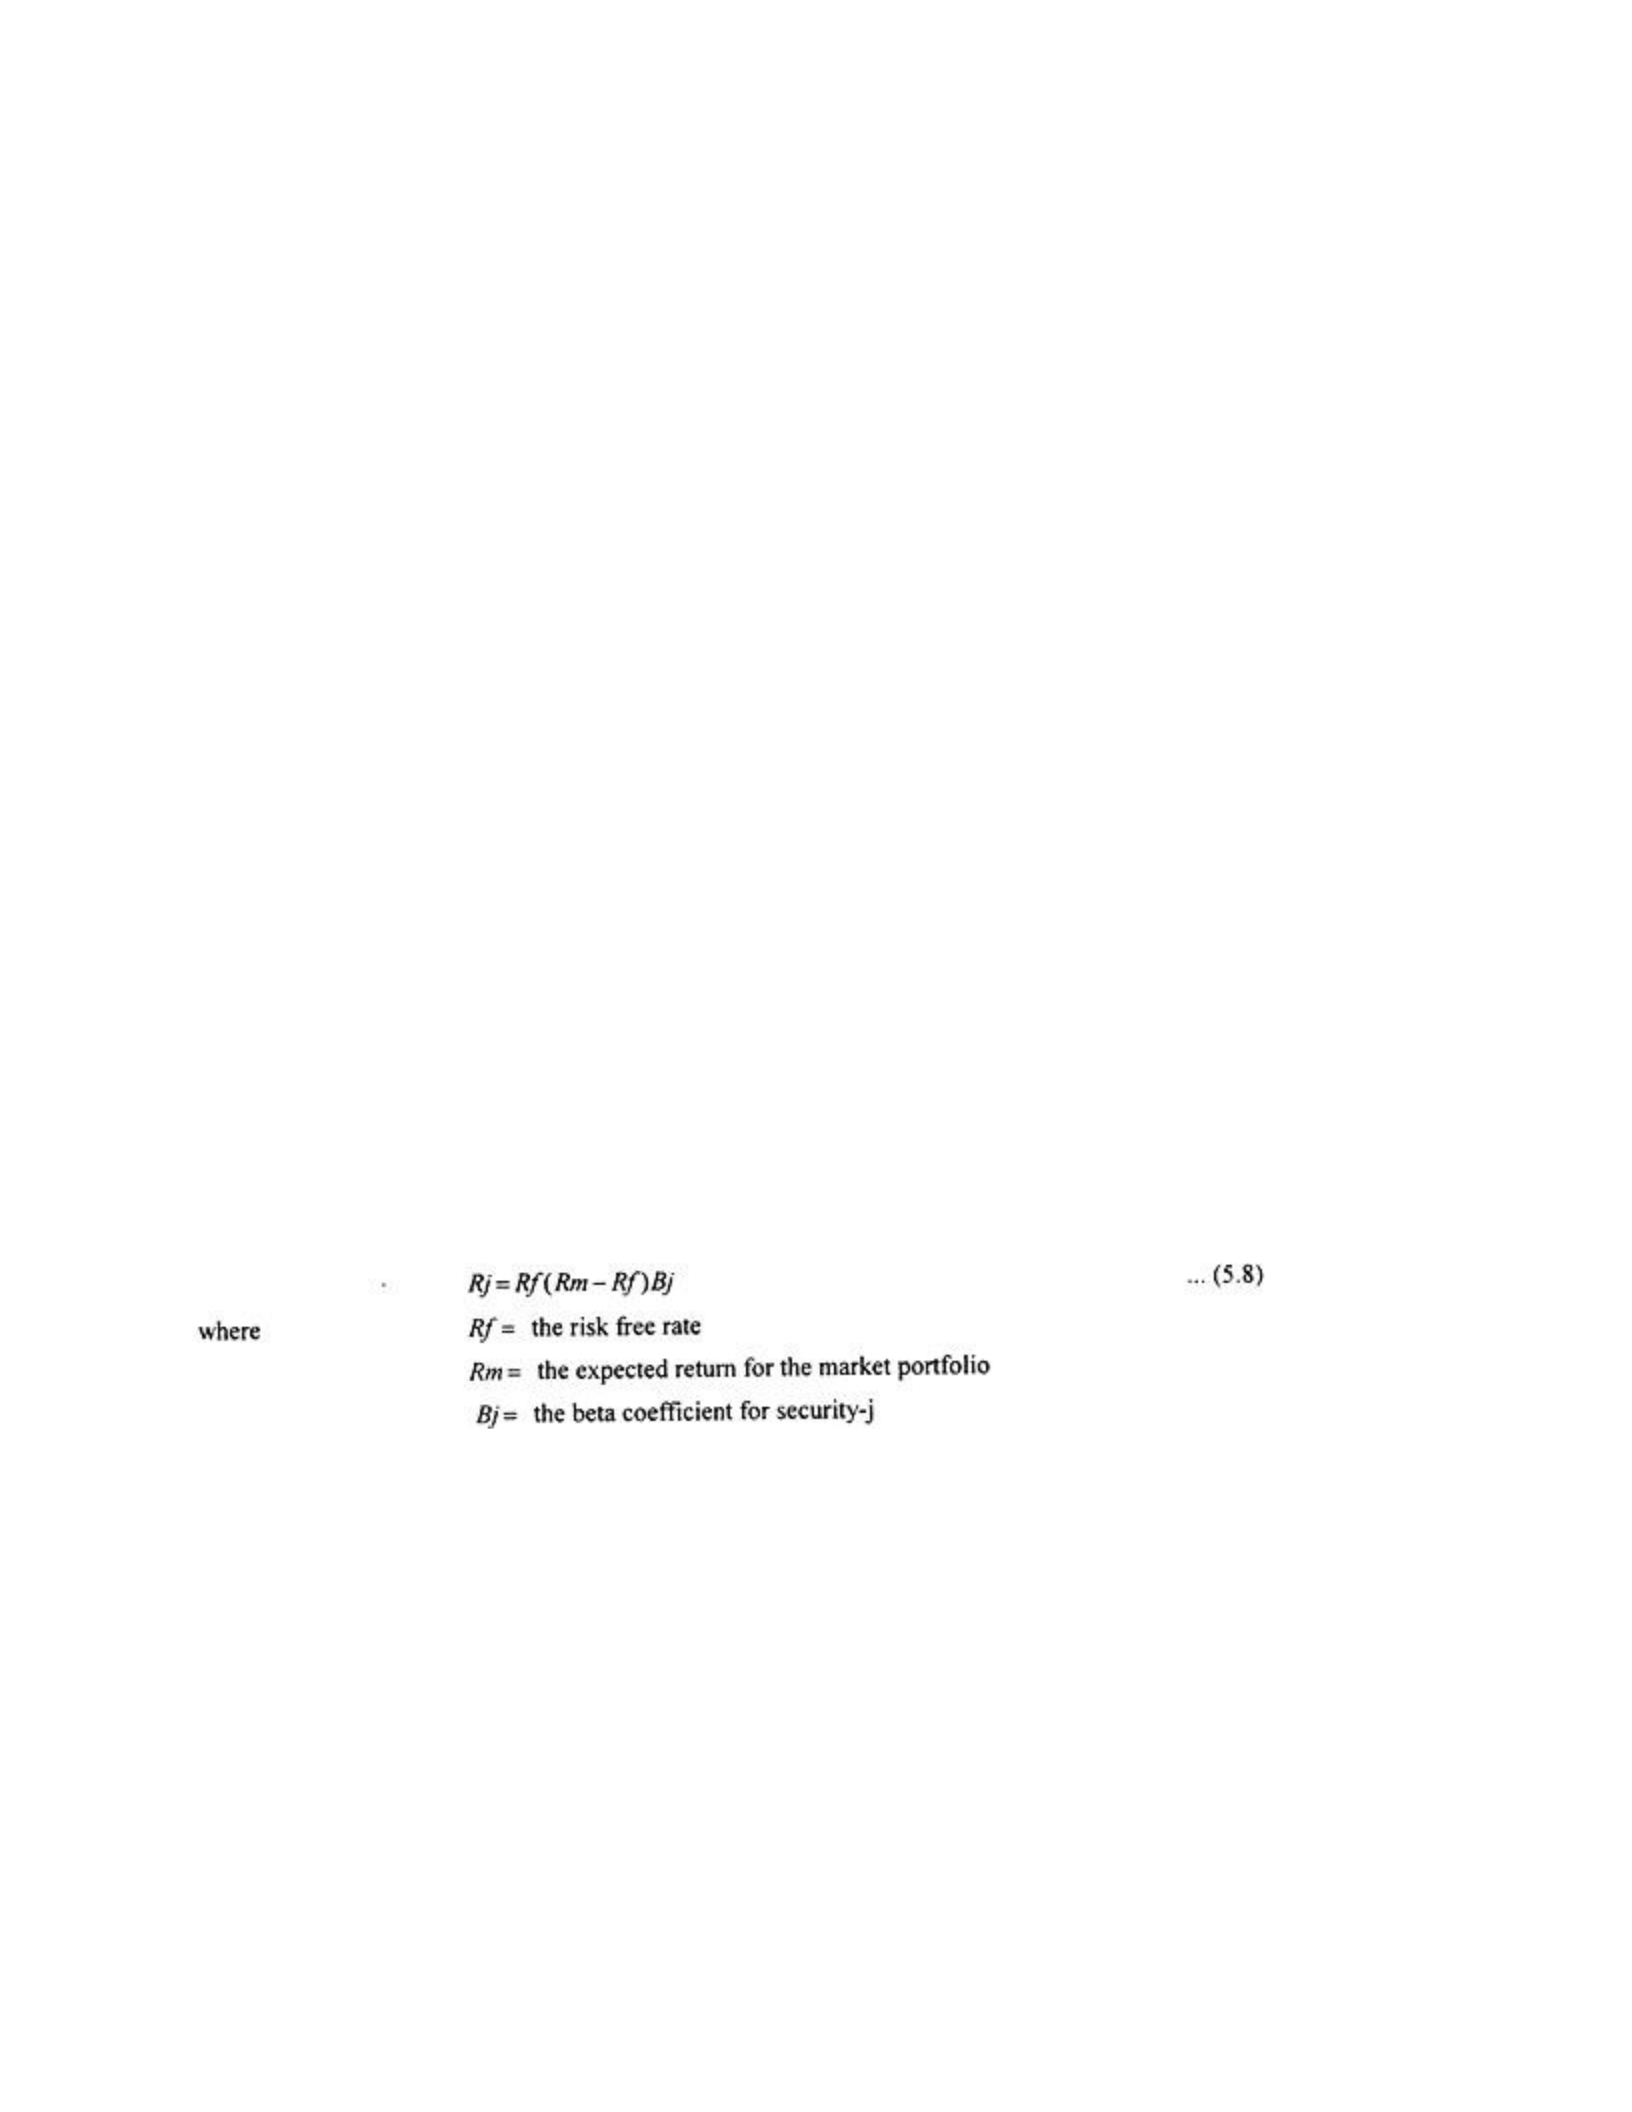
under-priced. The under-priced securities should be purchased by the investors. Figure 17.13
shows that those securities which are above the security market line are under-priced. Thus,
securities XYZ are under-priced as they are above the security market line and UVW below the
security market line are over-priced.
The reason for this is that XYZ have the same risk as UVW but they offer a higher return. To
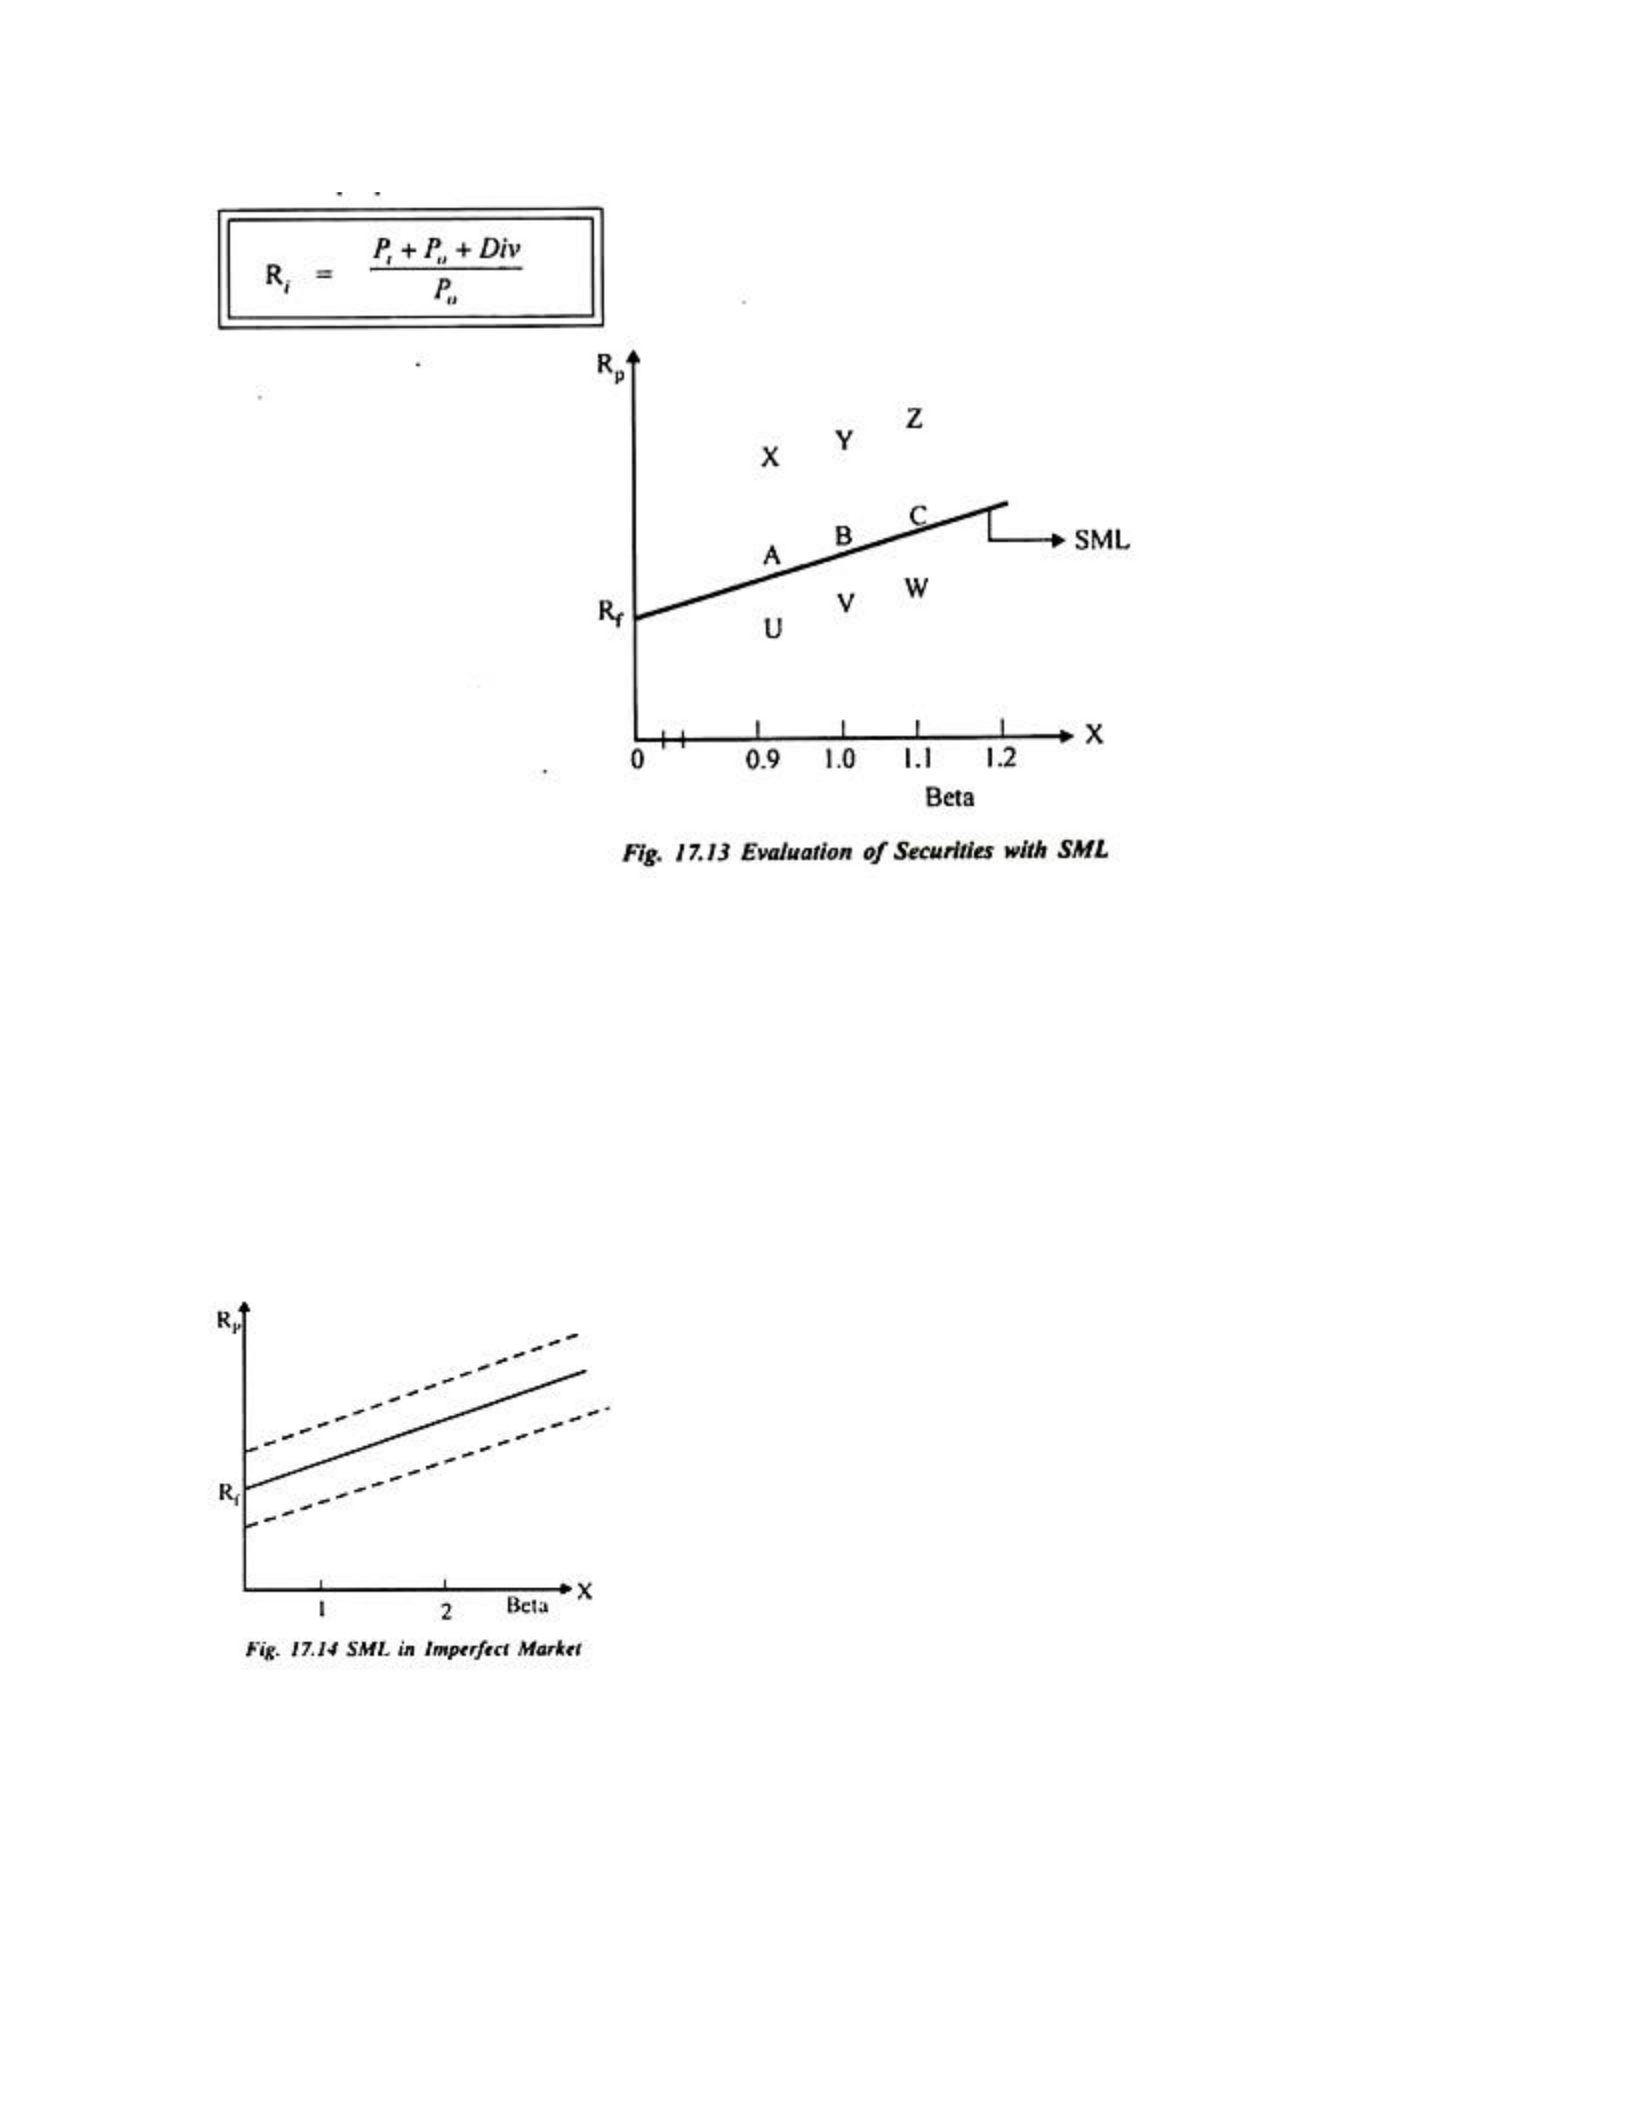
prove that XYZ under-priced the following formula can be used. P; is the present price P0 is the
purchase price and Dividend. The securities ABC are on the security market line and they are
correctly priced. Their return is in proportion to their risk