


1
Chapter 1: Introduction to the Study
Introduction
Techonolgy investment frameworks may contribute to the effectiveness of
organizational leaders’ investment decisions. My research was focused on companies that
used the Customer Focused Technology Planning (CFTP) framework (Paap, 2010) to
assess companies’ technology planning. An example of Paap’s CFTP framework without
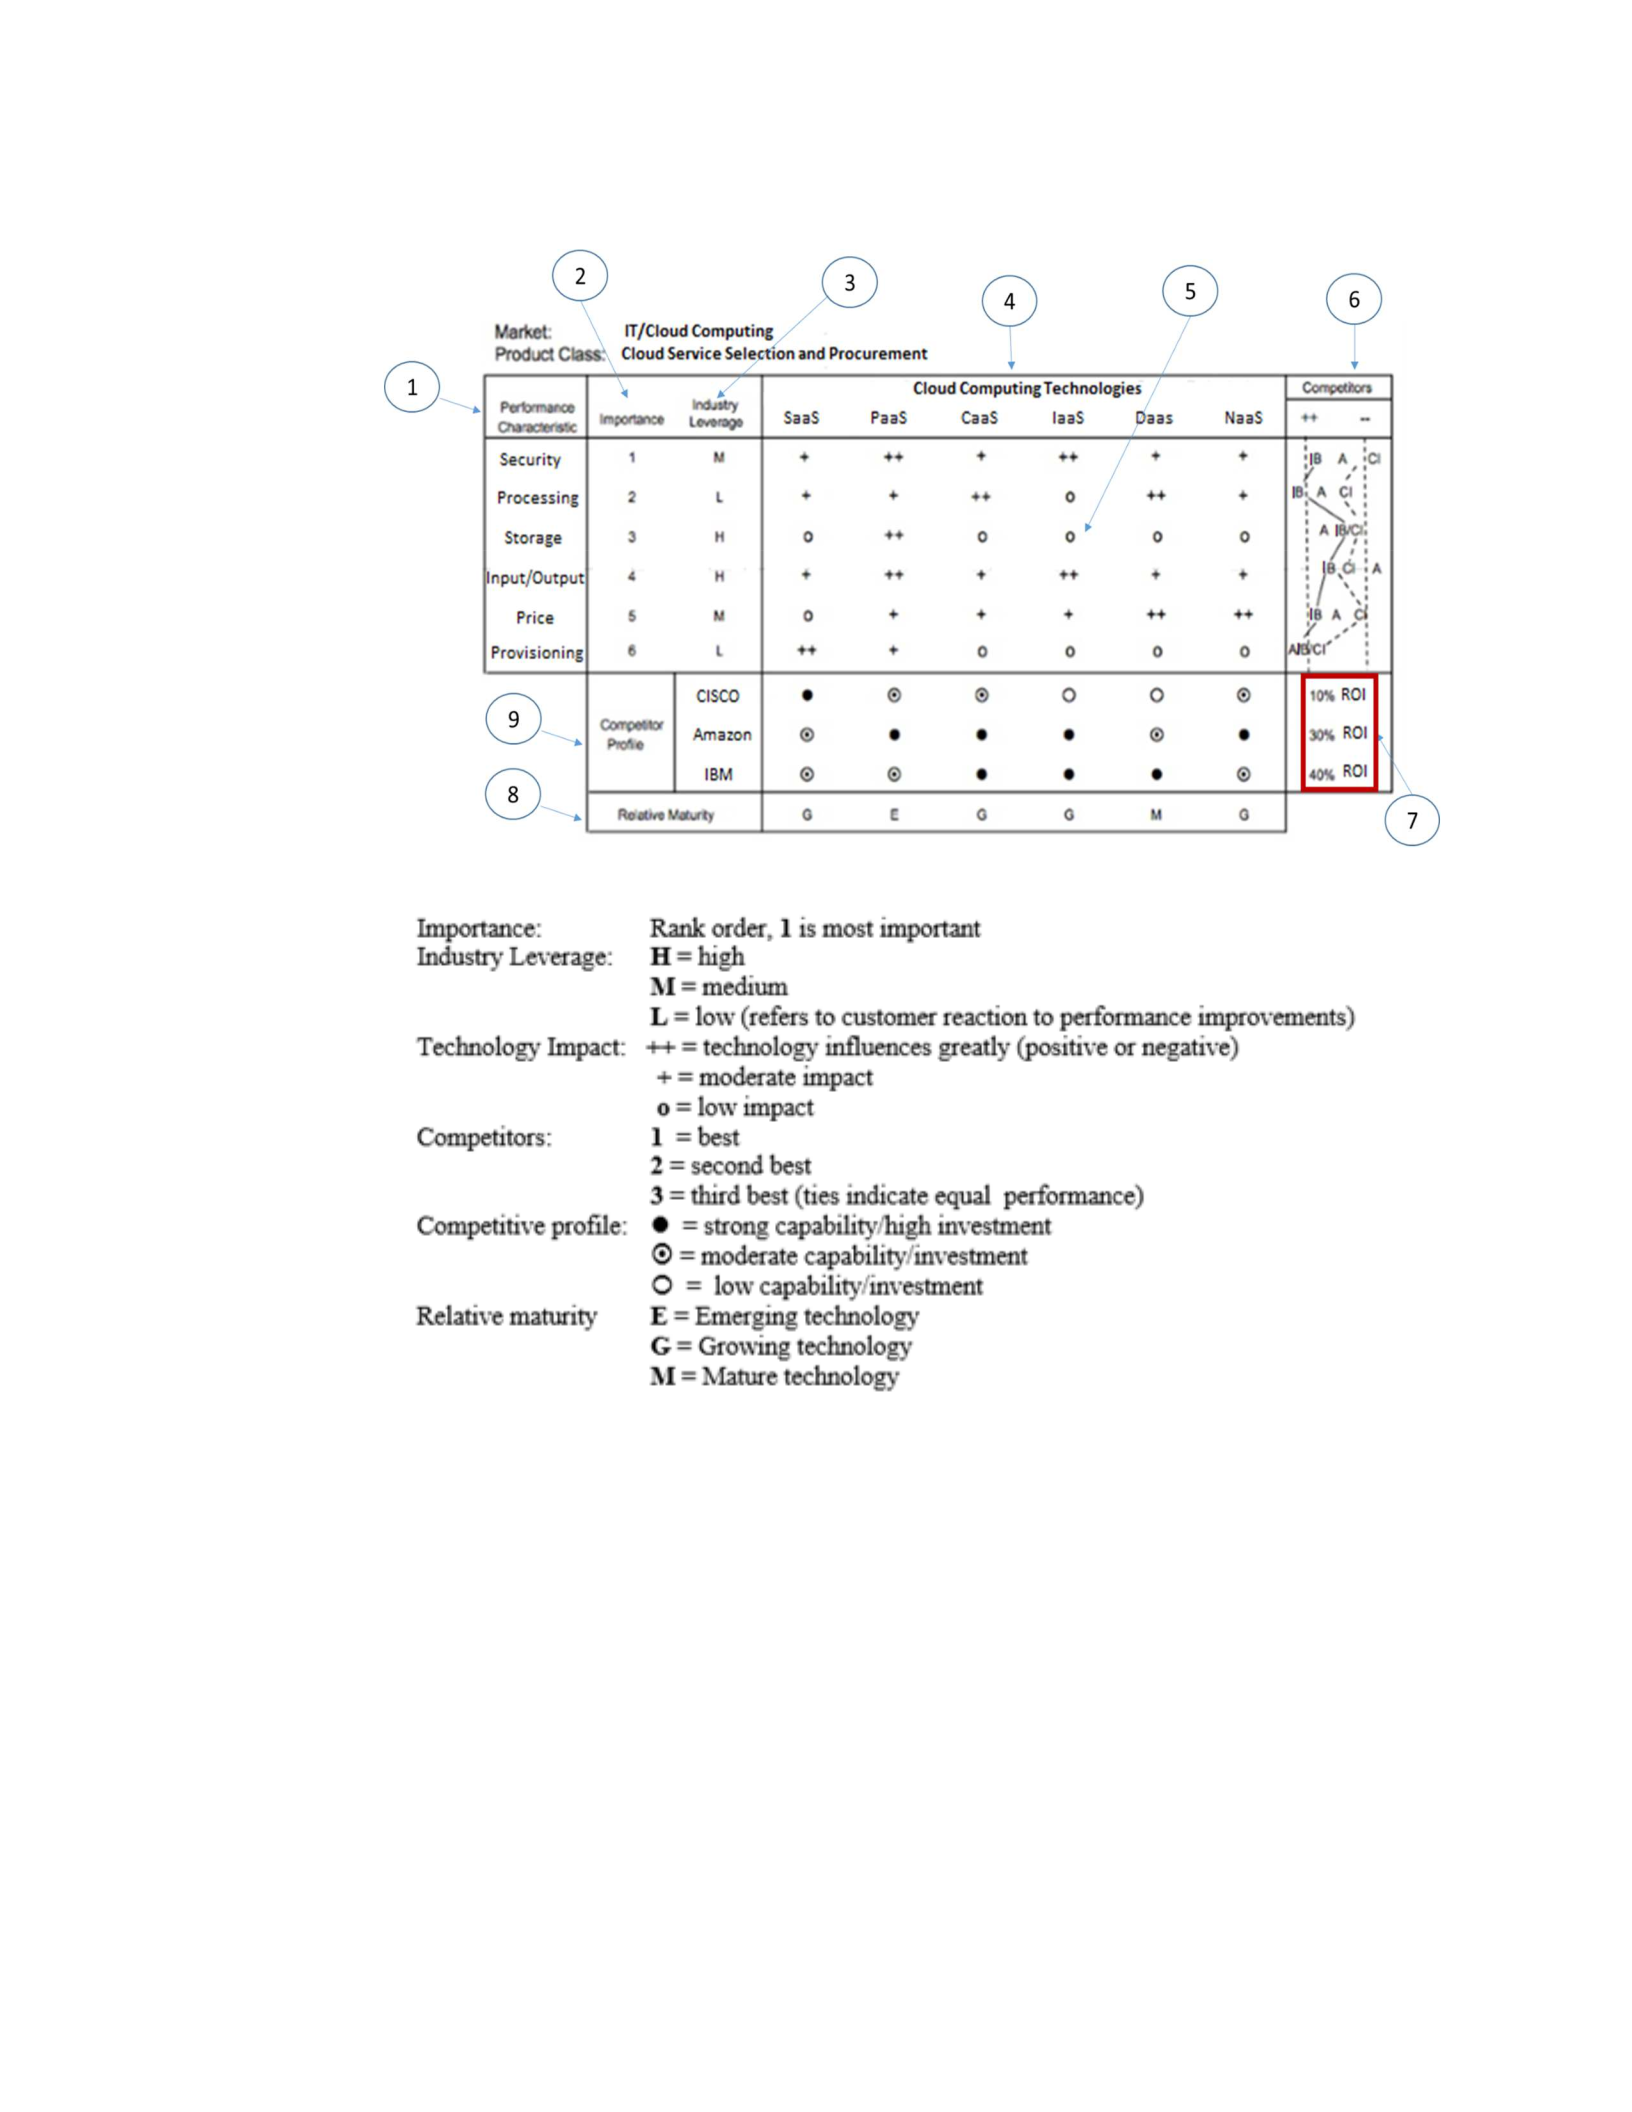
risk assessment is shown in Figure 1. The example showed that organizations using IBM
cloud computing services have the highest return on investment (ROI) at 40%. See
Appendix C for the steps I took when using Paap’s CFTP framework.
2
Figure 1. Paap’s CFTP framework without risk assessment. From Customer focused
technology planning: An overview, by J. Paap, 2010, p. 15. Retreived from
http://www.jaypaap.com/articles/CFTP-2016-06.pdf. Copyright 2016 by J. Paap.
Reprinted with permission.

3
Although Jurimae (2010) and Wilkinson (2009) have stressed the importance of
risk assessment when making decisions about technology investment, Paap’s framework
does not include risk assessment for technology implementation. In my quantitative
study, I sought to resolve the gap of missing risk assessment to potentially help
organizations reduce monetary loss and increase ROI when making technology
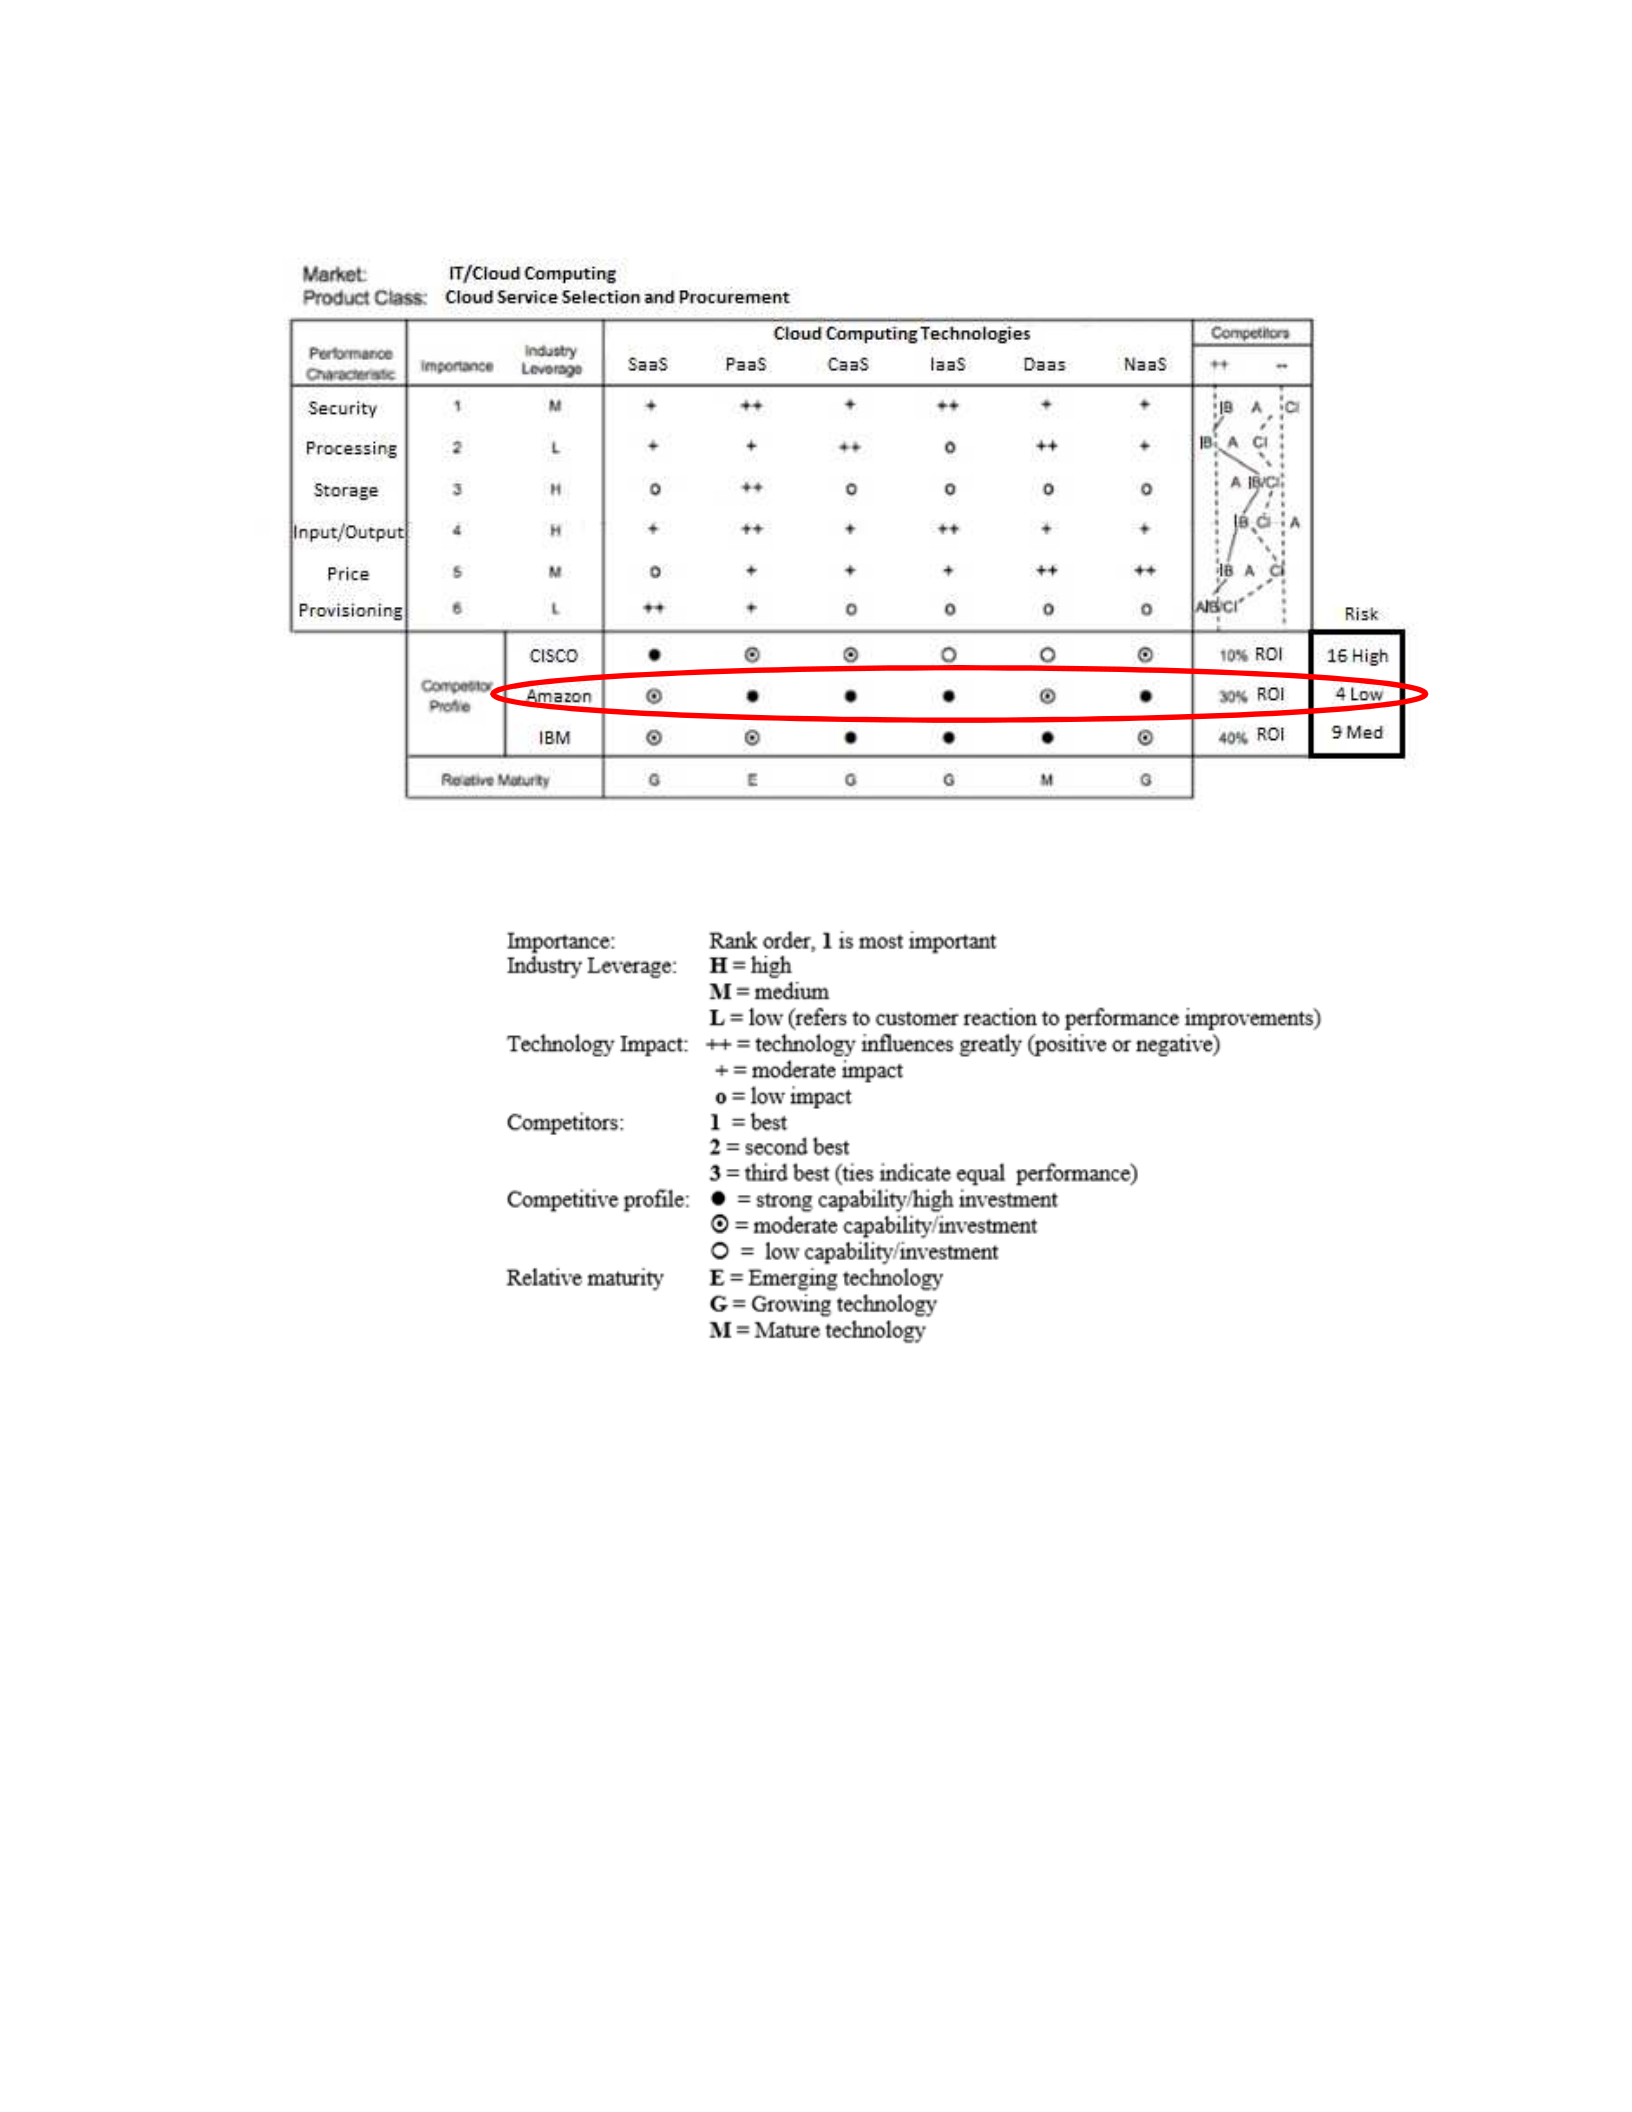
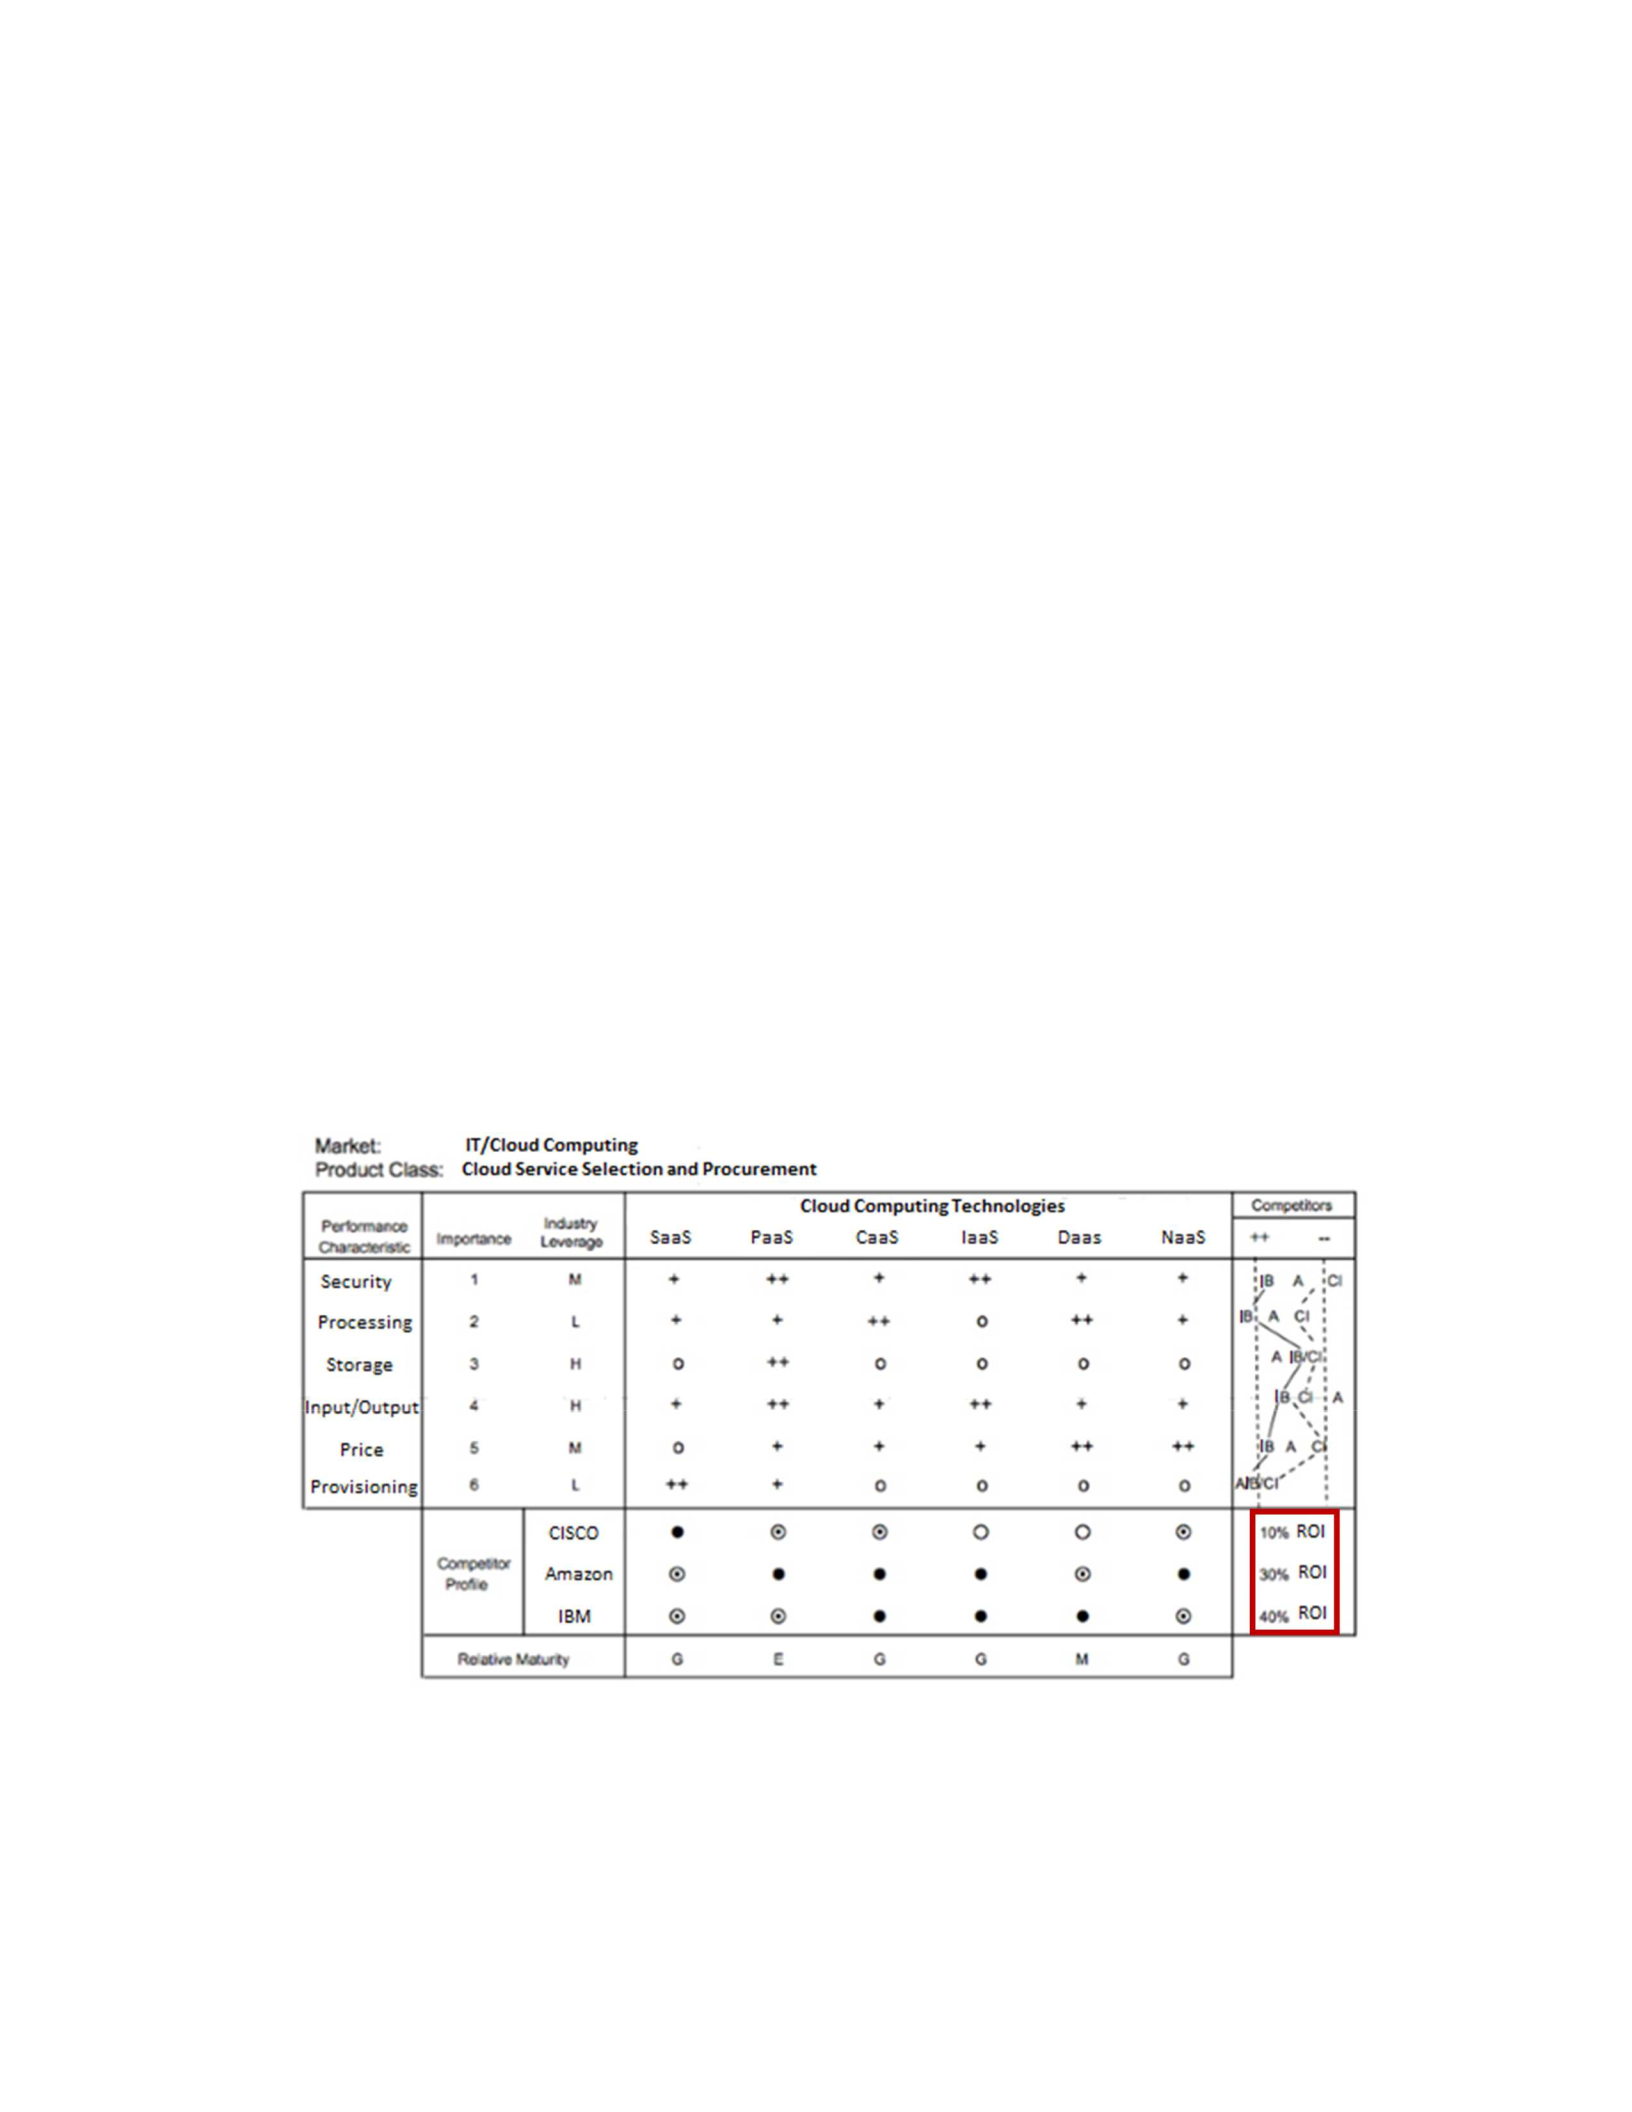
investment decisions. An example of Paap’s CFTP framework with added risk
assessment is shown in Figure 2. In Figure 2, the example showed that organizations
using Amazon cloud computing was the best to make your investment decision based on
the lowest risk of 4 and medium ROI of 30% compared to IBM Cloud Computing
Services with medium risk of 9 and medium ROI of 40%, as well as, CISCO Cloud
Computing with high risk of 16 and lowest ROI of 10%. In a perfect scenario, the
investment decision would be based on determining the lowest risk and the highest ROI.
See Appendix D for how I added risk assessment to Paap’s CFTP framework.
4
Figure 2. Paap’s CFTP framework with added risk assessment. Adapted from Customer
focused technology planning: An overview, by J. Paap, 2010, p. 15. Retreived from
http://www.jaypaap.com/articles/CFTP-2016-06.pdf. Copyright 2016 by J. Paap.
Reprinted with permission.
By adding risk assessment to Paap’s CFTP framework, high tech companies and
their technologists, investment strategists, and researchers might improve their
technology decision making processes for investments, which may result in higher
returns on their investments. My quantitative research study might contribute to positive

5
social change by providing information organizational leaders can use to create stronger
businesses that may help grow the global economy. Furthermore, the addition of risk
assessment to Paap’s CFTP theoretical framework could be useful to the risk
management field in by helping leaders better understand both investor intent and
technology investment relationships.
Chapter 1 contains an introduction to Paap’s CFTP framework for drawing future
technology roadmaps. Although Jurimae (2010), Wilkinson (2009), Valerdi and Kohl
(2004) have stressed the importance of and need for risk assessment when making
decisions about technology investment, Paap’s CFTP framework does not include risk
assessment for technology implementation. The major sections in this chapter include
discussions of (a) the quantitative research purpose, (b) the theoretical framework, (c) the
nature of study, (d) quantitative measurement tools, (e) data collection techniques, (f) the
limitations of the study, and (g) the positive social change implications of the study.
Background
Lopez-Ortega, Concepcion, and Viloria (2006) suggested using technology
roadmaps and technology intelligence to improve the technology investment decision-
making process. The outcome of this strategic decision-making process must satisfy the
following three criteria: (a) the planning process was centered on a specific technological
field of interest, (b) the participation in specific fields of interest and clear representation
of technological investment objectives; (c) the high tech company developed a
technology intelligent system in each specific technological field selected (Lopez-Ortega,
Concepcion, & Viloria, 2006). Paap (2010) developed his new framework to provide a

6
better technology roadmap method to improve descision making on technology
investment. He proposed the idea of the CFTP framework for drawing future technology
roadmaps to help technologists, investment strategists, and researchers make more
informed decisions, and to do so as effectively and efficiently as possible. Paap's CFTP
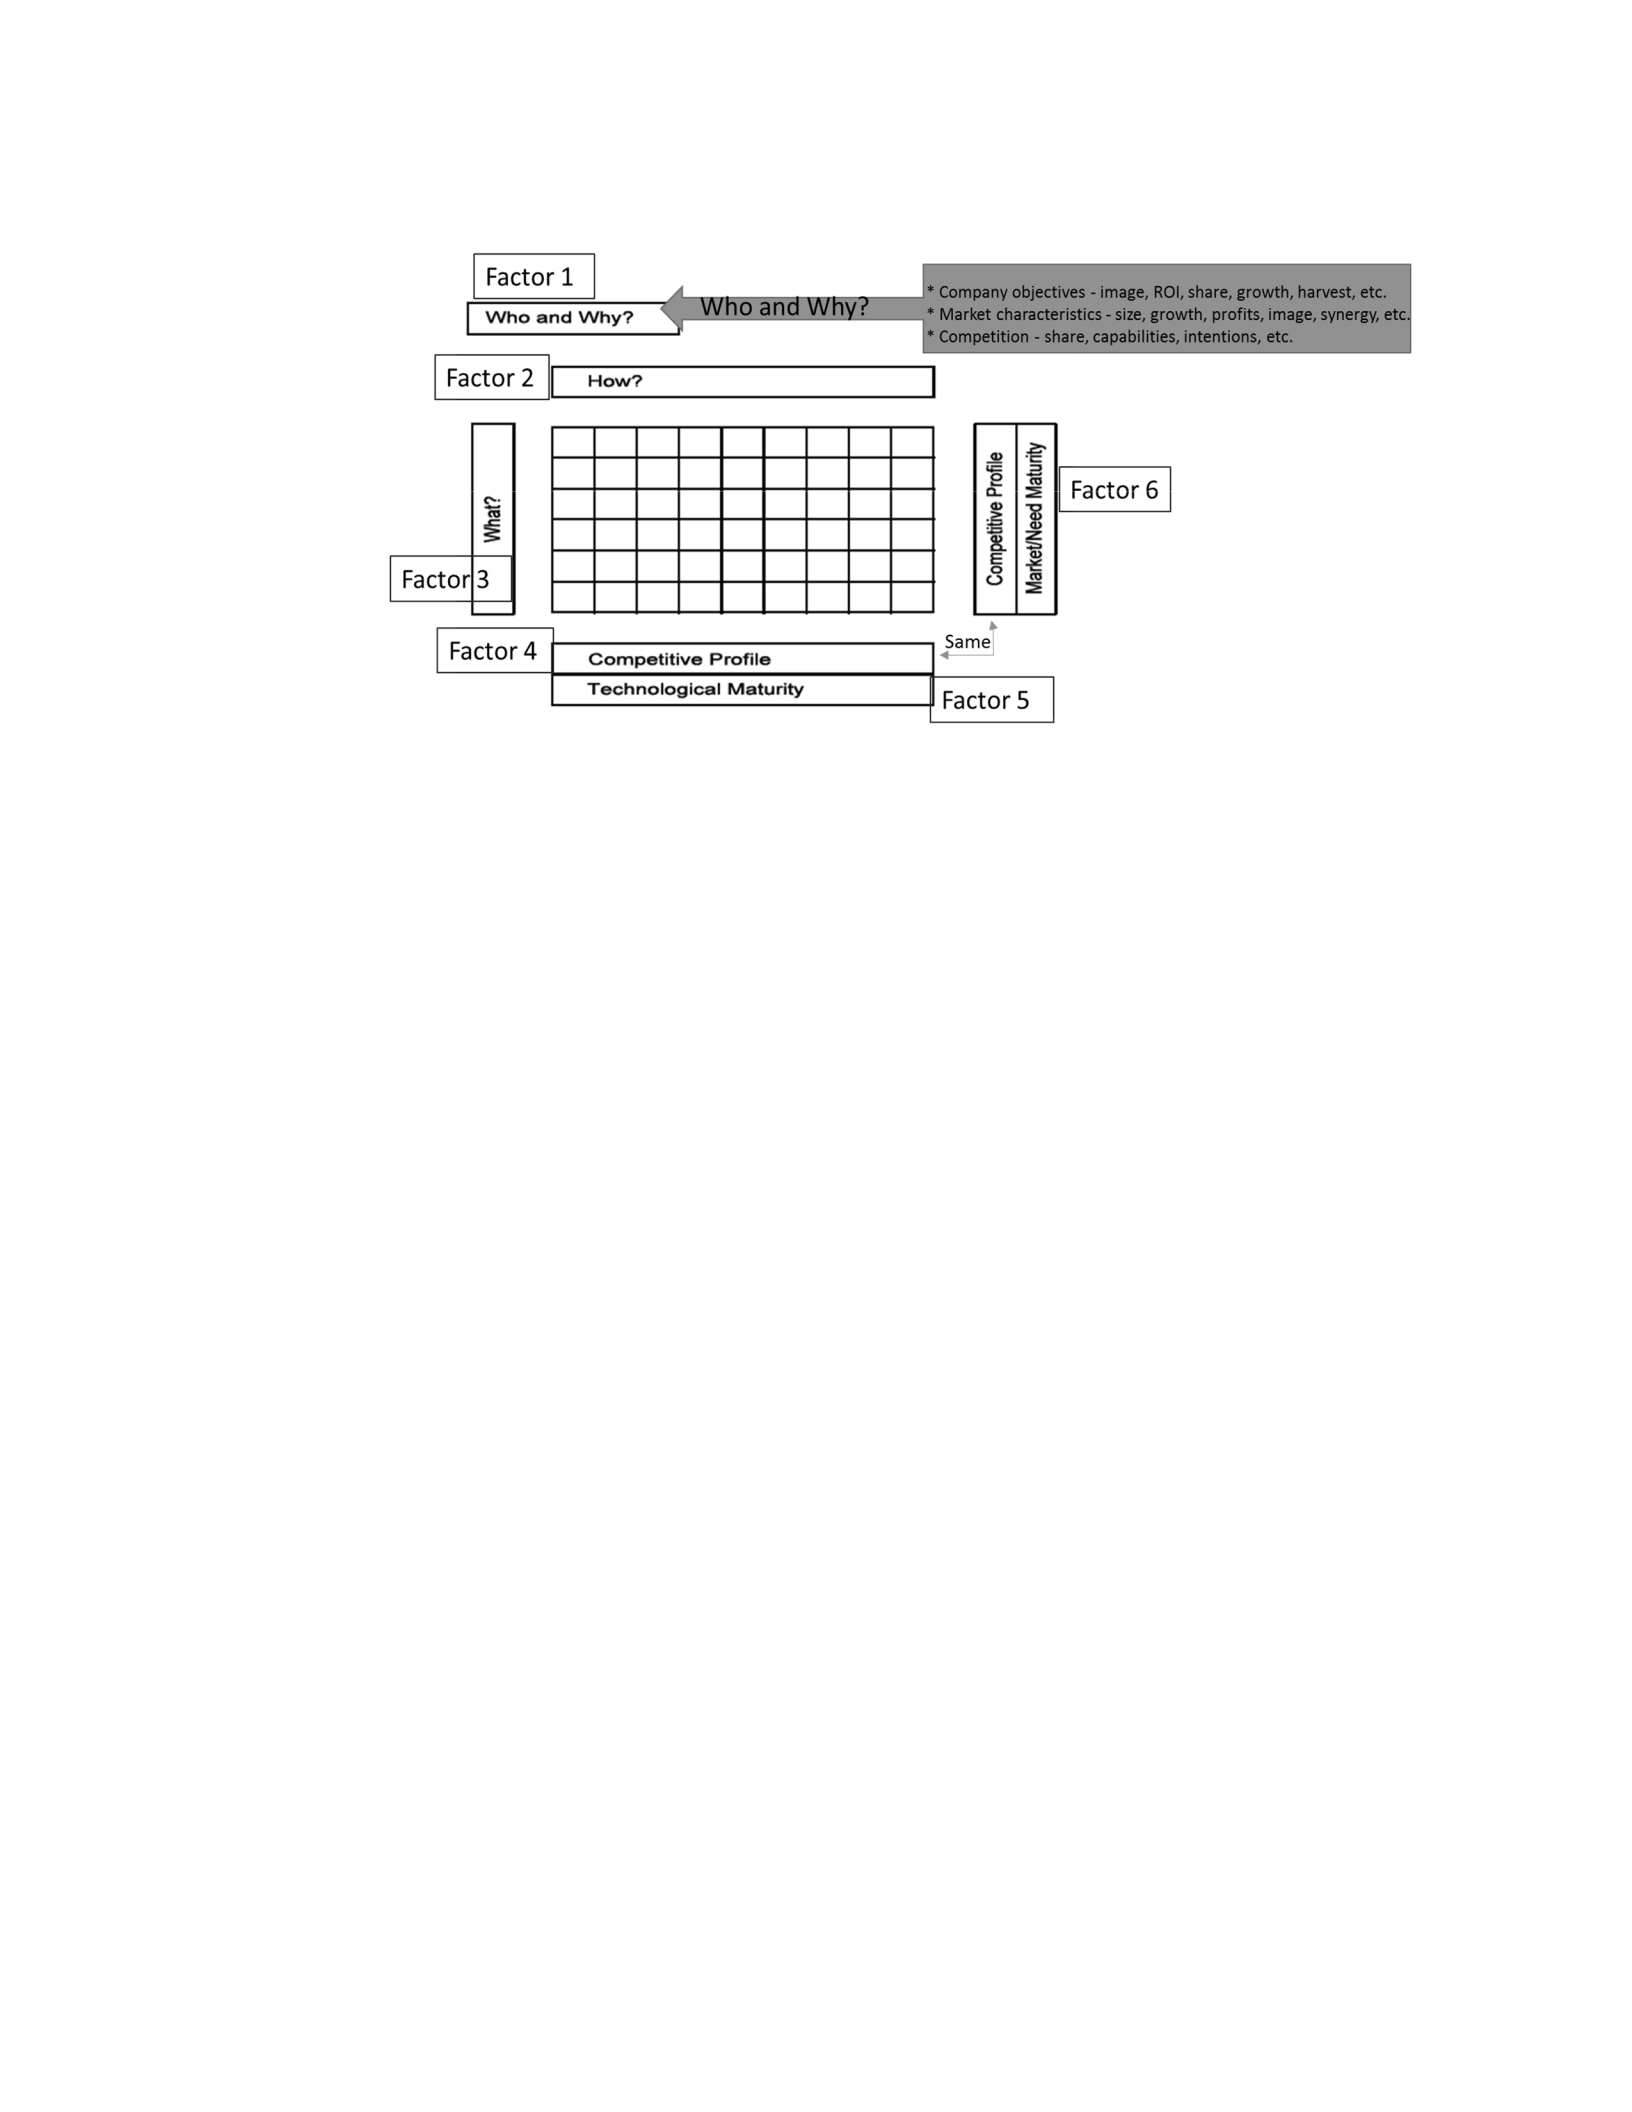
framework includes six factors that help companies determine which technology is most
beneficial (see Figure 3). The first factor is Who and Why box. The Who and Why box is
used to assess the product class relative to the market segment. Product class refers to a
broad range of related products or services used to address a customer need. The market
segments are investment decision patterns. The high interest segment means payoff
clusters for detailed assessment to save time and cost. Also, the Who and Why box
provides the comprehensive assessments of high interest segments including: (a)
company objectives (image, ROI, share, growth, harvest, etc.), (b) market characteristics
(size, growth, profits, image, synergy, etc.), and (c) competition (share, capabilities,
intentions, etc.).
7
Figure 3. Paap’s six factors. From Customer focused technology planning: An overview,
by J. Paap, 2010, p. 15. Retreived from http://www.jaypaap.com/articles/CFTP-2016-
06.pdf. Copyright 2016 by J. Paap. Reprinted with permission.
The market segment of my study was informaton technology (IT)/cloud computing, and
the product class of my study was cloud computing service selection and procurement.
The second factor of Paap’s CFTP framwork is How box. The How box is used to
identify the technology options available to provide, maintain, or improve important and
leveragable characteristics. Paap’s guidelines for assessing technology options and
relationships are:
• Identify technologies that do or might affect important leverage characteristics.
• Rank or rate the potential for the technology to maintain or improve
characteristics of importance.
• Estimate relative maturity and anticipate potential for obsolescence or
substitution.
• Determine the competitive relationship of technology as: (a) base (necessary and
available to all), (b) key (source of competitive advantage), (c) pacing

8
(technology expected to be future key), (d) exploratory (early stage with unclear
potential).
• Use benchmarking to compare competitors and identify “best in class,”
investment level, experience, strengths, and so on.
The third factor is called What box. The What box is used to identify what drove
the purchase or use decision. In my selected IT/cloud computing market segment, I first
assessed the characteristics that drove companies’ decisions to use cloud computing
services and procure them from a specific product class. The performance characteristics
should also include factors important to interested third parties who influence the
customers' buying decision, such as the third party’s procurement department, regulators,
or advocacy groups.
To fully understand what drives the purchase or use decision, it was often
necessary for project managers to consider cloud computing product performance
characteristics such as security, processing, storage, input/output, price, and provisioning.
Papp has divided assessment of performace characteristics into six steps. Step 1 is to
think broadly when defining the customer, and to consider users, buyers, decision
influencers, and so on. Step 2 is to list decision factors used by customers according to
categories on the sample chart as a starting point. This starts with understanding the
features they now desire, thinking backward to the needs these are addressing, and then
identifying additional features that may also meet those needs. Step 3 is to rank and/or
rate the past, present, and future importance of the features and/or needs. Step 4 is to
determine whether an improvement in the performance characteristic will increase use of

9
the product or service. The performance characteristic is a function of need maturity, and
the extent to which the underlying need is addressed drives decisions. The project
manager determine the minimum level of the performance that needs to be offered in
order for the product to be taken seriously in the market. The project manager also
determine the desired level, because further change was not perceivable, cannot be used,
or becomes less important than making improvements in another need or driver. Step 5 is
to compare competitors on each characteristic to determine “best in class” through
benchmarking. In addition, the most important consideration in this analysis deals with
the concept of leverage. Leverage is related to, but different from, importance because
importance is an absolute rating or ranking of all features or characteristics.
Competitive Profile box, the fourth factor in Paap’s CFTP, refers to each
competitor’s and/or company’s strength in the technology and ability to provide the
customers what they want in terms of delivering the right product requirements.
Competitive profile is categorized as strong, moderate, or low capability investments.
The fifth factor is Technology Maturity box that describes the approximate level
of improvement in the product and/or service. The project manager determine the
maturity of the technology was based on the Technology Readiness Level (TRL)
evaluations. The TRL was based on a scale from 1 to 9 with 9 being the most mature
technology. TRL 1 is the basic technology research maturity level. TRL 2 is the
technology concept and/or application maturity level. TRL 3 is the analytical and
experimental critical function and/or characteristic proof of concept maturity level. TRL
4 is the component and/or breadboard validation in laboratory environment maturity

10
level. TRL 5 is the component and/or breadboard validation in releant environment
maturity level. TRL 6 is the system/subsystem model or prototype demonstration in a
relevant environment maturity level. TRL 7 is the system prototype demonstration in an
operational environment maturity level. TRL 8 is the actual system completed and
qualified through test and demonstration maturity level. TRL 9 is the actual system
proven through successful mission operations maturity level. In addition, an important
task in the CFTP framework is to understand the relative maturity of the technology.
Paap categorized relative maturity according to the levels emerging technology, growing
technology, and mature technology. However, the relative maturity of the technology is
only part of the technology intelligence needed. The user must ask: Where is the
competition relative to you? What new technologies are attempting to replace the current
technology base? Will new technology take its place when the technology matures? Or
will technology become less important as competitors’ capabilities equalize?
The sixth factor is Market/Need Maturity box that shows an organization’s
success in the marketplace. The sixth factor helps technology investors understand the
dynamic environment in which needs constantly evolve and technologies mature and are
replaced by newer ones. It helps companies anticipate shifts in market needs and
technological capabilities that alter the current competitive environment, and increase the
probability for investment success.
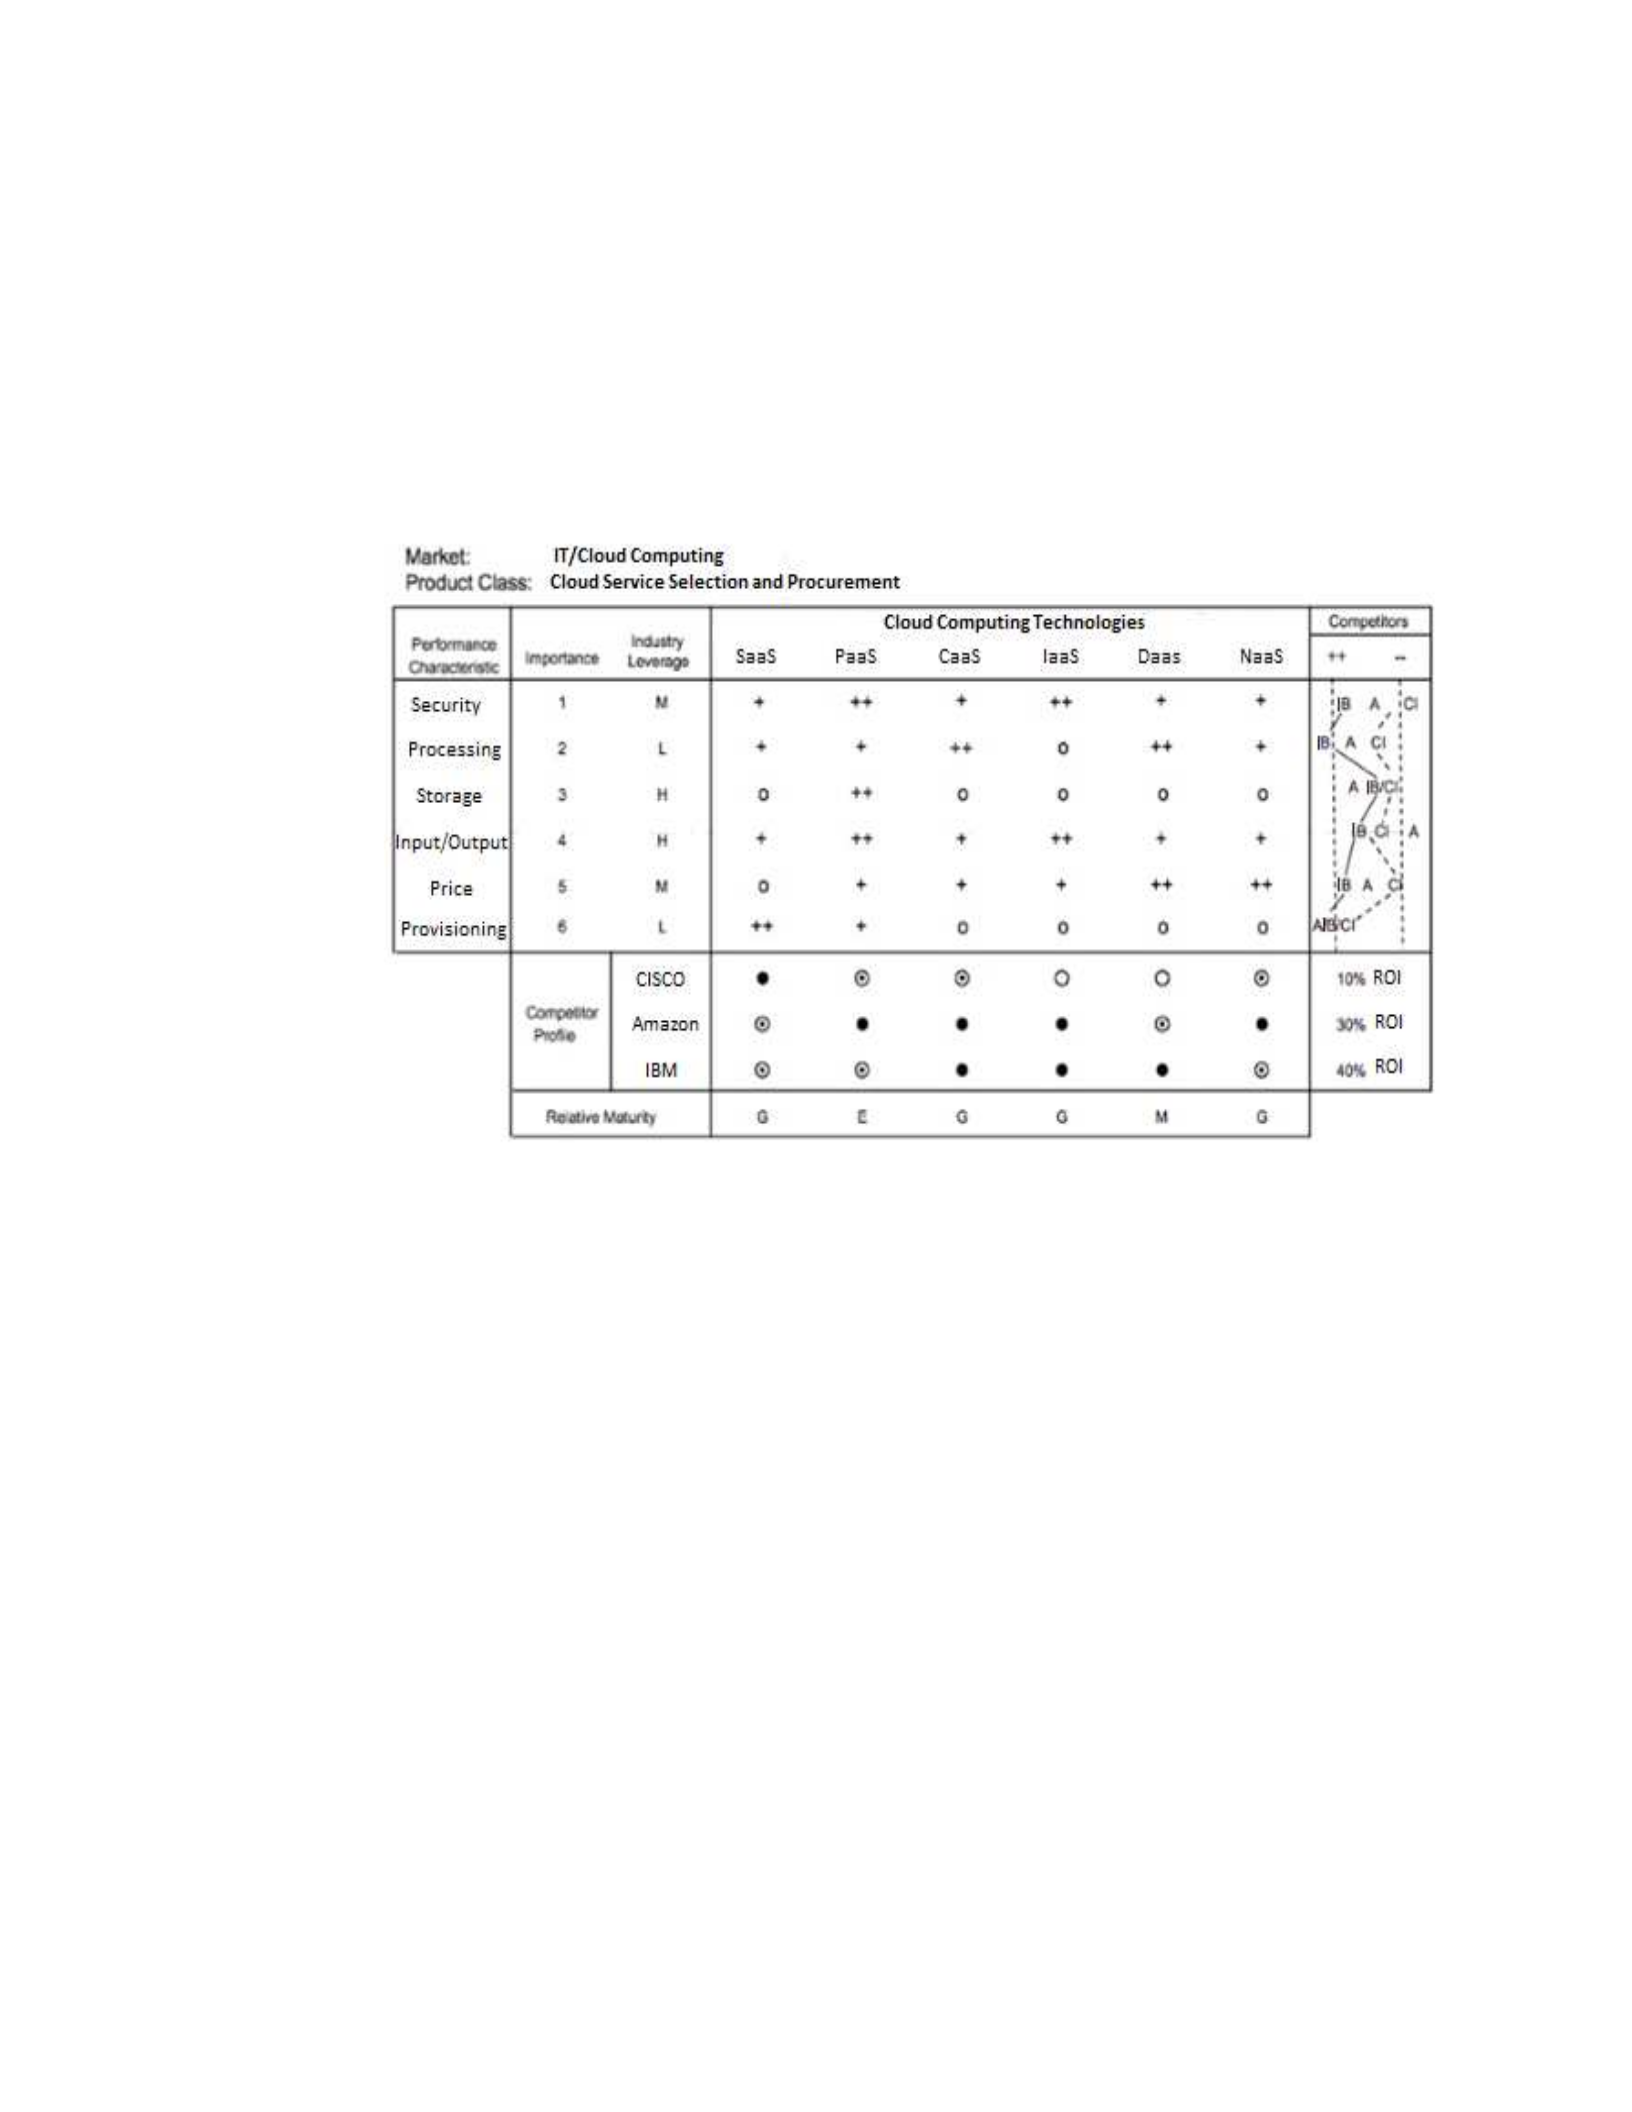
The output of Paap’s CFTP framework is shown in Figure 4. The CFTP
framework helps high tech companies integrate the diverse sources of information needed
to decide where to invest to get the greatest return from their technology dollars. Paap’s
11
CFTP framework helps high tech companies anticipate shifts in market needs and
technological capabilities that alter the current competitive environment, and increase the
technology investment probability for success. See Appendix B for information on
building Paap’s CFTP framework.
Figure 4. Paap’s CFTP framework development. From Customer focused technology
planning: An overview, by J. Paap, 2010, p. 15. Retreived from
http://www.jaypaap.com/articles/CFTP-2016-06.pdf. Copyright 2016 by J. Paap.
Reprinted with permission.
According to the Paap Associates Consulting website (2013), around 350
organizations are currently using Paap's CFTP framework. These organizations are
located in North America, Latin America, Europe, Africa, the Middle East, Asia, and the
Pacific region. Paap's CFTP framework has been used in both government and
commercial organizations from such diverse industries as automotive, computers,
electronics, energy, food processing, biotech, pharmaceuticals, oil, telecommunications,

12
consumer products, aerospace, chemicals, defense, and various government agencies and
federal labs.
IBM Institute for Business Value (2012) published an executive report on their
new Cloud Enablement Framework (CEF) that helps organizations understand the
relationship between cloud investments, value propositions, and value chains. The IBM
CEF is a competitive framework to Paap’s CFTP. Although Jurimae (2010), Wilkinson
(2009), Valerdi and Kohl (2004) have stressed the importance of risk assessment when
making decisions about technology investment, both the IBM CEF and Paap CFTP
frameworks do not include risk assessment of technology implementation. Jurimae
introduced the idea that technology risk management can enhance technology
procurement, and identified two barriers the stem from not using risk assessment in
technology procurement. The first barrier is the issue of failure of new technology
because of the increased level of risk during the research and development phase.
Another barrier for technology procurement is identifying and managing risk using the
technology roadmap (i.e., the technology planning phase). Therefore, Jurimae noted that
the process of technology procurement consists of technological risks. Jurimae’s primary
focus was on technological risks that impact performance of both service and product
production from the high tech companies. Other technological risks include contract
design and an award evaluation process not adequate for technology. Last but not least,
the risks of selecting the wrong technology may create problems, such as compatability
issues, if the procurement takes place before the market research is completed. Jurimae

13
(2010) concluded that an early stage of technology planning can help define some
investment options.
Wilkinson (2009) has stressed that technology investment failure results from
unrealistic expectations and failure to recognize the risks. Therefore, in this study I
sought to enhance strategic decision making using risk assessment. Risk assessment
covers the potential impacts and mitigating strategies to impove decision making in
technology investment. By using risk assessment in their technology decisions,
companies may have increased knowledge of the risks to their decisions.
Statement of the Problem
Jiang and Ruan (2010) recognized that one of the primary reasons for technology
investment losses was companies not performing risk assessments when making
technology investment decisions. Current studies are missing a robust investment
framework with added risk assessment that can be used to reduce profit loss. Bakht
(2015) also recognized the problem of the lack of risk assessment in technology
investment, such as science risk, technology risk, market risk, and regulatory risk.
Without risk assessment, investors have little choice but to make riskier and riskier
technology investment decisions that potentially lead to profit loss. The problem I
addressed in this study was that high tech companies are either losing money or getting a
much smaller than expected ROI when making technology investment decisions.
This quantitative study may resolve the gap of missing risk assessment that may
help to reduce monetary loss and increase ROI for firms making technology investment
decisions using Paap’s CFTP or similar frameworks IBM’s CEF. I use a cross-sectional

14
design to determine the ROIs of 35 cloud computing companies located in the United
States before and after adding risk assessment to Paap’s CFTP.
Purpose of the Study
The purpose of this research was to determine the relationship between returns on
investment before and after adding risk assessment to the CFTP framework. By adding
traditional risk assessment to the CFTP framework, high tech companies and their
technologists, investment strategists, and researchers might improve their technology
decision making processes for investments which may result in a higher return on their
investments.
This quantitative study was needed to resolve the gap of missing risk assessment
that may help to reduce monetary loss and increase ROI when for organizations making
technology investment decisions using Paap’s CFTP or similar frameworks. My findings
might be used by stakeholders to improve technology decision-making processes and
create a new technology management model. I believed the most important goal for a
technology company is making the right decisions that will maximize investment benefits
while minimizing risk. I thus sought to examine if Paap’s CFTP framework, when used in
in conjunction with risk assessment, contributes to improved ROI for cloud computing
technologies.
Quantitative measurement includes dependent and independent variables. In my
study, the dependent variable was ROI. The independent variable was market risk. In this
study, the risk assessment independent variable was an antecedent condition affecting the
ROI dependent variable, and the ROI dependent variable was the outcome.

15
Research Question
I conducted a study to determine the consequences of adding a traditional risk
assessment model to Paap's CFTP framework. The research question was: What is the
relationship to the return on investment by adding traditional risk assessment model to
Paap’s CFTP framework?
Research Hypotheses
The quantitative measurements included a dependent variable and an independent
variable. The influence of this market risk assessment independent variable on Paap’s
CFTP ROI dependent variable yielded the following hypotheses:
The null hypothesis (H
0
): The return on investment may not be positively related
to adding a traditional risk assessment model to Paap’s CFTP framework.
The alternative hypothesis (H
1
): The return on investment may be positively
related to adding a traditional risk assessment model to Paap’s CFTP framework.
The paired sample two-tailed t tests methodology was used to test above
hypothesis. The convention mathematical format is:
A two-tailed test: , the p-value is 0.000 (Reject at α = 5%)
where is the mean of first population (Before: No risk) and (After: Added
risk) is the mean of the second population. The null hypothesis equals 0
represents the condition that the populations are centered in the same spot. The two sided
0:
0:
211
21
≠− =−
µµ µµ
H
H
o
1
µ
2
µ
21
:
µ
µ
−
o
H

16
alternative hypothesis is that the means difference and does not equal 0. The
additional risk factor was market risk in cloud computing technology.
Theoretical Framework
In this study, I investigated Jay Paap’s CFTP framework and process to improve
technology investments. Another framework related to technology investment is
Benaroch, Lichtenstein, and Robinson’s (2006) option-based risk management (OBRiM)
theoretical framework. The OBRiM theoretical framework provides IT managers better
understanding of which risk mitigation strategy should be pursued in order to effectively
assess and handle technology risk. I also researched Lopez-Ortega, Concepcion, and
Viloria’s (2006) technology intelligence system (TIS) technology investment theory.
Lopez-Ortega, Concepcion, and Viloria’s (2006) theory provided the basics of competitor
behavior, technology management, and strategic decision making on technology
investment. Barnier (2014) describes how risk assessment will help investors make better
decisions quicker, which will then result in a higher ROI. Barnier’s assumption was that
world-class organizations are the ones that are able to set up their decision-makings
through a standardized technology framework with risk assessment in order to yield a
higher ROI.
Jay Paap’s CFTP is a planning framework designed to help firms focus their
technology investments in areas that will have a significant relationship to their markets,
their operations, and their shareholders. CFTP starts with the collection of information on
product capabilities, customer needs, technological maturity, and potential competitors.
211
:
µµ
−H

17
Given the complexity and diversity of information, Paap’s CFTP planning framework
uses a structured approach to building technology plans to support new product and
service initiatives. The CFTP has four planning steps:
1. Develop market profile.
2. Create a technology roadmap.
3. Identify technology investment opportunities.
4. Select projects and set priorities based on the business and technology
strategies.
Paap’s CFTP Who and Why box provides the high tech company’s ROI
dependent variable.
Albright and Kappel (2003) emphasized the importance of risk roadmaps to
technology planning. A risk roadmap can be used to identify major risk events for
monitoring during technology plan execution. The goal is to minimize the technological
risk or to limit its impact on a product investment and development. Albright and Kappel
(2003) used new risk management techniques to assess technology risk. These new
techniques, that they called neural networks and fuzzy logic (neuro-fuzzy), have three
distinguishing areas: (a) active monitoring to ensure the technology investment decision’s
sensitivity to detecting risk, (b) agility to ensure its flexibility to respond to risk, and (c)
adaptive learning to ensure the capability of the technology investment decision’s
resources to mitigate risk. After I investigated the neuro-fuzzy adaptive risk assessment
and realized such an approach would require large data sets for training the neural
18
networks, I decided to use the traditional risk assessment model. The traditional risk
assessment model was calculated by Risk = Likelihood × Consequence.
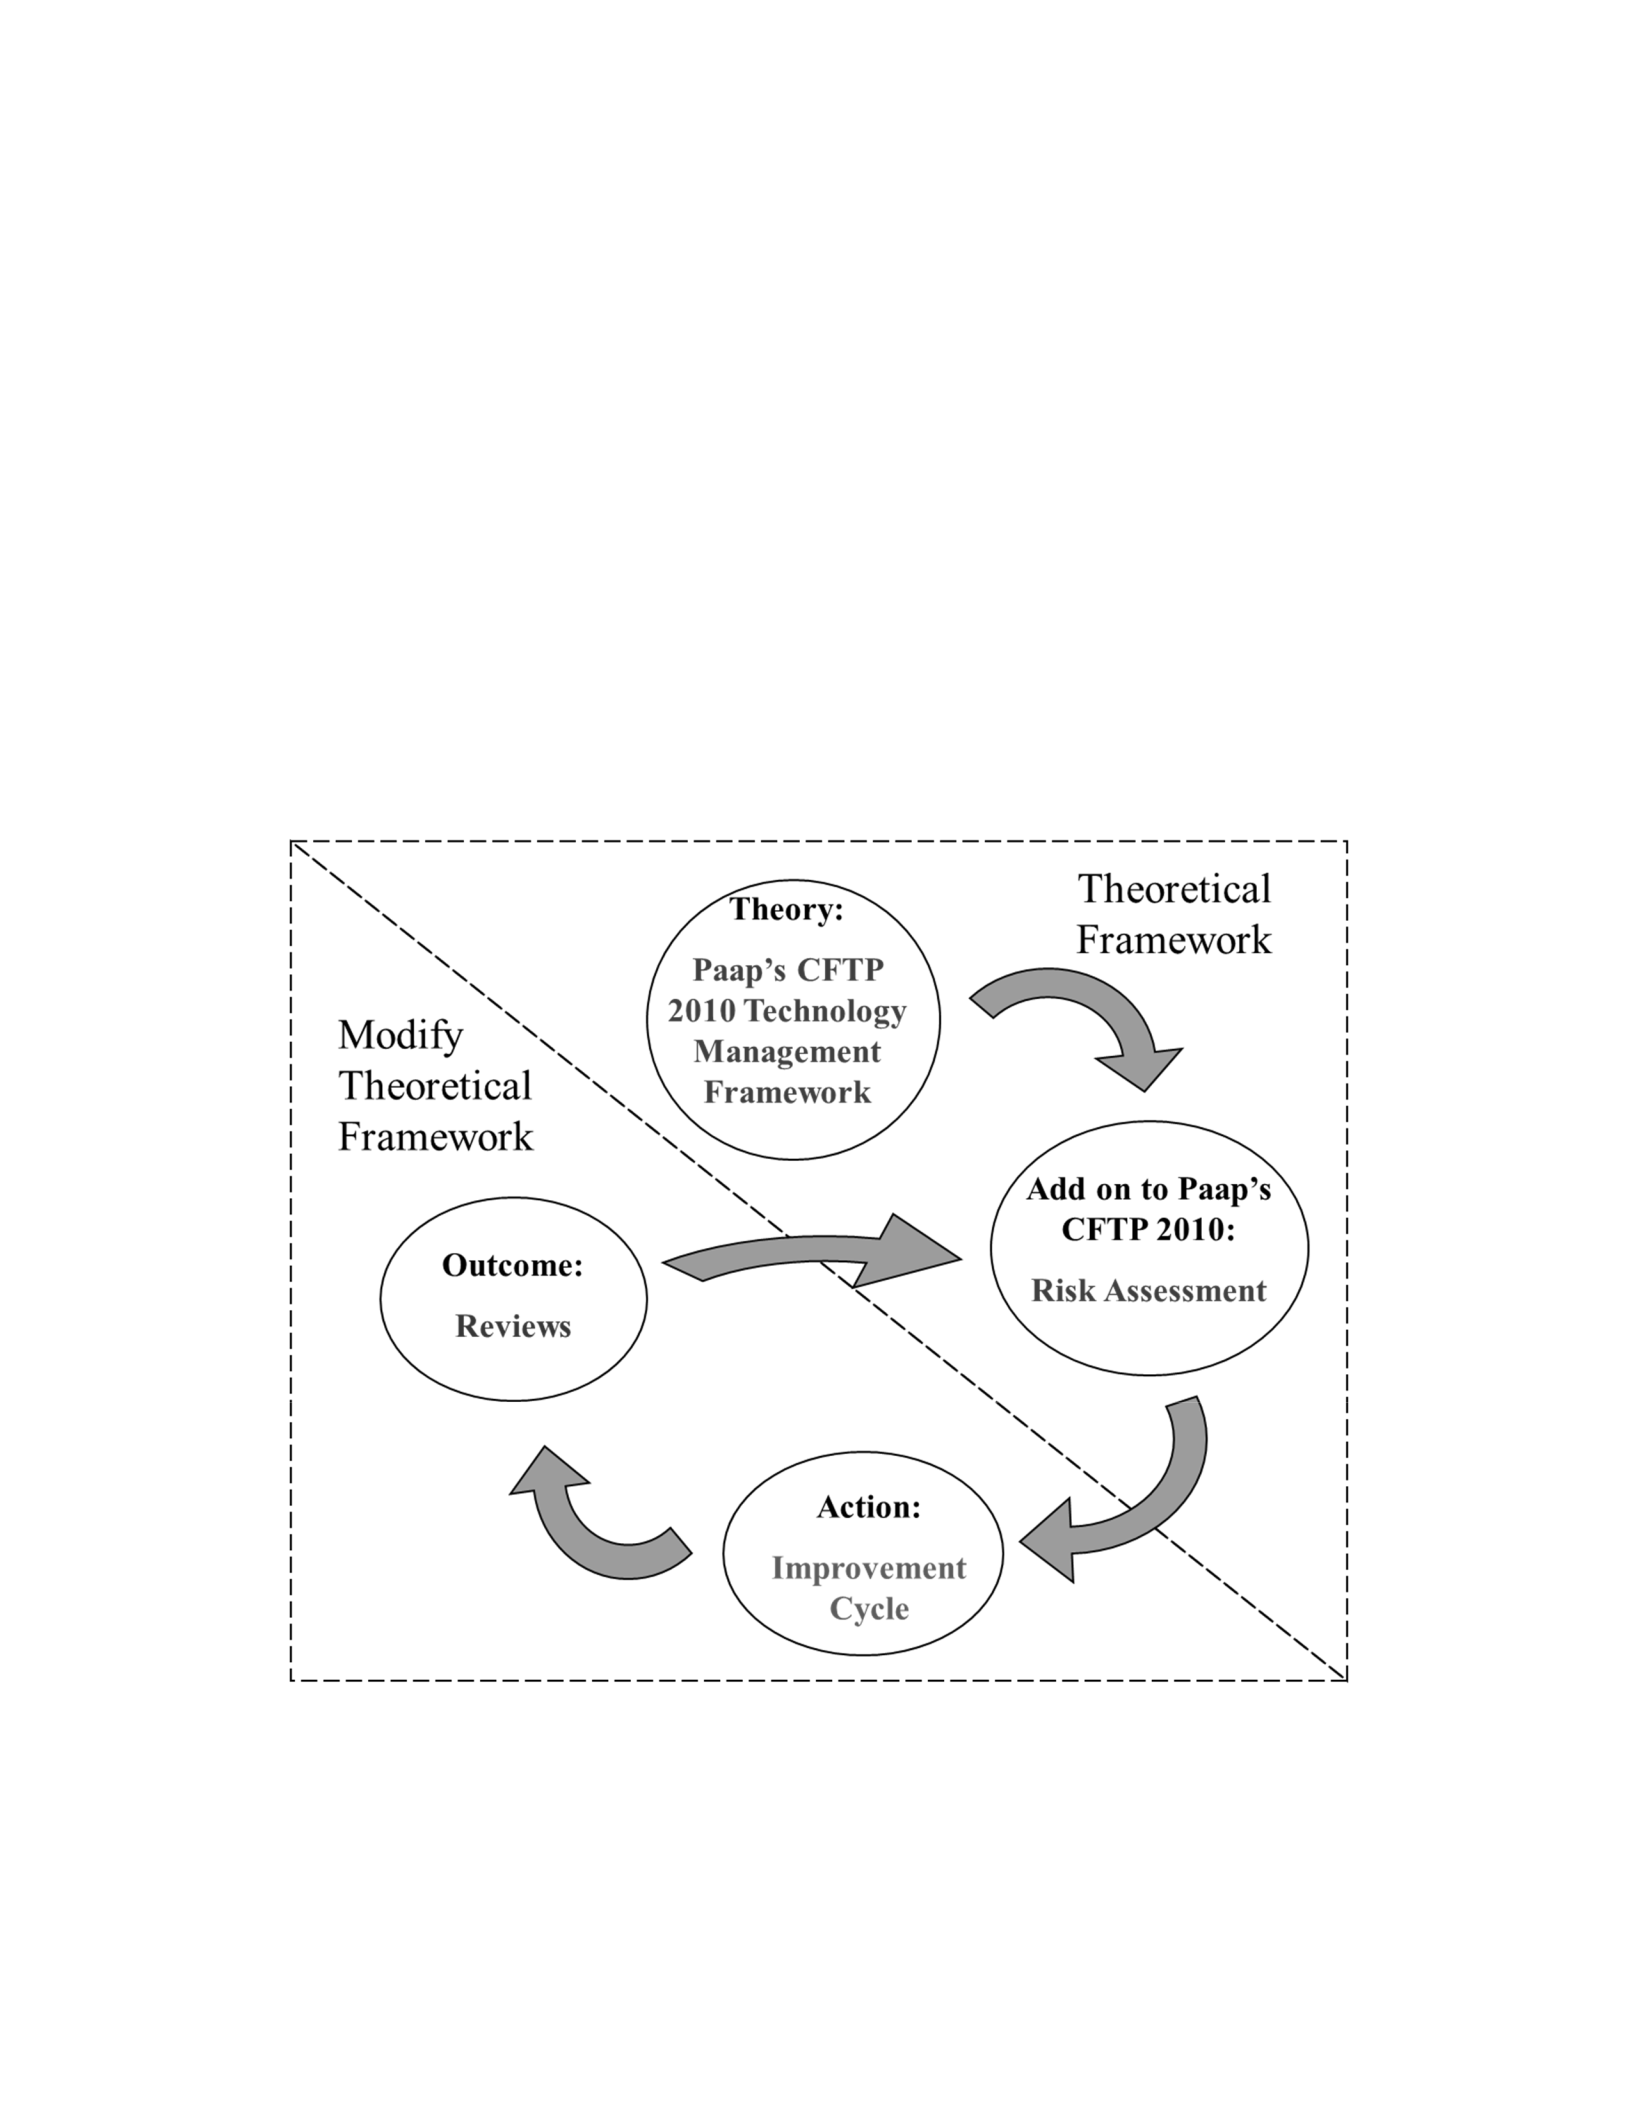
I used the theoretical action research cycle to modify Paap’s CFTP technology
framework. A pictorial representation of the theoretical action research cycle is shown in
Figure 5. Deming (1982) was the first to present the theory and concepts of the action
research cycle. The action research cycle was part of the theoretical framework used to
develop a solution to a specific issue between experts and researchers involving the
change process and the action needed for fact finding.
Figure 5. Modify theory and action research cycle.

19
Nature of the Study
I used a cross-sectional quantitative research design (i.e., ex-post facto design) to
compare the ROI using Paap’s CFTP framework with and without risk assessment for
cloud computing companies. By adding traditional risk assessment to the framework, the
high tech companies and their technologists, investment strategists, and researchers may
improve their technology decision making processes for investments, which might result
in a higher return on their investments. My quantitative study showed an improvement
using traditional risk management application.
Quantitative measurement includes dependent and independent variables. The
dependent variable in this study was ROI. The independent variable was market risk. In
my study, the risk assessment independent variable was an antecedent condition affecting
the ROI dependent variable.
ROI is a measure of the profit earned from each investment. To calculate ROI, the
return of an investment was divided by the cost of the investment. The result was
expressed as a percentage or a ratio in Equation 1:
ROI (%) = [(Gross Profit – Investment) / Investment] × 100
To get a better idea of how ROI was different from profit, let’s compare two investment
scenarios and have a look at the profit and ROI of each: an investment of $100,000 that
led to a gross profit of $150,000, and an investment of $10,000,000 that led to a gross
profit of $15,000,000. In the first scenario the net profit was $50,000, whereas in the
second one the net profit was $5,000,000. Using the same two scenarios, we can easily
calculate the ROI for each, as follows: ROI = [(150,000 – 100,000) / 100,000] x 100 and

20
ROI = [(15,000,000 – 10,000,000) / 10,000,000] x 100. The result was 50 in both cases,
meaning that both scenarios had a return of investment of 50%.
Risk was measure of a combination of the probability of occurrence of an event
(aka. likelihood) and its consequence. The traditional risk assessment was calculated
using Equation 2:
Risk = Likelihood × Consequence
I used a paired sample two-tailed t tests to compare Paap’s CFTP ROI variable
with and without traditional risk assessment associated with multiple technology project
investments. The alpha level was set at 0.05. See Chapter 3 for specifics regarding the
paired sample two-tailed t tests.
Operational Definition of Terms
The dependent variable was ROI. The independent variable was market risk
assessment.
Assessment of risk: The process of evaluating the potential risks using the
measurement of a combination of the probability of occurrence of an event (i.e., the
likelihood), multiplied by the consequence (Zavadskas, Turskis, & Tamošaitienė, 2010).
Decision driver: The performance characteristics with the greatest influence on
the purchase or use decision (Paap, 2010).
Innovation: The use of an old or new technology to improve the performance of a
new or old process, product or service sufficiently valued by potential users that they will
adopt it (Paap, 2010).

21
Risk management: A process to identify, assess, and prioritize risks (Jurimae,
2010).
Market risk: The uncertainty of market competition, such as market prospects,
product competitiveness, potential competitors, and marketing abilities (Albright &
Kappel, 2003).
Production risk: Uncertainties of production level, such as equipment, production
process change, production personnel constitution, and raw material supply (Albright &
Kappel, 2003).
Research and development (R&D) risks: The uncertainty of the R&D goal and
condition changes during R&D activities (Albright & Kappel, 2003).
Return on investment (ROI): Impact results of creating a new technology over the
company investments (Paap, 2010). ROI is a measure of the profit earned from each
investment. To calculate ROI, the return of an investment was divided by the cost of the
investment; the result was expressed as a percentage or a ratio.
ROI (%) = [(Gross Profit – Investment) / Investment] × 100
Risk limit: The point beyond which the user or purchaser of a product or service
no longer values the risk performance improvements (Paap, 2010).
Technology leverage: The extent to which an improvement in a performance
characteristic is perceived as having value by the users, purchaser, or influencer (Paap,
2010).

22
Technology life cycle: The roadmap of future technology and the investment risk
over a period of time (e.g., short term investment or long term investment; Jurimae,
2010).
Technology maturity: The stage of technology readiness level (Paap, 2010).
Technology risks: The probability of how mature the technology through the
measurement of a technical development in which the outcome was uncertain.
(Wilkinson, 2009).
Assumptions
According to Ulieru and Worthington (2006), bias occurs when people
make assumptions about preferences or abilities of others based on their cultural, racial,
ethnic, and gender characteristics. Therefore, my study was structured by the underlying
assumption that the data does not contain cultural, racial, ethnic, and gender biases. Any
of these biases may impact my traditional risk assessment model. Another assumption
was that the data from the participants can be correctly measured. If the participant data
does not satisfy these assumptions, the statistical results will not be a precise reflection of
reality. If this assumption was not met, it could affect the way the results are interpreted
and could lead to serious errors in the statistical tests.
Scope/Delimitations
My research population was limited to 35 cloud computing companies located in
the United States that invested $100 million or more in cloud computing technology. This
population carries a temporal limitation, because cloud computing was a technology trend
that started in 2009. In practice, the sample size used in this study was determined based

23
on the expense of data collection and the need to have sufficient statistical power.
Therefore, I performed a power analysis for my cross-sectional design. The power
analysis showed that I needed a total sample size of 24 to determine the probability of
detecting an effect of a given size with a given level of confidence, under sample size
constraints.
The data I used in developing the revised CFTP framework were from 35 cloud
computing companies. The 35 cloud computing companies provided the data to compare
the output of Paap’s ROI with and without risk assessment. This traditional risk
assessment model can potentially be used by any high tech company. The research
excluded an investigation of Shortreed, Hicks, and Craig’s (2003) generalized risk
management framework (RMF). A generalized RMF defines the processes and the order
and timing of processes that are used to manage risks.
Limitations
One limitation of this cross-sectional study was that the risk calculations were
based on the subjective opinions of people using the 5x5 traditional risk matrix.
Therefore, the results of my study are dependent on people’s accurate determination of
risk. Another limitation was that the data collected for the research was from the
economic downturn experienced from 2009 to 2014, which caused a decrease in the
amount of money invested in technology research. This, in turn, reduced the number of
companies that could participate in this study.

24
Significance of the Study
The value and benefit of my research is that it may be used to improve technology
decision-making processes and create a new technology management model. A
quantitative study that added risk assessment to Paap’s CFTP framework was necessary
to improve investment decision-making, and possibly to protect from another financial
crash, such as the 2008 global financial crisis. Being able to incorporate the risk
assessment into Paap’s CFTP framework may allow for better risk management within
investment portfolios involved in these high tech cloud computing companies. The
positive social change that may result from this research is better risk control in cloud
computing investment portfolios. This may create stronger businesses that grow the
global economy. Additionally, the main significance of this study was that the results
may help further improve technology planning processes and better meet the needs of the
cloud computing companies and their technologists, investment strategists, and
researchers. Also, this research can be valuable to economists, policymakers, and market
participant.
Importance for Social Change
The positive social change that may result from this research is better risk control
in cloud computing investment portfolios. This positive social change may create
stronger businesses that may help grow the global economy. Additionally, the main
significance of this study was that the results may help further improve technology
planning processes and better meet the needs of the cloud computing companies and their

25
technologists, investment strategists, and researchers. Also, this research can be valuable
to economists, policymakers, and market participant.
Summary
In Chapter 1, I proposed adding a traditional risk assessment model to
Paap's CFTP framework. The problem was that high tech companies are either losing
money or getting a much smaller than expected ROI when making technology investment
decisions. The purpose of this research was to determine the relationship between returns
on investment before and after adding risk assessment to the CFTP framework. The
quantitative study resolved the gap of missing risk assessment that helped to reduce
monetary loss and increase return on investment when making technology investment
decisions. This research may be used to improve technology decision-making processes
and create a new technology management framework. In addition, I presented the
research question and hypotheses and discussed the theoretical framework, operational
definition of terms, assumptions, limitations, and scope, as well as the significance of the
study and its consequences for social change. In Chapter 2, I offer a review of the
professional and academic literature related to my research problem.

26
Chapter 2: Review of Literature
Paap's CFTP is a planning framework to help technology investors create a profile
of technology investments. The purpose of this research was to determine the relationship
between returns on investment before and after adding risk assessment to the CFTP
framework . The literature review formed the basis of this quantitative study. The
primary research question I addressed in the study was: What is the relationship to the
return on investment by adding traditional risk assessment to Paap’s CFTP framework? I
conducted a review of the academic literature and established the context for the problem
statement. The problem was that high tech companies are either losing money or getting a
much smaller than expected ROI when making technology investment decisions. Jiang
and Ruan (2010) recognized that one of the primary reasons for these losses was that
companies were not performing risk assessment when making technology investment
decisions. Current studies are missing a robust investment framework with added risk
assessment to reduce profit loss. Bakht (2015) also recognized the lack of risk assessment
in technology investment, including assesment of science risk, technology risk, market
risk, and regulatory risk.
Without risk assessment, investors have little choice but to make riskier and
riskier technology investment decisions that leads to profit loss. For example, Merrill and
Kang’s (2014) research results showed a potential number of hidden costs with cloud
computing that many may not have considered. Therefore, they determined that risk
assessment was the next step needed to predict the actual costs of cloud computing and
the potential ROI. The results of Barnier’s (2014) research showed the benefits of risk

27
assessment. The benefits help investors make better decisions and more quickly, and also
help them consider the opportunities for cost savings in technology investment. In my
quantitative study, I resolved the gap of missing risk assessment that helped to reduce
monetary loss and increase return on investment when making technology investment
decisions. My research involved adding risk assessment to Paap’s CFTP framework in
order to help investors: (a) make better decisions, quicker; and (b) obtain a high return on
technology investment. By adding traditional risk assessment to the framework, the high
tech companies and their technologists, investment strategists, and researchers may
improve their technology decision making processes for investments, which might result
in a higher return on those investments.
The review of the literature begins with an overview of technology strategic
planning framework. The literature review next includes summaries of technology
investment profile. The review content includes technology investments opportunities
and financial growth. The review also includes discussion of the risk and technology
management. The review discussion compared two models for the study: a) Neuro-Fuzzy
Risk Assessment Model and b) Traditional Risk Assessment Model. The literature review
concludes with a description of the potential relationship on ROI with and without risk
assessment.
Literature compiled for the review included peer-reviewed and other scholarly
journal articles, published books, technical and business reports. Website content and
technology investment articles served as supporting evidence for my study. I also
obtained documents from online databases available through the Walden University

28
Library, with specific databases used including Business Source Complete, EBSCO,
IEEE Xplore, National Bureau of Economic Research, SAGE Premier, ProQuest Central,
and ScienceDirect. Use of the Google search engine enabled the identification of
technical and business reports of relevance to the study topic. Jay Paap Associates
website served as the source for 2010 CFTP theoretical framework for the study.
Additionally, the literature review provided background information for my
research dependent and independent variables. The dependent variable was ROI. The
independent variable was market risk assessment. Also, the new cloud computing
technology domains cut across these complex risk assessments and are directly affected
by decision making processes on future technology investments. The list of key search
terms are technology planning, technology roadmap, adaptive risk assessment, traditional
risk assessment, return on investment (ROI), and technology investment.
In this section, I included the scope of literature searches between the year of
2009 and the year of 2014. The review was based on peer-reviewed sources from the
Business Source Complete, EBSCO, IEEE Xplore, National Bureau of Economic
Research, SAGE Premier, ProQuest Central, and ScienceDirect databases. The following
key words were used: business, technology, risk management, economic and investments.
The source of literature search are business sources, IEEE peer-reviewed technical
papers, economic research peer-reviewed papers, technical and business reports, as well
as, Jay Paap Associates website served as the source for 2010 CFTP theoretical
framework for the study.

29
Technology Strategic Planning Framework
Jay Paap (2010) designed the CFTP planning framework to help firms focus their
technology investments in areas that will have a significant relationship to their markets,
their operations, and their shareholders.
Paap's CFTP framework provides six factors that help companies to determine
which technology was most beneficial. Paap lists the generic CFTP framework with six
factors shown in Figure 6. The first factor was the Who and Why box. The Who and Why
box was to assess the product class vs. the market segment. Product class refers to a
broad range of related products or services used to address a customer need. The market
segments are investment decision patterns. The high interest segment means payoff
clusters for detailed assessment to save time and cost. Also, the Who and Why box
provides the comprehensive assessments of high interest segments:
- Company objectives - image, ROI, share, growth, harvest, etc.
- Market characteristics - size, growth, profits, image, synergy, etc.
- Competition - share, capabilities, intentions, etc.

30
Figure 6. Generic CFTP framework. From Customer focused technology planning: An
overview, by J. Paap, 2010, p. 15. Retreived from
http://www.jaypaap.com/articles/CFTP-2016-06.pdf. Copyright 2016 by J. Paap.
Reprinted with permission.
The market segment of my study was Informaton Technology (IT)/Cloud Computing and
the product class of my study was cloud computing service selection and procurement.
The second factor was Paap’s CFTP How box. The How box was to identify the
technology options available to provide, maintain, or improve important and leveragable
characteristics. The guidelines for assessing technology options and relationships are
listed below:
• Identify technologies that do or might affect important leverage characteristics.
• Rank or rate the potential for the technology to maintain or improve
characteristics of importance.
• Estimate relative maturity and anticipate potential for obsolescence or
substitution.

31
• Determine the competitive relationship of technology:
- Base - necessary and available to all
- Key - source of competitive advantage
- Pacing - technology expected to be future key
- Exploratory - early stage with unclear potential
• Use benchmarking to compare competitors and identify “best in class”,
investment level, experience, strengths, etc.
The third factor was called the What box. The “What box” states what drove the
purchase or use decision. In my selected IT/Cloud Computing market segment, I first
assess the characteristics that drive the decision to use cloud computing service slection
and procurement product class. The performance characteristics should also include
factors important to interested third parties who influence the customers' buying decision,
such as the third party’s procurement department, regulators, or advocacy groups. To
fully understand what drives the purchase or use decision, it was often necessary to
consider cloud computing product performance characteristics such as security,
processing, storage, input/output, price, and provisioning. The steps on how to assess
performance characteristics were listed as: Step 1 is to think broadly when defining
customer; consider users, buyers, decision influencers, etc. Step 2 is to list decision
factors used by customers using categories on the sample chart as a starting point. This
starts with understanding the features they now desire, thinking backward to the needs
these are addressing, and then identifying additional features that may also meet those
needs. Step 3 is to rank and/or rate the past, present and future importance of the features

32
and or needs. Step 4 is to determine whether an improvement in the performance
characteristic will increase the use of your product or service - its leverage. The
performance characteristic was a function of need maturity and the extent to which the
underlying need being addressed drives decisions. Determine the minimum level of the
performance that needs to be offered in order for the product to be taken seriously in the
market. Determine the desired level, because further change was
not perceivable, cannot be used, or becomes less important than making improvements in
another need or driver. Step 5 is to compare competitors on each characteristic, such as
determining “best in class” through benchmarking. In addition, the most important
consideration in this analysis deals with the concept of leverage. Leverage was related to,
but different from importance. Importance was an absolute rating or ranking of all
features or characteristics. In addition, the most important consideration in this analysis
deals with the concept of leverage. Leverage was related to, but different from
importance. Importance was an absolute rating or ranking of all features or
characteristics.
The Competitive Profile box, also known as Paap’s CFTP fourth factor, refers to
the strength in the technology by each competitor and/or company, as well as, providing
the customers what they want in terms of delivering the right product requirements.
Competitive profile was categorized as strong, moderate, or low capability investments.
The fifth factor was the Technology Maturity box that described the approximate
level of improvement in the product and/or service. The maturity of the technology was
defined by the Technology Readiness Levels (TRL). The TRL was based on a scale from

33
1 to 9 with 9 being the most mature technology. TRL 1 is the basic technology research
maturity level. TRL 2 is the technology concept and/or application maturity level. TRL 3
is the analytical and experimental critical function and/or characteristic proof of concept
maturity level. TRL 4 is the component and/or breadboard validation in laboratory
environment maturity level. TRL 5 is the component and/or breadboard validation in
releant environment maturity level. TRL 6 is the system/subsystem model or prototype
demonstration in a relevant environment maturity level. TRL 7 is the system prototype
demonstration in an operational environment maturity level. TRL 8 is the actual system
completed and qualified through test and demonstration maturity level. TRL 9 is the
actual system proven through successful mission operations maturity level. In addition,
an important task of the Paap’s CFTP framework was to understand the relative maturity
of the technology. Relative maturity was categorized as emerging technology, growing
technology, and mature technology. The relative maturity of the technology was only part
of the technology intelligence needed. Where is the competition relative to you? What
new technologies are attempting to replace the current technology base? Will new
technology take its place, when the technology matures? Or will technology become less
important as competitors’ capabilities equalize?
The sixth factor was the Market/Need Maturity box that states your success in the
marketplace. The sixth factor helps technology investors to understand the dynamic
environment in which needs constantly evolve and technologies mature and are replaced
by newer ones. It helps companies anticipate shifts in market needs and technological
34
capabilities that alter the current competitive environment, and increase the success
investment probability.
The output of the Paap’s CFTP framework with six factors needed to understand
the link between customers’ needs and technology investment options was shown on
figure 7. The Paap’s CFTP framework helps high tech companies integrate the diverse
sources of information needed to decide where to invest to get the greatest return from
their technology dollars. Paap’s CFTP framework helps high tech companies anticipate
shifts in market needs and technological capabilities that alter the current competitive
environment, and increase the technology investment probability. See Appendix B for
building Paap’s CFTP Framework. A good technology plan should cover technology
decisions in the mission of the organization to increase operational efficiency and
effectiveness.
Figure 7. Output of Paap’s CFTP framework. From Customer focused technology
planning: An overview, by J. Paap, 2010, p. 15. Retreived from

35
http://www.jaypaap.com/articles/CFTP-2016-06.pdf. Copyright 2016 by J. Paap.
Reprinted with permission.
Benaroch, Lichtenstein, and Robinson’s (2006) developed their OBRiM
theoretical framework in a study of 50 IT investments at a large Irish financial services
organization (FSO). Their primary concern was to find the risk factors associated with IT
and its controlling values or variables, and their secondary concern was to maximize
value in IT investment decisions. The authors drew from a theoretical background to
support their research in information systems (IS) risk management and the OBRiM
framework. Benaroch, Lichtenstein, and Robinson (2006) stated, “two issues in the area
of IS risk management are listed as (1) How do we approach IT risk management from an
economic perspective? (2) How do we choose adequate mitigations and combine them to
effectively address specific risks” (p. 836). The first issue deals with economic impact
associated with different risk factors in IT management. The second issue deals with risk,
flexibility, and real options to assign a high, medium, or low risk decision relative to the
IT managers. The OBRiM framework provided an integrated solution to resolve the two
issues. To support the theoretical framework, the authors claimed, “OBRiM formalizes
this idea by viewing real options as high-level risk mitigation strategies for building
different forms of flexibility necessary to deploy corrective actions when risk occurs. It
helps to find a combination of options that adds the most value relative to the risk specific
to an investment” (Benaroch, Lichtenstein, & Robinson, 2006, p. 832). Benaroch,
Lichtenstein, and Robinson (2006) used regression testing to test the relationship between

36
the risk factors identified and the real options present in projects exposed to these risks.
The results indicated a strong relationship between risk factors and return on investments.
Technology Investment Profile
Aggarwal (2010) investigated the economy and business transformations in
India. The transformation included global integration, corporate restructure, domestic
mergers and acquisition (M&A), and oversea technology investments. India applied three
theoretical concepts to increase ROI and lower risk taking. The three concepts were the
Indian Foreign Direct Investment (FDI) model, the Ownership Location
Internationalization (OLI) paradigm, and the Process Theories of Internationalization
(PTI) Uppsala Model. These concepts were used to create a new hybrid theory called
Outward FDI improvement. Four types of advantages for oversea markets and
businesses, such as low cost production, natural endowment driven technologies, low cost
versions of expensive products, and leverage cultural and institutional understanding to
reduce the cost and risks of operations. Aggarwal (2010) described the summaries of the
globalization of Indian economy development using cross-border M&A, as well as, lower
transactions costs through new technology investments. After reading Aggarwal’s 2010
economy and business transformations paper, I decided to investigate United States cloud
computing companies’ ROI with added risk assessment to Paap’s CFTP framework.
Risk and Technology Management
The risk roadmap can be used to identify major risk events during execution of
technology plan. Albright and Kappel (2003) defined the risk roadmapping process in a
concise way. The risk roadmap consists of five major areas: market risks, technical risks,

37
schedule risks, economic risks, and resource risks. Albright and Kappel (2003) presented
the risk and technology roadmap that are organized by the return on investment priorities.
The goal of Albright and Kappel (2003) research was to minimize the risk or to limit its
impact to a product investment and development.
Technology roadmaps are becoming popular as tools to manage the future of
technology. Lopez-Ortega, Concepcion, and Viloria (2006) suggested using technology
roadmap and technology intelligence to improve the technology procurement decision-
making process. Lopez-Ortega, Concepcion, and Viloria (2006) data collection methods
are survey and interview questions. The first survery consisted of twelve questions and
the second survey only included six questions related to the strategic planning process of
the technological research and development center. Lopez-Ortega, Concepcion, and
Viloria (2006) research participants were 158 managers of the technological research and
development center. But only 21 out of 158 answered the the twelve item questionnaire,
yielding 13.3% participation. The second survery was sent to those 21 participants who
had participated during the first survery and all 21 participants answered the six item
questionnaire, yielding 100% participation. The 21 participants were categorized in three
categories: (a) public university, (b) private company, and (c) the research public center.
The outcome of Lopez-Ortega, Concepcion, and Viloria (2006) study was that the
Institute of Engineering of the National University of Mexico developed a technological
roadmap process (Lopez-Ortega, Concepcion, & Viloria, 2006, p. 32). The technological
roadmap process can be used to improve Paap’s CFTP technology investment
framework by adding risk assessment.

38
Neuro-Fuzzy Risk Assessment Model
Ebrat and Ghodsi (2011) conducted a mixed-method research to evaluate project
risk using a new adaptive Neuro-Fuzzy risk assessment model referenced in Appendix A.
I used a very similar Neuro-Fuzzy adaptive risk assessment model, but only two layer of
calculation. The two layer neural network and fuzzy logic used the generalized Nyquist
theorem to solve for training set size reduction between 25 to 28 samples. Choosing the
smallest but still sufficient set of training vectors results in a reduced learning time for the
network and fuzzy logic. After I computed the two layer Neuro-Fuzzy adaptive risk
assessment calculation with 35 raw sampling data, I decided to use traditional risk
assessment model. Because trained neural network and fuzzy logic does not have an
accurate approximation using 35 data samples. In addition, Ebrat and Ghodsi (2011)
suggested to training 70% sample sizes and test 30% sample sizes with 100 to 500
sampling in order to obtain the acceptable error percentages.
Traditional Risk Assessment Model
The traditional risk assessment was calculated by Risk = Likelihood ×
Consequence. In addition to traditional risk assessment, Kahneman and Lovallo (2006)
pointed out three shortcomings that led to poor decisions in response to risk. The first
shortcoming was loss aversion. As a consequence, inaction was favored over action and
the status quo over alternatives since loss aversion leads to an avoidance of risks. The
second shortcoming was near-proportionality, which the individuals seems to be
proportionately risk averse. For example, the cash equivalent that they demand for a 50%
chance of winning $ 100 increases close to proportionately as the amount was increased

39
to $ 1000 or $ 10,000 or even $ 100,000.This behavior was not consistent with any well
behaved risk aversion function, since the cash equivalent should decrease much more
dramatically as the size of the gamble increases. In decision terms, this would imply that
managers are unable to differentiate appropriately between small risks vs. large risk. The
third shortcoming was narrow decision frames, which was the decision makers tend to
look at problems one at a time, rather than consider them in conjunction with other
choices that they may be facing now or will face in the future. This would imply that the
portfolio effect of a series of risky decisions was not factored in fully when evaluating
each decision on its own. Kahneman and Lovallo (2006) research results concluded that
managers have trouble dealing with risk because the possibility of losses skews their
decision making processes, the inability to separate small risks from large risks and the
failure to consider the aggregate effect of risky decisions.
In addition, Chabrow’s 2012 cloud computing survey was highly related to my
research on adding risk assessments to improve cloud computing investments.
Information Security Media Group Survey Results Report (2012) showed cloud
computing initiatives are relatively new for many organizations. Nearly 1 in 3 survey
respondents say their organizations are not using the cloud, a strikingly high percentage
considering how quickly the computing platform was maturing. Also, the survey showed
that just over 40 percent of respondents’ organizations allocated 10 percent or less of
their IT budgets on public, community and hybrid clouds, with just over one-third
earmarking money for private clouds. Nearly 40 percent of respondents say their
organizations didn’t allocate any money for public/community/hybrid clouds; less than a

40
quarter didn’t apportion any funds for the private cloud. Still, cloud computing was
perceived to lower costs and provide other benefits to the organization. Therefore,
organizations must weigh the benefits against the risks when determining whether to
implement a cloud computing solution.
Return On Investment (ROI)
To address the potential cloud computing investment risk, Spínola (2012)
proposed a technology investment monitoring system so that an investor an measure the
performance, as well as, continuing to measure the ROI. The technology investment
monitoring system performs ROI analysis to increase the understanding of the true costs
associated with adopting cloud services. Spínola (2012) also considered a comprehensive
ROI to show hardware savings and possible infrastructure costs, personnel savings
associated with reduced IT support, increased organizational efficiency, as well as
monthly service provider subscription costs. Kuo, Bhatia, and Chang (2010) worked on
IBM cloud computing return on investment methodology. The ROI methodology are
carefully evaluated without risk assessment. Kuo, Bhatia, and Chang (2010) collected the
existing IT infrastructure and current operational data to calculated the ROI. With the
baseline data, a cost-benefit approach can be used to compare the current environment to
the cloud implementation from IBM. The IBM ROI methodology uses a three-step
process to calculate the ROI, net present value (NPV), and payback period and the three-
step process was listed as:
Step 1. Project the benefits from reduced IT costs. These benefits include cost
savings. The cost savings are from hardware, software, maintenance, and IT

41
support. Another benefit was increased user productivity obtained from automated
self-service provisioning and overall improved IT resource utilization.
Step 2. Identify the investment made in deploying the solution. This includes the
initial cost of the IBM cloud solution, development, implementation services, and
support costs.
Step 3. Project the costs and potential savings over a fixed period and calculate
the ROI and payback period for the deployed solution. This model uses a standard
discounted cash flow method to calculate the net present value (NPV) over three
years. The payback period was the time from initial deployment to when the
benefits equal the initial investment (Kuo, Bhatia, & Chang, 2010, p. 4).
The ROI analysis showed IBM cloud computing increased server utilization from
36 to 79 percent company wide and reduced resource provisioning time from six hours to
less than thirty minutes. Therefore, the IBM cloud computing decreased average time for
a user to obtain resources by 48 times from 12 days to two hours.
The results showed an initial investment for eight months were around $1.2 million and
the net present value (NPV) was $3.0 million. The IBM investment algorithm estimated
an annual ROI at 76% over eight months.
Kornevs, Minkevica, and Holm (2012) performed a cloud computing evaluation
based on financial metrics such as Cost Benefit Analysis (CBA), Return on Investment
(ROI) and Total Cost of Ownership (TCO). The case study was performed to validate
evaluation of the private cloud model because a private cloud has a higher risk of being
unsuccessful from an economic point of view. The reason for conducting a case study

42
was to provide a validation to increase private cloud investments. The case study results
showed private cloud computing has created significant return on investment. For
example, the company spent $100,000 per month on self-hosting an e-commerce site that
generates $110,000 per month. That’s a 10% ROI. By outsourcing hosting to a cloud
provider, and lowering monthly expenses by $20,000 per month, that same $110,000
could still be generated if the application performs at the same level. That’s a 37.5% ROI.
Skilton (2014) designed a framework on how to measure return on investment
(ROI) for cloud computing. The following are the eight measurements of cloud
computing ROI:
(a) The speed and rate of change – Cost reduction and cost of adoption /de-
adoption was faster in the cloud. Cloud computing creates additional cost
transformation benefits by reducing delays in decision costs by adopting pre-built
services and a faster rate of transition to new capabilities. Adopting pre-built
services was a common goal for business improvement programs that are lacking
resources and skills and that are time sensitive (Skilton, 2014, p. 2).
(b) Total cost of ownership optimization – Users can select, configure, and run
infrastructure and applications that are best suited for business needs.
Traditionally this has often been decoupled when IT projects are handed off to
production services. In cloud computing environments these are joined up
(Skilton, 2014, p. 2).

43
(c) Rapid provisioning – Resources are scaled up and down to follow business
activity as it expands and grows or was redirected. Provisioning time compression
can go from weeks to hours (Skilton, 2014, p. 2).
(d) Increased margin and cost control – Revenue growth and cost control
opportunities allow companies to pursue new customers and markets for business
growth and service improvement (Skilton, 2014, p. 2).
(e) Dynamic usage – Elastic provisioning and service management targets real
end users and real business needs for functionality as the scope of users and
services evolve seeking new solutions (Skilton, 2014, p. 2).
(f) Risk and compliance improvement – Cloud computing green capabilities can
be leveraged through shared services (Skilton, 2014, p. 2) .
(g) Enhanced capacity utilization – IT avoids over-and under-provisioning of IT
services to improve smarter business services (Skilton, 2014, p. 2) .
(h) Access to business skills and capability improvement – Cloud computing
enables access to new skills and solutions through cloud sourcing on demand
solutions (Skilton, 2014, p. 2) .
Skilton (2010) said, “The impact on the ROI business case from using Cloud
Computing services is directly relevant to sovereignty, security, and management of
services risk containment (Skilton, 2010, p. 19)”. My research focused on adding risk
assessment to Paap’s CFTP Framework to improve upon cloud computing technology
investment. Skilton’s 2010 white paper provided an analysis of how to build and measure
cloud computing ROI through ROI savings models that demonstrate cost, time, quality,
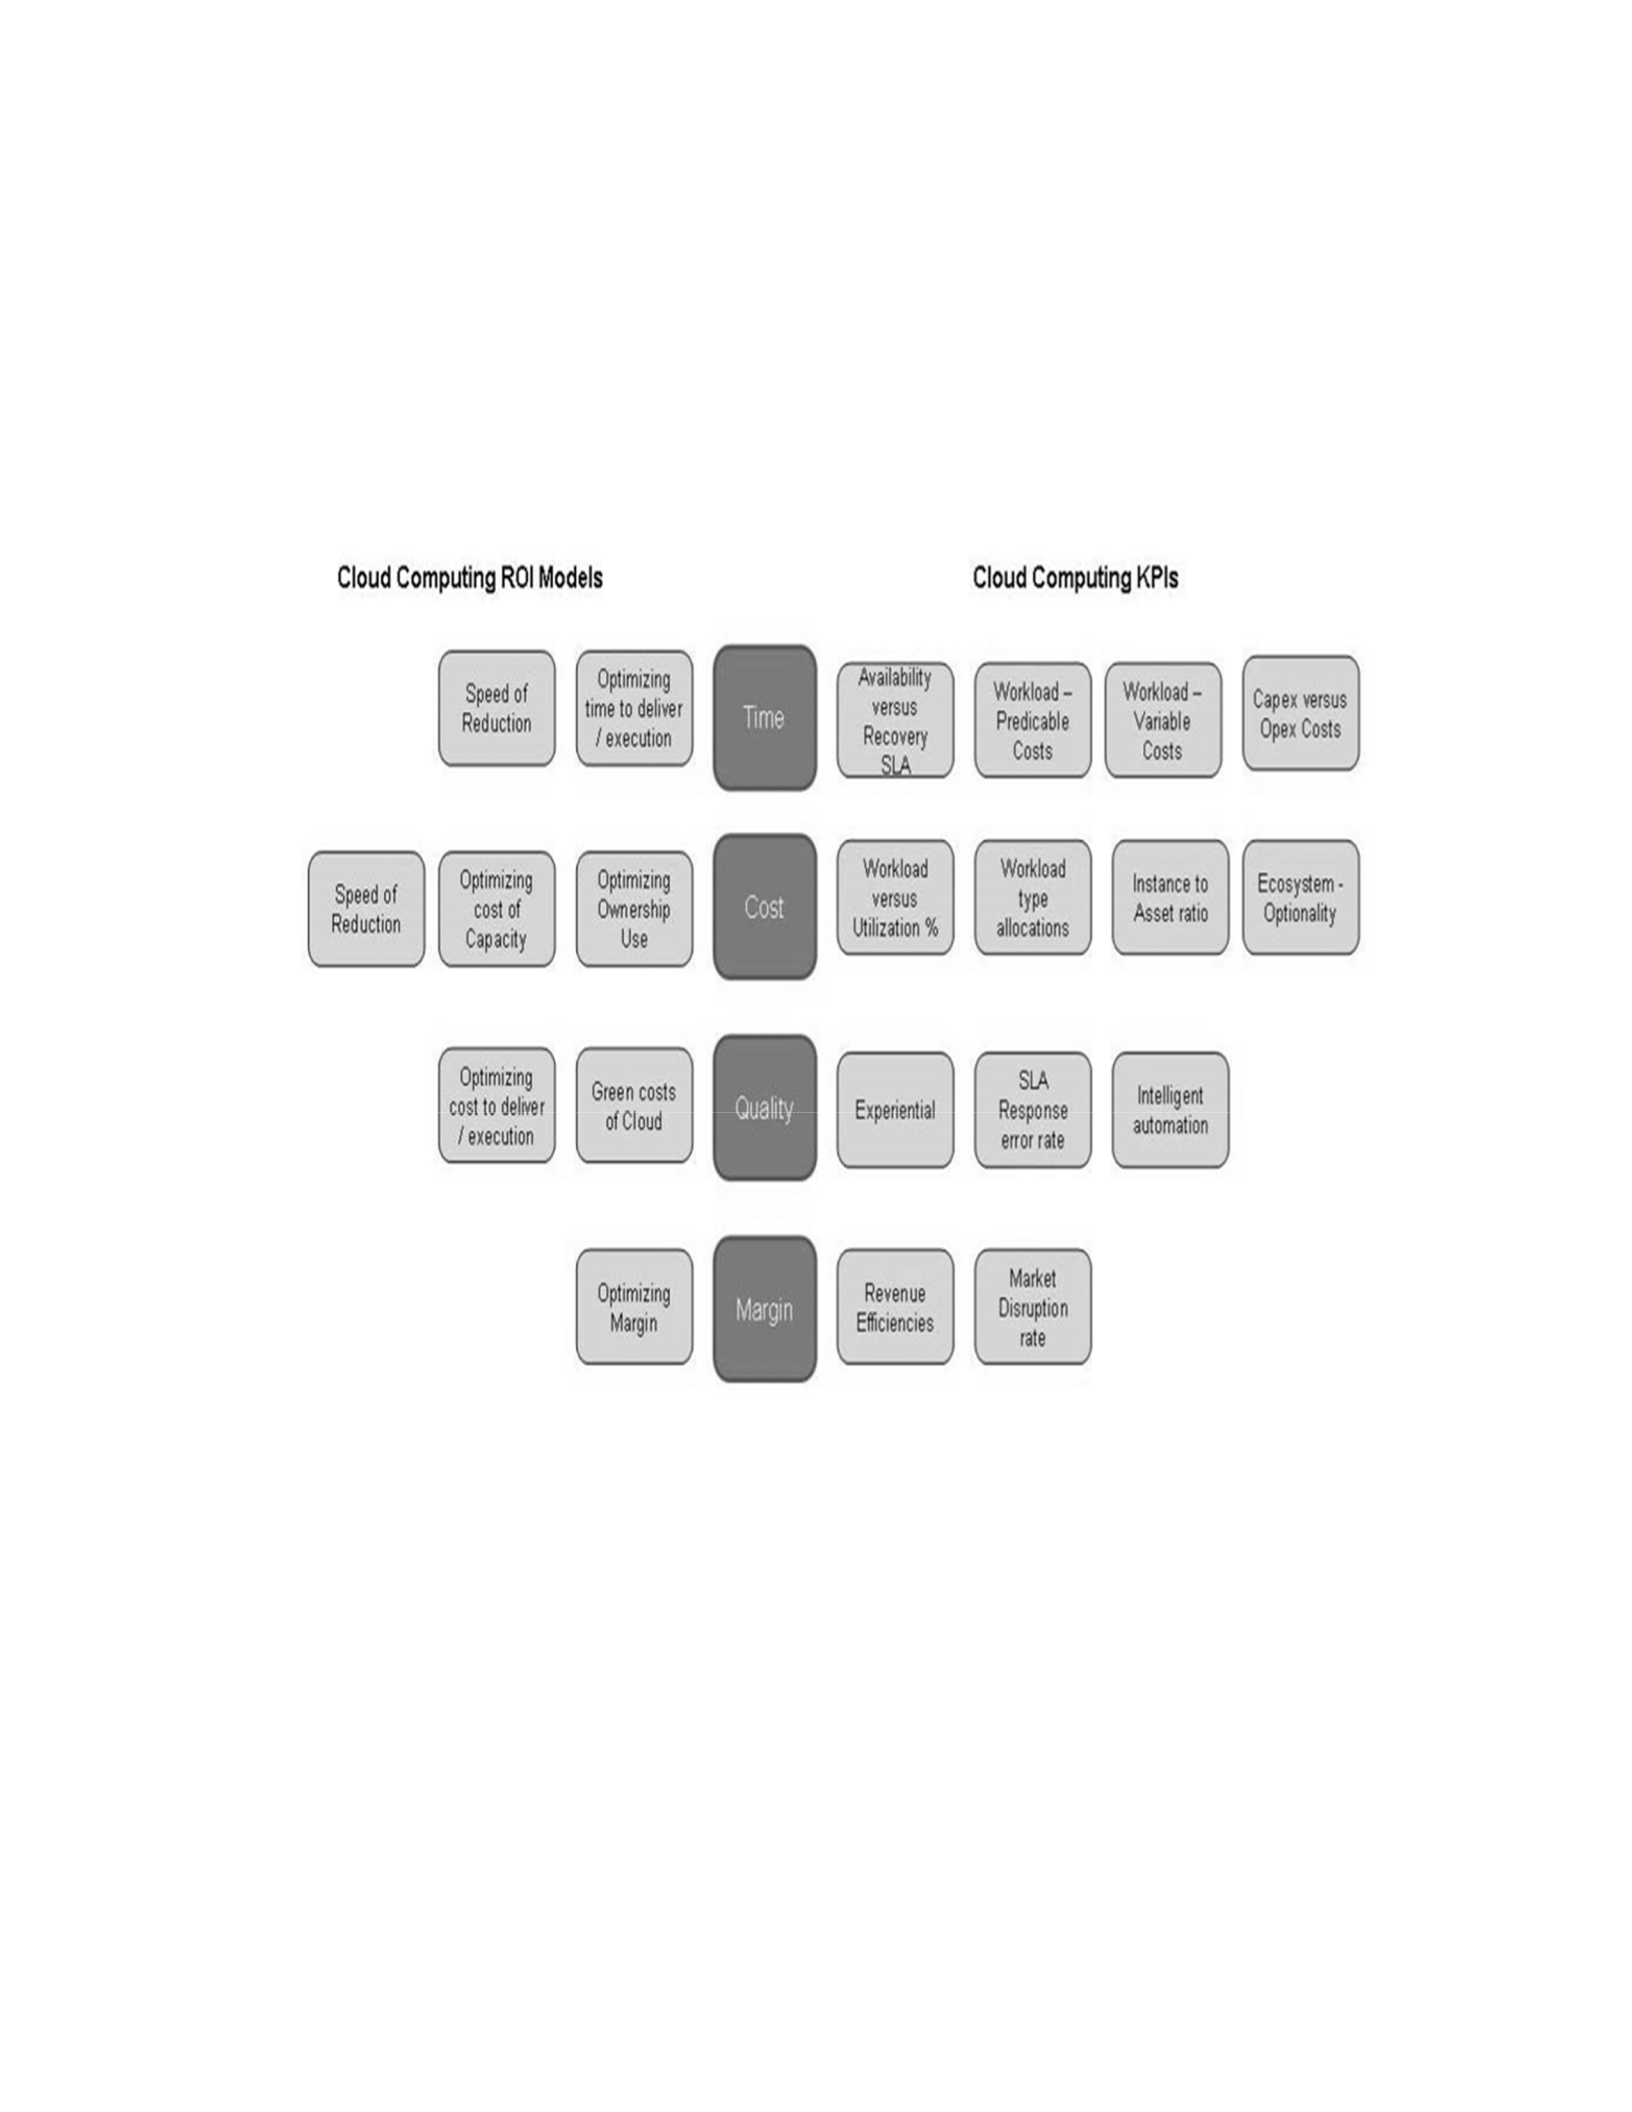
44
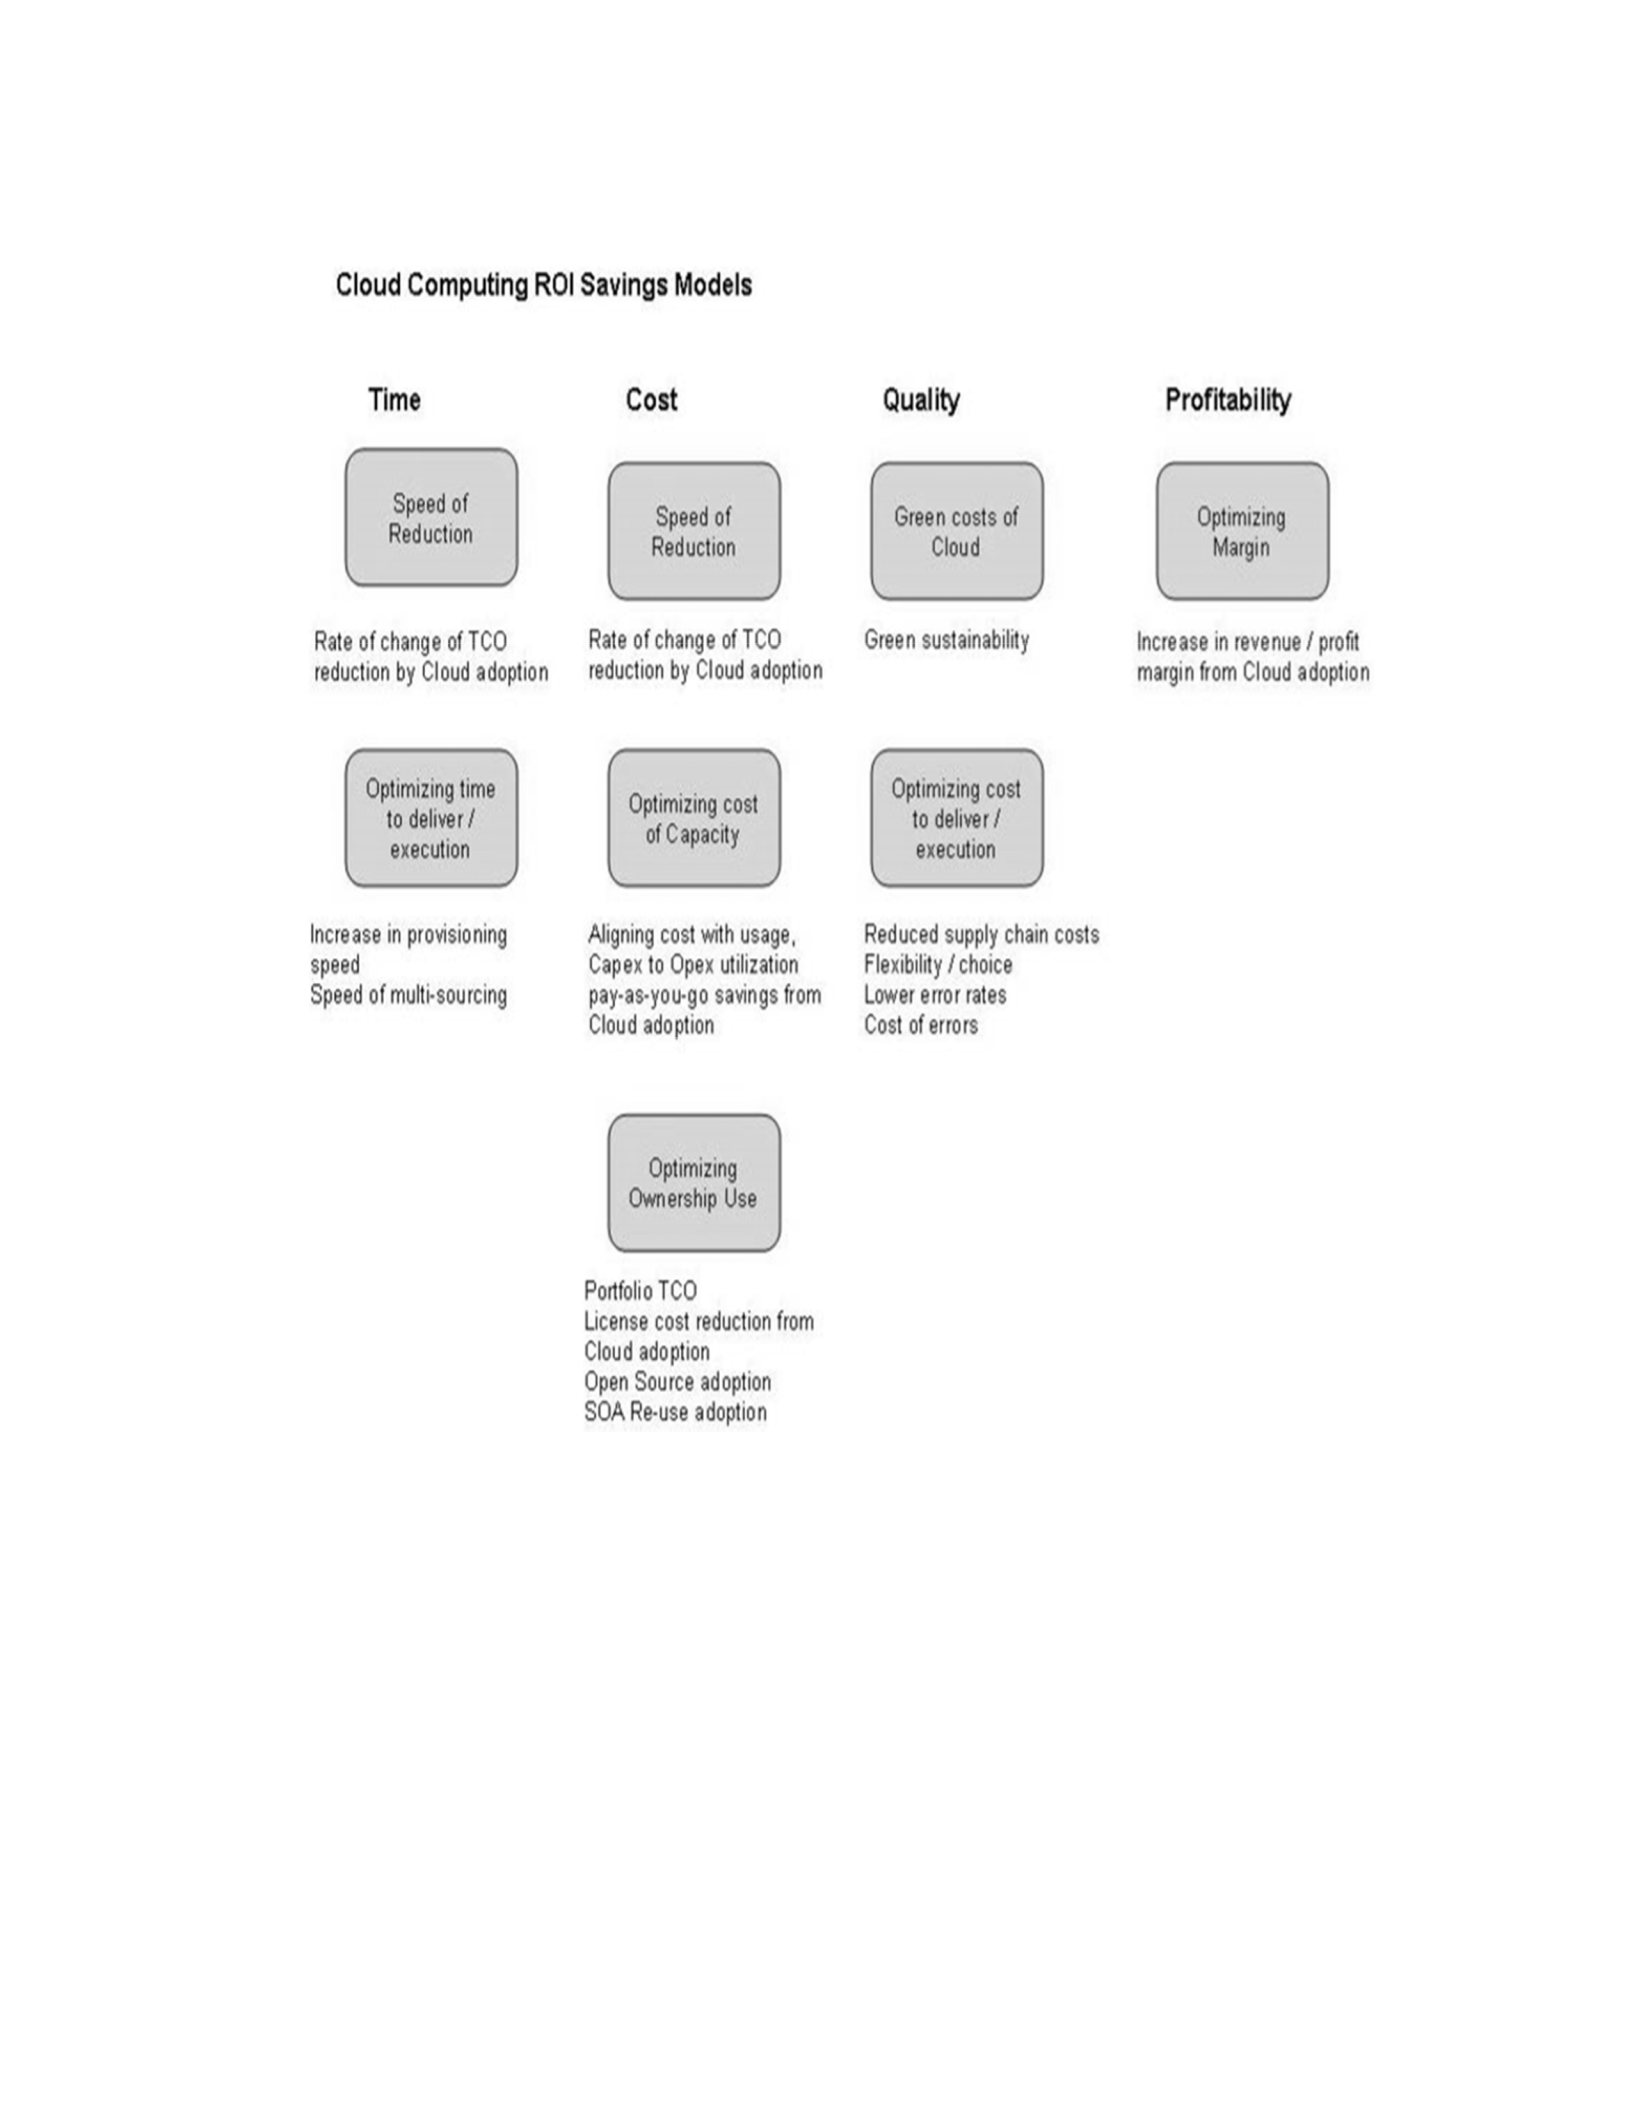
compliance, revenue, and profitability improvement shown in Figure 8 titled “Cloud
computing ROI models and key performance indicators” and Figure 9 titled “Cloud
computing ROI saving model”. The different between the two figures are the key
performance indicators vs. the ROI saving model.
Figure 8. Cloud computing ROI models and key performance indicators. From Building
return on investment from cloud computing, by M. Skilton, 2010, p. 22. Retreived from
The Open Group Techical Report. Reprinted with permission.
45
Figure 9. Cloud computing ROI saving model. From Building return on investment from
cloud computing, by M. Skilton, 2010, p. 22. Retreived from The Open Group Techical
Report. Reprinted with permission.
The Skilton’s 2010 cloud computing ROI saving model was computed by time,
cost, quality, and profitability. Time is the time it takes a supplier to deliver the cloud
product using multi-sourcing method. Cost is the optimized cost of a cloud computing

46
product. Quality is the degree of excellence of a cloud computing product delivery. The
profitability is the optimized margin. The following sentences listed the cloud computing
ROI Model definitions. Speed of time reduction is the decrease in time to adopt to cloud
computing technology. Speed of cost reduction is the decrease in cost to adopt to cloud
computing technology. It is measured by the rate of change in TCO reduction by Cloud
adoption. Optimizing cost of capacity is defined as aligning cost with usage. Cash flow
describes revenue, cash, and working capital changes that flow within part of the
operating expenses liquidity and available usage of funds. Green costs of Cloud adoption
is the benefit to the economic and emission footprint from the use of shared services.
Optimizing time to deliver/execution is described as the increase in provisioning speed
and reduced supply chain costs with fast speed of multi-sourcing and flexibility of
choices. Optimizing margin is the increase in revenue/profit margin from cloud adoption.
Skilton (2010) concluded cloud computing can provide many advantages over
conventional approaches to IT provisioning, which can translate into significant
improvements in ROI. In addition, Merwe (2014) proposed to use Mosaic approach for
cloud computing risk assessment that was developed at the Carnegie-Mellon University
Software Engineering Institute. Merwe (2014) stated, “The Mosaic approach builds on
and extends traditional risk management to provide a framework for managing complex,
systemic risks, where it takes a holistic view of risk to objectives by examining the
aggregate effects of multiple conditions and potential events” (Merwe, 2014, 2). Merwe’s
2014 risk assessment provided me a very good understanding of recent cloud computing
ROI risks. For example, the key factors to consider when assessing cloud ROI risk

47
probability are the leading indicators, such as utilization, speed, scale, and quality. These
factors are built into Mosaic ROI models, and affect the headline figures for investment,
revenue, cost, and time to return. But, Merwe’s 2014 cloud ROI risk assessment was a
guidance with no actual data to prove that risk factor was an improvement in cloud
computing technology investment versus my research with 35 cloud computing
companies’ data to prove that risk assessment might be increase in technology investment
decisions using Paap’s CFTP framework.
Cloud Computing Enterprise Risk Management Framework and ROI
The cloud computing technology was considered a low risk investment, because
the companies use an open architecture that leverages Service Oriented Architecute
(SOA) technology capabilities. From an investor perspective that means that technology
and product risks are somewhat mitigated (Padnos, 2012, 1). Feuerlicht and Govardhan
(2010) documented a potential risk on cloud computing technology investment. The risk
included higher costs associated with cloud computing investment model. For example,
business continuity and service provider’s availability have been identified as a
significant relationship to cloud computing cost concern. Chan, Leung, and Pili’s 2012
Enterprise Risk Management Framework (ERMF) was to help the computer industry to
identify cloud computing risks and relationship to their organizations shown on Figure
10.
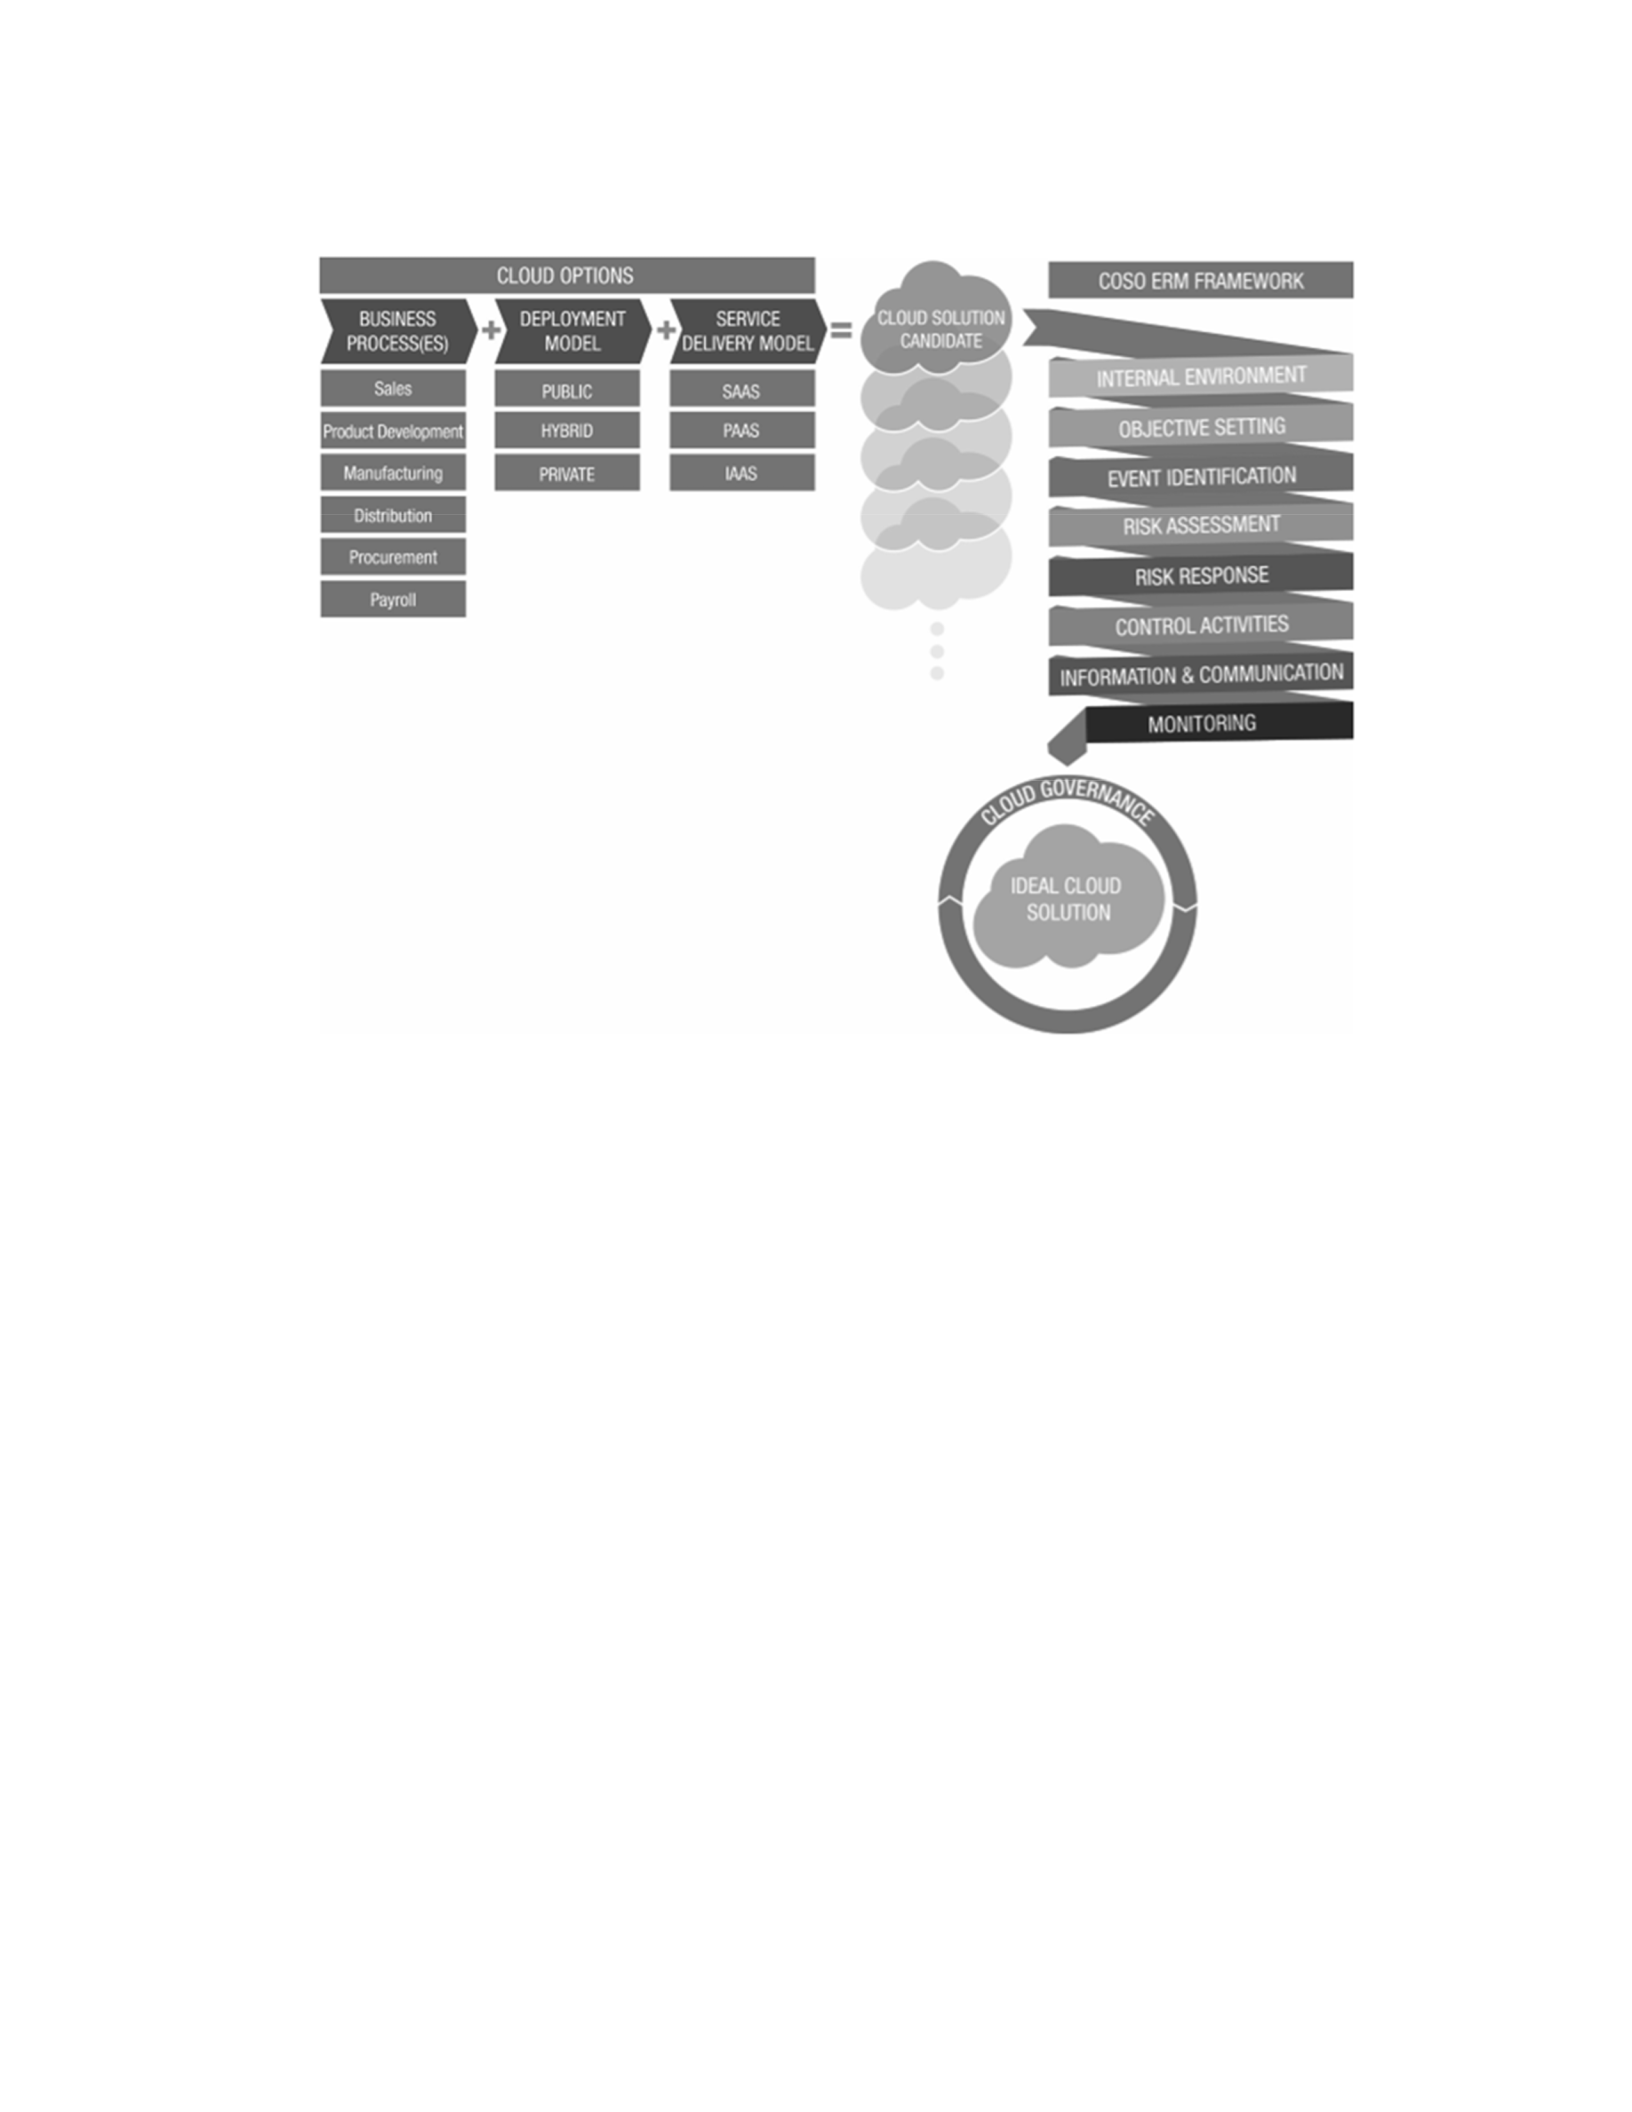
48
Figure 10. ERMF along with cloud computing options. From Enterprise risk
management for cloud computing, by W. Chan, E. Leung, E., and H. Pili, 2012, p. 13.
Retreived from the Committee of Sponsoring Organizations of the Treadway
Commission (COSO) Conference paper. Reprinted with permission.
The COSO’s 2012 ERMF was related to my research in terms of risk assessment, where
cloud computing risk assessment was to evaluate the risk events associated with its cloud
computing technology to determine the potential impact of the risks associated with each
cloud computing investment option. Cloud computing can affect the following critical
focal points of a risk assessment, such as risk profile, inherent/residual risk, likelihood
and impact. Risk profile is a description of a set of potential investment options to
estimate return on investment (ROI) while characterizing the risk for each option. The
inherent/residual risk is where an organization must assess the inherent risks of the events

49
and then develop risk responses and determine the residual risk. The Likelihood and
impact of risk assessment means the likelihood of certain events and the related potential
impact change in many cases when cloud solutions are adopted.
According to Merrill and Kang (2014), a potential number of hidden costs with
cloud computing that many may not have considered. Therefore, risk assessment was the
next step to predict the actual costs of cloud computing and the potential ROI. For
example, what are the costs associated with transferring your data and network to another
cloud provider? Once a company’s data resides on the cloud, the company becomes
increasingly reliant on its provider; cloud providers know this and could easily make
moving to another provider difficult.
Summary
In Chapter 2, the literature review provided the context and substantiation of the
basis of inquiry for the primary research question: What is the relationship to the return
on investment by adding traditional risk assessment model to Paap’s CFTP framework?
In addition, the literature review also provided the background knowledge to my
research. The review discussion compared two models for the study: (a) Neuro-Fuzzy
Risk Assessment Model, and (b) Traditional Risk Assessment Model. The research in
cloud computing technology investment model started two years ago, so very little
articles published in this field of study. Chapter 3 provides further detailed description of
the quantitative methodology.

50
Chapter 3: Methodology and Procedure
In this chapter, I discuss the characteristics of the quantitative method I used to
construct Paap’s CFTP framework with added risk assessment to answer my research
question. Quantitative measurement includes dependent and independent variables. The
dependent variable in this study was ROI. The independent variable was market risk. I
used a paired sample two-tailed t tests to determine the differences between ROI without
risk assessment and ROI with added risk assessment.
I begin this chapter by justifying the quantitative cross-sectional methodology and
the study’s independent and dependent variables. Then, the methodology section outlines
the target population and sampling. In the data collection and analysis section, I describe
variable scales, hypothesis construction, and analytical tools. The reliability and validity
section includes discussion of threats to reliability and validity in this research study. The
next section covers ethical procedures and confidentiality. Last but not least, I offer a
summary of the methodology.
Research Design
I used a quantitative method for this study. The approach was a cross-sectional
design which I used to measure companies’ ROIs before and after adding adaptive risk
assessment to Paap’s CFTP. Cross-sectional design involved the analysis of data
collected from the 35 cloud computing companies in United States at one specific point
in time. The advantage of using cross-sectional design was that it was relatively
inexpensive to conduct research using existing cloud computing companies' data sets. In
addition, could use the cross-sectional design to estimate prevalence of outcome of

51
interest because the sample was taken from the whole population of 35 cloud companies
in the United States. Another advantage of using cross-sectional design was that it was
less time-consuming than other potential methods.
The research question was: What is the relationship to the return on investment by
adding traditional risk assessment model to Paap’s CFTP framework?
The quantitative measurements include a dependent variable and an independent
variable. The influence of this market risk assessment independent variable on Paap’s
CFTP ROI dependent variable yielded the following hypotheses:
The null hypothesis (H
0
): The return on investment may not be positively related
to adding a traditional risk assessment model to Paap’s CFTP framework.
The alternative hypothesis (H
1
): The return on investment may be positively
related to adding a traditional risk assessment model to Paap’s CFTP framework.
The convention mathematical format is:
A two-tailed test: , the p-value is 0.000 (Reject at α = 5%)
where is the mean of first population (Before: No risk), and (After: Added
risk) is the mean of the second population. The null hypothesis equals 0
represents the condition that the populations are centered in the same spot. The two sided
alternative hypothesis is that the means difference and does not equal 0. The
additional risk factor was market risk in cloud computing technology.
0:
0:
211
21
≠− =−
µµ µµ
H
H
o
1
µ
2
µ
21
:
µ
µ
−
o
H
211
:
µµ
−H

52
ROI is a measure of the profit earned from each investment. To calculate ROI, the
return of an investment was divided by the cost of the investment; the result was
expressed as a percentage or a ratio in Equation 3:
ROI (%) = [(Gross Profit – Investment) / Investment] × 100
To get a better idea of how ROI was different from profit, let’s compare two investment
scenarios and have a look at the profit and ROI of each: an investment of $100,000 that
led to a gross profit of $150,000, and an investment of $10,000,000 that led to a gross
profit of $15,000,000. In the first scenario the net profit was $50,000, whereas in the
second one the net profit was $5,000,000. Using the same two scenarios, we can easily
calculate the ROI for each, as follows: ROI = [(150,000 – 100,000) / 100,000] x 100 and
ROI = [(15,000,000 – 10,000,000) / 10,000,000] x 100. The result is 50 in both cases,
meaning that both scenarios had a ROI of 50%.
See Appendix C for how to use Paap’s CFTP framework to determine the ROI
values. Paap’s CFTP has 9 inputs to the framework which I have circled in Figure 11.
The following 9 inputs definitions are described below:
1. The performance characteristics input refers to the performance factors that
are important in influencing the purchase or use decision.
2. The importance input refers to the rank of the performance characteristic in
the purchase or use decision. Higher ranked items generally must be fairly
well satisfied before lower ranked items influence the buying or use decision.
3. The industry leverage input refers to the market relationship of an
improvement in a technology. High leverage means customers will have a

53
strong and positive reaction to improvements. Low means they really do not
care about improvements, even if the improvements had an important
characteristic.
4. The cloud computing technologies input refers to the current and potential
technologies that are used in this business area.
5. The technology relationship input refers to which technology affects the
performance level of a characteristic.
6. The competitive performance profile input refers to each competitor profile
including yourself, and the customers.
7. The ROI input is a measure of the profit earned from each investment. To
calculate ROI, the return of an investment was divided by the cost of the
investment; the result was expressed as a percentage ROI (%) = [(Gross Profit
– Investment ) / Investment] × 100. The cloud computing companies’ ROI
values are an input to Paap’s CFTP ROI values.
8. The relative maturity of the technology input refers to TRLs.
9. The competitive technology profile input refers to the strength in the
technology by each competitor.
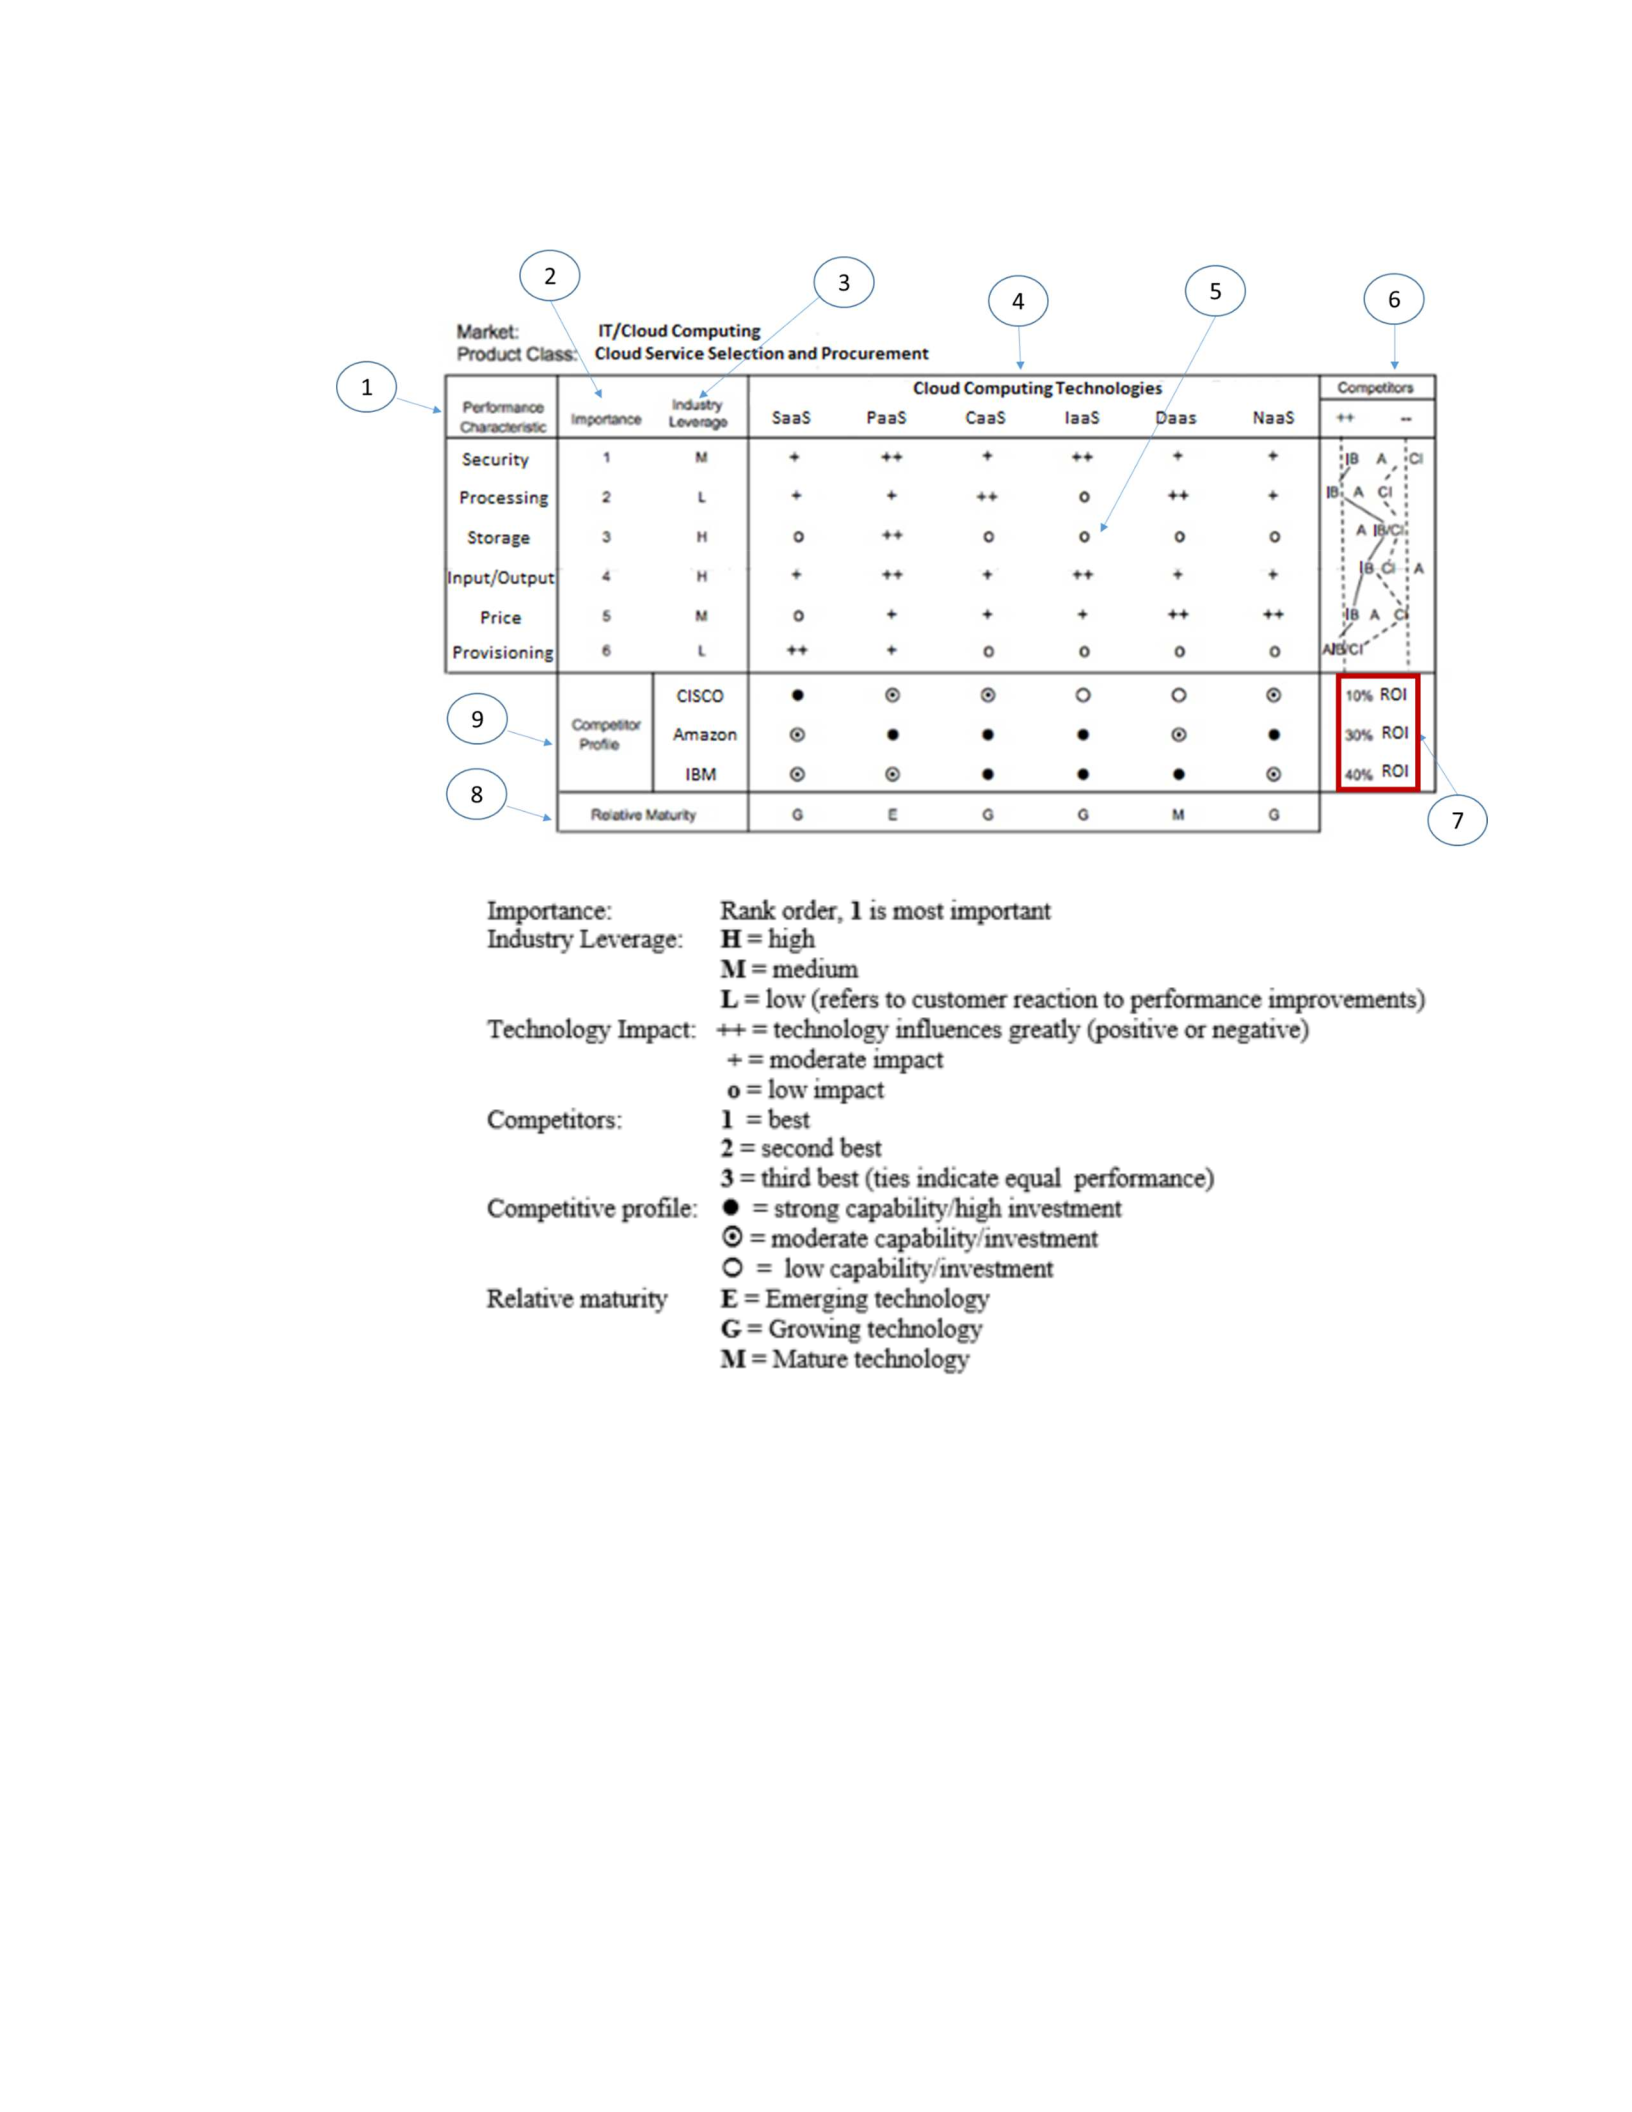
54
Figure 11. Paap’s CFTP ROI for cloud computing investment. From Customer focused
technology planning: An overview, by J. Paap, 2010, p. 15. Retreived from
http://www.jaypaap.com/articles/CFTP-2016-06.pdf. Copyright 2016 by J. Paap.
Reprinted with permission.
The definitions of cloud computing technologies are listed below:
1. Software as a service (SaaS): Provide to a cloud service user applications
running on a cloud infrastructure in a non-real-time environment, such as IT

55
and business applications. The cloud service user does not manage or control
the underlying cloud infrastructure, with the possible exception of limited
user-specific application configuration settings.
2. Communications as a service (CaaS): Provide to a cloud service user real-time
communication and collaboration services, such as voice over IP, instant
messaging, and video conferencing.
3. Platform as a service (PaaS): Provide to a cloud service user user-created or
acquired applications and delpoy them on the cloud infrastructure using
platform tools supported by the cloud service provider. The platform tools
may include programming languages and tools for application development,
interface development, database development, storage and testing. The cloud
service user does not manage or control the underlying cloud infrastructure,
but has control over the deployed applications and, possibly, over the
application hosting environment configurations.
4. Infrastructure as a service (IaaS): Provide to a cloud service user provisioning,
processing, data storage, intra-cloud network connectivity services (e.g.,
VLAN, firewall, load balancer, and application acceleration), and other
fundamental computing resources of the cloud infrastructure where the cloud
service user is able to deploy and run arbitrary application. The cloud service
user does not manage or control the resources of the underlying cloud
infrastructure, but has control over operating systems, deployed applications,

56
and possibly limited control of select networking components (e.g., host
firewalls).
5. Network as a service (NaaS): Provide to a cloud service user transport
connectivity services and/or inter-cloud network connectivity services, such as
virtual private network (VPN) and bandwidth on demand.
6. Big data as a service (DaaS): Provide to a cloud service user statistical
analysis tools or information by an outside service provider that helps
organizations understand and use insights gained from large information sets
in order to gain a competitive advantage. These include tools such as a web
dashboard or control panel for carrying out the actual analysis and providing
reports.
Risk assessment involves the calculation of the magnitude of potential
consequences (levels of impacts) and the likelihood (levels of probability) that these
consequences will occur. Risk was calculated using the following Equation 4:
Risk = Consequence x Likelihood
Likelihood is the probability of occurrence of an impact that affects the environment, and
Consequence is the environmental impact if an event occurs. The traditional risk matrix is
shown in Figure 12. The traditional risk matrix is a method that combines the scores from
the consequence (levels of impact) and the likelihood (levels of probability) to generate a
risk score.
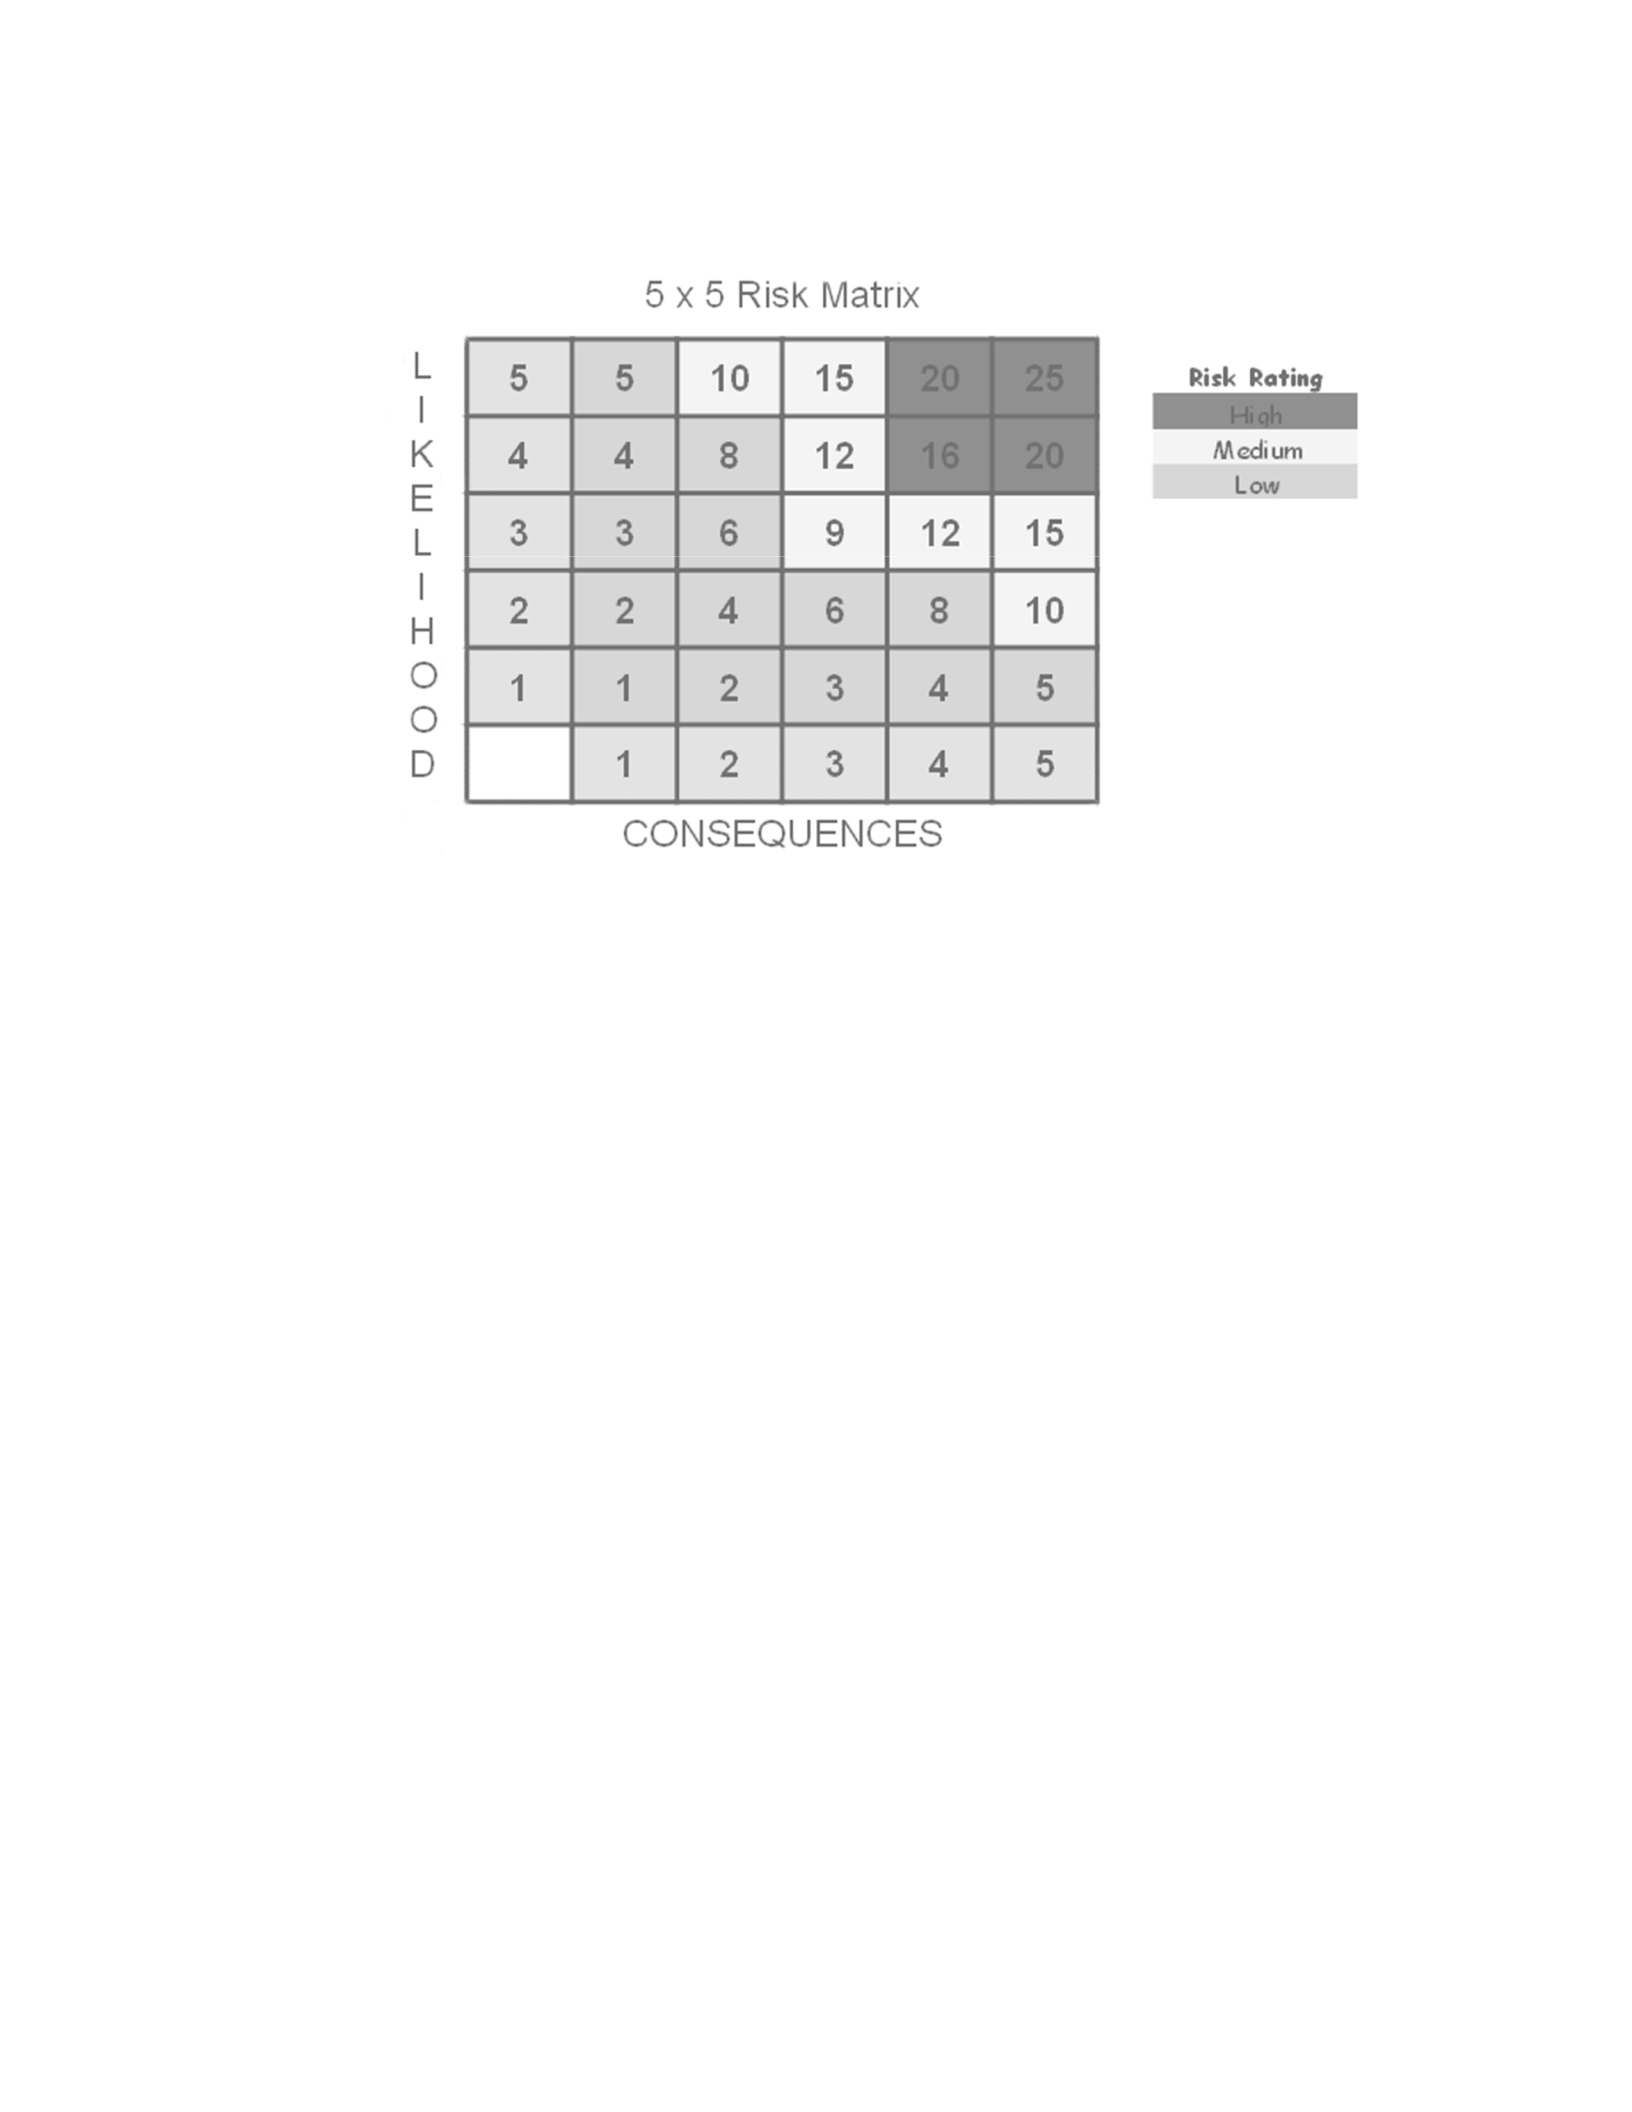
57
Figure 12. Traditional 5x5 risk matrix.
The traditional risk assessment process involves selecting the most appropriate
combination of consequence and likelihood levels that fit the situation for a particular
objective based upon the information available and the collective knowledge of the group
involved in the assessment process. An example of Paap’s CFTP Framework added risk
asssignment was shown in Figure 13.
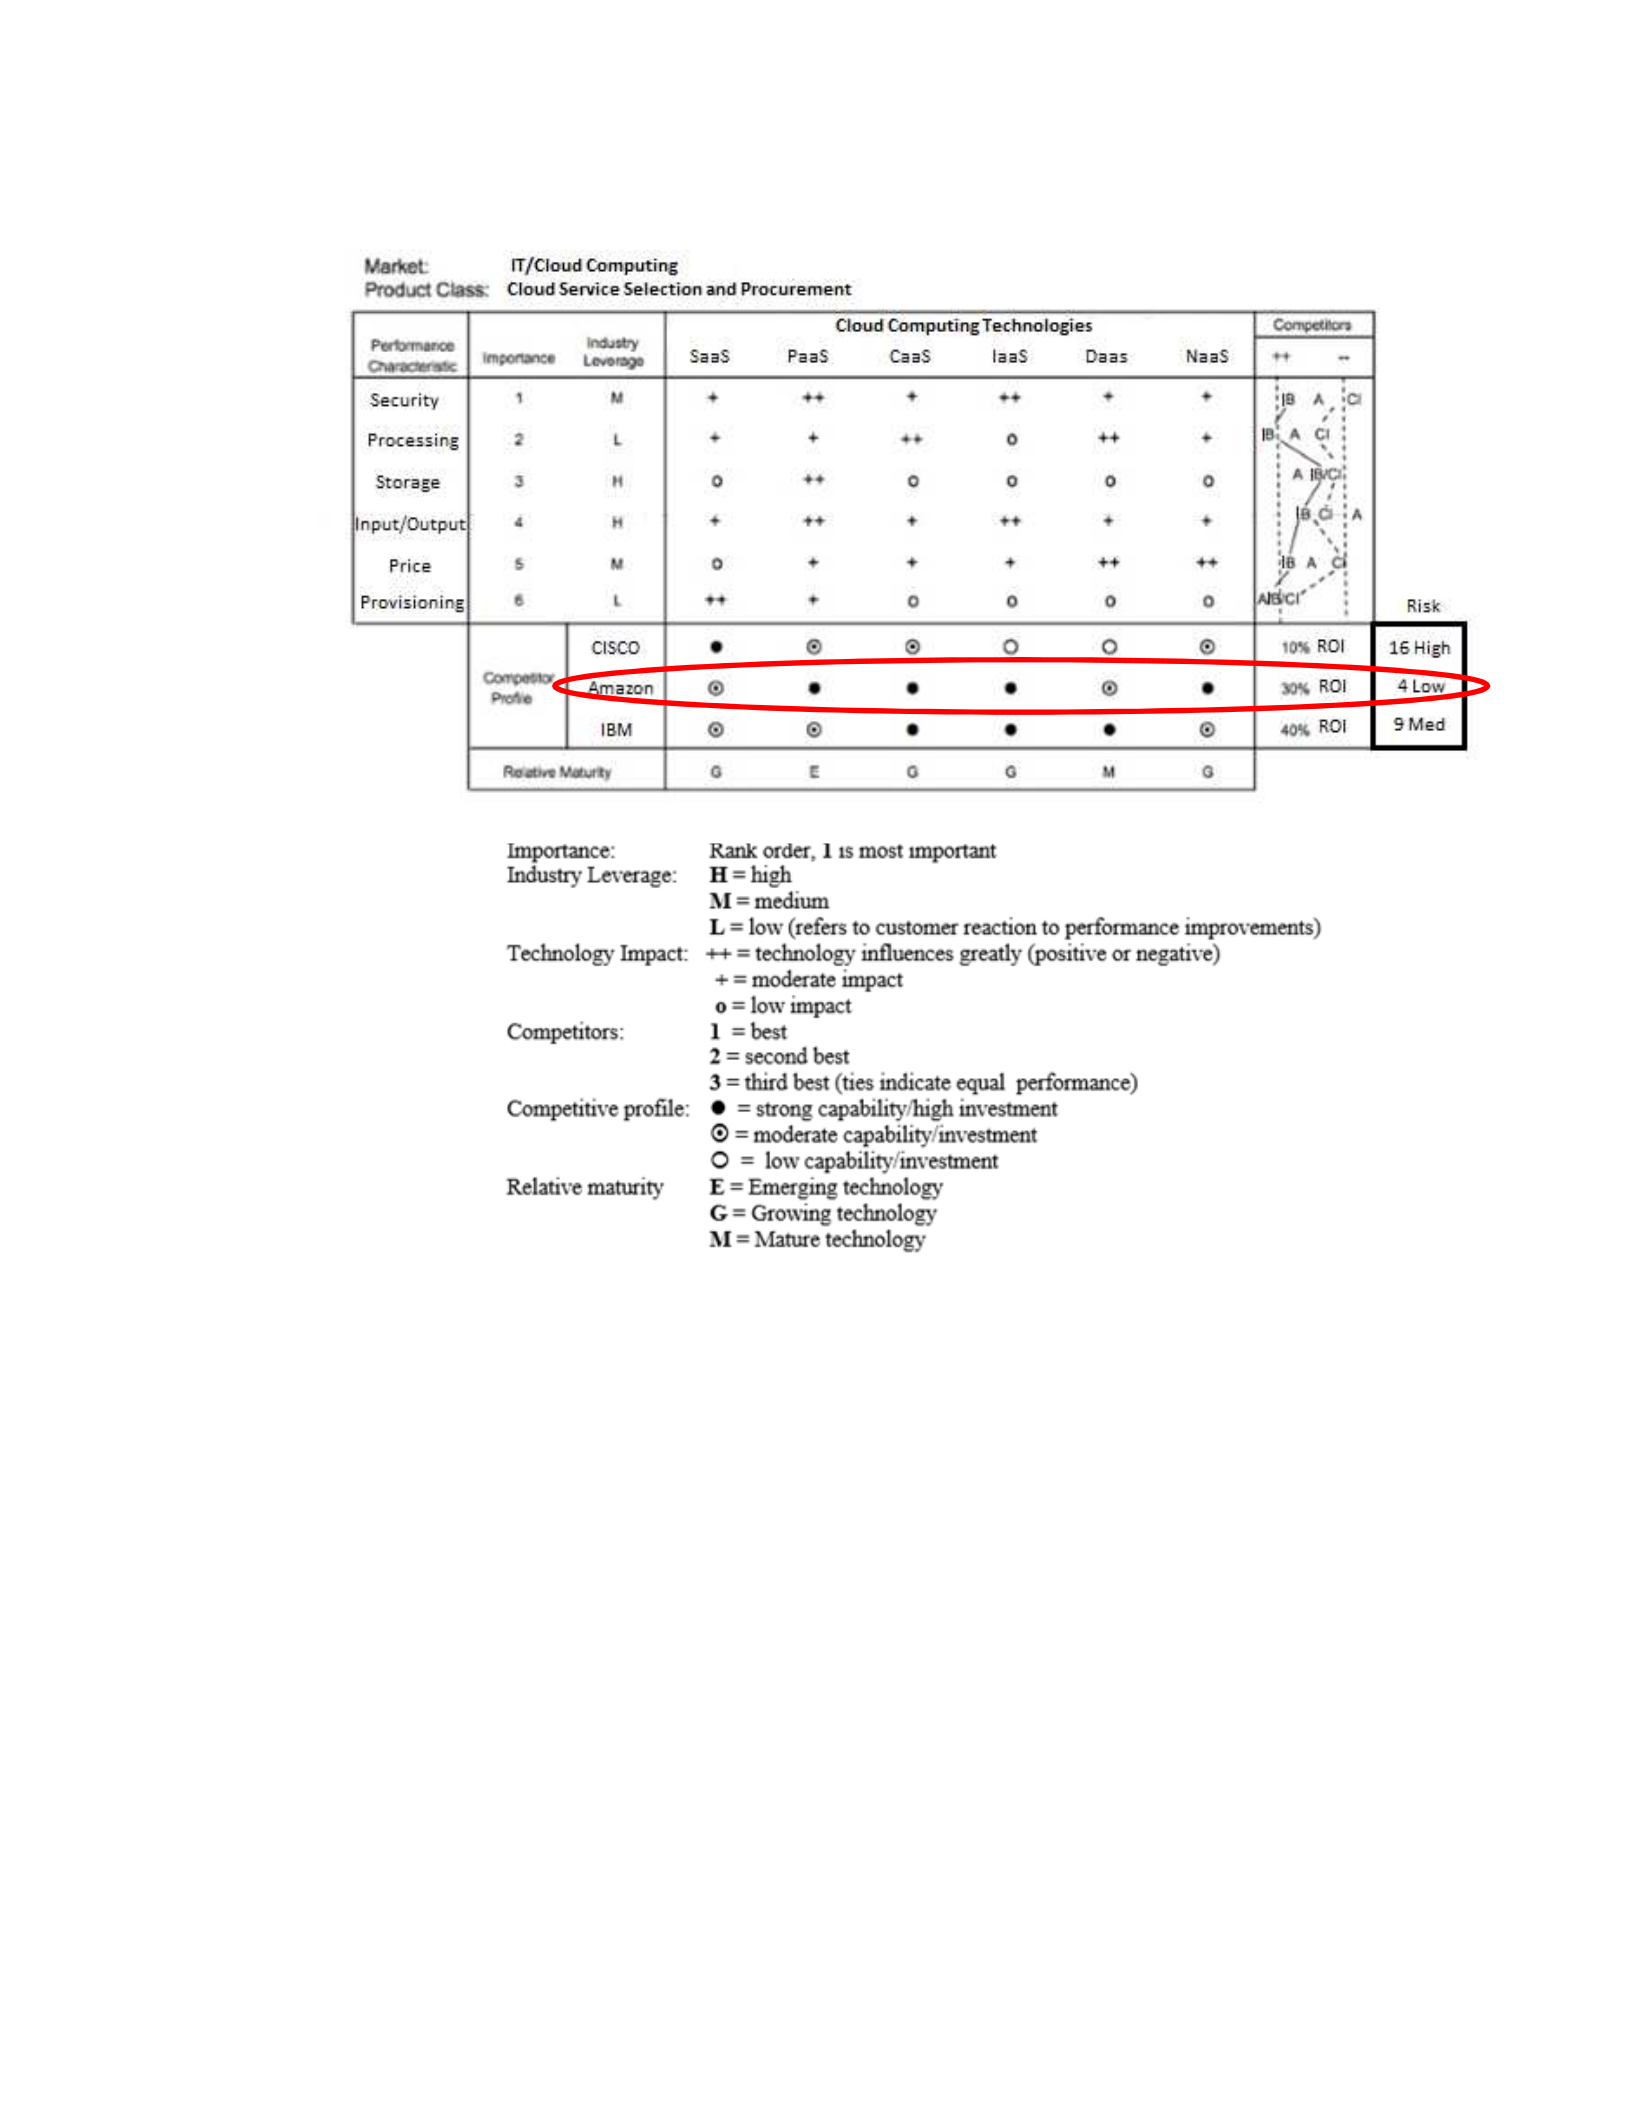
58
assessment process. An example of Paap’s CFTP Framework added risk asssignment is
shown in Figure 10.
Figure 13. Cloud computing investment example using Paap’s CFTP Framework with
added risk assessment.
In Figure 13, the results showed Amazon Cloud Computing Company was the best to make your
investment decision based on the lowest risk of 4 and medium ROI of 30% compared to IBM
Cloud Computing with medium risk of 9 and medium ROI of 40%, as well as, CISCO Cloud
Computing with high risk of 16 and lowest ROI of 10%. In a perfect scenario, the investment
decision was based on determining the lowest risk and the highest ROI. See Appendix D for how
to add risk to Paap’s CFTP framework.
Target Population and Sample
59
Collins and McAllister (2011) conducted a cloud computing market research and
they found U.S. cloud computing investment was anticipated to continue growing at a
robust rate over the course of the next five years. Collins and McAllister (2011) predicted
that the global cloud services revenues were expected to reach US$148.8 billion in 2014
as shown in Figure 14.
Figure 14. Cloud investment results. From Telcos advance in cloud computing, by S.
Collins, and D. McAllister, 2011, p. 2. Retreived from KPMG International Cooperative
Conference Paper. Reprinted with permission.
The United States was the largest market for cloud services, with a market share
of 58 percent in 2010. It was followed by Western Europe with 23.8 percent and Japan
with a 10 percent market share. The market research on cloud services revenues between
2010 and 2014 provided me a background on the demographic and population selections.
My research population was limited to 35 cloud computing companies located in United
States that invested $100 million or more in cloud technology. The data to use in
developing the revised Paap's CFTP framework was from 35 cloud computing
companies. I collected two data sets. The data sets are (1) cloud computing companies’

60
ROI values and, (2) cloud computing companies’ risk data. The cloud computing
companies’ ROI values are an input to Paap’s CFTP ROI values. Next, I performed a
computation using Paap’s ROI values with added risk assessment values. Then, I used the
paired sample two-tailed t tests to determine the differences between ROI with no risk
and ROI with added risk, as referenced in Table 1. I used Table 1 to document the results
of my analysis. The numerical results was computed in Chapter 4 after conducting my
study. The differences calculation determine how much relationship to ROI with and
without risk for the 35 cloud computing companies.

61
Table 1
Paired Sample Two-Tailed T Tests Results of My Analysis
#
Cloud Computing Company Before (No Risk) After (Added Risk) Difference
1
Amazon
2
AppDirect
3
Apple
4
AT&T
5
BlueLock
6
BMC
7
CA Tech
8
Cisco
9
Citrix
10
CloudStack
11
Datapipe
12
Dell
13
Eucalyptus
14
FUJITSU
15
Google
16
HP
17
IBM
18
Internap
19
Micro Focus
20
Microsoft
21
Oracle
22
OpenNebula
23
OpenStack
24
Piston
25
Rackspace
26
Red Hat
27
Salesforce
28
SAP
29
Savvis
30
Sage
31
Ultimate
32
Tableau
33
Version
34
Virtustream (EMC)
35
VMware

62
Data Collection
There are two set of data collections: risk data and actual ROI data. The 35 cloud
computing company’s ROI data and market risk data are from the 2015 annual report of
each company. The 2015 annual report can be found on the company’s website, Mergent
online database, and/or U.S. Securities and Exchange Commission Form 10-K
government website. The federal securities laws require public companies to disclose the
annual report on Form 10-K provides a comprehensive overview of the company's
business and financial condition and includes audited financial statements. My design
instruments was observation and action plans. The observation captures actual ROI
applications. Observations are particularly useful in cloud computing projects and are
effective when the observer was either invisible or transparent. I reviewed the
observation at the end of each formal session with my dissertation chair. The action plans
are developed during the project and are implemented after the project was completed.
Follow-up on action plans provides evidence of ROI for specific projects. All 35 U.S.
cloud computing uses risk management for technology development, but it was not
associated with return on investment factor. Therefore, my research was based on cross-
sectional design to determine measurement Paap’s CFTP ROI before and after added risk
assessment may or may not improve upon technology investment.
Data Analysis
I analyzed the sample size required for my cross-sectional design. The results of
the power analysis showed that a minimum of 24 data samples are needed. My study
involved comparing two groups: (a) before added risk and (b) after added risk. The

63
difference in the means for the two groups was a measure of the effect size (aka. Cohen’s
dz calculation). The effect size provided a measure of the magnitude of the effect. The
magnitude can often be used to evaluate the importance or meaning of the effect. In other
words, effect size is a measure of how much the ROI changed (aka. dependent variable).
I used effect size dz = 0.6, because I would like to follow Cohen’s rule of thumb
that stated:
Small effect when dz = 0.2
Medium effect when dz = 0.5
Large effect when dz = 0.8
The average effect size over many studies were closer to dz = 0.5. My calculation
using G*Power 3.0 tool was very closer to dz = 0.6, which was slightly above medium
effect. The effect size dz =0.6 means that one group performed six-tenths of a standard
deviation above the other group.
The advantage of paired sample t tests was fewer sample size and greater control
over external influences. After my power analysis results, as shown in Figure 15, I plan to
use paired sample two-tailed t tests with 35 total sample size to determine the
relationship by adding a traditional risk assessment model to Paap’s CFTP framework.
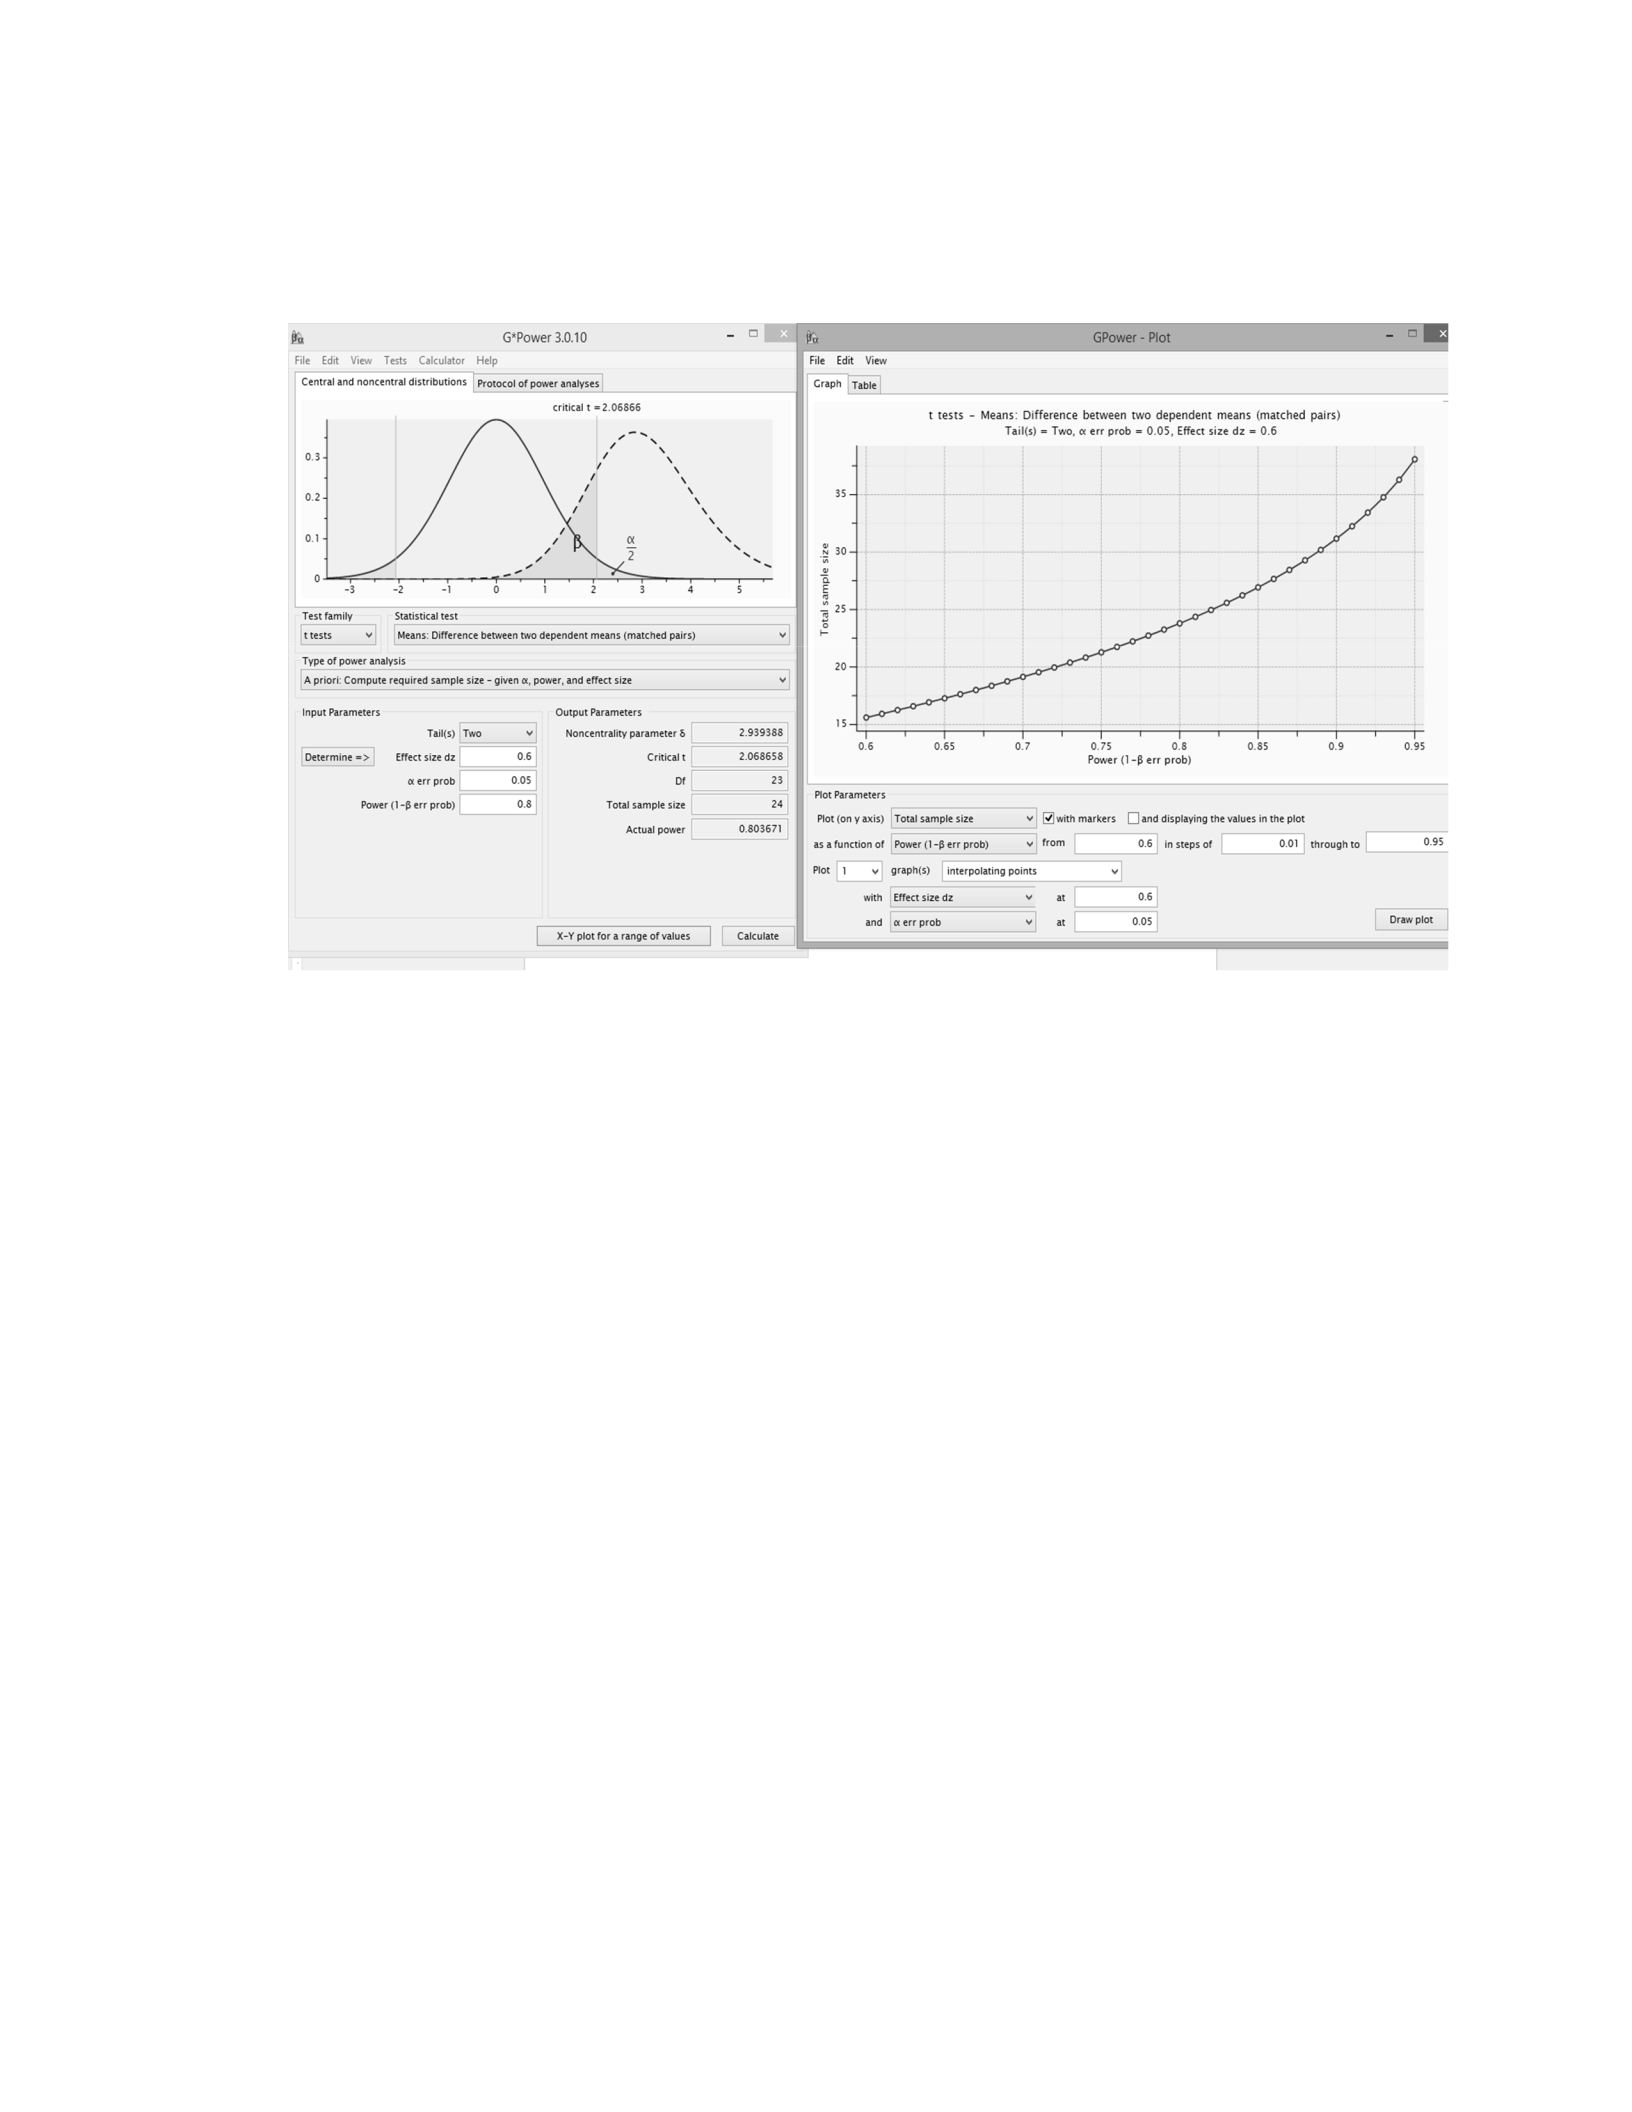
64
Figure 15. Power analysis results.
Both Jurimae (2010) and Wilkinson (2009) reported risk assessment would
increase technology investment returns. To determine if risk assessment improves Paap’s
CFTP framework, the paired sample two-tailed t tests was performed to compare Paap’s
CFTP 2010 model with and without traditional risk assessment associated with the cloud
computing companies. Paired sample two-tailed t tests was perform the statistical
hypothesis to determine if the alternative hypothesis was supported. When the p-value
was less than 0.05 then we reject the null hypothesis and provide enough evidence at the
0.05 level to conclude the alternative hypothesis.
Reliability and Validity

65
In quantitative study, reliability and validity of the analysis instrument are very
important for decreasing errors that might arise from measurement problems in the
research study. Reliability refers to the accuracy and precision of a measurement
procedure (Thorndike, 1997). Mistakes while selecting the sample size could have
occurred. Therefore, I performed a power analysis for my cross-sectional design to
increase reliability of my sample two-tailed t tests.
Validity refers to the degree to which a study accurately reflects or assesses the specific
concept or construct that the researcher was attempting to measure (Thorndike, 1997). To
increase validity, I plan to use doctoral peer review of my research results with an expert
in the field. In order to avoid bias and interpretation of quantitative results, I had double
checked to make sure my research question designed to measure a particular trait are
indeed measuring the same trait.
Research Permission and Ethical Considerations
Ethical issues was addressed at each phase in the study. In compliance with the
regulations of the Walden’s Institutional Review Board (IRB), the permission for
conducting the research must be obtained through IRB. The Request for Review Form
was filed, providing information about the principal investigator, the project title and
type, source of funding, type of review requested, number and type of subjects.
Application for research permission will contain the description of the project and its
significance, methods and procedures, participants, and research status. All study data,
including the data analysis electronic files, cloud computing company's risk data were

66
kept in locked metal file cabinets in the researcher’s office and destroyed after a
reasonable period of time.
Summary
Chapter 3 include an outline of the research method and design. I selected a
quantitative research method using cross-sectional design to determine measurement of
Paap’s CFTP ROI before and after adding traditional risk assessment. The quantitative
measurement includes dependent and independent variables. The dependent variable was
ROI. The independent variable was market risk. A paired sample two-tailed t tests was
performed to compare Paap’s CFTP 2010 model with and without traditional risk
assessment associated with multiple technology project investments. Chapter 3 also
include the study population and sample size used, as well as the data collection,
organization, and analysis methods used for the study. In additon, I discussed reliability,
validity, credibility, and ethical considerations of the research. Chapter 4 provides further
detailed on data collection and quantitative analysis.

67
Chapter 4: Results
The purpose of this research was to determine the relationship between returns on
investment before and after adding risk assessment to the CFTP framework. I used a
cross-sectional design to measure companies’ ROIs before and after adding adaptive risk
assessment to Paap’s CFTP. This cross-sectional design involved the analysis of data
collected from 35 cloud computing companies in the United States at one specific point
in time.
The research question was: What is the relationship to the return on investment by
adding traditional risk assessment model to Paap’s CFTP framework?
The quantitative measurements included a dependent variable and an independent
variable. The influence of this market risk assessment independent variable on Paap’s
CFTP ROI dependent variable yielded the following hypotheses:
The null hypothesis (H
0
): The return on investment may not be positively related
to adding a traditional risk assessment model to Paap’s CFTP framework.
The alternative hypothesis (H
1
): The return on investment may be positively
related to adding a traditional risk assessment model to Paap’s CFTP framework.
The paired sample two-tailed t tests methodology was used to test above
hypothesis. The convention mathematical format is:
A two-tailed test: , the p-value is 0.000 (Reject at α = 5%)
0:
0:
211
21
≠− =−
µµ µµ
H
H
o

68
where is the mean of the first population (Before: No risk), and is (After:
Added risk) the mean of the second population. The null hypothesis equals 0
represents the condition that the populations are centered in the same spot. The two sided
alternative hypothesis is that the means difference and does not equal 0.
The additional risk factor is market risk in cloud computing technology. Market risk is
the risk that market conditions can negatively impact ROI.
In this chapter I discussed data collection, quantitative analysis, and results from
this study. In the first section, I descrive the time frame for data collection, the
demographic characteristics of the sample, and how representative the sample is of the
population of interest was described. In the second section, I discuss the quantitative
analysis and research results. This section also included a report on descriptive statistics
that appropriately characterizes the sample, statistical assumptions, and statistical
analysis of the findings. In the final section of this chapter, I summarize the answers to
the research questions prove them with result findings.
Data Collection
The Walden Unversity Institutional Review Board (IRB) confirmed that my
doctoral capstone study met Walden University’s ethical standards (IRB #08-05-16-
0049972). I started my data collections after the IRB approval on August 5, 2016. I
collected two set of data: risk data and actual ROI. The time frame for data collection
was a single year in 2015. There were no discrepancies in the data collection from the
proposed data collection plan.
1
µ
2
µ
21
:
µ
µ
−
o
H
211
:
µ
µ
−
H

69
The market research done by Collins and McAllister (2011) on cloud services
revenues between 2010 and 2014 provided me background on the demographic and
population selections.Collins and McAllister (2011) provided a chart representation of
the cloud computing companies showing that the United States was the largest market for
cloud services, with a market share of 50% in 2014. My research population was limited
to 35 cloud computing companies located in United States that invested $100 million or
more in cloud technology during the year 2015. I drew the 35 cloud computing
company’s ROI and market risk data from the 2015 annual reports of each company. The
annual report is a comprehensive report on a company's activities, and it is issued to a
company's shareholders, creditors, and regulatory organizations following the end of its
fiscal year. The 2015 annual report can be found on the company’s website, Mergent
online database, and/or U.S. Securities and Exchange Commission Form 10-K
government website. The federal securities laws require public companies to disclose the
annual report on Form 10-K, which provides a comprehensive overview of the company's
business and financial condition and includes audited financial statements. For example,
the 2015 IBM annual report listed a cloud ROI of 57%. IBM’s strategic imperatives
grew by 26% and generated $29 billion in 2015, which represented 35% of IBM’s total
revenue. The 2015 IBM market risk was low. IBM manages this risk, in part, through the
use of derivative financial instruments. There were no covariates within this study.

70
Quantitative Analysis and Research Results
This section I summarize the quantitative analysis and results after the data
collection. I condected a power analysis to determine the sample size required for this
cross-sectional study and found that a minimum of 24 data samples were required (see
Figure 15). Therefore, I conducted the study with a sample size of 35 cloud computing
companies located in the United States that invested $100 million or more in cloud
technology during the year 2015. An introduction to each of the 35 cloud computing
companies follows:
• Amazon is an electronic commerce and cloud computing company with
headquarters in Seattle, Washington. Amazon Elastic Compute Cloud (Amazon
EC2) is a web service that provides resizable compute capacity in the cloud
computing platform.
• AppDirect is an enterprise cloud service commerce company headquartered in
San Francisco, California. AppDirect provide cloud software that builds an app
store for its clients and buyers.
• Apple is a hardware and digital technology company company with headquarters
in Cupertino, California. Apple iCloud is a cloud storage and cloud computing
service. The service provides Apple users with data storage for items such as
documents, photos, and music on remote servers for download to iOS, Macintosh,
or Windows devices, to share and send data to other Apple users, and to manage
their Apple devices if lost or stolen.

71
• AT&T is a telecommunication and cloud computing company headquartered in
Dallas, Texas. AT&T cloud services provides computing, storage, software,
development, and network resources on demand. AT&T has developed the ability
to provide virtual private and hybrid cloud computing to their customers.
• BlueLock is a cloud technology service company headquartered in Indianapolis,
Indiana. BlueLock provides cloud computing environments to reduce IT risks and
IT costs, and to provide a faster infrastructure to their customers.
• BMC is an IT software solutions and cloud services company headquartered in
Houston, Texas. BMC provides Cloud Lifecycle Management, which integrates
with TrueSight Capacity Optimization to help IT deliver fast and reliable cloud
services. The BMC cloud computing also provides intelligent analytics to
improve IT performance and reduce the cloud computing costs.
• CA Tech is an IT software and cloud services company with headquarters in New
York, New York. CA Cloud Service Management improves IT efficiency via
automated workflows and upgrades. CA Tech creates IT software that runs in
mainframe, distributed computing, virtual machine, and cloud computing
environments.
• Cisco is a network technology and cloud computing company headquartered in
San Jose, California. Cisco cloud solutions reduce the cost of cloud computing,
simplify cloud management and operations, and increase IT/network services
worldwide.

72
• Citrix is a software company headquartered in Santa Clara, California, and Fort
Lauderdale, Florida, that provides cloud computing technologies, server,
application, and desktop virtualization, and IT/network services. Citrix Cloud
reduces cost and complexity in infrastructure and software services, and allows
customers to deliver a desktop quickly and efficiently.
• CloudStack is an open source cloud computing company owned by Apache
Software Foundation with headquarters in Mountain View, California.
CloudStack provides open source cloud computing software for creating,
managing, and deploying infrastructure cloud services. CloudStack provides
computing orchestration, NaaS, user and account management, open application
program interface (API), resource accounting, and a user interface (UI).
• Datapipe is an IT and cloud solutions company headquartered in Jersey City, New
Jersey. Datapipe provides enterprise cloud services and IT solutions. Datapipe
provides managed IT solutions to more than 2,000 customers in 25 data center
facilities worldwide.
• Dell is a computer company headquartered in Round Rock, Texas. Dell provides
cloud solutions that includes cross-platform infrastructure services, private and
hybrid clouds, and heterogeneous cloud management.
• Eucalyptus is an open source cloud computing company headquartered in Goleta,
California. Eucalyptus is the acronym for Elastic Utility Computing Architecture
for Linking Your Programs To Useful Systems. Eucalyptus’ cloud provides
computing, storage, and network resources that can be dynamically scaled up or

73
down as application workloads change. Eucalyptus announced a formal
agreement with Amazon Web Services in March 2012 to maintain compatibility.
• Fujitsu is an IT equipment and cloud services company with U.S. headquarters in
San Jose, California. Fujitsu provides cloud solutions and services in
infrastructure, platform, and software, as well as a hybrid cloud. Fujitsu cloud
computing has increased the processing power, storage capability, and IT network
infrastructures of its users.
• Google is a web and internet services company that provides online advertising
technologies, and search, cloud computing, and software services. Google
headquarters are located in Mountain View, California. The Google Cloud
platform allow users to build and host applications and websites, store data, and
analyze data on Google's scalable infrastructure. Google Cloud provides
collaboration and productivity applications online including machine learning
tools, APIs, the enterprise Maps APIs, and the Android operating system for
phones, tablets, and Chromebooks.
• Hewlett Packard (HP) is a computer company headquartered in Palo Alto,
California. HP Helion Eucalyptus cloud provides interoperability with Amazon
Web Services (AWS). HP Helion Eucalyptus cloud had a combined storage,
servers, networking and software, since HP procured Helion and Eucalyptus open
source cloud services in 2014 and end of 2015.
• IBM is a computer company with headquarters in Armonk, New York. IBM
SmartCloud consists of the infrastructure, hardware, provisioning, management,

74
integration and security that serve as the underpinnings of a private or hybrid
cloud. IBM SmartCloud Solutions consist of collaboration tools, analytics and
marketing software applications. IBM cloud platforms has a built-in support for
virtualization and IBM Websphere application infrastructure solutions are
supporting the programming models and open standards for virtualization.
• Internap Corp. is an internet and cloud computing company headquartered in
Atlanta, Georgia. Internap cloud services provides large-scale and high-
performance workloads .Internap cloud solutions uses low-latency IP service for
maximum network performance. Internap cloud computing provided services to
online retail, online gaming, software, and financial and business industries.
• Micro Focus is an Information Technology (IT), software, and cloud computing
company with United States headquarters in Santa Clara, California and Seattle,
Washington. Micro Focus cloud provides an enterprise cloud services include
platform, software, and infrastructure.
• Microsoft is a software company headquartered in Redmond, Washington.
Microsoft cloud computing provides services to Azure products, cybercrime
investigation, infrastructure, software, platform, data insights, enterprise mobility,
and real time online collaboration.
• Oracle is a database and cloud computing company headquartered in Redwood
City, California. Oracle enterprise cloud computing provides software, platform,
infrastructure, and database services. Oracle enterprise cloud computing help
increase business agility, lowering costs, and reducing IT complexity.

75
• OpenNebula is an open source cloud computing company headquartered in
Cambridge, Massachusetts. OpenNebula cloud computing included infrastructure,
software, platform services. OpenNebula cloud provides storage, network,
virtualization, monitoring, and security technologies to virtual machines on
distributed infrastructures using combined data center and remote cloud resources.
• OpenStack is an open source cloud computing company headquartered in Austin,
Taxes. OpenStack cloud computing provides open source software, platform, and
infrastructure services. OpenStack cloud consists of interrelated components that
control hardware pools of processing, storage, and networking resources
throughout a data center. Users either manage it through a web-based dashboard,
through command-line tools, or through a RESTful API.
• Piston is an enterprise private cloud software company headquartered in San
Francisco, California. Piston Cloud Computing is a subsidiary of Cisco during
June 12, 2015. Piston cloud provides software that automate orchestration and
deployment of cloud computing distributed systems for running applications on
OpenStack.
• Rackspace is cloud computing company headquartered in Windcrest, Texas.
Rackspace cloud computing provides web application hosting, Platform as a
Service (PaaS), cloud storage, virtual private server, load balancers, databases,
backup, and monitoring.
• Red Hat is a software and cloud computing company headquartered in Raleigh,
North Carolina. Red Hat cloud computing provides solutions for private, hybrid,

76
and public cloud services. Red Hat cloud computing helps customers to build and
manage a private Infrastructure as a Service (IaaS). Red Hat cloud computing
provides Platform as a Service (PaaS) to help customer on quick application
development, application hosting, and scalable application method. Red Hat
cloud computing also provides Software as a Service (SaaS) application, data
storage, and other data sources.
• Salesforce is a cloud computing company headquartered in San Francisco,
California. Salesforce provides cloud-based tools that increase customer’s
productivity. Salesforce cloud computing tools help interfacing the case and task
managements to automatically route and escalate customers on event planning
includes a social networking site, analytical tools, and other cloud computing
services.
• SAP is a cloud computing company with United States headquarters in Newtown
Square, Pennsylvania. SAP cloud computing company provides in-memory
technology, software, platform (PaaS), and infrastructure services. SAP enterprise
cloud security and hosting services enhanced public, private, or hybrid cloud
environments.
• Savvis is a social media communications and cloud computing company
headquartered in Town and Country, Missouri. Savvis Symphony cloud
computing solutions allow customers to deliver cost savings, high performance,
scalability and security applications with leading connectivity and cloud storage
from the Savvis’ 31 global data centers.

77
• Sage is a business software and cloud computing company with United States
headquarters in Atlanta, Georgia. Sage mobile cloud computing provides services
to manage human resources and payroll accountings.
• Tableau is a software and cloud computing company headquartered in Seattle,
Washington. Tableau cloud computing provides online workbook sharing, online
hosting Tableau Server, and access data from databases, data warehouses, Hadoop
clusters, Excel files and cloud applications.
• Ultimate is a business software and cloud computing company headquartered in
Weston, Florida. Ultimate cloud computing provides human resource and payroll
Software as a Service (SaaS) solutions. Ultimate UltiPro is a cloud-based human
capital management (HCM) solutions to enable businesses to consolidate,
manage, and analyze comprehensive workforce information.
• Version is a telecommunication and cloud computing company headquartered in
New York City, New York. Version cloud computing allow users to secure online
storage by back up and sync customer’s contacts, photos, videos, music,
documents, call logs and text messages.
• Virtustream is an enterprise cloud software and services provider company
headquartered in Bethesda, Maryland. Virtustream cloud computing provides
enterprise private, public, and hybrid clouds to run complex software and I/O
intensive applications. Virtustream also provides cloud storage, planning and
migration to their customers. EMC Corporation acquired Virtustream on July 9,
2015 and Dell acquired parent company EMC during January 2016.
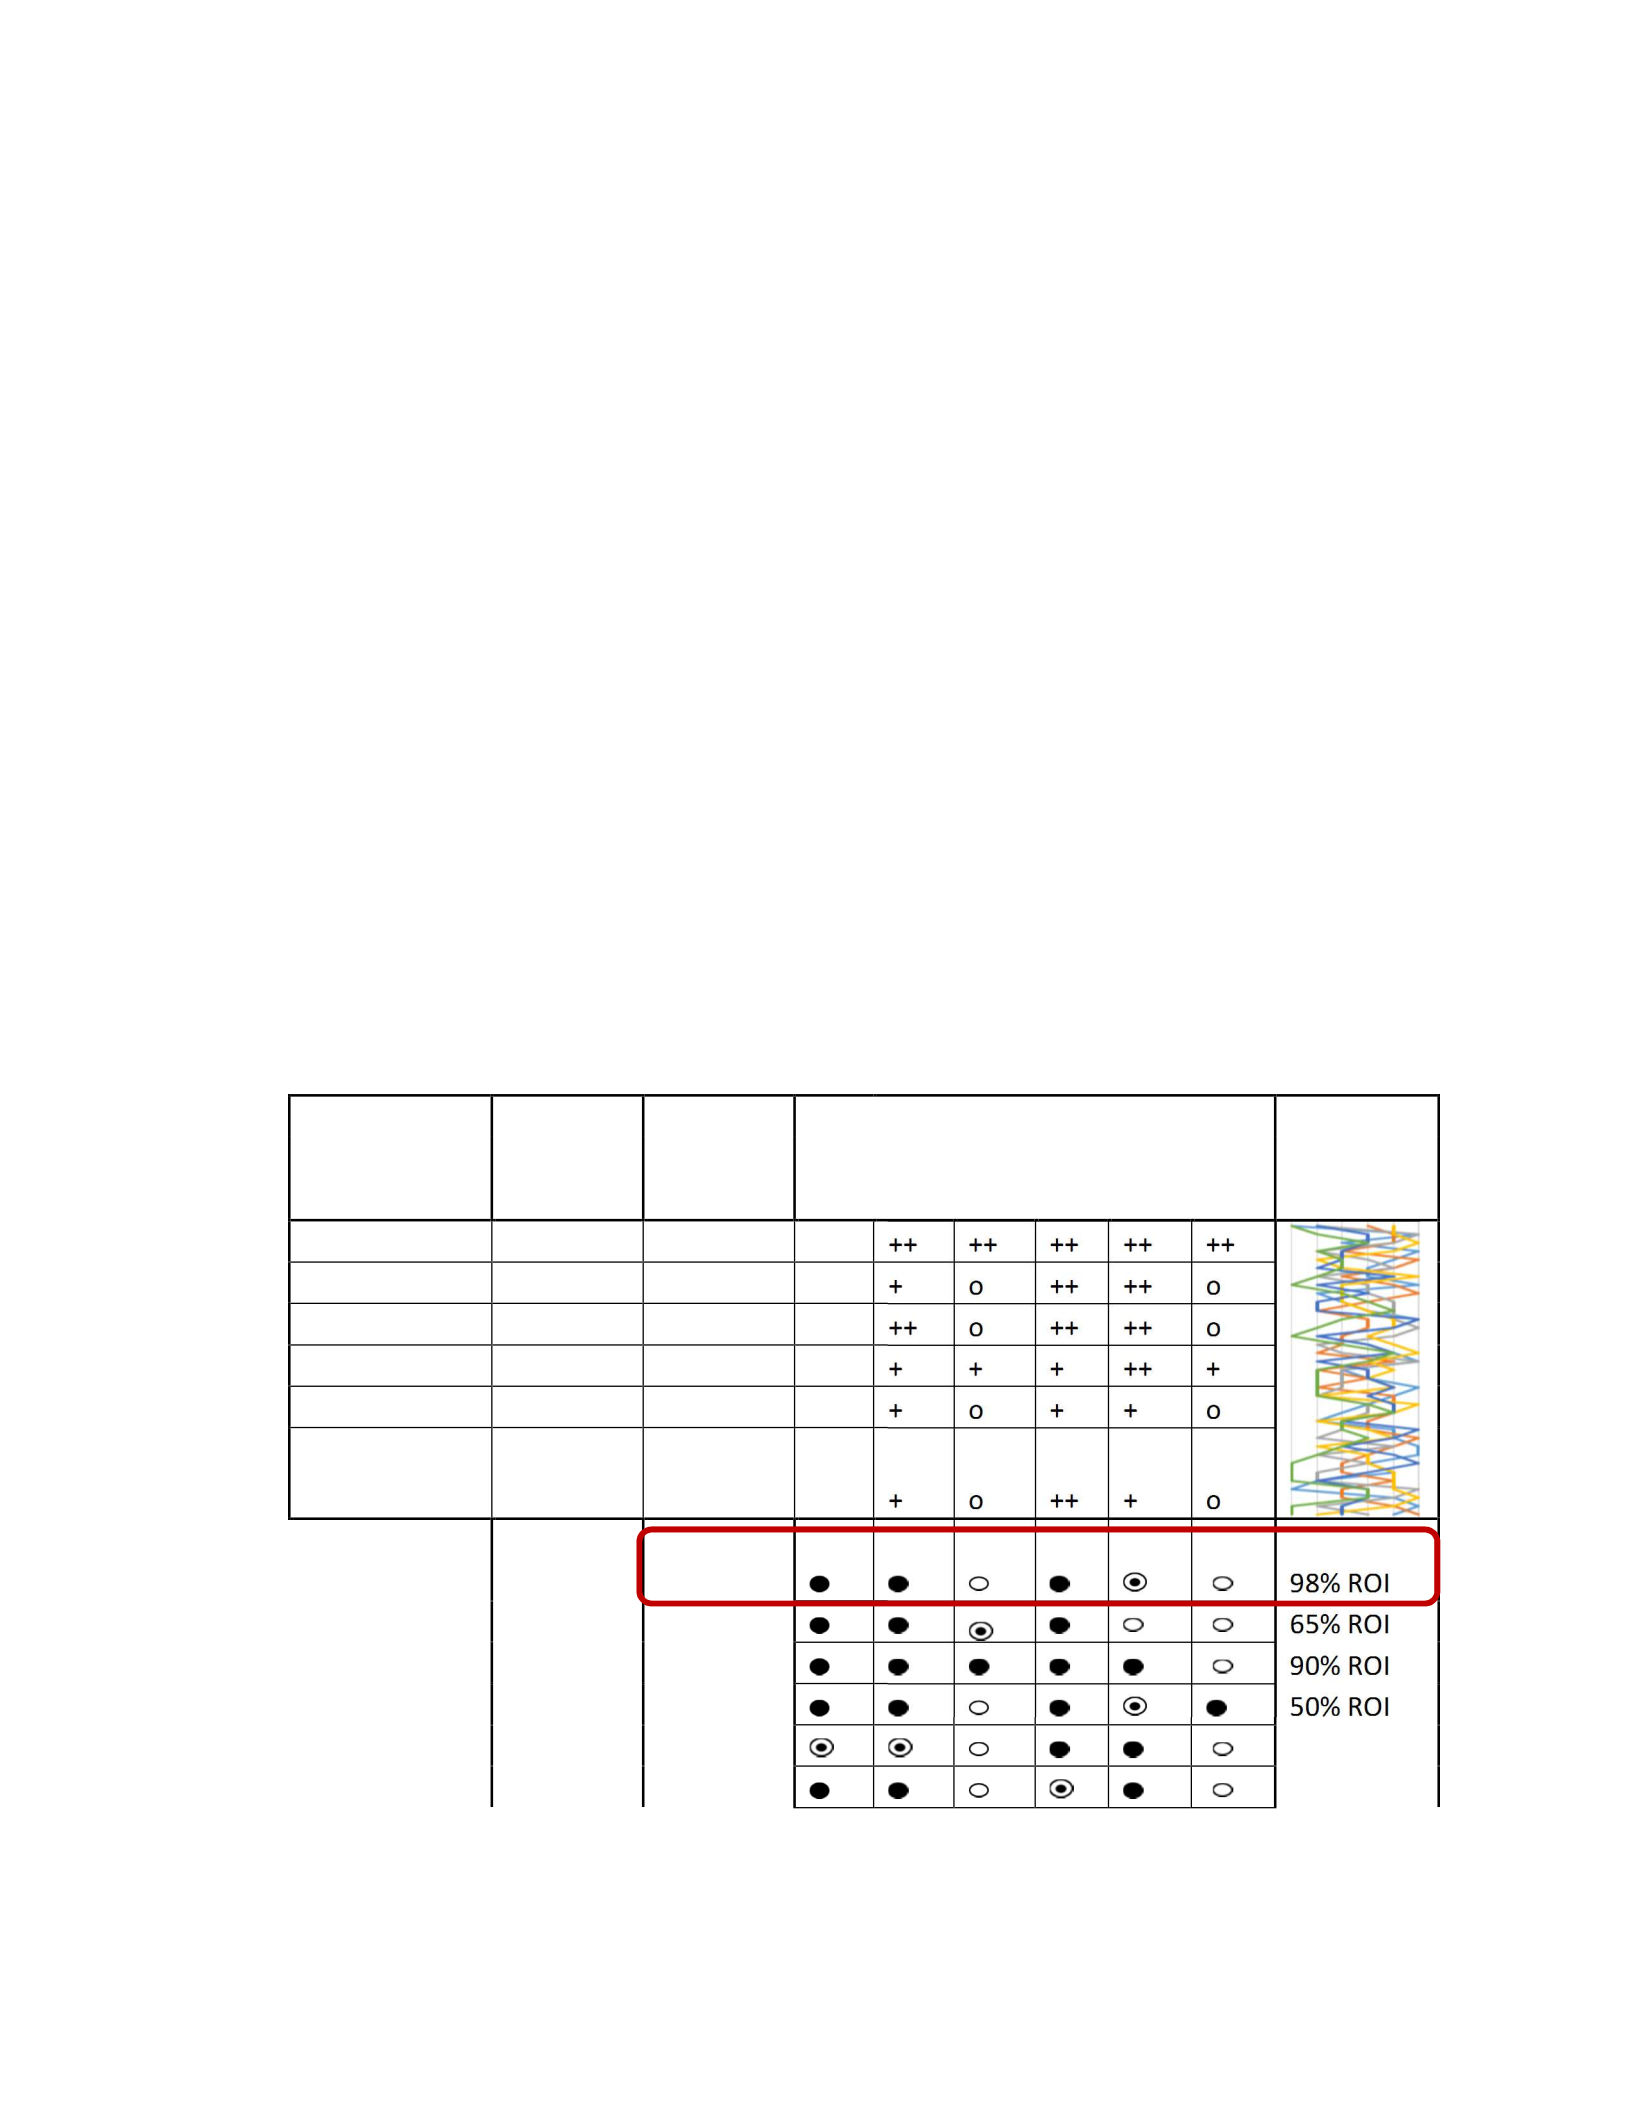
78
• VMware is a software and cloud computing services company headquartered in
Palo Alto, California. VMware is a now a subsidiary of Dell and Dell's acquisition
of parent company EMC during January 2016. VMware cloud computing uses
enterprise capabilities to run, manage, connect and secure online applications
across multiple private and public clouds and devices.
The assumption was that the cloud computing companies’ ROI values are an input
to Paap’s CFTP ROI values. Paap’s CFTP framework was used to analyze and evaluate
the the assumption of the best Cloud Computing ROI in the year 2015. The results are
shown in Figure 16.
Paap’s CFTP with ROI only
Market: IT/Cloud Computing
Product Class: Cloud Service Selection and Procurement
Cloud Computing Technologies Competitors
Performance
Characteristic Importance
Industry
Leverage SaaS PaaS CaaS IaaS DaaS NaaS ++ --
Security
1 H ++ ++ ++ ++ ++ ++
Processing
2 M + + o ++ ++ o
Storage
3 H o ++ o ++ ++ o
Input/Output
4 H + + + + ++ +
Price
5 M o + o + + o
Provisioning
6 L + + o ++ + o
Competitor
Profile Amazon
98% ROI
AppDirect
65% ROI
Apple
90% ROI
AT&T
50% ROI
BlueLock
30% ROI
BMC
40% ROI
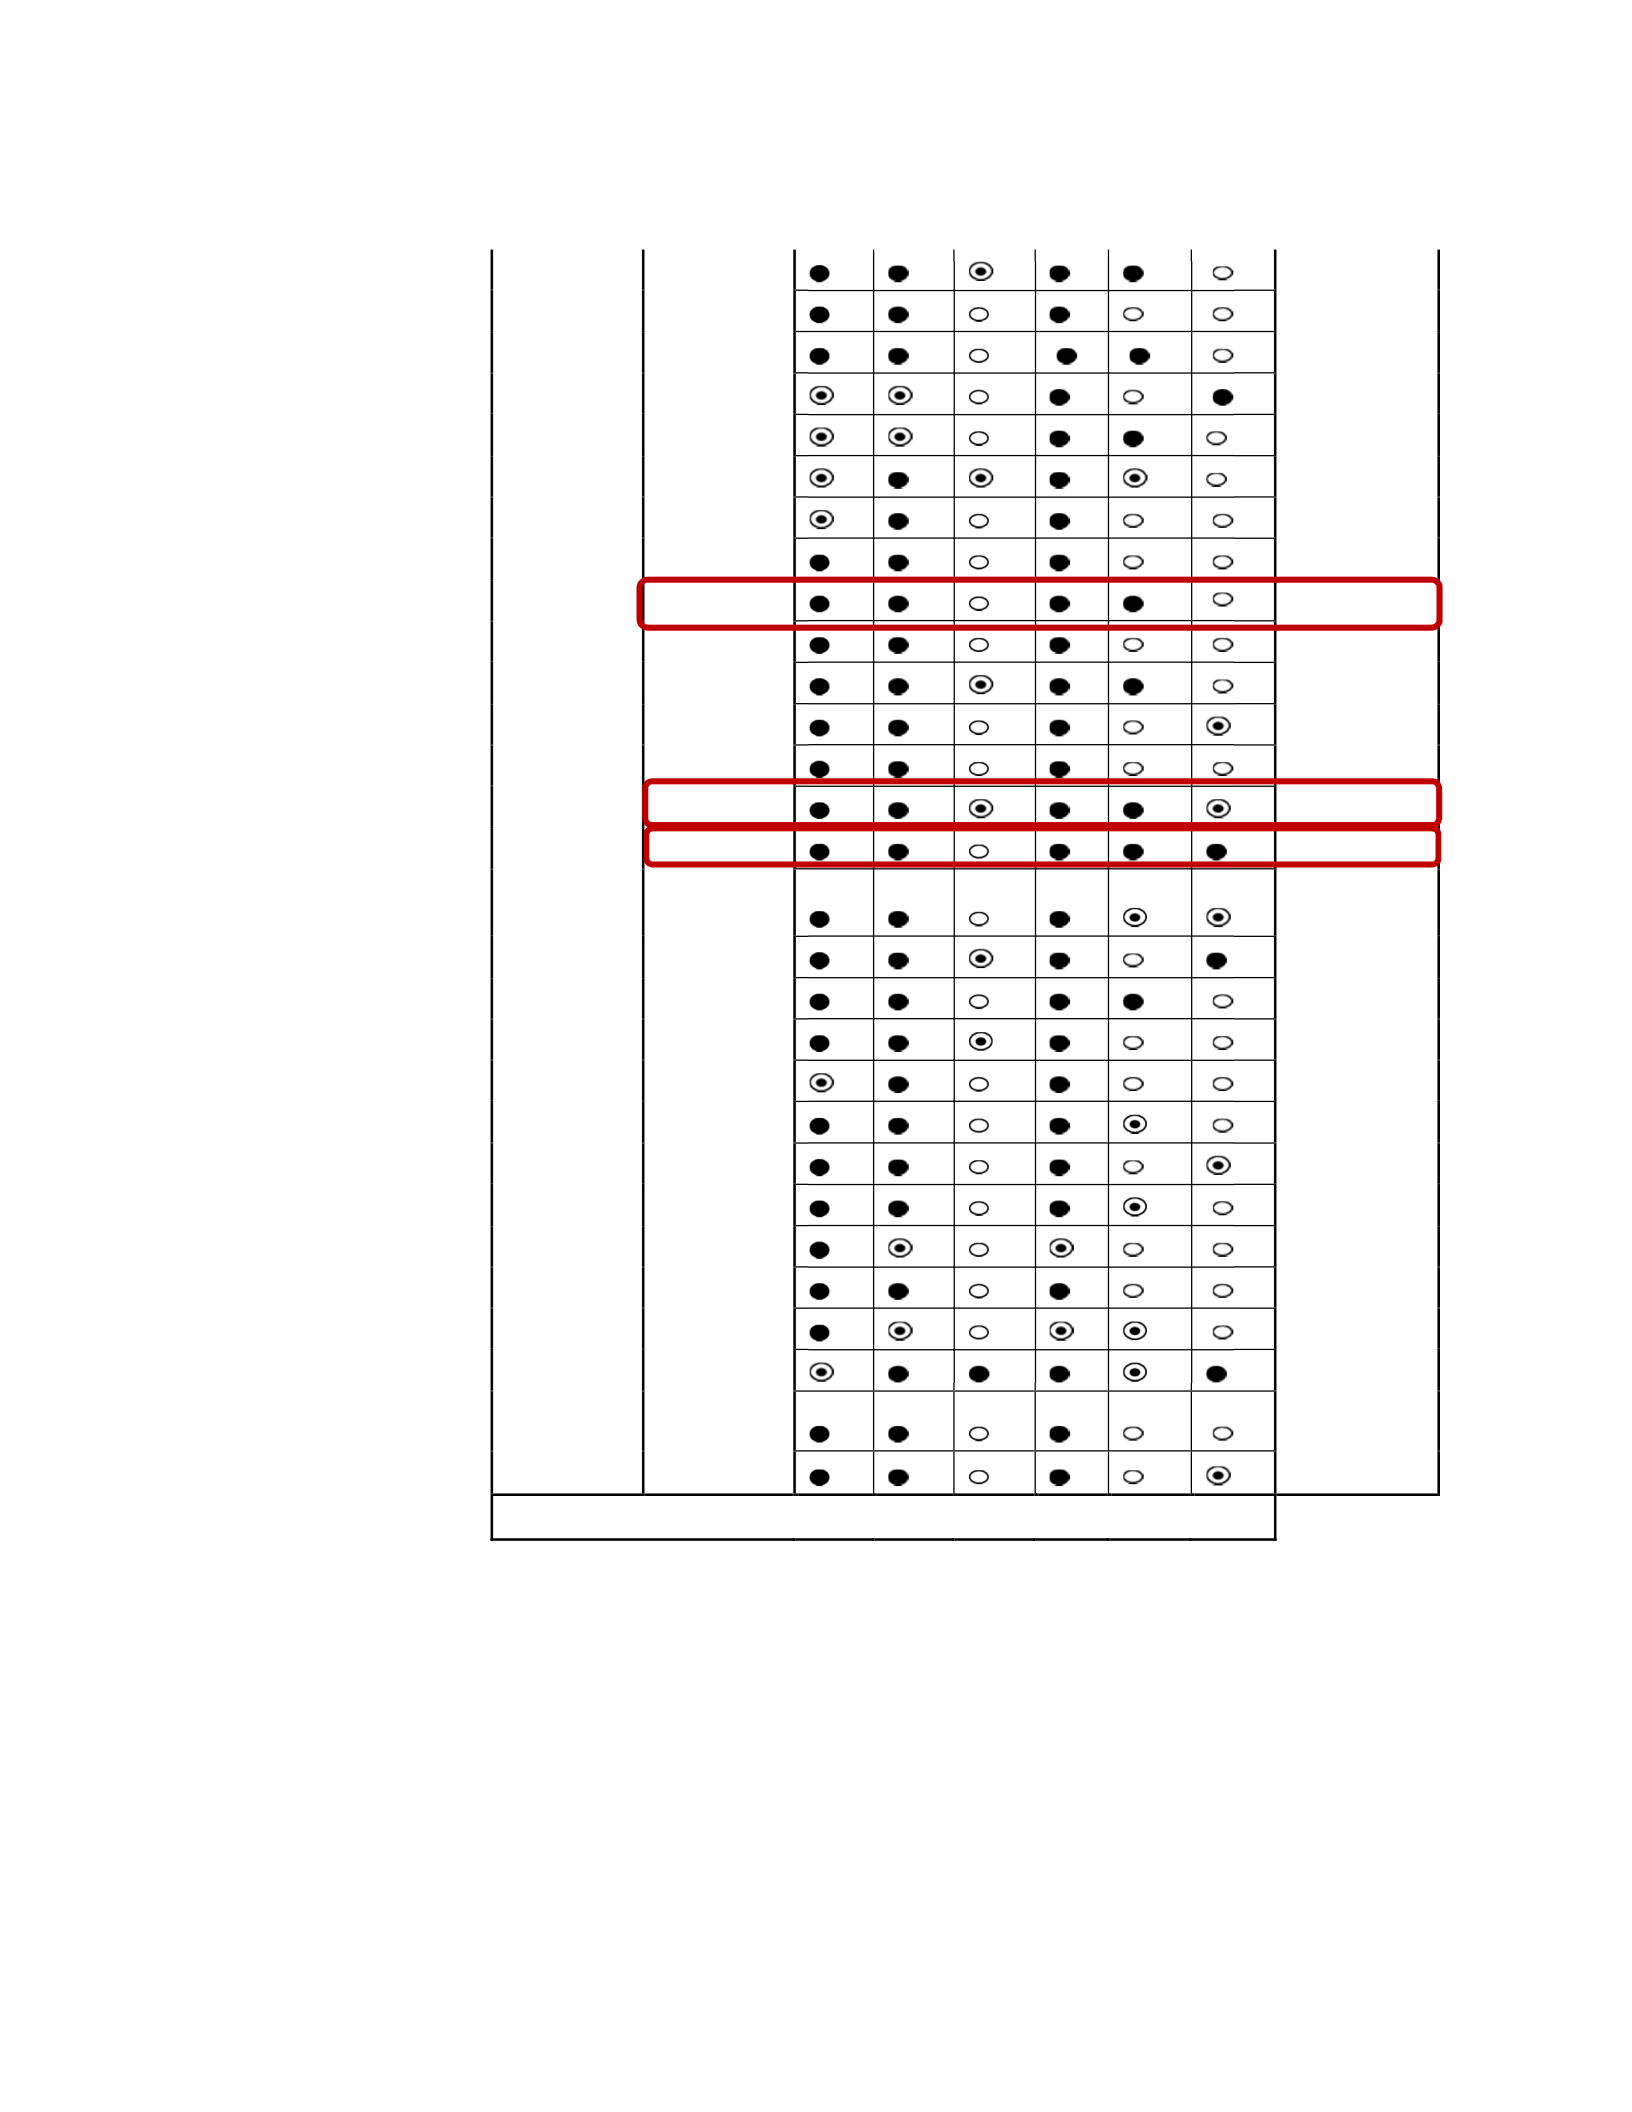
79
CA Tech
45% ROI
Cisco
56% ROI
Citrix
72% ROI
CloudStack
32% ROI
Datapipe
30% ROI
Dell
37% ROI
Eucalyptus
20% ROI
FUJITSU
55% ROI
Google
98% ROI
HP
61% ROI
IBM
57% ROI
Internap
68% ROI
Micro Focus
57% ROI
Microsoft
98% ROI
Oracle
98% ROI
OpenNebula
70% ROI
OpenStack
85% ROI
Piston
83% ROI
Rackspace
68% ROI
Red Hat
23% ROI
Salesforce
77% ROI
SAP
74% ROI
Savvis
89% ROI
Sage
19% ROI
Ultimate
57% ROI
Tableau
51% ROI
Version
89% ROI
Virtustream
(EMC)
62% ROI
VMware
86% ROI
Relative Maturity M M G M E G

80
Figure 16. Paap’s CFTP ROI results.
The result description for Paap’s CFTP with ROI only has determined four possibilities
on high return on investment. The four companies are Amazon, Google, Microsoft and
Oracle. All four companies scored a 98% ROI for year 2015. The competitive profiles of
the four companies are very similar. The interpretation of the competitive profiles are
evaluated by the definitions of cloud computing technologies listed below:
(a) Software as a Service (SaaS): Provide a cloud service user the applications
running on a cloud infrastructure in a non-real-time environment, such as IT and
business applications. The cloud service user does not manage or control the
underlying cloud infrastructure, with the possible exception of limited user-
specific application configuration settings.
(b) Communications as a Service (CaaS): Provide a cloud service user to use real-
time communication and collaboration services, such as voice over IP, instant
messaging, and video conferencing.
(c) Platform as a Service (PaaS): Provide a cloud service user to deploy user-
created or acquired applications onto the cloud infrastructure using platform tools

81
supported by the cloud service provider. The platform tools may include
programming languages and tools for application development, interface
development, database development, storage and testing. The cloud service user
does not manage or control the underlying cloud infrastructure, but has control
over the deployed applications and, possibly, over the application hosting
environment configurations.
(d) Infrastructure as a Service (IaaS): Provide a cloud service user to provisioning,
processing, data storage, intra-cloud network connectivity services (e.g. VLAN,
firewall, load balancer, and application acceleration), and other fundamental
computing resources of the cloud infrastructure where the cloud service user was
able to deploy and run arbitrary application. The cloud service user does not
manage or control the resources of the underlying cloud infrastructure but has
control over operating systems, deployed applications, and possibly limited
control of select networking components (e.g., host firewalls).
(e) Network as a Service (NaaS): Provide a cloud service user to transport
connectivity services and/or inter-cloud network connectivity services, such as
Virtual Private Network (VPN) and bandwidth on demand.
(f) Big data as a Service (DaaS): Provide a cloud service user to use statistical
analysis tools or information by an outside service provider that helps
organizations understand and use insights gained from large information sets in
order to gain a competitive advantage, such as a web dashboard or control panel
to carrying out the actual analysis and providing reports.

82
Amazon’s competitive profile listed SaaS with strong capability/high investment, PaaS
with strong capability/high investment, CaaS with low capability/high investment, IaaS
with strong capability/high investment, DaaS with moderate capability/high investment,
NaaS with low capability/high investment. Google’s competitive profile listed SaaS with
strong capability/high investment, PaaS with strong capability/high investment, CaaS
with low capability/high investment, IaaS with strong capability/high investment, DaaS
with high capability/high investment, NaaS with low capability/high investment.
Microsoft’s competitive profile listed SaaS with strong capability/high investment, PaaS
with strong capability/high investment, CaaS with moderate capability/high investment,
IaaS with strong capability/high investment, DaaS with high capability/high investment,
NaaS with moderate capability/high investment. Oracle’s competitive profile listed SaaS
with strong capability/high investment, PaaS with strong capability/high investment,
CaaS with low capability/high investment, IaaS with strong capability/high investment,
DaaS with strong capability/high investment, NaaS with strong capability/high
investment. The relative technology maturity was analyzed. SaaS was under the mature
technology category, PaaS was under the mature technology category, CaaS was under
the growing technology category , IaaS was under the mature technology category , DaaS
was under the emerging technology, and NaaS was under the growing technology.
The six performance characteristics chosen in this study was security, processing,
storage, input/output, price, and provisioning. The importance rank of the six
performance characteristics were based on cloud computing experts in the field. Ranking
number one on the performance characteristics were cloud computing security and the

83
industry leverage is high. The cloud computing security are defined as the control-based
technologies and policies designed to compliances with rulesets and protect information,
data applications and infrastructure associated with cloud computing usage. Ranking
number two is cloud computing processing and the industry leverage is medium. The
cloud computing processing is an internet-based computing that provides shared
processing resources and data to computer users, smart phone users, and/or other devices
on demand. Ranking number three is cloud computing storage and the industry leverage
is high. The cloud computing storage is remote data internet storage and it is maintained,
operated and managed by a cloud storage service provider on a storage servers that are
built on virtualization techniques. Ranking number four is cloud computing input/output
and the industry leverage is high. The cloud computing input/output (I/O) device is an
internet device that has the ability to accept inputted, outputted or other processed data.
The cloud computing I/O can acquire data as input sent to a computer, smart phone or
other devices on demand or send data to cloud computing storage as an output. Ranking
number five would be price in cloud computing and this related to how much user buy or
acquire the cloud computing services. The industry leverage is medium. Kim (2015)
plotted the average pricing for each of the cloud computing companies shown in Figure
17. Based on Figure 17, Amazon Web Services (AWS) dropped prices by 8% from Oct.
2013 to Dec. 2014, while both Google and Microsoft cut their prices to 6% and 5% and
other cloud companies who charge more, like Rackspace and AT&T, dropped prices even
more significantly (Kim, 2015, p.3). Most of the cloud computing company would like to
be competitive in pricing on the United States market. The last ranking is cloud
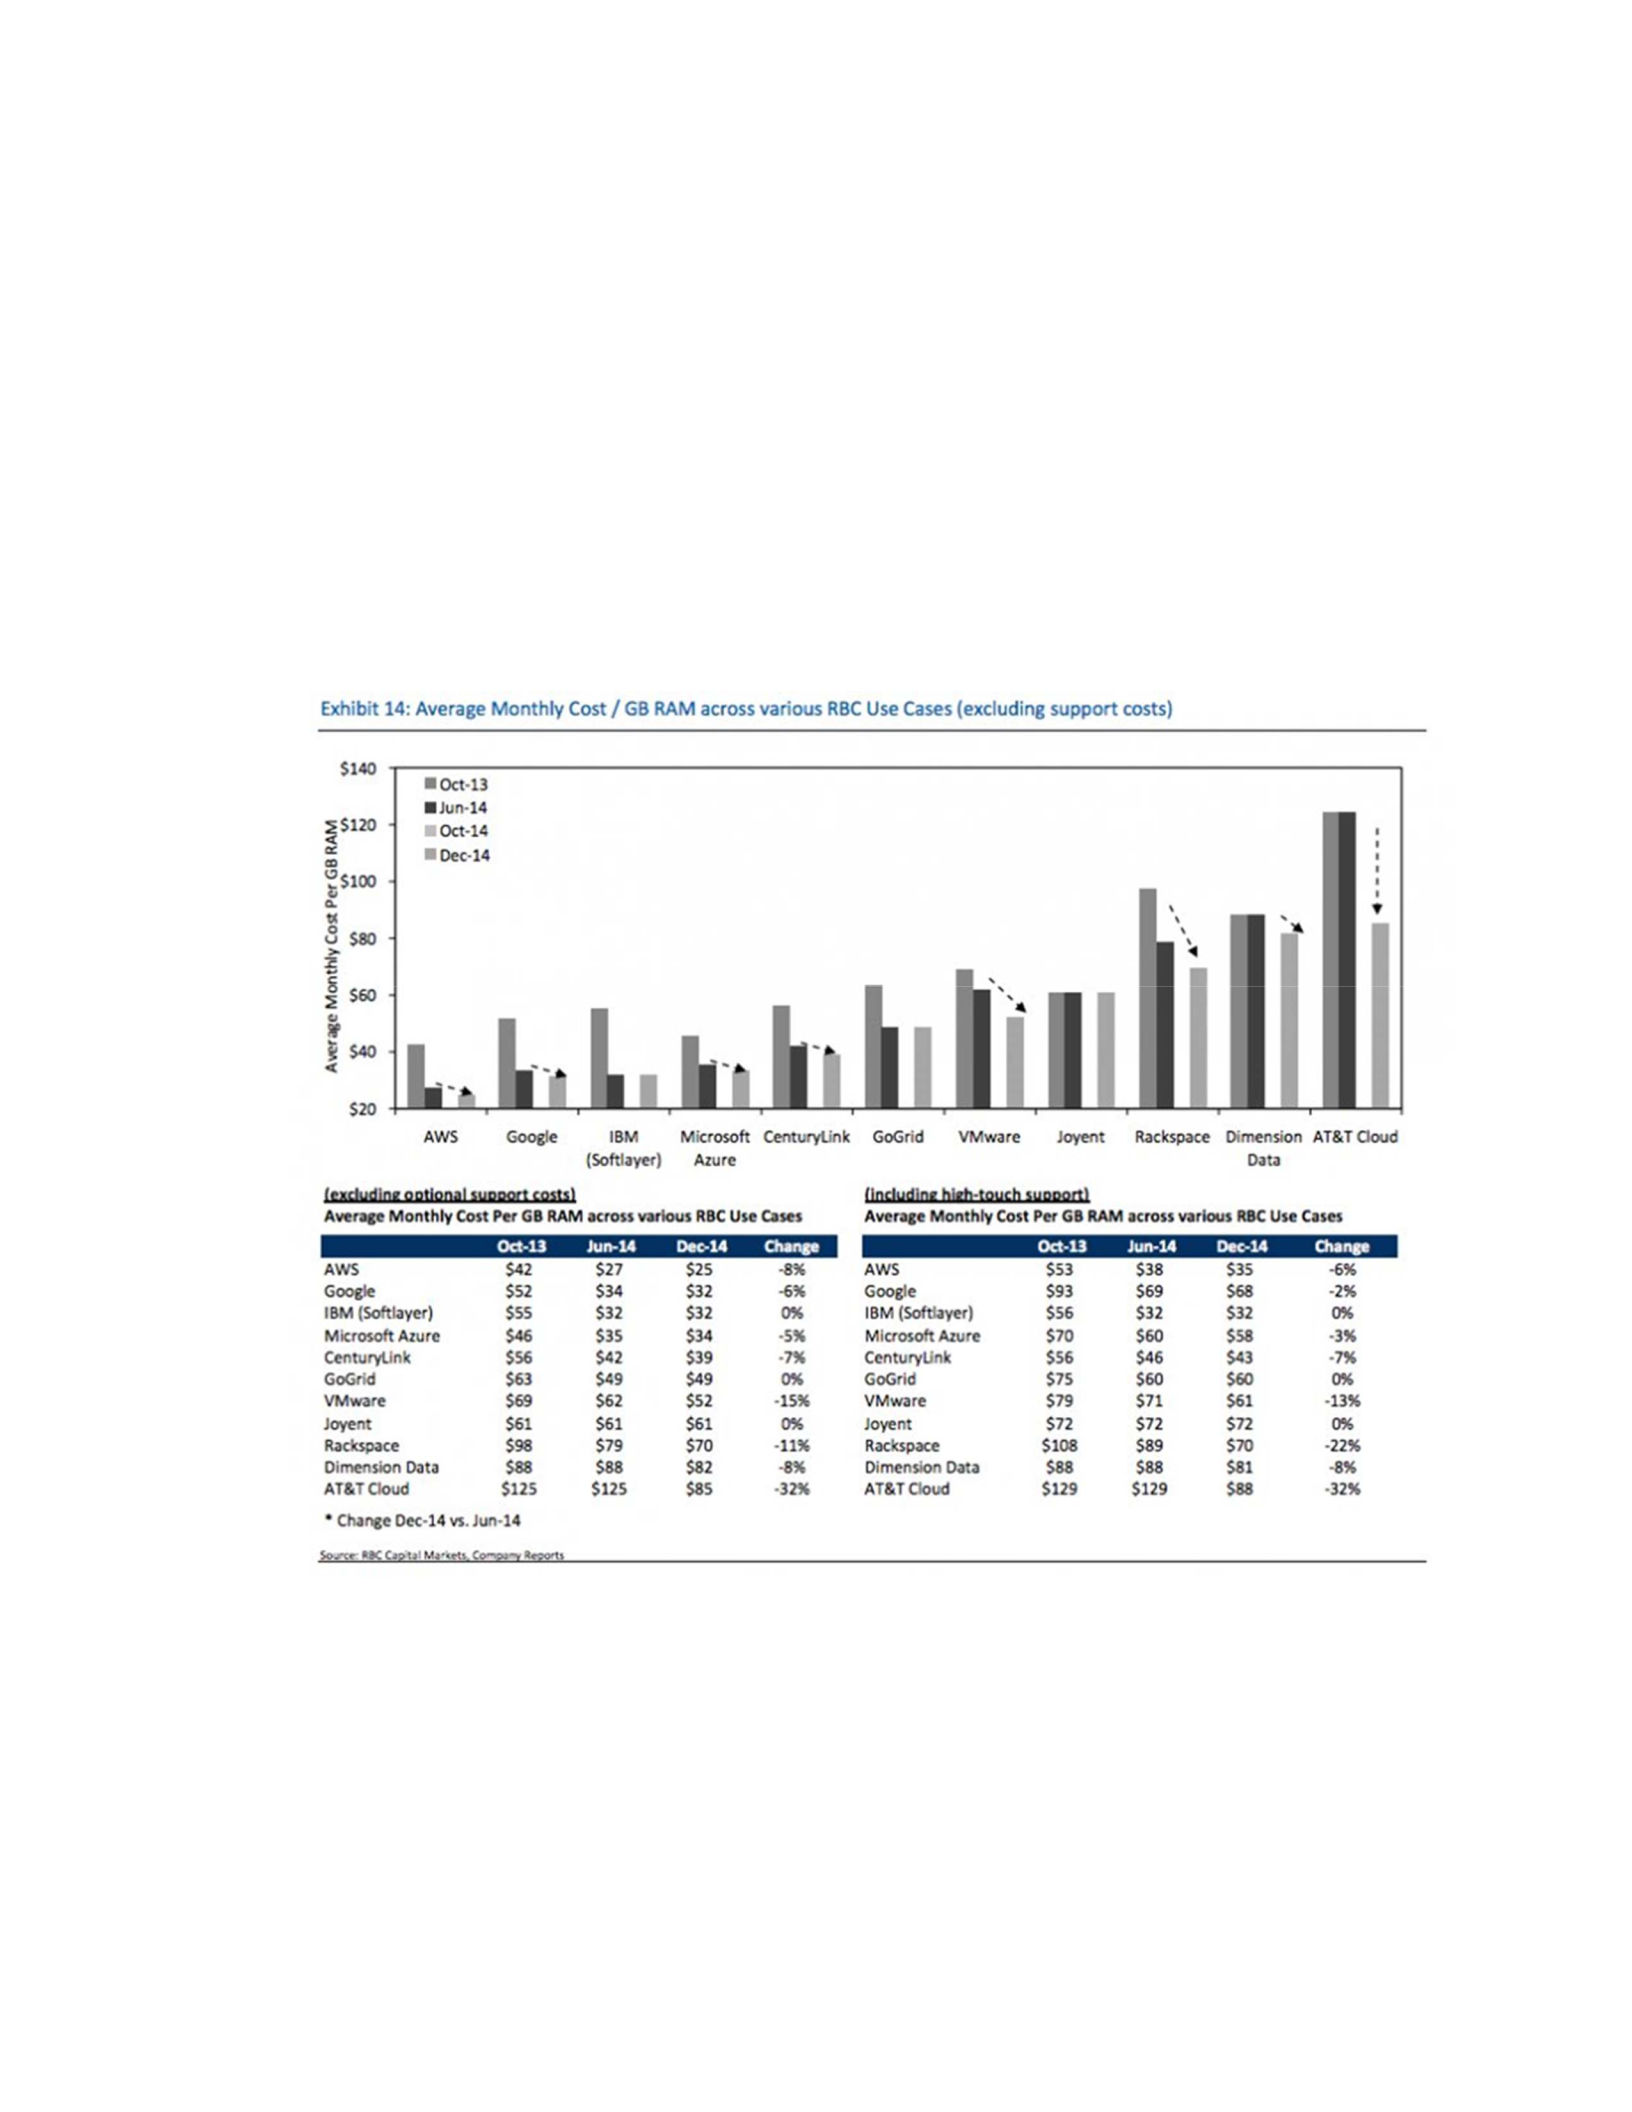
84
computing provisioning. The cloud computing provisioning involves selecting the
applications and services will reside in the internet computing and developing the
processes for interfacing with the cloud computing’s applications and services, as well as,
auditing and monitoring which user accesses and utilizes the resources. The industry
leverage of cloud computing provisioning is low due to the customer reaction on
performance improvement was required.
Figure 17. Cloud computing company’s pricing. From This one chart shows the vicious
price war going on in cloud computing, by E. Kim, 2010, p. 3. Retreived from Business
Insider. Reprinted with permission.
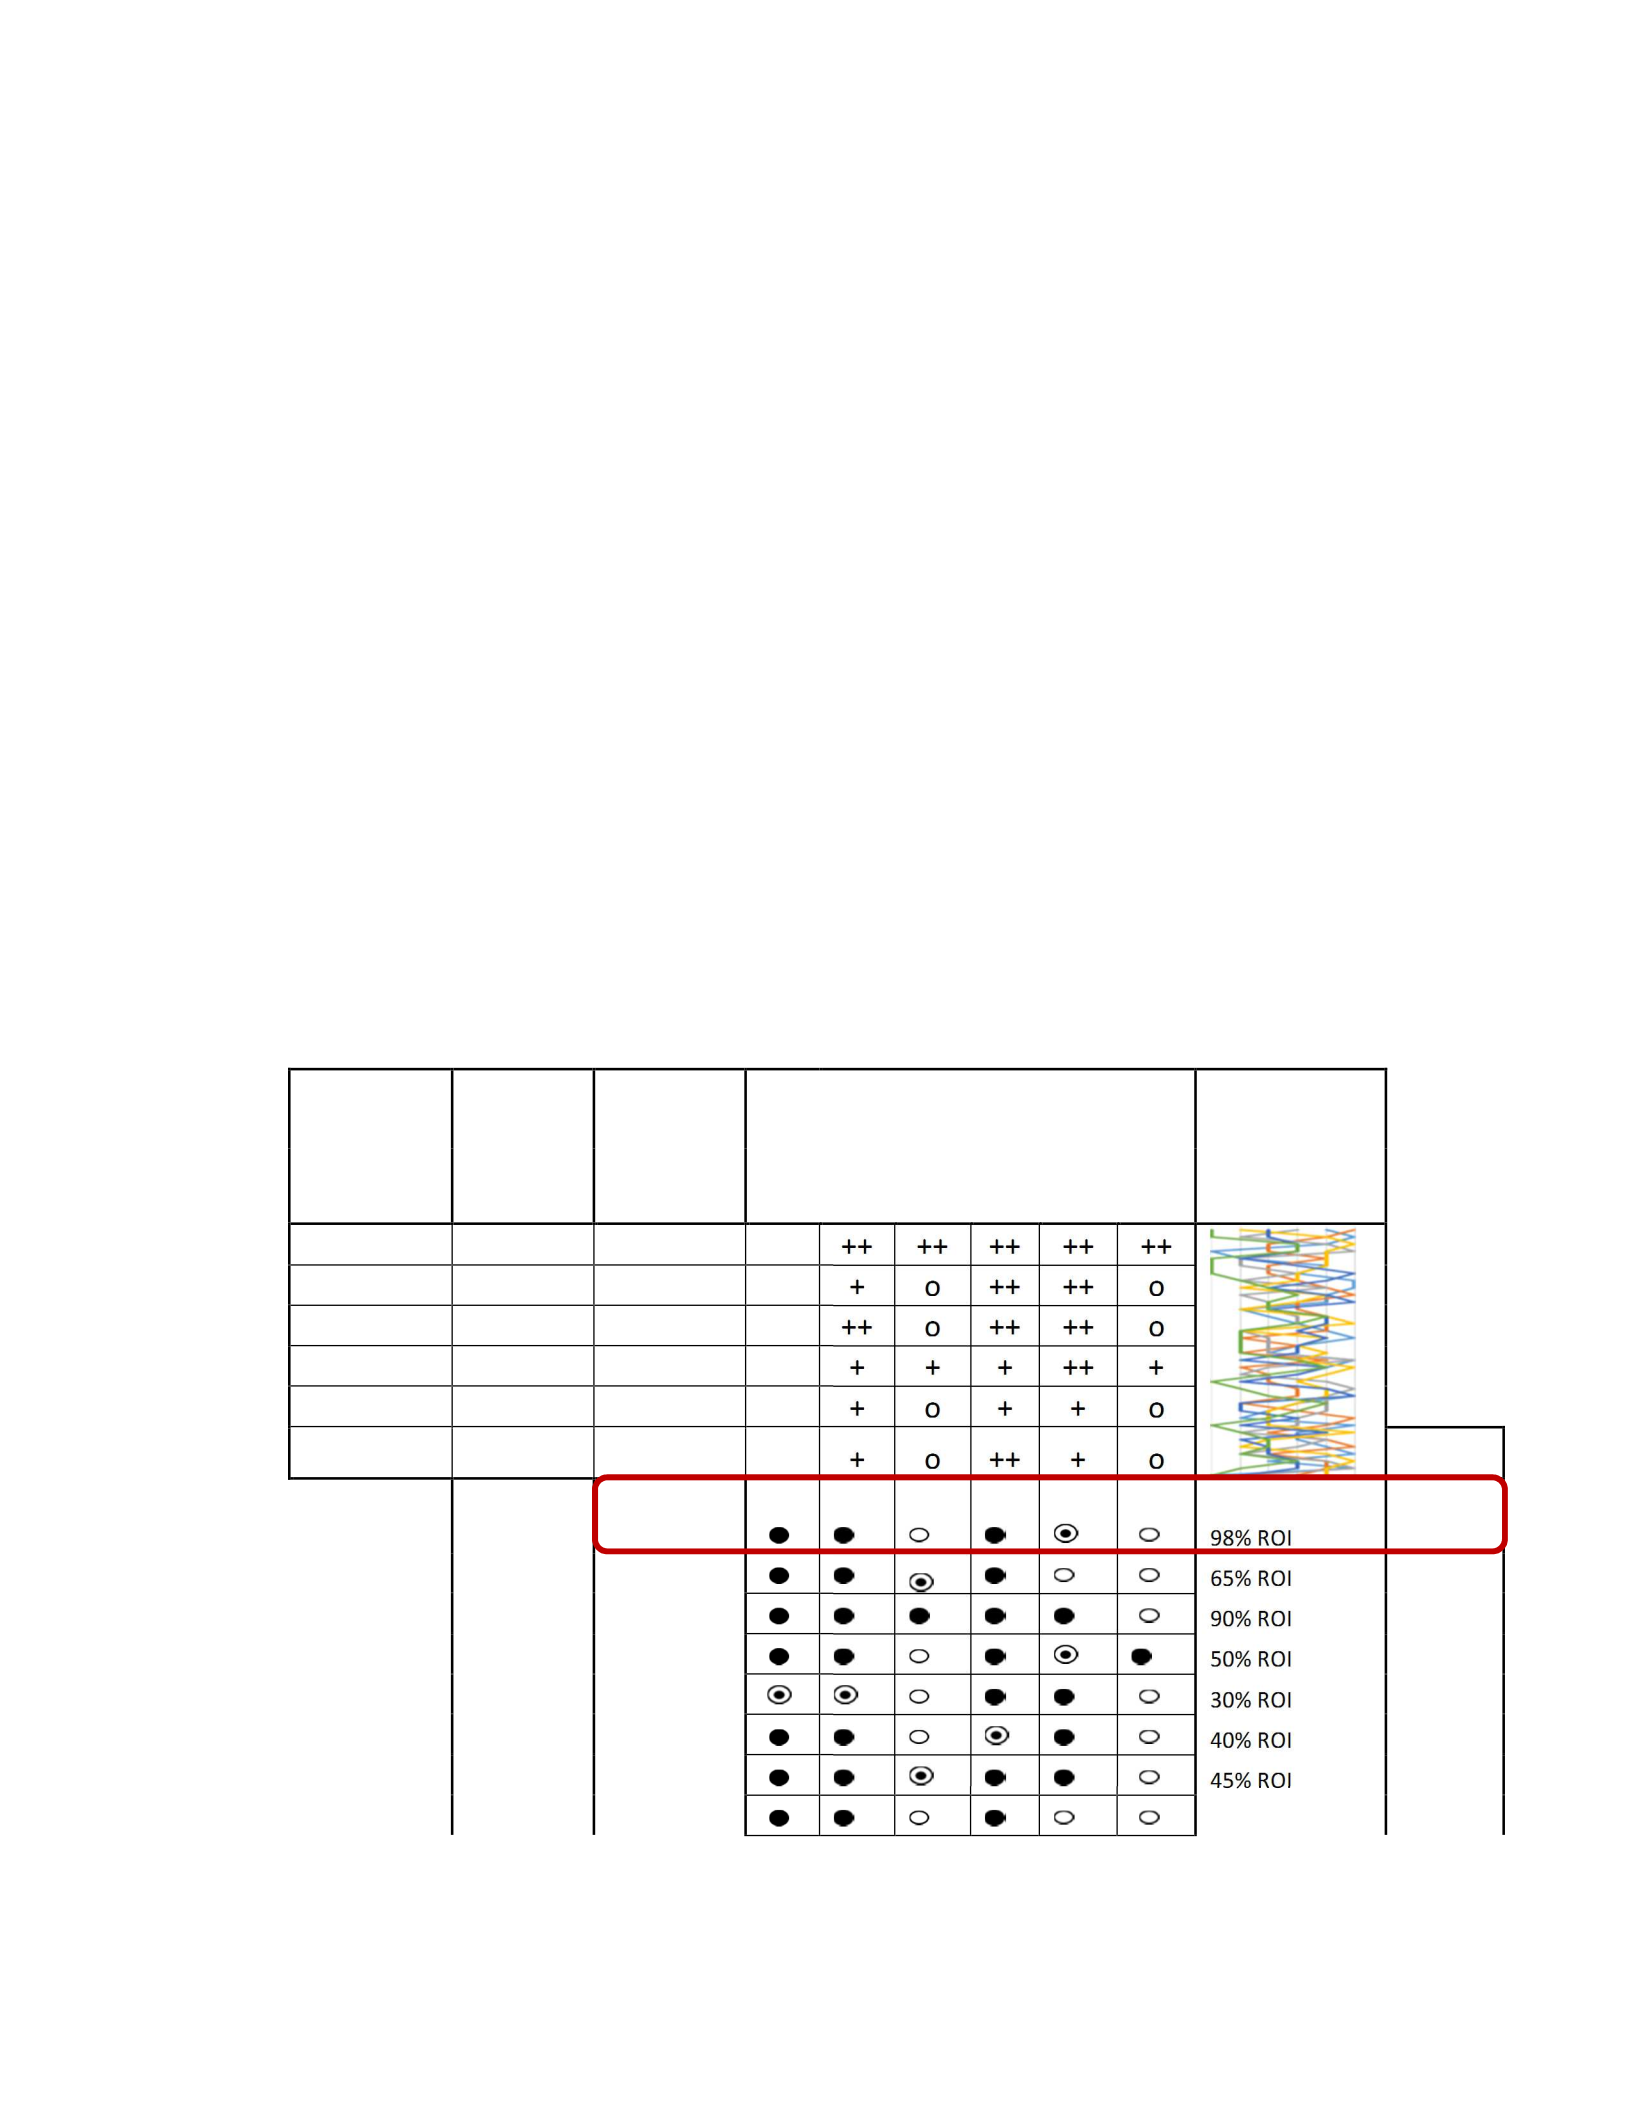
85
The highest technology impacts are DaaS and IaaS. The ++ symbol is when the
cloud computing technology influences greatly and the - - symbol is when cloud
computing technology influences least. For example, Amazon’s security, processing,
storage, and pricing has the greatly technology influences and the most competitive
among the 35 cloud computing companies shown in Figure 16. The least competitive in
cloud computing companies was Sage and Enclyptus. This is the reason why both
companies had a very small ROI of 19% and 20%. The next step to this research was to
use Paap’s ROI values with added market risk values.
Paap’s CFTP with ROI and market risk assessment
Market: IT/Cloud Computing
Product Class: Cloud Service Selection and Procurement
Cloud Computing
Technologies Competitors
Performance
Characteristic
Importance
Industry
Leverage SaaS PaaS CaaS
IaaS DaaS NaaS ++ --
Security 1 H
++ ++ ++ ++ ++ ++
Processing 2 M
+ + o ++ ++ o
Storage 3 H
o ++ o ++ ++ o
Input/Output 4 H
+ + + + ++ +
Price 5 M
o + o + + o
Provisioning 6 L
+ + o ++ + o Risk
Competitor
Profile Amazon
98% ROI 2 Low
AppDirect
65% ROI 9 Med
Apple
90% ROI 6 Low
AT&T
50% ROI 3 Low
BlueLock
30% ROI 15 Med
BMC
40% ROI 12 Med
CA Tech
45% ROI 10 Med
Cisco
56% ROI 9 Med
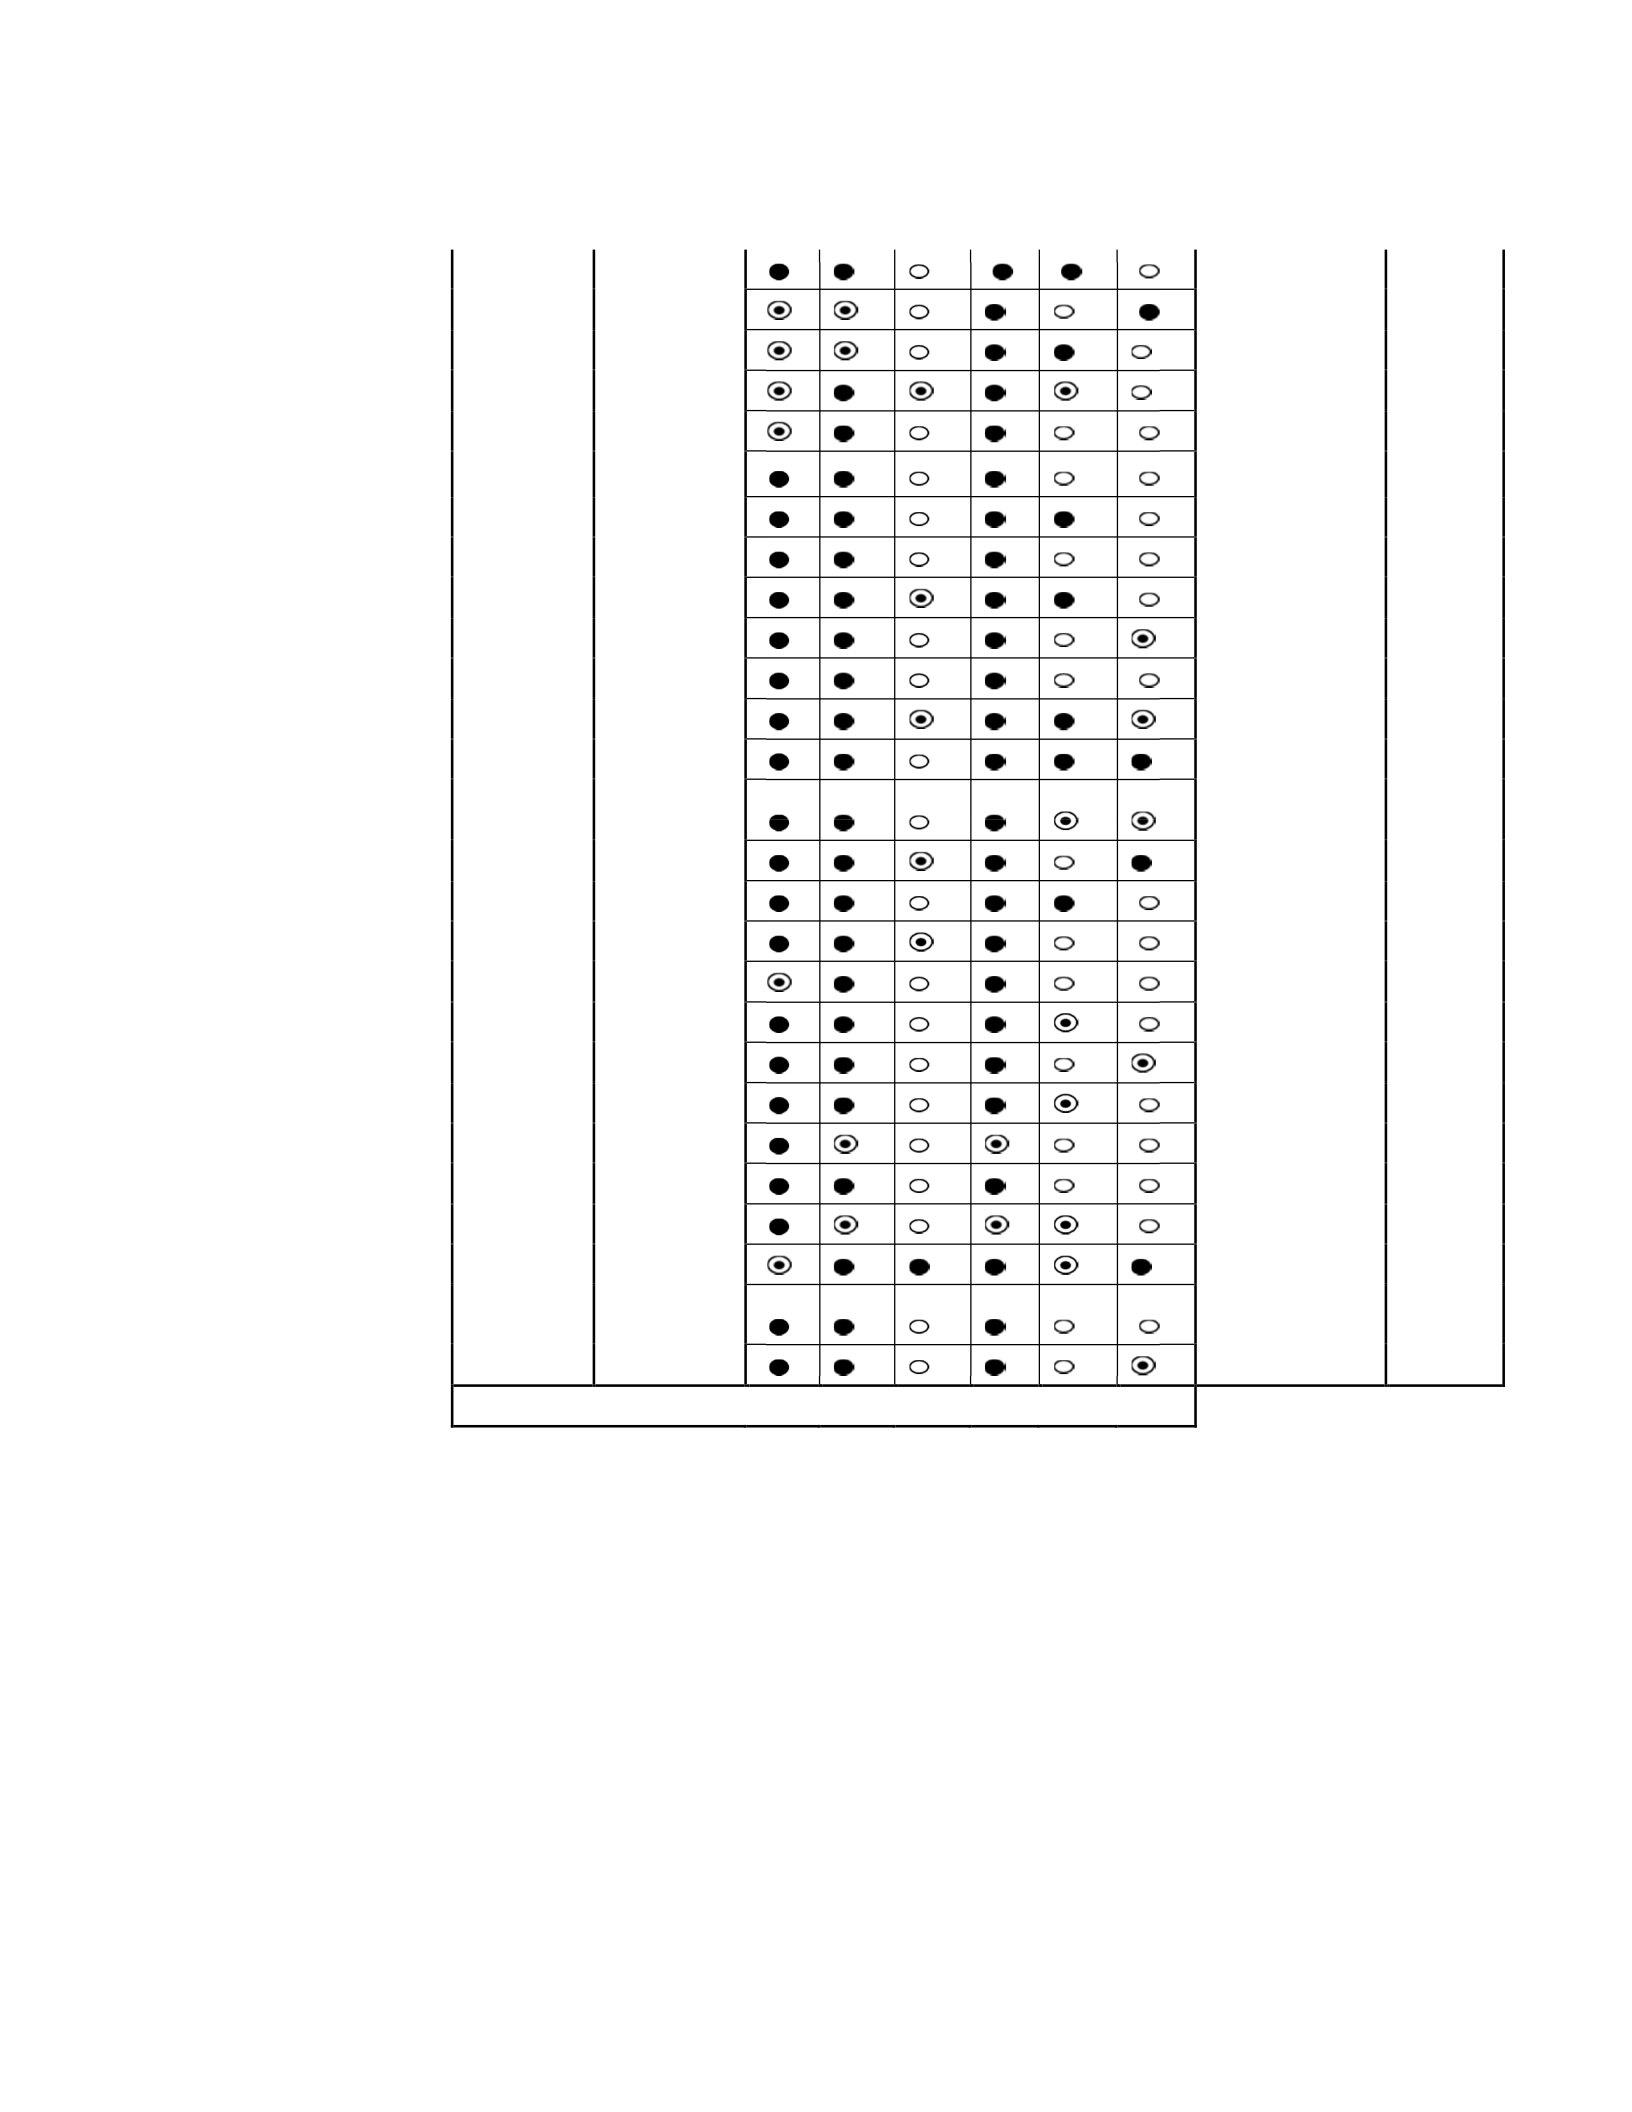
86
Citrix
72% ROI 8 Low
CloudStack
32% ROI 12 Med
Datapipe
30% ROI 16 High
Dell
37% ROI 9 Med
Eucalyptus
20% ROI 20 High
FUJITSU
55% ROI 9 Med
Google
98% ROI 6 Low
HP
61% ROI 9 Med
IBM
57% ROI 6 Low
Internap
68% ROI 16 High
Micro Focus
57% ROI 15 Med
Microsoft
98% ROI 8 Low
Oracle
98% ROI 10 Med
OpenNebula
70% ROI 12 Med
OpenStack
85% ROI 9 Med
Piston
83% ROI 16 High
Rackspace
68% ROI 12 Med
Red Hat
23% ROI 15 Med
Salesforce
77% ROI 4 Low
SAP
74% ROI 6 Low
Savvis
89% ROI 12 Med
Sage
19% ROI 20 High
Ultimate
57% ROI 6 Low
Tableau
51% ROI 20 High
Version
89% ROI 9 Med
Virtustream
(EMC)
62% ROI 15 Med
VMware
86% ROI 3 Low
Relative Maturity M M G M E G

87
Figure 18. Paap’s CFTP ROI with added risk results.
The result description for Paap’s CFTP ROI with market risk assessment determined that
Amazon has a high ROI of 98% and scored 2 on the lowest risk during the year 2015.
Carvalh and Marden (2015) research results provided a five-year ROI of 560% in
Amazon cloud computing. Therefore, the results of Paap’s CFTP ROI with added risk are
aligned with the Carvalh and Marden (2015) study. Amazon’s competitive profile listed
SaaS with strong capability/high investment, PaaS with strong capability/high
investment, CaaS with low capability/high investment, IaaS with strong capability/high
investment, DaaS with moderate capability/high investment, NaaS with low
capability/high investment.
Amazon’s security, processing, storage, and pricing was the most influence in
cloud computing technology and the most competitive among the 35 cloud computing
companies shown in Figure 18. The least competitive in cloud computing companies was
Sage and Enclyptus. This was the reason why both companies had a very small ROI of
19% and 20. Both companies had a very high market risk investment. Returns on

88
Investments (ROI) is a commonly used approach for evaluating the financial
consequences of investments and decisions. If there is no growth in profit this means zero
or negative Returns on Investments (ROI). If an investment has a positive ROI, then the
investment should be undertaken. A higher ROI means that investment gains compare
favorably to investment costs. One limitation of ROI by itself says nothing about the
likelihood that expected returns and costs will appear as predicted. A good investment
analysis should also consider both the ROI values and the risks. Therefore, Paap’s CFTP
with added risk assessment was an important tool to determine the current cloud
computing investment and forecast the future investment decisions based on a portfolio
and planning strategy. The portfolio and planning strategy provided three confidence
investment opportunities. The high confidence cloud computing investment opportunity
is between 61% ROI to 100% ROI with a low or a moderate risk score. If any of the
cloud computing companies are within the boundary of the high confidence investment
opportunity, then they should either continue to invest or increase investment in cloud
computing technology for the future years as long as the increase investment returns a
similar ROI or higher ROI. If any of the cloud computing companies are within the
boundary of high confidence investment ROI, but scored a high risk, then these cloud
companies should think about diverting their cloud computing investment to other
technologies. The moderate confidence cloud computing investment opportunity is
between 21% ROI to 60% ROI with a low or a moderate risk score. If any of the cloud
computing companies are within the boundary of the moderate confidence investment
opportunity, then they should continue to invest in cloud computing technology for the

89
future years. If any of the cloud computing companies are within the boundary of
moderate confidence investment ROI, but scored a high risk, then these cloud companies
should think about diverting their cloud computing investment to other technologies. The
low confidence cloud computing investment opportunity is between 0% ROI to 20% ROI
with a high risk score. If any of the cloud computing companies are within the boundary
of the low confidence investment opportunity, then they should be cautious on investing
in cloud computing technology for the future years. It is very important to be cautious on
investing, because there might not be a long-term financial growth and competitiveness
when ROI is low and risk is high. Paap’s CFTP with added risk assessment can help the
low ROI and high risk cloud computing to change their investment strategy to increase
ROI and lower the risk in the future years. For example, the low ROI cloud computing
company can partner with another high ROI cloud computing company. Another
example is to use inventory management to reduce costs and lower the risk. If any of the
cloud computing companies are within the boundary of low confidence investment ROI,
but scored a low or a moderate risk, then these cloud companies should think about
diverting their cloud computing investment to other technologies.
The last step to the data analysis was using the paired samples two-tailed t tests to
compare two means that are from the same cloud computing companies. The two means
represent two data sets, ROI without risk and ROI added risk with a difference between
the two data sets. The purpose of the test was to determine whether there was statistical
evidence that the mean difference between paired observations on a particular outcome
was significantly different from zero. The paired samples two-tailed t tests was a

90
parametric test. Risk values are converted to percentage in Table 2 to form a consistency
unit convertion between ROI and risk. The percentage was scaled from 1 to 25 based on
the traditional 5x5 risk matrix. The score of 1 is the lowest risk in 0% (0), the score of 2
is a low risk investment in 5% (0.05), the score of 9 is a medium risk investment in 40%
(0.4), the score of 16 is a high risk investment in 70% (0.7), and the score of 25 is the
highest risk in 100% (1).

91
Table 2
Risk Values are Converted to Percentage
Company ROI in % Risk in %
Amazon
0.98 0.05
AppDirect
0.65 0.4
Apple
0.9 0.25
AT&T
0.5 0.1
BlueLock
0.3 0.65
BMC
0.4 0.55
CA Tech
0.45 0.45
Cisco
0.56 0.4
Citrix
0.72 0.35
CloudStack
0.32 0.55
Datapipe
0.3 0.7
Dell
0.37 0.4
Eucalyptus
0.2 0.9
FUJITSU
0.55 0.4
Google
0.98 0.25
HP
0.61 0.4
IBM
0.57 0.25
Internap
0.68 0.7
Micro Focus
0.57 0.65
Microsoft
0.98 0.35
Oracle
0.98 0.45
OpenNebula
0.7 0.55
OpenStack
0.85 0.4
Piston
0.83 0.7
Rackspace
0.68 0.55
Red Hat
0.23 0.65
Salesforce
0.77 0.15
SAP
0.74 0.25
Savvis
0.89 0.55
Sage
0.19 0.9
Ultimate
0.57 0.25
Tableau
0.51 0.9
Version
0.89 0.4
Virtustream
(EMC)
0.62 0.65
VMware
0.86 0.1

92
I conducted a paired sample two-tailed t tests to determine the relationship of
adding traditional risk in percentage to Paap's 2010 CFTP ROI in percentage after the
completion of Table 2. The paired sample two-tailed t tests results are computed by a
Mirosoft Excel analysis worksheet. The paired sample two-tailed t tests results are listed
on Table 3 and Table 4.
Table 3
Results on the Difference Between No Risk and Added Risk
# Company Before (No Risk) After (Added Risk) Difference
1
Amazon
0.98 0.05 0.93
2
AppDirect
0.65 0.4 0.25
3
Apple
0.9 0.25 0.65
4
AT&T
0.5 0.1 0.4
5
BlueLock
0.3 0.65 -0.35
6
BMC
0.4 0.55 -0.15
7
CA Tech
0.45 0.45 0
8
Cisco
0.56 0.4 0.16
9
Citrix
0.72 0.35 0.37
10
CloudStack
0.32 0.55 -0.23
11
Datapipe
0.3 0.7 -0.4
12
Dell
0.37 0.4 -0.03
13
Eucalyptus
0.2 0.9 -0.7
14
FUJITSU
0.55 0.4 0.15
15
Google
0.98 0.25 0.73
16
HP
0.61 0.4 0.21
17
IBM
0.57 0.25 0.32
18
Internap
0.68 0.7 -0.02
19
Micro Focus
0.57 0.65 -0.08
20
Microsoft
0.98 0.35 0.63
21
Oracle
0.98 0.45 0.53
22
OpenNebula
0.7 0.55 0.15
23
OpenStack
0.85 0.4 0.45
24
Piston
0.83 0.7 0.13
25
Rackspace
0.68 0.55 0.13
26
Red Hat
0.23 0.65 -0.42
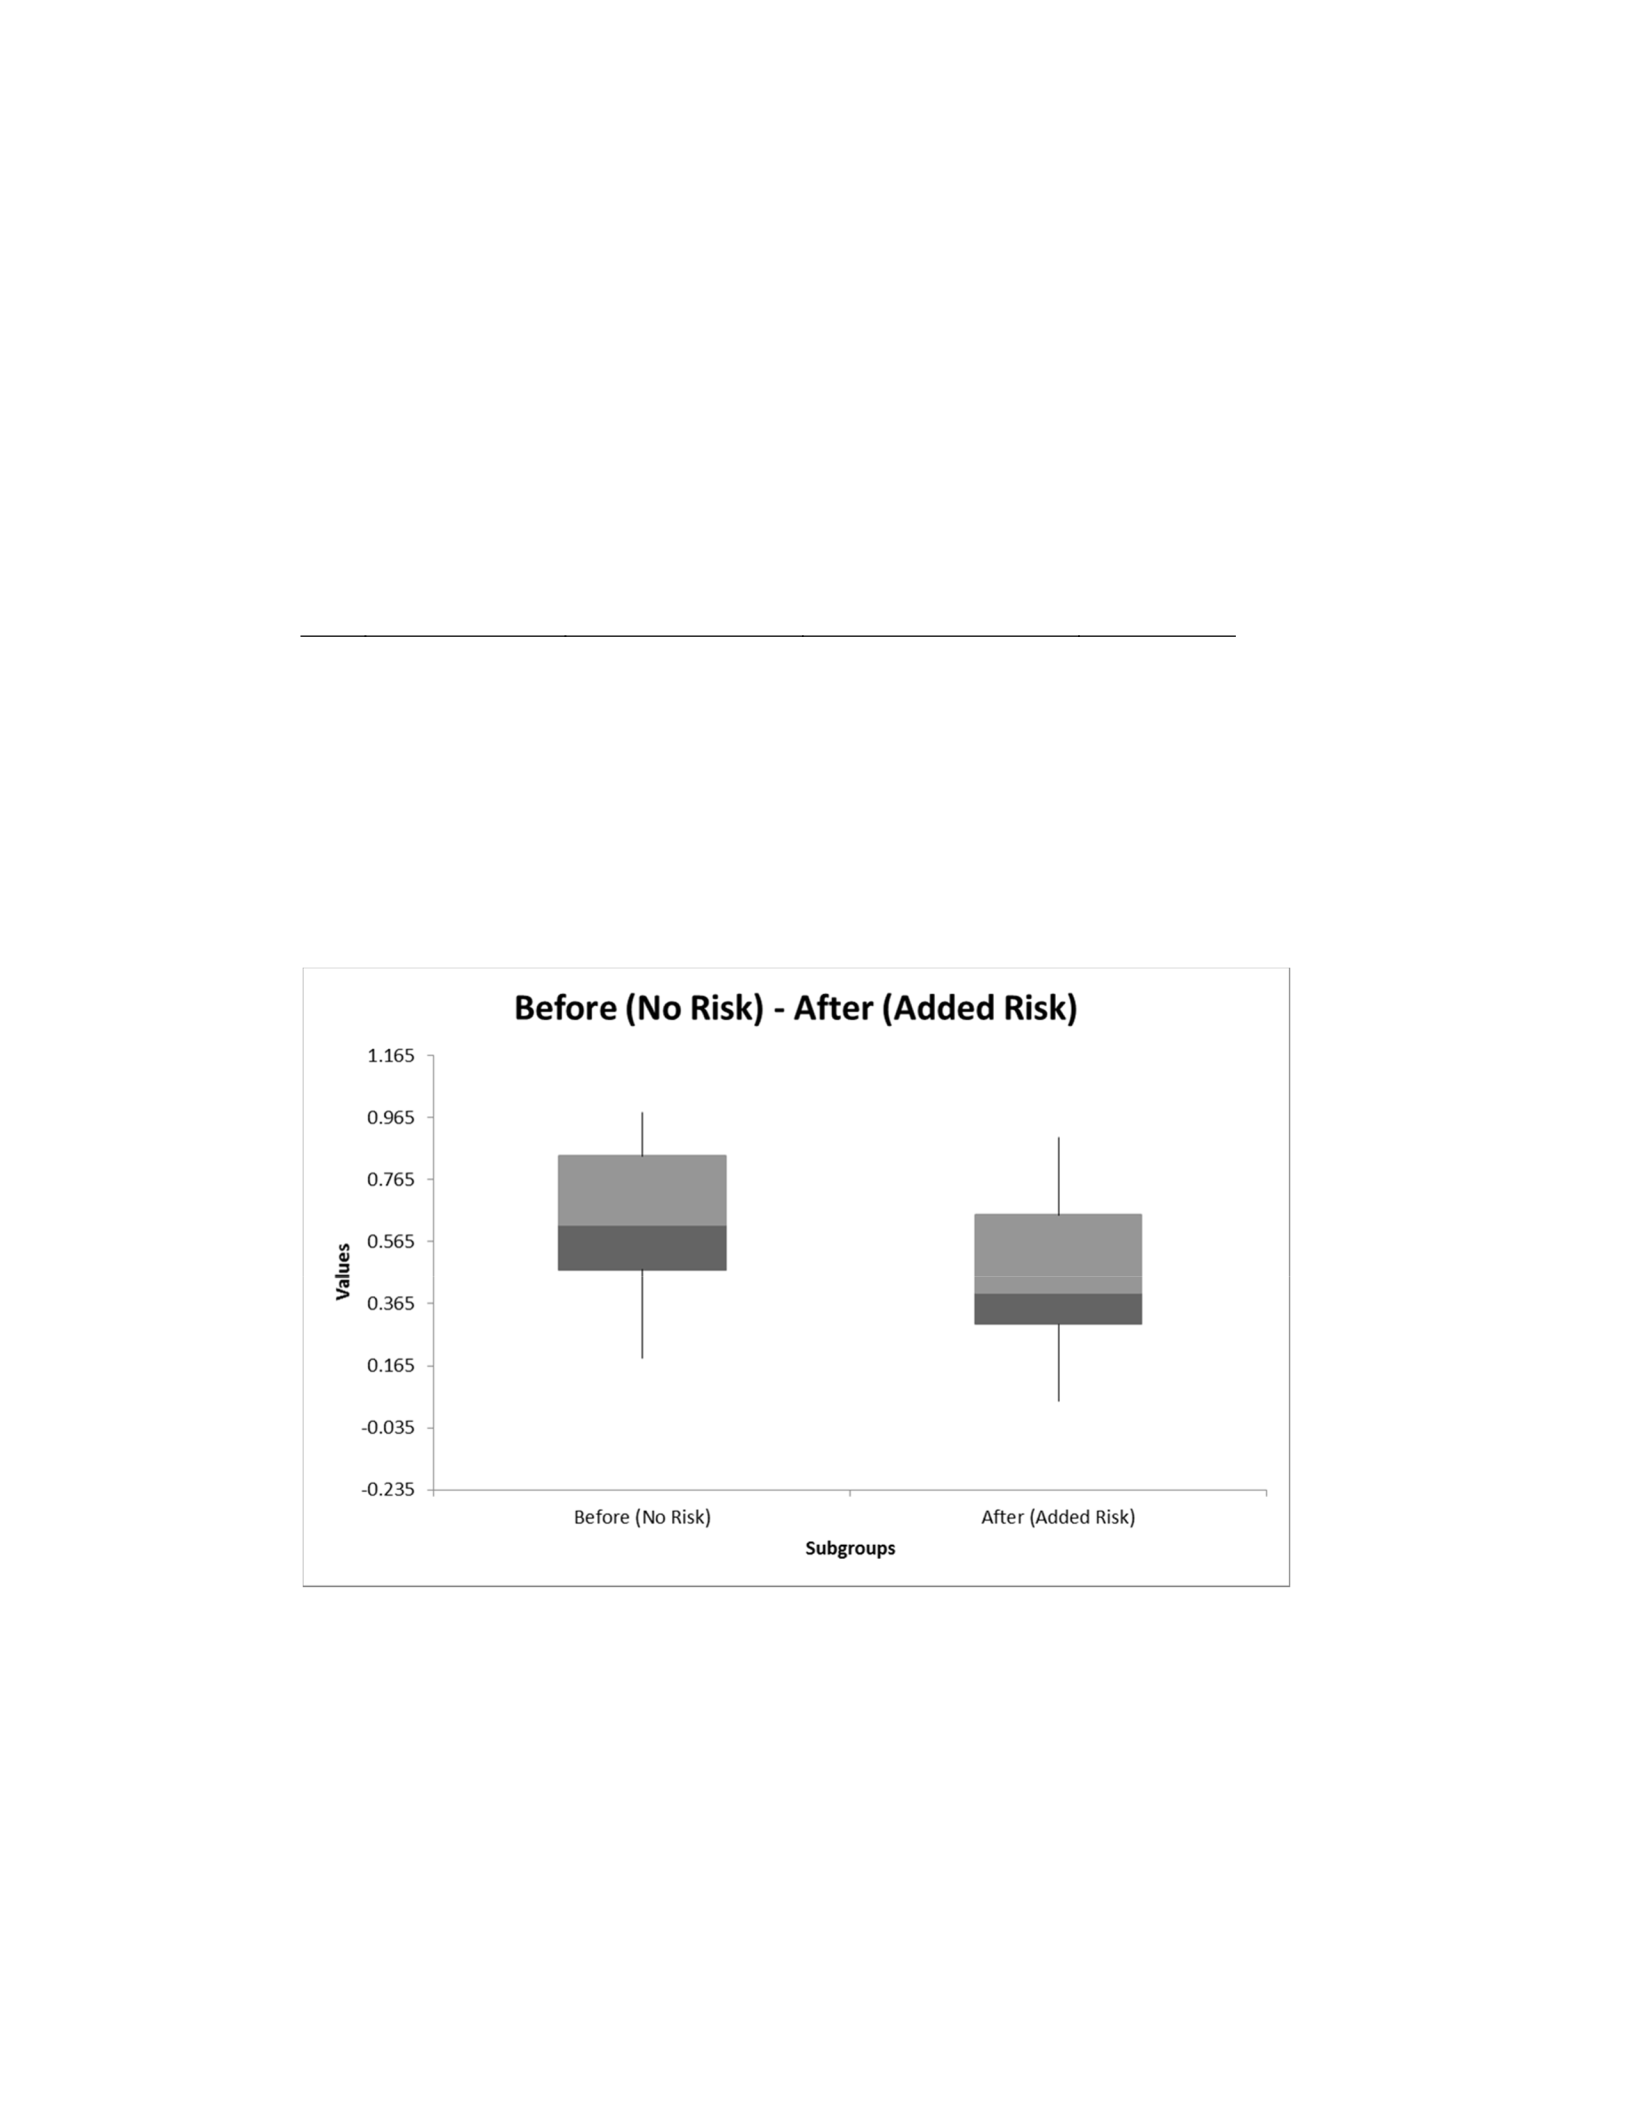
93
27
Salesforce
0.77 0.15 0.62
28
SAP
0.74 0.25 0.49
29
Savvis
0.89 0.55 0.34
30
Sage
0.19 0.9 -0.71
31
Ultimate
0.57 0.25 0.32
32
Tableau
0.51 0.9 -0.39
33
Version
0.89 0.4 0.49
34
Virtustream
(EMC)
0.62 0.65 -0.03
35
VMware
0.86 0.1 0.76
Table 3 calculates the difference within each before-and-after pair of measurements. These
results are also shown in Figure 18 using a Box Plot to determine the difference measures.
In Figure 18, the results determined the difference measures are normally distributed or at
least reasonably symmetric.
Figure 19. Box plot for difference measures.

94
The paired sample two-tailed t tests for Means data analysis output from the Excel data
analysis tool was shown in Table 4. The results summary provided 0.025 p-value below the
significance level of 0.05. This indicates there was a statistical difference
between Before (No risk) and After (Added risk). Therefore, the null hypothesis was
rejected. The T critical two tail is 2.032. The means was 0.163 difference between the
Before mean of 0.626 and the After mean of 0.463. This was based on a 95% confidence
interval values of 0.022 and 0.304. The Before variance was 0.057 and the After variance
was 0.051. The Pearson’s correlation coefficient is to determine whether the correlation
between populations is zero. The Pearson correlation was -0.559. The t-distribution critical
values table (df) required 34 values to determine the paired sample two-tailed t tests and
finally the t-statistics was determined to be 2.347. The p-value was compared with the alpha
to determine whether the observed data are statistically significantly different from the null
hypothesis. In conclusion, the null hypothesis was rejected, since the p-value was less than
the alpha (p< 0.05). The result was statistically significant.

95
Table 4
Results on Paired Sample Two-Tailed T Tests for Means
t
tests
: Paired Two
Sample for Means α 0.05
Before
(No Risk)
After
(Added
Risk)
diff
95% Confidence
Interval
Mean
0.625714
0.462857
0.163
0.022
0.304
Variance
0.057296
0.050933
Observations
35
35
Pearson Correlation
-
0.55865
Hypothesized Mean
Difference 0
df
34
t Stat
2.347
P(T<=t) one-tail 0.012
Reject Null Hypothesis because p <
0.05 (Means are Different)
T Critical one
-
tail
1.691
P(T<=t) two-tail 0.025
Reject Null Hypothesis because p <
0.05 (Means are Different)
T Critical Two
-
tail
2.032
Another test was performed to show the results of differences between two means
equal variances (aka. Homoscedastic). Two-tailed t tests with equal variances are
assumed that the population variances were equal since the sample variances were almost
the same. The variances between Before (No risk) and After (Added risk)
are relatively similar. Table 5 results showed the Before variance is 0.057 and the After
variance is 0.051. The pooled variance is 0.054. The p-value was compared with the
alpha to determine whether the observed data are statistically significantly different from
the null hypothesis. In conclusion, the null hypothesis was rejected, since the p-value is
less than the alpha (p< 0.05). The result was statistically significant.

96
Table 5
Results on Paired Sample Two-Tailed T Tests for Equal Variance
t
tests
: Two
-
Sample Assuming
Equal Variances α 0.05
Equal Sample Sizes
Before
(No Risk)
After
(Added
Risk) diff
95% Confidence
Interval
Mean
0.625714
0.462857
0.163
0.052
0.274
Variance
0.057296
0.050933
Observations
35
35
Pooled Variance
0.054114
Hypothesized Mean
Difference
0
df
68
t Stat
2.929
P(T<=t) one-tail 0.002
Reject Null Hypothesis because p <
0.05 (Means are Different)
T Critical one
-
tail
1.668
P(T<=t) two-tail 0.005
Reject Null Hypothesis because p <
0.05 (Means are Different)
T Critical Two
-
tail
1.995
The null hypothesis was rejected because 0.005 p-value is below the significance level of
0.05. The means are 0.163 difference between the Before mean of 0.626 and the After
mean of 0.463. This was based on a 95% confidence interval values of 0.052 and 0.274.
The t-distribution critical values table (df) required 68 values to determine the paired
sample two-tailed t tests and the t-statistics was determined to be 2.929. Finally, the T
critical two tail value was 1.995.
My study involved comparing two groups: (a) before added risk and (b) after
added risk. The difference in the means for the two groups is a measure of the effect size
(aka. Cohen’s dz calculation). The effect size provided a measure of the magnitude of the
effect. The magnitude can often be used to evaluate the importance or meaning of the

97
effect. In other words, effect size is a measure of how much the ROI changed (aka.
dependent variable). I used effect size dz = 0.6, because I would like to follow Cohen’s
rule of thumb that stated:
Small effect when dz = 0.2
Medium effect when dz = 0.5
Large effect when dz = 0.8
The average effect size over many studies were closer to dz = 0.5. My calculation using
G*Power 3.0 tool was very closer to dz = 0.6, which was slightly above medium effect.
The effect size dz =0.6 means that one group performed six-tenths of a standard deviation
above the other group was shown in Figure 20. To reduce the threat of reliability, I
performed a power analysis to determine the minimum sample size of 24. In conclusion,
the sample size of 35 cloud computing companies are listed in this study are very
reasonable for my paired sample two-tailed t tests.

98
Figure 20. The effect size calculation.
Summary
This section I summarized the answer to research question. The results of paired
sample two-tailed t tests for means and equal variances showed the null hypothesis
rejected because p < 0.05. The concluded statement would be the null hypothesis gets
replaced with the alternate hypothesis (H1): The return on investment may be positively
related to adding a traditional risk assessment model to Paap’s CFTP framework. The
research question was: What is the relationship to the return on investment by adding
traditional risk assessment model to Paap’s CFTP framework? The answer to my research
question was the return on investment was positively related to added traditional risk
assement model to Paap’s CFTP framework. Chapter 5 provides further detailed
interpretation of the findings, limitations of the study, recommendations on future study,
and the most important section to cover implications of positive social change of my
study.

99
Chapter 5: Research Conclusion and Positive Social Change
The purpose of this research was to determine the relationship between returns on
investment before and after adding risk assessment to the CFTP framework .By adding
traditional risk assessment to the framework, the high tech companies and their
technologists, investment strategists, and researchers might improve their technology
decision making processes for investments, which may result in a higher return on their
investments.
This quantitative study was needed to resolve the gap of missing risk assessment
that helped to reduce monetary loss and increase ROI when making technology
investment decisions in Paap’s CFTP framework and other technology investment
framework, such as IBM Cloud Enablement Framework. This study may provide
information that organizational leaders can use to improve technology decision-making
processes and create a new technology management model. I examined and verified that
ROI done in conjunction with risk assessment, can benefit cloud computing technology
investments using Paap’s CFTP framework. The benefits of using risk assessment with
the CFTP framework include helpping investors make better and more expeditious
decisions while considering the opportunities for cost savings in technology investment.
My key finding was that only four companies had high ROI, when assessed using
only Paap’s CFTP framework. The four companies were Amazon, Google, Microsoft and
Oracle. All four companies scored a 98% ROI for 2015. I also found that, after adding
market risk assessment to Paap’s CFTP framework, Amazon had a high ROI of 98% and
scored 2 on the lowest risk index during the 2015. Carvalh and Marden (2015) research

100
results showed a 5-year ROI of 560% for Amazon cloud computing. Therefore, the
results of my study using Paap’s CFTP ROI with added risk are aligned with Carvalh and
Marden (2015) study. I found that adding risk assessment to the technology investment
framework may help investors (a) make better decisions more quickly; and (b) obtain a
high return on technology investment by selecting the highest ROI value and lowest risk
value. The results of a paired sample two-tailed t tests for means and equal variances
showed that I should reject the null hypothesis, because p < 0.05, and replace it with the
alternate hypothesis (H1) that the ROI may be positively related to adding a traditional
risk assessment model to Paap’s CFTP framework.
Interpretation of the Findings
The findings extended knowledge in the risk management discipline by resolved
the missing gap of risk assessment that helped to reduce monetary loss and increase ROI
when making technology investment decisions in Paap’s CFTP framework and other
technology investment framework, such as IBM Cloud Enablement Framework. In the
literature review in Chapter 2, I noted Jiang and Ruan (2010) recognized that one of the
primary reasons for these losses was that companies were not performing risk assessment
when making technology investment decisions. Current studies are missing a robust
investment framework with added risk assessment to reduce profit loss. Bakht (2015)
also recognized the current problem was the lacking of risk assessment in technology
investment, such as science risk, technology risk, market risk, and regulatory risk.
Investors have little choice but to make riskier and riskier technology investment

101
decisions that leads to profit loss. Another example, Merrill and Kang (2014) research
results provided a potential number of hidden costs with cloud computing that many may
not have considered. Therefore, risk assessment was the next step to predict the actual
costs of cloud computing and the potential ROI. Another example was Barnier (2014)
research results provided the benefits of risk assessment. The benefits help investors
make better decisions quicker and consider the opportunities for cost savings in
technology investment.
I analyzed and interpreted the findings in the context of the theoretical
framework. I used the theoretical action research cycle to modify Paap’s CFTP 2010
technology framework. A pictorial representation of the theoretical action research cycle
is shown in Figure 21. Deming (1982) was the first to present the theory and concepts of
action research cycle, which was part of a theoretical framework used to develop a
solution to a specific issue between experts and researchers involving the change process
and the action needed for fact finding.
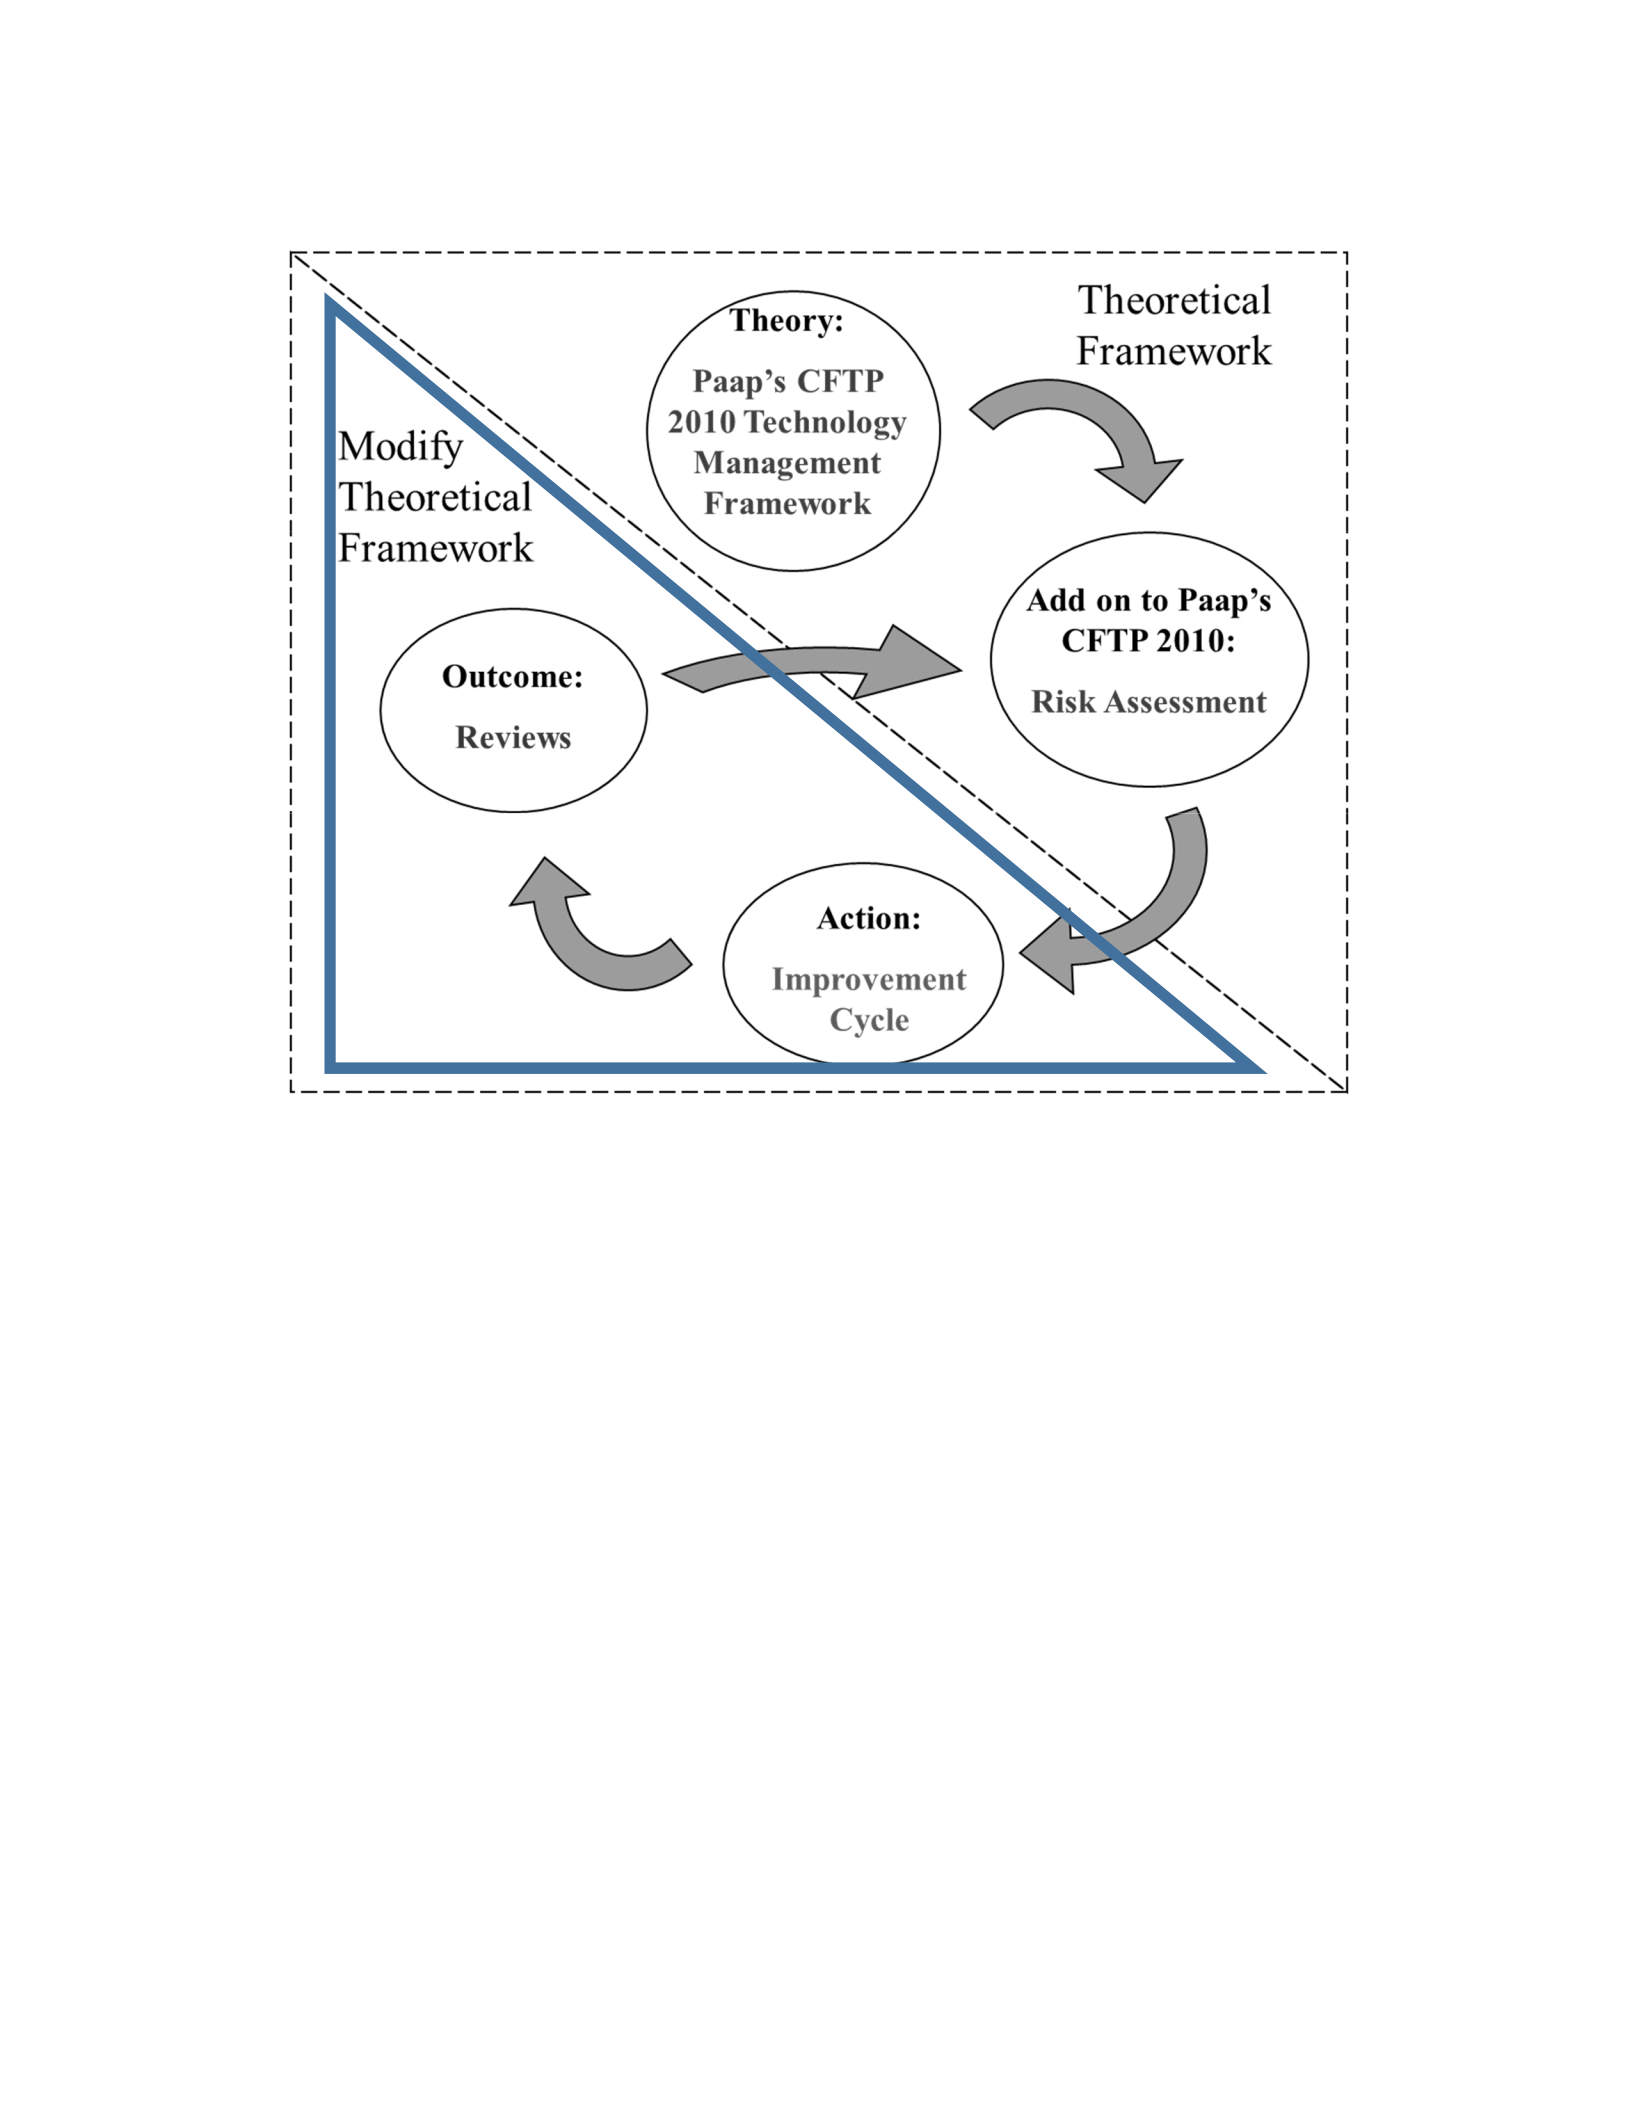
102
Figure 21. Modified theory using action research cycle.
I have shown with my research that adding risk assessment to Paap’s CFTP framework
has the potential to improve technology decision-making processes. Further, after
reviewing the outcomes of the quantitative analysis, I have examined and verified that
there is a need to modify Paap’s CFTP framework with added risk assessment. The
finding was that only four companies had high ROI, when assessed using only Paap’s
CFTP framework. The four companies were Amazon, Google, Microsoft and Oracle. All
four companies scored a 98% ROI for 2015. I also found that, after adding market risk
assessment to Paap’s CFTP framework, Amazon had a high ROI of 98% and scored 2 on
the lowest risk index during the 2015. Carvalh and Marden (2015) research results

103
showed a 5-year ROI of 560% for Amazon cloud computing. Therefore, the results of my
study using Paap’s CFTP ROI with added risk are aligned with Carvalh and Marden
(2015) study.
Also, I found that Paap’s CFTP with added risk assessment was an important tool
for determining the current cloud computing investment and forecasting future
investment decisions based on a portfolio and planning strategy. The portfolio and
planning strategy provided three confidence investment opportunities. The three
confidence investment opportunities are:
• The high confidence cloud computing investment opportunity. This was between
61% and 100% ROI, with a low or a moderate risk score. If any of the cloud
computing companies are within the boundary of the high confidence investment
opportunity, then they should either continue to invest or increase investment in
cloud computing technology for the future years, as long as the increased
investment returns a similar or higher ROI. If any of the cloud computing
companies are within the boundary of high confidence investment ROI, but
scored a high risk, then these cloud companies should think about diverting their
cloud computing investment to other technologies.
• The moderate confidence cloud computing investment opportunity. This was
between 21% and 60% ROI,with a low or a moderate risk score. If any of the
cloud computing companies are within the boundary of the moderate confidence
investment opportunity, then they should continue to invest in cloud computing
technology for the future years. If any of the cloud computing companies are

104
within the boundary of moderate confidence investment ROI, but scored a high
risk, then these cloud companies should think about diverting their cloud
computing investment to other technologies.
• The low confidence cloud computing investment opportunity. This was between
0% and 20% ROI, with a high risk score. If any of the cloud computing
companies are within the boundary of the low confidence investment opportunity,
then they should be cautious in investing in cloud computing technology for the
future years. It is very important to be cautious when investing, because there
might not be a long-term financial growth and competitiveness when ROI is low
and risk is high. Paap’s CFTP with added risk assessment can help the low ROI
and high risk cloud computing to change their investment strategy to increase ROI
and lower the risk in the future years. For example, the low ROI cloud computing
company can partner with another high ROI cloud computing company. Another
example is using an inventory management system to reduce costs and lower the
risk. If any of the cloud computing companies are within the boundary of low
confidence investment ROI, but scored a low or a moderate risk, then these cloud
companies should think about diverting their cloud computing investment to other
technologies.
The finding of power analysis provided the minimum sample size of 24. I have
examined and verified with my research there is a need to compare two groups: (a) before
added risk and (b) after added risk. The difference in the means for the two groups was a
measure of the effect size (i.e., Cohen’s dz calculation). The effect size provided a

105
measure of the magnitude of the effect. The magnitude can often be used to evaluate the
importance or meaning of the effect. In other words, effect size was a measure of how
much the ROI changed (aka. dependent variable). I selected effect size dz = 0.6, because I
would like to follow Cohen’s rule of thumb that stated:
Small effect when dz = 0.2
Medium effect when dz = 0.5
Large effect when dz = 0.8
The average effect size over many studies were closer to dz = 0.5. My calculation
using G*Power 3.0 tool was much closer to dz = 0.6, which was slightly above medium
effect. The effect size dz =0.6 means that one group performed six-tenths of a standard
deviation above the other group. In summary, the sample size of 35 cloud computing
companies are listed in this study was very reasonable for my paired sample two-tailed t
tests.
The finding of the paired sample two-tailed t tests for Means data analysis
provided 0.025 p-value below the significance level of 0.05. This indicates there was a
statistical difference between Before (No risk) and After (Added risk). Therefore, the null
hypothesis was rejected. The T critical two tail was 2.032. The means were 0.163
difference between the Before mean of 0.626 and the After mean of 0.463. This was
based on a 95% confidence interval values of 0.022 and 0.304. The Before variance was
0.057 and the After variance was 0.051. The Pearson’s correlation coefficient is to
determine whether the correlation between populations is zero. The Pearson correlation
was -0.559. The t-distribution critical values table (df) required 34 values to determine

106
the paired sample two-tailed t tests and finally the t-statistics was determined to be 2.347.
The p-value was compared with the alpha to determine whether the observed data are
statistically significantly different from the null hypothesis. The null hypothesis was
rejected, since the p-value was less than the alpha (p< 0.05). The result was statistically
significant. The finding of two paired sample t -test with equal variances are assumed that
the population variances were equal since the sample variances were almost the same.
The variances between Before (No risk) and After (Added risk) were relatively similar.
Table 5 results showed the Before variance was 0.057 and the After variance was 0.051.
The pooled variance was 0.054. The p-value was compared with the alpha to determine
whether the observed data were statistically significantly different from the null
hypothesis. The null hypothesis was rejected because 0.005 p-value was below the
significance level of 0.05. The means are 0.163 difference between the Before mean of
0.626 and the After mean of 0.463. This was based on a 95% confidence interval values
of 0.052 and 0.274. The t-distribution critical values table (df) required 68 values to
determine the paired sample two-tailed t tests and the t-statistics was determine to be
2.929. Finally, the T critical two tail value was 1.995. The results of paired sample two-
tailed t tests for means and equal variances showed the null hypothesis rejected because p
< 0.05. The concluded statement would be the null hypothesis gets replaced with the
alternate hypothesis (H1): The return on investment may be positively related to adding a
traditional risk assessment model to Paap’s CFTP framework.

107
Limitations of the Study
This research provides the potential for several limitations. The major limitation
of this study relates to a one time period data collection in 2015 and a wider time period
should be investigated. To mitigate as many limitations as possible, proactive attempts
were made to reduce threats to reliability, internal and external validity. To reduce the
threat of reliability, I performed a power analysis to determine the minimum sample size
of 24. In conclusion, the sample size of 35 cloud computing companies in this study was
very reasonable for my paired sample two-tailed t tests. The threats to internal validity
may compromise my confidence in saying that a relationship exists between the
independent and dependent variables. To reduce the threat of internal validity, I used
doctoral peer review of my research results with my dissertation chair, who is an expert
in the investment and risk management fields. The threats to external validity may
compromise my confidence in saying whether the study’s results are applicable to other
groups. To reduce the threat of external validity, I used doctoral peer review of my
research results with an expert in the field from the cloud computing investment industry.
Recommendations for Further Study
The scope for future work includes testing of the Paap’s CFTP framework with
added risk assessment to the international cloud computing companies' data. The current
dataset was collected in United States with over $100 million on investment. The study
should be expanded with a wider population and sample size to obtain a better
understanding of future cloud computing investment in different regions of the world. If
the sample size was larger than 500 samples, then traditional risk assessment can be
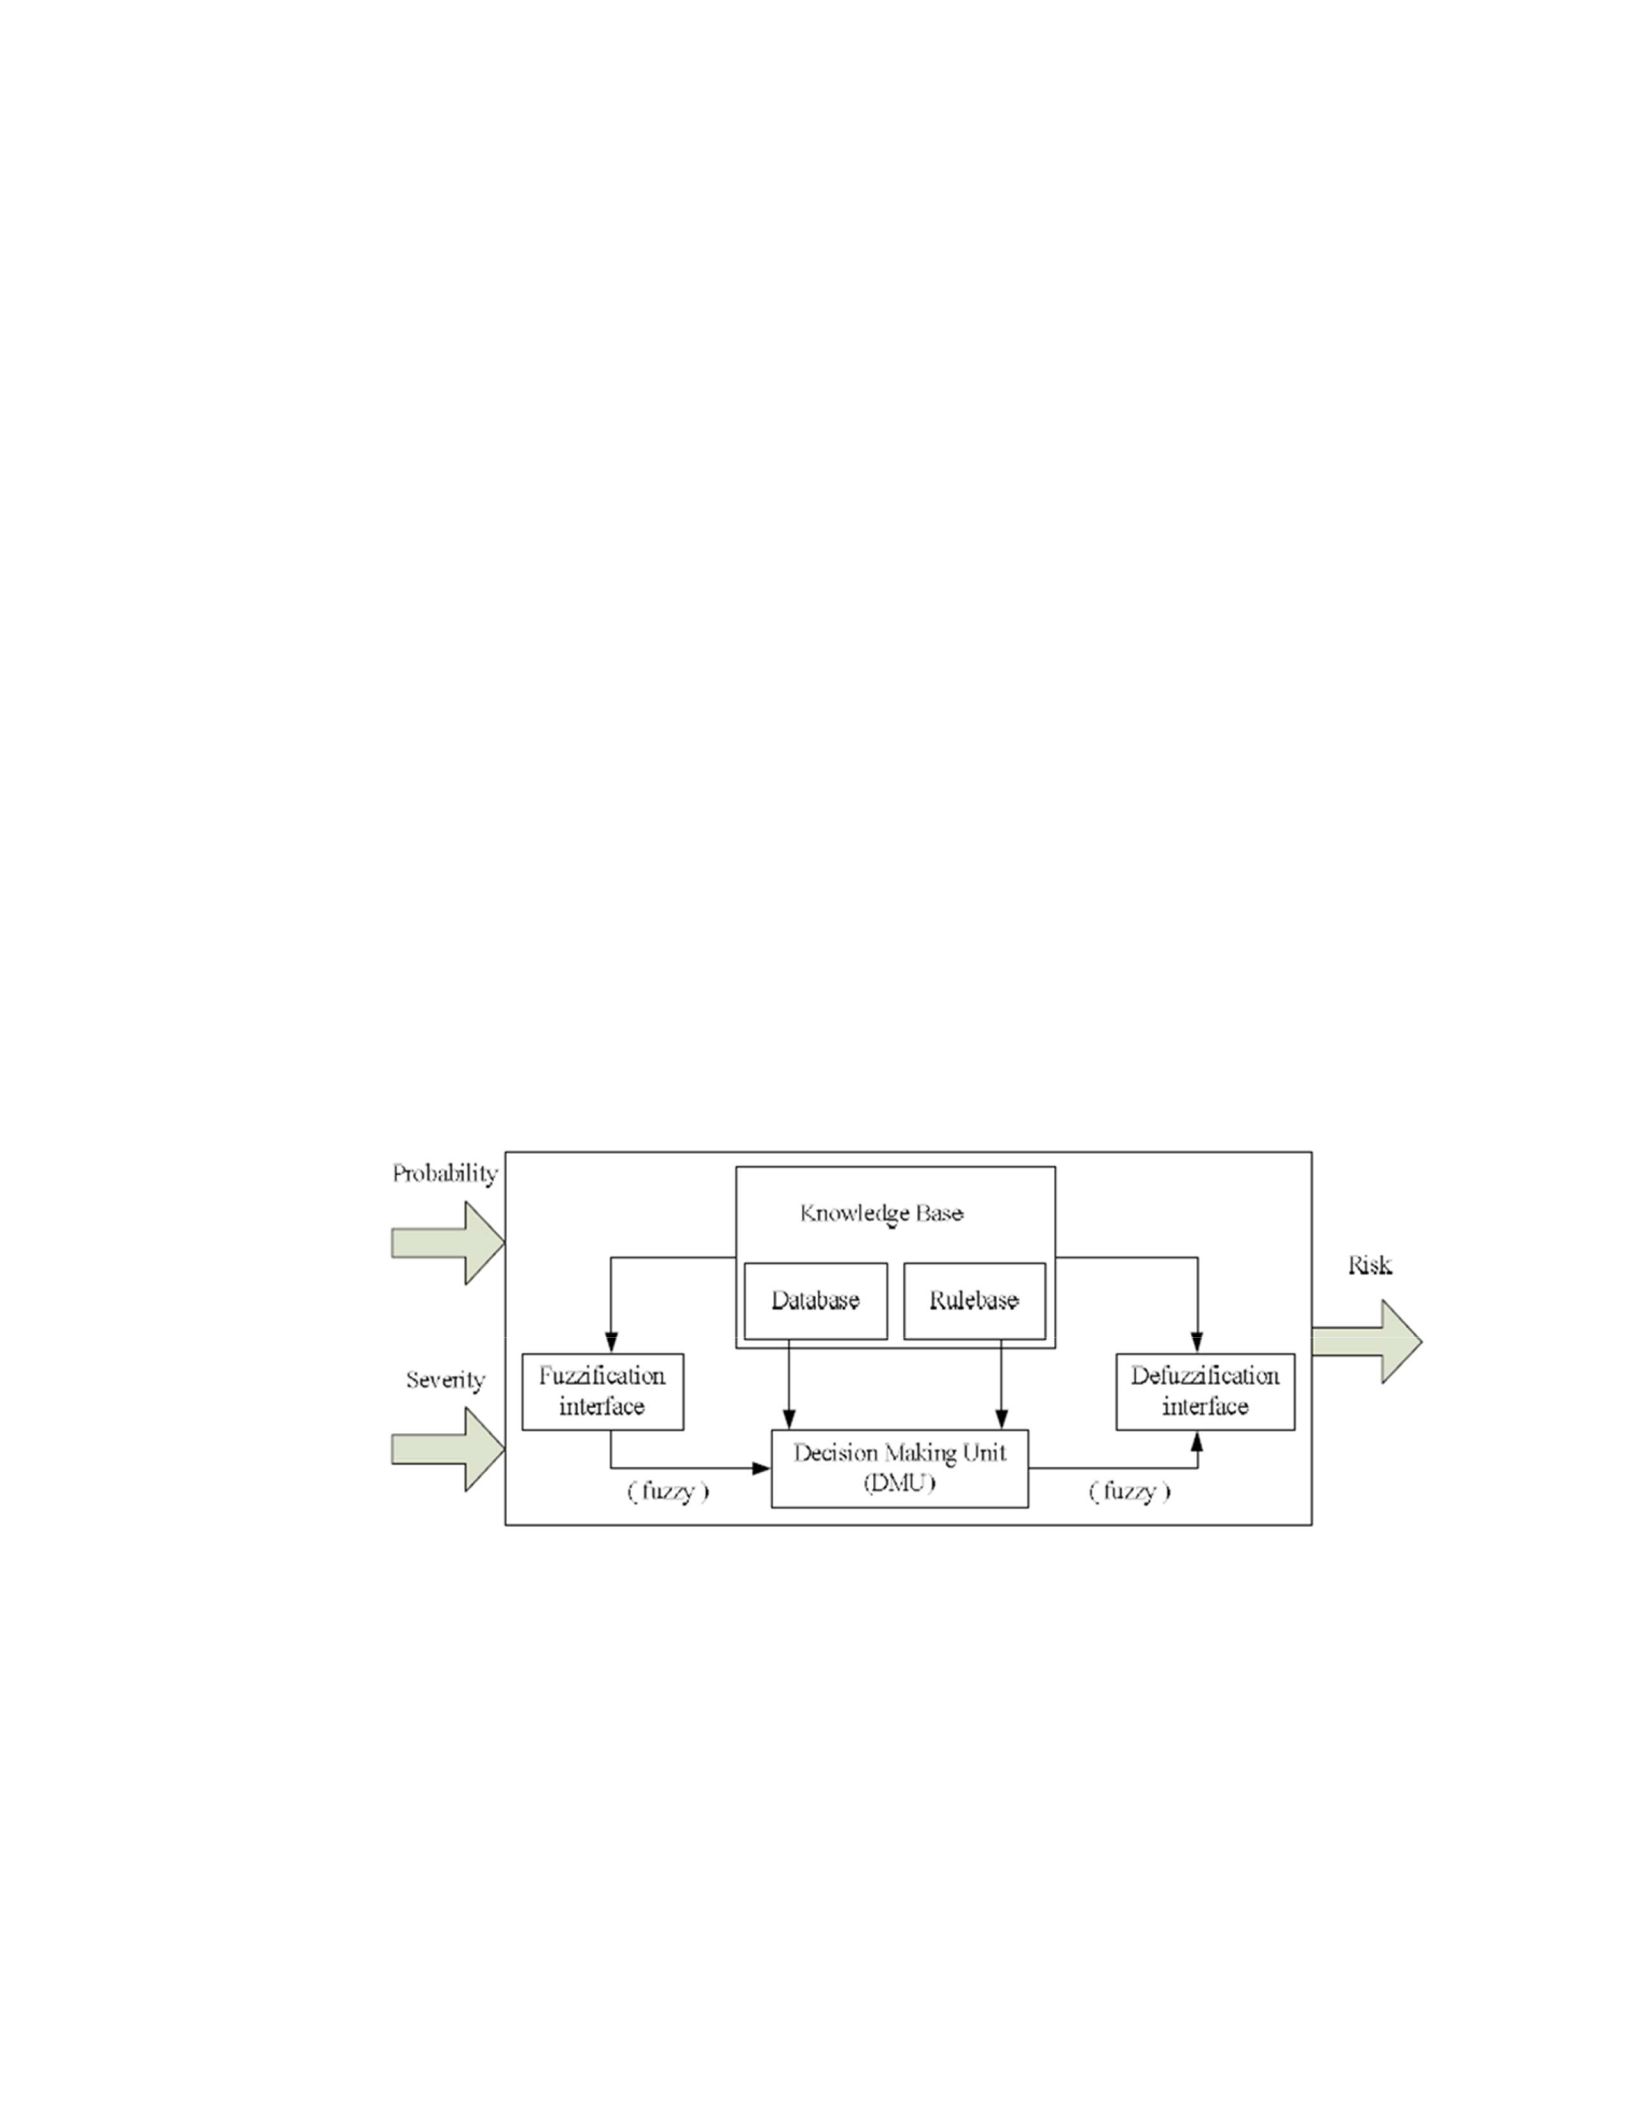
108
replaced with Neuro-Fuzzy risk assessment to train the neural networks to preform an
artificial intelligence assessment. The Neuro-Fuzzy risk assessment have three
distinguishing areas: (a) active monitoring to ensure the technology investment decision’s
sensitivity to detect risk, (b) agility to ensure its flexibility to respond to risk, and (c)
adaptive learning to ensure the capability of the technology investment decision’s
resources to mitigate risk. The Neuro-Fuzzy risk assessment model is referenced in
Appendix A. The technique is neural networks with fuzzy logic combined to create a new
risk assessment model. The inputs to the model were linguistic and fuzzy values of the
probability of risk occurrence and severity of risk occurrence. The fuzzy risk assessment
model is shown in Figure 22. The inputs to the model were linguistic and fuzzy values of
the probability of risk occurrence and severity of risk occurrence. The risk values are the
output to a generic model.
Figure 22. Fuzzy risk assessment. From Risk assessment of construction projects using
network based adaptive fuzzy system, by M. Ebrat and R. Ghodsi, 2011, p. 414. Retreived
from International Journal of Academic Research. Reprinted with permission.
Two parts to the Neuro-Fuzzy adaptive risk assessment model. The first part of
the model was a hybrid learning algorithm, and the second part of the model was an error
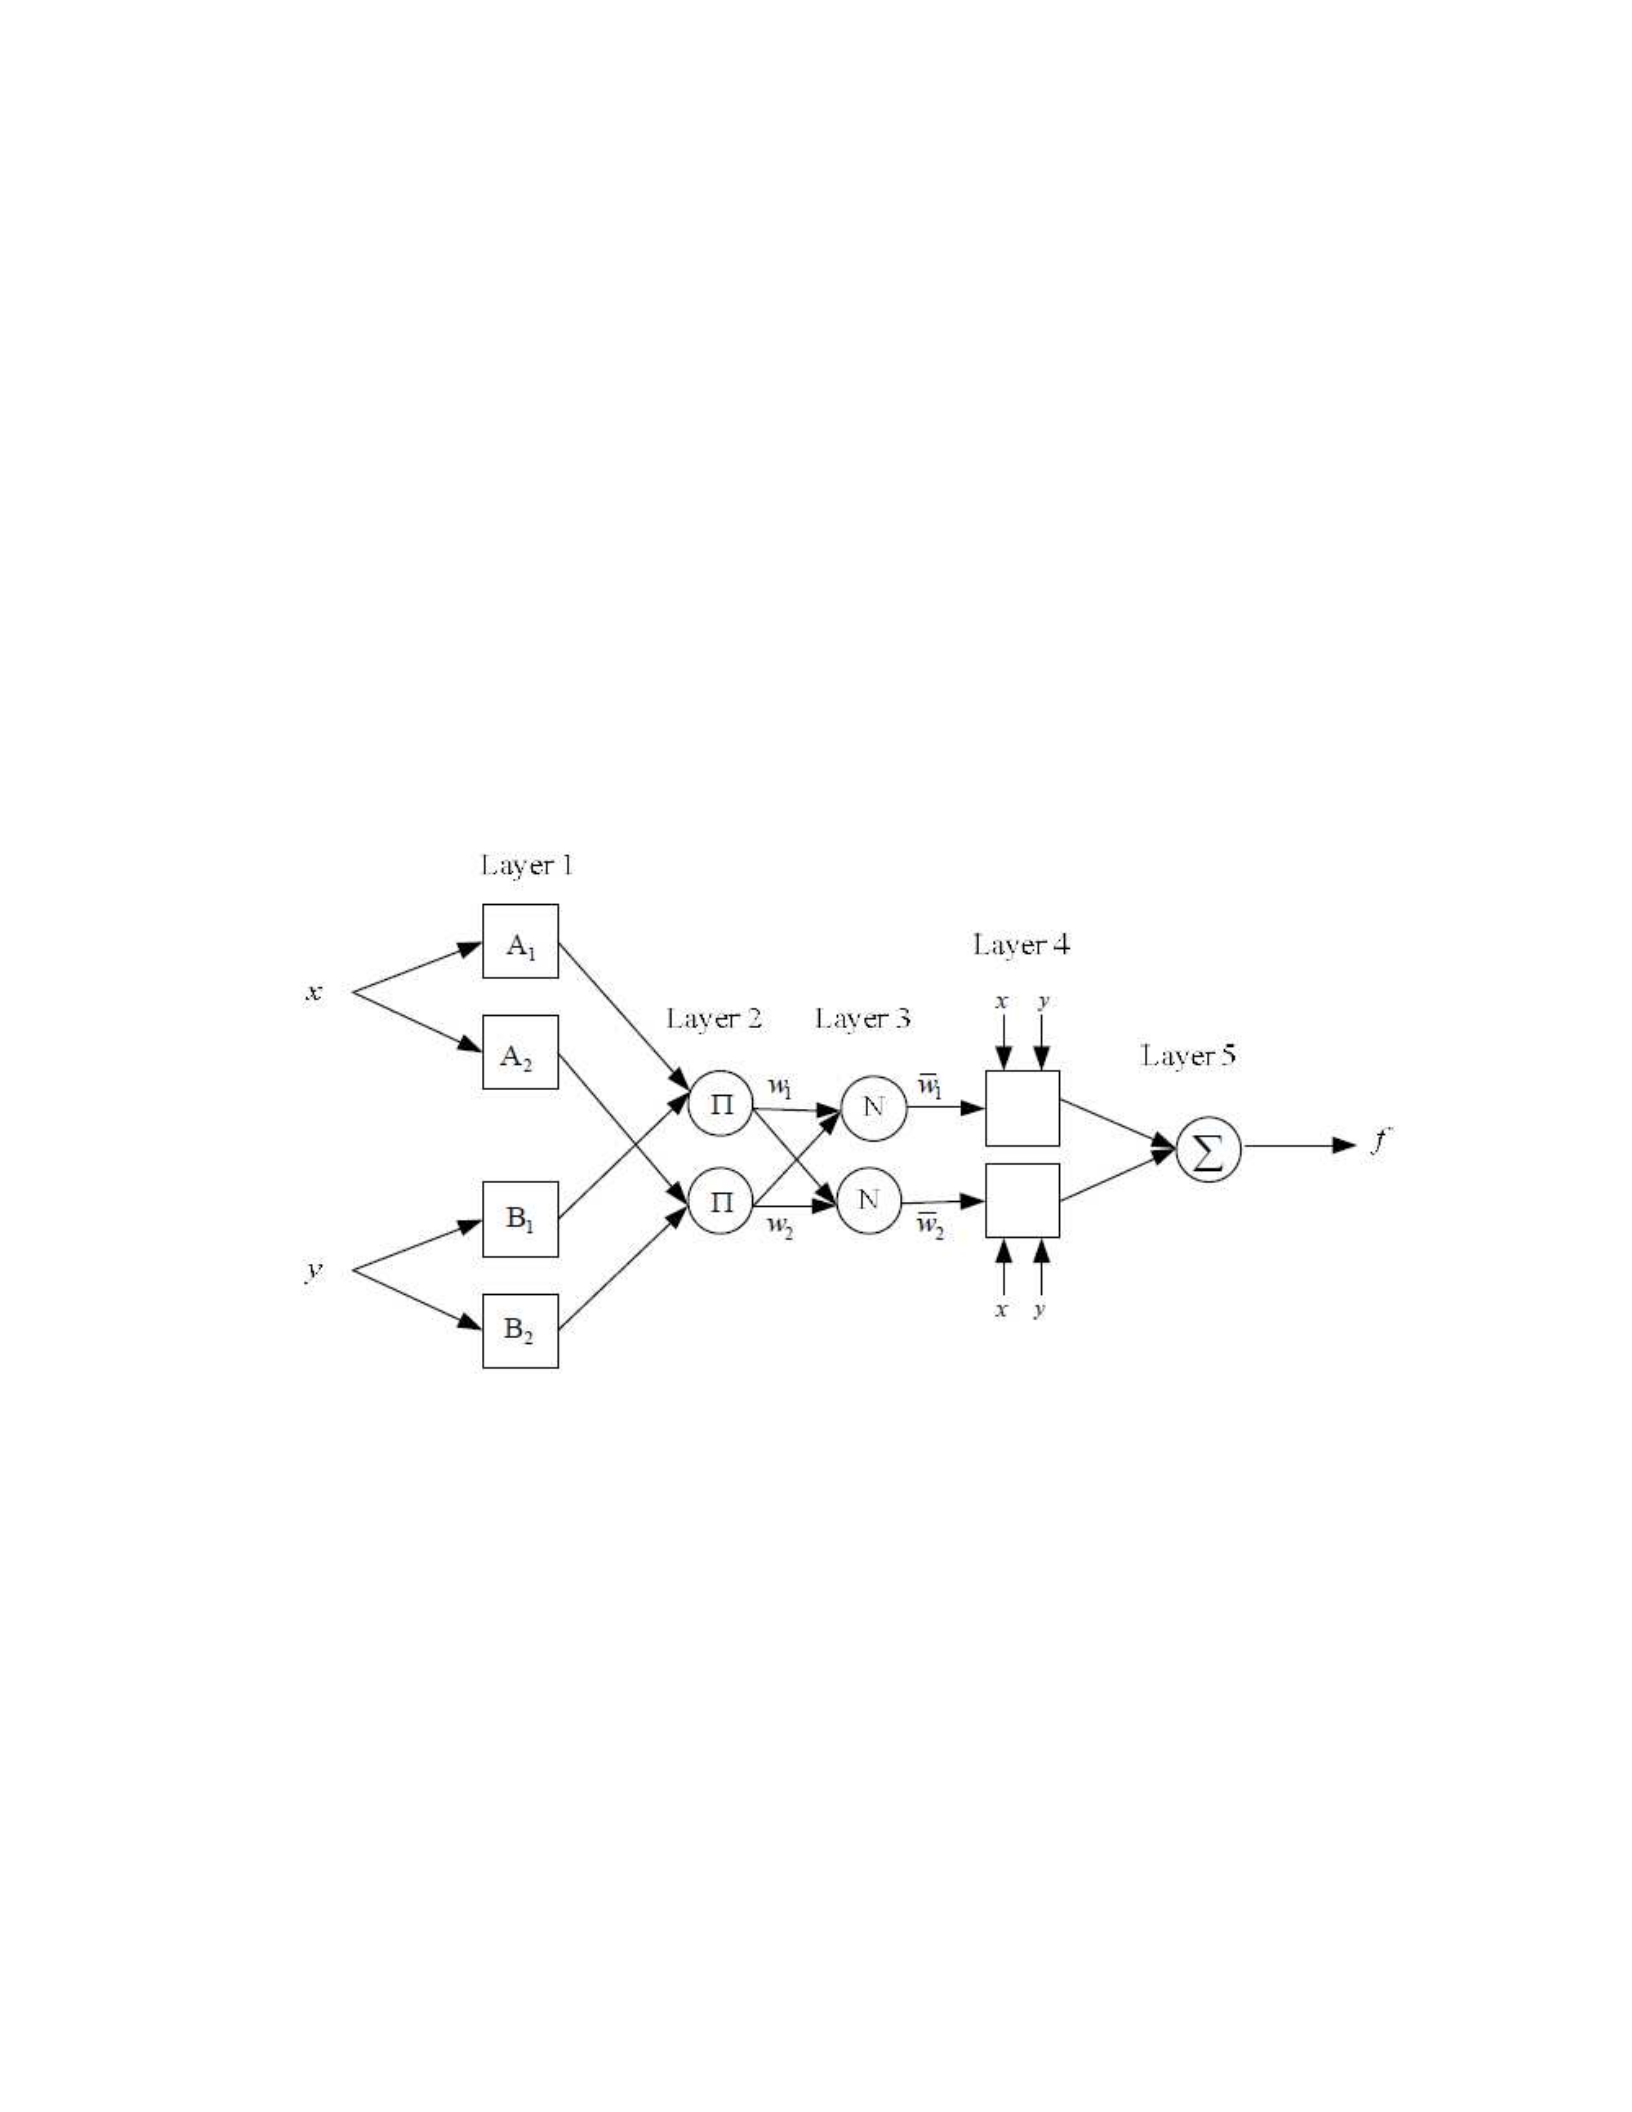
109
back-propagation algorithm. The Neuro-Fuzzy systems use neural network learning for
determination of input and output spaces, as well as, adaptive training samples. The linear
relationship between the input variables was shown in Equation 5.
if (x is A1) AND (y is B1) Then (f1 = p1x + q1y + r1),
where x and y are numerical inputs while A and B are numerical variables. The p, q, and
r are parameters that determine the relation between input and output (Ebrat & Ghodsi,
2011). The Neuro-Fuzzy adaptive assessment model formed by five layers was shown in
Figure 23.
Figure 23. Neuro-fuzzy adaptive assessment model. From Risk assessment of
construction projects using network based adaptive fuzzy system, by M. Ebrat and R.
Ghodsi, 2011, p. 414. Retreived from International Journal of Academic Research.
Reprinted with permission.
The first layer indicated how much each numerical input belongs to a different fuzzy set
was listed in Equation 6.

110
The second layer are operators, such as “AND” and “OR” are used for achieving the
output which was called firing strength. This value determined how much a special rule
was true in different values of inputs. The output of this layer or firing strength was
obtained by multiplying the earlier results. These output are calculated by w in Equation
7.
The third layer was calculated by each of the outputs of the previous layer divided by all
outputs of that rule. The outputs are calculated by was shown in Equation 8.
The forth layer was computed by Equation 9.
The fifth layer was the outputs of the previous neurons are summed with each other and
finally, by defuzzification, fuzzy outputs are converted to numerical outputs f(x,y) in
Equation 10.
The neural network requires training data to learn the adaptive risk computational model
and finally, the least square method was used to obtain the best parameters (Ebrat &

111
Ghodsi, 2011). If the membership functions of inputs are unknown as well, the solution
space would be very large and convergence will take more time. This needs a forward
step and backward step. In the forward step, errors are calculated and in the backward
step, operations are done on the parameters (Ebrat & Ghodsi, 2011). With the assumption
a, b, and c are constants. Then Equation 11 and 12 become the following:
Also, the future study to determine the costs and benefits in Cloud Computing
ROI with Net Present Value (NPV) and Internal Rate of Return (IRR) may also increase
future profits in cloud computing investment. To back up my future study, Misra and
Mondal (2011) addressed the cloud computing investment and the time frame in which
increased profit was expected, Net Present Value (NPV) and Internal Rate of Return
(IRR) can be calculated along with ROI to increase future profits. The ROI with Net
Total Benefit (NTB) calculation uses the net total benefit costs over the analysis period,
and compares this with the total cost saving and other tangible benefits over the same
period. The ROI with NTB is shown in equation 13.
ROI
NTB
= Net Total Benefit (NTB) / Net Total Cost (NTC)
O’Donnell (2002) suggested ROI with NTB approach provides more flexibility than just
NPV because it allows additional intangible benefits to be included. ROI with NTB is
most appropriate when there is a need to analyze costs and benefits where technology

112
investment prices do not exist or are inadequate. The ROI with NTB calculation provides
a valuable comparison of the net total benefit verses net total cost, a ratio that can point
towards a solution that delivers optimum technology investment benefits and the value of
ROI with NTB is important when making a technology investment decision because it
clearly demonstrates the financial gains of the technology investment, compared to the
relative cost (O’Donnell, 2002).
Future research can be conducted with the new Stage-Gate process presented by
Cooper and Edgett (2017). The Stage-Gate process is a phase gate model that improves
new product development, process improvement, and organizational change by dividing
into a series of activities (stages) and decision points (gates). The Stage-Gate process is
leaner, faster, more adaptive and risk- based. To manage risk, the parallel activities in a
certain stage must be designed to gather vital information, such as technical, market,
financial, operations data in order to reduce key project uncertainties and risks. The
Stage-Gate process was first developed by Robert G. Cooper. The five stages are defined
as, (a) Stage 0 Discovery - activities designed to discover opportunities and to generate
new technology investment ideas, (b) Stage 1 Scoping - a quick and inexpensive
assessment of the technical merits of the new technology investment and its market risk,
(c) Stage 2 Build Business Case - technical, marketing and business feasibility are
accessed resulting in a business case which has three main components: technology
investment definition; technology investment justification; and technology investment
plan, (d) Stage 3 Development - the actual technology investment of the new technology
occurs, the investment plan is mapped out, (e) Stage 4 Testing and Validation - the

113
purpose of this stage is to provide validation of the entire investment plan, (f) Stage 5
Launch – making the final investment decisions and fully commercialize the technology
(Cooper & Edgett, 2017). The three gates are listed as, (a) Gate 1 - technology investment
deliverables, (b) Gate 2 - criteria, (c) Gate 3 - outputs of the investment decision and path
forward (Cooper & Edgett, 2017). Gate 3 consists of risk assessment of technology
investment. The risk assessment are organized into a scorecard and include both ROI and
risk criteria. The benefits of using the new Stage-Gate process are to accelerate speed-to-
market decisions, increase likelihood of successful technology investments, and ensure a
complete process to assess technology investment ROIs and risks.
Another future study idea would be using the Paap’s CFTP framework with
added risk assessment apply to a different industry, such as the car manufacturing
industry. For example, the new product risk include high end autonomous self driving
feature may or may not be a good ROI for lowest price cars. But, we don't know the
results until we apply the Paap’s CFTP framework with added risk assessment to the car
manufacturing industry.
Cloud computing investments are no longer just about lowering costs and
improving efficiency. Cloud computing technology fosters greater collaboration across
the company and IT services also call for fewer resources, providing organizations with
the opportunity to invest in other business processes and innovations within their
organization. A great future study idea would be using Paap’s CFTP framework with
added risk assessment apply to a 5 year ROI and risk forecasts. This idea will help the
company to work on long term investment planning for their organization. Also, many

114
companies are spending time with key business stakeholders and peers on the executive
committee to begin laying out a 5 year technology roadmap that aligns with cloud
computing investment strategy with corporate strategy. So, the 5 year ROI and risk
forecasts will be a very useful tool to help the company to make a better decision on their
long term investment strategy.
Another future study idea is to apply Greenwell, Liu, & Chalmers' 2014 Benefits
Management tools in conjunction with Paap's 2010 CFTP framework plus risk
assessment because this may increase the knowledge and robustness of the cloud
computing investment portfolio. Greenwell, Liu, & Chalmers' 2014 Benefits
Management tools determine four types of investments in cloud computing. The fours
investment portfolio categories are strategic cloud computing investments, the high
potential cloud computing investments, the key operation cloud investments, and the
support cloud computing investments.
Positive Social Change and Implications
Several potential positive social changes existed in this study. The positive social
change in this study created a proactive investment strategy using Paap’s CFTP ROI with
added risk assessment. The proactive investment strategy allows the United States cloud
computing companies to remain competitive in the world market with the lowest risk and
highest ROI. Another positive social change was helping cloud computing company
manger to make the best investment decisions which might accelerate changes in new
high tech start-ups and entrepreneurships. These changes may vary from high tech start-
ups in new cloud computing investments, to revolutionizing the large cloud computing

115
companies in their ongoing investments. The Paap’s CFTP ROI with added risk
assessment framework might assist the cloud computing manager with proper investment
decision making. Paap’s CFTP ROI with added risk assessment framework was a tool
that helps the cloud computing manager to understand the different investment factors,
and the potential benefits of risk assessment added to investment strategy. Improve
business process, team work and collaboration between investment and strategic
departments was another positive social change. The current cloud computing companies
are arranged in separate departments to analyze ROI and risk decisions. The ROI
portfolios were analyzed by the investment department and the risk factors were analyzed
by strategic department. Paap’s CFTP ROI with added risk assessment framework was a
tool that helps the help the company to make joint department decisions that might
improve business process, team work, and collaboration. For investment managers, they
could utilize the research findings to focus on a specific cloud computing investment vs.
four or more cloud computing investments in their portfolio. For risk managers, they
could utilize the research findings to help reduce risky investment in their portfolio.
Another major positive social change that the Paap’s CFTP ROI with added risk
assessment framework can be used and applied in many industries besides cloud
computing. Lastly, the United States Government can make use of the Paap’s CFTP ROI
with added risk assessment framework proposed in this research study or a derivative of
it to improve on the acquisition and procurement policy. Instead of using a government
contractor and surveys of different industries to understand the government acquisition
and procurement process, the Paap’s 2010 Paap’s CFTP ROI with added risk assessment

116
could be used to analyze government contracting cost effort when using a certain risk
factor to improve government budget allocation for each fiscal year. Fiscal year is a
period that the government uses for accounting purposes and preparing financial
statements. There are two benefits involved in increasing cloud computing investments.
The benefit was a positive potential investment opportunity. If any of the cloud
computing companies were within the boundary of the high confidence investment
opportunity, then they should either continue to invest or increase investment in cloud
computing technology for the future years. Wikibon Public and Private Cloud Research
Projects (2016) published a projection on how much can be invested in public cloud was
$228 Billion in 2026 worldwide and private cloud was $201 Billion in 2026 worldwide
shown in Figure. 22. The increase in cloud computing investments is helping the
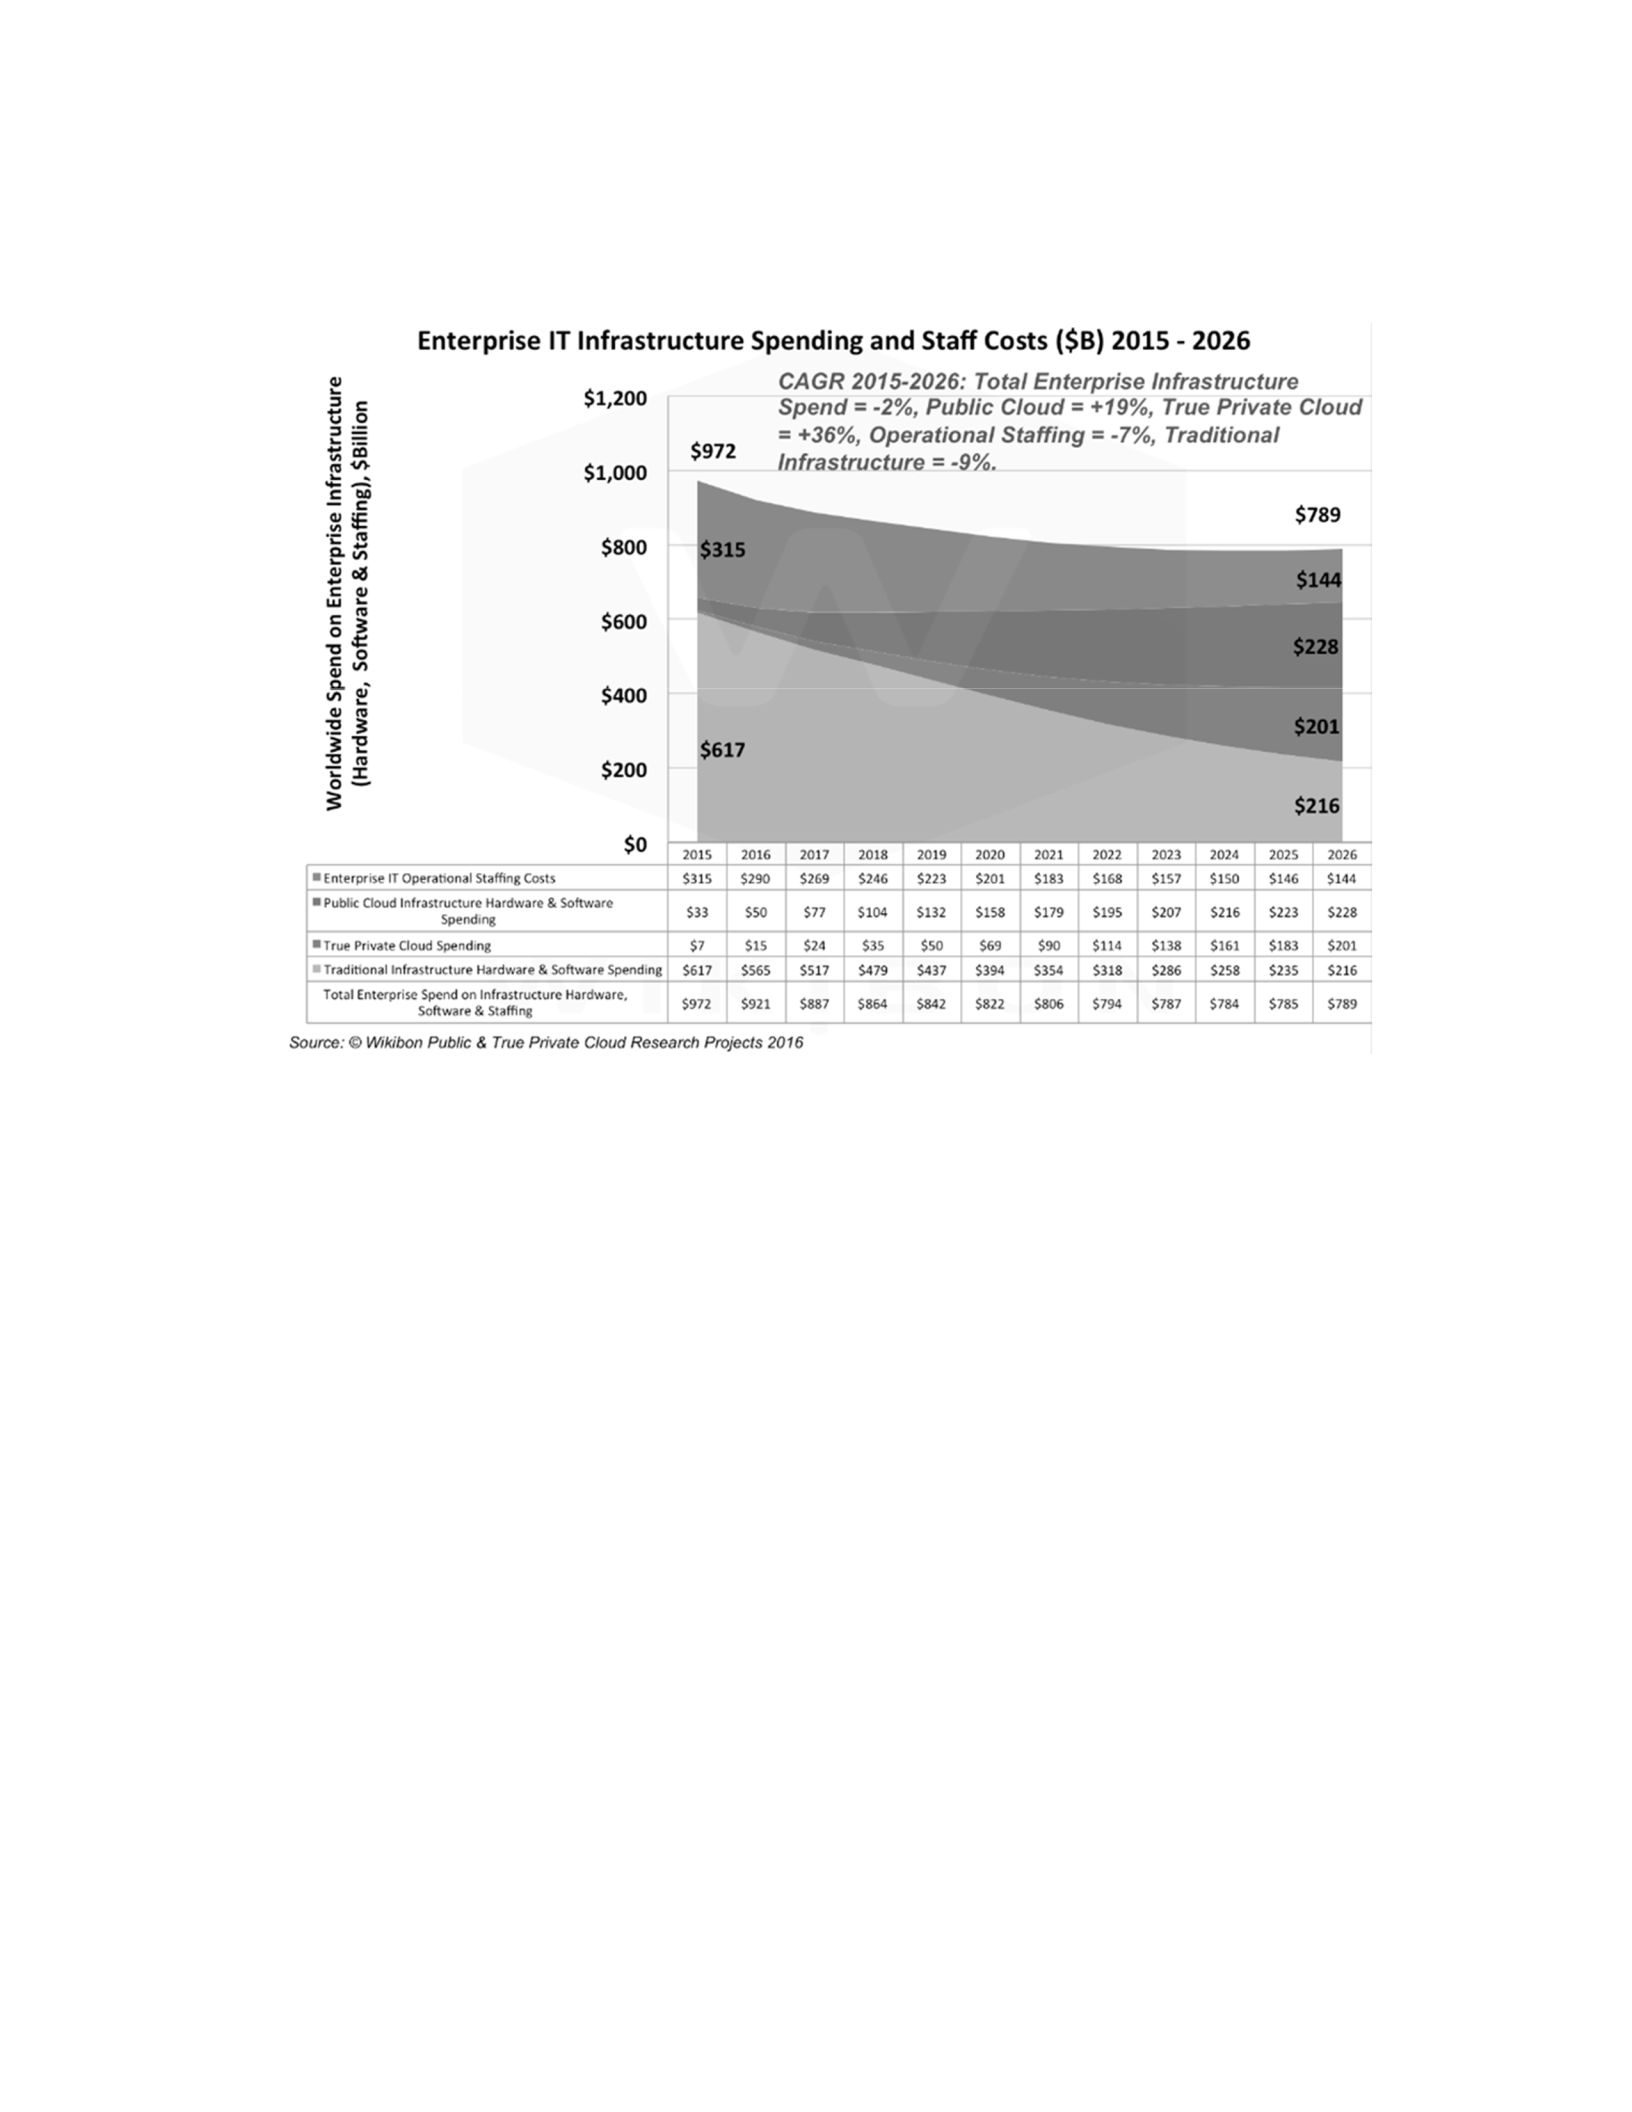
117
economy grow and create new jobs in the United States and around the world.
Figure 24. Wikibon public and private cloud research projects (2016). From Wikibon
research cloud computing (2015 – 2026), by B. Gracely, 2016, p.16. Retreived from
Wikibon Public and True Private Cloud Research Projects 2016 Report. Reprinted with
permission.
Conclusion of Study
My research concluded adding risk assessment to Paap’s CFTP framework has an
improvement upon technology decision-making processes. The key finding was that only
four companies had high ROI, when assessed using only Paap’s CFTP framework.. The
four companies were Amazon, Google, Microsoft and Oracle. All four companies scored
a 98% ROI for 2015. I also found that, after adding market risk assessment to Paap’s
CFTP framework, Amazon had a high ROI of 98% and scored 2 on the lowest risk index
during the 2015. Carvalh and Marden (2015) research results showed a 5-year ROI of

118
560% for Amazon cloud computing. Therefore, the results of my study using Paap’s
CFTP ROI with added risk are aligned with Carvalh and Marden (2015) study.Therefore,
the results of Paap’s CFTP ROI with added risk are aligned with Carvalh and Marden
(2015) study. The research findings with added risk assessment to technology investment
framework yielded two types of benefits: (1) help investors make better decisions
quicker; and (2) obtain a high return on technology investment by selecting the highest
ROI value and lowest risk value.
Also, Paap’s CFTP with added risk assessment was an important tool to
determine the current cloud computing investment and forecast the future investment
decisions based on a portfolio and planning strategy. The portfolio and planning strategy
provided three confidence investment opportunities. The high confidence cloud
computing investment opportunity was between 61% ROI to 100% ROI with a low or a
moderate risk score. If any of the cloud computing companies are within the boundary of
the high confidence investment opportunity, then they should either continue to invest or
increase investment in cloud computing technology for the future years as long as the
increase investment returns a similar ROI or higher ROI. If any of the cloud computing
companies are within the boundary of high confidence investment ROI, but scored a high
risk, then these cloud companies should think about diverting their cloud computing
investment to other technologies. The moderate confidence cloud computing investment
opportunity was between 21% ROI to 60% ROI with a low or a moderate risk score. If
any of the cloud computing companies are within the boundary of the moderate
confidence investment opportunity, then they should continue to invest in cloud

119
computing technology for the future years. If any of the cloud computing companies are
within the boundary of moderate confidence investment ROI, but scored a high risk, then
these cloud companies should think about diverting their cloud computing investment to
other technologies. The low confidence cloud computing investment opportunity was
between 0% ROI to 20% ROI with a high risk score. If any of the cloud computing
companies are within the boundary of the low confidence investment opportunity, then
they should be cautious on investing in cloud computing technology for the future years.
It was very important to be cautious on investing, because there might not be a long-term
financial growth and competitiveness when ROI was low and risk was high. Paap’s CFTP
with added risk assessment can help the low ROI and high risk cloud computing to
change their investment strategy to increase ROI and lower the risk in the future years.
For example, the low ROI cloud computing company can partner with another high ROI
cloud computing company. Another example was to use inventory management to
reduce costs and lower the risk. If any of the cloud computing companies are within the
boundary of low confidence investment ROI, but scored a low or a moderate risk, then
these cloud companies should think about diverting their cloud computing investment to
other technologies.
I have examined and verified with my research there is a need to modify Paap’s
CFTP framework with added risk assessment after reviewing the quantitative analysis
results. The quantitative analysis results of paired sample two-tailed t tests for means and
equal variances showed the null hypothesis rejected because p < 0.05. The concluded
statement would be the null hypothesis gets replaced with the alternate hypothesis (H1):

120
The return on investment may be positively related to adding a traditional risk assessment
model to Paap’s CFTP framework.

121
References
Abdoulaye, P. (2014a). Cloud computing: Advanced business and information technology
strategies. London, United Kingdom: Lulu Publisher.
Abdoulaye, P. (2014b). Cloud computing: Advanced business and information
technology approaches to extract tangible value from cloud. London, United
Kingdom: Lulu Publisher.
Aggarwal, R. (2010). India in the world economy: Role of business restructuring. Review
of Market Integration, 2(2), 181–228. Retrieved from http://www.academia.edu
/20241038/India_in_the_World_Economy_Role_of_Business_Restructuring
Albright, R., & Kappel,T. (2003). Roadmapping in the corporation. Research Technology
Management, 46(2), 31–40. Retrieved from
https://www.questia.com/library/journal/1P3-305041281/technology-
roadmapping-roadmapping-the-corporation
Amazon, Inc. (2015). Annual report 2015. Retrieved from Mergent
Online database http://www.mergentonline.com/login.php
AppDirect, Inc. (2015). Annual report 2015. Retrieved from Mergent Online database
http://www.mergentonline.com/login.php
Apple, Inc. (2015). Form 10-K 2015. Retrieved from http://www.sec.gov/edgar.shtml
Assuncao, M., Costanzo, A., & Buyya, R. (2009). Evaluating the cost benefit of using
cloud computing to extend the capacity of clusters. Proceedings of the 18th ACM
International Symposium on High Performance Distributed Computing, 141-150.
doi:10.1145/1551609.1551635

122
Assuncao, M., Costanzo, A. & Buyya, R. (2010). A cost benefit analysis of using cloud
computing to extend the capacity of clusters. Cluster Computing Journal, 13(1),
335-347. doi:10.1007/s10586-010-0131-x
AT&T, Inc. (2015). Annual report 2015. Retrieved from Mergent Online
database http://www.mergentonline.com/login.php
Babcock, C. (2010). Management strategies for the cloud revolution. New York:
McGraw-Hill.
Bahga, A., & Madisetti, V. (2013). Cloud computing: A hands-on approach. Charleston,
SC: CreateSpace Publishing.
Bakht, Omar. (2015). University of Rochester Ventures Website. Retrieved
from http://www.rochester.edu/ventures/event/8452/
Barnier, B. (2014). 5 views on achieving ROI through risk management. Information
System Journal, 1(1), 1-5. Retrieved from http://www.darkreading.com/risk/5-
views-on-achieving-business-roi-through-risk-management/d/d-id/1138233?
Benaroch, M., Lichtenstein, Y., & Robinson, K. (2006). Real options in information
technology risk management: an empirical validation of risk-option relationships.
MIS Quarterly, 30(4), 827-864. doi:10.2307/25148756
Berman, S., Kesterson-Townes, L., Marshall, A., & Srivathsa, R. (2012). The power of
cloud driving business model innovation. IBM Global Business Services
Executive Report, 1-20. Retrieved from http://www.ibm.com/cloud-
computing/us/en/assets/power-of-cloud-for-bus-model-innovation.pdf
Birkett, M. (1995). Is audit action research? Physiotherapy, 81(4), 190-194. Retrieved

123
from https://www.asrn.org/journal-nursing/1037-a-redefinition-of-action-
research.html
BlueLock, LLC. (2015). Annual report 2015. Retrieved from Mergent Online database
http://www.mergentonline.com/login.php
BMC Software, Inc. (2015). Form 10-K 2015. Retrieved from http://www.sec.gov/edgar
.shtml
CA Technologies, Inc. (2015). Annual report 2015. Retrieved from Mergent Online
database http://www.mergentonline.com/login.php
Chabrow, E. (2012).Overcoming the apprehension of cloud computing. Information
Security Media Group Survey Report, 1-24. Retrieved from
https://assets1.csc.com/cloud/downloads/Cloud_Survey_Report_2012_1.pdf
Carstensen, J., Golden, B., & Morgenthal, J. (2012). Cloud computing: Assessing the
risks. London, United Kingdom: IT Governance Publisher.
Carvalho, L., & Marden, M. (2015). Quantifying the business value of Amazon web
services. IDC White Paper, 1-15. Retrieved from https://d0.awsstatic.com/analyst-
reports/
Chan, W., Leung, E., & Pili, H. (2012). Enterprise risk management for
cloud computing. The Committee of Sponsoring Organizations of the Treadway
Commission (COSO) conference paper, 1-32. Retrieved from
https://www.coso.org/Documents/Cloud-Computing-Thought-Paper.pdf
Chang, V., Roure, D., Wills, G., Walters, R., & Barry, T. (2011). Organizational
sustainability modelling for return on investment (ROI): Case studies presented

124
by a national health service trust UK. Journal of Computing and Information
Technology, 19(1), 177-192. doi:10.2498/cit.1001951
Chen, H., Ho, J. & Kocaoglu, D. (2009). A strategic technology planning framework: A
case of Taiwan’s semiconductor foundry Industry. IEEE Transactions on
Engineering Management Journal, 56(1), 4-15. Retrieved from
http://ceit.aut.ac.ir/~sa_hashemi/My%20Teachings/MS-CEIT-
Advanced%20Strategic%20Planning/8-
Selected%20Papers/Offered/Strategic%20Technology%20planning%20Framewor
k.pdf
Chen, P., & Wang, J. (2009). Application of a fuzzy AHP method to risk assessment of
international construction projects. 2009 International Conference on Electronic
Commerce and Business Intelligence, 459–462. doi:10.1109/ECBI.2009.14
Cisco Systems, Inc. (2015). Annual report 2015. Retrieved from Mergent Online
database http://www.mergentonline.com/login.php
Citrix Systems, Inc. (2015). Annual report 2015. Retrieved from Mergent Online
database http://www.mergentonline.com/login.php
CloudStack Apache Software Foundation. (2015). Annual report 2015. Retrieved from
Mergent Online database http://www.mergentonline.com/login.php
Collins, S. & McAllister, D. (2011). Telcos advance in cloud computing. KPMG
International Cooperative Paper, 1-10. Retrieved from
http://docplayer.net/788088-Telcos-advance-in-cloud-computing.html
Cooper, R., & Edgett, S. (2017). Stage-Gate: Your roadmap for new product

125
development website. Retrieved from http://www.prod-dev.com/stage-gate.php
Craig, J. & Jutla, D. (2000). e-Business readiness: A customer-focused framework.
Boston: Addison-Wesley Professional.
Cross, D. & Kuwahara, E. (Spring, 2010). E-discovery and cloud computing: control of
ESI in the cloud. EDDE Journal, 1(2), 20-28. Retrieved from
https://www.crowell.com/documents/E-Discovery-and-Cloud-Computing-
Control-of-ESI-in-the-Cloud.pdf
Curtis, W., Heckman, C., Handley, S. Thorp, A., & Herzinger, K. (2010). Cloud
computing: eDiscovery issues and other risk. Orrick eDiscovery Journal, 1(1),
133-140. Retrieved from http://ilta.personifycloud.com/webfiles/
productfiles/2003/Handout%20-%20Cloud%20Computing.pdf.
Datapipe, Inc. (2015). Annual report 2015. Retrieved from Mergent Online database
http://www.mergentonline.com/login.php
Dell Inc. (2015). Annual report 2015. Retrieved from Mergent Online database
http://www.mergentonline.com/login.php
Deming, W. E. (1982, winter). Improvement of quality and productivity through action
by management. National Productivity Review, 2(1), 12-22. Retrieved from
www.jourlib.org/references/14008819
Dobson, S., Sterritt, R., Nixon, P., Hinchey, M. (2010). Fulfilling the vision of autonomic
computing. IEEE Transactions on Computer Engineering, 43(1), 35-41. doi:
10.1109/MC
Ebrat, M. & Ghodsi, R. (2011). Risk assessment of construction projects using network

126
based adaptive fuzzy system. International Journal of Academic Research, 3(1),
411-417. doi: 10.1007/s12205-014-0139-5
Erl, T., Puttini, R., & Mahmood. (2013). Cloud computing: concepts, technology &
architecture (1st ed.). New Jersey: Prentice Hall.
Eucalyptus System, Inc. (2015). HP subsidiary annual report 2015. Retrieved from
Mergent Online database http://www.mergentonline.com/login.php
Feuerlicht, G., & Govardhan, S. (2010). Impact of cloud computing: Beyond a
technology trend. System Integration Journal, 1(1), 262-269. Retrieved from
https://www.researchgate.net/publication/228980650_Impact_of_Cloud_Computi
ng_Beyond_a_Technology_Trend
Flynn, D., Lownds, P., Vredevoort, H., & Finn, A. (2012). Microsoft private cloud
computing. New Jersey: Wiley.
Fujitsu America, Inc. (2015). Annual report 2015. Retrieved from Mergent Online
database http://www.mergentonline.com/login.php
Google, Inc. (2015). Form 10-K 2015. Retrieved from
http://www.sec.gov/edgar.shtml
Gracely, B. (2016). Wikibon research cloud computing (2015 – 2026). Wikibon Public
and True Private Cloud Research Projects 2016 Report, 1-23. Retrieved from
http://wikibon.com/wp-content/uploads/Wikibon-BGracely-Cloud-Computing-
Nov-20152.pdf
Granneman, S. (2008). Google apps deciphered: Compute in the cloud to streamline your
desktop. New Jersey: Prentice Hall.

127
Greenwell, R., Liu, X., & Chalmers, K. (2014). Benefits management of cloud computing
investments. (IJACSA) International Journal of Advanced Computer Science and
Applications, 5(7), 1-9. doi:10.1.1.635.7450
Haugen, D. M. (2012). Technology and the cloud. Michigan: Gale Group Publisher.
Hewlett Packard (HP), Inc. (2015). Form 10-K 2015. Retrieved from
website http://www.sec.gov/edgar.shtml
International Business Machines (IBM) Corporation. Annual report 2015. Retrieved
from https://www.ibm.com/annualreport/2015/assets/img/2016/02/IBM-Annual-
Report-2015.pdf
Internap Corporation. (2015). Annual report 2015. Retrieved from Mergent Online
database http://www.mergentonline.com/login.php
Jiang, H., & Ruan, J. (2010). Investment risks assessment on high-tech projects based
on analytic hierarchy process and bp neural network. Journal of Networks, 5(4),
393-402. Retrieved from https://www.researchgate.net/publication/42804020
Jurimae, T. (2010). Risk management in the procurement of innovation. European
Commission Directorate Report: European Commission Printing Office, 1-122.
Retrieved from http://ec.europa.eu/invest-in-research/pdf/download_en/
risk_management.pdf
Kahneman, D. and D. Lovallo. (2006). Timid choices and bold forecasts: A cognitive
perspective on risk taking. Management Science Journal, 39(2), 17-31. Retrieved
fromhttp://www.anderson.ucla.edu/faculty/keith.chen/negot.%20papers/
KahnemanLovallo_ChoicForcastsRisk93.pdf

