Quick Study Chapter 21
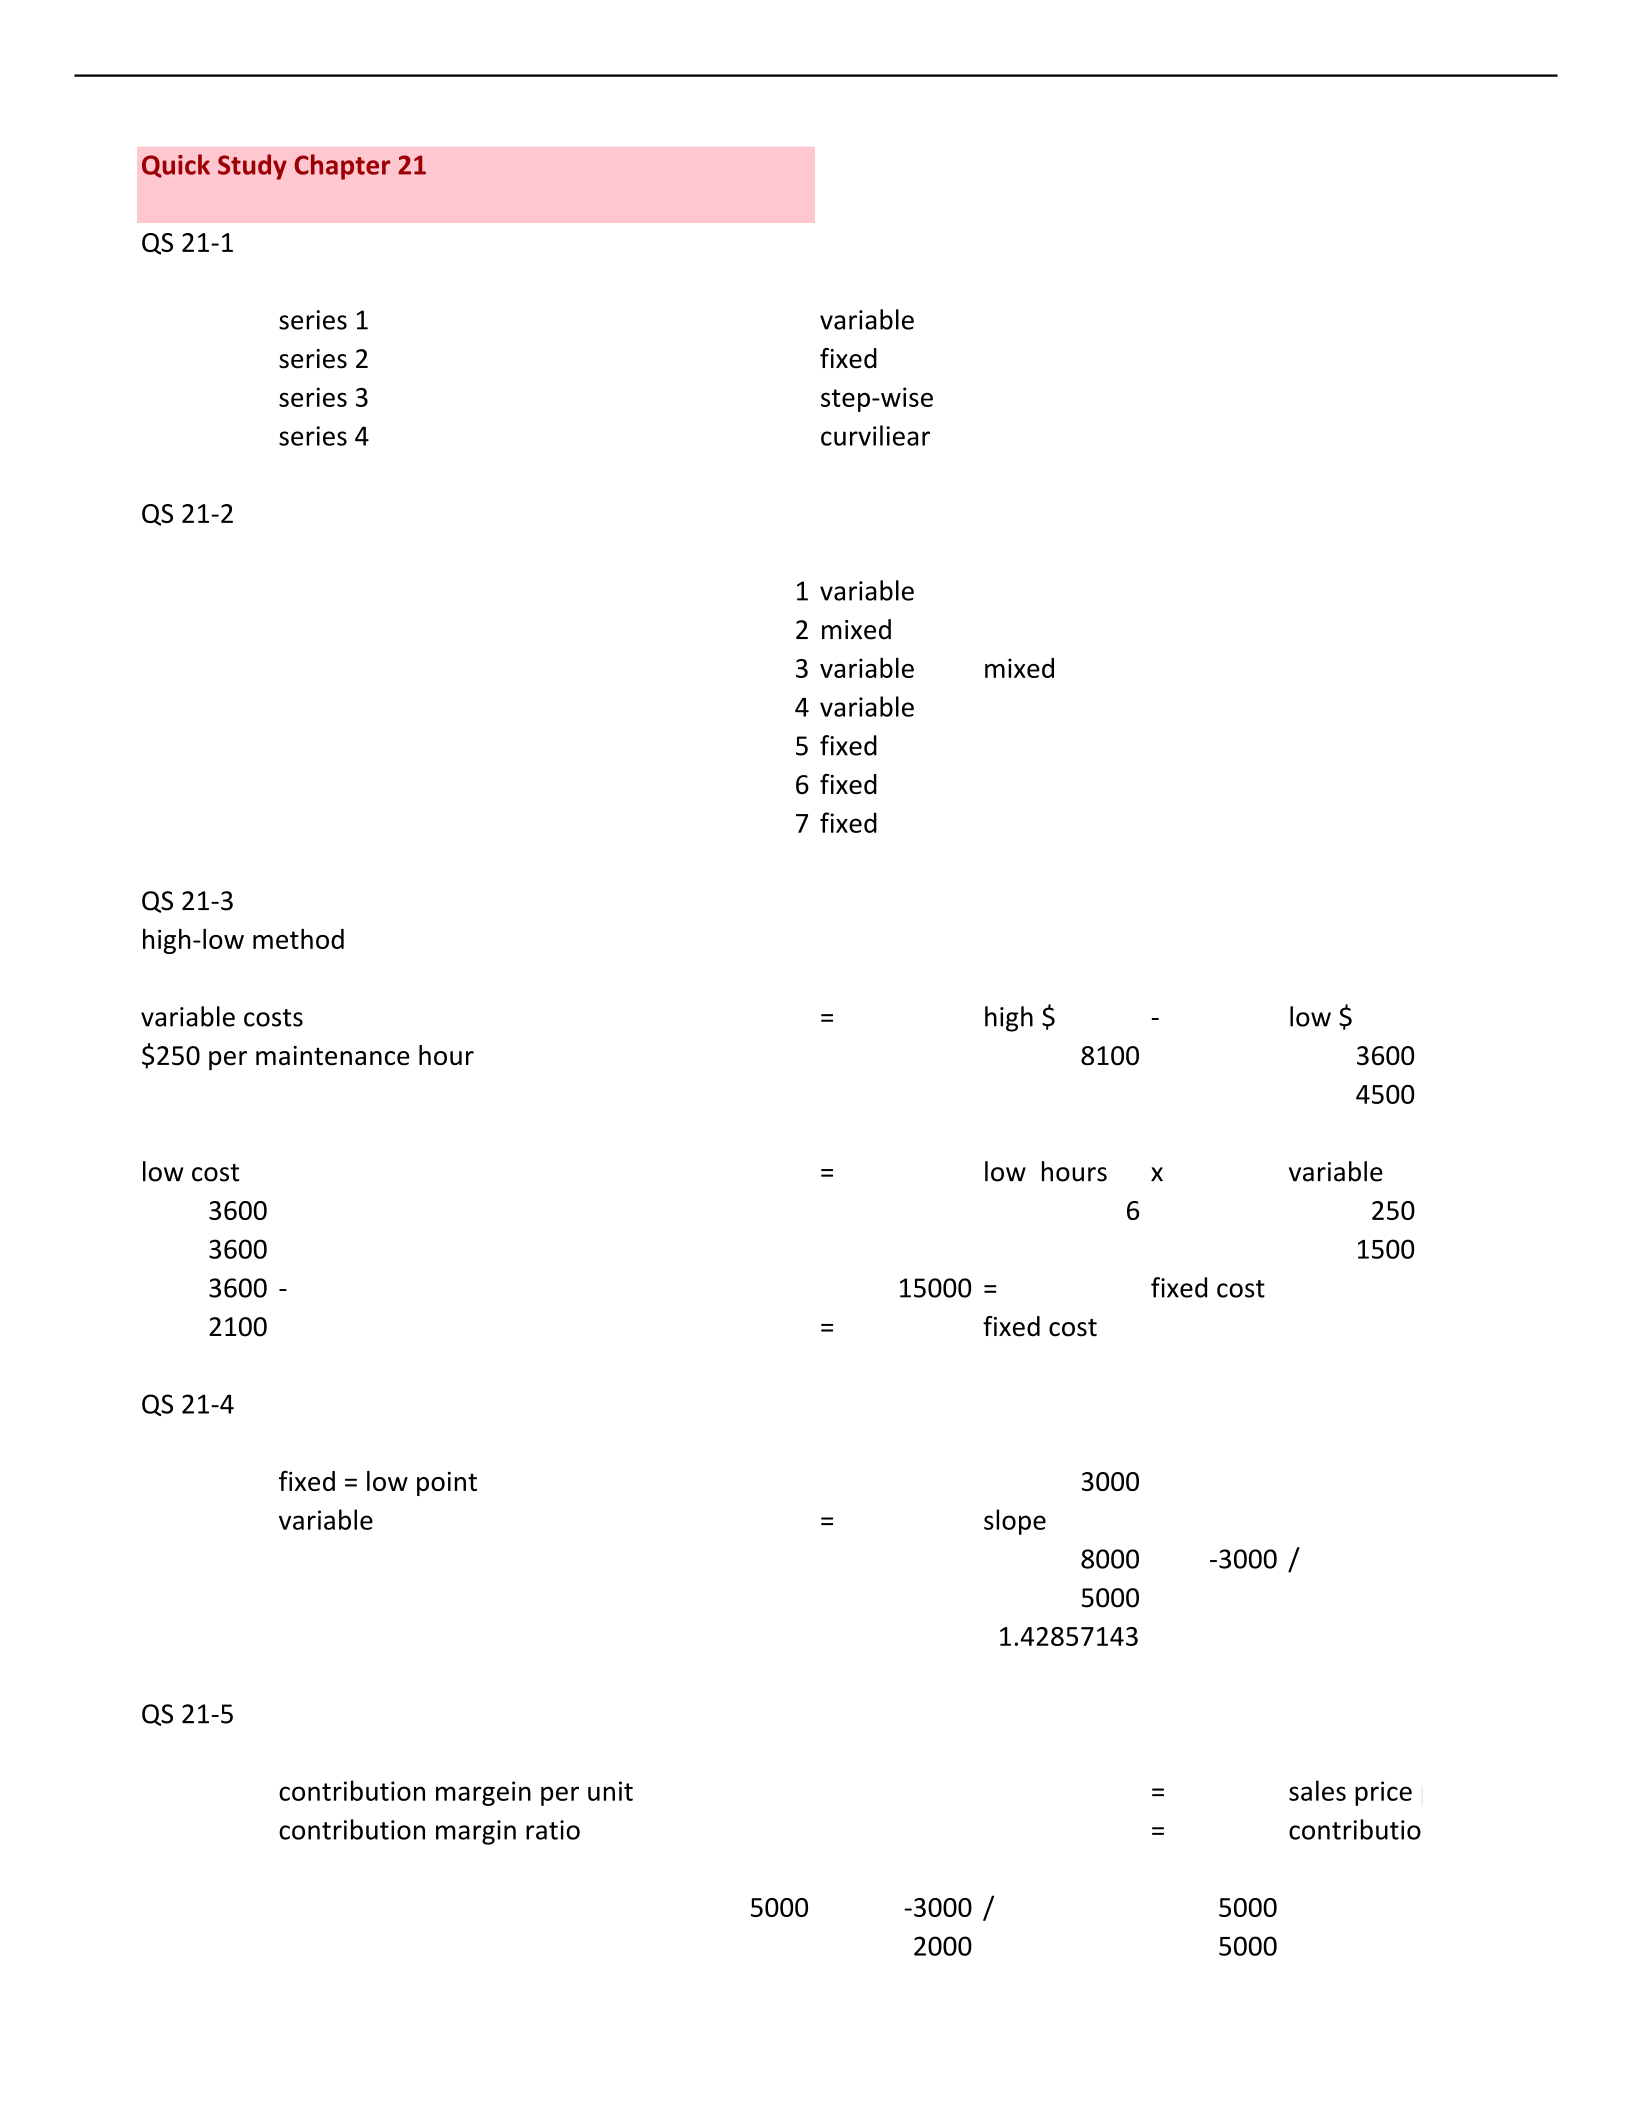
QS 21-1
series 1
variable
series 2
fixed
series 3
step-wise
series 4
curviliear
QS 21-2
1
variable
2
mixed
3
variable
mixed
4
variable
5
fixed
6
fixed
7
fixed
QS 21-3
high-low method
variable costs
=
high $
-
low $
$250 per maintenance hour
8100
3600
4500
low cost
=
low hours
x
variable
3600
6
250
3600
1500
3600
-
15000
=
fixed cost
2100
=
fixed cost
QS 21-4
fixed = low point
3000
variable
=
slope
8000
-3000
/
5000
1.42857143
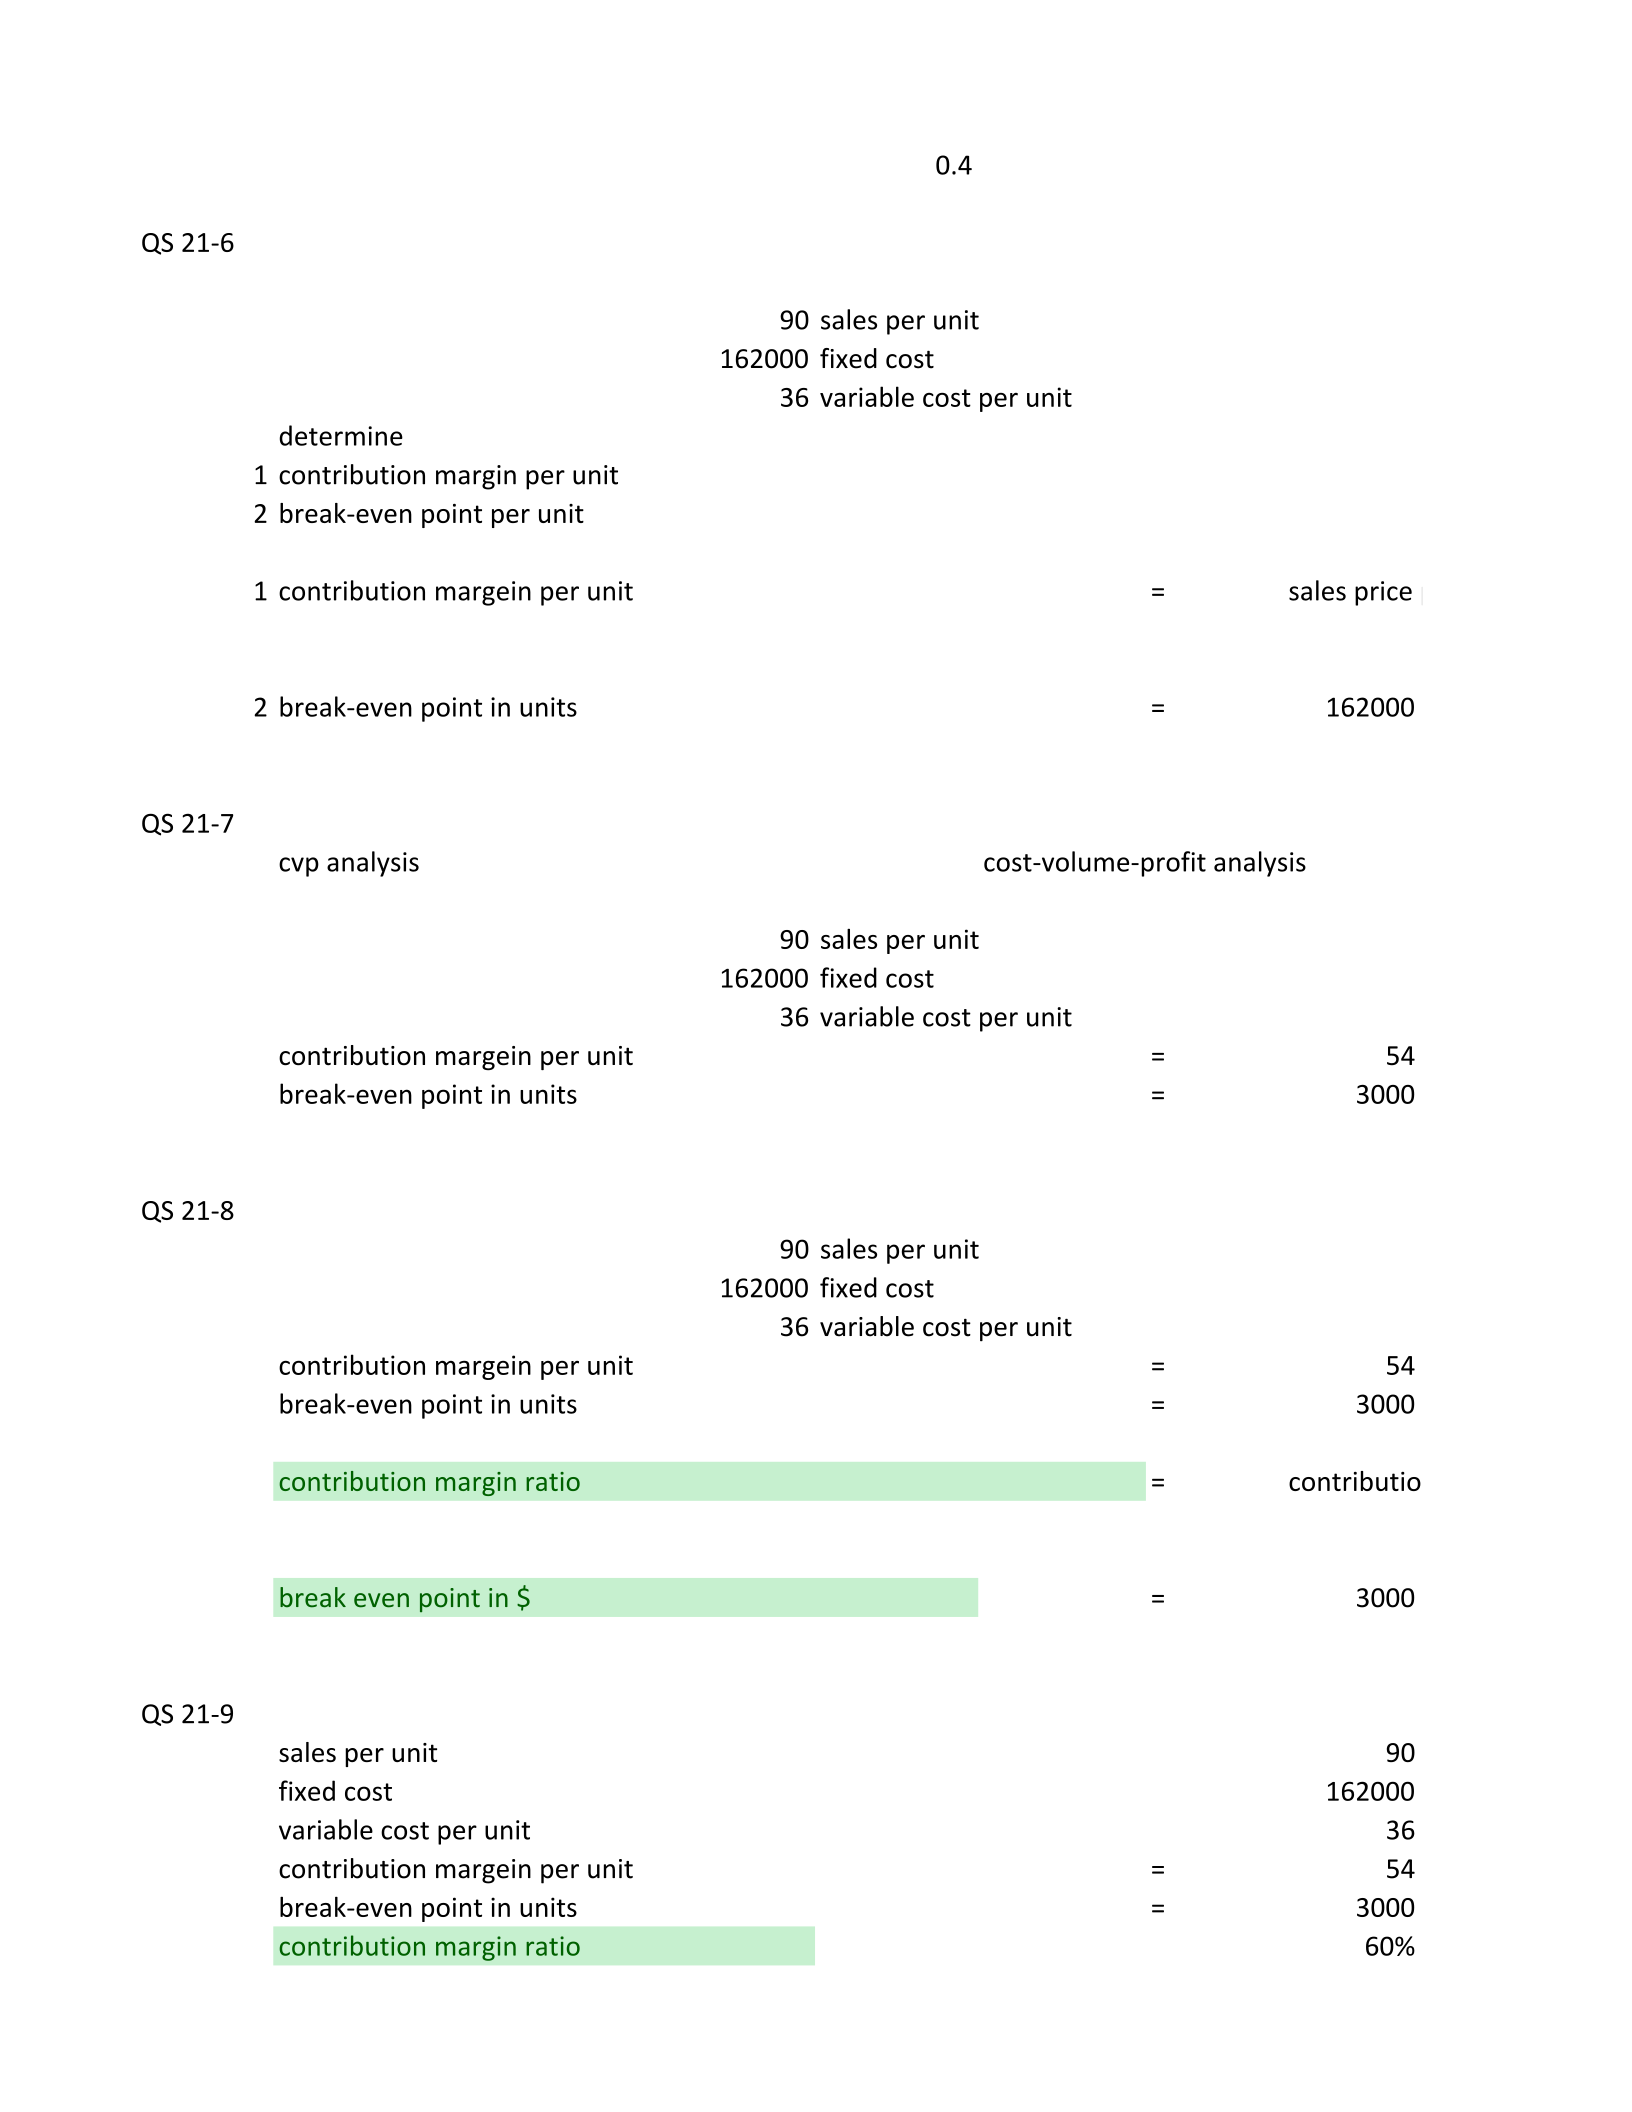
QS 21-5
contribution margein per unit
=
sales price per unit
contribution margin ratio
=
contribution margin per unit
5000
-3000
/
5000
2000
5000
0.4
QS 21-6
90
sales per unit
162000
fixed cost
36
variable cost per unit
determine
1
contribution margin per unit
2
break-even point per unit
1
contribution margein per unit
=
sales price per unit
2
break-even point in units
=
162000
QS 21-7
cvp analysis
cost-volume-profit analysis
90
sales per unit
162000
fixed cost
36
variable cost per unit
contribution margein per unit
=
54
break-even point in units
=
3000
QS 21-8
90
sales per unit
162000
fixed cost
36
variable cost per unit
contribution margein per unit
=
54
break-even point in units
=
3000
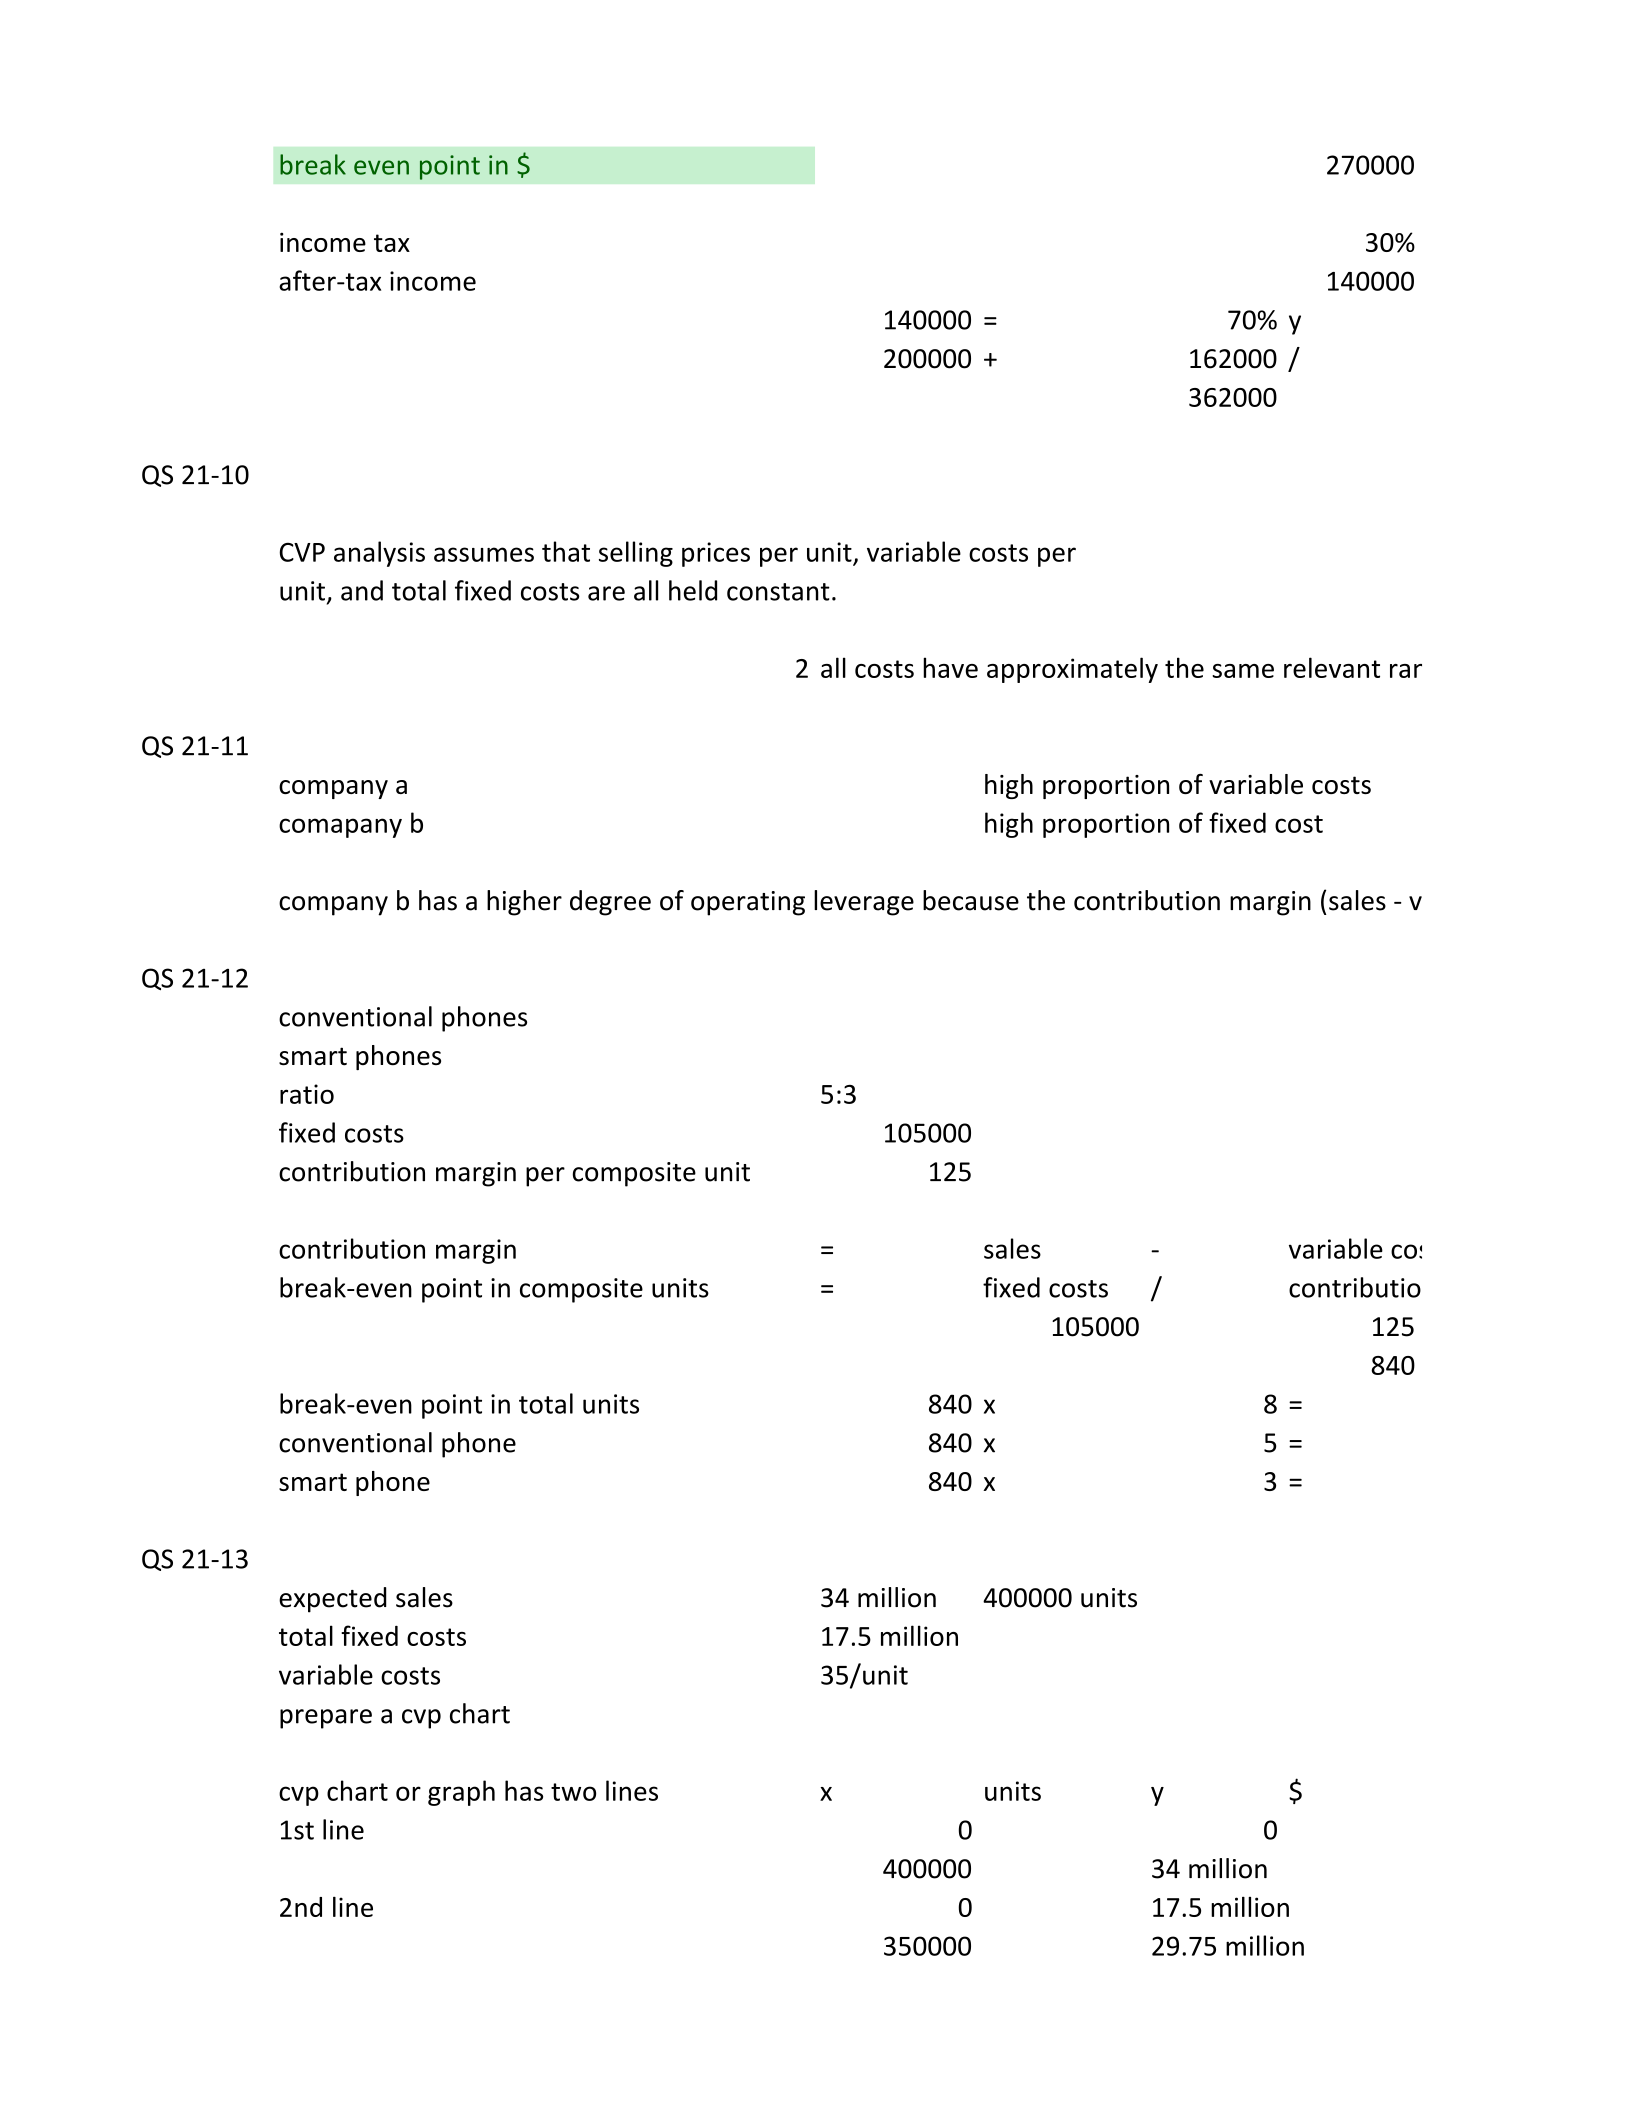
contribution margin ratio
=
contribution margin per unit
break even point in $
=
3000
QS 21-9
sales per unit
90
fixed cost
162000
variable cost per unit
36
contribution margein per unit
=
54
break-even point in units
=
3000
contribution margin ratio
60%
break even point in $
270000
income tax
30%
after-tax income
140000
140000
=
70%
y
200000
+
162000
/
362000
QS 21-10
CVP analysis assumes that selling prices per unit, variable costs per
unit, and total fixed costs are all held constant.
2
all costs have approximately the same relevant range
QS 21-11
company a
high proportion of variable costs
comapany b
high proportion of fixed cost
company b has a higher degree of operating leverage because the contribution margin (sales - variable costs) is high.
QS 21-12
conventional phones
smart phones
ratio
5:3
fixed costs
105000
contribution margin per composite unit
125
contribution margin
=
sales
-
variable costs
break-even point in composite units
=
fixed costs
/
contribution margin per unit
105000
125
840
break-even point in total units
840
x
8
=
conventional phone
840
x
5
=
smart phone
840
x
3
=
QS 21-13
expected sales
34 million
400000 units
total fixed costs
17.5 million
variable costs
35/unit
prepare a cvp chart
cvp chart or graph has two lines
x
units
y
$
1st line
0
0
400000
34 million
2nd line
0
17.5 million
350000
29.75 million
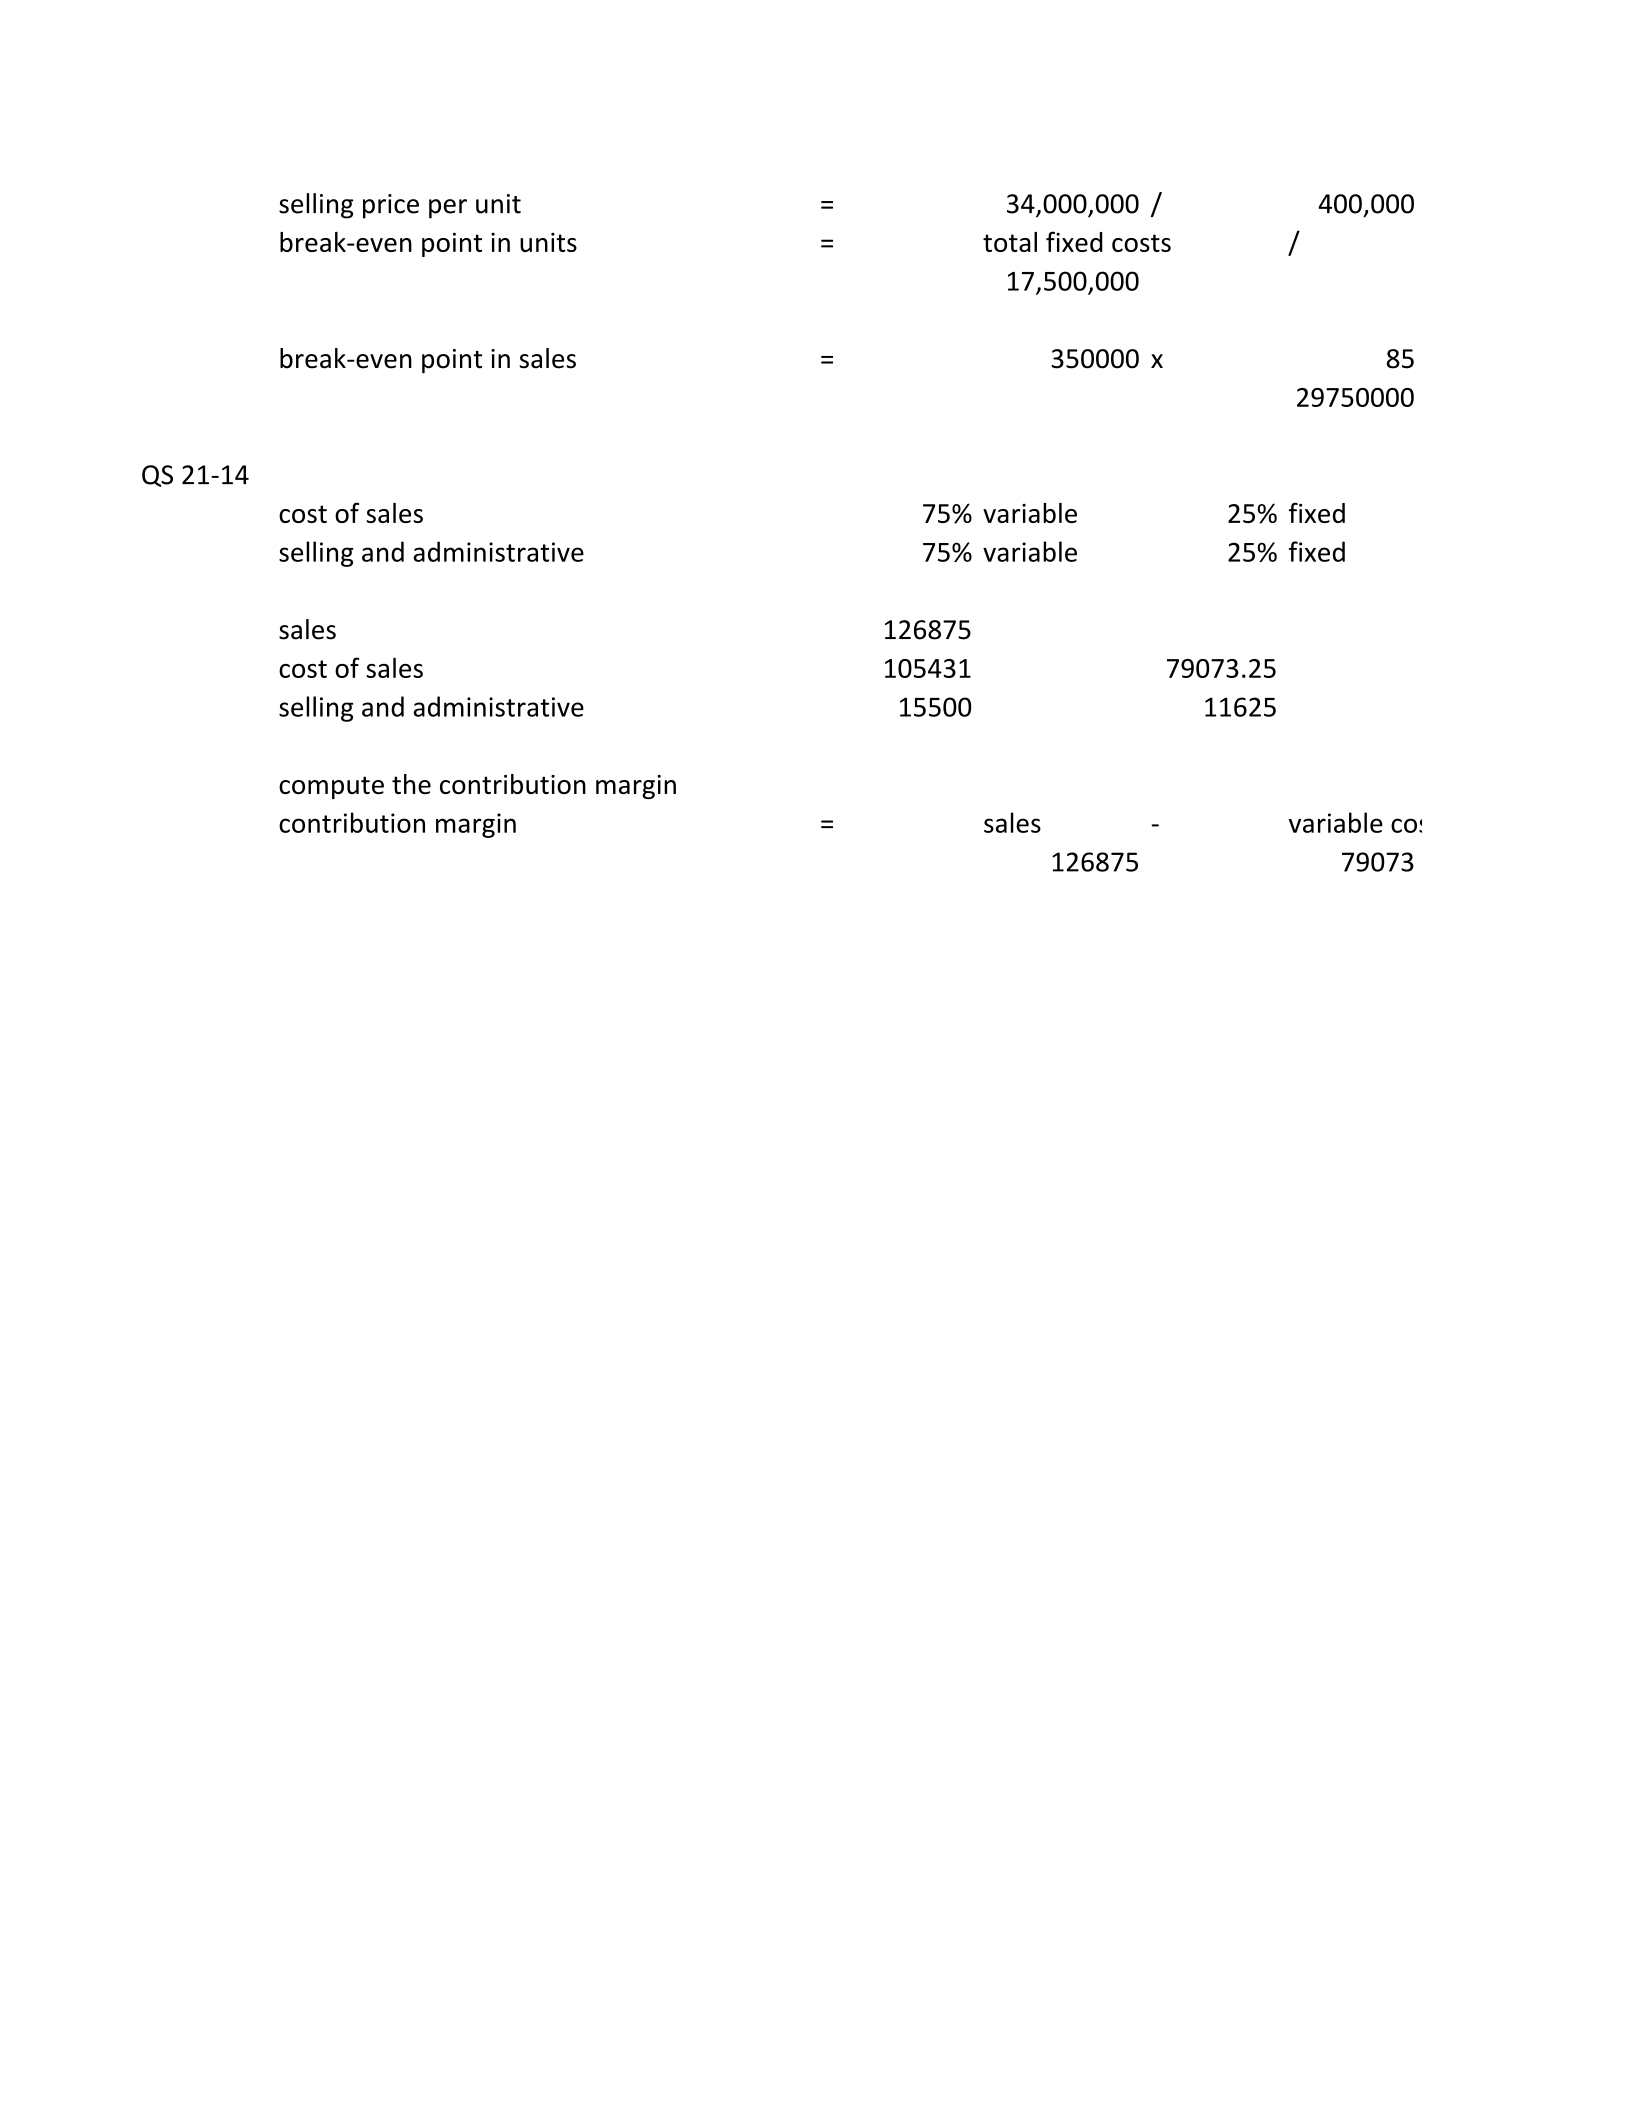
selling price per unit
=
34,000,000
/
400,000
break-even point in units
=
total fixed costs
/
17,500,000
break-even point in sales
=
350000
x
85
29750000
QS 21-14
cost of sales
75%
variable
25%
fixed
selling and administrative
75%
variable
25%
fixed
sales
126875
cost of sales
105431
79073.25
selling and administrative
15500
11625
compute the contribution margin
contribution margin
=
sales
-
variable costs
126875
79073
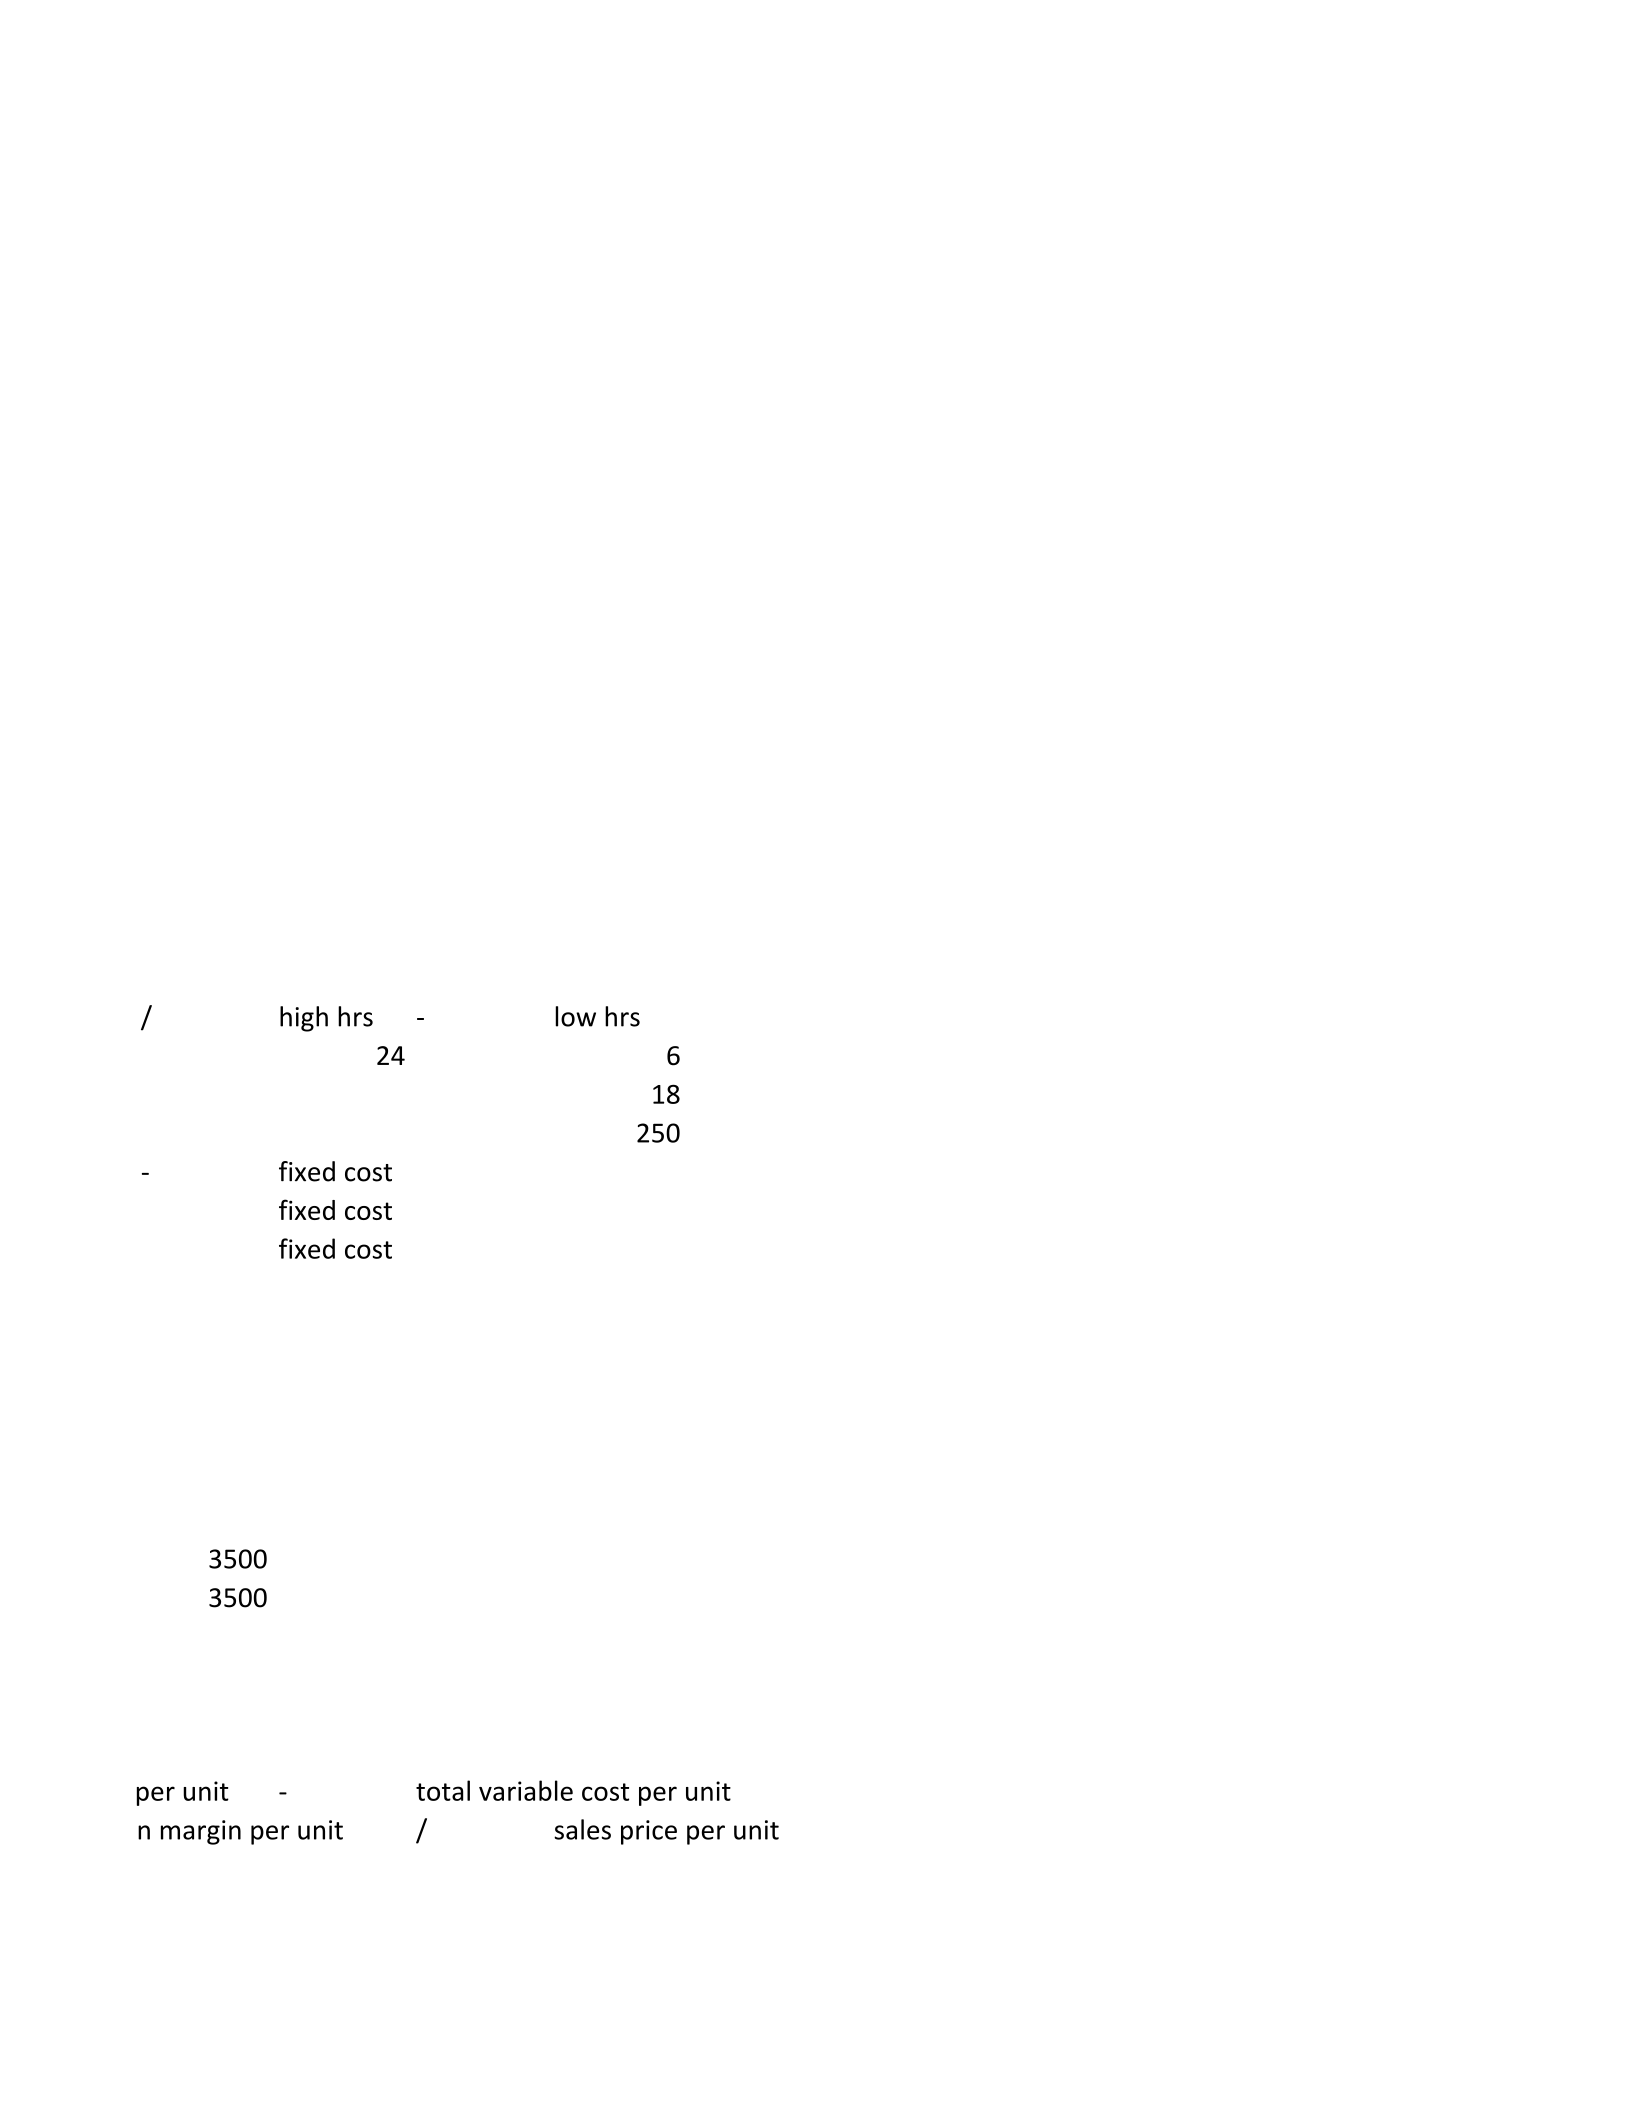
/
high hrs
-
low hrs
24
6
18
250
-
fixed cost
fixed cost
fixed cost
3500
3500
sales price per unit
-
total variable cost per unit
contribution margin per unit
/
sales price per unit
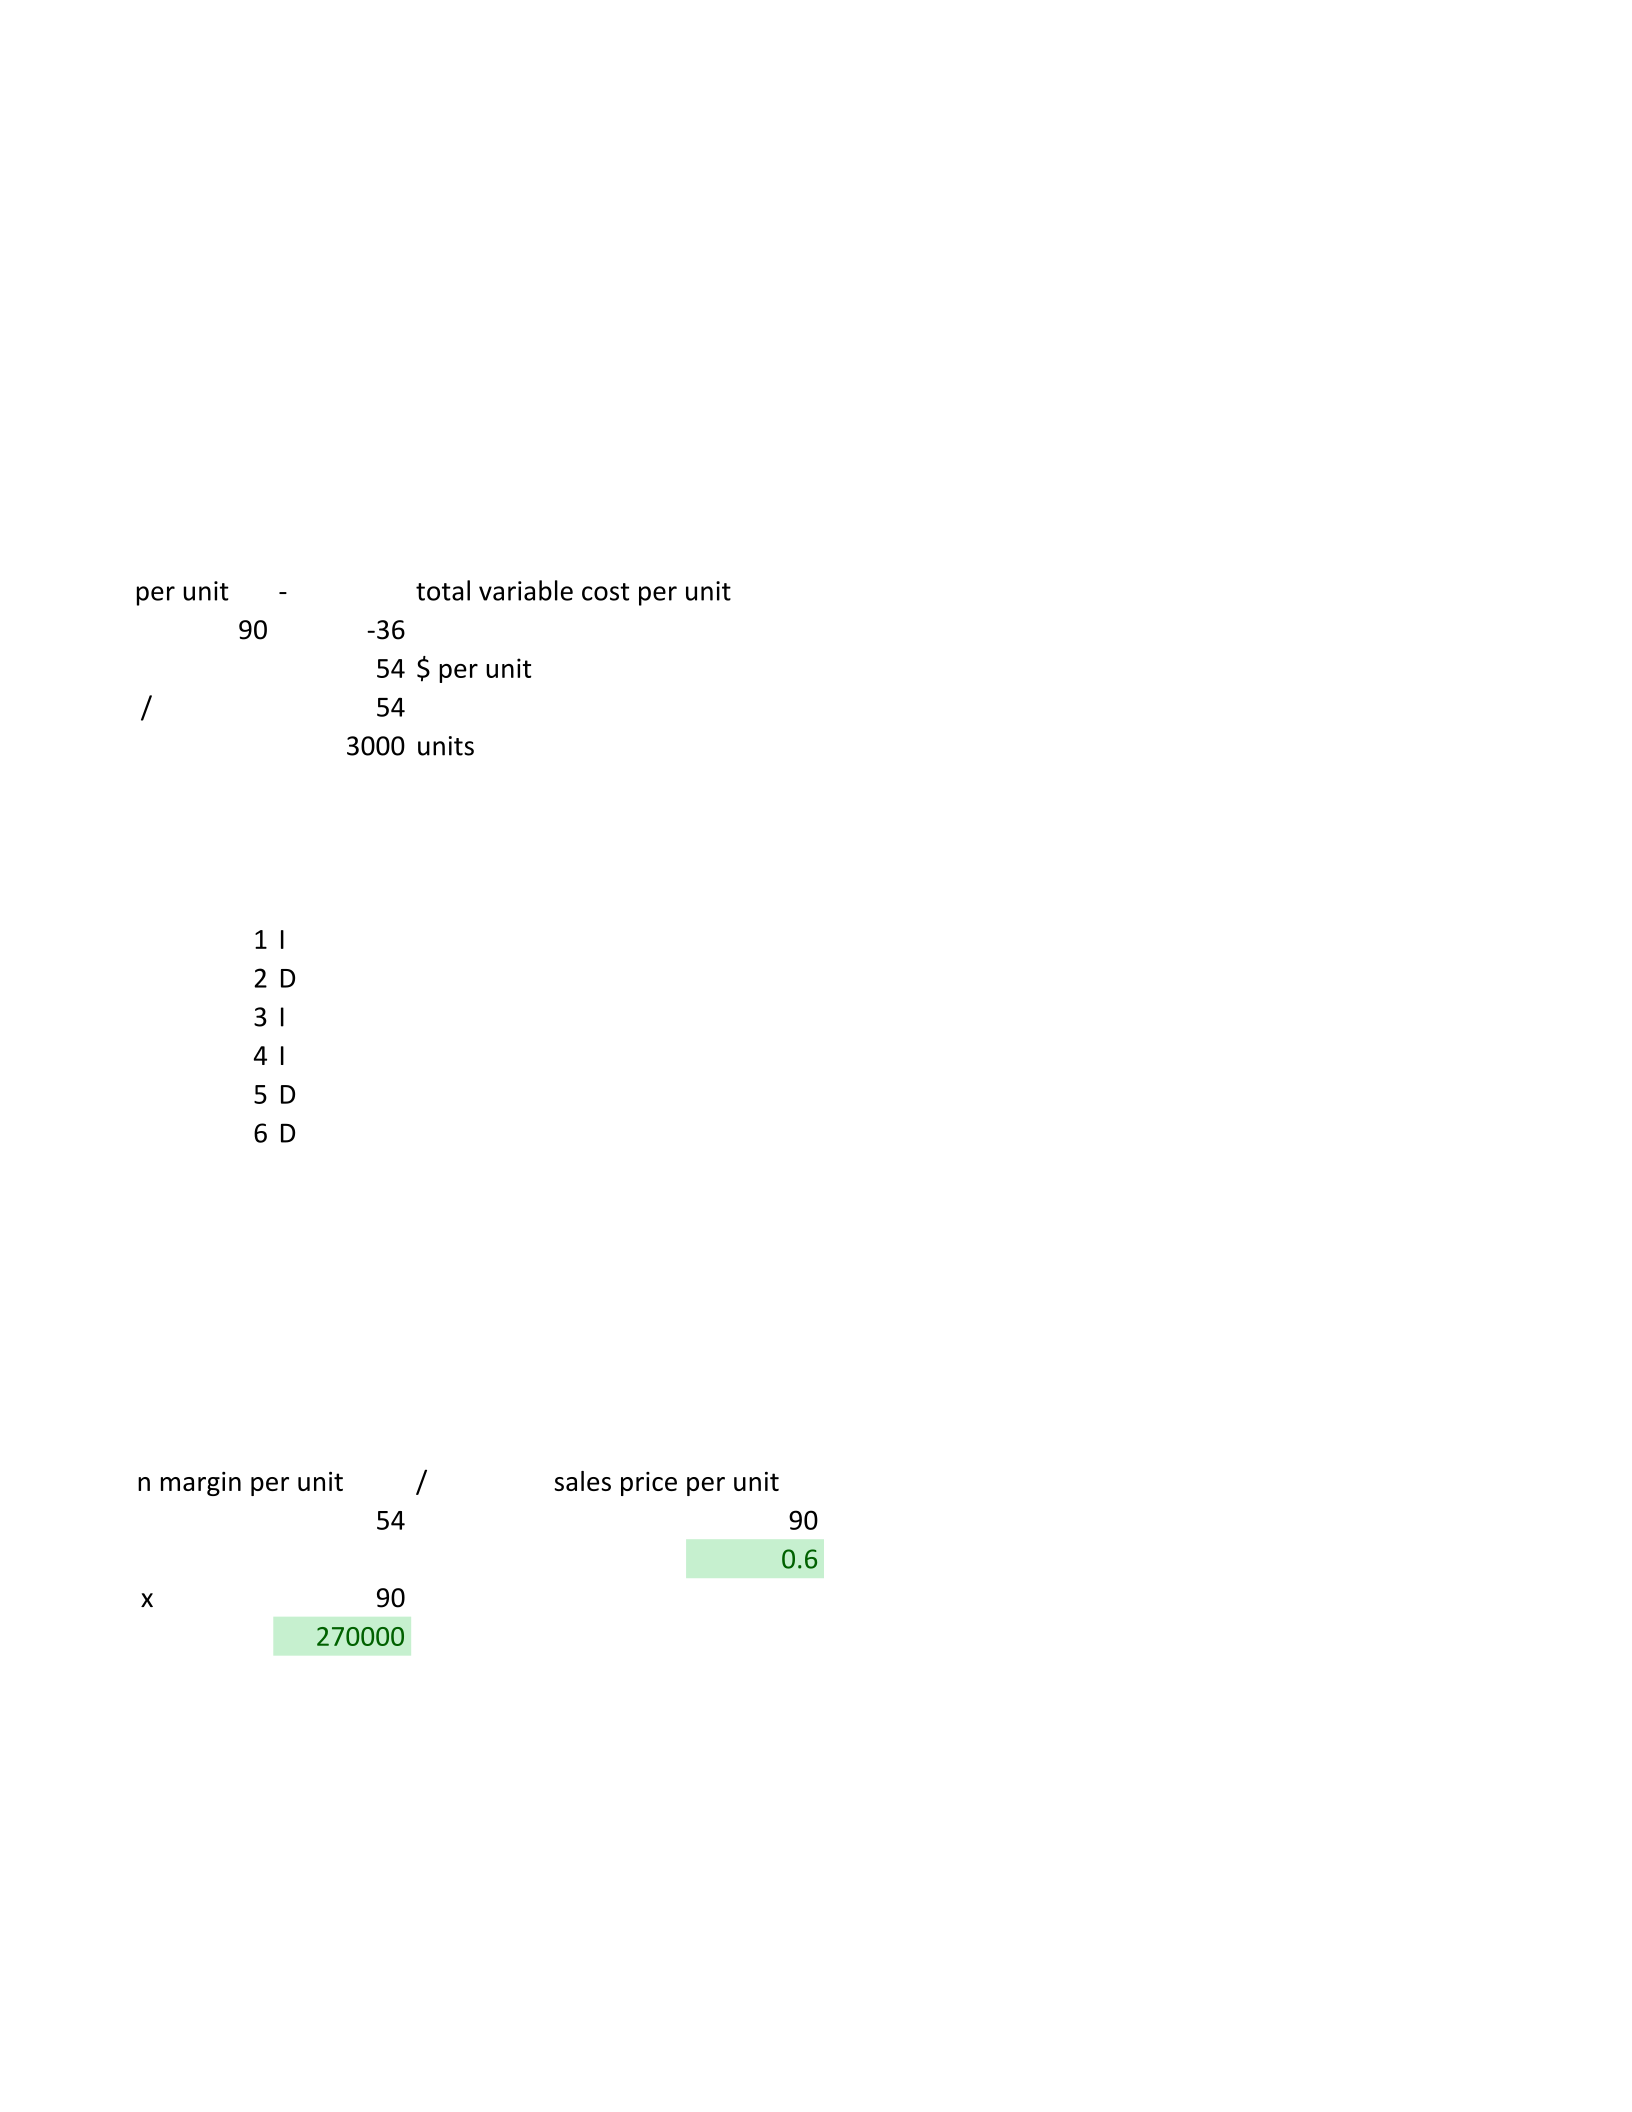
sales price per unit
-
total variable cost per unit
90
-36
54
$ per unit
/
54
3000
units
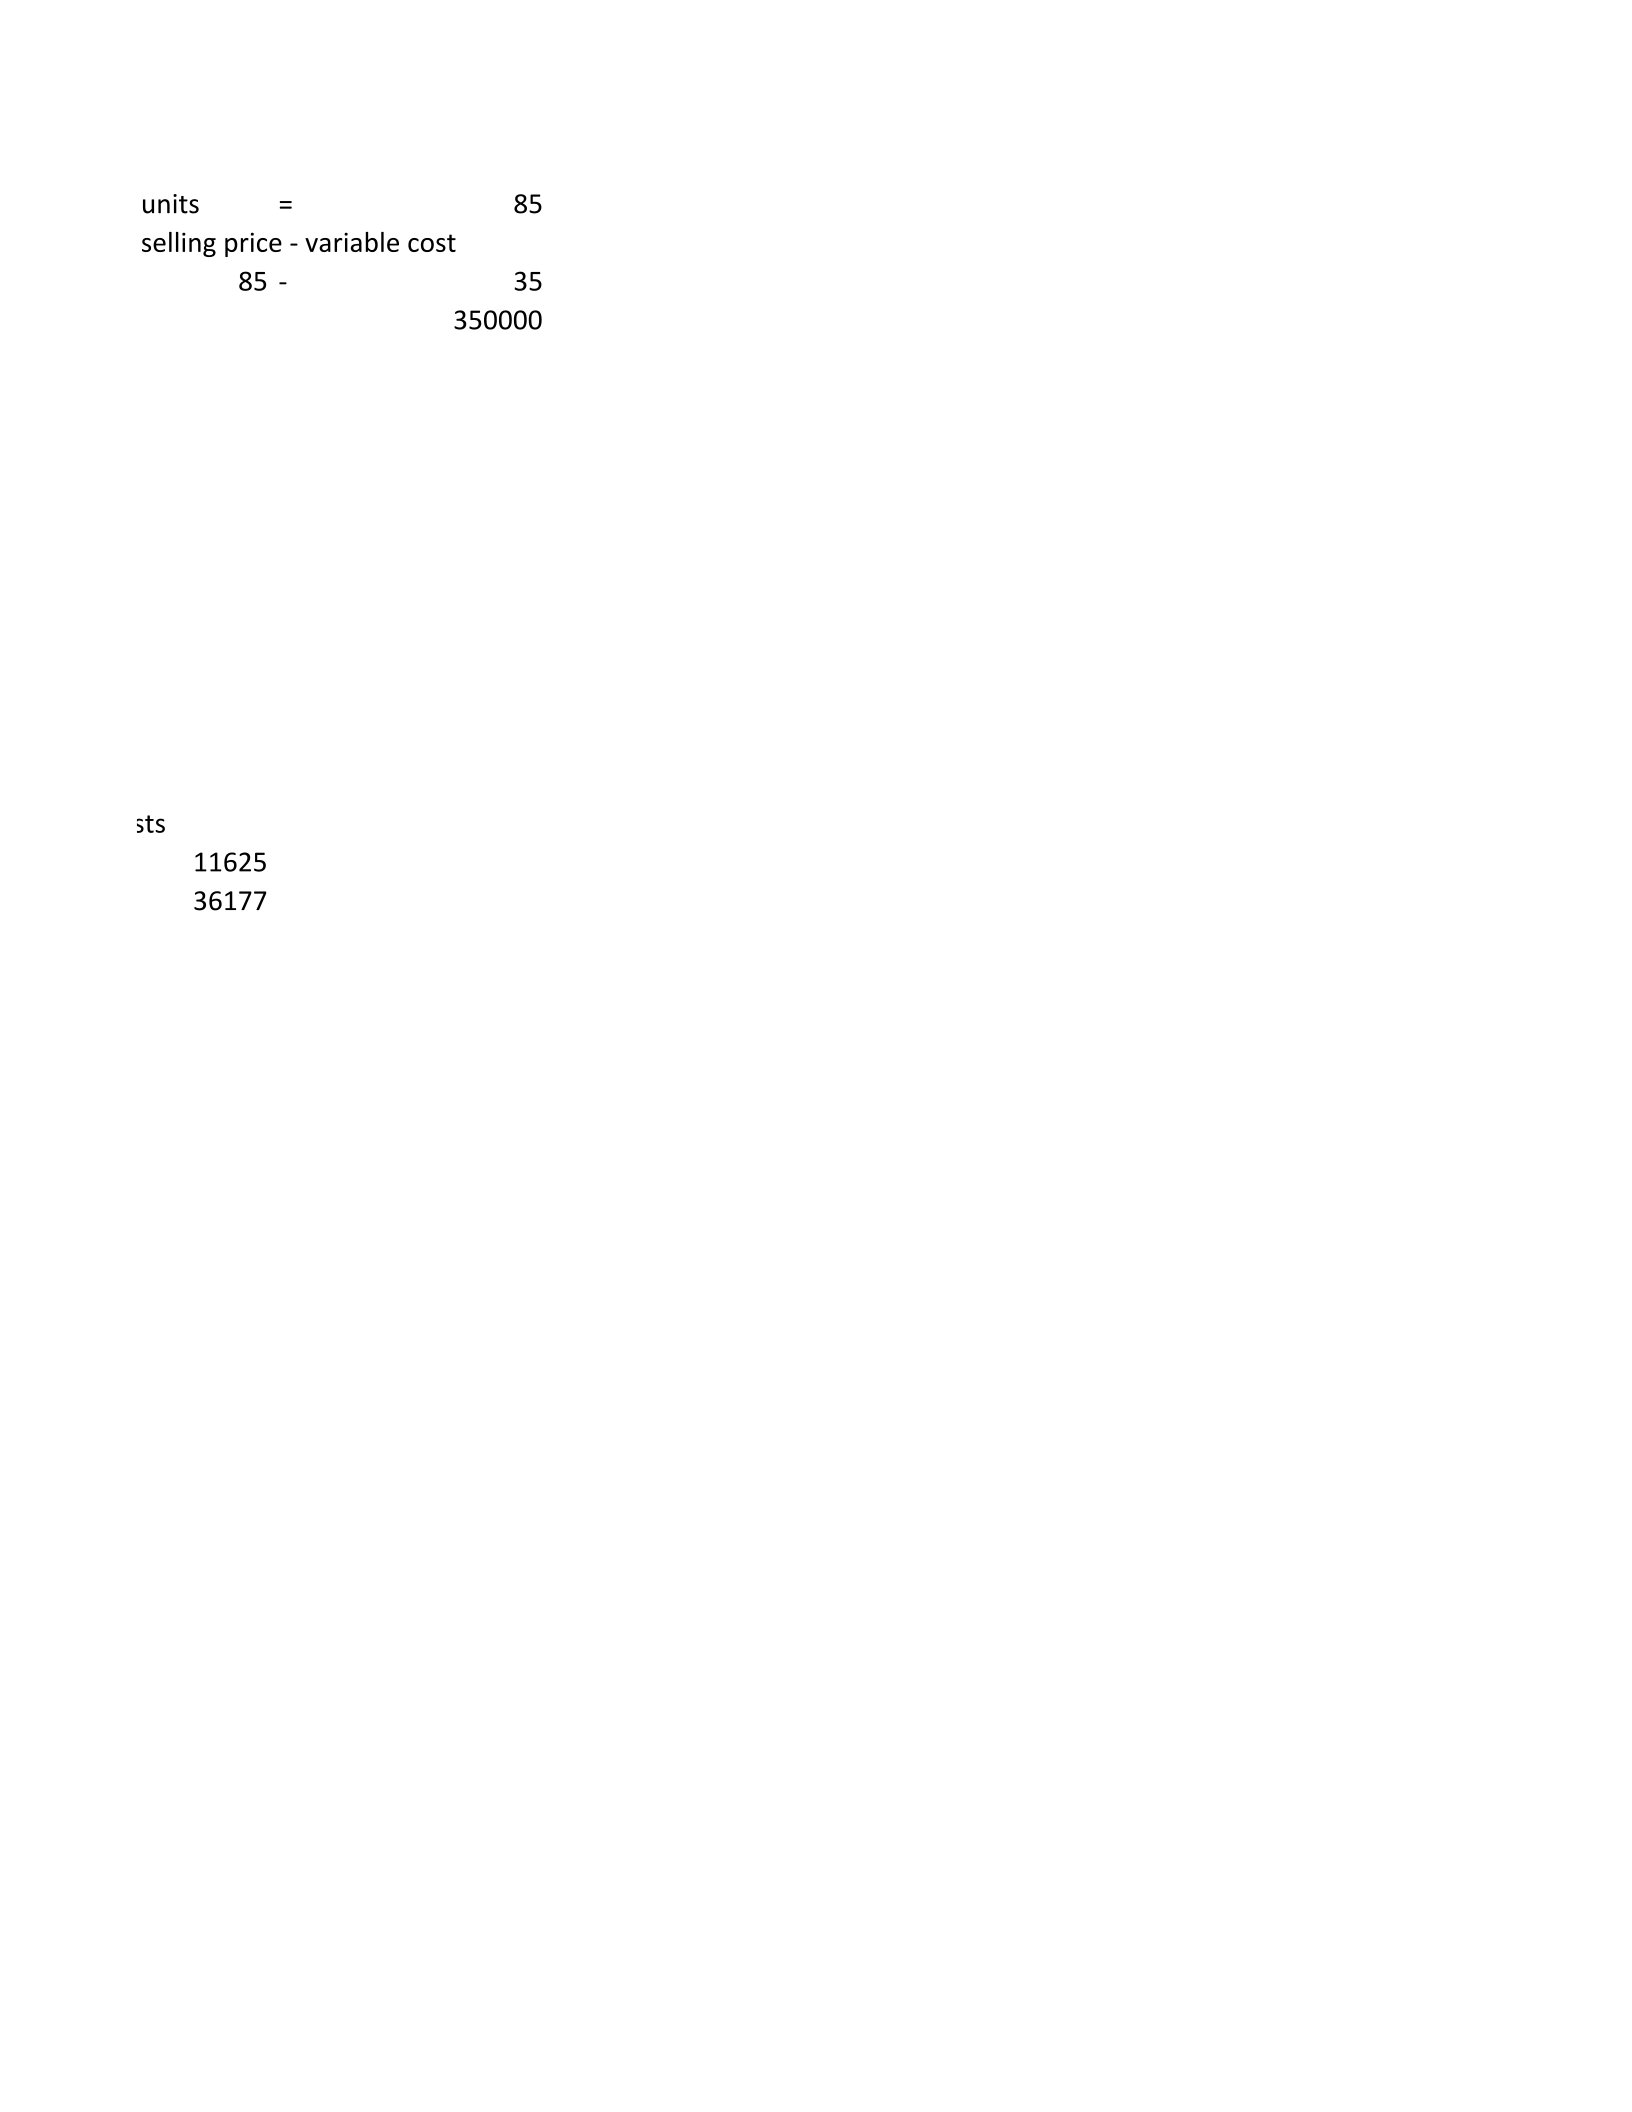
1
I
2
D
3
I
4
I
5
D
6
D
contribution margin per unit
/
sales price per unit
54
90
0.6
x
90
270000
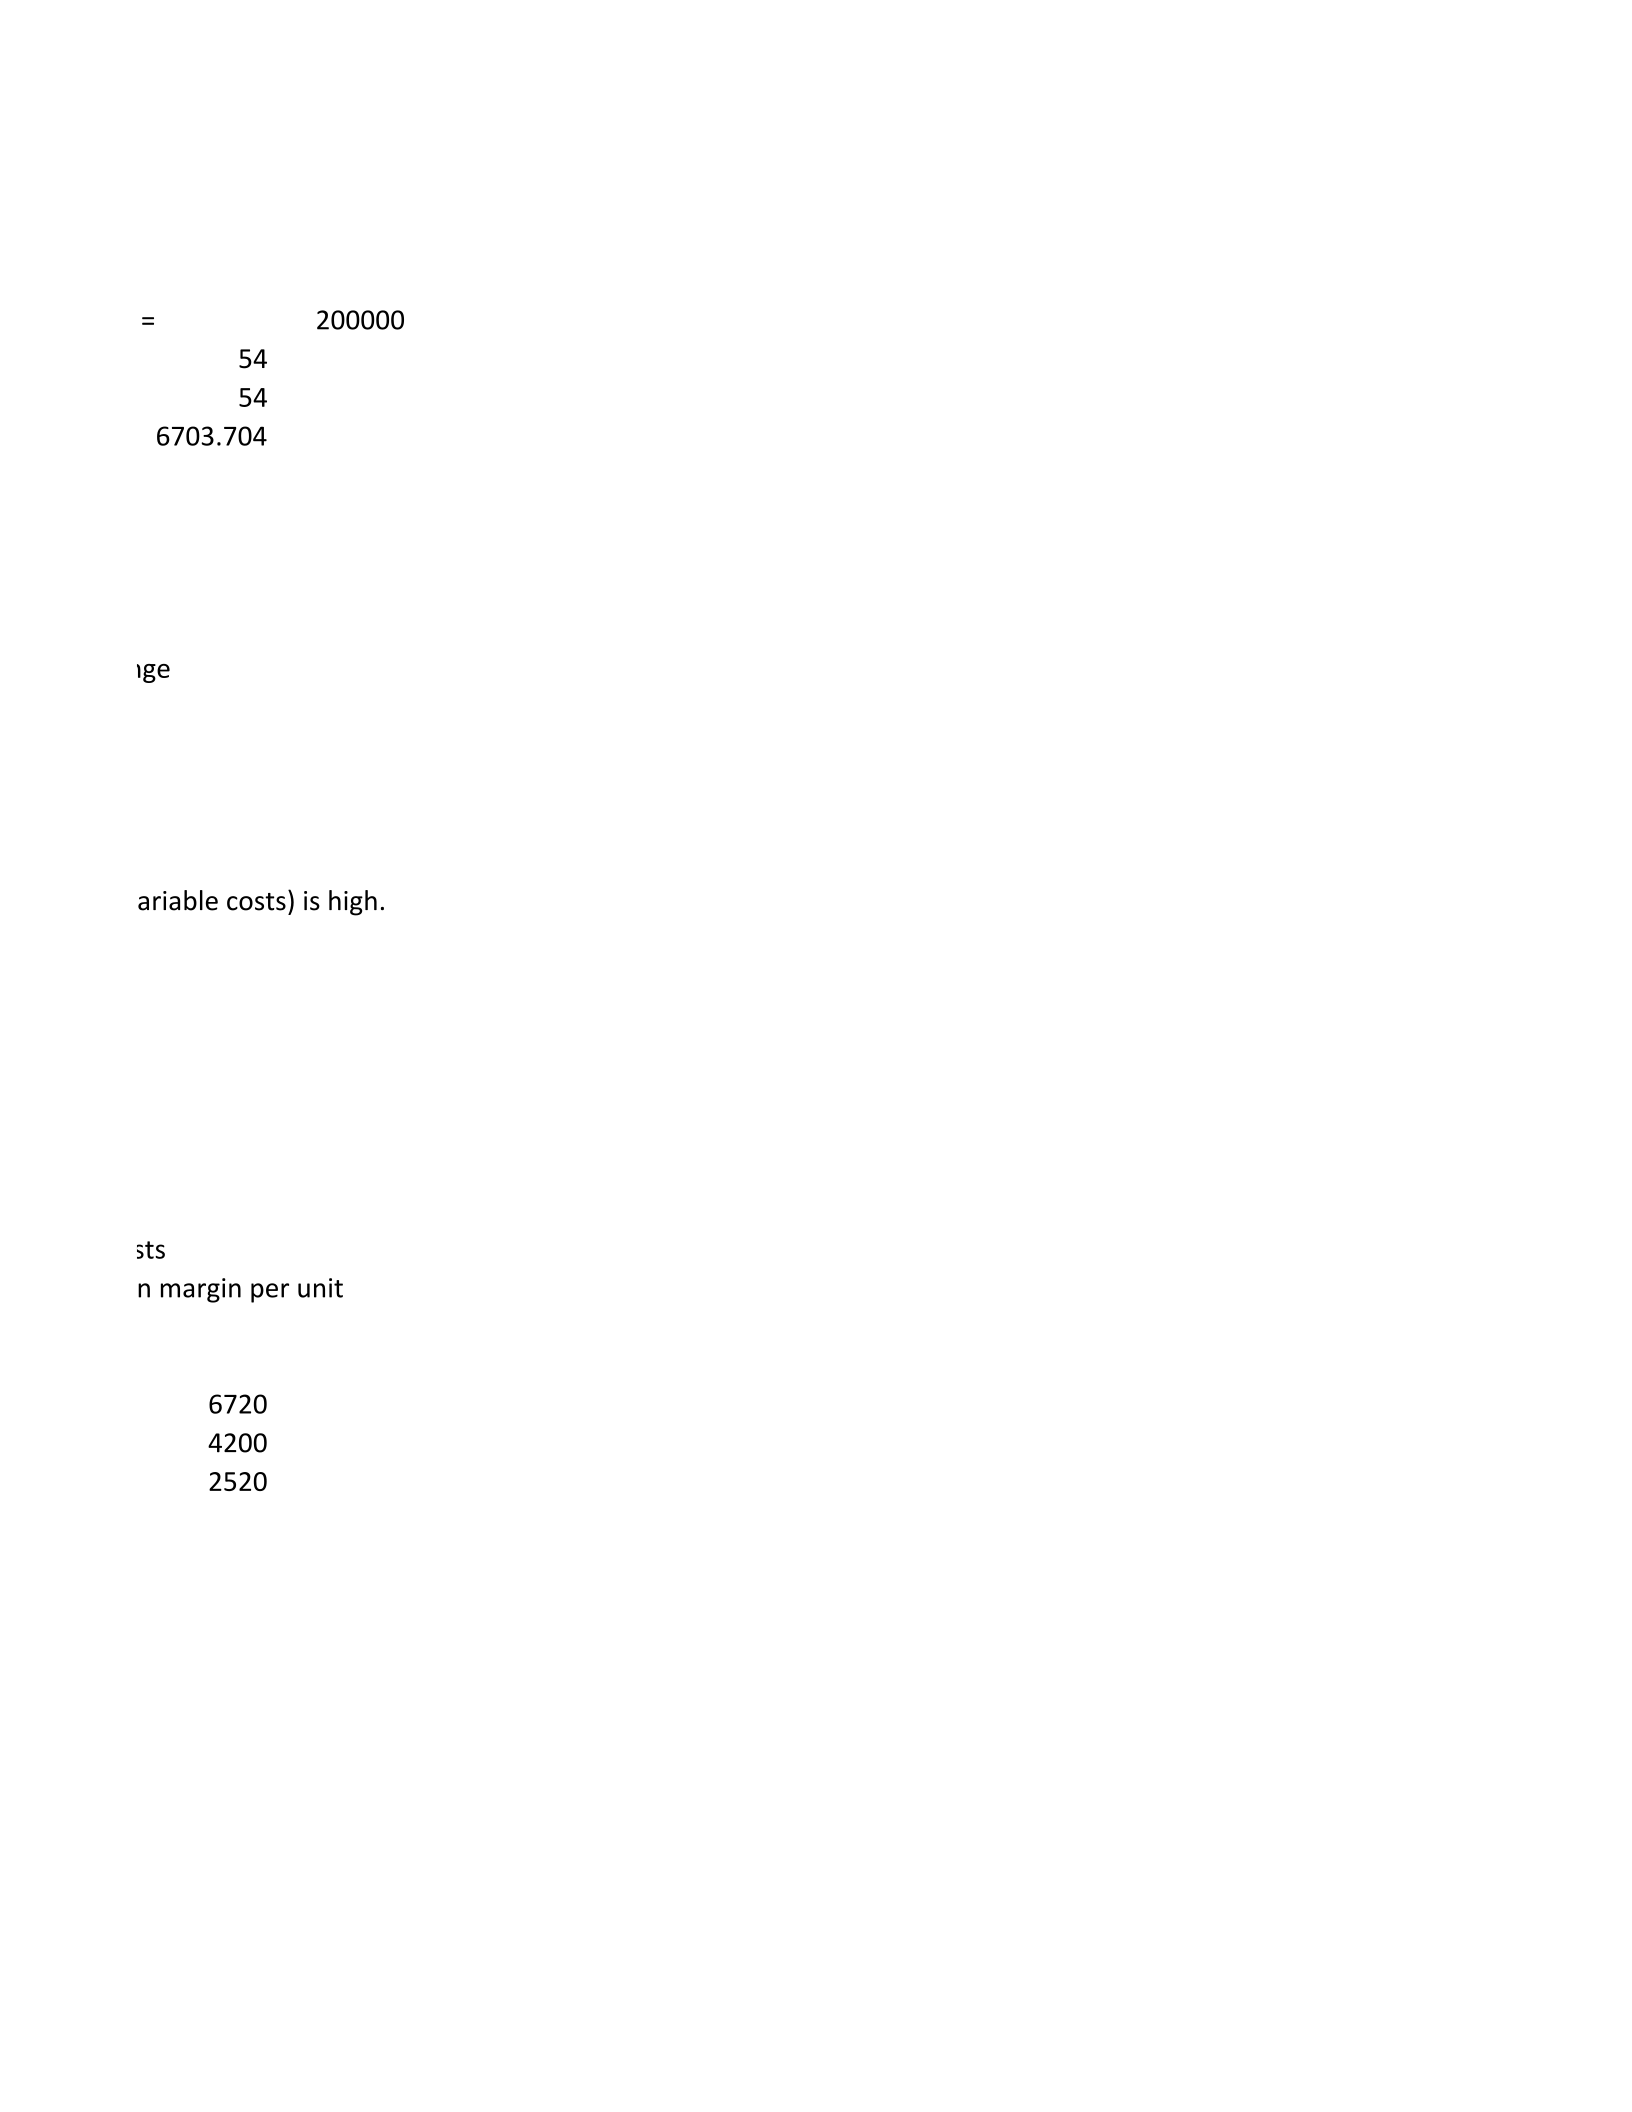
=
200000
54
54
6703.704
all costs have approximately the same relevant range
company b has a higher degree of operating leverage because the contribution margin (sales - variable costs) is high.
variable costs
contribution margin per unit
6720
4200
2520