



According to the theory of revealed preference, what is the best way to measure
consumer preferences?
The best way to measure consumers preferences is to observe their purchasing
behavior.
In what way is using demand functions to measure consumer’s surplus an
example of the revealed preference approach?
The demand curve reveals the consumers preferences, how he trades off income
for various goods.
What are the economic benefits of Glen Canyon Dam?
Storing water to improve the supply of water for irrigation and urban users in the
Lower Basin states, Hydropower generation, flood control.
What is wrong with the practice – followed by federal agencies in the 1950s – of
measuring the benefits for people who visit national parks by the expenditures
made by those visitors to those parks?
The expenditures by people who visit the site or the cost of developing the site,
generates a meaningful measure of the net benefit of the site.
Why did people think that no demand function to visit national parks could be
observed if there was zero charge to enter national parks?
Price is 0, no price variation.
How did Hotelling come to think that there would be sufficient price variation to
estimate a demand function to visit a national park? What generated the price
variation?
1
ASSIGNMENT VALUATION USING THE TRAVEL COST METHOD

They were not captured by the park but they set price on visiting the park, if price
could be measured and correlated with frequency of visitation, one would obtain
a demand function for visiting the park.
What are the components of the cost to a person to visit a national park?
Cost of transportation to get to the site, Entrance fee to get into the site
Why is this method of valuation called the travel cost method? Is it because a
visitor’s cost of traveling to the site measures the value of the site to the visitor?
Because the existence of a cost to travel to the site, and the fact that it varies
based on the location of the visitors and the site, creates a variation in price that
makes it possible to estimate a visitors demand function for the site.
What is the difference between the approach to estimating a demand function for
visits to a national park that uses zonal data versus the approach that uses
individual data with regard to where the data is collected?
With zonal approach you interview people arriving at destination and ask them
where they came from today and have they been here previously in the past 12
months.
With individual data, you need to survey people in their homes, by mail, phone or
internet.
What is wrong with the following demand curve?
2
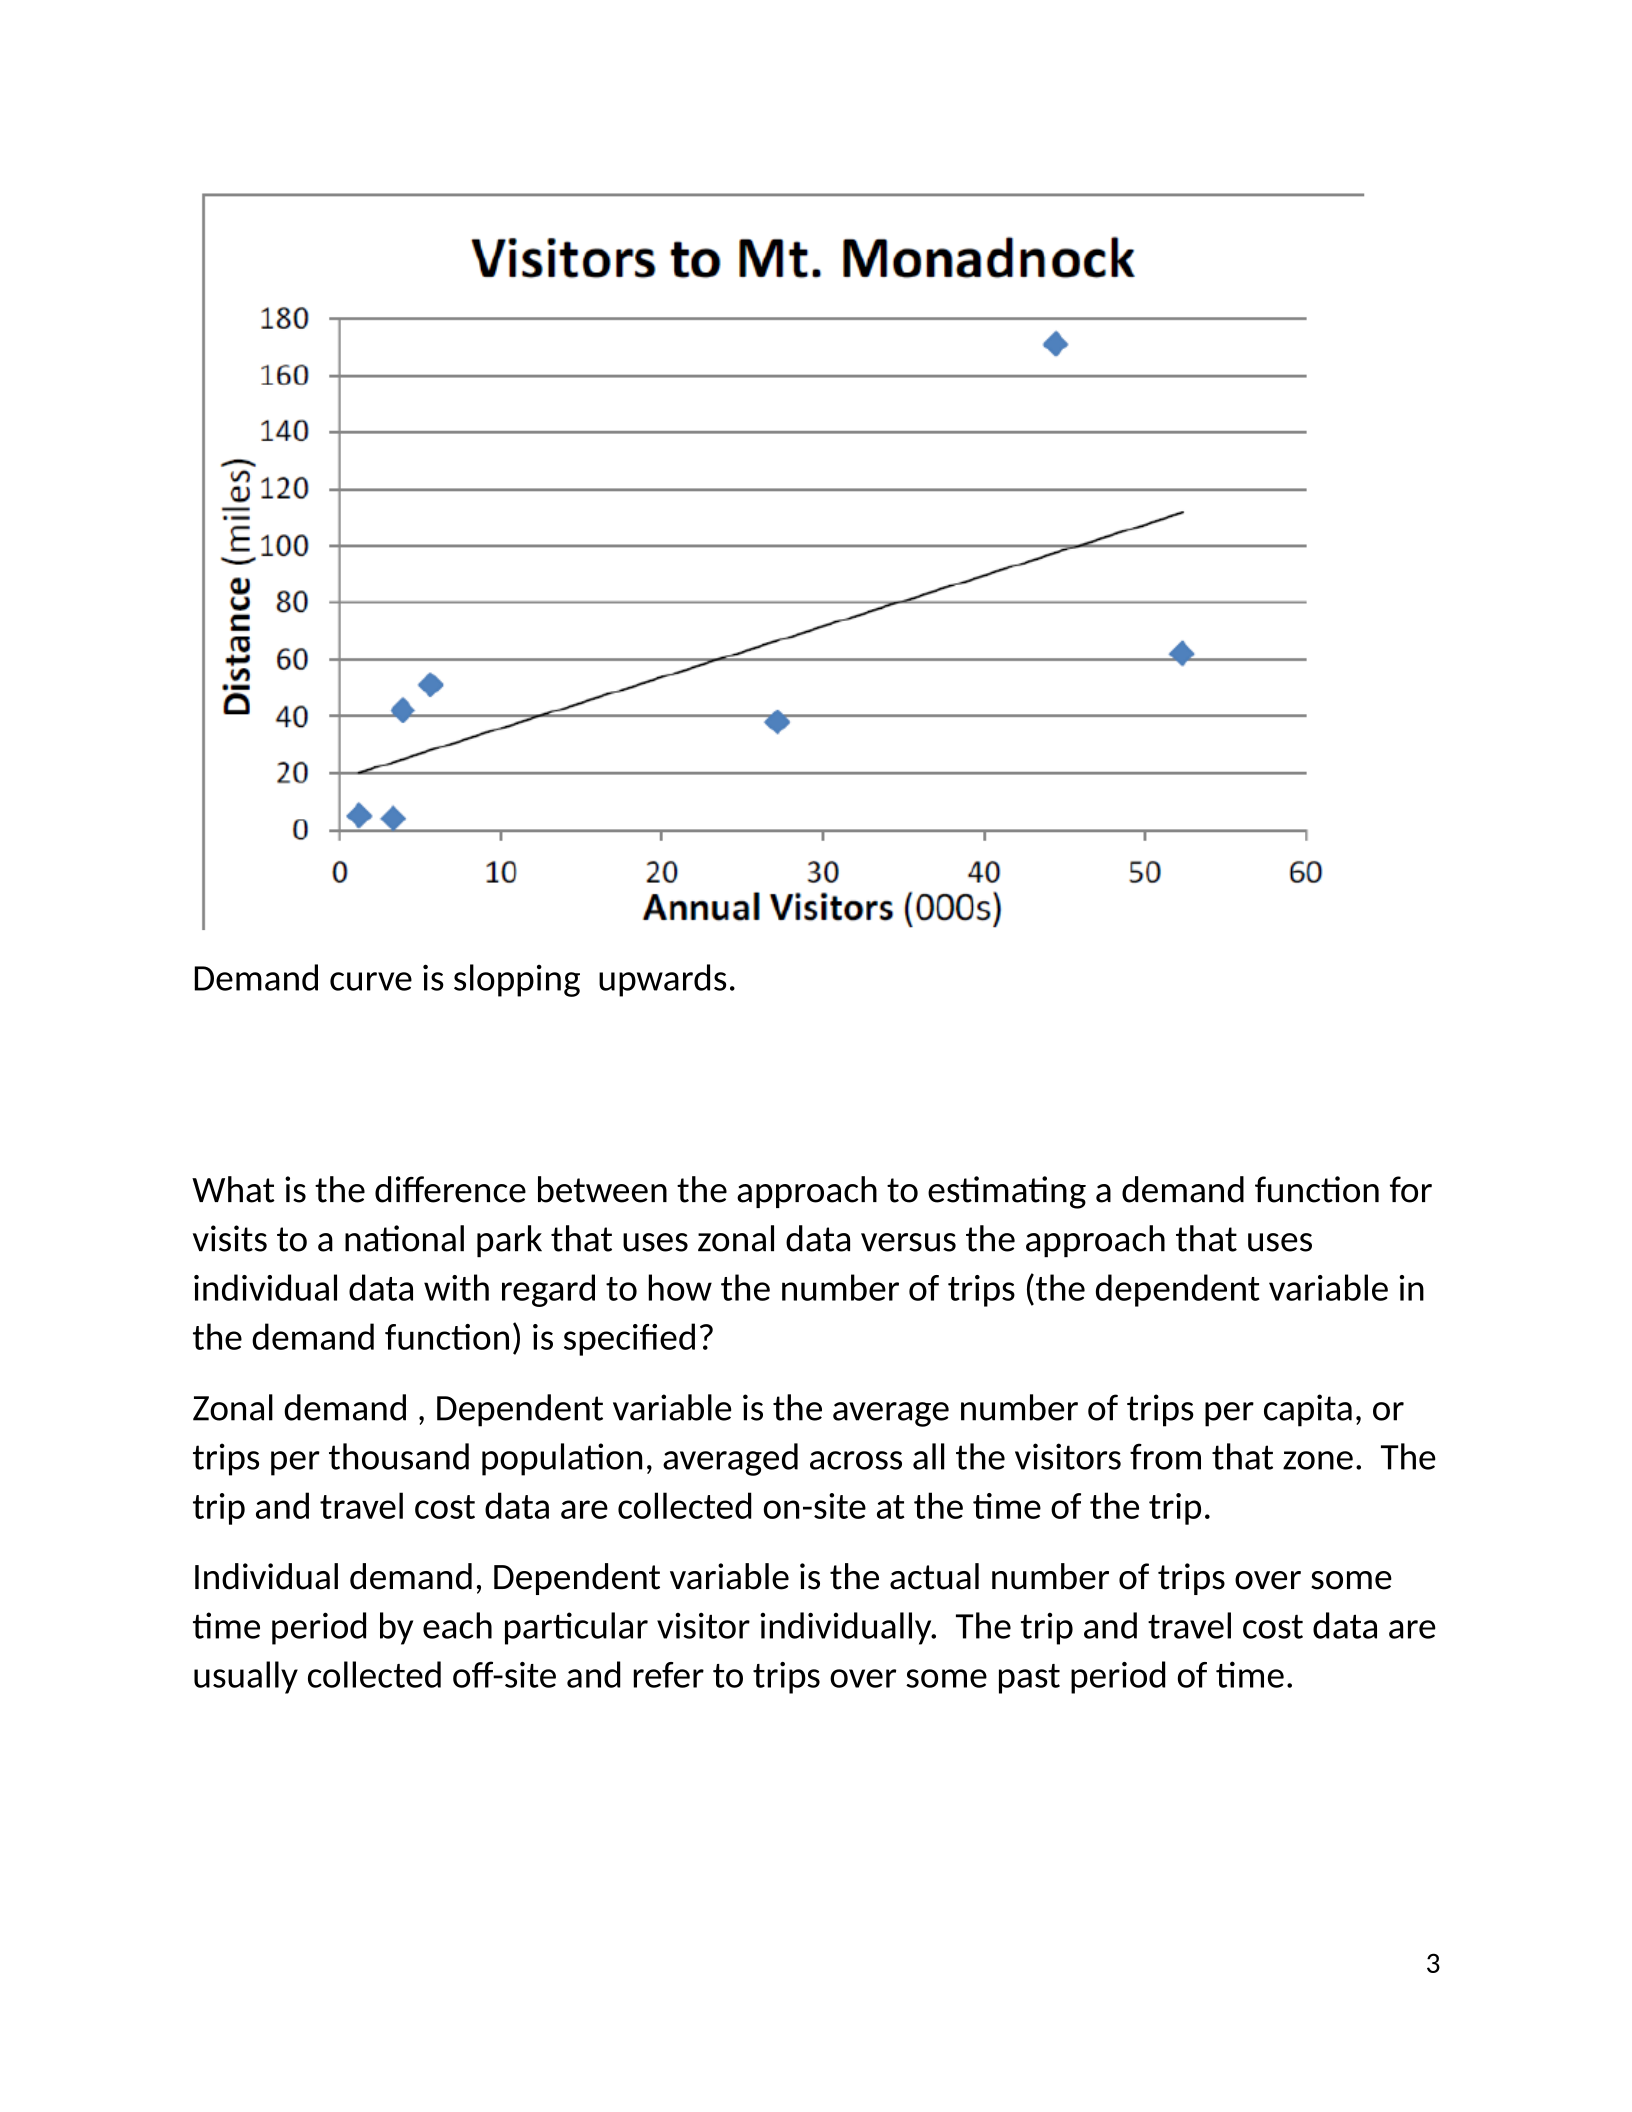
Demand curve is slopping upwards.
What is the difference between the approach to estimating a demand function for
visits to a national park that uses zonal data versus the approach that uses
individual data with regard to how the number of trips (the dependent variable in
the demand function) is specified?
Zonal demand , Dependent variable is the average number of trips per capita, or
trips per thousand population, averaged across all the visitors from that zone. The
trip and travel cost data are collected on-site at the time of the trip.
Individual demand, Dependent variable is the actual number of trips over some
time period by each particular visitor individually. The trip and travel cost data are
usually collected off-site and refer to trips over some past period of time.
3
If visitors come to a national park from three different origin zones, how does this
influence how you calculate the overall consumer’s surplus obtained from that
national park?
You identify all different people who visits the site, from their demand functions
you calculate each persons consumer surplus, you aggregate these consumers
surplus quantities across all visitors.
If you are assessing a proposal to create a new recreation site which would
compete with several existing recreation sites, what is the key economic factor
that determines the net benefit that would be generated by opening up the new
site?
In the simplest case, you assume that there is no difference in the quality of the
new site or in the visitor experience at the new site compared to the existing sites.
Then, the only benefit could be a closer distance to where visitors live and a lower
travel cost to the new site.
Given the following data on the travel cost to three recreation sites from three
towns in Arizona, who visits site A, who visits site B, and who visits site C?
People in Alpha visit Site B
People in Beta visit Site C
4
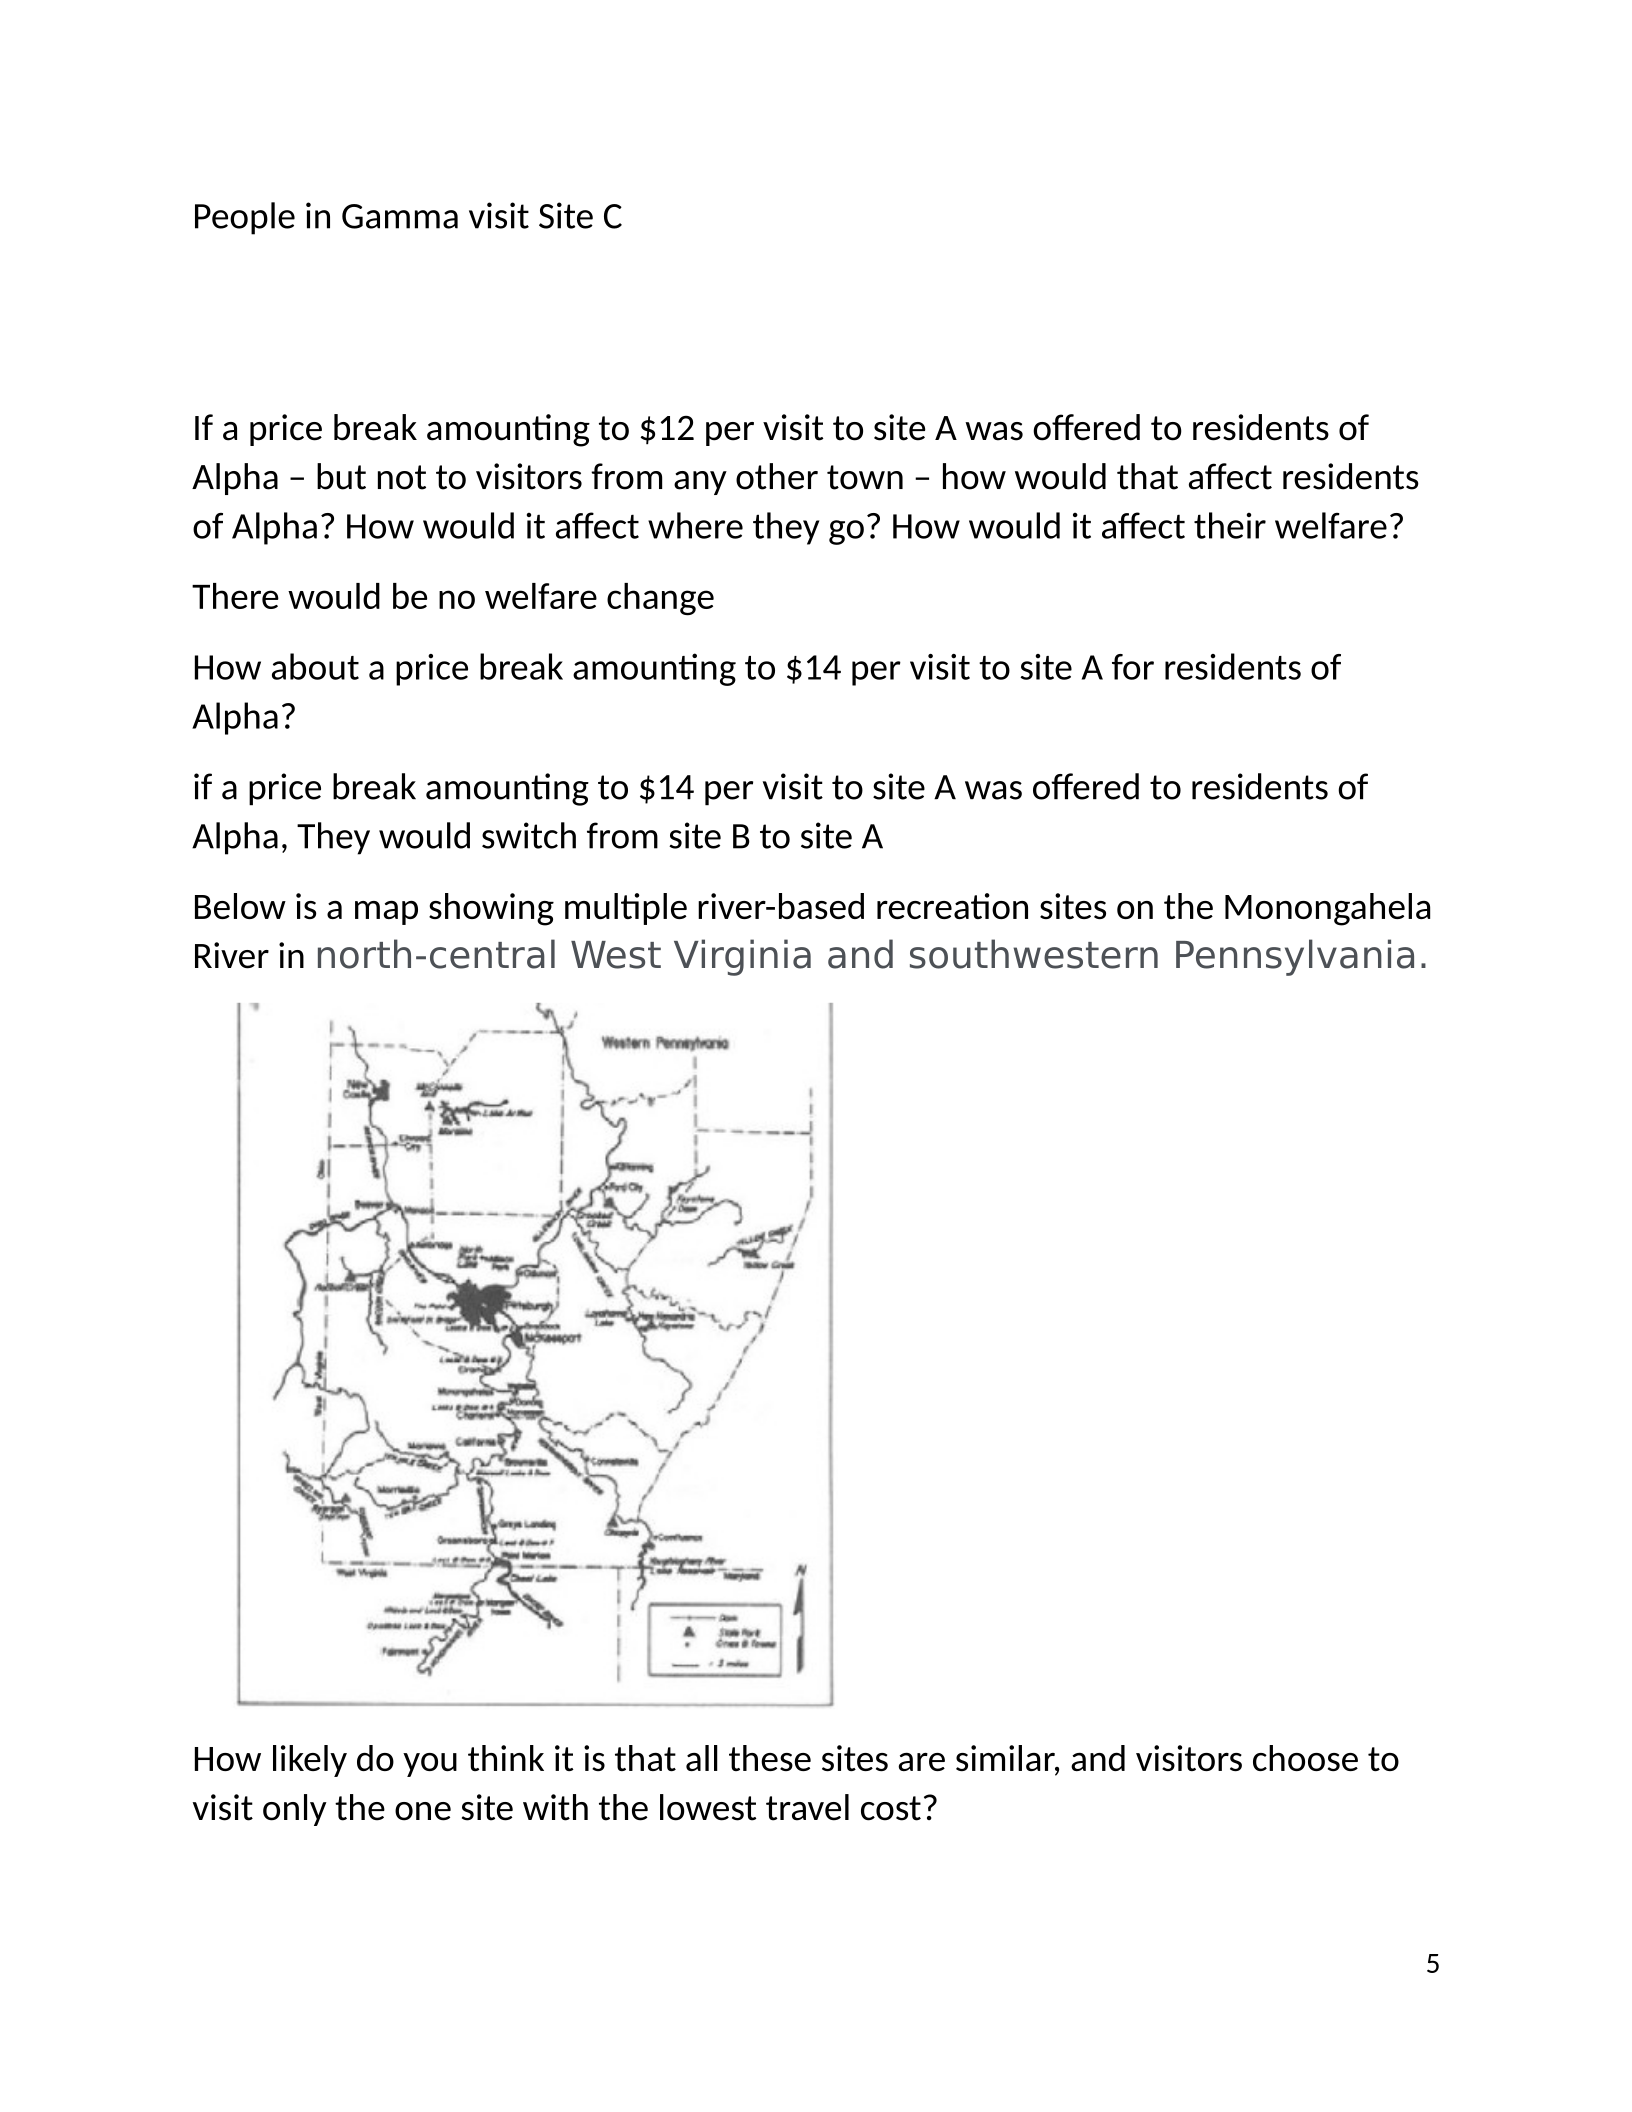
People in Gamma visit Site C
If a price break amounting to $12 per visit to site A was offered to residents of
Alpha – but not to visitors from any other town – how would that affect residents
of Alpha? How would it affect where they go? How would it affect their welfare?
There would be no welfare change
How about a price break amounting to $14 per visit to site A for residents of
Alpha?
if a price break amounting to $14 per visit to site A was offered to residents of
Alpha, They would switch from site B to site A
Below is a map showing multiple river-based recreation sites on the Monongahela
River in north-central West Virginia and southwestern Pennsylvania.
How likely do you think it is that all these sites are similar, and visitors choose to
visit only the one site with the lowest travel cost?
5

Most people visit more than one site over the course of the year, They may not
visit the site with the lowest cost at all. Most people care a lot about site quality
If you are analyzing the demand functions for several sites and you believe these
sites differ significantly in their quality and attractiveness, how does this affect
your research plan?
you need to estimate demand functions that include quality attributes as well as
price and income.
What information do you need in order to calculate the economic benefit of an
improvement in the quality of a recreation site?
You need to know how the consumer demand shifts in response to the
improvement in site quality. You then calculate the increase in consumer’s surplus.
What is the difference between the first approach to formulating a demand
function that incorporates site quality and the second approach?
First approach: Estimate a common demand function across all sites, expressing
the demand for a site as a function of its price and its quality characteristics.
Second approach: Estimate a separate demand function for each site individually
where the regression coefficients in the demand function are allowed to be
different for different sites.
What is the statistical problem that arises when implementing the second
approach?
Problem is that most people don’t visit many sites, so there are corner solution
outcomes.
What factors accounted for the difference in estimates of beach attendance lost in
1990 during the Huntington Beach oil spill between the State of California (the
plaintiff) and the tanker company (the defendant)?
6
The defendants assumed that more of the people who showed up near the beach
after the spill were recreation on the beach rather than coming to look at the
clean up.
How was data collected in the subsequent Southern California Beach Valuation
study? What data was collected.
The data was collected by recruiting a sample of the area’s population to keep a
monthly diary of what beach trips they made each week of the month.
Of the two approaches to incorporating site quality in a demand model for beach
site visits, which approach was adopted in the Southern California Beach
Valuation study?
The second approach was implemented, estimating a demand system for each
week’s demand to visit each site.
7
Powered by TCPDF (www.tcpdf.org)

