


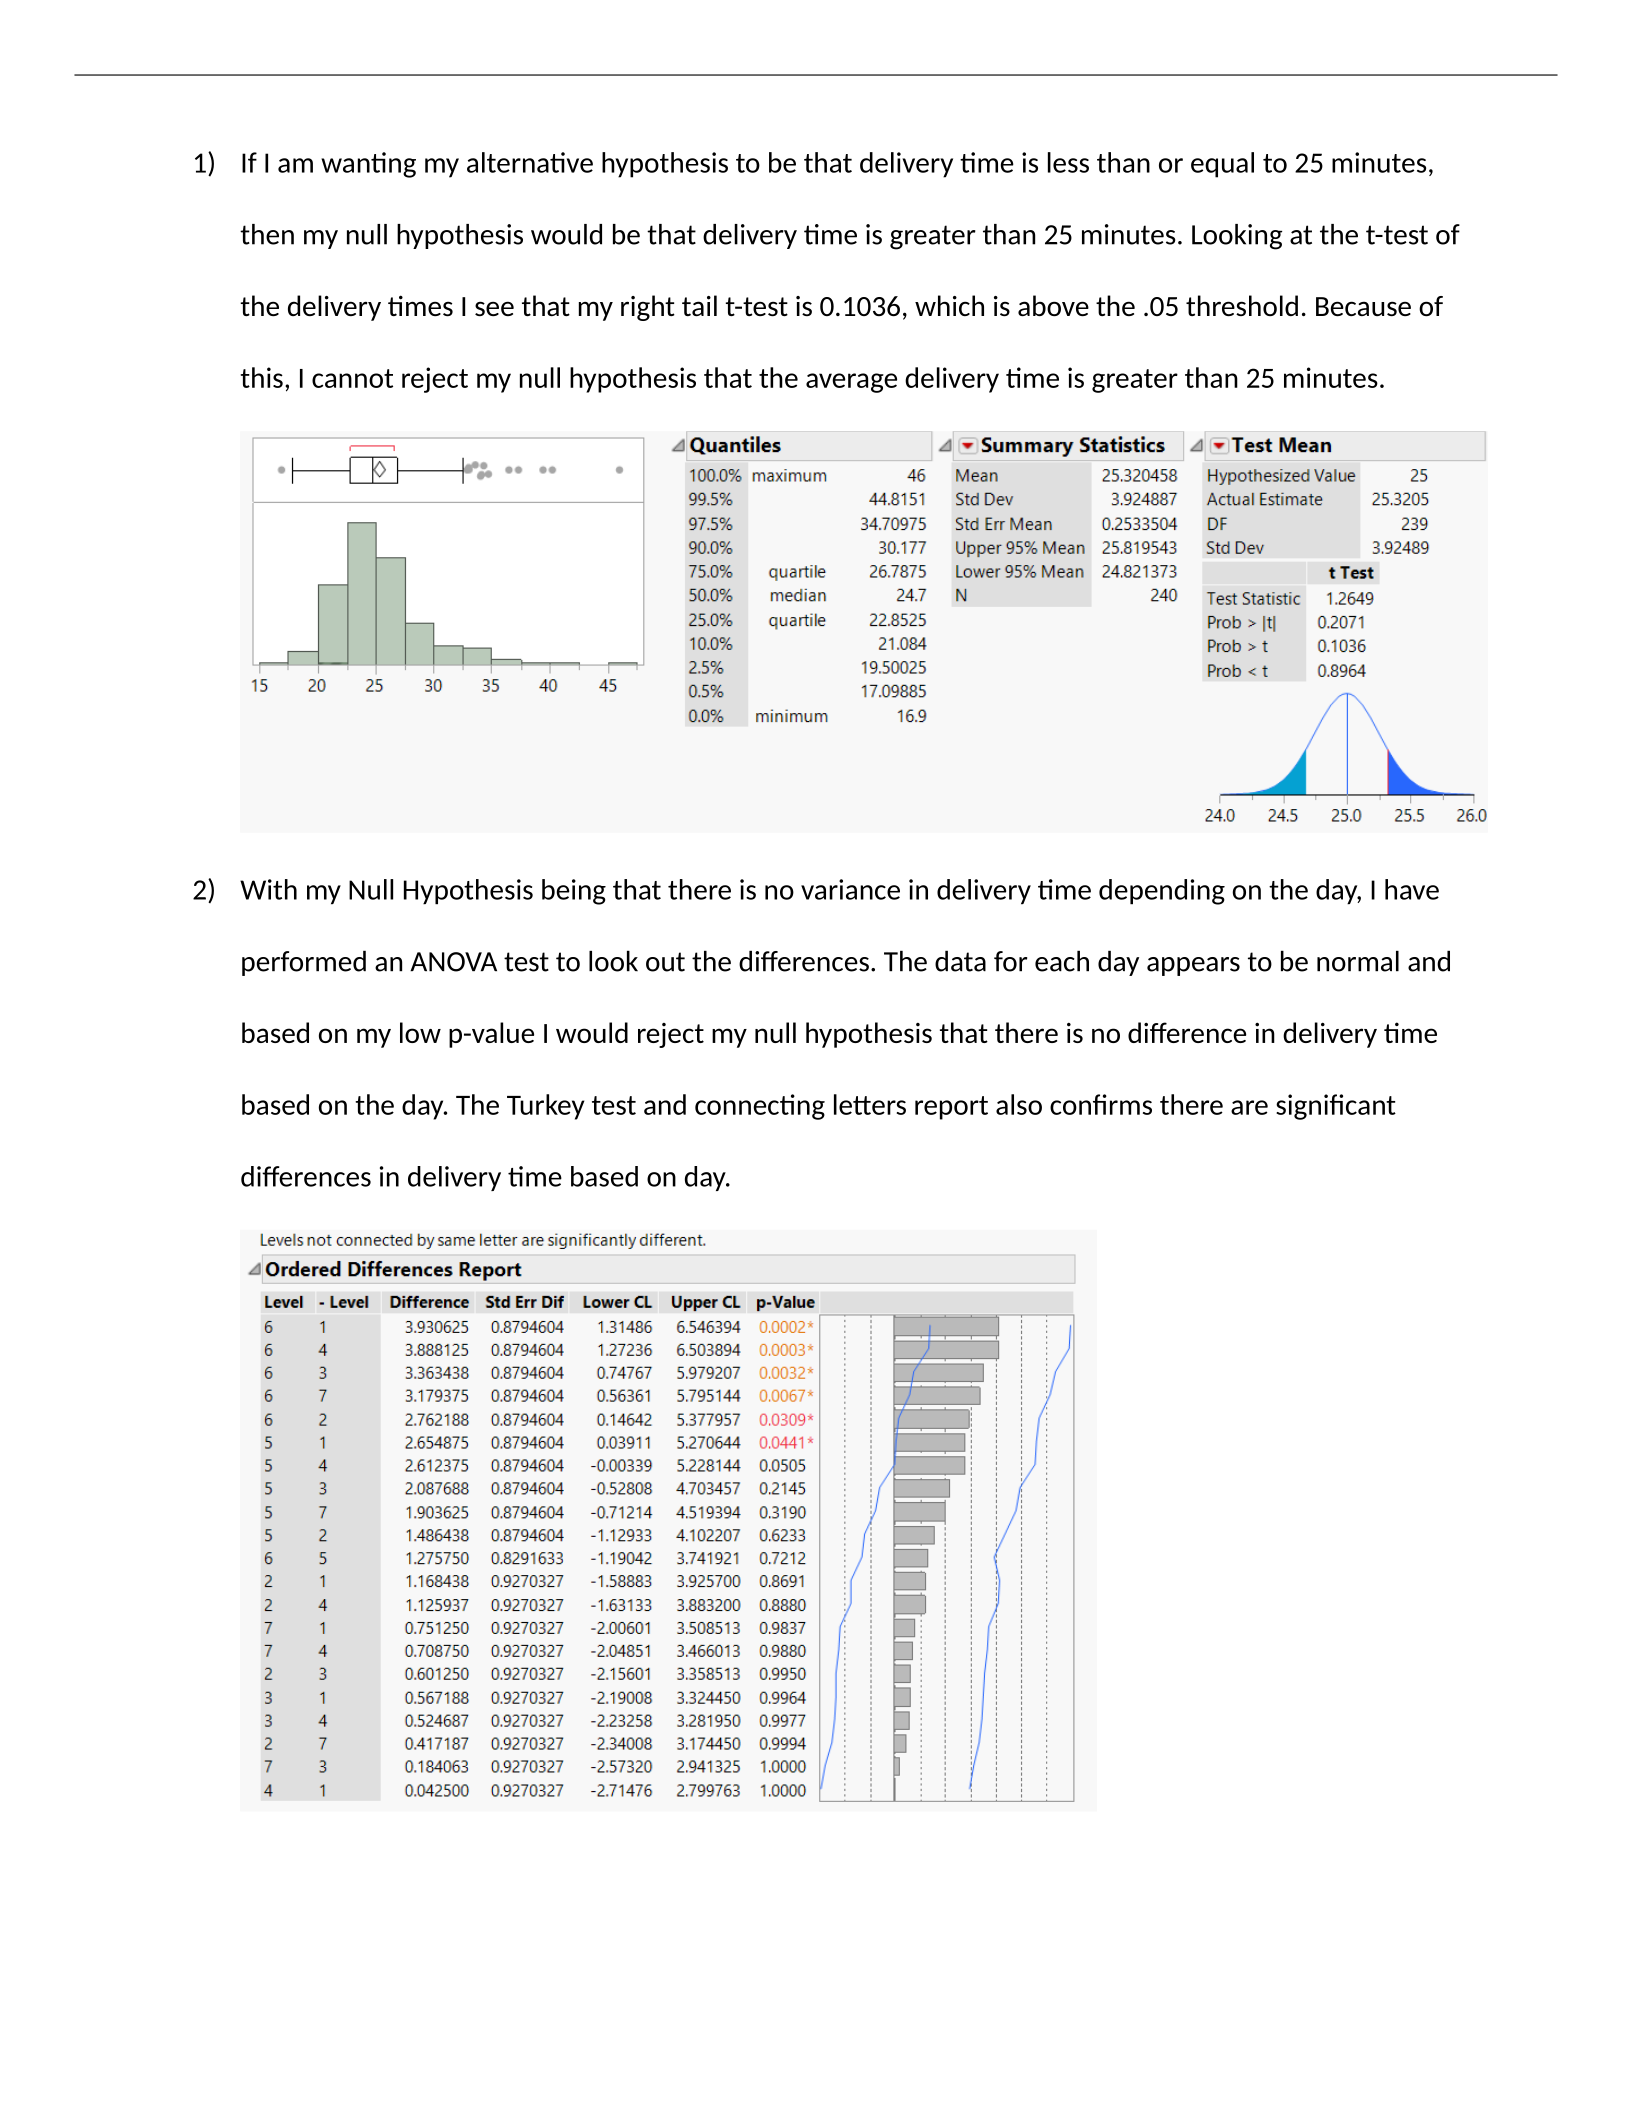
1) If I am wanting my alternative hypothesis to be that delivery time is less than or equal to 25 minutes,
then my null hypothesis would be that delivery time is greater than 25 minutes. Looking at the t-test of
the delivery times I see that my right tail t-test is 0.1036, which is above the .05 threshold. Because of
this, I cannot reject my null hypothesis that the average delivery time is greater than 25 minutes.
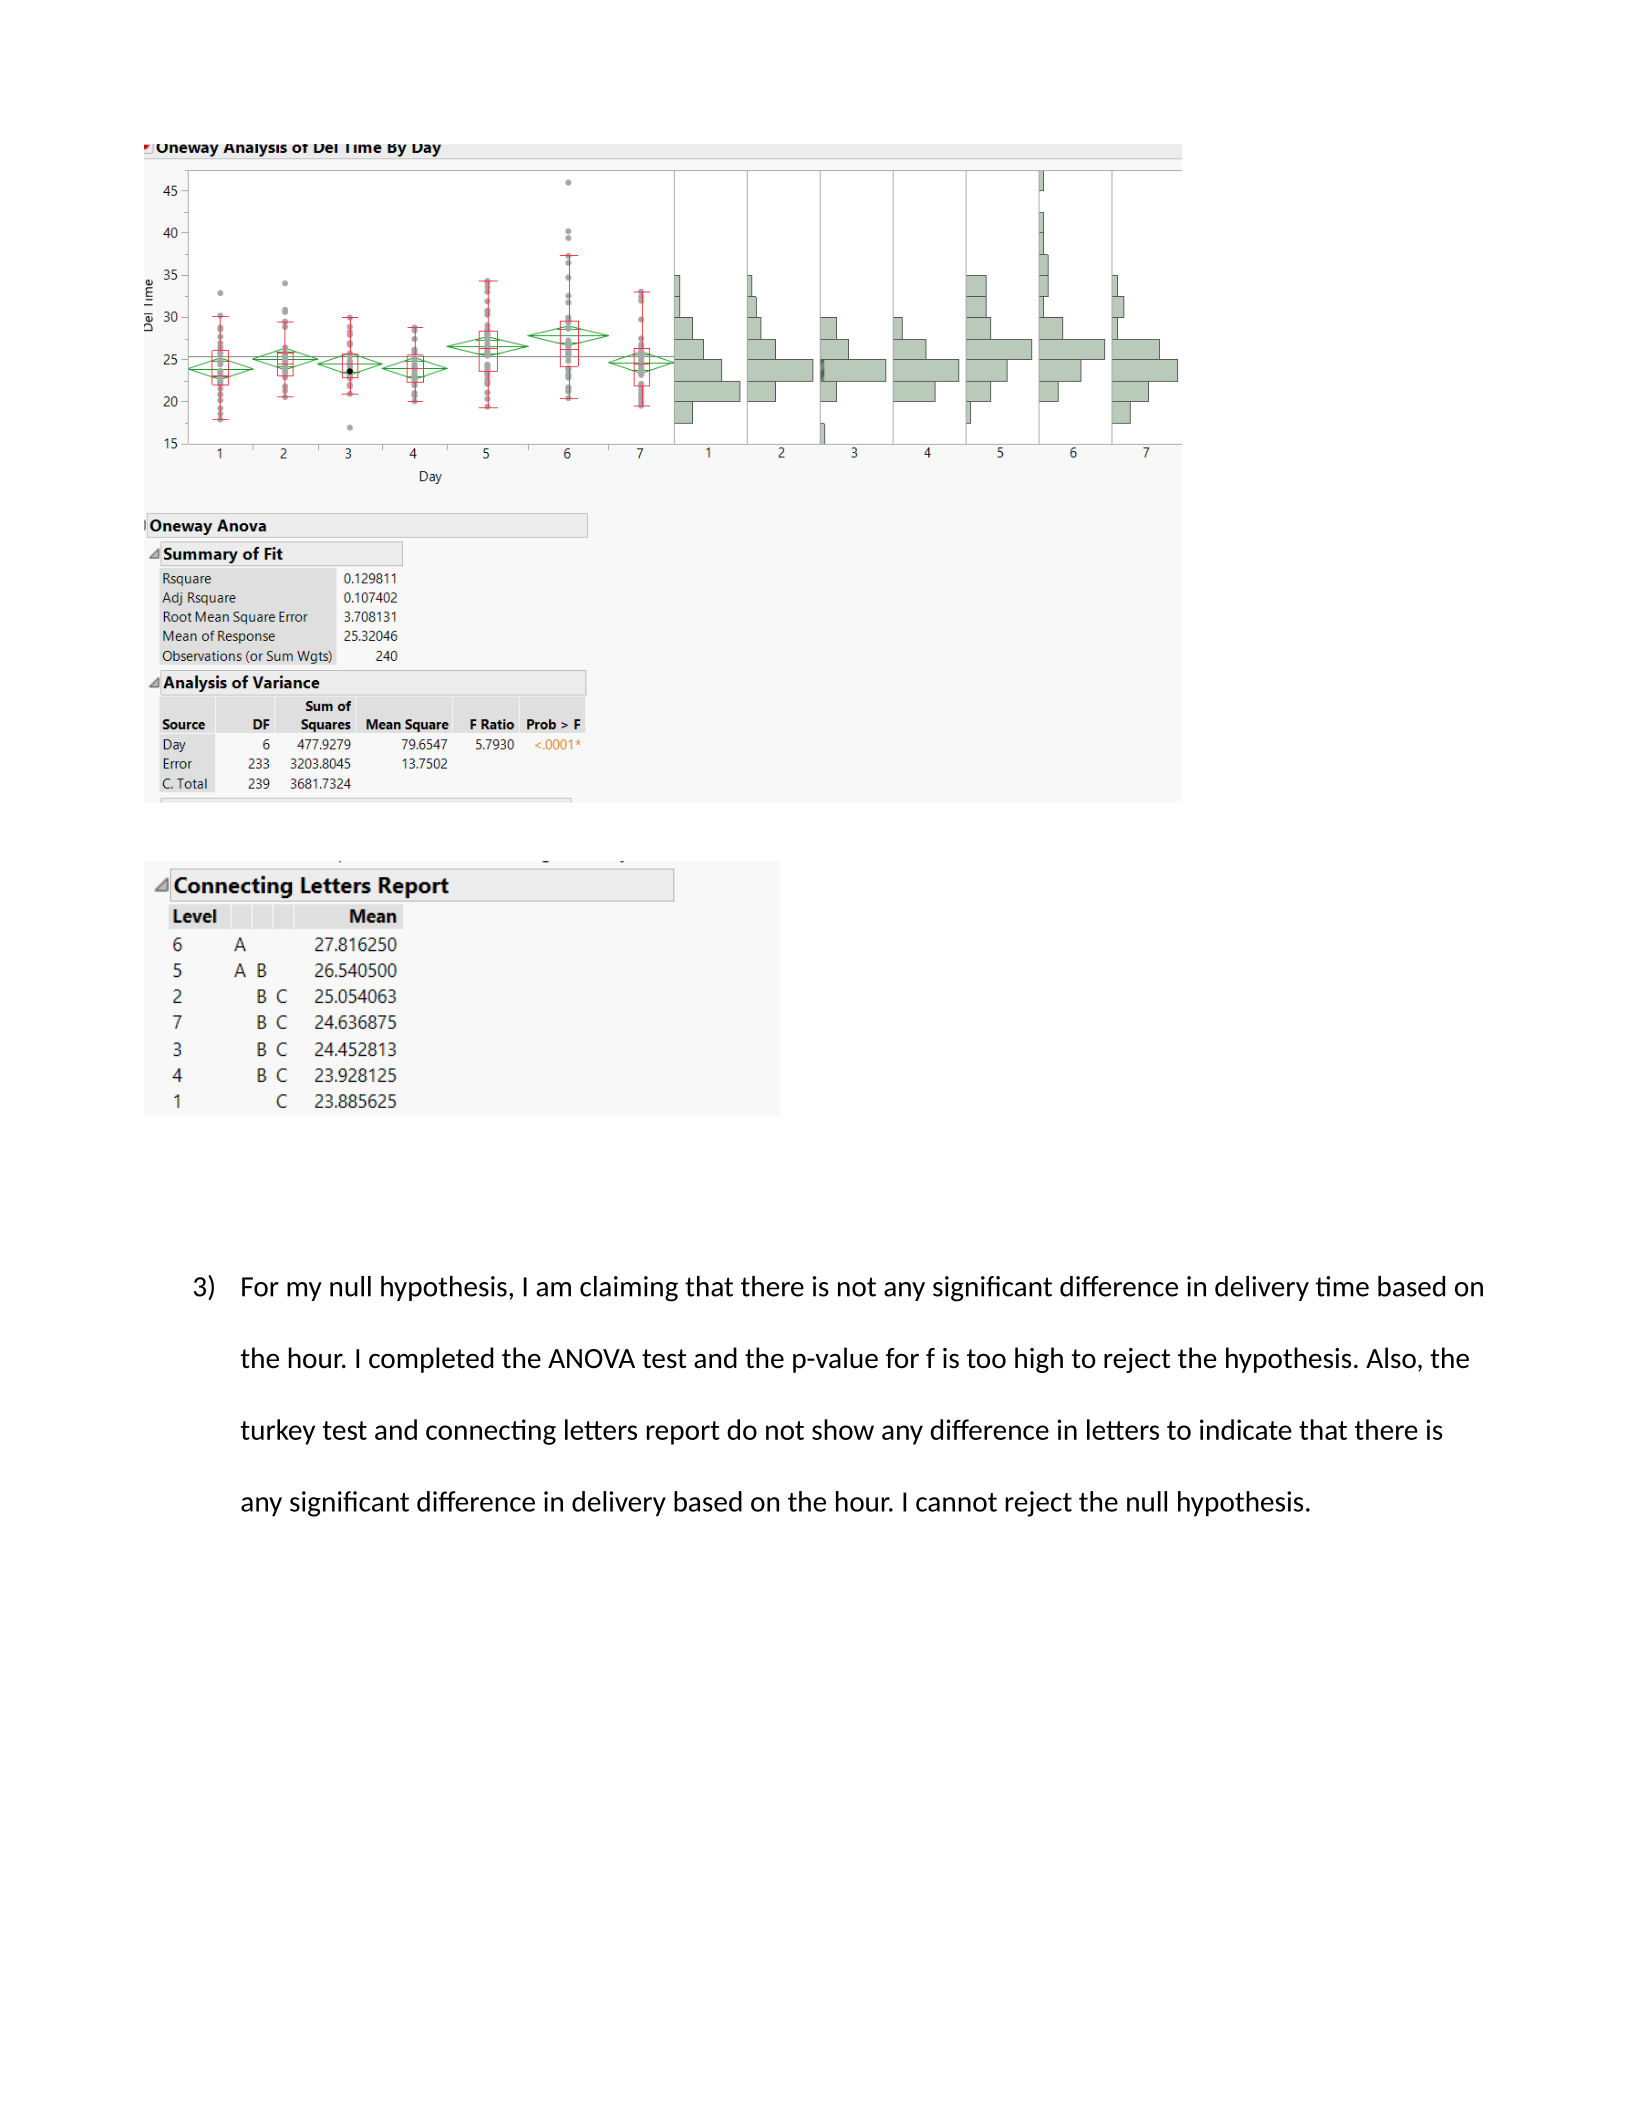
2) With my Null Hypothesis being that there is no variance in delivery time depending on the day, I have
performed an ANOVA test to look out the differences. The data for each day appears to be normal and
based on my low p-value I would reject my null hypothesis that there is no difference in delivery time
based on the day. The Turkey test and connecting letters report also confirms there are significant
differences in delivery time based on day.
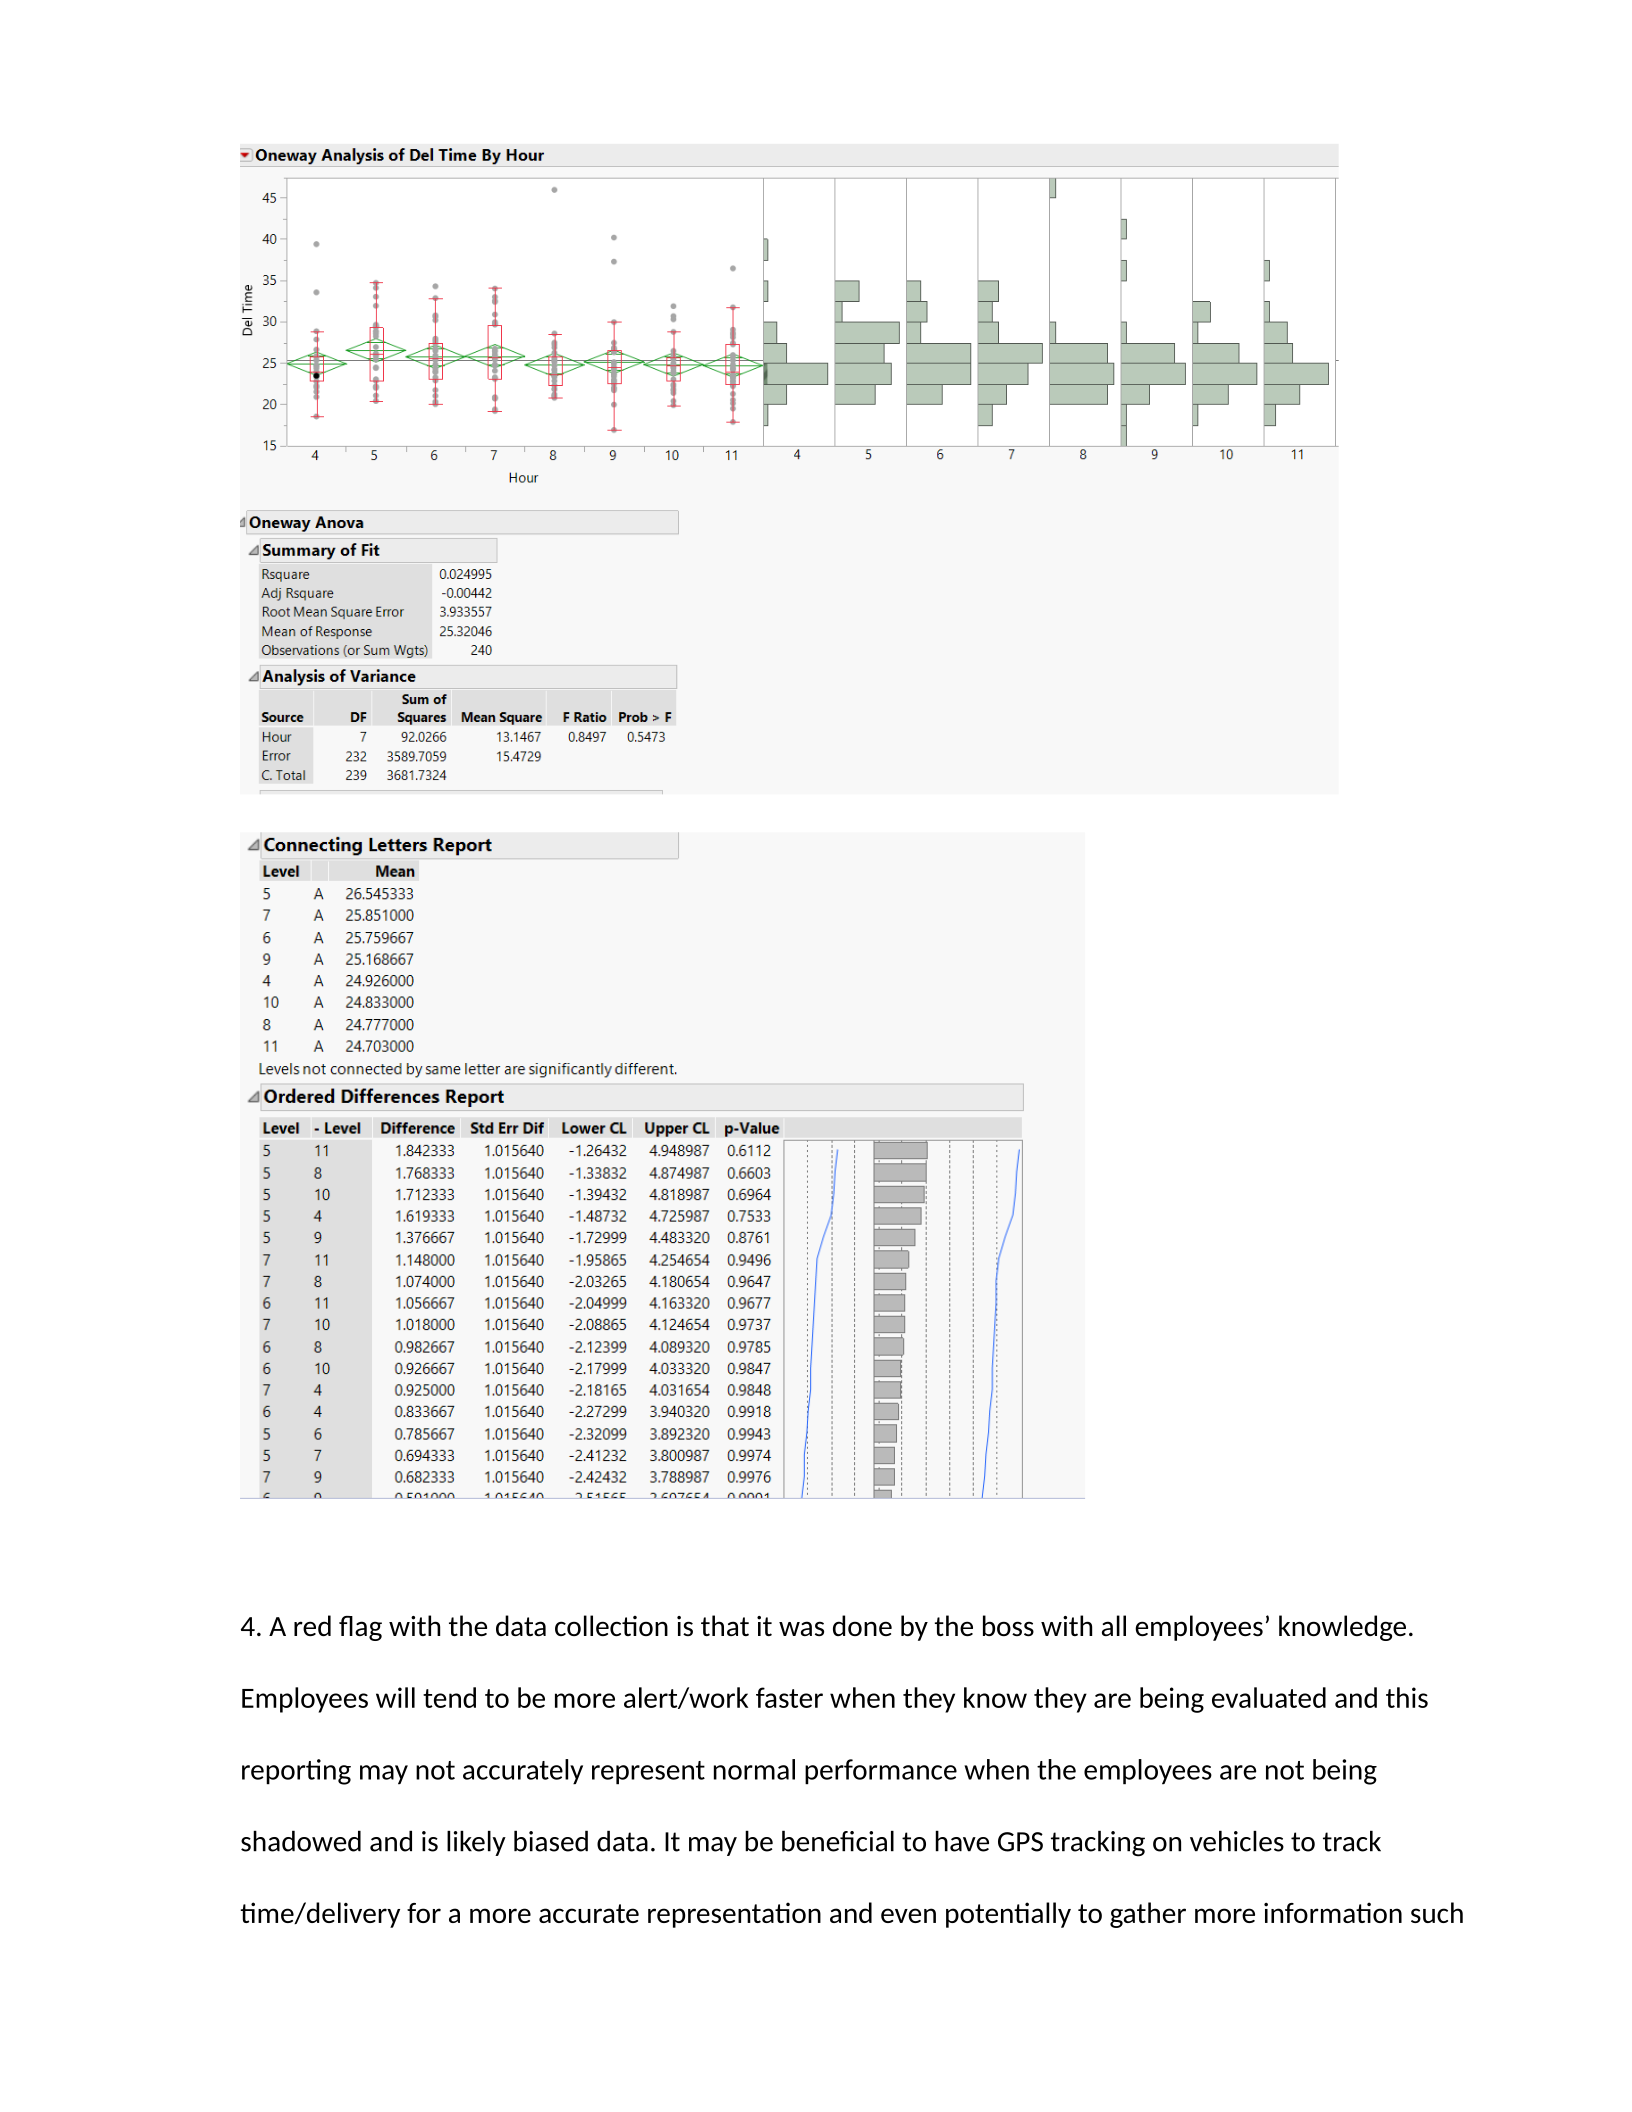
3) For my null hypothesis, I am claiming that there is not any significant difference in delivery time based on
the hour. I completed the ANOVA test and the p-value for f is too high to reject the hypothesis. Also, the
turkey test and connecting letters report do not show any difference in letters to indicate that there is
any significant difference in delivery based on the hour. I cannot reject the null hypothesis.
4. A red flag with the data collection is that it was done by the boss with all employees’ knowledge.
Employees will tend to be more alert/work faster when they know they are being evaluated and this
reporting may not accurately represent normal performance when the employees are not being
shadowed and is likely biased data. It may be beneficial to have GPS tracking on vehicles to track
time/delivery for a more accurate representation and even potentially to gather more information such
as routes taken, typical traffic jams, and if drivers have correct/accurate directions. Cameras could be
installed in the pizza parlor to watch the preparation portion or an undercover evaluator posing as a new
employee might give more accurate information in the shop. Also, it may be beneficial to evaluate each
section on its own to search for potential opportunities to improve times. For example, if Tony evaluated
prep time on its own, he could compare the prep time to the order size/type to see how volume of the
order impacted prep time. He could also evaluate on an employee level to see if there are any
stragglers/high performers. Maybe Employees spend time waiting for pizzas to cook and he should invest
in another oven. On the wait time, how many orders is a driver picking up at a time? Are they able to
take more without compromising heat of the pizza? Is wait time particularly high during specific
days/hours where additional drivers are needed during peak times? For delivery time, are particular
areas/destinations causing delays? Should we expand/diminish our ‘29 minute guarantee area’ due to
traffic issues making it to particular neighborhoods? I think there are more areas we could evaluate and
additional data that could be gathered to get further insight into the delivery time and we could gather
less biased data by not having Tony personally shadow employees to collect it.
5. Based on the ANOVA test, the days with the highest mean were Friday (day 5) and Saturday (day 6).
This does not tell us exactly how to improve the delivery time on those days as the delivery time is the
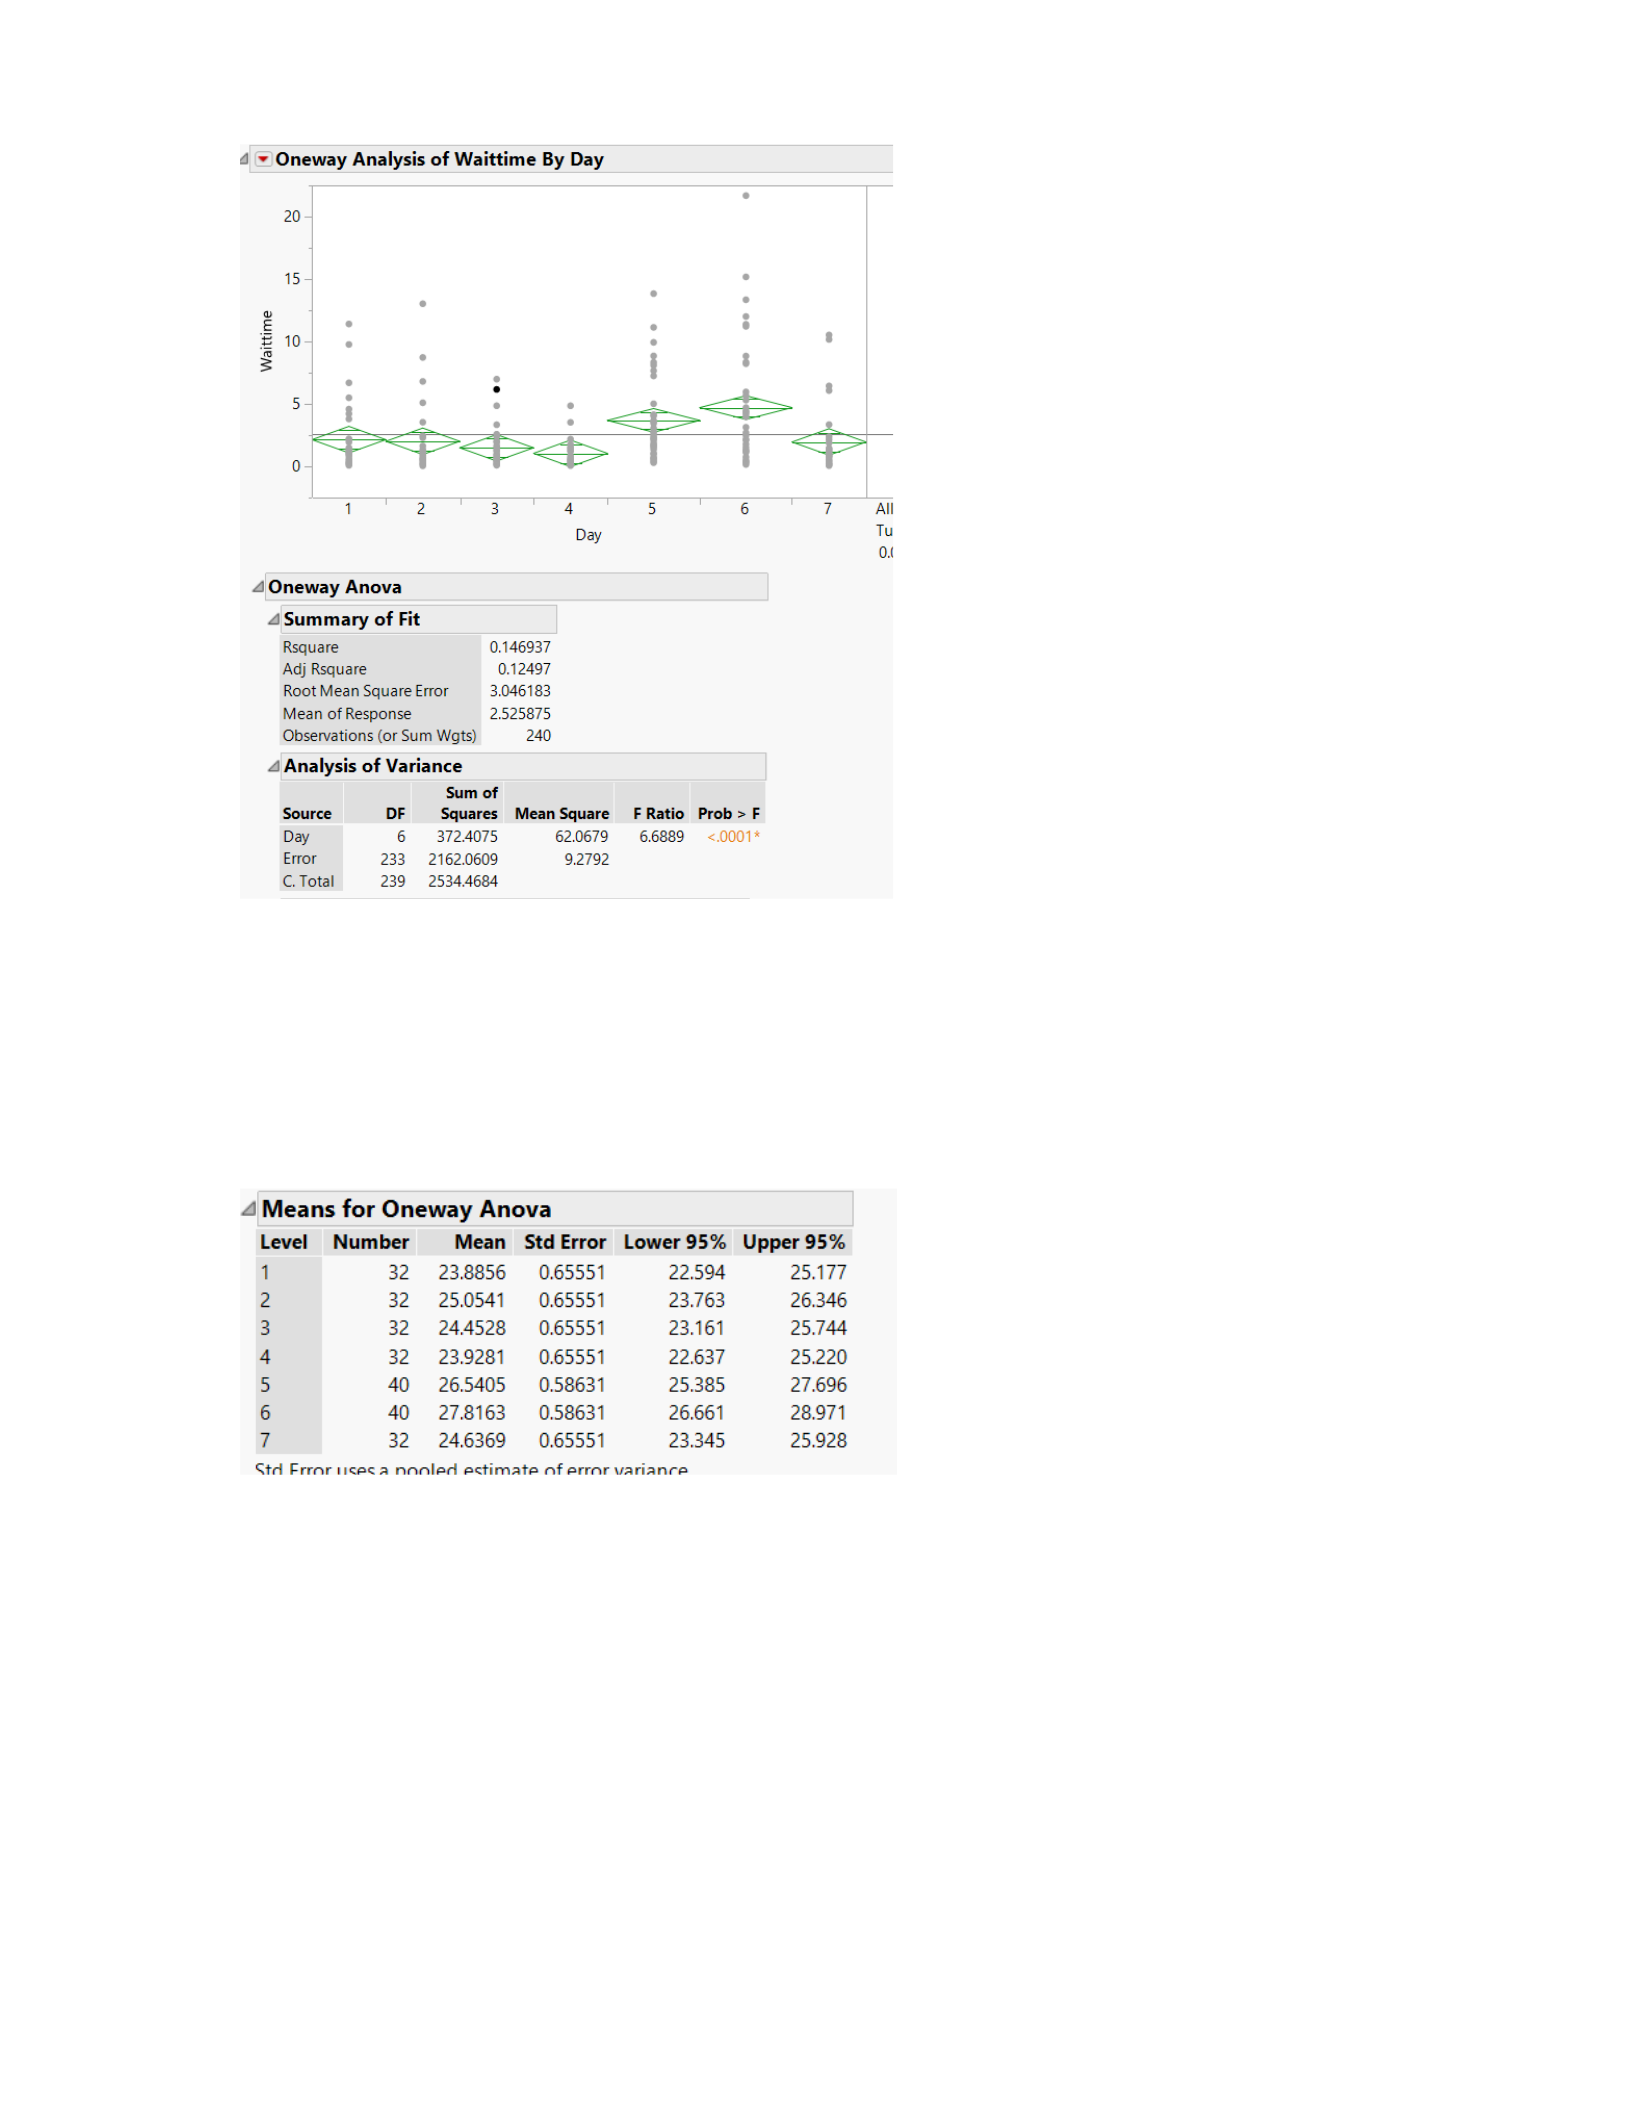
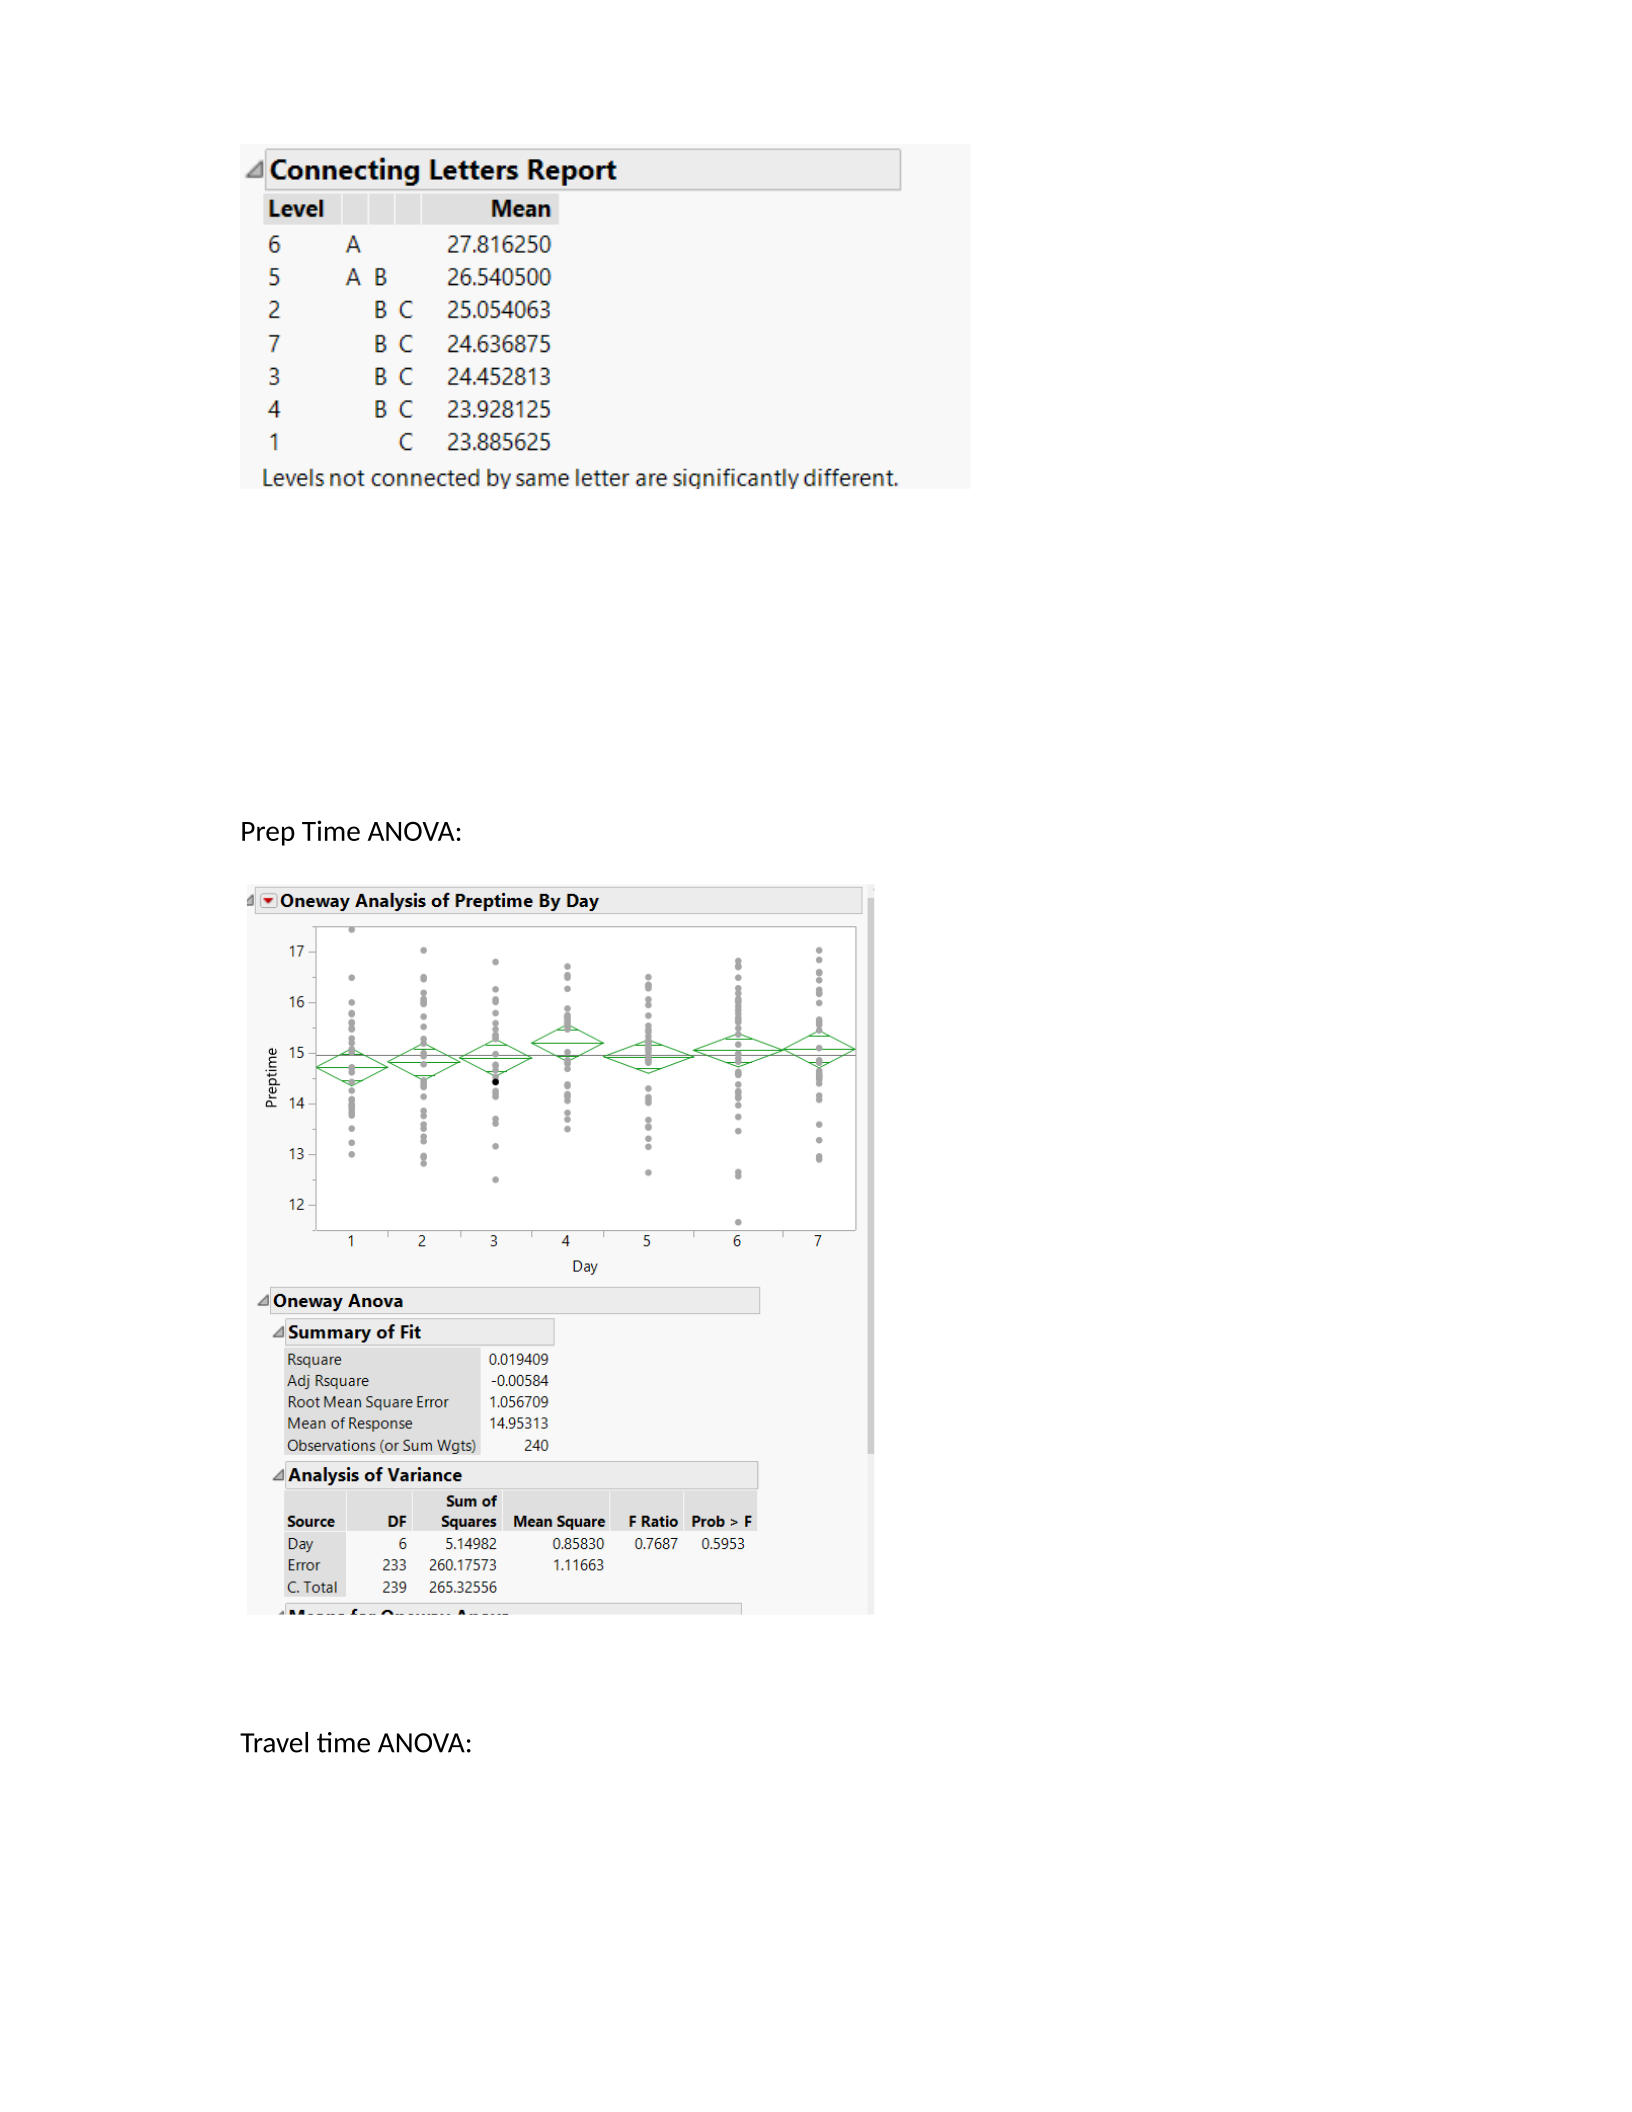
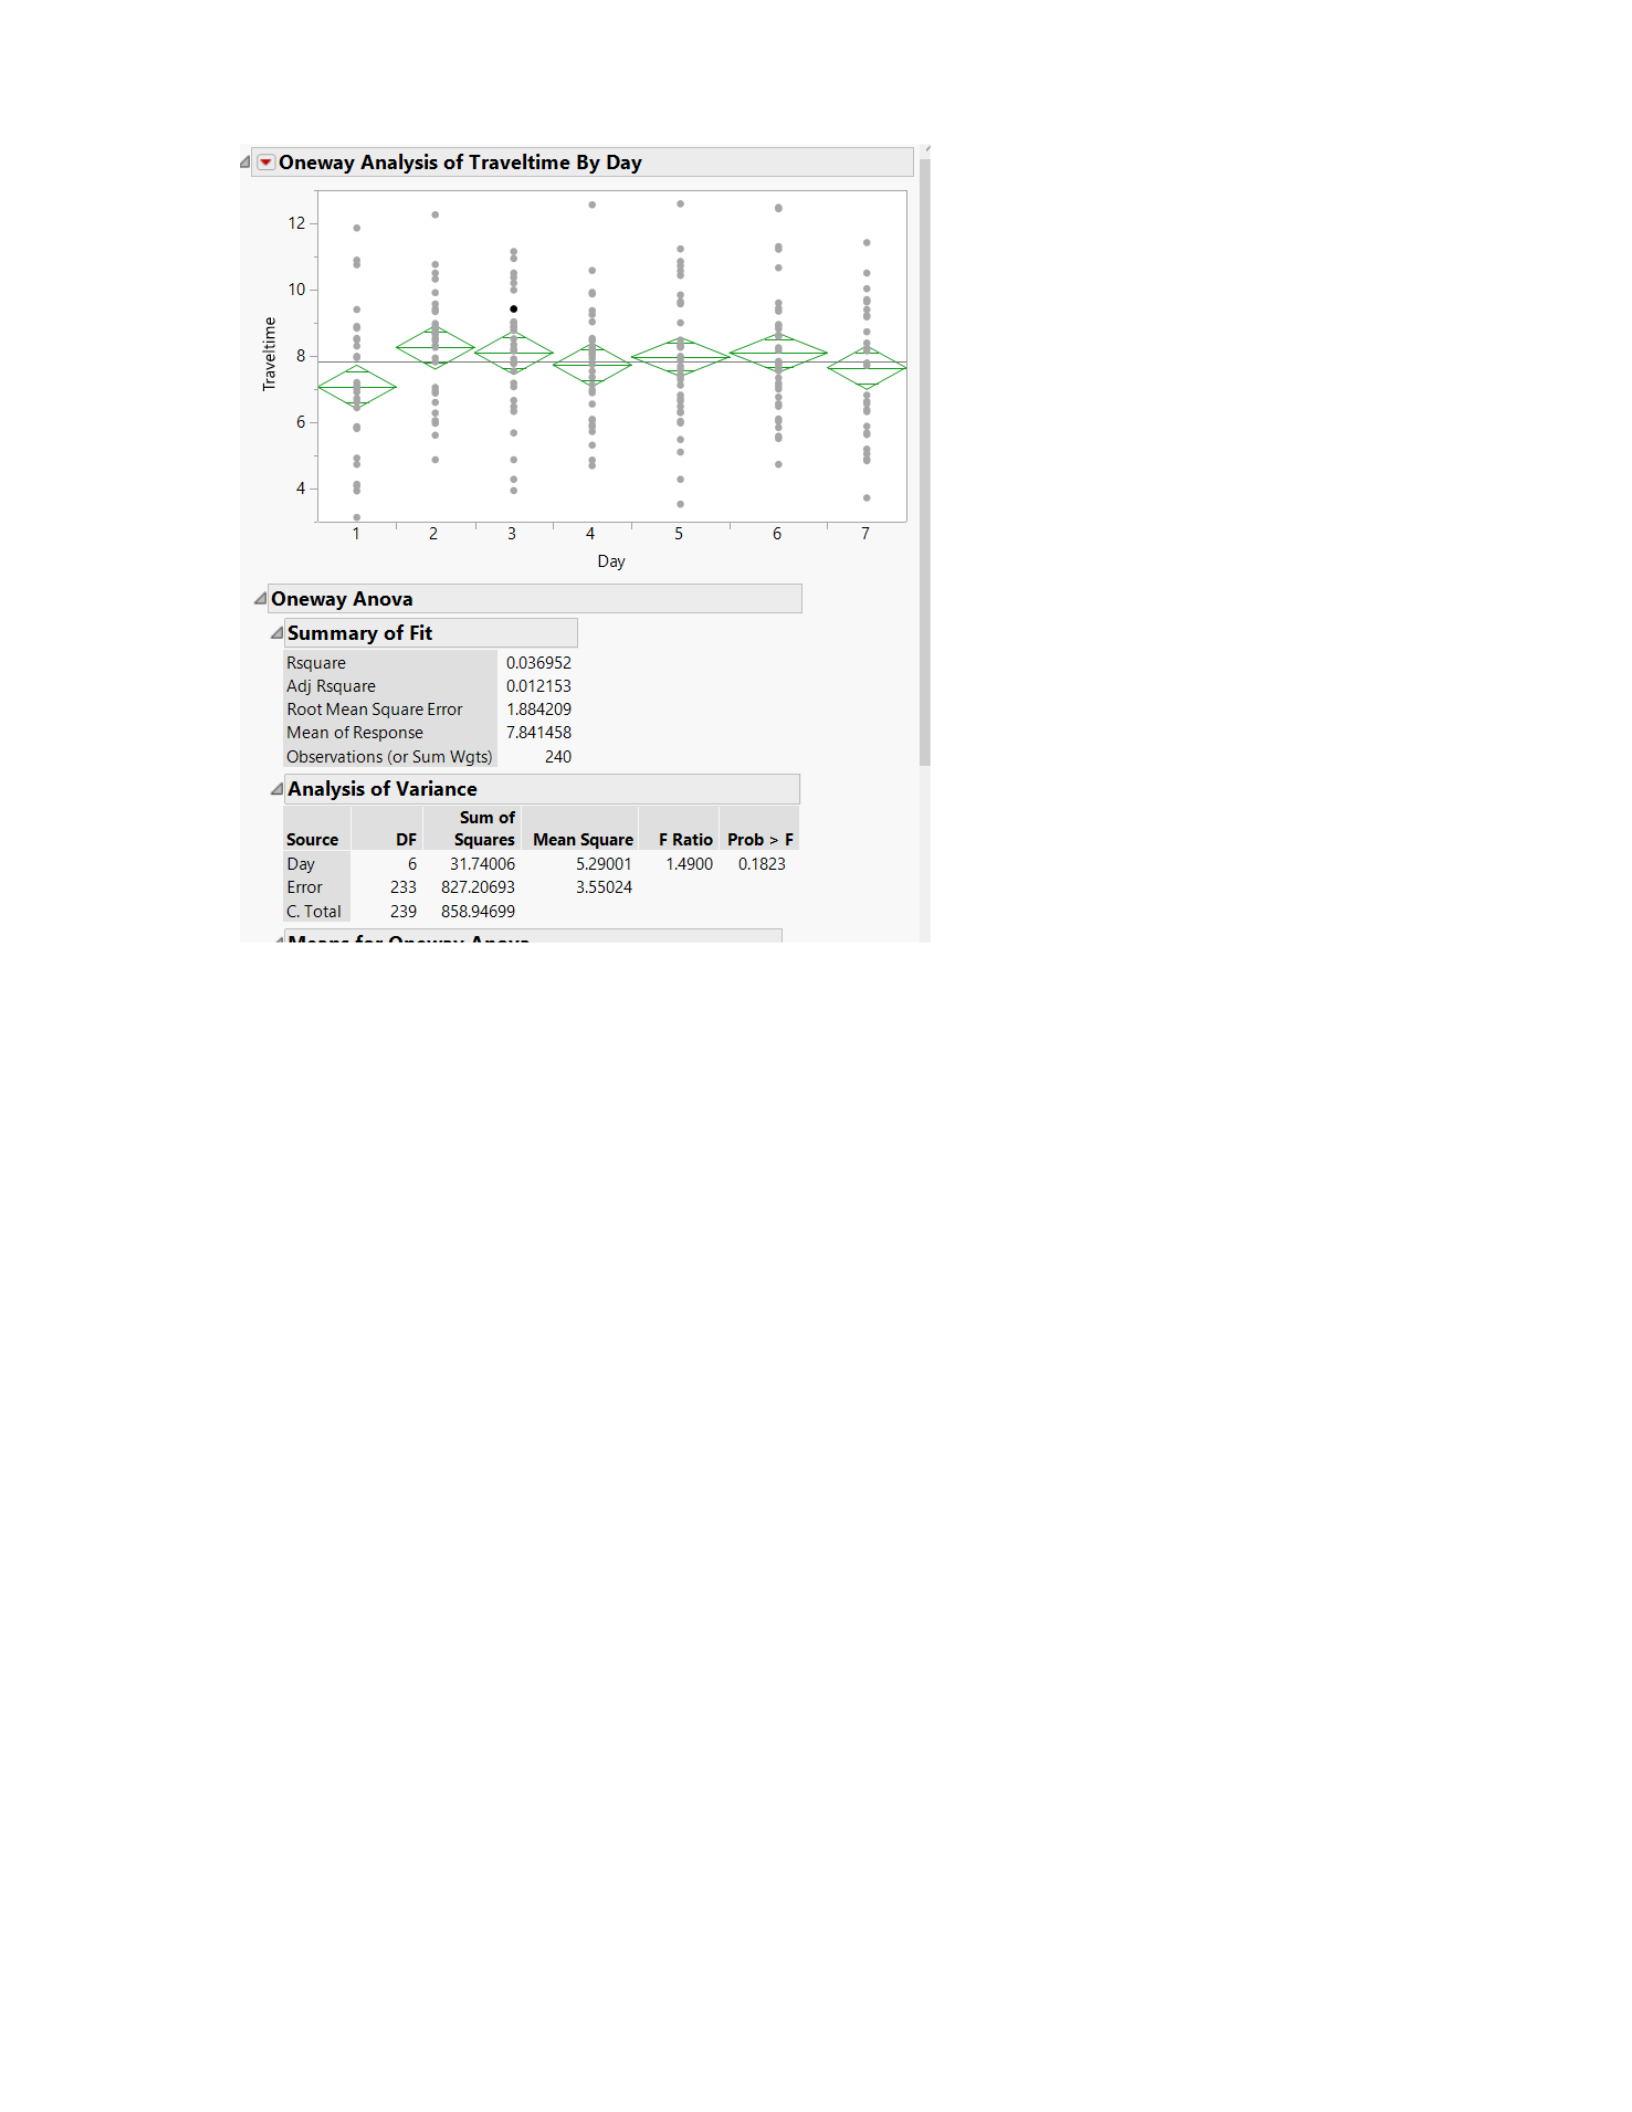
culmination of prep, wait, and travel. To dive further into the issue, I completed ANOVA testing of each
prep, wait, and travel times based on day. With a null hypothesis for each that the times are not
impacted by day, the only one with a low enough p-value was wait time. I can safely reject the null
hypothesis that wait time is not impacted by day and would recommend further evaluation by Tony as to
why we are seeing increased wait times on specific days. According to the Turkey test, the days of the
week with the highest mean wait time are days 5 and 6. Further evaluation would be helpful, but
potentially hiring additional drivers to decrease wait times on days 5 and 6 would help the overall
delivery time on those days and the overall mean pizza delivery time.

4
=/Oneway
Analysis
of
Waittime
By
Day
Waittime
20
15
3
5
0
—>
1 3
4
Day
4
Oneway
Anova
4
Summary
of
Fit
Rsquare
0.146937
Adj
Rsquare
0.12497
RootMean
Square
Error
3.046183
Mean
of
Response
2.525875
Observations
(or
Sum
Wats)
240
4Analysis
of
Variance
Sum
of
Source
DF
Squares
Mean
Square
Day
6
372.4075
62.0679
Error
233.
2162.0609
9.2792
CTotal
239
2534.4684
4
Means
for
Oneway
Anova
Level
Number
Dubhwh
a
7
32
32
32
32
40
40
32
F
Ratio
Prob
> F
6.6889 <,0001*
7
Mean
Std
Error
Lower
95%
Upper
95%
23.8856 0.65551
25.0541
0.65551
24.4528 0.65551
23.9281
0.65551
26.5405
0.58631
27.8163
0.58631
24,6369 0.65551
22,594
23.763
23.161
22.637
25.385
26.661
23.345
Std
Error
ceca
nanled
actimate of
errr
variance
25.177
26.346
25.744
25.220
27.696
28.971
25,928
All
Tu
04
4
~)/Oneway
Analysis
of
Traveltime
By
Day
12
é
Day
4
Oneway
Anova
4Summary
of
Fit
Rsquare
0.036952
‘Adj
Rsquare
0.012153
RootMean
Square
Error
1.884209
Mean
of
Response
7.841458
Observations
(or
Sum
Wets)
240
4
Analysis
of
Variance
Sum
of
Source
DF
Squares
Mean
Square
F
Ratio
Prob
> F
Day
6
31.74006
5.29001
1.4900 0.1823
Error
233
827.20693
3.55024
C.
Total
239
85894699
Powered by TCPDF (www.tcpdf.org)

