


1
Chapter 1: Introduction to the Study
The topic addressed in this study is the application of student data by
administrators of 4-year colleges in tracking and predicting retention. Student data are
derived from student behavior characteristics and attributes that are tracked during their
academic pursuits in higher education. There is a limited number of studies about higher
education application of student data used for tracking and predicting retention. This gap
in the literature affects the information that is needed to address the gap in practice about
processes required to scaffold tracking and predict retention in higher education. A strong
sense of urgency is needed to reaffirm administrators of higher education and their
commitment to using chosen student data to make better strategic decisions, especially as
it relates to student retention. Brown (2019) said that educational leaders should be
advancing using predictive analytics to channel new tools for the success of institutions
and student retention at their chosen university. This study was conducted to address a
gap in literature by informing practices of administrators at 4-year colleges about
processes needed for efficacious student data applications to track and predict retention in
higher education.
This study will contribute to positive social change by increasing higher education
administrators’ understanding of best practices in applying student data targeted to predict
and track retention, ultimately influencing student success and institutional revenue. This
can prove to be valuable and lead to institutional sustainability. An efficacious process for
predicting and tracking retention is an asset in higher education as it allows innovative
recruitment and increases overall efficiency and cost containment when students are

2
retained. Neelakantan (2019) said the understanding in higher education of student data
for variable identification used for institutional advancement initiative fuels well-
organized processes that allow staff to work smart for increased time management. This
can underpin confidence in the adoption of better decision-making processes as it relates
to student data. Use of policies and procedures that enable data managers to make
informed decisions based on evidence rather than intuition as this aligns with best
practices shown in suggested data analysis processes (Sivarajah, et al., 2017; Schneider &
Preckel, 2017) that are now expected by higher education accrediting bodies, such as The
Higher Learning Commission.
I explore this topic in this chapter. I begin with the study’s background with a
brief description of the focus and scope regarding student data application for retention
tracking in higher education. The problem, purpose, and research question are presented
along with the conceptual framework. The nature of this study and significance of other
research is addressed along with a brief discussion of the study’s assumptions, scope,
and delimitations, followed by a summary of this chapter.
Background
This study involves perceptions and experiences of administrators of 4-year U.S.
colleges regarding identifying student data for tracking and predicting retention. This
study’s scope is appropriate to interpret experiences and perceptions of administrators of
4-year colleges regarding their understanding of the phenomenon that will inform best
practices in terms of the application of student data and retention. The scope of data
collection was not limited by geographical location since these interviews were

3
conducted in a virtual format as well as face-to-face. Data were collected from 12
administrators from U.S. 4-year colleges who were recruited using criteria-based
sampling.
This study can bridge the gap in literature regarding the application of student
data to track and predict student retention in higher education. Wilderotter (2020) said the
lack of faculty and administrator understanding of one’s student population and their
attributes can prevent selection of variables that measure retention in a meaningful way.
Wilderotter also said critical planning for retention in higher education involves
understanding student enrollment trends and what influences those trends for student
decision-making when choosing a college. Additional research is needed to help higher
education administrators identify predictive student data for retention.
The current study is needed because it will benefit higher educational institutions
and the data administrators that plan for student retention tracking initiatives.
Neelakantan (2019) said returns on investment for intentional planning for student
retention variables outweighs costs. Avella et al. (2016) said that many higher education
administrators are currently unable to communicate the linkage between student data,
identifying variables for tracking student retention. Huda et al. (2018) said that higher
education administrator knowledge of data mining processes identified for retention
efforts drive best practices for tracking and predicting college student retention and
institutional stability through increased funding. This study is needed to further address
gaps in research that influence the gap in practice that is needed for administrators in

4
higher education to identify and apply student data for higher education internal research
of retention initiatives in 4-year U.S. colleges.
Problem Statement
The problem guiding this study is that many administrators of 4-year colleges do
not have efficacious application practices for student data in terms of tracking and
predicting student retention. Wang (2017) said that despite abundant data availability,
higher education administrators have a limited understanding of student behavior
characteristics that are needed for analyzing and selecting appropriate variables for
overall institutional research. According to Wang, this has a negative effect on data
management practices and student success outcomes, in that the limited understanding of
the data process itself is a hindrance to reliable outcomes.
This study builds upon previous research findings about processes and policies for
identifying student data that can be applied as variables for data analysis as well as using
analytics for tracking and predicting retention in higher education. Sass et al. (2018) said
data mining practices are typically siloed and fluid within institutions and are
characterized by a lack of planning as it relates to internal retention efforts. Huda et al.
(2018) said higher education administrators continue to struggle without guidance on data
management practices for selecting variables from raw data to track and predict student
retention. Further, a lack of knowledge exists among many data administrators in higher
education who lack appropriate data mining policies and processes to drive student
support practices. This lack of data knowledge and practice prevents the successful

5
function of innovative business intelligence in higher education in terms of retention for
revenue stability (Elhassan et al., 2018).
Purpose of the Study
The purpose of this basic qualitative study is to explore perceptions and
experiences of administrators of 4-year colleges in terms of their application of student
data for tracking and predicting retention. The basic qualitative methodology was used in
this study to generate an increased understanding of this phenomenon. Increased
understanding is needed for higher education administrators for the process of selection
of student data and how they are applied to tracking and predicting retention. This
understanding in higher education for analyzing and selecting data is important because
student attributes that feed into data selection processes may change depending upon
trends influencing higher education (Arensdorf & Naylor-Tincknell, 2016). Matsebula
and Mnkandla (2017) said changing trends can further affect retention tracking because
of the needed reevaluation of targeted student data.
Research Question
The research question that guided this study is:
RQ1: What are the perceptions and experiences of higher education
administrators of 4-year colleges in terms of the application of student data targeted for
tracking and predicting retention?
Conceptual Framework
The process of understanding and interpreting raw data is not reduced to a
predetermined method, but it occurs during the interpretive process itself (Mills et al.,

6
2010). The primary function of the conceptual framework is to provide a clear and
concise mechanism for interpretation and understanding in a qualitative study (Barbour,
2014). These two models were specifically chosen to underpin this study because they
provide the basic knowledge and defined terms that make up data components of any
retention initiative. Part of gauging the higher education perceptions and experiences in
this study will rely upon their basic knowledge of data mining terms. The conceptual
framework models of Attarran et al. (2018) and Gandomi and Haider (2015) constitute
the data mining and analysis structure needed to inform these perceptions and
experiences. A more detailed analysis of this will be provided in Chapter 2.
The conceptual framework for this study is informed by a model of analytics by
Attaran et al. and the three V construct by Gandomi and Haider. Given the strong
knowledge base needed from participants regarding data mining protocol and language,
these are appropriate conceptual framework models for this study. A more detailed
analysis of this dual lens conceptual framework will be provided in Chapter 2.
The Attaran et al. model takes a three-pronged approach to analytics: descriptive,
predictive, and prescriptive. These three approaches involve decision-making
perspectives seen most frequently in higher education. First, descriptive analytics allows
for a rearview mirror approach to describe data variables chosen that will assist in
choosing a path forward given what has or has not been successful results in the past.
This means that previous data outcomes can be reviewed for historical perspectives and
provide a course forward given past behavior collected from data and whether this
behavior is still wanted or not (Attaran et al., 2018). The second prong of this

7
threepronged approach is predictive analytics. This particular perspective considers
historical data as well as current data mining results. It is useful in identifying potential
risks as well as opportunities for growth and development with appropriately identified
variables that show patterns of data that serve to predict future behavior of the group
being studied and analyzed with targeted data points. Finally, the prescriptive analytics
tool of this model allows decision-makers a simulation process to optimize an action
being considered in policy or practice. This is a valuable approach and goes beyond
descriptive and predictive analytics by helping decision-makers decide what happens next
and why this course may be best given the data patterns from the group being studied or
analyzed. Kivunja and Kuyini (2017) said that any study based upon basic data mining
skills for the understanding of analysis results and its application in higher education
should have a data mining model as the basis of policy and practice, such as Attaran, et al.
and Gandomi and Haider, that provide the dual lens of the conceptual framework of this
study.
The second model supporting this study is the three-V construct by Gandomi and
Haider. The three Vs stand for: velocity, variety, and volume. Velocity refers to the speed
at which data is constantly uploading into a data system. Variety is diversity of data such
as gender, race, socio-economic status, GPA, and credit ration score (Gandomi & Haider,
2015, p. 138). Volume refers to amount of data, given the size of the institution and
number of goals or targets being measured. The three-V model targets raw and
unstructured data that compose 95% of data analytics in higher education (Mah, 2016), as
well as types of data that higher education administrators and stakeholders consider

8
during their decision-making processes (Chaurasia & Rosin, 2017). Baer and Norris
(2016) said higher education administrators cannot begin to understand data analytics and
its application without understanding the three V construct.
Exploring perceptions and experiences of administrators of 4-year colleges
regarding their application of student data for tracking and predicting retention requires
basic knowledge of data mining principles such as those supporting this study in the
conceptual framework. Analysis and interpretation are essential to all qualitative inquiries
(Silverman, 2016). During analysis, certain characteristics became more important than
others and meaningful data from participants were driven by the RQ during this analysis.
Further, data analysis was guided by the conceptual framework. It would not be possible
to answer the RQ without these models informing the basic participant knowledge
necessary to scaffold post analysis .
The conceptual framework guides research components of the study. With
understanding of the two models, I created semistructured interview questions. Use of
priori codes is frequently referred to as a deductive or beforehand form of analysis, while
building codes during analysis is inductive (Castillo-Montoya, 2016). I used priori codes
as part of the data analysis procedures. More detail regarding the chosen conceptual
frameworks and their alignment with this study is in Chapter 2.
Nature of the Study
I used a basic qualitative design to explore the perceptions and experiences of
administrators in 4-year colleges about identifying and applying student variables for
tracking and predicting retention. Basic qualitative research is used to examine natural

9
circumstances in which individuals’ function, as the objective is to provide a practical
understanding of real-world problems (Korstjen & Moser, 2018). Basic qualitative design
is an appropriate choice for this study because this design is used to advance knowledge
and investigate an academic phenomenon (Given, 2008). I investigated the processes in
place for applying student variables in retention, and the perceptions and experiences of
administrators using these practices. Another rationale for choosing the basic qualitative
design is to address contextual experiences of interest. Patton (2015) said the qualitative
inquiry is the chosen method for analyzing people’s perceptions and experiences within
the context to be understood. Accordingly, I analyzed perceptions and experiences of
college administrators.
This design was chosen as opposed to the case study. This is because in the case
study design, a researcher is focusing on the concrete, contextual, in-depth knowledge
about a specific real-world issue that allows a researcher explore the key characteristics,
meanings, and implications of the case (Lichtman, 2020). There is not enough literature
on the topic of this study to inform practice in regards to answering the RQ. Because of
this reason, the researcher found it necessary to have the open design approach that the
basic qualitative study design provides.
The basic qualitative study, sometime called generic, general, or interpretive
qualitative designs typically derives from practical issues in the social sciences which
provide the context for qualitative semistructured interviews. Data were collected via
semistructured interviews by phone or virtual format from administrators at 4-year U.S.
colleges who have responsibility for the identification of student data for retention

10
efforts. Number of participants depended upon what was required to reach data
saturation. Saturation is achieved when the researcher begins to hear the same comments
repeatedly from participants, and no further interviewing is necessary (Saunders et al.,
2017).
During data analysis, validity involves obtaining rigor through using techniques of
verification such as inductive and deductive coding (Spiers et al., 2018. This approach
has two advantages. First, by using a priori codes or deductive coding, I can ask
participants questions that relate to their own thoughts and experiences that can help
establish rapport as well as gather data. Codes were selected and categorized using NVivo
12 software to ultimately deduct data down to the three major themes. Further discussion
of the basic qualitative study design appears in Chapter 3.
Definitions
Terms that need clarification are discussed briefly here.
Some terms that may need clarification will be discussed briefly here.
Data Mining: This is a general term used frequently when discussing the process
for identifying variables for research. Specifically defined as the practice of analyzing
large databases in order to generate new information (Slater et al., 2017).
Retention: Because this is a common termed heard in both business and education
it is important to have the correct working definition. For this study, student retention in
higher education is defined as the identified student attributes applied as variables in
tracking retention and success of students in higher education from term to term until
completion (Alsharari & Alshurideh, 2020).

11
Student Data: Mentioned throughout this study as part of the key concepts are
defined as those student data or characteristics deemed statistically significant for use as
variables in tracking a data target (Elegendy & Elragal, 2016).
I assumed that participants shared honest and accurate accounts of their
perceptions and experiences when applying student data for tracking and predicting
retention. It was further assumed that during the participant selection process, participants
accurately portrayed their job titles and responsibilities. This is necessary for internal and
external validity of the study. This is also important in terms of answering the RQ and
relating this knowledge through semistructured interview questions. Magaldi and Berler
(2018) said semistructured interviews are only as strong as identified participants’
knowledge base related to the focal topic. These assumptions were necessary for this
study to build the research question and semi-structured inquiries for participant
interviews.
Scope and Delimitations
The scope of this study includes administrators of 4-year, U.S. colleges who are
responsible for student variable applications for tracking and predicting student retention.
This study was delimited to 4-year colleges to be specific to higher education
administrators without being too narrow (Lichtman, 2017; Patton, 2015). This study was
also delimited to only U.S. colleges. Data collection only within the United States can
minimize efforts for saturation during the COVID-19 crisis that may influence the
participation recruitment process (Bradley et al., 2020). Finlay (2013) stated that in
qualitative study, careful thought for participant selection must be done with the essential

12
belief that you look for variety in people to describe, explore, or explain phenomena in
real-world contexts. Merriam and Tisdell (2015), and Finlay (2013), stated that
researchers and readers can then make connections from the data outcomes. When these
reflections are applied to qualitative practices, this is called transferability (Barbour,
2014; Finlay, 2013; Given, 2008; Lichtman, 2017; Merriam & Tisdell, 2015).
Limitations
Bias may reduce credibility, and researchers must control for bias during tool
development, sampling, and data interpretation. Researchers should also be aware of
personal thoughts, beliefs, values, and opinions so they do not negatively impact their
study (Creswell & Poth, 2019). I am a retention and completion director in higher
education, and knowledge and responsibilities I have that relate to the focus of this study
can cause bias. I minimized my bias by being cognizant of any influence my background
may have on the study. Potential weaknesses in the study can influence trustworthiness of
the final analysis if not kept in check. I reflected on and attempted to prevent biased
activity. I avoided snowball sampling, which could have resulted in too many likeminded
participants. I also used a reflexivity journal and restricted myself to the research method
process detailed in Chapter 3.
Significance
Findings of this study involve a gap in the literature that is needed to inform
practice related to higher education administrators’ application of student data in
predictive analytics for tracking retention. Hadwater et al. (2019) said that the future
foundation of student retention in higher education will involve policies that informs

13
analytics practice to save time, money, and human capital. The findings of this study
provide a deeper understanding of processes for identifying student data in predicting and
tracking retention. This, in turn, will benefit higher education administrator practice by
helping to close the gap in literature (Hadwater et al., 2019). According to Rubel and
Jones (2017), to achieve best practices for retention analytics, insight into student
attributes and behavioral characteristics must be applied during the identification of
student data.
Increased understanding needed for higher education administrators on
appropriate student data in predicting retention initiatives can positively influence social
change. The intended audiences for this study are higher education decision makers and
internal research teams that guide analytics interpretation. This can be done both in higher
education and on an individual basis by administrators. Predictive and preventive
analytics mining can bolster retention and completion (Chaurasia et al., 2018). Also,
improved analytics can promote more efficient use of human capital while increasing
revenue (Elhassan Ali & Klett, 2018). This can influence higher education practices to
yield improved institutional stability and inform efforts to reduce siloed data ownership
pools that impede progress (Nimmagadda & Rudra, 2017).
Summary
This chapter included an overview of this study of administrators of 4-year U.S.
colleges and their application of identified student data in predicting and tracking
retention. Further, administrators’ experiences and perceptions of student data identified
as targets in predicting retention through semi-structured interview questions are

14
grounded in the conceptual framework models of Attaran, et al. (2018) model of analytics
and Gandomi and Haider (2015) three-V construct. Limitations were discussed that
highlighted participants’ lack of knowledge and experience that may influence
recruitment and data outcomes as well as researcher limitations given my current job title
and responsibilities involving institutional retention. Participants were 10 administrators
from eight 4-year U.S colleges . I focused on describing social change implications
relating to improved understanding of higher education administrators with data tracking
responsibilities in predicting retention, which can positively influence student success and
institutional stability by increasing revenue. Chapter 2 contains information regarding the
conceptual framework along with a review of current literature.
Chapter 2: Literature Review
The problem guiding this study is that many administrators in 4-year colleges do
not have efficacious application practices in place for student data in terms of tracking
and predicting student retention. Therefore, the purpose of this basic qualitative study is
to explore perceptions and experiences of 4-year college administrators regarding their
student data application processes for tracking and predicting retention. Problems with
tracking retention arise in higher education without defined processes for applying
student characteristics that are specific to data tracked for students who persist in school
(Elhassan & Klett, 2018; Mahroeian et al., 2017).. Important components of successful
tracking and predicting of retention initiatives in higher education include attitudes and
perceptions of administrators who have the responsibility for pertinent use in defining and
applying student data (Alsharari & Alshurideh, 2020)

15
In this chapter, research relevant to this study is reviewed. Literature search
strategies and databases used for this research are discussed. I used Stark and Stotler’s
model of analytics and Gandomi and Haider’s three-V construct to address key concepts
in this study. Key concepts addressed through this literature review include defining
retention in higher education, applying and identifying student data for institutional
research, tracking and predicting retention in higher education, and barriers to data
mining. These are followed by chapter conclusions and a summary.
Literature Search Strategy
Databases used during the research process for finding literature were: SAGE
Journals, ERIC, , EBSCOHost, PROQUEST, PsycINFO, Academic Search Premier, and
ProQuest Central. Walden University’s Thoreau Library portal and Google Scholar were
also used to identify articles not obtained through databases. Key words used were:
analytics in higher education, higher education administration decision-making tools,
higher education administration perceptions of student data applied in retention, tracking
and predicting retention in higher education, Gandomi and Haider three-V construct in
higher education, Attaran, Stark, and Stotler analytics model in higher education, student
attributes identified as variables in tracking or predicting retention, qualitative study in
higher education retention, student data in retention, how student data application
influences student retention tracking, higher education student retention, retention
analytics in higher education, and students who retain in higher education. These key
terms were used independently and in combination, and led to four major themes:
defining retention in higher education, applying and identifying student data for

16
institutional research, tracking and predicting retention in higher education, and barriers
to data mining. There are 60 total sources in the literature review, 41 (68%) of which
were published between 2017 and 2021 (see Table 1).
Table 1
Sources in the Literature Review
Source Type
Last 5 Years
Older than 5 Years
Total
Peer Reviewed
40
14
54
Seminal
1
5
7
Total Sources
60
Conceptual Framework
The conceptual frameworks for this study were the model of analytics and three V
construct. Both have origins in general data mining best practices (Baker & Siemens,
2014). Baker and Siemens (2014) said accuracy of education data mining (EDM) metrics
is important, as they can determine the relevance of educational experiences to students.
Heiner et al. (2007) said the model of analytics establishes processes and tools needed in
any data mining effort to operationalize decision-making in order to synchronize data for
planned improvement in policy and practice.
Model of Analytics
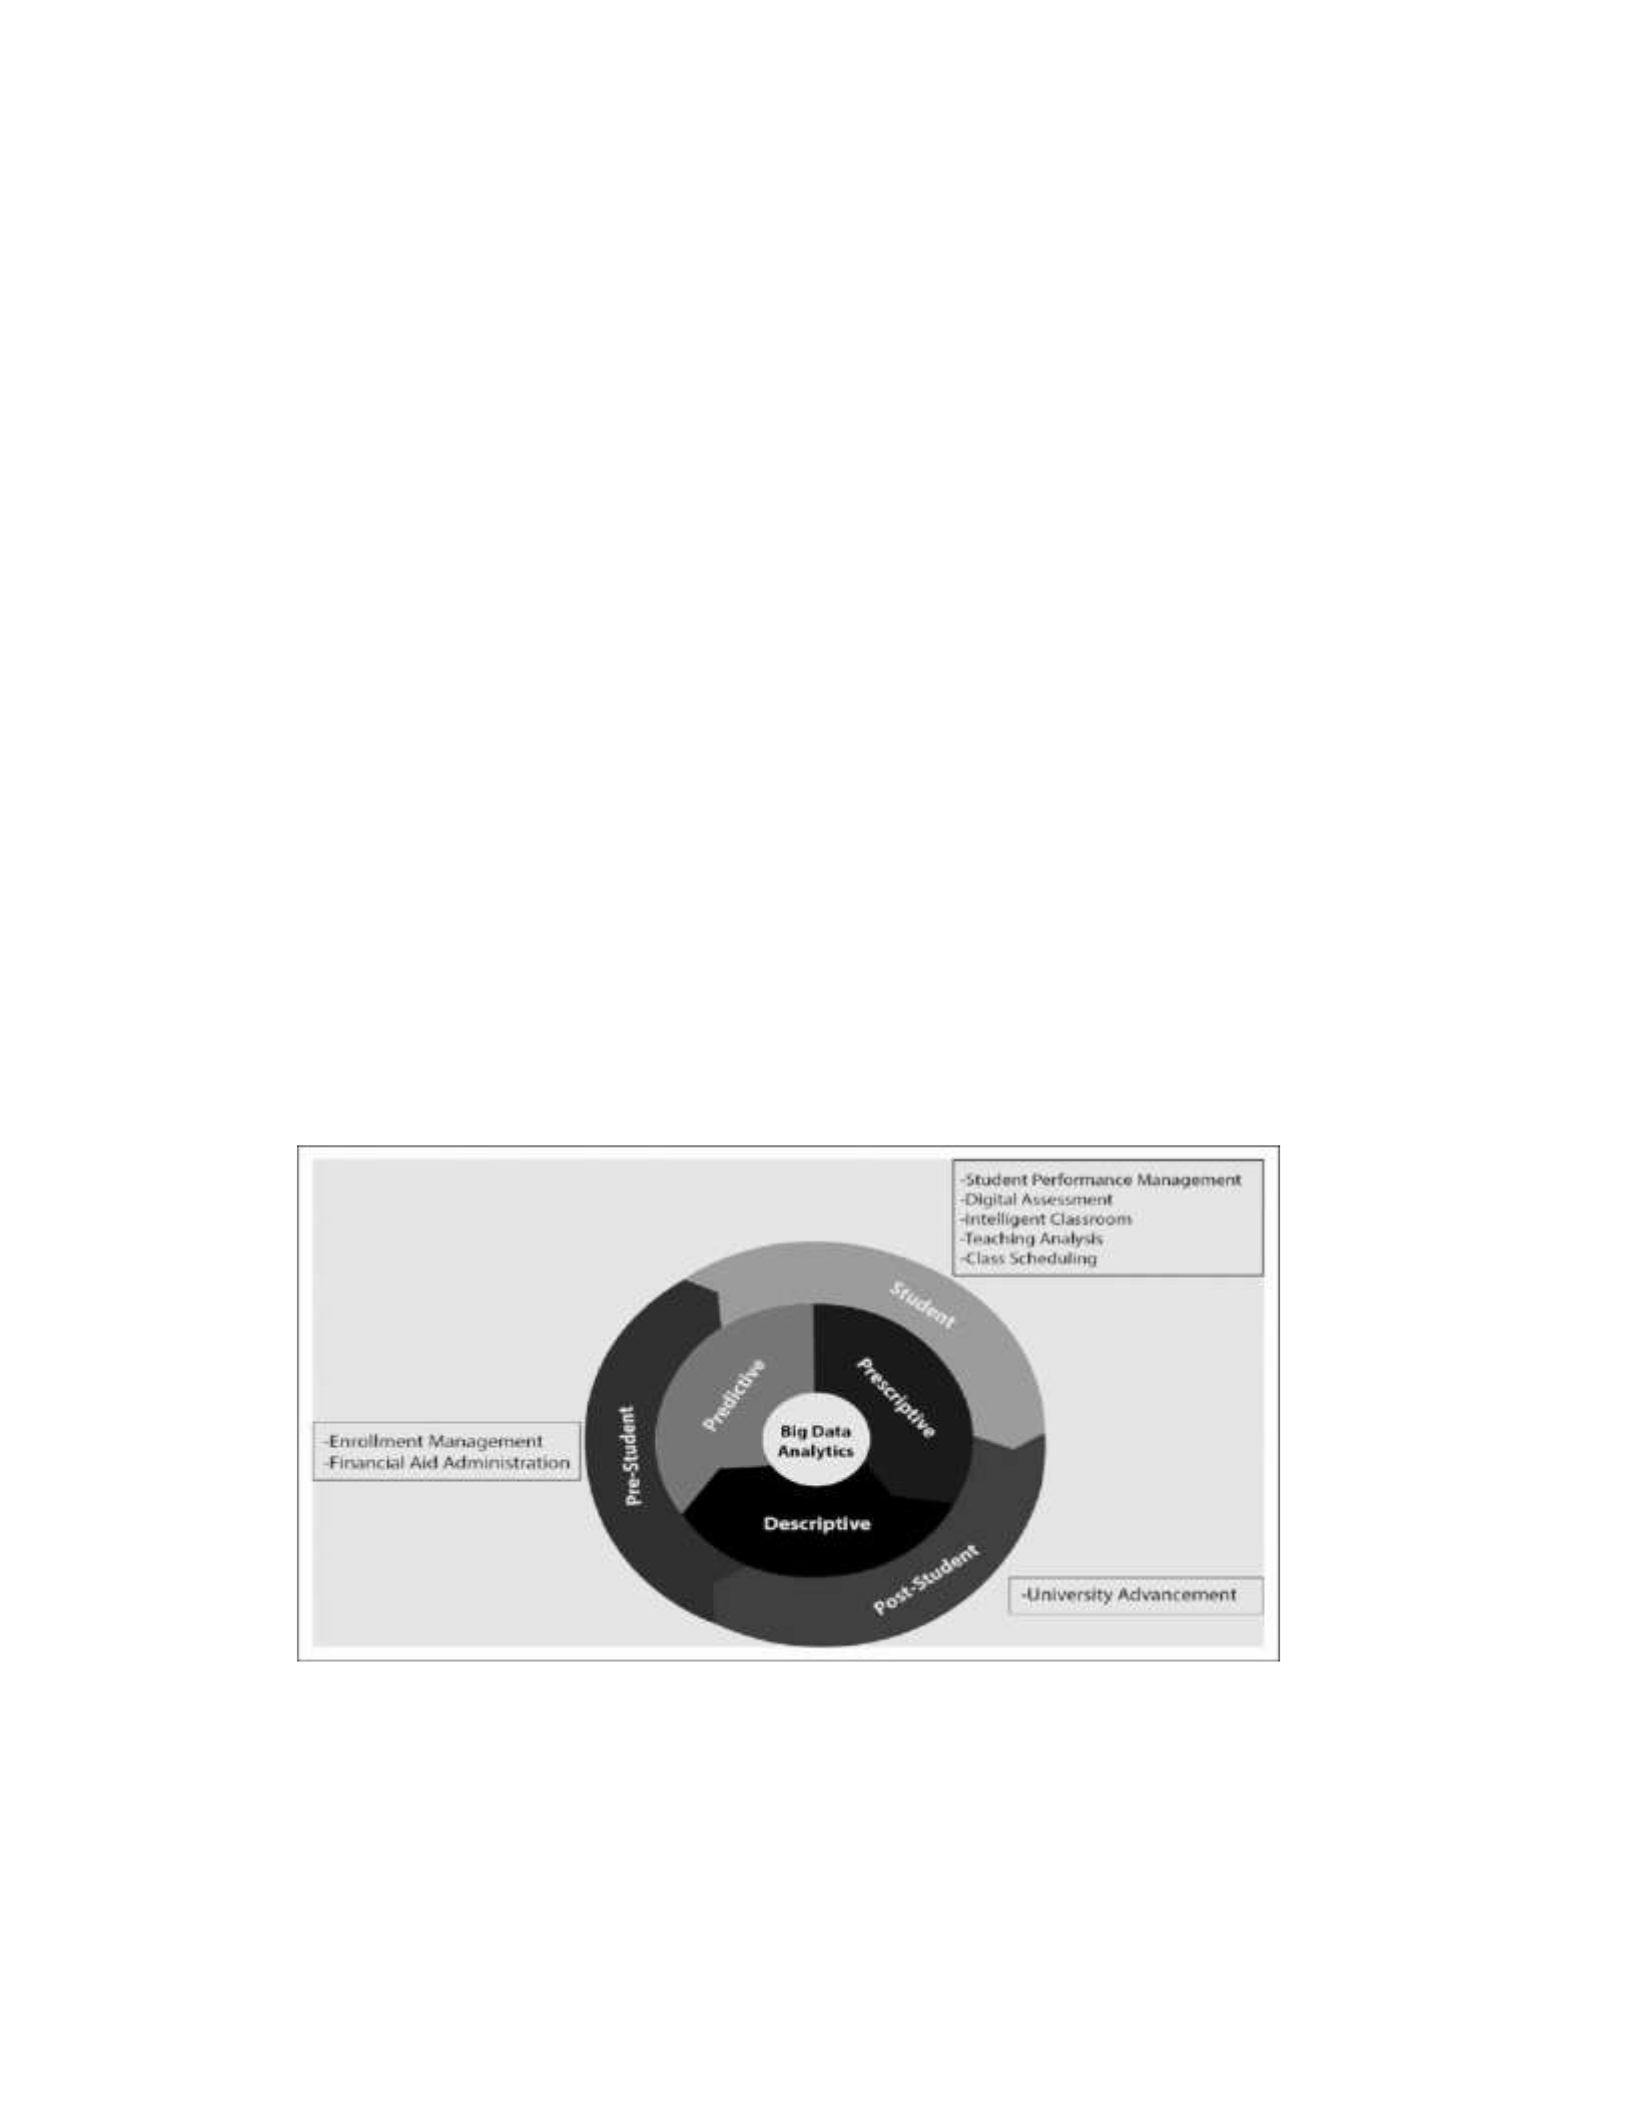
The model of analytics involves a three-pronged approach to analytics:
prescriptive, predictive, and descriptive. These address the decision-making perspectives
seen most frequently in business and education (Williamson, 2017). Attaran et al. (2018)
17
said once big data are broken down, these smaller pieces of prescriptive, predictive, and
descriptive data allow decision-makers to see patterns and trends from past data
outcomes.
Descriptive analytics allow for a knowledge-based approach to deciding future
policies and procedures (Attaran et al., 2018). Predictive analytics involves historical data
as well as current data mining results. It is useful in identifying potential risks and
opportunities for growth and development. The prescriptive analytics approach allows
data simulations to optimize an action being considered. Attaran, et al. stated that this is
the most valuable approach and goes beyond descriptive and predictive analytics by
allowing decision-makers to decide what happens next.
Figure 1
Record-Shape Visual
Three V Construct
. The three Vs of the three V construct are velocity, variety, and volume (Gandomi
& Haider, 2015). The speed (velocity) at which student data are available will also

18
include a assortment of data points and diversity of experiences (variety) with the actual
number, or how much, of analyzed and chosen variables (volume) there were in the final
analysis. Williamson (2017) said the political economy is changing in higher education,
and data science has migrated from the commercial sector into academics. This shift
requires a basic knowledge of how data are defined. Torrecilla and Romo (2018) stated
that one of the models necessary to understand the basics of any data tracking or analysis
is the Gandomi and Haider the V construct.
Summary
The three V construct provides this study with an underpinning for deciphering
the data outcomes as they relate to the perceptions and experiences of administrators in
4year colleges of applying student data for tracking and predicting retention. This is done
by incorporating the three V construct factors of volume, velocity, and variety into the
semistructured interview questions. This construct will assist in data outcome
interpretations in identifying participant experience or perception of data or student
variable identification that relates to its volume, velocity, or variety. Heiner et al. (2007)
stated that Attaran et al.’s model establishes an underpinning for the processes and tools
needed in any data mining effort to operationalize decision making in order to
synchronize data for planned improvement.
Literature Review Related to Key Concepts
The focus of this study will include the application of predictive approaches that
can drive decision making in retention tracking initiatives in higher education and the
efficacious identification of student data in this process. The first subsection of this

19
review of current literature will provide a review of literature related to the tracking and
predicting of retention in higher education. The ensuing section will review how student
data are identified and used in retention. Next, I discuss literature on the importance of
inclusion in student retention. The main themes that emerged include: defining retention
in higher education, applying and identifying student attributes for institutional research,
tracking and predicting retention in higher education, barriers to data mining.
Defining Retention in Higher Education
Retention in higher education and how certain populations are defined within the
data mining process can be generalized or college specific (Dewberry & Jackson, 2018).
What is noted as the current generalized definition of retention in higher education is the
fall-to-fall comparisons as reported by the National Center for Education Statistics
(2020). This national data clearing house, which also provides the Integrated
Postsecondary Education Data System (IPEDS), is the agency considered as the expert in
the national benchmarks for all higher education (Dewberry & Jackson, 2018; Sass et al.,
2018; Swafford, 2017). Other terms that are associated with retention and have been used
interchangeably are completion, persistence, and student success (Manyanga et al., 2017).
Manyanga et al. (2017) continued and said that many institutions have defined and
delineated these terms differently and a general agreement to the term retention is agreed
upon in research. However, Manyanga et al. cautioned, generalizations about retention
can be misleading due to the uniqueness of each institution, academically, culturally, and
otherwise and should be considered carefully in research efforts.

20
Prior to the 1970s, student retention was seen as the reflection of individual
attributes, skills, and motivation (Tinto, 2006). Tinto (2006) further stated that students
who did not retain or persist were thought to be less able, less motivated, and less willing
to foresee the fruits of this college labor. In short, students failed, not institutions. That
view, and how institutions define student retention, shifted to consider the role of the
environment, the institution, and level of connectedness a student internalizes for the
decision to stay or leave (Olaya et al., 2020). This student retention definition continued
evolving to what it is today and now has the student variable and data mining descriptors
as part of this explanation (Garcia-Ros et al., 2019).
Nadasen and List (2017) stated that the difficulty is not of the definition of
retention in higher education, it is the lack of information available to track or predict the
retention of students, with a process for data mining and policy to inform best practices.
This is evidenced by Elnozahy et al. (2019) who stated that for new students to retain, the
supportive internal research needs to be accessible to inform practice on student variable
identification for tracking of those existing and retained students fall to fall. This is
discussed more specifically by Mahroeian et al. (2017), who defined and categorized the
perceptions of its participants toward the use of analytics and data mining in New
Zealand higher education. They found public and private 4-year upper management staff
had knowledge of data in three main categories: structural, functional, and
structuralfunctional. Mahroeian et al. further defined these categories via the participants’
perceptions. Those who perceived analytics in terms of the structural aspects leaned
toward quantitative elements such as statistics, digits, visualization, and metrics to inform

21
decisions. Mahroeian et al., suggested further study to gauge the foundational perceptions
and experiences in higher education related to data mining, use of analytics, and applying
variables. Just as they sought to deliver a better understanding of current perceptions and
values of analytics in higher education within the New Zealand by defining three
functional aspects of data mining, I also seek to do the same regarding efficacious student
variable application in tracking and predicting retention.
Applying and Identifying Student Attributes for Institutional Research
Understanding the student experience from academic, social, and functional
aspects of institutional connectedness can only be recognized and measured if all student
attributes are accounted for in internal research (Stage, 2000). Braxton (2019) suggested
that student data could not be identified for research in retention until specific areas for
future research were addressed. Braxton stated that these areas should be considered for
data mining and defining student attributes: (a) continued study of sociodemographic
characteristics of students, (b) the role of organizational behavior, (c) student
environments nested within different institutional settings, and (d) the effects of student
sub climates (p. 132). However, one such attribute being considered from a psychology
and emotional health point of view, student external commitments, is traditionally not
thought of as a measurement assigned in tracking retention in higher education (Tight,
2020). Tight (2020) continued and stated that institutions continuing to focus on the
obvious attributes such as race, socioeconomic status, SAT, and gender, are doing a
disservice to themselves and students by not attributing external commitment attributes to
retention research tracking.

22
A trending practice in higher education has been program review (Conrad &
Wilson, 2020). Conrad and Wilson (2020) suggested that institutions consider program
review as an opportunity to assess student retention at program and course levels. In
doing so, Conrad and Wilson continued, student attributes may emerge that can be used
as variables for tracking retention initiatives both at granular and institutional levels.
Manyanga et al. (2019) stated that few institutions truly have a retention agenda nor
agreed upon student attributes to apply as variables in these retention efforts. In various
retention models that have been discussed over the past few decades, Manyanga et al.
found that assessment and review at the course and program levels every 3 years should
be best practice. They continued and said that this best practice serves not only to inform
internal stakeholders of student satisfaction but to also reveal certain student attributes of
those who retain and can be applied as variables for tracking and predicting retention.
Premalatha (2019) agreed and stated, in her review of traditional outcome-based
education that included program review outcomes, that this model does not include a
process for identifying student attributes for retention. Premalatha continued that new
processes should be considered for outcome based education and program reviews to
include an intentional look at student attributes within these internal audits for student
success measurement and tracking for retention.
Higher education institutions have been faced with numerous problems ranging
from reduced student population, poor student performance, reduced funding and lack of
transparency in its operations (Baer & Norris, 2016). Krieb (2018) addressed this issue
from the poor student performance perspective. Krieb found that more study is needed to

23
identify additional student data for tracking retention to inform practice and policy overall
in higher education. Krieb brought a new awareness of the importance in identifying
student data for tracking retention at his institution, which is an outcome I hoped for this
research as well.
Tracking and Predicting Retention in Higher Education
Users of big data for retention tracking have shown inconsistency in its
application in higher education (Daniel, 2015). Daniel (2015) stated that this
inconsistency affects decisions made with respect to the experiences of the users,
institutional policies, and processes adopted by the institution. Daniel’s focus on big data
management in higher education emphasized identifying student data for tracking
initiatives as part of the big data management process for retention. Sperry (2015) stated
that there are valuable attributes to be considered in precollege student data when drafting
processes for retention initiatives. The importance of efficacious application practices for
student data in tracking and predicting student retention is evidenced by Niebel et al.
(2019) who said that some of the benefits of such practices are increased retention,
financial returns, and satisfaction of customers.
Tracking retention in higher education should consider the student body in its
entirety but not necessarily the identifying the same attributes applied as tracking and
predictive variables (Saunders et al., 2016). Saunders et al. (2016) indicated that subsets
of psychometric tools should be considered for retention tracking and potentially
predicting the retained student. They stated that this is not only complimentary to the
academic and demographic data that is commonly used in retention initiatives but also to

24
ascertain a students’ self-efficacy, confidence, and engagement for both in the classroom
and campus activities for connectedness. Xerri et al. (2018) agreed and stated that the
influence of student connectedness showed a direct relationship to the motivation to study
and therefore an increase in academic success that ultimately results in retention and
completion. Xerri et al. suggested that factors influencing this connectedness are largely
unknown and subsets of student psychosocial attributes would assist in not only gaining
this knowledge but further understanding the student journey in higher education. This
process for gathering subsets of psychometric or psychosocial data for tracking and
predicting retention was also suggested by Ganotice and King (2014). They stated that the
connectedness of students can potentially be measured from the perceived support of
faculty, parents, and peers—the most salient of these being that of the support of their
peers.
A current trend in higher education for student retention initiatives are high impact
practices (HIP; Provencher & Kassel, 2019). HIP are intended to bolster the support and
success of second year college students (Provencher & Kessel, 2019). They continued
and stated that early data has shown improved retention with students who are involved
with HIP. However, Provencher and Kessel (2019) were concerned that bias has occurred
with student selection for HIP and research should focus on institutions that shown
intentional equity of the HIP process, so retention data are not skewed. Murray (2015)
stated that HIP have shown increased student retention when considering student library
use and involvement. Murray suggested that student attributes for library use and
frequency be mined and used as retention tracking and predicting measures. In a similar

25
study, but a focus on asynchronous discussions boards for HIP, Perrotta (2020) stated that
this HIP also showed influence on increased student retention in the history program
being studied. Perrotta said that findings from this study set the stage for an increased
pursuit of student attributes from HIP and suggested that further research from qualitative
study would benefit.
Barriers to Data Mining
Lomet (2017) noted the importance of the protection of student data, the buy in of
faculty, and the cost effectiveness of any data mining tool for higher education. Bughlin
(2016) agreed and added that gathering big data for identifying variables requires a
system to mine and target an institution specific initiative but the barriers will be far
greater before the benefits can be realized. Nadasen and List (2017) stated that the
problem is the lack of information available to track or predict the retention of students
with a process for data mining and policy to inform best practices. Soares et al. (2016)
noted the lack of literature and research available to guide practice because much of the
literature is on Learning Management Systems (LMS), a specific academic group, or
small cohorts for identifying retention variables that only provides a narrow scope of
understanding in data mining. Wilderotter (2020) agreed and stated that a predictive
analytics model is needed for higher education that can be customized to specific
institutional needs while still underpinning best practice.
Important components to best practices in retention initiatives in higher education
are the attitudes and perceptions of administrators who have the responsibility for apt use,
defining, and application of, student data (Alsharari & Alshurideh, 2020). Staff and

26
faculty concerns of protected student information is another barrier to college
administrators’ application of data mining protocol for predictive analytics (Ekowo &
Palmer, 2016). Albalowi and Alhamed (2017) also addressed this concern, providing a
number of problems that have affected the adoption of data mining for student data
identification in higher education such as the culture or environment, absence of
appropriate infrastructure, and ethical issues related to the students.
Culture or Environment
Chaurasia et al. (2018) believed that user perceptions of analytics and data mining
tends to contribute to its acceptance and use as a medium for generating variables for
institutional research. They further added that many institutions do not have a culture of
data-based decision making because of these perceptions and therefore identification of
student data to assess learning as well as overall retention are problematic (Chaurasia et
al., 2018). Gagliardi et al. (2108) stated that the most significant challenges to the
adoption of data mining, specifically for variable identification used for internal research
in higher education, has been limited to perception of data managers toward the
institutions’ culture of this work. They continued by saying that data manager inability to
comprehend the benefits associated with the use of campus-wide analytics can adversely
affect an institution’s capacity to compete, perform their operation, develop a learning
culture, and retain students by potentially not wanting to share data, based on this
perceived data culture (Gagliardi et al., 2018). Cope and Kalantzis (2016) agreed and
stated that those higher education administrators who value introducing new methods of
thinking as well as a means of data-informed practice are typically met with barriers.

27
They went on to say that these barriers are the increasing cost associated with the
gathering, storage, analysis, and application of this data that is siloed and decentralized.
In addition to culture, Hadwater et al. (2018) stated that the barriers that have contributed
to the slow adoption of data mining efforts that identify student data for institutional
research include existing infrastructure, and institutional policies.
There is growing pressure for higher education to be a culture of evidence (Hora
et al., 2017). Hora et al. (2017) stated that data mining techniques applied to higher
education gives an institution the capabilities to improve institutional level operations
such as targeted recruitment for efficient admission operations for undergrad,
international, and graduate programming. Andrews and Lemons (2015) cautioned that
institutional level culture is not enough. They stated that for a decision-making culture
based on data evidence to occur, this practice needs to permeate to staff and faculty who
are responsible for the day-to-day services with students. Faculty still make decisions
based on personal experiences rather than data (Andres & Lemons, 2017). In any higher
education institution, there are multi levels of practice that feed into the culture of
learning (Klimek & Klimek, 2020). A seemingly monumental barrier to a productive shift
to a data driven culture will be the shared reality, vision, and trust of the IT department,
administrations, and faculty, said Klimek and Klimek (2020). They stated that for
dynamic development and dissemination of data technologies to occur, small steps with
data driven problem solving that require internal stakeholder integration can begin the
road to barrier removal.

28
Infrastructure
Cope and Kalantzis (2016) said that systems used by institutions of higher
learning do not support interoperable data analysis, suggesting that a wide range of data
for high level use and classroom data are stored in multiple online repositories and this
creates problems for narrowing down variables to identify as targets for internal research
efforts. Matsebula and Mnkandla (2017) noted that the absence of an appropriate
infrastructure specifically tailored for mining student attributes and behavior
characteristics in identifying variables has contributed to the inability for analytics to
support decision making in many facets of student success in higher education. Avella et
al. (2016) stated that student attributes can be collected, managed, and used to identify
variables for retention in many of the LMS purchased by institutions. However, Avella et
al. continued by saying that data mining from these LMS can be difficult. Albalowi and
Alhamed (2017) agreed but pointed out that although faculty pushback is the biggest
barrier, the benefits of the data mining capabilities in LMS can include improved student
placement, better enrollment rates, and enhanced attendance and academic warning
systems. Some institutions of higher learning have utilized certain LMS to evaluate the
quality of education offered, determine the enrollment rate, share profiles, acknowledge
the supported required in improving the learning experience, among other benefits
(Avella et al., 2016). Avella et al. continued by stating that these efforts are frequently
siloed and many still use manual data entry reporting such as excel sheet storage and
updates. Manual tracking systems and siloed data practices have proven to be ineffective
in resolving student retention in higher learning institutions (Matsebula & Mnkandla,

29
2017). Williamson (2017) acknowledged this and stated that educational data science has
predictive algorithms for retention in its grasp, but the level of expertise, manual tracking,
and available workforce can be a barrier. Williamson added that retention data should be
housed as a centralized data warehouse, but the responsibility of its use and application
should be widely dispersed with proper training and respect for protected student
information, as ethical issues are an ongoing concern.
Institutions of higher learning face new challenges relating to student information
uptake and internal analysis (Arendsdorf & Naylor-Tincknell, 2016), including
information related to global economics, political change, and ensuring the programs they
offer are relevant to market needs locally and nationally. Chaurasia and Rosin (2017)
added that, due to competition, institutions find themselves under immense pressure to
analyze and decipher large data sets, as doing so puts them ahead of the competition.
However, Stefanova and Kabakchieva (2017) contended that literature is inadequate to
support the knowledge base needed to apply data for retention efforts. Shein (2020)
agreed, stating that the knowledge base needed for data managers in higher education is
simply not in the literature.
Utilization of student data applied as performance indicators in tracking retention
in higher learning has been considered effective (Varouchas et al., 2018). Varouchas et al.
(2018) continued by stating that in higher education, data mining for student variable
identification for internal initiatives can be obtained from several sources such as social
media, information and learning systems used in the institution, and swipe card data. Data
mining processes such as these include a high velocity, volume, and variety of raw data

30
that is needed to be applied in tracking or predicting retention (Attaran et al., 2018). The
problem with this data mining is the lack of consistency, knowledge of data application
best practices, and sensical policy to align such endeavors (Varouchas et al., 2018). A
data mining model in educational settings is best used concurrently with data analytics
and the knowledge base required to understand the diversity, size, and speed of data
(Huselid & Minbaeva, 2019). The updates to the higher education data mining systems,
however, are long overdue (Tsai et al., 2015) and the research is not available for higher
education administrators to use as guides for retention tracking process and practice. Tsai
et al. (2015) continued by saying that management, processing, and application of
variables from large sets of data to track and predict success cannot be accomplished by
simple excel sheet formulas that were once considered traditional means. The collection,
management, and identification of variables for retention requires a more sophisticated
approach.
Ethical Issues
Roberts et al. (2016) indicated that the use of analytics tools in the higher
education sector has outpaced the ethical aspects associated with its usage. From the
perspective of higher education, data analysis related to students has comprised of
demographic details, enrollment survey results, student course assessment, the use of
library facilities, the academic performance of students, among others (de Freitas et al.,
2015). Elhassan and Klett (2018) suggested that an ethical perspective is needed to
consider student’s participation in decision making in order to promote a healthy
institutional climate so unbiased student data is being gathered from student attributes and

31
behavior characteristics needed for identification of variables for retention by the
administrators.
Ethical concerns related to data mining for student data is captured in the Roberts
et al. (2016) study. They indicated that the use of analytics tools in the higher education
sector has outpaced the ethical aspects associated with its usage. Roberts et al. continued
that the nonexistence of the students’ voices regarding the use of data mining has
presented challenges related to the acceptability of student attributes and behavior
characteristics use for identifying variables for further study. From the perspective of
higher education, data analysis related to students has comprised of demographic details,
enrollment survey results, student course assessment, the use of library facilities, the
academic performance of students, among others (de Freitas et al., 2015). Elhassan and
Klett (2018) suggested that an ethical perspective is needed to consider student
participation in decision making in order to promote a healthy institutional climate so
unbiased student data are being gathered from student attributes and behavior
characteristics needed for identification of variables for retention by the administrators.
Further, Lacerenza et al. (2018) stated that successful teams produce desired outcomes
but it is critical that team members demonstrate effective processes to achieve these
outcomes. They continued and stated that team development interventions are salient to
team survival but adherence to data policy and ethics is salient to institutional survival.
Summary and Conclusions
Major themes in the literature were discussed in relation to the key concepts of
defining retention in higher education, applying and identifying student attributes for

32
institutional research, tracking and predicting retention in higher education, barriers to
data mining. Defining retention in higher education can be both generalized and
institution specific (Dewberry & Jackson, 2018) depending upon the college mission and
accrediting body expectations (Conrad & Wilson, 1985). Tight (2020) stated that higher
education is missing an opportunity in tracking retention by not considering attributes to
apply as variables directly related to student external commitments.
What is Known
What is known about tracking and predicting retention in higher education is that
there is an overabundance of large unstructured data that needs to be disaggregated to
find the nuggets of significance for internal research (Huselid & Minbaeva, 2019; Shein,
2020) and the old system of manually gathering data from siloed data systems that do not
integrate, further increases institutional instability (Soares et al., 2016). Research
literature yields plenty of data mining options for higher education in regard to LMS
(Krieb, 2018) but these studies focus on variables that only serve academic purposes and
not those that inform policy and practice on campus wide data mining integration,
experiences and knowledge base of data administrators, nor the process for identifying
student data in tracking or predicting retention (Avella et al., 2016; Baer & Norris, 2016).
What is known about identifying student data from attributes and behavior
characteristics that are needed for tracking and predicting retention can be obtained from
a number of sources such as social media, information, and learning systems used in the
institution, and swipe card data among others (Varouchas et al., 2018). However, the
problem with this data mining is the lack of consistency, knowledge of data application

33
best practices, and sensical policy to align these undertakings (Chaurasia et al., 2018).
This all plays into the ethical dilemma that poses barriers in higher education if aligned
policies for best practices are not transparent to the staff, faculty, and students regarding
the use, storage, and outcomes of protected data (Elhassan & Klett, 2018).
What is not Known
What is not known in the areas of student variable identification and its place in
the efficacious tracking and predicting of retention in higher education are the perceptions
and experiences of the data administrators to this process that would directly inform
policy and practice (Gagliardi et al., 2018; Hadwater et al., 2019). Further, data managers
inability to comprehend the benefits associated with the use of campus wide analytics can
adversely affect the institutions’ capacity to develop a learning culture and retain students
by potentially not wanting to share data, based on a perceived data culture that may exist
or not (Hadwater et al., 2019). Higher education leaders need to know that the actual
barriers that may exist given the data manager knowledge base and a culture of data
support or not have contributed to the slow adoption of data mining efforts that identify
student data for institutional research (Ekowo & Palmer, 2016). These perceptions and
experiences from data administrators in higher education can prove to be valuable in the
evolution of data analytics for institutional stability (Albalowi &
Alhamed, 2017).
Gap in the Literature
This study seeks to fill the gap in literature that is needed to inform the practice of
identifying student data for tracking and predicting retention. Further, the outcomes of

34
this study aim to fill the gap in the literature regarding what is not known regarding the
process of data mining for student data, and that is the experiences and perceptions of the
college administrators responsible for these efforts. I also seek to have similar results as
Krieb (2018) in bringing awareness and understanding to those administrators in higher
education needing research results to inform a gap in the practice for identifying student
data in tracking and predicting retention. By accomplishing these objectives, this current
study will fill this informational research gap, thus benefiting future researchers who may
desire to explore and add on this topic.
Transition
The next chapter will detail the research design and method as well the process for
participant selection. Further, in Chapter 3, a discussion of the internal and external
validity will be explored, the role of the researcher, and data analysis plan and treatment
of the research data. A final summary will unify the information and complete the chapter.
Chapter 3: Research Method
The purpose of this basic qualitative study is to explore and describe perceptions
and experiences of administrators of 4-year colleges and their identification and
application of student data for tracking and predicting retention. In this chapter, the role
of the researcher as well as methods, design, and validity of research is discussed in
relation to the purpose of this study. A detailed description of participant recruitment and
selection strategies is discussed as well as the data analysis plan. The data analysis plan
includes a discussion of internal and external validity as well as adherence to ethical
procedures. Chapter 3 ends with a summary and segue into Chapter 4.

35
Research Design and Rationale
I used a bbasic qualitative research design to address the research question: What
are the perceptions and experiences of higher education administrators in terms of the
application of student data targeted for tracking and predicting retention? The central
phenomenon of the study is the application of student data for tracking and predicting
retention and how this process is perceived or experienced by administrators responsible
for such responsibilities at 4-year institutions. I wanted to make sense of the data analysis
process and inform practice in higher education regarding how student data may be
identified and influence retention initiatives. According to Barbour (2014), researchers
should confer with participants by asking questions and inferring meaning from
responses.
The basic qualitative research design is appropriate for this study because the RQ
is broad and open to unexpected findings. Knapp (2017) said the basic qualitative study is
appropriate to explore experiences of participants with knowledge of the topic and ascribe
meaning to those experiences. The basic qualitative design is also appropriate to explore
college administrators’ perceptions about the phenomenon of efficacious application of
student data for tracking and predicting retention. This design allows participants to
provide thick and rich accounts of their experiences and perceptions (Korstjen & Moser,
2017; Merriam 2015). Also, basic qualitative research is used to examine natural
circumstances in which individuals function to provide a practical understanding of real-
world problems (Korstjen & Moser, 2018).

36
Role of the Researcher
With the basic qualitative research design, the role of the researcher is to be the
instrument for gathering and analyzing data (Silverman, 2016). Qualitative researchers
influence the research process because study participants interact with researchers. In this
study, the interview process allowed relationships to be built. This influences the research
process and its findings, which is why it is important for me to be transparent about my
perspectives as the researcher and explicitly acknowledge any subjectivity.
My professional role is director of retention and completion at a 4-year private
nonprofit university. Inherent biases can threaten the trustworthiness of the study if not
kept in check. Shufutinsky (2020) suggested self-checking, which includes reflection,
feedback, and mindful consideration during qualitative research. Shufutinsky said
qualitative research is generally rooted in interpretivism, and therefore, the researcher is
responsible for the interpretation of participant responses. I used bracketing and epoche
methods to mitigate preconceptions and presuppositions that could taint the research.
Epoche practices are those practices that allow for active suspension of assumed
understandings by journaling throughout the research process and note taking during
data collection (Shufitinsky, 2010). Bracketing and epoche are often used interchangeably
in practice (Butler, 2016). The researcher, as the main instrument of the research, must be
constantly conscious of internal ideas, perceptions, values, prejudgments, and
connections to the topic under study (Creswell, 2013). Journaling throughout the study
process in its entirety and reflective note taking during data collection helps mitigate
research bias through awareness of self and processes.

37
As a qualitative researcher, I employed empathy as well as distance. Empathy
entailed putting myself into participants’ situations in order to better understand their
intent and meaning. Distance involves necessary awareness of my own values, which can
negatively influence data collection, and as the researcher, I must remain nonjudgmental
and nondirective. I did not have any known relationships with participants as coworker or
supervisor. This removes any potential power relationship with participants. No
information was purposefully omitted or altered. I acknowledged the importance of being
aware regarding my role during processes of collecting, analyzing, and interpreting data,
as well as mitigating preconceived biases by conducting a test run of interviews. These
efforts mitigate bias.
Methodology
This section includes procedures for coding and analyzing data, as well as
methods to ensure trustworthiness and ethics in research.
Participant Selection
The participant sample consisted of approximately 10 administrators from 4-year
U.S. colleges. Sample size result in qualitative research is determined by data saturation
(Etikan, 2016; Guetterman, 2015). Sample size for qualitative studies can vary when
using interviews for data collection. To recognize that data are saturated, some analysis
must occur during data collection. The researcher must notice when participant responses
become repetitive. I estimated that no more than 12 participants were needed to reach
data saturation; this was determined during the interview process. According to Patton
(2015), it is an acceptable practice in qualitative research to check with interviewees for

38
more information to enrich or clarify data to meet data saturation. If saturation is reached,
there is no need to seek additional interviews because themes, patterns, and concepts
repeat, with no new information being collected (Merriam & Tisdell, 2016). Selecting an
appropriate number of participants for a study leads to manageability of the data results,
richness of data, and relevant participant characteristics.
Chosen participants had decision-making responsibilities in their institutions.
Participants for the study were chosen via criterion-based selection, a form of
homogenous purposive sampling. Participants needed to have student data identification
or tracking and predicting of retention initiatives among their responsibilities. They were
identified through institutional public websites that list higher education administrator
profiles and contact information. The first 10 individuals identified as fitting roles and
criteria for participation in this study were selected and sent recruitment letters via email.
Email addresses were retrieved from public websites that were randomly chosen.
What follows are procedures for how participants were identified, contacted, and
recruited. An IRB approved letter of consent was sent via email. This consent outlined the
intent of the study, participants identity protection, treatment of data, and statement of
voluntary participation. Those who agreed completely filled out and signed the consent
form and returned it to my personal Gmail address listed in the consent form. Depending
upon participant location, the interview choices consisted of face to face, virtual, or
phone. Given the 30-day time frame that was presented in the introductory request letter,
the participants specified the best days and times for the interview and the preferred
format. The format of semistructured interviews are flexible and versatile, making them a
popular choice for collecting qualitative data (Kallio et al., 2016). They are a

39
conversation in which the researcher knows what she/he wants to cover and has a set of
questions and a foundation of knowledge to help guide the exchange and can be done face
to face, phone or virtual, depending upon research and participant preference (Magaldi &
Berler, 2018). Given the current COVID-19 restrictions the goal was to create a safe
space so the participant felt comfortable to reflect upon his or her own personal
experiences while maintaining social distancing protocol (CDC, 2020).
Instrumentation
Data collection was achieved through researcher-produced questions for
semistructured interviews. The questions found in the Appendix A, are based on the
literature review conducted relating to data mining practices for student variable
applications in tracking and predicting retention in higher education, as well as the
conceptual framework models chosen for this study. Also, in designing queries for
interviews, I was sure to use language that most participants are likely to understand
(Rubin & Rubin, 2012). Literature and the conceptual framework for this study guides the
development of the research question, but it was important to develop and use open ended
interviewing methods to avoid guiding participants’ answers (Rubin & Rubin, 2012). I
started with what Rubin and Rubin (2012) call a tour question that has participants talk
about their broad activities in their administrator role before asking about specific
experiences in student data applications in retention initiatives. The tour question is
intended to open a frame of context for participants to consider in a broad sense, while
the accompanying probes are worded to promote confirmation, clarification, sequence,
continuation, elaboration, and credibility (Magaldi & Berler, 2018). In this case, the

40
questions for phone, virtual, or face to face interviews are appropriate for qualitative
research given its fluidity and participants’ ability to elaborate on their answers
(Brinkmann, 2016). Each interview will last for approximately 60 minutes to provide
each participant with enough time to express and elaborate on each question (Magaldi &
Berler, 2018).
Basis for Instrument Development
The semistructured interview questions were created by me and follow protocol
from previous qualitative studies (Castillo-Montoya, 2016; Kallio et al., 2016; Magaldi &
Berler, 2018). Kallio et al. (2016) used a protocol for semistructured qualitative
interviews that included five phases: (a) identifying the prerequisites for using
semistructured interviews, (b) retrieving and using previous knowledge, (c) formulating
the preliminary semistructured interview guide, (d) testing the guide, and (e) presenting
the complete semistructured interview guide. I referred to these steps during the drafting
of the semistructured interview questions.
In a similar manner of study, Castillo-Montoya (2016) developed the interview
protocol refinement (IPR) framework for the development of an interview protocol. The
IPR method aims to support efforts in reinforcing the reliability of interview protocols in
qualitative research. The framework includes, constructing the interview questions and
ensuring interview questions align with research questions, has been completed (see
Appendix A). In this study, the interview protocol was used to address the RQ. To guide
my creation and alignment of the interview protocol, I used the Types of Interview
Questions from the IPR framework (Table 2). I also used the Types of Interview

41
Questions table as a reference to ensure internal validity (Castillo-Montoya, 2016).
Referencing this process ensured clarity, focus, and sufficiency of the questions to prompt
accurate responses that are aligned to the RQ.
Table 2
Types of Interview Questions
Types
Explanation of Type
Introductory
Questions that are relatively neutral eliciting general and
nonintrusive information and that are not threatening
Transition
Questions that that link the introductory questions to the key
questions to be asked
Key
Questions that are most related to the research questions and
purpose of the study
Closing
Questions that are easy to answer and provide opportunity for
closure

42
Note. From “Preparing for Interview Research: The Interview Protocol Refinement
Framework” by M. Castillo-Montoya, 2016, The Qualitative Report, 21, p. 823.
Magaldi and Berler (2018) said interviews are an accessible, affordable, and
effective method to understand a phenomenon in the world of research. Their approach
suggests that semistructured queries are an interpretive framework where the data
collected is not viewed as evidence of the truth or reality of an experience but rather a
context-bound and subjective insight from the participants. In this way, Magaldi and
Berler suggested that the researcher needs to be open to new insights and to honor the
participant’s experience in data collection by using the basic qualitative design to abut
this method that is exploratory in nature and permits the collection of rich data which can
answer questions about which little is already known.
Procedures for Recruitment, Participation, and Data Collection
Once IRB approval is received for this study, a criteria-based sample was
recruited to yield approximately than 12 administrators from a 4-year, U.S. institution.
Potential participants were identified through a higher education random google search of
4-year institutions’ public websites. Email correspondence to those academic leadership
having contact information listed on their institutions’ public site will commence to those
who have a job title, job responsibilities, or job description that involve data mining,
student variable identification and application in research initiatives, and participation in
tracking and predicting retention on any level at their institution. This initial email will
contain the details of the study on the 30-day timelines for the interviews, volunteer

43
consent, treatment of the data, confidentiality of the participants, and the purpose of this
study.
A minimum of 50 email invitations were sent for the first round of recruitment to
seek the approximately 12 participants. Return emails of interest from potential
participants will yield a self-identification for meeting the approved criteria. This will
continue until approximately 12 participants are identified. Each week an additional 25
institutions were googled for participants meeting criterial and contact information
displayed on their institution’s public site. This continued each week until the minimum
number of 10 but no more than 12 participants meeting the criteria and accepting the
terms is met. Participants who returned the emails with interest received the letter of
informed consent within 24 hours to review and sign. Any participant that showed interest
but did not respond were sent two additional follow up emails to confirm their interest or
not. Should there have been participants who were unwilling for any reason to continue in
the study at any time were told they may contact me via my listed email and I would have
removed them from the study.
All interviews were recorded with the Google transcribing tool that is a voice to
text software. The use of this software supports the need to ensure valid and reliable data
from the interviews as well as have a cross checking system for me to review for
accuracy (Creswell & Poth, 2016; Given, 2008). This process was performed while
keeping the participants’ identity protected and honor the confidentiality of the
participants, in case they would inadvertently provide identifying information and need to
be redacted. The interviewees were informed of potential follow up, within 2 weeks after

44
the interview, via email if further clarification is needed. At that time, all participants will
receive an email stating that the interviews are completed, and the analysis has begun.
Any participant interested in viewing the final study can email a response and a copy was
emailed upon completion.
Data Analysis Plan
What follows are the data analysis approaches for this study. I used Feng and
Behar-Horstein’s five-step procedure to analyze the data collected for the study:
1. Step one is data cleaning and participant coding alignment to responses in an
excel sheet format or manual first round transcript coding.
2. Excel sheet data or direct transcript was imported to NVivo software system.
3. Word frequency analysis will then be conducted through NVivo word
frequency query feature.
4. Text coding and reference extracting includes the text search query feature to
identify the most frequently occurring words to code the responses content of
all sentences or paragraphs for each participant within each question. NVivo
refers to these words as nodes. Nodes are also known as categories in the
qualitative induction coding process. Content that includes the most frequently
occurring words were identified as references of the nodes. The text coding
summary from NVivo shows the number of references for each node or
category.
5. Matrix coding, mind mapping, and data relationship queries for continued
inductive analysis allow comparisons across and between different nodes or

45
categories and references to categories within the participant responses for
themed focus.
Software programs can be useful in organizing large amounts of data and assist
the researcher with assigning codes to data (Korstjen & Moser, 2018). The use of
software can simplify the analysis process without sacrificing any significant meaning
found within the data. I used inductive coding to tag meanings in the perceptions and
experiences of student variable identification from participants (Merriam & Tisdell,
2015). Given the probability of diverse responses, inductive coding was used as a cross
check to NVivo in the matrix coding and inductive analysis step of Feng and Behar-
Horstein’s data analysis approach. This will continue with each component of the RQ:
perceptions and experiences of student variable application to research, perceptions and
experiences of student variable identification in tracking and predicting retention, and
perceptions and experiences of student variable applications in tracking and predicting
retention. The bigger categories are the overarching themes while the subcategories are
theme supporters (Korstjen & Moser, 2017). NVivo software analysis uses the word
nodes for the subcategories and theme supporters as references to nodes that feed into the
major themes to be addressed in the RQ (Feng & Behar-Horstein, 2018; Welsh, 2002).
This is where the participants’ responses become a story from the data. The themes can
tell the same story from different perspectives, or several different stories that connect
with each other (Given, 2008). This final phase in analysis involves connecting the stories
through connecting themes in data with word clouds, frequencies, percentages, or tables
to finalize the analysis from NVivo and researcher notes (Babchuk, 2017).

46
Once the data are collected, I analyzed it through the matrix coding approach. I
also employed an iterative process throughout the data analysis process for the purposes
of organizing and managing the data (Babchuk, 2017; Given, 2008; Merriam, 2015). This
process will involve labeling interview notes, transcripts, and participants with
confidential identifiers. This process included organizing key elements of the data
relevant to this study, including a priori and axial coding systems (Babchuk, 2017;
Merriam, 2015). The a priori codes were created from the conceptual framework
supporting this study from Attarran et al. (2018), and Gandomi and Hader (2015). A priori
codes were highlighted in the transcripts as key words and phrases. During the open
coding procedure of the study, I used repetitive words and phrases of meaning that
emerge from the data, as well as those seen as emphasized by the participants, (Korstjen
& Moser, 2017) to be designated as codes (Merriam & Tisdell, 2015). During the final,
axial coding I categorized codes into groups and identify patterns that will become major
themes (Lichtman, 2017). This final process formed the basis for my findings and
conclusions of this study (Creswell & Poth, 2016).
In basic qualitative studies a researcher must identify and assess discrepant data
(Levitt et al., 2017). Discrepant data is an occurrence that cannot be accounted for or
explained and can signal defects in the data (Korstjen & Moser, 2018). It was important
to examine and confirm discrepant data, the inconsistent pattern of data, with that of the
other resources and review with participants. Maxwell (2008) stated that distinction
between categories or themes may be the source of negative or discrepant data and can be
resolved with probing questions or follow up review with participants. Once this is

47
completed, the discrepant data will be shared in the analysis and findings of this study
and explained (Creswell & Poth. 2016).
Trustworthiness
Trustworthiness in qualitative research must demonstrated to show proper
methods and rigor were used throughout the data collection and analysis process
(Babchuk, 2017). Protocols in trustworthiness include demonstrating credibility,
transferability, dependability, and confirmability (Amankwaa, 2016; Korstjens & Moser,
2018). Maxwell (2008) stated that researcher bias is a thread throughout the research
process that provides a quality of awareness and that we should not suppress our primary
experiences. He continued and stated that, conversely, we do not allow this awareness and
related experiences to overwhelm nor drive the research process, but rather elevate
mindfulness and use it as part of the inquiry process. Lichtman (2017) stated that the
researcher is the conduit through which participant relationships are built to yield insight
in the data. Lichtman explained that self- reflection and subjectivity within the steps of
building participant comfortability in the interview process for data collection does not
cause a paradox or confusion. Rather, the researcher creates the awareness needed to
show the sense of self and therefore demonstrates deep understanding that directly
influences all aspects of trustworthiness in qualitative research (Lichtman, 2017).
Credibility
Credibility was authenticated in this study by assuring the participant response
was received as it was intended through member checking (Patton, 2014). As stated by
Korstjen and Moser (2018), I repeated probing questions, take side notes during the

48
interview, and sharing the tentative results of data analysis with the participants via email.
An agreement with Madill and Sullivan (2018) I used member checking to repeat the
interview questions with different tone or wording without changing the meaning. I
provided participants with the opportunity to restate their answers during the interview
and amend the meaning of their statements after the interview (Madill & Sullivan, 2018;
Patton, 2014). I did, during interviews, noted vague responses, repeated questions with
clarifications, and reflected participants statements back to them for clarification (Madill
& Sullivan, 2018).
Another credibility authentication method that I used is reflexivity. Korstjen and
Moser (2018) described this as the process of critical self-reflection about oneself as the
researcher and one’s biases, preferences, and presumptions as well as the relationship to
the participants and how this relationship may affect their answers to questions. As
Maxwell (2008) advised, I maintained a reflexive, internal credibility process during the
semistructured interviews. By journaling and taking notes throughout each interview, I
monitored my own explicit and implicit assumptions in all phases of this qualitative study
to enhance credibility (Maxwell, 2008).
A third process to confirm credibility in the study is how discrepant data was
handled. Negative or discrepant data is described by Patton (2014) as exceptions to the
patterns found in the data. When negative or discrepant data occurs, I reviewed and
reflected from a cross checking perspective via interview recordings, researcher memos,
and journal to determine useful support of the study as suggested by Bashir et al. (2008).
This allowed me to record the experiences of participants within and beyond the

49
immediate context (Korstjen & Moser, 2018). So, I continually checked and verified the
data processes to ensure that the results are robust, rather than a simple justification of
any assumed findings (Spiers et al., 2018).
Transferability
Transferability relates to the ability to transfer the results of the study to a
population differing from the one used in the data collection (Amankwaa, 2016; Babchuk,
2017; Kallio et al., 2016). Participants were selected from those serving in decision-
making positions in higher education from 4-year, U.S. institutions. Criteriabased
selection was used to recruit higher education administrators with specific knowledge in
data mining, student variable identification and application for internal research, and the
tracking and predicting of retention on any level at their institution. By providing this rich
description of the participants and the research process, the reader of this study can decide
whether the findings are transferrable to their setting (Korstjen & Moser, 2018). Korstjen
and Moser continued and stated that the reader, not the researcher, can make the
transferability judgment. The job of the researcher is providing as much context as
possible so lens can be clear for the reader to see applicability to their setting or not
(Arensdorf & Naylor-Tincknell, 2016).
Dependability
Dependability is also necessary in a basic qualitative study to show reliability of
the data collection and the analysis (Amankwaa, 2016; Babchuk, 2017; Kallio et al.,
2016). For this study, audit trails will be easily accessible in a few forms from the start of
this research study to the development and reporting of the findings as needed to show

50
transparency as stated by Korstjen and Moser (2018). Once such audit trail can be found
in the records of the research path that are to be kept throughout the study and 5 years
after its completion. I have this information password protected and kept at my home
office with desk drawer key that I alone can access. Another audit trail used in this study
was the a priori coding system protocol used by the researcher for the interview questions
and audio transcription for cross checking interview data of the participants as suggested
by Babchuk (2017). Finally, the handwritten reflexivity notes and journal will be
accessible as well as the recordings of the participant interviews for review as needed
(Silverman, 2016). This protocol follows a specific stage by stage process from general
memo taking and journaling through reflexivity, taking the priori coding in the interview
questions that can be further used during the data collection process through deductive
coding and cross checking with the NVivo software (Feng & Behar-Horenstein, 2019).
Confirmability
Confirmability refers to objectivity or the ability of others to confirm findings
(Stahl & King, 2020). Confirmability refers to the researcher’s transparency and
documentation of processes (Korstjen & Moser, 2018; Nowell et al., 2017). As Koch
(1994) recommended, I included markers, such as the reasons for analysis choices, so that
others can understand how and why analysis decisions were made. I enhanced
confirmability in this study by describing the process used for data collection and analysis
as suggested by Meadows (2003). I provide a detailed description of the sequence for
data collection, coding, and analysis to deliver a clear and well-defined accountability for
the process (Bochner, 2018; Meadows, 2003).

51
Ethical Procedures
I submitted a request for internal review board (IRB) approval before conducting
any research with human participants. This process is in place to hold accountability for
researchers. The IRB document contains questions that must be answered by the
researcher in regards to participant selection criteria, informed consent document, contact
intended for any vulnerable populations, instrumentation tool and how it was used, and
treatment of data. Once all research protocol met the standards for the protection of
participants, then approval was given (IRB Approval # 04-22-21-0672595). Upon IRB
approval the potential participants were contacted via email with informed consent that
includes the purpose of the study, type of data collection, and any risks if indicated.
Further, the informed consent clearly stated the voluntary nature of participation and
ability to withdraw at any time as well as complete confidentiality during and concluding
the process of the study. The study did not require the use of vulnerable populations.
Further, the participants of this study could leave at any time during the process. The
semistructured interview questions approved by the IRB are found in Appendix A. I did
not be conduct this research in my direct work environment nor with any higher
education professional known to me, so these rule out any potential conflict of interest or
power differentials. I have chosen not use participant incentives for this study.
Treatment of Data
All email correspondence taken place beginning with participant recruitment up
until data analysis will remain in a password protected hard drive. All transcribed audio
recorded data are kept within google docs account that only I can access and is password

52
protected. Any handwritten notes to support data in hard copy file format are housed in
my home office within a locked drawer and I am the sole key holder. Participant names
were coded to protect anonymity during data analysis and when delivering the study
findings. Confidentiality was maintained throughout the process by changing the names
of the participants and general references to 4-year schools without identifying name of
schools. It is required to keep all data and results for 5 years after the completion of the
study (Babchuk, 2017; Knapp, 2017). After the 5-year period is concluded all files will be
either shredded or deleted as indicated for hard copy and electronic copies of the research
study.
Summary
This chapter explored all that is involved in participant selection, recruitment, and
the data collection and analysis that comes from the instrumentation. Trustworthiness and
ethical procedures being followed for this study were also briefly discussed. Once
completed, this study will offer an account of the perceptions and experiences of
administrators of 4-year, U.S. colleges regarding the application and identification of
student data for tracking and predicting retention. Participants are selected based on certain
criteria needed in either their job title, job responsibilities, or job description. Recruitment
for at least 10 but no more than 12 participants began with a random Google search of all
4-year, U.S. colleges that have public websites. Within these websites, another search was
conducted to view any administrators that may meet the criteria for data mining, student
variable identification and application to internal research efforts, and predicting and
tracking retention on any level at their institution. Contact information posted allows for

53
email and phone contact to recruit participants. Protocol was followed for the IRB approved
informed consent and the researcher produced semistructured interview questions. The 30-
day timeline started the day the participant sent back the approved and signed informed
consent form. This 30-day timeline allowed for flexible dates and times for participants as
well as any time needed for brief follow up. In the next chapter, I reflected upon the details
of the study results through the discussion of the data
collection, analysis, and trustworthiness of this study.
Chapter 4: Results
The purpose of this basic qualitative study was to explore perceptions and
experiences of administrators of 4-year colleges in terms of their application of student
data for tracking and predicting retention. This study was driven by the RQ: What are the
perceptions and experiences of higher education administrators of 4-year colleges in
terms of the application of student data targeted for tracking and predicting retention?
Efforts to answer the research question are further described in this chapter. This chapter
includes the setting of this study as well as specific participant information. describe
minimum requirements for participation. A brief description of the data collection process
precedes the data analysis section that is the bulk of Chapter 4. A thematic coding
approach was used via NVivo. This coding process is discussed in detail in the data
analysis section. A brief summary of the chapter follows with a transition to Chapter 5.
Setting
Participants in this study were chosen from 4-year higher education institutions
that had either a direct responsibility for retention initiatives or were indirect supervisors
or committee members. Of the participants, four were from private and six were from

54
public nonprofit 4-year colleges. Four participants had direct experience with identifying
student data for retention initiatives, and it was in their job to do so as administrators.
Three participants were also directly involved with identifying student data for retention
initiatives via the nature of their direct student advising roles and specific student success
data, analysis, and outcomes. Three participants were indirectly involved in identifying
student data for retention initiatives via membership and supervision of a student service
team that was tasked to do these responsibilities in either academics, student support,
athletics.
This study was conducted during the COVID-19 pandemic. My focus was on
perceptions and experiences of participants regarding data for student retention initiatives.
Participants talked little about the pandemic and the influence of mandates on their
retention initiatives. This could have been an unexpected effect to consider during data
interpretation; however, during the inductive coding process, these items became
irrelevant to the results, as participants did not relate any of the interview questions to be
influenced by the pandemic.
Data Collection
The 10 semistructured interviews with participants currently employed in
administrative higher education roles served as sources of data. Each participant had
direct or indirect responsibilities for defining and selecting student data for retention
initiatives at their 4-year U.S. institution (see Table 3).
Table 3
States Represented by Study Participants

55
Number of
Participants
State
1
Indiana
1
Michigan
2
Missouri
2
Pennsylvania
4
Ohio
Each interview was manually coded for initial patterns in the interview data as
well as researcher notes and memos during interviews. Interviews were conducted
remotely and audio recorded and transcribed via the Google transcription tool. After
receiving consent from each participant, they were assigned a participant number to
safeguard confidentiality and privacy. Each participant engaged in one Zoom or Google
Duo meeting that lasted 45 to 60 minutes. The format was dependent upon participant
preferences given their preferred software platforms for virtual meetings. I encouraged
each participant to schedule meetings at their convenience where they could be either in
their own home or a private office if they chose their work environment. In doing so, each
participant would have only those around them they felt comfortable with. Before the
start of each interview, I reminded them of the consent form and meeting recording and
transcriptions, and thanked them for their time and commitment. Once interviews were
completed over the course of a 3-month period, I read each transcript thoroughly while
listening to audio recordings to correct any grammatical or inaccurate transcriptions
errors. There were no notable variations during this procedure. I then began the manual a
priori coding process. I then uploaded data to NVivo 12 for data reorganization to begin

56
data exploration. This process was the beginning of coding relevant information that
would generate themes to answer the RQ.
Initially, the number of participants sought was at least 12. However, data
saturation was reached after 10 participant interviews. Saturation occurred when no
additional data were found that was different from the first nine participants. As I saw
similar experiences and perceptions related to the RQ repeatedly, I became confident that
data related to answering the RQ was saturated. During data collection, I began to see
repeated patterns in transcripts during the sixth interview. However, in order to address
diversity of data and to make certain that saturation was based on the widest range of
data, , I continued with four more participants to confirm saturation.
Throughout the data collection process, the semistructured nature of the interview
tool allowed participants to lead the discussion and provide open ended answers for their
experiences and perceptions regarding the evolution of data mining at their institution.
Further, the open ended semistructured interview tool also allowed the participants to
describe their specific duties related to the retention initiatives and student variable
selection and defining processes.
Data Analysis
A framework analysis was conducted and consists of several stages such as
familiarization, identifying a thematic framework, coding, charting, mapping and
interpretation (Stahl & King, 2020). A framework analysis is used in qualitative research
when a naturalistic approach to data gathering is sought and the researcher seeks to
understand phenomena in context-specific settings. The real world setting allows the

57
participants to be comfortable in the research process and the researcher does not attempt
to manipulate the phenomenon of interest and only try to unveil the ultimate truth
(Bochner, 2018).
Data analysis began with the initial a priori coding (see Appendix C) of audio
transcripts. Each transcript was reviewed line-by-line for six a priori codes. Once initial a
priori coding was complete, I began open coding. I completed line-by-line manual open
coding of transcripts to determine additional codes found repeatedly throughout each
transcript. Audio transcripts with completed a priori and open manual coding of all 10
interviews were then uploaded to NVivo 12. Each was loaded and labeled as a case file
with designated participant confidential identifiers. Each case file was manually coded
within NVivo to create a second coding process of interviews. This helped the analysis
process remain consistent in terms of emphasizing key points during coding that were
cross-checked with researcher notes and memos during the open coding process. This
resulted in 811 initial codes initially. Some of the most common codes, found five or
more times in transcripts were: not data informed, no communication among programs
and departments, lack of defined processes for retention initiatives, student attributes
changing from term to term, lack of leadership driving best practices for student
retention, lack of knowledge of who is responsible for identifying student attributes and
variables for research, faculty and staff frustration, lack of centralized data warehouse
platform, lack of data mining knowledge, lack of people to gather data for student
retention, reactive rather than proactive decisions, lack of internal-external resources for
analytics software, and lack of transparency for student retention initiatives.

58
During the selective coding phase, I searched to find categories emerging from
similarities in open codes. Using word-mapping and relationship types queries in the
software, I took all the vignettes and the open codes and mapped them into a tree-map
and word cloud. Diverging instances of the identified patterns and trends were noted from
the narratives of the participants and they gave new meanings to my understandings of
the text. Some coding patterns found most common, five or more times in the transcripts,
in this selective coding process were: inconsistent data tracking, no common data mining
definitions, no common data mining process, decentralized student retention initiatives,
decentralized data retrieval, manual raw data kept in excel and google docs, too much
time to gather and analyze data, and decisions made before data can be presented. Figure
2 includes the summary of the data and analysis process for a priori, open, selective, and
categorical coding. Using NVivo 12 software, I continued with word-count queries and
relationship or connection types cross checking tool as another means in discovering
selective codes from the data.
Figure 2
Data Analysis Process
59
In analyzing the depth of codes, or the quantity of vignettes assigned to a group of
codes, or grouping of open codes, selective codes emerged from the data. For the
purposes of this study, the researcher defined depth as having 10 or more vignettes
assigned to a code. Thematic coding resulted from the connections both within and across
the open codes and selective codes. Connections across the selective codes were analyzed
with the mind-map tool within NVivo. When building the mind-map, each time a vignette
linked directly to a code, I reviewed that vignette for connections with other codes and
each had a designated color assigned to it. If there was a connection, NVivo connected the
codes with that designated color coded line. The selective codes with the most
connections formed the start of thematic coding.
Open
•
Each line of transcribed interview text was coded line by line manually
•
Each vignette from manual coding was entered into NVivo and either coded with a unique new
open code or linked to an existing open code
Selective
•
Mind
-
mapping software was used to group open codes into categories. All vignettes were
transferred into the wordmap, linked to an open or selective code
•
NVivo word
-
counts of transcribed interviews were used as second check for additional codes or
categories
Categorical
•
Word
-
mapping software was used to help discover themes by linking codes and vignettes from
open and selective coding where a direct relationship was clear from the NVivo "relationship
types" queries
•
Selective codes with the most relationships formed the foundation for coding into categories
•
This same process continued in the final coding phase for themes, but only the categories were
queried for word count and relationship types

60
Emerging Selective Codes into Formed Categories
Inductive and comparative strategies endorsed by Merriam and Tisdell were used
to analyze similar data revealed in multiple codes that grouped into categories, and then
into final themes. The initial coding cycle of the interview transcripts resulted in 23 initial
relationships from mind map coding. In subsequent reiterations my list of categories was
narrowed to nine. I consolidated several items into similar threads following Saldaña's
recommendations of sorting and shifting coded materials into categories, the relationship
between variables, patterns, and themes. The clarity and depth shared in the interviews
generated a total of 464 coded subdivisions during my analysis (Table 4). Discrepant
cases that were found in the data were those that were misaligned from the majority of the
interviewee results. Discrepant cases were set aside and used in a brief discussion in each
themed area to be deliberated in the Results section of this chapter.
Table 4
Frequency of Codes to Categories and Subthemes
Categories/Subthemes Total Word from Coded Vignettes/ Frequency
Interview Participant Researcher Count Total Segments Final Round
Relationships Transcript Segment Count Notes Segment Code
Siloed Data 79 A1 24 15 39
Siloed Communications 71 B2 29 11 40
Time Consuming 66 C3 36 18 54
Manual data retrieval 59 D4 33 13 46
No centralized data warehouse 53 E5 39 11 50
No common data language 42 F6 35 19 54
Inconsistent data practices 34 G7 26 17 43
Varied student attributes 31 H8 32 11 43
Partial data driven decisions 29 I9 27 21 48
J10 35 12 47
Total: 464 Totals: 316 148 464

61
Results
In this section, I discussed the main themes associated with answering the
research question and any subthemes related. The research question guiding this study
was: What are the perceptions and experiences of higher education administrators of
4year colleges in the application of student data targeted for tracking and predicting
retention? Themes that emerged were:
Theme 1: There are no common data mining practices or definitions;
Theme 2: Student retention decisions are only partially driven by data; and
Theme 3: Data is siloed and subthemes are (a) manual data retrieval processes and
(b) time consuming data analysis process.
Theme 1: No Common Data Mining Processes or Definitions
According to the perspectives shared by the college administrators interviewed for
this study, there is frustration in understanding the data mining processes for student
retention initiatives. Further, the college administrators were frustrated by the lack of a
common language or definitions at their institution for the data analysis process and the
variables used for research. The participants also shared that although there were common
academic and administrative language that is understood by most faculty and staff, this
did not translate over to the data collection, storage, and analysis that leads to results of
unknown origin.
Regarding Theme 1, D4 stated:
Honestly, I have no idea what student data are used for retention initiatives….the
problem is that we have no common data language. The other problem is that no
one seems to know how we get the data results or where they come from.

62
I9 said:
This is a frustrating time for us because of COVID-19. We have to know what our
students are thinking and how they are feeling. But defining the parameters for
measuring this is just as difficult as understanding how to do it.
Participant F6 was frustrated with leaderships and in regard to Theme 1 stated:
“Transparency shouldn’t be a privilege in student retention. We should have a common
language and understanding for the process and where the data originates.”
Two discrepant cases in regard to Theme 1 came up in the data analysis process.
C3 felt that defining a common language for gathering and presenting data for student
retention was important, but not as important as trusting the leadership put in place to
track and monitor student retention. C3 further stated:
I have an important job and it matters to a great many people that we are driving
best practice and student service delivery with data. However, they do not ask
how we define the data or the outcomes. Faculty and staff just want to know what
to do to retain students. It comes from trust.
J10 stated:
Data for retention initiatives is going to vary for each institution as well as the
definitions for the variables and research process. It is more important to focus on
pulling the right variables and attributes to get the outcomes we need to drive our
practice. That in and of itself is hard enough.

63
Theme 2: Student Retention Decisions are Only Partially Driven by Data
Most of the administrators interviewed expressed concerns of not being a data
driven institution. This concern played out in multiple experiences that were shared
during the interview process. These concerns were related to being reactive rather than
proactive with student retention and leadership lacking explanation for policy changes.
The participants also shared great frustration with leadership adding or removing services
based upon what other institutions are doing or trends, rather than having a reliable data
analytics structure for predictions related to student retention.
A1 spoke of these lack of data informed decisions at their institution and stated:
We do not have a choice in high level student retention reporting. We have to
have strong, reliable data for reporting to IPEDS and HLC accrediting. The
department and program level data are hard to find, collect, and analyze to make
decisions on student preferences for format delivery and types of services needed.
We rely on some student survey outcomes that are around 15% participation, and
the rest is gut instinct and results of many discussions and meetings.
B2 also shared concerns at their college on the lack of data informed decision
making and the toll it has taken on retention rates. B2 stated:
I know COVID-19 plays a factor in declining retention rates, but ours were falling
long before this. We cannot make a data informed decision in one area like
admissions and lack the wherewithal in other areas just as important, like student
retention.

64
H8 shared more detail about the frustrations of higher education decision making
downfalls. H8 stated:
We are supposed to be here to help our students succeed. We cannot fail at this.
But how are we supposed to help our students if we fail to help ourselves? We
should see through the data outcomes lens, what are students need and what the
level of need is so we can act appropriately. But, our institution continues to be
impatient with data analysis and invests in poor time management, rash decisions,
and lack of resources to influence positive change in student retention.
One discrepant case was noted. G7 stated:
We are moving toward a data informed decision-making culture. It has taken
years to do so, but we are less and less desiloed [sic] and more and more
integrated with communication, data analysis, and working together for student
retention efforts. Although we lack a centralized data warehouse, we make up for
it in intentionality of our manual data retrieval processes.
Theme 3: Data is Siloed
All participant data resulted in solidarity on this third and final theme. Although
there were discrepant cases in the subthemes, the misalignment was slight, but enough to
discuss as discrepant. The college administrators viewed higher education in general as
competitive based on fear. This fear is from lack of resources and a fickle climate for
degree seeking consumers. The data analysis from the college administrators made clear
that internal fear at individual institutions existed for the same reason and created the
siloed effect. Each department and program have a solitary mission to grab all they can

65
and seek the attention of Trustees and Executive leadership to survive, while subtly
driving down the success of other departments and programs. Sharing data and
integrating efforts to increase student success is not a priority, unless it serves to advance
the success and presence of the department itself.
E5 said:
The competition amongst ourselves makes my job difficult, if not impossible. We
are siloed as it is and gathering data for student retention initiatives is like herding
cats. Some programs will gladly give help as well as ask for help with deciphering
data and choosing student data to research. Other programs will not budge and
they assume that any data they gather belongs to them, but it belongs to our
institution. This siloed mentality will eventually close our doors.
D4 said: “Retention initiatives would be much easier if I didn’t have to gather
from 11 different islands. Each island has their own government and rules. None of them
work together.”
H8 said: “Our customer is our student, bottom line. If that is not a good enough
reason to come out of your fortified bunkers to share information and keep our doors
open, then what will it take?”
A1 agreed and said:
We have to be able to gather data and make decisions in unison. The internal
communication breakdown and data corruption will only serve to hurt ourselves
and our students. We have to coexist, and the common ground is institutional
survival through student success and retention.

66
Subtheme A: Manual Data Retrieval Processes
Many of the participants described data collection and storage as a manual process
held within Excel sheets and Google docs. The data is raw and not aggregated until
someone needs to access an aggregate response to a question for driving practice or
policy. There is then a continuation of this manual process through running PIV tables,
formulas, and a series of cut and paste activities to try and understand the data and the
variables that speak into it. There is a large margin of human error as well as inconsistent
process and unreliable data outcomes.
D4 said:
You cannot move the needle on retention if you do not know where the needle is.
We do not have one haystack to find the needle, we have many haystacks. It
equates to grabbing hay handful by handful and potentially having to do it again
and again because you missed a few and still cannot find the needle.
H8 said:
We are missing a lot of opportunities here and we need get caught up. Keeping
data on spreadsheets in dozens of offices across the institution is not only a
HIPPA violation in some cases, it is not best practice. Manually retrieving data
from department to department reaps only muddied results. We need a better way.
Participant J10 in this study shared similar sentiments on this issue and stated:
Right now, in my job, I have to track 421 students’ success. This is all on Excel
spreadsheets and I have trained myself on how to run certain formulas and PIV
tables to understand the needs of my students. There is not data analytics software
and we all need it desperately.

67
However, G7 said:
We have a mix of some department level data analytics software but still rely
upon some manual data processes. The software helps speed up the deciphering of
raw data and decreases human error as long as the human conducts data input
correctly. The need for manual processes may never go away. This may be a
necessary inconvenience for the sake of cross checking if nothing else.
Subtheme B: Time Consuming Data Analysis Process
College administrator experiences have been described as not enough time to
process data because it takes a lot of time to process data. My analysis of the transcripts
gleaned perceptions that spoke of unrealistic expectations for data results in days that, in
reality, take weeks to clean, organize, and decipher. Even the best of data analytics
software takes hours to input data points, choose filters, and run reports. This can be an
iterative process depending upon the software and the task at hand. But to input data into
columns of Excel sheets and Google docs that require organizing, filtering, formulas.
And PIV tables just to get started is a whole different stress on time and human capital.
E5said:
There are days that I want to give up. So much time is invested in gathering sheets
of data to organize, clean, and start to run PIV [sic]. Then someone changes the
request or deadline in the slightest and panic ensues. It shouldn’t take days and
days to get data analysis to work for us.
B2 stated:

68
The time it takes for me to produce even the simplest of data requests, such as a
course roster showing attendance concerns, takes a day or two. This is because it
has to be cross checked with the registrar because the LMS and SIS do not talk to
each other. I could have helped at least 6 to 10 students one on one in that time.
F6 said:
There is not enough time in any given day as it is. The process to grabbing raw
data from excel sheets and playing with filters and rows and columns is just
exhausting. Part of the time issue is just from using the help function on Excel to
learn how to do a filter or modify a PIV table. Our institution has to invest in
analytics software. We need it for many reasons. But just to be able to give back
hours upon hours of my time and that of my team would be invaluable.
I9 stated: “Time is not the issue, it is the lack of resources. Getting good data takes
time, that’s the nature of the beast. We have to do it right or it is not worth doing it at all.”
This section went through the three themes of the study, with the third theme
having two subthemes. Each area gave a description of any discrepant cases except for
Theme 3. The rest of this chapter will speak to the trustworthiness of my study and then
provide a brief summary.
Evidence of Trustworthiness
Trustworthiness
Trustworthiness in qualitative research must be demonstrated to show proper
methods and rigor were used throughout the data collection and analysis process

69
(Babchuk, 2017). Protocols in trustworthiness include demonstrating credibility,
transferability, dependability, and confirmability (Amankwaa, 2016; Korstjens & Moser,
2018). I followed the guidelines provided by Walden University’s Internal Review Board
and the research recommendations shared in the literature from Chapter 3 to ensure I
executed my study with rigor and transparency to the processes contained within it.
Credibility
Credibility is authenticated in this study by assuring the participant response was
received as it was intended through member checking (Patton, 2014). I provided
participants with the opportunity to restate their answers during the interview and amend
the meaning of their statements during the interview if needed (Madill & Sullivan, 2018;
Patton, 2014). During interviews I addressed vague responses with repeating questions in
order to reflect participants statements back to them for clarification (Madill & Sullivan,
2018). There were instances where participants were unsure of the meaning of the interview
question and I repeated the interview question by changing the tone or highlight certain
words without changing the meaning.
The second credibility authentication method I used was reflexivity. Korstjen and
Moser (2018) described this as the process of critical self-reflection about oneself as the
researcher and one’s biases, preferences, and presumptions as well as the relationship to
the participants and how this relationship may affect their answers to questions. By
journaling and taking notes throughout each interview, I monitored my own explicit and
implicit assumptions and values in all phases of this study. Finally, confirm credibility in
my study I used discrepant data findings in each theme described in this chapter.

70
Negative or discrepant data is described by Patton (2014) as exceptions to the patterns
found in the data. When discrepant data was found in participant transcripts, I reviewed
and reflected from a cross checking perspective via interview recordings, researcher
memos, and NVivo data queries. This is done to determine useful support of the study as
well as responses not aligned to the final thematic results in order to show rigor and
transparency.
Transferability
As stated in Chapter 3, transferability relates to the ability to transfer the results of
the study to a population differing from the one used in the data collection (Amankwaa,
2016; Babchuk, 2017; Kallio et al., 2016). By providing this rich description of the
participants, setting, sample size, the research process, and the findings (Korstjen &
Moser, 2018). The reader of this study can decide whether the findings are transferrable
to their setting. The job of the researcher is providing as much context as possible so lens
can be clear for the reader to see applicability to their setting or not (Arensdorf & Naylor-
Tincknell, 2016).
Dependability
Dependability is necessary in a research study to show reliability of the data
collection and the analysis (Amankwaa, 2016; Babchuk, 2017; Kallio et al., 2016), as
stated in Chapter 3. For this study, audit trails are easily accessible in a few forms from
the start of this research study to the development and reporting of the findings as needed
to show transparency. Part of the audit trail used in this study was the a priori coding
system (Appendix C) protocol used by the researcher for the interview questions and

71
audio transcription as another means of cross-checking interview data of the participants
with NVivo software. Finally, the handwritten reflexivity notes are accessible as well as
the recordings of the participant interviews for review as needed (Silverman, 2016). I
followed the specific stage by stage process from general note taking during participant
interviews through reflexivity, use of the priori coding in the interview questions that
were used during the data collection process through deductive coding and cross checking
with the NVivo software (Feng & Behar-Horenstein, 2019).
Confirmability
As stated in Chapter 3, confirmability refers to objectivity or the ability of others
to confirm findings (Stahl & King, 2020). Confirmability also refers to the researcher’s
transparency and documentation of processes (Korstjen & Moser, 2018; Nowell et al.,
2017). I show confirmability in this study when I described the process used for data
collection and analysis as suggested by Meadows (2003). I provided a detailed
description of the sequence for data collection, coding, and analysis to deliver a clear and
well-defined accountability for the process as shown throughout this chapter.
Transparency can be defined as “the degree of detail and disclosure about the
specific steps, decisions, and judgment calls made during a scientific study” (O’Kane et
al., 2021, p 105). I provided transparency to the data collection and analysis process by
discussing the levels of queries used within NVivo 12 software. Abu (2016) stated that
this confirms a level of credibility for the researcher that provides trustworthiness of the
data results when using an analytics software platform. This process was described in

72
detail in this chapter to provide the transparency of the data analysis development that
yielded the main themes and results of the study as seen in Table 4 and Figures 3, 4, and
5.
Trustworthiness in This Study
Trustworthiness, the central concept by which to judge the quality of interpretive
qualitative research is enhanced by demonstrating that researchers understand their
context and data (credibility), showing consistency and lack of bias in data analysis
(confirmability), providing enough detail for possible replication (dependability), and
allowing for assessment of a study’s outcomes in relation to other contexts is
transferability (Korstjen & Moser, 2018; Lichtman, 2017; O’Kane, et al., 2021; Patton,
2014). Maher et al. (2018) stated that NVivo software maximizes researcher data
interaction in a variety of modalities that ensures the analysis process is rigorous and
productive. They further stated that reflection on an authors' research analysis process,
combined with consultation with the literature, would suggest digital analysis software
packages such as NVivo do not fully scaffold the analysis process but provide excellent
data management and retrieval facilities that support analysis and write-up. Further,
Bonello and Meehan (2019) agreed and stated that the NVivo 12 software platform was
intuitive enough to drive intentional queries on the data while showing the trail of
breadcrumbs for researcher credibility and trustworthy results in qualitative study (p.
490).
Another point in achieving trustworthiness for this study was use of a thematic
coding process. Thematic analysis provides a highly flexible approach that can be

73
modified for the needs of many studies, providing a rich and detailed, yet complex
account of data (Nowell et al., 2017). Thematic analysis is a particularly good choice for
those researchers early in their career and does not require the detailed theoretical and
technological knowledge of other qualitative approaches, it offers a more accessible form
of analysis (Tobin & Begley, 2004). Thematic analysis provides a decision trail, stated
White et al. (2012), that can be shown and presented via narrative or visual display that
enhances the rigor of study with thematic coding process.
Summary
The research question driving this study was: What are the perceptions and
experiences of higher education administrators of 4-year colleges in the application of
student data targeted for tracking and predicting retention? Three main themes emerged
from the inductive coding process driven by the NVivo 12 software platform. The
documents uploaded into the NVivo software for the coding process were the interview
transcripts with initial manual coding completed and my notes and memos written during
the participant interviews. In deciphering and coding the participants’ experiences and
perceptions, the first theme that emerged is that there is no common data mining
definitions nor language for understanding the process for student variable identification
in retention initiatives at each institution. The third theme that emerged from the
participants’ perceptions and experiences is that there is a manual process due to siloed
institutional data.
This third theme also contained two subthemes. The first subtheme was the
manual process for siloed data this further causes challenges in data result turnaround

74
time. The process to retrieve raw data and analyze in a timely manner requires many
resources that institutions do not have to be a data driven college. The second subtheme
was retention initiatives can only be data driven at a minimal level because of the manual
processes across an institution. These themes and subthemes will be further deliberated in
Chapter 5 in the final discussion, conclusions, and recommendations regarding the results
of this study.
Chapter 5: Discussion, Conclusions, and Recommendations
The purpose of this basic qualitative study was to explore perceptions and
experiences of administrators of 4-year colleges in terms of their application of student
data for tracking and predicting retention. This study could potentially fill a gap in the
literature regarding tracking and predicting processes needed for college retention
initiatives. I conducted interviews with retention administrators at 4-year U.S. colleges to
obtain their experiences and perceptions regarding student data applications for retention
initiatives at their institutions. I manually coded data before uploading the documents into
NVivo 12 for further coding. I reported findings by discussing main themes that emerged.
The themes that emerged for answering the RQ were, that no common data mining
practices or definitions existed, and that student retention decisions are only partially
driven by data, and siloed data is prominent and problematic. The third theme, siloed
data, had two subthemes that were, manual data retrieval is problematic and this further
creates time-consuming data analysis processes. This chapter includes interpretations of
findings as well as limitations of this study. Before concluding this chapter, I include a
brief discussion of recommendations and implications of this study.

75
Interpretation of the Findings
Interview data were used to provide answers to the RQ for this study. Themes
aligned with peer-reviewed literature regarding retention initiatives in higher education.
In this section, I present interpretations of findings for this study and describe how it
connects to, confirms, and extends what has been found in existing literature.
Theme 1: No Common Data Mining Practices or Definitions
A need in higher education data practices is for a common set of definitions to
inform a general understanding for administrators of data mining practices was a theme
identified in this study. This theme is supported by findings from previous literature and
research that showed a need for higher education to start with basic knowledge of data
mining processes that should be informed by a common set of definitions and policy to
drive research initiatives. Having a set of common data mining definitions to drive
student variable identification for retention initiatives is integral to supporting results that
confirm data transparency in practice. Institutions frequently begin data mining practices
out of order and have a difficult time with faculty buy-in and gaining trust of staff without
first implementing common agreed upon data mining definitions that inform and confirm
processes for analyzing and presenting results (Chaurasia et al., 2018; Gagliardi et al.,
2018).
Knowledge of basic data mining terminology was not widely known by the
participants in this study. Such as the Gandomi and Haider three V construct (2015) that
speaks to the process of data being broken down into prescriptive, predictive, and
descriptive parts and allows decision-makers to see patterns and trends from past

76
outcomes. Torrecilla and Romo (2018) said common data mining processes are collected
in very different ways, that can be a manual excel sheet process or via the use of software
systems that calculate data through a filtering and specific search language for analysis.
Kwon et al. (2014) said to maintain quality of data, institution-wide data mining
definitions must be in place in higher education to underpin practices and processes. Lack
of participant knowledge as well as their peer administrators was noted as also preventing
colleges from successfully applying student data in retention initiatives.
Theme 2: Student Retention Decisions are Only Partially Driven by Data
Many participants perceived their institution to be inept in terms of data-driven
decision making and this primes institutional leadership to making knee-jerk reactions
rather than being proactive. New processes should be considered for outcome-based
education including data administrators to take an intentional look at student data within
departmental audits to reveal student success measurements and tracking to fuel
datadriven decision making involving retention. Also, many institutions do not have a
culture of data-based decision making, and therefore identification of student data to
assess learning as well as overall retention is problematic I identifying those students who
retain and why (Chaurasia et al., 2018).
Participants said inconsistency in data tracking and unknown origins of data
affects institutional decision-makers in terms of having enlightened institutional data
tracking policies and processes adopted for student success. Niebel et al. (2019) said data-
informed decision-making practices quickly yield benefits to higher education institution
through increased retention, financial returns, and satisfaction of customers.

77
Theme 3: Siloed Data
Participants in this study stated that a big problem at their institutions was siloed
data. Findings in this study indicated that a point of frustration was a lack of a common or
centralized system for storing and analyzing data. Matsebula and Mnkandla (2017) said
the absence of an appropriate infrastructure for data mining feeds a culture of separated
and individualized data practices, which leads to data tracking failures to support
decision-making that influences student retention and institutional revenue in many facets
of student success in higher education such in academics and social connectedness. Avella
et al. (2016) said data systems that rely upon siloed data and manual practices for data
analysis have proven to be ineffective for time management and tend to be riddled with
human error in terms of tracking student retention in higher learning institutions.
Williamson (2017) said ethical issues in data storage and student information protection
are an ongoing concern. He continued and stated that retention data should be housed in a
centralized data warehouse, and responsibility for its use and application should be
widely dispersed with proper training and accountability.
Subtheme A: Manual Data Retrieval Processes
Participant data showed frustrations with manual data retrieval processes that
come from siloed data practices. participants perceived their institutions as struggling to
make data-informed decisions, and manual processes for retrieving siloed data was one of
those reasons. Tsai et al. (2015) said management, processing, and application of raw
student data cannot be accomplished using simple Excel sheet formulas that were once
considered traditional. Collection and analysis processes for identification of variables in

78
retention requires a more sophisticated approach then the use of manual paper processes
and siloed data.
Data results from interviews showed a consistent concern for ethical issues
involving data being kept in spreadsheets and files within each department and program,
which leads to ethical issues involving protection of student data. Lacerenza et al. (2018)
said participation in decision-making to promote healthy institutional climates begins
with collecting unbiased and protected student data. Lacerenza et al. said successful
teams produce desired outcomes with clean and safe data variables using demonstrated
and effective processes. Team development interventions are relevant in terms of
institutional survival, but this is contingent upon adherence to data policy and ethical
practices that protect student data.
Subtheme B: Time Consuming Data Analysis Processes
The second subtheme that emerged from the third theme was the time-consuming
process for data analysis that occurs with siloed data. Participants shared that this is a
primary barrier to successful data informed decision making in siloed data practices.
Many of the interviewees stated that decisions must be made whether there is data or not.
But when it takes days or even weeks to track, collect, analyze, and produce an
aggregated result and infographic(s), there are just too many decisions that need to move
forward. Unfortunately, these decisions are forced to be made as a best educated guess.
The hope is that the data that follows confirms the decision. Participants stated that they
see this type of decision-making being done from an institutional level on down to course
level because data is not readily available.

79
Higher education administrators who value introducing new methods of thinking
as well as a means of data-informed practice are typically met with barriers (Cope &
Kalantzis, 2016). These barriers are associated with the time-consuming task of
gathering, analyzing, and applying data that is siloed and decentralized. Hadwater et al.
(2018) agreed and stated that the barriers that have contributed to the slow adoption of
data mining efforts are institutional policies that do not support a centralized and time
efficient data mining system. This lack of support in policy and practice ultimately
depletes the efforts needed for student success and institutional revenue (Baer & Norris,
2016).
Limitations of the Study
As the sole researcher of this study, I was responsible for collecting, coding,
analyzing, and interpreting the findings. This can create a limitation of this study in that I
am a partial insider researcher because I have a similar professional role to the
participants who the author interviewed. However, I am removed from the community of
which each participant was a part (Fleming, 2018). I did not intentionally make any
decisions to influence the participant interviews. However, I do have a similar role and
knowledge as the participants and may have inadvertently influenced participant
responses. But as an insider, I was able to speak the jargon and pedagogy with which
participants may be familiar, and this allowed for a comfortability to retrieve honest and
open responses.
I followed Walden University’s Institutional Review Board recommendations and
ethical guidelines and used several methods to mitigate my bias and any influence over

80
this study (Butler, 2016; Cresswell, 2013; Shufutinsky 2020). I kept detailed notes and
memos during the data collection process to review any potential biases I may have had
regarding the participant interview process and data collection, and this provided a tool
for me to engage in self-reflection. I also used reflexivity to evaluate each interaction with
participants while maintain a professional boundary appropriate as the researcher.
Recommendations
I have three recommendations for further research. The first recommendation is to
conduct a study that specifically addresses the experiences and perceptions of
administrators in higher education that can speak to the data culture of their institution.
This study paralleled the topic, but participant perceptions and experiences were
inconsistent as to the data culture in their institutions. Administrator perceptions of
analytics and data mining tends to contribute to its acceptance and use as a medium for
generating variables for institutional research (Chaurasia et al., 2018). Andrews and
Lemons (2015) stated that for a decision-making culture to exist and to be based upon
data evidence, this practice cannot be at the institutional level alone. The data culture
needs to permeate to staff and faculty who are responsible for the day-to-day services
with students. For example, faculty that continue to make decisions based on personal
experiences rather than data need to be brought into the data culture as they have the most
direct knowledge and experience with students (Andres & Lemons, 2017). A good place
to start in driving efficacious data mining in higher education would be to first gauge if
the culture is ripe for such tasks.

81
A second recommendation would be to quantitatively conduct a study on the level
and type of siloed data that exists in higher education and what would it take to centralize
these efforts. The data results of this study showed that siloed data is problematic, so
much so, that it was a main theme. This theme of siloed data contained two subthemes
that stated barriers in time management and manual data processes still in place.
Additional study to take a deeper dive into siloed data and the use of manual tracking
systems would benefit higher education best practices (Avella, et al., 2016). This
knowledge is needed so that siloed data practices that have proven to be ineffective in
resolving student retention in higher learning institutions are more widely researched and
provide guidance for resolution (Matsebula & Mnkandla, 2017). Williamson (2017)
acknowledged this and stated that educational data science needs predictive measures for
retention but the level of expertise, manual tracking, and available workforce can be a
barrier. Williamson added that retention data should be housed as a centralized data
warehouse, but the responsibility and application of desiloed data should be widely
dispersed with proper training.
My final recommendation would be to address the ethical concerns related to
student data in higher education. Within the context of this study, participants expressed
concerns for student data being on every faculty desk across campus as a result of siloed
data practices. Although this study did address the barriers to siloed data in higher
education as it relates to retention initiatives, the topic of data ethics was beyond the
scope of the stated problem and purpose. So, it is recommended that further study take
place to address this. The nonexistence of the students’ voices regarding the use of data

82
mining has presented challenges related to the acceptability of student attributes used for
institutional research (Roberts, et al., 2016). Data analysis in higher education related to
students has been comprised by way of using demographic details, enrollment survey
results, student course assessment, and the academic performance of students, among
others (de Freitas et al., 2015). Ethical perspective is needed in higher education research
to consider student participation in decision making to promote a healthy institutional
climate that serves and benefits all stakeholders.
Implications
By gathering the experiences and perceptions of administrators in this study and
how they see their institution through the student retention lens I learned that this gives a
voice to those struggling with organizational change in data culture. Positive
organizational change occurs when individuals achieve their goals and have influence on
others. In this way, the findings can influence those administrators wanting change in
their institution for data mining practices in student success by improving policy and
practice by beginning practices to desilo data, improving data informed decisions making,
and creating a common language for practices when using student data in retention
initiatives. This methodological change in practice can ultimately improve the goal
achievement at the organizational level as well.
Higher education accreditation bodies and funders require data-informed results to
show increasing progress each year. Organizational change can be influenced by the
change in methods of practice. This study provides understanding of both the barriers and
opportunities to begin successful data mining methods for practice and policy change in

83
higher education that can further influence organizational change. Implications for
change in methods of practice for data mining would first and foremost be an increase in
student success and institutional revenue by incorporating the participant data into
multilevel data informed decision making. Successful achievement of institutional goals
will increase the viability of an institution to accreditors and the surrounding community.
The key recommendations from this study that can influence social change on
organizational and societal levels in higher education, by having open discussion to
define common processes for data mining that increase trust and transparency in retention
initiatives. This can be a positive motivator for organization change that also meets the
societal expectations for data informed results in higher education.
The findings of this study showed that the Gandomi and Haider Three V
Construct (2015) and Attarran et al. (2018) model of analytics used as the conceptual
framework were not widely understood by the participants. The conceptual framework
was successful in providing a common language and process that are considered basic
and integral to any data mining efforts in business and education (Baker & Siemens,
2014; Sivarajah et al. 2017; Williamson, 2017). However, during data collection it was
revealed that the participants knew little about this common process and language. This
implicates that administrators are either being hired with little or no expertise for what is
expected given their title and job description, or that data mining training efforts are
needed.
Although the participants were all from 4-year colleges, the results can be
transferrable to most higher education institutions that struggle with siloed data pools,

84
little or no data mining processes, and need to increase data informed decision making.
By reviewing methods of practice at varying levels of an institution, the findings of this
study can inform the readers of main themes for improving performance in data mining
initiatives in retention. One of the salient points from this study is to desilo data from
departments and programs as much as possible to centralize the data mining process and
protect student data. This is both integral to organizational and societal change that will
further influence what an institution brings to the table for student success and how they
are viewed by accreditors.
Conclusion
This study explored the perceptions and experiences of administrators of 4-year
colleges in applying student data for tracking and predicting retention. Three themes
emerged that can inform gaps in practice that have been noted in previous research
literature. These gaps in practice have been barriers to student success and institutional
revenue. The lack of common process and definitions for data mining practices
accompanies a lack of transparency and distrust from staff and faculty. By making known
what the processes are for identifying student data, who is responsible, and defining a
common language for those processes, college administrators can open possibilities for
organizational change and success. Improved understanding brought about through this
study can be a first step in productive data mining practices for student success and
retention initiatives. Centralizing data or assigning data responsibilities in a designated
department can increase data productivity and data-informed decision making for
institutions of higher education. Manual data entry and tracking practices from excel

85
sheets and google docs are devices of the past. The outcomes of this study show that
higher education administrators want efficiency and intentionality from data driven
decisions. With increasing requirements for higher education institutions to produce
reliable data results, time is of the essence. The time has passed for higher education to
simply do what has always been done.
By giving a voice to those struggling with organizational change in regards to data
culture, this provided an understanding of both the barriers and opportunities to begin
successful data mining methods for practice and policy change. This change will
influence higher education data mining practices organizationally speaking that can
further influence community and social change that meets their expectations for data
informed results in higher education to show student success and institutional stability.
This can be accomplished in three integrated steps. The first is to influence organizational
change through methods of practice. This study provides understanding of both the
barriers and opportunities to begin successful data mining for updating methods for
practice and policy change in higher education that can further influence organizational
change. Implications for change in methods of practice for data mining would first and
foremost be the understanding of common data mining language and practice that would
yield an increase in student success and institutional revenue by incorporating the
participant data into multi-level data informed decision making.
Organizations change follows when positive change occurs in updating methods
of practice when individuals achieve their goals and have influence on others. In this way,
the findings can influence those administrators wanting change in their institution for data

86
mining practices in student success by improving policy and practice by beginning
practices to desilo data, improving data informed decisions making, and creating a
common language for practices when using student variables in retention initiatives.
Societal change follows when organizational change aligns to higher education
accreditation bodies and funders data-informed requirements show increasing progress
each year. Organizational change can be influenced by the change in methods of practice.
Successful achievement of institutional goals will increase the viability of an institution to
accreditors and the surrounding community. The key recommendations from this study
that can influence social change on organizational and societal levels in higher education,
by having open discussion to define common processes for data mining that increase trust
and transparency in retention initiatives. This can be a positive motivator for organization
change that also meets the societal expectations for data informed results in higher
education. The need to desilo data from departments and programs, as well as drive the
institutional culture with data informed decision makers, will yield a foundation of
common language and practice in data mining and the ability to focus on the success of
both students and institutions.
References
Albalowi, A., & A Alhamed, A. (2017, December 7). Big data and learning analytics in
higher education: Demystifying variety, acquisition, storage, NLP and analytics.
https://doi.org/10.1109/ICBDAA.2017.8284118
Alsharari, N.M., & Alshurideh, M.T. (2020). Student retention in higher education: The
role of creativity, emotional intelligence and learner autonomy. International

87
Journal of Educational Management, Vol. #?(Issue #?), p. ##-##?
https://doi.org/10.1108/IJEM-12-2019-0421
Amankwaa, L. (2016). Creating protocols for trustworthiness in qualitative research.
Journal of Cultural Diversity, 23(3), 121-127.
https://www.researchgate.net/publication/324804792_CREATING_PROTOCOL
S_FOR_TRUSTWORTHINESS_IN_QUALITATIVE_RESEARCH
Andrews, T., & Lemons, P. (2015). It’s personal: Biology instructors prioritize personal
evidence over empirical evidence in teaching decisions. CBE—Life Sciences
Education, 14(1), 1-18. https://doi.org/10.1187/cbe.14-05-0084
Arensdorf, J., & Naylor-Tincknell, J. (2016). Beyond the traditional retention data: A
qualitative study of the social benefits of living learning communities. Learning
Communities: Research & Practice, Vol. #?(Issue #?), p. ##-##?.
https://eric.ed.gov/?id=EJ1112861
Attaran, M., Stark, J., & Stotler, D. (2018). Opportunities and challenges for big data
analytics in U.S. higher education: A conceptual model for implementation.
Industry and Higher Education, 32(3), 169-182.
https://doi.org/10.1177/0950422218770937
Avella, J. T., Kebritchi, M., Nunn, S. G., & Kanai, T. (2016). Learning analytics methods,
benefits, and challenges in higher education: A systematic literature review.
Online Learning, 20(2), 13-29. Online Learning 20.2 Full-Issue pdf.pdf
(ed.gov)
Babchuk, W. A. (2017). Qualitative research: A guide to design and implementation (4th
ed.). Adult Education Quarterly, 67(1), 71–73.

88
https://doi.org/10.1177/0741713616671930
Baer, L. L., & Norris, D. M. (2016). A call to action for student success analytics.
Planning for Higher Education, 44(4), 1-10. A call to action for student success
analytics. Planning for Higher Education, 44(4), 1-10.
DATA2018_PRIMER_DOWNLOAD.pdf (naspa.org)
Baker, R.S., & Siemens, G. (2014). Educational data mining and learning analytics. In K.
Sawyer (ed.), Cambridge handbook of the learning sciences (2nd ed., pp. 253-
274). Cambridge University Press. Educational Data Mining and Learning
Analytics: Applications to Constructionist Research | SpringerLink
Barbour, R. (2014). Introducing qualitative research: A student’s guide. SAGE
Publications. Introducing Qualitative Research: A Student's Guide - SAGE
Research Methods (waldenulibrary.org)
Barratt, M. J., Ferris, J. A., & Lenton, S. (2015). Hidden populations, online purposive
sampling, and external validity: Taking off the blindfold. Field Methods, 27(1), 3-
21. https://doi.org/10.1177/1525822X14526838
Bashir, M., Afzal, M.T., & Azeem, M. (2008). Reliability and validity of qualitative and
operational research paradigm. Pakistan Journal of Statistics and Operation
Research, 1(1), 35-45. https://doi.org/10.18187/pjsor.v4i1.59
Bochner, A. (2018). Unfurling rigor: On continuity and change in qualitative inquiry.
Qualitative Inquiry, 24(6), 359-368. https://doi.org/10.1177/1077800417727766
Bomatpalli, T. (2013). Significance of big data and analytics in higher education.
International Journal of Computer Applications, 68, 21-23.

89
https://doi.org/10.5120/11648-7142
Bonello, M. & Meehan, B. (2019). Transparency and coherence in a doctoral study case
analysis: Reflecting on the use of NVivo within a ‘framework’ approach. The
Qualitative Report, 24(3), 483-498
https://www.proquest.com/openview/5bc7bedc8740d7875375b49d80688e5c/1?pq
-origsite=gscholar&cbl=55152
Bradley, E. H., An, M.-W., & Fox, E. (2020). Reopening colleges during the Coronavirus
disease 2019 (COVID-19) pandemic—One size does not fit all. JAMA Network
Open, 3(7), e2017838-e2017838.
https://doi.org/10.1001/jamanetworkopen.2020.17838
Braxton, J. M. (2019). Leaving college: Rethinking the causes and cures of student
attrition by Vincent Tinto (Review). Journal of College Student Development,
60(1), 129-134. https://doi.org/10.1353/csd.2019.0012
Bughin, J. (2016). Big data, big bang? Journal of Big Data, 3(1), 2.
https://doi.org/10.1186/s40537-015-0014-3
Busteed, B. (2016). Welcome to the exit era of higher education. Gallup.
https://news.gallup.com/opinion/gallup/199304/welcome-exit-era-
highereducation.aspx
Butler, J. L. (2016). Rediscovering Husserl: Perspectives on the epoche and the
reductions. The Qualitative Report, 21(11), 2033-2043. Rediscovering Husserl:
Perspectives on the Epoché and the Reductions (nova.edu)

90
Castillo-Montoya, M. (2016). Preparing for interview research: The interview protocol
refinement framework. The Qualitative Report, 21(5), 811-831. Retrieved from
http://nsuworks.nova.edu/tqr/vol21/iss5/2
Centers for Disease Control and Prevention. (2020). Coronavirus Disease 2019 (COVID-
19). Prevention & treatment. Centers for Disease Control and Prevention.
https://www.cdc.gov/coronavirus/2019-ncov/prevent-gettingsick/prevention.html.
Chaurasia, S. S., & Frieda Rosin, A. (2017). From Big Data to Big Impact: Analytics for
teaching and learning in higher education. Industrial and Commercial Training,
49(7/8), 321–328. https://doi.org/10.1108/ICT-10-2016-0069
Chaurasia, S. S., Kodwani, D., Lachhwani, H., & Ketkar, M. A. (2018). Big data
academic and learning analytics: Connecting the dots for academic excellence in
higher education. International Journal of Educational Management, 32(6),
1099–1117. https://doi.org/10.1108/IJEM-08-2017-0199
Chaurasia, S. S., & Rosin, A. F. (2017). From Big Data to Big Impact: Analytics for
teaching and learning in higher education. Industrial and Commercial Training.
https://doi.org/10.1108/ICT-10-2016-0069
Chen, H., Chiang, R. H. L., & Storey, V. C. (2012). Business Intelligence and Analytics:
From Big Data to Big Impact. MIS Quarterly, 36(4), 1165–1188. JSTOR.
https://doi.org/10.2307/41703503
Conrad, C. F., & Wilson, R. F. (1985). Academic Program Reviews: Institutional

91
Approaches, Expectations, and Controversies. ASHE-ERIC Higher Education
Report No. 5, 1985. Association for the Study of Higher Education, Publications
Department, Washington, DC. https://eric.ed.gov/?id=ED264806.
Cope, B., & Kalantzis. M. (2016). Big Data Comes to School: Implications for Learning,
Assessment, and Research. AERA Open 2(2).
https://doi.org/10.1177/2332858416641907.
Creswell, J. W. (2013). Qualitative inquiry and research design: Choosing among five
approaches. Thousand Oaks, CA: Sage
Creswell, J. W., & Poth, C. (2016). Qualitative Inquiry and Research Design: Choosing
Among Five Approaches. SAGE Publications.
Crotty, M. (1998). The Foundations of Social Research. London: Sage.
Daniel, B. (2015). Big Data and analytics in higher education: Opportunities and
challenges. British Journal of Educational Technology, 46(5), 904–920.
https://doi.org/10.1111/bjet.12230
Davidson, W. B., Beck, H., & Grisaffe, D. B. (2015). Increasing the institutional
commitment of college students: Enhanced measurement and test of a
nomological model. Journal of College Student Retention: Research, Theory &
Practice 17 (2): 162–85. https://doi.org/10.1177/1521025115578230.
DeCarlo, M. (2018). 13.2 Qualitative interview techniques. Scientific Inquiry in Social
Work. (Chap 13). Pressbooks.
https://scientificinquiryinsocialwork.pressbooks.com/chapter/13-2-
qualitativeinterview-techniques/.

92
de Freitas, S., Gibson, D., Du Plessis, C., Halloran, P., Williams, E., Ambrose, M.,
Dunwell, I., & Arnab, S. (2016). Foundations of Dynamic Learning Analytics:
Using University Student Data to Increase Retention. British Journal of
Educational Technology, 46(6), 1175–1188. Foundations of dynamic learning
analytics: Using university student data to increase retention - Freitas - 2015 -
British Journal of Educational Technology - Wiley Online Library
Dewberry, C., & Jackson, D. (2018). An application of the theory of planned behavior to
student retention. Journal of Vocational Behavior 107, 100–110.
https://doi.org/10.1016/j.jvb.2018.03.005.
Ekowo, M., & Palmer, I. (2016) The promise and peril of predictive analytics in higher
education: A landscape analysis. New America.
https://eric.ed.gov/?id=ED570869.
Elgendy, N., & Elragal, A. (2016). Big Data Analytics in Support of the Decision Making
Process. Procedia Computer Science, 100, 1071–1084.
https://doi.org/10.1016/j.procs.2016.09.251
Elhassan Ali, F. A., & Klett, F. (2018). Learning Analytics in Higher Education—The
Path Toward Educational Management Intelligent Systems. 2018 11th
International Conference on Developments in ESystems Engineering (DeSE),
244–249. https://doi.org/10.1109/DeSE.2018.00050
Elnozahy, W. A., El Khayat, G.A., Cheniti-Belcadhi, L., &Said, B. (January 1, 2019).
Question Answering System to Support University Students’ Orientation,
Recruitment and Retention. Procedia Computer Science, CENTERIS 2019 -
International Conference on ENTERprise Information Systems / ProjMAN 2019 -

93
International Conference on Project MANagement. 164: 56–63.
https://doi.org/10.1016/j.procs.2019.12.154.
Etikan, I. (2016). Comparison of Convenience Sampling and Purposive Sampling.
American Journal of Theoretical and Applied Statistics, 5, 1.
https://doi.org/10.11648/j.ajtas.20160501.11
Feng, X., & Behar-Horenstein, L. (2019). Maximizing NVivo utilities to analyze
openended responses. The Qualitative Report, 24(3), 563-571.
https://nsuworks.nova.edu/tqr/vol24/iss3/11
Finlay, L. (2013). Unfolding the phenomenological research process: Iterative stages of
seeing afresh. Journal of Humanistic Psychology 53(2): 172–201.
https://doi.org/10.1177/0022167812453877.
Gagliardi, J., Parnell, A., & Carpenter-Hubin, J. (2018). The analytics revolution in higher
education. Change: The Magazine of Higher Learning, 50(2), 22–29.
https://doi.org/10.1080/00091383.2018.1483174
Gandomi, A., & Haider, M. (2015). Beyond the hype: Big data concepts, methods, and
analytics. International Journal of Information Management, 35(2), 137–144.
https://doi.org/10.1016/j.ijinfomgt.2014.10.007
Ganotice, F. A., King, R. B. (2014). Social influences on students’ academic engagement
and science achievement. Psychological Studies 59 (1), 30–35.
https://doi.org/10.1007/s12646-013-0215-9.

94
García-Ros, R., Pérez-González, F., Cavas-Martínez, F., & Tomás, J. M. (2019). Effects
of pre-college variables and first-year engineering students’ experiences on
academic achievement and retention: A structural model. International Journal of
Technology & Design Education 29 (4), 915–28.
https://doi.org/10.1007/s10798018-9466-z.
Glesne, C. (2016). Becoming qualitative researchers: An introduction, 5th Edition. In
Pearson. Pearson.
Gordon, R. (2020). A basic qualitative research study: How marginalized students’ ability
to succeed is impacted during freshman and sophomore years in college.
[Thesis, Concordia University, St. Paul]. Retrieved from
https://digitalcommons.csp.edu/cup_commons_grad_edd/183
Griffiths, A. (2017). Forecasting failure: Assessing risks to quality assurance in higher
education using machine learning [PhD Thesis]. King’s College London. British
Library EThOS: Forecasting failure : assessing risks to quality assurance in higher
education using machine learning (bl.uk)
Guetterman, T. C. (2017). Descriptions of sampling practices within five approaches to
qualitative research in education and the health sciences. Forum Qualitative
Sozialforschung / Forum: Qualitative Social Research, 16(2).
https://doi.org/10.17169/fqs-16.2.2290
Hadwer, A. A., Gillis, D., & Rezania, D. (2019). Big data analytics for higher education
in the cloud era. 2019 IEEE 4th International Conference on Big Data Analytics
(ICBDA), 203–207. https://doi.org/10.1109/ICBDA.2019.8713257

95
Harackiewicz, J. M., & Priniski, S. J. (2018). Improving student outcomes in higher
education: The science of targeted intervention. ANNUAL REVIEW OF
PSYCHOLOGY, VOL 69, 69, 409–435. https://doi.org/10.1146/annurev-psych-
122216-011725
Heflin, H., Shewmaker, J., & Nguyen, J. (2017). Impact of mobile technology on student
attitudes, engagement, and learning. Computers & Education, 107, 91–99. Impact
of mobile technology on student attitudes, engagement, and learning -
ScienceDirect (waldenulibrary.org)
Heiner, C., Heffernan, N., & Barnes, T. (July, 2007). Educational data mining workshop.
Supplementary Proceedings of the 13th International Conference of Artificial
Intelligence in Education. Marina del Rey, CA. USA 10.1.1.66.1441.pdf
(educationaldatamining.org)
Henke, N., Puri, A., & Saleh, T. (2020). Accelerating Analytics to Navigate COVID‐19
and the Next Normal. McKinsey & Company. accelerating-analytics-to-
navigatecovid-19.pdf (mckinsey.com)
Hora, M. T., Bouwma-Gearhart, J., & Park, H.J. (2017). Data driven decision-making in
the era of accountability: Fostering faculty data cultures for learning. The Review
of Higher Education 40 (3), 391–426. https://doi.org/10.1353/rhe.2017.0013.
Hubler, S. (2020, August 15). As colleges move classes online, families rebel against the
cost. The New York Times. https://www.nytimes.com/2020/08/15/us/covidcollege-
tuition.html

96
Huda, M., Maseleno, A., Atmotiyoso, A., Siregar, M., Ahmad, R., Jasmi, K., & Muhamad,
N. (2018). Big data emerging technology: Insights into innovative environment
for online learning resources. International Journal of Emerging Technologies in
Learning (IJET) 13 (1), 23–36. (PDF) Big Data Emerging
Technology: Insights into Innovative Environment for Online Learning Resources
(researchgate.net)
Huselid, M., & Minbaeva, D. (2019). In Press: Sage Handbook of Human Resource
Management (2nd edition), Wilkinson, A., Bacon, Lepak, L., & Snell, S. (Eds.).
SAGE Reference - The SAGE Handbook of Human Resource Management
(sagepub.com)
Kallio, H., Pietilä, A.-M., Johnson, M., & Kangasniemi, M. (2016). Systematic
methodological review: Developing a framework for a qualitative semi-structured
interview guide. Journal of Advanced Nursing, 72(12), 2954–2965.
https//doi.org/10.1111/jan.13031
Kivunja, C., & Kuyini, A. B. (2017). Understanding and applying research paradigms in
educational contexts. International Journal of Higher Education, 6(5), 26.
https://doi.org/10.5430/ijhe.v6n5p26
Klimek, J. & Klimek, J.A. (2020). IT and data mining in decision-making in the
organization. Education management in the culture of late modernity. Procedia
Computer Science 176: 1990–99. https://doi.org/10.1016/j.procs.2020.09.235.
Knapp, M. S. (2017). The practice of designing qualitative research on educational
leadership: Notes for emerging scholars and practitioner-scholars. Journal of

97
Research on Leadership Education 12(1): 26–50.
https://doi.org/10.1177/1942775116647365.
Korstjens, I., & Moser, A. (2018). Series: Practical guidance to qualitative research. Part
4: Trustworthiness and publishing. European Journal of General Practice, 24(1),
120–124. https://doi.org/10.1080/13814788.2017.1375092
Korstjens, I., & Moser, A., (2017). Series: Practical guidance to qualitative research. Part
2: Context, research questions and designs. European Journal of General Practice
23 (1): 274–79. https://doi.org/10.1080/13814788.2017.1375090.
Krieb, D. (2018). Assessing the impact of reference assistance and library instruction on
retention and grades using student tracking technology. Evidence Based Library
and Information Practice 13(2): 2–12. https://doi.org/10.18438/eblip29402.
Kwon, O., Lee, N., & Shin, B. (2014). Data quality management, data usage experience
and acquisition intention of big data analytics. International Journal of
Information Management, 34(3), 387–394.
https://doi.org/10.1016/j.ijinfomgt.2014.02.002
Lacerenza, Christina N., Shannon L. Marlow, Scott I. Tannenbaum, and Eduardo Salas.
(2018). Team development interventions: Evidence-based approaches for
improving teamwork. AMERICAN PSYCHOLOGIST 73 (4), 517–31.
https://doi.org/10.1037/amp0000295.
Lee, G. (2021). Clarifying the complexities of qualitative research: A book review of
phillip adu's A step-by-step guide to qualitative data coding. The Qualitative
Report, 26(7), 2168-2170. doi:http://dx.doi.org/10.46743/2160-3715/2021.4947

98
Levitt, H. M., Motulsky, S. L., Wertz, F. J., Morrow, S. L., & Ponterotto, J. G. (2017).
Recommendations for designing and reviewing qualitative research in
psychology: Promoting methodological integrity. Qualitative Psychology, 4(1), 2–
22. https://doi.org/10.1037/qup0000082
Lichtman, M. (2017). Judging the research process and product. Qualitative research for
the social sciences. SAGE Publications. https://www-
doiorg.ezp.waldenulibrary.org/10.4135/9781544
Lomet, D. B. (2017). The Future of Data Management. Computer, 50(10), 12–13.
https://doi.org/10.1109/MC.2017.3641630
Lourens, A., & Bleazard, D. (2016). Applying Predictive Analytics in Identifying
Students at Risk: A Case Study. South African Journal of Higher Education,
30(2), 129–142. https://eds-b-
ebscohostcom.ezp.waldenulibrary.org/eds/pdfviewer/pdfviewer?vid=1&sid=c
9db1d31f1b8-43b0-8c03-9056517fe02b%40pdc-v-sessmgr01
Madill, A., & Sullivan, P. (2018). Mirrors, portraits, and member checking: Managing
difficult moments of knowledge exchange in the social sciences. Qualitative
Psychology (5) 3: 321–39. https://doi.org/10.1037/qup0000089.
Magaldi, D., & Berler, M. (2018). Semi-Structured interviews. Encyclopedia of
Personality and Individual Differences, edited by Virgil Zeigler-Hill and Todd K.
Shackelford. (Chaps 1-6). Cham: Springer International Publishing.
https://doi.org/10.1007/978-3-319-28099-8_857-1.
Mah, D. (2016). Learning analytics and digital badges: Potential impact on student
retention in higher education. Technology, Knowledge and Learning, 21(3), 285-

99
305. doi:http://dx.doi.org.ezp.waldenulibrary.org/10.1007/s10758-016-9286-8
Maher, C., Hadfield, M., Hutchings, M., & de Eyto, A. (2018). Ensuring Rigor in
Qualitative Data Analysis: A Design Research Approach to Coding Combining
NVivo With Traditional Material Methods. International Journal of Qualitative
Methods, 17(1), 1–13.
https://doiorg.ezp.waldenulibrary.org/10.1177/1609406918786362
Mahroeian, H., Daniel, B., & Butson, R. (2017). The perceptions of the meaning and
value of analytics in New Zealand higher education institutions. International
Journal of Educational Technology in Higher Education 14(1): 1–17.
https://doi.org/10.1186/s41239-017-0073-y.
Manyanga, F., Sithole, A., & Hanson, S. (2017). Comparison of student retention models
in undergraduate education from the past eight decades. Journal of Applied
Learning in Higher Education 7, 30–42. EJ1188373.pdf (ed.gov)
Matsebula, F., and E. Mnkandla. (2017). A big data architecture for learning analytics in
higher education. IEEE AFRICON: 951–56.
https://doi.org/10.1109/AFRCON.2017.8095610.
Maxwell, J. (2008). Designing a qualitative study. Qualitative Research.
https://doi.org/10.4135/9781483348858.n7.
Meadows KA. (2003). So you want to do research? 3. An introduction to qualitative
methods. British Journal of Community Nursing, 8(10), 464–469.
https://www.researchgate.net/publication/9037262_So_you_want_to_do_research
_3_An_introduction_to_qualitative_methods

100
Merriam, S. B. (2015). Qualitative Research: A Guide to Design and Implementation, 4th
Edition (4 edition). John Wiley & Sons.
Merriam, S. B., & Tisdell, E. J. (2016). Qualitative Research: A Guide to Design and
Implementation. John Wiley & Sons.
Mills, A., Durepos, G., & Wiebe, E. (2010). Encyclopedia of Case Study Research.
SAGE Publications. https://doi.org/10.4135/9781412957397.
Murray, A. (2015). Academic libraries and high-impact practices for student retention:
Library deans’ perspectives. Portal: Libraries and the Academy 15 (3), 471–87.
https://doi.org/10.1353/pla.2015.0027.
Nadasen, D., & List, A. (2017). Predicting four-year student success from two-year
student data. Big Data and Learning Analytics in Higher Education: Current
Theory and Practice, edited by Ben Kei Daniel. 221–36. Cham: Springer
International Publishing. https://doi.org/10.1007/978-3-319-06520-5_13.
Nathan, S., Newman, C., & Lancaster, K. (2018). Qualitative interviewing. Handbook of
Research Methods in Health Social Sciences, edited by Pranee Liamputtong, 1–
20. https://doi.org/10.1007/978-981-10-2779-6_77-1.
National Center for Education Statistics. (2020). Undergraduate retention and graduation
rates.
https://nces.ed.gov/programs/coe/indicator_ctr.asp#:~:text=Retention%20rates%2
0measure%20the%20percentage,a%20specified%20period%20of%20time
Neelakantan, S. (2019). ‘Data Analytics Can Save Higher Education’, Say Top College
Bodies. Technology Solutions That Drive Education. Retrieved April 13, 2020,

101
from https://edtechmagazine.com/higher/article/2019/11/data-analytics-can-
savehigher-education-say-top-college-bodies
Niebel, T., Rasel, F., & Viete, S. (2019). BIG data – BIG gains? Understanding the link
between big data analytics and innovation. Economics of Innovation and New
Technology, 28(3), 296–316. https://doi.org/10.1080/10438599.2018.1493075
Nimmagadda, S. L., & Rudra, A. (2017). Managing the Embedded Digital Ecosystems
(EDE) Using Big Data Paradigm. In B. Kei Daniel (Ed.), Big Data and Learning
Analytics in Higher Education: Current Theory and Practice (pp. 43–72).
Springer International Publishing. https://doi.org/10.1007/978-3-319-06520-5_5
Nowell, L. S., Norris, J. M., White, D. E., & Moules, N. J. (2017). Thematic analysis:
Striving to meet the trustworthiness criteria. International Journal of Qualitative
Methods. https://doi.org/10.1177/1609406917733847
O’Kane, P., Smith, A., Lerman, M.P. (2021). Building transparency and trustworthiness
in inductive research through computer-aided qualitative data analysis software.
Organizational Research Methods, 24(1), 104–139.
https://doi.org/10.1177/1094428119865016
Olaya, D., Vásquez, J., Maldonado, S., Miranda, J., & Verbeke, W. (2020). Uplift
1modeling for preventing student dropout in higher education. Decision Support
Systems. 134. https://doi.org/10.1016/j.dss.2020.113320.
Patton, M. (2015). Qualitative Research & Evaluation Methods. SAGE.
https://us.sagepub.com/en-us/nam/qualitative-research-
evaluationmethods/book232962.

102
Perrotta, K. (2020). Getting HIP: A study on the implementation of asynchronous
discussion boards as a high-impact practice in online udergraduate survey history
courses. The Journal of Social Studies Research 44 (2), 209–17.
https://doi.org/10.1016/j.jssr.2020.02.001.
Premalatha, K. (2019). Course and program outcomes assessment methods in
outcomebased education: A review. Journal of Education 199 (3), 111–27.
https://doi.org/10.1177/0022057419854351.
Priniski, S. J., Hecht, C. A., & Harackiewicz, J. M. (2018). Making Learning Personally
Meaningful: A New Framework for Relevance Research. Journal of Experimental
Education, 86(1), 11–29.
https://www.researchgate.net/publication/320478264_Making_Learning_Personal
ly_Meaningful_A_New_Framework_for_Relevance_Research
Provencher, A. & Kassel, R. (2019). High-impact practices and sophomore retention:
Examining the effects of selection bias. Journal of College Student Retention:
Research, Theory & Practice 21 (2), 221–41.
https://doi.org/10.1177/1521025117697728.
Roberts, L., Chang, V., & Gibson, D. (2016). Ethical considerations in adopting a
university and system wide approach to data and learning analytics. Big Data and
Learning Analytics in Higher Education: Current Theory and Practice, edited by
Ben Kei Daniel, 89–108. Cham: Springer International Publishing.
https://doi.org/10.1007/978-3-319-06520-5_7.
Romero, C., Ventura, S. (2007). Educational data mining: A survey from 1995 to 2005.

103
Expert Systems with Applications, 33, 135–146.
https://www.researchgate.net/publication/222815211_Educational_data_mining_
A_survey_from_1995_to_2005
Rubel, A., & Jones, K. (2017). Data Analytics in Higher Education: Key Concerns and
Open Questions. University of St. Thomas Journal of Law and Public Policy
(Minnesota), 11, 25. Rubel Jones Big Data in Higher Education (ssrn.com)
Sass, D. A., Castro-Villarreal, F., Wilkerson, S., Guerra, N., & Sullivan, J. (2018). A
Structural Model for Predicting Student Retention. The Review of Higher
Education, 42(1), 103–135. https://doi.org/10.1353/rhe.2018.0035
Sanders, L. D., Daly, A.P., & Fitzgerald, K. (2016). Predicting retention, understanding
attrition: A prospective study of foundation year students. Widening Participation
& Lifelong Learning 18 (2), 50–83. https://doi.org/10.5456/WPLL.18.2.50.
Saunders, B., Sim, J., Kingstone, T., Baker, S., Waterfield, J., Bartlam, B., Burroughs, H.,
& Jinks. C. (2017). Saturation in qualitative research: Exploring its
conceptualization and operationalization. Quality & Quantity 52(4): 1893–1907.
https://doi.org/10.1007/s11135-017-0574-8.
Schneider, M., & Preckel, F. (2017). Variables associated with achievement in higher
education: A systematic review of meta-analyses. Psychological Bulletin, 143(6):
565–600. doi: 10.1037/bul0000098.
Seaman, M. (2011). Bloom’s taxonomy: Its evolution, revision, and use in the field of
education. Curriculum and Teaching Dialogue. 1–2(29).

104
Shanahan, J. G., & Dai, L. (2015). Large scale distributed data science using apache
spark. Proceedings of the 21th ACM SIGKDD International Conference on
Knowledge Discovery and Data Mining, 2323–2324.
https://www.researchgate.net/publication/297582750_Large_Scale_Distributed_D
ata_Science_using_Apache_Spark
Shein, E. (2020). How universities deploy student data. Communications of the ACM.
Association for Computing Machinery. doi:10.1145/3381910
Shufutinsky, A. (2020). Employing use of self for transparency, rigor, trustworthiness,
and credibility in qualitative organizational research methods. Organizational
Development Review 52 (1), 50-58.
https://www.researchgate.net/publication/340539936_Employing_Use_of_Self_fo
r_Transparency_Rigor_Trustworthiness_and_Credibility_in_Qualitative_Organi
zational_Research_Methods
Silverman, D. (2016). Qualitative Research. SAGE.
Singh, D., & Reddy, C. K. (2015). A survey on platforms for big data analytics. Journal
of Big Data, 2(1) 8. A survey on platforms for big data analytics | Journal of Big
Data | Full Text (springeropen.com)
Sivarajah, U., Kamal, M. M., Irani, Z., & Weerakkody, V. (2017). Critical analysis of big
data challenges and analytical methods. Journal of Business Research 70 (1),
263–86. https://doi.org/10.1016/j.jbusres.2016.08.001.

105
Slater, S., Srećko J., Vitomir K., Ryan S. B,, and Dragan G. (2017). Tools for educational
data mining: A review. Journal of Educational and Behavioral Statistics 42 (1)
85–106. https://doi.org/10.3102/1076998616666808.
Soares, L., Steele, P., & Wayt, L. (2016). Evolving higher education business models.
American Council on Education: Center for Policy Research and Strategy.
https://www.acenet.edu/Documents/Evolving-Higher-Education-Business-
Models.pdf
Spiers, J., Morse, J.M., Olson, K., Mayan, M., & Barrett, M. (2018).
Reflection/Commentary on a past article: Verification strategies for establishing
reliability and validity in qualitative research. International Journal of Qualitative
Methods 17(1). https://doi.org/10.1177/1609406918788237.
Stage, F. K., & Hossler, D. (2000). Where is the student? Linking student behaviors,
college choice and college persistence. In J. M. Braxton (Ed.), Reworking the
departure puzzle (pp. 170–195) Nashville, TN: Vanderbilt University Press.
https://www.researchgate.net/publication/282861589_Where_Is_the_Student_Lin
king_Student_Behaviors_College_Choice_and_College_Persistence
Stahl, N., & King, J. R. (2020). Expanding approaches for research: Understanding and
using trustworthiness in qualitative research. Journal of Developmental
Education 44 (1): 26–28.
https://www.researchgate.net/publication/337224462_Expanding_Approaches_for
_Research_Action_Research

106
Stefanova, K. & Kabakchieva, D. (2017). Educational data mining perspectives within
university big data environment. International Conference on Engineering,
Technology and Innovation (ICE/ITMC), Funchal, 2017, pp. 264-270, doi:
10.1109/ICE.2017.8279898.
Swafford, S. J. (2017). Factors affecting retention of first-time, full-time freshmen
students at higher education institutions within the Appalachian college
association. University of Tennessee at Chattanooga, Tennessee.
https://www.researchgate.net/publication/346425936_Expanding_Approaches_for
_Research_Understanding_and_Using_Trustworthiness_in_Qualitative_Research
Terrón, M., Olivencia, J. J. L., & Caballero, P. D. F. (2010). Big data irruption in
education.” Irrupción Del Big Data En La Educación., 57(3) 59–90.
https://doi.org/10.12795/pixelbit.2020.i57.02.
Tierney, W. G. (2016). An Anthropological Analysis of Student Participation in College.
The Journal of Higher Education, 63(6), 603–618.
https://doi.org/10.1080/00221546.1992.11778391
Tight, M. (2020). Student retention and engagement in higher education. Journal of
Further and Higher Education 44 (5), 689–704.
https://doi.org/10.1080/0309877X.2019.1576860.
Tinto, V. (2006). Research and practice of student retention: What next? Journal of
College Student Retention: Research, Theory & Practice 8 (1), 1–19.
https://doi.org/10.2190/4YNU-4TMB-22DJ-AN4W.
Tobin, G. A., Begley, C. M. (2004). Methodological rigour within a qualitative
framework. Journal of Advanced Nursing, 48, 388–396. doi:10.1111/j.1365-

107
2648.2004.03207.x
Torrecilla, J. L., & Romo, J. (2018). Data learning from big data. Statistics & Probability
Letters: The role of Statistics in the era of big data. 136: 15–19.
https://doi.org/10.1016/j.spl.2018.02.038.
Tsai, C.-W., Lai, C.-F., Chao, H.-C., & Vasilakos, A. V. (2015). Big data analytics: A
survey. Journal of Big Data, 2(1), 21. Big data analytics: a survey | Journal of Big
Data | Full Text (springeropen.com)
Tukey, J. W. (1977). Exploratory data analysis. Reading, MA: Addison-Wesley
Wang, Y. (2017). Education policy research in the big data era: Methodological frontiers,
misconceptions, and challenges. Education Policy Analysis Archives, 25(94).
http://dx.doi.org/10.14507/epaa.25.3037
Wayt, L. & La Cost, B. (2016). Transitioning to performance-based state funding:
Concerns, commitment, and cautious optimism. Faculty Publications in
Educational Administration. https://digitalcommons.unl.edu/cehsedadfacpub/112.
Welsh, E. (2002). Dealing with data: Using NVivo in the qualitative data analysis process.
Forum, Qualitative Social Research, 3.
http://www.qualitativeresearch.net/fqs/fqs-eng.htm
White, D. E., Oelke, N. D., Friesen, S. (2012). Management of a large qualitative data set:
Establishing trustworthiness of the data. International Journal of Qualitative
Methods, 11, 244–258. doi:10.1177/160940691201100305

108
Whitford, E. (2020). Colleges walk back fall reopening plans and opt for online-only
instruction. https://www.insidehighered.com/news/2020/08/12/colleges-walk-
back-fall-reopening-plans-and-opt-online-only-instruction
Wilderotter, R. (2020, July 22). How higher ed can use predictive analytics for student
recruitment and retention. BPLogix.
https://www.bplogix.com/blog/predictiveanalytics-student-retention
Williamson, B. (2017). Who owns educational theory? Big data, algorithms and the
expert power of education data science. E-Learning and Digital Media 14 (3)105–
22. https://doi.org/10.1177/2042753017731238.
Xerri, M. J., Radford, K., & Shacklock, K. (2018). Student engagement in academic
activities: A social support perspective. Higher Education 75 (4), 589–605.
https://doi.org/10.1007/s10734-017-0162-9

