


1
CHAPTER 1
INTRODUCTION
National Context
Many countries, including the United States of America, are “reforming their
education systems to provide their citizens with knowledge and skills that enable them to
engage actively in democratic societies and dynamic knowledge-based economies”
(Sahlberg, 2006, p. 261). These skills are often referred to as “21st century
competencies” or, in the United States, “21st century skills” (Voogt et al., 2013, p. 405).
In 2015, President Barack Obama instituted the Every Student Succeeds Act (ESSA),
which addressed the need for states to enhance technology-assisted learning and testing to
provide students with these skills (Hall, 2018). Digital literacy was referenced within the
context of this document (Alliance for Excellent Education, 2016) and later expounded
upon by the United States Department of Education’s Office of Education Technology in
an additional document that described and explained how schools, including post-
secondary, should go about integrating technology and digital literacy into their teaching
and learning practices. In 2017, the Office of Educational Technology updated this
document and named it Reimagining the Role of Technology in Education: 2017 National
Education Technology Plan Update. This update carefully describes why educational
technology and digital literacy should be used in schools, what students need to learn
about and with educational technology, and how teachers, administrators, teacher

2
preparation institutions, and policy makers can implement the educational technology
plan (U. S. Department of Education [ED], 2017).
Even before the United States Department of Education (ED) published their
2017 Educational Technology Plan Update, many states had embraced the
implementation of education technology standards through legislation that included
digital literacy skills as the basis for instruction (National Conference of State Legislators
[NCSL], 2017). Indeed, Florida, North Carolina, Minnesota, Maine, and Louisiana all
passed legislation before 2015 promoting the use of educational technology to support
digital literacy skills (Deye, 2015). These states all made provisions for not only student
instruction, but also professional development for teachers so that educators would be
able to implement the states’ educational technology plans (Deye, 2015). Technology
coaches, online professional development courses, and pre-service teacher preparation
courses in technology integration were some of the ways states intended to equip their
educators to address the new state policies (Deye, 2015). Washington State, for example,
passed a bill in 2015 that specifically addressed school technology and library programs
and mandated that librarians collaborate with teachers to integrate digital literacy skills
into regular classroom content (National Conference of State Legislators, 2017;
Substitute Senate Bill, 2015). Other states eventually followed suit and created their own
technology plans. As of September 2018, all states plus the District of Columbia, The
Virgin Islands, and Puerto Rico had a published state technology plan (ED, 2018).
Local Context
The State of South Carolina currently has a new educational technology plan that
is set to replace the previous plan from 2014. The new plan, 2020–24 South Carolina

3
Educational Technology Plan: Empowering Education with Technology (SCDE, 2020),
addresses the 2017 National Education Technology Plan (NETP), and lists the NETP’s
primary goals as follows:
• Learning: Engaging and Empowering Learning Through Technology
• Teaching: Teaching with Technology
• Leadership: Creating a Culture and Conditions for Innovation and Change
• Assessment: Measuring for Learning
• Infrastructure: Enabling Access and Effective Use (SCDE, 2020, p. 2-3)
South Carolina’s new plan has only three stated goals, which incorporate the
national goals. These goals emphasize 1) “Infrastructure, Connectivity, Security &
Privacy,” 2) “Teaching and Learning,” and 3) “State-hosted Services, Collaboration
Opportunities, and Shared Services” (SCDE, 2020, pp. 1-2). Each of these goals
addresses some aspect of digital literacy skills with the Teaching and Learning goals
specifically discussing the implementation of the South Carolina Digital Literacy and
Computer Science Standards, which include digital literacy skills, and which were put
into place in 2017 (SCDE, 2020; SCDE, 2017). Both of these documents explicitly state
that teachers are required to teach digital literacy skills infused into their content area
instruction. The 2020-2024 technology plan (SCDE, 2020) states that “teachers must …
collaborate more and … reach outside the boundaries of their classrooms using
technology and integrate that technology into lesson plans” (p. 9). Likewise, the Digital
Literacy Standards state the following:
The South Carolina Computer Science and Digital Literacy Process Standards
should be integrated into every grade level…. Because the Process Standards

4
drive the pedagogical component of teaching and serve as the means by which
students should demonstrate understanding of the content standards, the process
standards must be incorporated as an integral part of overall student expectations
when assessing content understanding. (SCDE, 2017, p.7)
Although the standards are very clear that teachers need to combine digital
literacy into their lessons, many do not because they do not have time to develop new
lessons, they do not know enough about educational technology to incorporate digital
literacy skills, or they do not have the tools to teach and assess these skills (Voogt et al.,
2013). It must be stated, however, that many teachers and administrators simply do not
know the requirements outlined by the State of South Carolina when it come to the digital
literacy standards. When asked informally, at the school where this study was performed,
no teachers were aware of South Carolina digital literacy standards, much less that they
are supposed to be teaching them. As far as administration goes, the principal of the
school said he thought that the standards were for high school.
The school district in which this study took place does not have a technology
plan. The district website has a technology page, but the Technology Plan link goes to a
blank page. Without a technology plan in place, or a technology coach, the librarians in
the district are solely responsible for the educational technology professional
development that teachers receive and the digital literacy skills lessons that students
receive. Collaboration between teachers and the librarians to co-teach lessons infused
with digital literacy skills would effectively remedy the problem (Latham et al., 2013;
Milbury, 1997; Montiel-Overall, 2007; Montiel-Overall & Grimes, 2013; Ward, 2019).

5
Statement of the Problem
Teachers at the school where this study was performed do not integrate digital
literacy instruction into their lessons to meet the South Carolina Department of
Education’s Digital Literacy Standards.
Explanation of the Problem
Computer science and digital literacy content standards require all South Carolina
public school teachers to provide their students with academic content infused with
digital literacy skills. These skills are defined as the ability to effectively and efficiently
locate information in an online environment, critically evaluate that information for
reliability and relevance, use that information correctly and ethically, and create new
information that can be safely shared (American Association of School Librarians, 2017;
P21, 2019; South Carolina Department of Education [SCDE], 2020), along with the
Computer Science and Digital Literacy Content Standards (SCDE, 2017). However,
many teachers often lack time, technology expertise, and/or tools to teach or assess this
type of learning outlined by state’s educational standards (Voogt et al., 2013). One study
aimed at investigating one-to-one teaching practices reported that “teachers are obsessed
by ‘covering content’ and are not sufficiently motivated to promote technology-assisted
learning and develop[ing] the digital literacy of their students” (Blau et al., 2016, p.1228).
Unlike many classroom teachers, most school librarians have the expertise and
tools to teach computer science and digital literacy standards (Johnston, 2015). However,
they do not have a teaching situation that allows them to do so (Luetkemeyer, 2017)
because they do not teach regular classes, but instead have only occasional whole group
class visits for library orientations and book check-outs. Thus, librarians end up providing

6
instruction in which digital literacy skills are not infused into authentic projects where
students can apply their learning to real-world situations. To remedy this problem,
Latham et al. (2013) suggest that content teachers and librarians collaborate and co-teach
lessons that address both subject area content and digital literacy and 21st century skills.
Purpose Statement
This mixed methods action research study investigated the impact of the
collaborative teaching (co-teaching) of lessons that integrated digital literacy into social
studies content on sixth-grade students’ social studies unit summative assessment
projects, student engagement, and students’ digital literacy assessment scores during a
social studies learning unit at an intermediate school in the midlands of South Carolina.
Research Questions
RQ1: How does co-teaching instruction that integrates digital literacy and social studies
content influence sixth-grade students’ performance on social studies unit projects?
RQ2: What are the effects of co-teaching instruction that integrates digital literacy and
social studies content on student engagement in the social studies content?
RQ3: What are the effects of co-teaching instruction that integrates digital literacy and
social studies content on six-grade students’ level of digital literacy?
Researcher Subjectivities & Positionality
I am a former art teacher, but now work as a librarian in a tiny, rural school
district in South Carolina. I have lived in this community all my life and have worked
here on and off for my entire career. I have known many of the people that work at my
school forever. I am related to much of the population, I attend church with many of my
students, I taught many of my students’ parents, and I even taught some of the teachers at

7
my school, when they were in school. My position within this study is as an indigenous
insider, which is defined as “local researchers conducting research with individuals and
groups within their own country or cultural groups” (Suwankhong & Liamputtong, 2015,
p. 1).
I received my Master of Library and Information Science degree from the
University of South Carolina (USC) in 2016. USC did an excellent job preparing me for a
modern librarian position, which is about 80% information technologist. At my school, I
track and maintain all the 1:1 devices, I fix most of the equipment, I teach teachers how
to use their technology equipment and how to use the software and apps that are
available. Also, I select and buy books, promote reading and research, maintain the
physical library and check in and check out books. Because of the job that I do, I believe
that most people at my school see me in a service position, like a partner, instead of a
person in a position of power. Students treat me like a teacher, but also a bit like an aunt
or a family friend, which in many cases I am.
Navigating positionality for me, as a researcher in this environment, has been
somewhat complicated because I did not want participants to feel pressured to join the
study because they knew me well. Additionally, I did not want them to skew results in
what they perceived was a positive way in order to please me. Also, I was heavily
invested in the outcome of this study because it affected people I know and care about. In
order to prevent these potential problems, I ensured eligible participants in writing and
verbally that they could choose to not participate without damaging relationships, I
carefully explained that any result was a positive thing because we were learning

8
something, and I would have outside individuals go over my interpretation of data to
detect any bias I may have added.
I have a pragmatic worldview and the associated paradigm allowed me as a
researcher to choose whatever research method best suited my situation to address the
problem (Creswell & Creswell, 2018; Franco, 2016; Onwuegbuzie & Leech, 2005). I
used a mixed methods approach to investigate how student project scores were affected
by the collaboration efforts between a social studies teacher and the librarian (me) as we
co-taught lessons that incorporated digital literacy and heavily emphasized creativity and
problem solving while working collaboratively. Because of my background in art, I
consider creativity and problem solving to be the cornerstones to all real academic
success. Technology is the perfect tool for developing these skills while learning,
creating, and sharing information digitally with the world. I communicated this
conviction with my colleagues and students often.
Though an obvious bias to contend with, I think my values towards educational
technology have had a positive effect on my work as a researcher because I am so
convinced of its advantages. Broadly, I hope my action research will provide researchers,
educators, and librarians with improved awareness of the benefits of teacher-librarian
collaboration. Much closer to home, I hope my research will help my school, my
colleagues, and my students be more aware of digital literacy standards so that our
students can compete with students from all over the world when it comes to them getting
better jobs and thus having a better quality of life.

9
Definition of Terms
• Departmental unit summative assessment project – an assessment in the form of a
project that is required of all students in a grade level for a particular subject
usually at the end of a unit of study.
• Core-content teacher – a teacher that teaches science, mathematics, language arts,
or social studies.
• 21st century skills – skills that involve technology assisted “critical thinking,
communication, collaboration, and creativity” (AASL, 2017).
• Key learning goals from The South Carolina Computer Science and Digital
Literacy Content Standards – digital literacy, computing systems, networks and
the Internet, data and analysis, algorithms and programming, and the impact of
computing (SCDE, 2017).
• Collaborative teaching – a teaching practice whereby two or more teachers plan,
teach, and assess learning units (Montiel-Overall, 2005). For this study,
collaborative teaching is a teaching situation in which a librarian and a core-
content teacher form a partnership whereby they work together to develop lessons
or unit plans that infuse digital literacy skills into academic content (AASL,
2018b; ISTE, 2018).
• Integrated lessons – for this study, an integrated lesson is a learning structure
where an academic core-content teacher and a librarian plan together and then
teach a body of knowledge that mixes both digital literacy and academic content
(AASL, 2018; Dooley, et al., 2016; Montiel-Overall & Grimes, 2013; SCDE,
2021).

10
• Classroom engagement – the intellectual connection that occurs when a student is
deeply interested or involved with academic content identifiable by student
behaviors such as questioning, continued effort on challenging projects,
reviewing, reading ahead, and researching outside sources for the purpose of
personal mastery as well as academic goals (Greene, 2015; Lowe et al., 2020;
Sadaf & Gezer, 2020; Sesmiyanti, 2016; Wallace-Spurgin, 2020).
• Digital literacy – an individual’s ability to use technology to locate information
that meets that individual’s educational or recreational needs, evaluate that
information for accuracy and relevance, and then ethically use and safely share
that information or any new knowledge derived from it (ALA, 2017; Johnston,
2015; ED, 2017; Wray & Mulvihill, 2018).

11
CHAPTER 2
LITERATURE REVIEW
The purpose of this mixed methods action research study was to investigate the
impact of the collaborative teaching of lessons that integrate digital literacy into social
studies content on sixth-grade students’ social studies unit summative assessment
projects, student engagement, and students’ digital literacy assessment scores during a
social studies learning unit at a small, rural school in the midlands of South Carolina. The
literature that was reviewed to inform this study was centered around the three research
questions each having to do with some aspect of digital literacy instruction.
RQ1: How does co-teaching instruction that integrates digital literacy and social studies
content influence sixth-grade students’ performance on social studies unit projects?
RQ2: What are the effects of co-teaching instruction that integrates digital literacy and
social studies content on student engagement in the social studies content?
RQ3: What are the effects of co-teaching instruction that integrates digital literacy and
social studies content on six-grade students’ level of digital literacy?
When analyzing the research questions in-depth, three main variables emerged to
direct the literature search. These variables were: (1) collaborative teaching between
content area teachers and librarians, (2) students’ academic success and classroom
engagement when content teachers and librarians co-teach lessons to students, and (3)
students’ digital literacy skills.

12
In order to locate and examine literature relevant to this study, a variety of
methods were used including database searches, book chapters, journal articles and their
bibliographies, and recommendations form colleagues. I used Academic Search
(EBSCO) and ProQuest as indexes. Only one relevant article was found using Google
Scholar, and for this article, I searched Thomas Cooper Library journals to make sure the
publication was peer-reviewed. The main databases that I used were Academic Search
Complete, ERIC (Education Resources Information Center), Gale Literature Resource
Center, ProQuest Dissertations and Theses Global, Taylor and Frances Online, Library
Literature & Information Science Full Text (H. W. Wilson), Springer Link, Wiley Online
Library, William and Mary Scholar Works, and JSTOR. When searching databases, the
searchers were limited to “peer reviewed” journals only, usually with a publication date
set for between 2012 and the year at the time of the search. Some articles were located
without a date limitation and were deemed seminal works concerning my research.
When searching the library catalogue and databases, I used many different search
terms and combinations of search terms to locate literature. These search terms were
mainly centered on each of the variables of this study. For instance, when I was focusing
on teacher and librarian collaboration, I used search terms such as “librarians” &
[Boolean operator “and”] “collaboration,” & “librarian” & “teacher” & “collaboration.”
Likewise, when I was focusing on students’ academic success and classroom engagement
when content teachers and librarians co-teach, I used search terms that included
combinations of “student academic success” & “digital literacy” & “teacher librarian
collaboration,” as well as “student classroom engagement” & “digital literacy” &
“teacher librarian collaboration.” I also searched “student classroom engagement” alone

13
or with the terms “definition” and “assessment.” For works that pertained to digital
literacy I searched not only using the term “digital literacy” but also other terms that fall
under the realm of digital literacy or are often related to it. These terms include
information literacy, 21st century skills, and the 4 Cs. Often, when I discovered works
that were highly relevant to my research, there were several references in the authors’
bibliographies that I would locate using the library or the previously mentioned
databases. Finally, several of my colleagues, when doing their own research concerning
topics related to educational technology, would send me articles that were significant for
my own study. These shared sources were then searched using a scholarly database and
the limiter “peer reviewed” in order to verify the legitimacy of the resource before
including it into my own literature to be reviewed.
The review of literature for this action research study is organized into three
sections with each section relating to the variables. The first section discuses aspects of
how collaborative teaching is defined and further explores what integrated lessons are
when academic content is infused with digital literacy instruction. The second section
concerns students’ classroom engagement and considers how it is defined and measured
in an academic setting. The third section provides a thorough review of literature
concerning digital literacy as a whole, how it has evolved, why it is relevant, how digital
literacy is assessed, who teaches it, and how and why it may not be currently taught
adequately to students. The final section of the literature review for this study looks at
teacher – librarian collaboration as a means to providing students with digital literacy
instruction combined with academic instruction. How students benefit from this practice,

14
as well as the benefits and challenges experienced by teachers and librarians are further
explored and discussed in this last section.
Collaborative Teaching and Integrated Lessons
In this section of the literature review, teacher and librarian collaboration will be
defined and discussed in terms of what is expected by the governing bodies that oversee
librarian education and school librarian standards that are what national and state
government education departments require of teachers and school librarians. Further, the
concept of integrated lessons or units will be defined in the context of teacher and
librarian collaboration. Also included in this portion of the literature review, research
concerning collaboration and integrated lessons as well as examples of how digital
literacy has been infused into content lessons by librarians while working collaboratively
with teachers in all grade levels will be addressed.
Definition of Collaborative Teaching
In the United States, the American Library Association (American Library
Association [ALA], 2017) and the American Association of School Librarians
(American Association of School Librarians [AASL], 2018a) provide a set of national
educational standards for kindergarten through twelfth-grade school librarians. These
standards inform the criteria for school librarian education and evaluation as well as
being the basis for individual states’ school library standards (Burns & Dawkins, 2021).
Along with the International Society for Technology in Education (ISTE), a highly
respected global organization also responsible for contributing input into teaching
standards (Prottsman, 2019), these governing bodies include librarian and teacher
collaboration as one of the major foundations of school librarianship (AASL, 2018a;

15
ISTE, 2018; Prottsman, 2019). Specifically, both the ISTE standards (2018, p. 3) and the
AASL standards (2018a, p. 5) each use the exact wording stating that a librarian “builds
instructional partnerships” and “partners with educators to design and implement
evidence-based curricula and assessments that integrate elements of deeper learning,
critical thinking, information literacy, digital citizenship, creativity, innovation and the
active use of technology.” In essence, the AASL and the ISTE have described
collaborative teaching as a teaching situation in which a librarian and a core content
teacher form a partnership whereby they work together to develop lessons or unit plans
that infuse digital literacy skills into academic content (AASL, 2018b; ISTE, 2018).
Montiel-Overall (2005) in her highly influential work concerning the theory of
collaboration between teachers and librarians defined collaboration as follows:
Collaboration is a trusting, working relationship between two or more equal
participants involved in shared thinking, shared planning, and shared creation of
integrated instruction. Through a shared vision and shared objectives, student
learning opportunities are created that integrate subject content and information
literacy by co-planning, co-implementing, and co- evaluating students’ progress
throughout the instructional process in order to improve student learning in all
areas of the curriculum. (p. 5)
Therefore, based on this description, the AASL standards, and the ISTE standards, the
definition of collaborative teaching will be operationalized as the collaboration of
teachers and librarians in a partnership whereby both individuals plan and subsequently
teach lessons together that incorporate or infuse digital literacy skills into the teacher’s

16
content, and then jointly assess their students’ work (AASLb, 2018; ISTE, 2018;
Montiel-Overall, 2005).
Definition of an Integrated Lesson
As described earlier, teachers and librarians have been directed to collaborate
while planning and teaching lessons or units. Standards describe these collaboration
efforts as integrated lessons when they combine academic content and information/digital
literacy instruction (AASLa, 2018; Montiel-Overall & Grimes, 2013; SCDE, 2021;
Dooley et al., 2016). Often, an integrated lesson can be described in terms of examples,
such as when a science instructor and a librarian collaborate when preparing and then
together oversee students during inquiry-based units such as summative science projects
when the teacher teaches the science portion of the lessons and the librarian helps
students research topics using online databases, helps them find credible sources, helps
them document and cite their sources, and then helps them prepare presentations that
combine their research into a sharable products (McPherson & Dubé, 2016). Using this
description as a guide, for the purpose of this study an integrated lesson or unit will be
operationally defined as a learning structure where an academic core content teacher and
a librarian plan together and then teach a body of knowledge that mixes both digital
literacy and academic content (AASL, 2018; Dooley, et al., 2016; Montiel-Overall &
Grimes, 2013; SCDE, 2021).
Collaborative Teaching and Integrated Lessons
A large body of research exists concerning how different partnerships, co-
teaching, and collaboration should take place between teachers and librarians in a K-12
setting. Much of this research is based on the works of Loertscher who wrote his first

17
edition of Taxonomies of the School Library Media Program in the 1980s. The second
edition of Loertscher’s book includes information literacy using technology and has since
been embraced in place of the earlier edition by researchers spanning two decades
(Gwyer et al., 2012; Loertscher, 2000; Mohamad, 2017; Montiel-Overall, 2005; Ward,
2019). It is this edition that was the guiding force of Montiel-Overall’s (2005) seminal
work concerning teacher and librarian collaboration.
Grounded in the works of social constructivist learning theorists such as Dewey,
Bruner, and Vygotsky as well as previous researchers in the fields of psychology,
educational practices, and library science, Montiel-Overall (2005) sought to provide a
theory of collaboration and ultimately came to described four types of working
relationships between librarians and teachers that have been associated with the term
collaboration. These levels are referred to in research concerning this topic as Teacher
and Librarian Collaboration (TLC) models with each type of relationship being a
progressively more appropriate situation for the maximum benefit of teachers, librarians,
and students with the final one being the highest degree of attainment and the most
desired relationship to promote student success (Kammer et al., 2021 ;Montiel-Overall,
2005).
According to Montiel-Overall (2005) the first level of teacher librarian
relationship is one in which the librarian and the teacher coordinate efforts to reduce
duplicated activities or better accommodate schedules, but this coordination does not
focus on student learning. The second level of working relationships between librarians
and teachers involves cooperation along with a partnership in which the teacher and the
librarian work together on a goal that is focused on student learning, but the partners do

18
not have a shared planning time and the intellectual and assessment portions of the
leaning objectives are not shared (Montiel-Overall (2005). The third level of teacher and
librarian collaboration described by Montiel-Overall (2005) is the integrated
instructional model which is the model that seems most accurately to describe the
standards goals of modern AASL (2018a), and the ISTE (2018) school library standards
described earlier. In this model teachers and librarians work during a shared planning
time to create lessons and activities that integrate academic content and
information/digital literacy learning arising from a “shared vision” and a “shared
objective” aiming to increase students’ educational outcomes (Montiel-Overall, 2005, p.
5). The fourth and final model outlined by Montiel-Overall (2005) in her foundational
work involves the librarian not just working with a teacher, but with the administration
and all teachers within a school to create a curriculum that integrates information/digital
literacy into all academic content and all grade levels.
Often referencing Montiel-Overall’s work on a theory of collaboration, additional
research concerning this topic has been performed in the time since. Kammer et al.
(2021), in their qualitative meta-analysis, used Montiel-Overall’s work concerning the
four models of teacher and librarian collaboration (TLC) to examine what practices or
behaviors librarians engage in that make true collaboration with teachers, that is
combining information literacy with academic content, possible and effective. This study
also looked at how different researchers measured the outcomes of the collaboration
efforts and included librarians and teachers from elementary, middle, and high school
settings (Kammer et al., 2021). Through the lens of Montiel-Overall’s TLC Models, the
authors used the qualitative data collected from the primary research studies along with

19
the Wilder Collaboration Factors Inventory developed by Mattessich and Johnson (2018)
to analyze the qualitative data collected from each of the studies selected for their meta-
analysis (Kammer et al., 2021, p.11). The Wilder Collaboration Factors Inventory was
developed to gage collaborating practices and success within organizations (Mattessich &
Johnson, 2018). This instrument uses a Likert scale with 44 questions arranged according
“twenty-two factors of successful collaboration” (Kammer et al., 2021, p. 3) that are
clustered into six groups which include “environment, membership characteristics,
process and structure, communication, purpose, and resources” (Kammer et al., 2021, pp.
3-4). Using the factors from this instrument, but not the instrument itself, the researchers
used commentary from the primary studies to collectively examine how librarians
perceived their collaborative experiences and the factors that influenced these perceptions
(Kammer et al., 2021).
Besides this above mentioned qualitative meta-analysis that used the TLC models
and the Wilder Collaboration Factors Inventory, additional research studies aimed at
investigating teacher and librarian collaboration have been performed using qualitative,
quantitative, mixed methods and action research. For instance, King (2019), who was
one of the primary researchers in the Kammer et al. (2021) meta-analysis performed an
action research study to investigate and analyze how new collaborations are formed once
participants decide that they wish to work together collaboratively. Likewise, Mohamad
(2017) in an explanatory, sequential, mixed method study specifically focused on
collaboration between librarians and teachers when integrating academic lessons with
technology. Both studies used collected qualitative data using case studies while also
using surveys to collect quantitative data (King, 2019; Mohamad, 2017).

20
When collaborative teaching involving librarians and teachers is discussed, one
should assume that the librarian will be teaching some sort of information literacy and
that this will be in the form of digital literacy (Gwyer et al., 2012). That being said, a
small body of research has emerged within the last two decades that focuses on how to
most effectively provide content instruction and digital literacy instruction for students
during inquiry-based units similar to those discussed as part of the definition of integrated
lessons. Early works using both qualitative and quantitative methods examining inquiry-
based instruction combined with information/digital literacy instruction aimed at
providing data mostly about project success, not student success, in social studies project-
based lessons (Milbury, 1997), general studies and language lessons (Chu, 2009), and
science lessons (Hughes, 2012). However, there is a notable lack in recent literature
concerning 1) teacher and librarian collaboration on longer projects or unit lessons, 2)
student engagement during the projects, and 3) students overall successful completion of
the units due to their engagement because of the digital literacy instruction component
(Kammer et al., 2021). This lack of literature suggests that an investigation grounded in
the constructivist pedagogy theory of project-based or inquiry-based learning is
necessary. This may seem especially true if one takes to heart the work of Loertscher
(2000) and his statement:
Collaborative planning with teachers and students (during a constructivist project)
is the most powerful link between the library media program and raising academic
achievement. An effective human interface between teachers and learners and the
vast store of information technology can and should make a tremendous
difference as a learning experience proceeds. (p. 81)

21
Classroom Engagement
Student classroom engagement or how deeply students are involved in subject
matter or activities is an issue that concerns teachers and education professionals all over
the world. When students become engrossed in learning a particular subject or become
absorbed in a project, teachers find it far easier to teach the students or lead the students
in their own quest for knowledge (Taylor & Parsons, 2011). Further, students’ deep
engagement in subject matter is what brings joy and purpose to many teachers. But aside
from the pleasure teachers get from having their students become absorbed in their
content, students’ classroom engagement has been linked to students' academic success
and in fact to success beyond the K-12 environment (Fredericks et al., 2004; Greene,
2015; Sesmiyanti, 2016; Wallace-Spurgin, 2020).
In this section of the literature review for this study, classroom engagement will
be defined in terms of current research. In addition, research concerning the effects of
student classroom engagement will be explored in terms of the effects on overall student
academic success and test scores. Finally, the means by which classroom engagement has
been measured and assessed by other researchers as well as the instrument that I used to
assess classroom engagement will be discussed.
Definition of Classroom Engagement
In the past, concerns over how deeply students connect to academic content have
been concentrated on enhancing students’ grades, removing discipline issues, and helping
students feel more a part of the learning community so that they stay in school (Taylor &
Parsons, 2011; Wallace-Spurgin, 2020). Of late, the concern has moved somewhat away
from grades, discipline, and retention and has started focusing more on student

22
engagement so that students “learn how to learn” and so that they “become lifelong
learners in a knowledge-based society” (Wallace-Spurgin, 2020, p. 6). Based on earlier
works by Fredericks et al. (2004) concerning student engagement Wallace-Spurgin
(2020) outlined three types of engagement associated with students when they are being
taught and participating in lessons: behavioral engagement, emotional engagement, and
cognitive engagement. Wallace- Spurgin (2020) described these three types of
engagement as follows:
1. Behavioral engagement draws on the idea of participation; it includes
involvement in academic and social or extracurricular activities and is
considered crucial for achieving positive academic outcomes and
preventing dropping out.
2.Emotional engagement encompasses positive and negative reactions to teachers,
classmates, academics, and school and is presumed to create ties to an
institution and influence willingness to do the work.
3.Cognitive engagement draws on the idea of investment; it incorporates
thoughtfulness and willingness to exert the effort necessary to comprehend
complex ideas and master difficult skills. (p.26)
For this study, student engagement as described above by Wallace- Spurgin (2020) will
be referred to as classroom engagement and will include all three components of
engagement and as such will be focused on for research question two.
Accordingly, classroom engagement has been defined by researchers in various
ways. Early on, Fredericks et al. (2004) ultimately defined engagement in terms of
students’ “self-regulated learning” along with their “psychological investment” (p. 65).

23
Later on, but still referencing Fredericks et al. (2004), additional researchers added to the
description of engagement to help define the phenomenon (Wallace- Spurgin, 2020).
Activities such as questioning, continued effort on challenging projects, reviewing,
reading ahead, and researching outside sources were found to be indicative of classroom
engagement (Wallace-Spurgin, 2020). Along with this explanation of engagement, there
arose a need to add the degree to which students are engaged in content to help round out
the definition in the literature (Greene, 2015).
Based on this need, and after much research, Greene (2015) defined deep
engagement as a time when students actively use what they have previously learned
along with new information to build new knowledge, whereas “shallow engagement
involves rote processing and other intentional cognitive actions that are more mechanical
than thoughtful (e.g., rote rehearsal and verbatim memorization strategies)” (Greene,
2015, p.15). Further, Greene (2015) described the depth of student engagement in terms
of students’ motivation and learning objectives. Deeper engagement occurs when
students are self-motivated to connect with content to attain mastery for personal as well
as academic achievement (Greene, 2015; Sesmiyanti, 2016) and “involves self-regulation
strategies” (Lei et al., 2018, p. 519) that help them stay active and focused. In essence,
deep student engagement in academic content is the degree to which a student becomes
actively involved in the information that is being taught for reasons beyond just being a
good student or getting a good grade (Sadaf, & Gezer, 2020; Sesmiyanti, 2016; Wallace-
Spurgin, 2020) and involves students’ personally developed approaches to learning (Lei
et al., 2018).

24
Therefore, based on these descriptions and definitions, for this study, the term
classroom engagement in academic classes will be operationally defined as the
intellectual connection that occurs when the student is deeply interested or involved with
the content evidenced by student behaviors such as questioning, continued effort on
challenging projects, reviewing, reading ahead, and researching outside sources for the
purpose of personal mastery as well as academic goals (Greene, 2015; Lowe et al., 2020;
Sadaf & Gezer, 2020; Sesmiyanti, 2016; Wallace-Spurgin, 2020).
Classroom Engagement Effects on Student Performance
Classroom engagement and its effects on student learning have long been the
subject of research. Numerous studies have found that students who are more engaged in
content do better academically (Perry & Steck, 2015). In 2018, Lei et al. (2018)
performed a meta-analysis of 69 research studies conducted between the years of 2003
and 2015 to investigate how student engagement and student academic success have been
studied, as well as the overall findings of these studies. The impetus of their research was
partly to delve into why findings published in empirical studies over the years yielded
sometimes inconclusive and contradictory results (Lei et al., 2018). For the purposes of
this action research study, the studies that Lei et al. (2018) reported were located
individually and examined further.
Consequently, two particularly informative studies came to light when analyzing
Lei et al.’s (2018) meta-analysis. Each of these studies separated the types of engagement
and compared how each type effected student success differently depending on different
variables such as demographics, age, and nationality (Shernoff & Schmidt, 2008) and
students’ positive feelings about their school environment (Pietarinen et al., 2014).

25
Further studies concerning student engagement included Appleton et al.'s (2006)
work aimed at measuring cognitive engagement as well as psychological engagement and
the varying affects these two types of engagement, separately and combined, influence
academic achievement. This study used a large population of 1931 ninth-grade students
and a student engagement instrument designed to pick apart the numerous variables that
could influence student engagement (Appleton et al., 2006; Pietarinen et al., 2014; Lei et
al., 2018). Appleton et al.’s (2006) study was particularly interesting because it was
aimed at validating an instrument that was developed to measure the depth of student
engagement and the factors that effected it.
Documenting Classroom Engagement
As discussed above, students’ engagement has been the topic of much research,
especially in terms of how it effects students’ academic success. This is partly due to a
concern for students’ wellbeing (Pietarinen et al., 2014), but also because improvement
on student academic achievement is used to assess individual schools’ and school
districts’ performance, as well as teacher performance, all of which are a concern for
anyone in education today (Lei, et al., 2018; Wang et al., 2014). But despite the
importance of measuring and evaluating student engagement, the process has proven to
be problematic (Appleton et al., 2006). This again is due in part to the fact that student
engagement has been divided into types and subtypes that can be complicated and
intertwined if instruments do not aim to carefully isolate and remove or examine
variables concerning the types of engagement not meant to be studied (Appleton et al.,
2006), as well as the fact that instruments used to measure student engagement do not
necessarily differentiate between school engagement and classroom engagement (Wang

26
et al., 2014). With this in mind, several studies have attempted to develop instruments
and methods for documenting and measuring the separated types of student engagement
(Fredricks et al., 2011) as well as isolating school engagement from individual classroom
engagement (Wang et al., 2014).
Instruments for Assessing Student Classroom Engagement
Fredricks et al. (2011) in conjunction with the National Center for Education
Evaluation performed a study to identify, describe, and evaluate 21 different instruments
used to measure upper elementary through high school student engagement. This
document further analyzed all the instruments to determine each type of engagement (i.e.,
behavioral, emotional, and cognitive) that the instrument measured along with the
validity of the instruments as determined by other researchers. In addition, the study
scrutinized the purposes that the instruments were created for such as monitoring
students, evaluating teachers, assessing interventions, and examining empirical research.
Fredricks et al. (2012) continued their research and further identified four main types of
instruments that researchers use to gather data for engagement studies, which include
student self-report surveys, experience sampling, interviews, and observations. One of
their recommendations pertinent to this study is that researchers use multiple methods of
data collection in order to accurately gage student engagement (Fredricks et al., 2012).
A lack of studies that addressed classroom engagement as opposed to the more
general school engagement was an issue that Wang et al. (2014) sought to remedy with
their development of the Classroom Engagement Survey (CEI). Their notion was that
“engagement should be measured at the same specificity level as the intervention” (Wang
et al., 2014, p. 518). Their CEI was therefore designed to address engagement in

27
particular classrooms and to measure all three types of engagement which, again, include
behavioral, cognitive, and emotional engagement. Further, the CEI was designed to be
used with students in grades four through twelve and be to be invariant across age groups,
“class subject, gender, and free/reduced lunch status” (Wang et al., 2014, p. 523).
For this action research study, I used an adapted version of the CEI, which has
been validated by numerous correlational studies (Cummings, 2020; Fredricks et al.,
2011; Manzano-León et al., 2021; Wang et al., 2014) because of the age of my students
and because it directly measures classroom engagement regardless of gender, race, and
socioeconomic status. Further, because Fredricks et al. (2012) suggested that multiple
measures be used to thoroughly investigate student engagement, I also used student
interviews to gather data for this study.
Digital Literacy
Digital literacy skills have come to be some of the most important skills students,
and indeed people in general, need to navigate our 21st century world where we are
inundated with a barrage of information from a variety of sources almost constantly
(Bejaković & Mrnjavac, 2020; Karnoe et al., 2018; Martzoukou & Elliott, 2016). Still,
digital literacy has varied meanings (Latham et al., 2013). In this section of the literature
review, other researchers’ as well as academic and government entities’ definitions of
digital literacy will be explored, and the term digital literacy will be operationalized for
the purpose of this research study. Additionally, this section will examine how digital
literacy has been assessed within school settings. Within the final portion of this section
of the literature review the importance of teaching digital literacy will be discussed in

28
light of the national and state educational standards that have been created to ensure that
digital literacy is taught in schools.
Definition of Digital Literacy
In 2002, the U.S. Department of Education and the National Education
Association, along with private and national industry leaders formed a group called The
Partnership for 21st Century Skills (P21) (Latham et al., 2013). This group was not only
integral in promoting 21st century skills in K-12 education, but also provided a definitive
definition of 21st century skills, which included under the umbrella of 21st century skills
“information literacy, media literacy, and information and communication technology
(ICT) literacy” (Latham et al., 2013, p. 3). According to P21 in their 2019 document
defining the terms surround 21st century skills, information literacy has to do with a
person’s ability to perform the following:
Access information efficiently (time) and effectively (sources), evaluate
information critically and competently, use information accurately and creatively
for the issue or problem at hand, manage the flow of information from a wide
variety of sources, [and] apply a fundamental understanding of the ethical/legal
issues surrounding the access and use of information. (P21, 2019, p. 5)
Likewise, P21 defines media literacy as a persons’ ability to do the following:
Understand both how and why media messages are constructed, and for what
purposes, examine how individuals interpret messages differently, how values and
points of view are included or excluded, and how media can influence beliefs and
behaviors, apply a fundamental understanding of the ethical/legal issues
surrounding the access and use of media, understand and utilize the most

29
appropriate media creation tools, characteristics, and conventions, [and]
understand and effectively utilize the most appropriate expressions and
interpretations in diverse, multi-cultural environments. (P21, 2019, p. 5)
Finally, according to P21, information and communication technology (ICT) literacy
pertains to a person’s ability to perform the following activities:
Apply technology effectively, use technology as a tool to research, organize,
evaluate, and communicate information, use digital technologies (computers,
PDAs, media players, GPS, etc.), communication/networking tools and social
networks appropriately to access, manage, integrate, evaluate, and create
information to successfully function in a knowledge economy, apply a
fundamental understanding of the ethical/legal issues surrounding the access and
use of information technologies. (P21, 2019, p. 6)
These lengthy sets of definitions have further been used and adapted by the
Institute of Museum and Library Services (IMLS, n.d.) and the American Association of
School Librarians (AASL, 2021) to define information literacy, media literacy, and ICT
literacy in very similar ways. When using the term digital literacy, the AASL,
referencing the American Library Association’s (their governing body) definition, defines
digital literacy is as follows:
Like information literacy, digital literacy requires skills in locating and using
information and in critical thinking. Beyond that, however, digital literacy
involves knowing digital tools and using them in communicative, collaborative
ways through social engagement. ALA’s Digital Literacy Task Force defines
digital literacy as ‘the ability to use information and communication technologies

30
to find, evaluate, create, and communicate information, requiring both cognitive
and technical skills. (ALA, 2017)
Stordy (2015) explained that the terms information literacy, media literacy, and digital
literacy “overlap considerably and tend to be used by others interchangeably” (p. 263).
Based on the close scrutiny of each of the above-mentioned explanations and their
obvious commonality, for the purpose of this research study, I have summarized these
definitions to provide a more succent description of digital literacy which is a
combination of information literacy, media literacy, and ICT literacy and follows more
closely to the ALA’s (2017) Digital Literacy Task Force definition. In short, the
operational definition of digital literacy for this study is an individual’s ability to use
technology to locate information that meets that person’s educational or recreational
needs, evaluate that information for accuracy and relevance, and then ethically use and
share that information or any new knowledge derived from it (ALA, 2017; Johnston,
2015; ED, 2017; Wray & Mulvihill, 2018).
Digital Literacy Assessment
Assessments to accurately and authentically gage students’ digital literacy skills
have, in the past, been a challenge for practitioners and researchers alike (Care & Kim,
2017). According to Care & Kim (2017) authentic assessments must meet the following
five criteria:
1) An authentic task presents as a set of activities that emulate professional practice
2) The physical context reflects the way the competencies will be applied in
professional practice

31
3) The social processes (if these are relevant) will reflect those applied in the real
situation
4) The product or performance mirrors a real life one, permits inferences about the
underlying construct, includes multiple indicators, and is available to others for
review
5) Criteria identify what is valued, and standards indicate levels of performance
expected. (p. 25)
In essence, based on the above criteria, digital literacy assessments in schools need to be
tied to real world situations and projects where students can apply their knowledge and be
graded based on a set of consistent performance standards (Care & Kim, 2017).
In addition to authentic assessments where students apply digital literacy skills to
elaborate, real-world scenarios involving multiple activities, Kent State University
developed the TRAILS (Tool for Real-Time Assessment of Information Literacy Skills)
Digital Literacy Assessment which is a select-response test where students choose an
appropriate answer to a test question from a set of possible items (Kent State University,
2019c). According to Kent State University, this TRAILS assessment has been
“administered more than 126,000 assessments to nearly 2.5 million students” (2019b,
para. 3). Morriston (2007), one of the many educators who has used TRAILS concluded
that the TRAILS assessment provides researchers and librarians with a formative
assessment for students’ digital literacy skills. Likewise, Miller (2016) in a review of the
assessments claimed that “data from the assessment can provide evidence of the need to
purposely incorporate information skills into a school’s curriculum, or serve as the
impetus for conducting action research” (p. 46). Further, Spisak (2018) and Salem (2014)

32
both reported that the TRAILS assessment “has been previously validated and deemed
reliable using Cronbach’s alpha for test reliability and the Rasch model for person and
item reliability” (Spisak, 2018, p.45).
The Kent State assessment has four versions each designed for a different grade
level, one of which is specifically for 6th grade students. The 6th grade TRAILS
assessment is made up of two general assessments with 20 items each and five category
assessments with ten items each for a total of 90 total questions. The category
assessments concern 1) developing topics for research, 2) identifying potential sources
for research, 3) developing, using, and revising search strategies during academic and
personal research, 4) evaluate sources and information during academic and personal
research, and 5) using information responsibly, ethically, and legally (Kent State
Libraries, 2019). A study by Salem (2014) which was designed to investigate the validity
and reliability of the TRAILS for grades 3, 6, 9, and 12 found that the test is valid and
does reliably measure students’ information literacy skills. In point of fact, Salem’s study
reported that “all four tests met or approached the 0.80 threshold for coefficient alpha
recommended for large-scale tests in the social sciences: 3rd grade, α = 0.81; 6th grade, α
= 0.78; 9th grade, α =0.80; 12th grade, α = 0.82” (p. 128). Likewise, Spisak (2018)
investigated the reliability coefficients for the TRAILS and found that Rasch model
estimates of scale reliability provided additional confirmation of the TRAILS test
reliability and stability for each test.
For the purposes of this study and as suggested by Care and Kim (2017), the
researcher used a real-world social studies project where students were required to use
digital literacy skills that met the South Carolina Computer Science and Digital Literacy

33
standards to create an online artifact that also met South Carolina Social Studies
standards for 6th graders. This artifact, i.e., project, provided the authentic situation in
which students' performance could be assessed. In addition, an adapted version of the
TRAILS assessment, called the Online Digital Literacy Assessment (ODLA) was used to
collect data for this study.
Importance of Teaching Digital Literacy Skills
The importance of digital literacy cannot be overstated. In order for almost
anyone to function in society today they need to be able to do minimal online operations
such as search for a website, find and fill out online forms, and find specific information
such as telephone numbers and address (Martzoukou & Elliott, 2016). However, this
description only touches on basic survival. In order to participate fully in our society,
which includes finding employment, accessing government information and assistance,
and finding education information, individuals need to be able to do a great deal more
(Martzoukou & Elliott, 2016). Indeed, studies have shown that individuals who do not
know how to search and find resources online fare far worse than those who do when it
comes to employability (Bejaković & Mrnjavac, 2020), as well as health and wellbeing
(Karnoe, 2018). Likewise, research has shown that students who do not have access to
technology in their homes so that they can develop stronger digital literacy practices fall
significantly short of their adult earning potential and educational attainment (Vigdor et
al., 2014). Based on research, it is then clear that people in general need digital literacy
skills to survive and prosper in our world.
However, international, national, and regional organizations have recognized this
need has not been fully met (Voogt et al., 2013) and has further been emphasized in light

34
of educational challenges that occurred because of Covid-19 (Lai & Widmar, 2021). In
this next section of the literature review, and as part of the overall discussion of digital
literacy, national, as well as South Carolina state educational standards for teaching
digital literacy will be explored.
National and State Standards for Teaching Digital Literacy
As mentioned earlier, the International Society for Technology in Education
(ISTE) has developed a set of standards that are used throughout the world to inform
technology use in and for educational institutions, which includes digital literacy
instruction in all its forms (Almisad, 2020; Kimm et al., 2020). These standards informed
United States Department of Education’s (ED) Office of Educational Technology,
National Education Technology Plan (2017), as well as the ISTE’s National Standards for
Educators (2017) (specifically for teachers, as opposed to the broader standards for
education as a whole) and the ALA’s National School Library Standards (2017).
Likewise, these standards were then used to develop individual states’ standards
including the South Carolina Department of Education’s (SCDE) South Carolina
Computer Science and Digital Literacy Standards (2017). In this section, examples from
each of these sets of standards will be provided to illustrate the connectiveness and
similarity that each agency aimed for when creating their standards.
ISTE National Standards for Educators
The ISTE’s National Standards for Educators include the following specific
standards that relate to regular core content teachers teaching digital literacy:

35
a. Create experiences for learners to make positive, socially responsible
contributions and exhibit empathetic behavior online that build
relationships and community.
b. Establish a learning culture that promotes curiosity and critical examination
of online resources and fosters digital literacy and media fluency.
c. Mentor students in the safe, legal, and ethical practices with digital tools and
the protection of intellectual rights and property.
d. Model and promote management of personal data and digital identity and
protect student data privacy. (ISTE, 2018, p. 1)
The ISTE standards listed above are for educators. Standards b and c correspond to
librarian standards B.1., C.1. and C.2. below.
National School Library Standards
The ALA (2017) and ISTE (2018) National School Librarian Standards are the
same and are quite in depth and extensive. Below are only a few examples from the
standards that relate to librarians teaching digital literacy:
A. The school library facilitates opportunities to integrate collaborative and
shared learning by:
1. Partnering with other educators to scaffold learning and organize learner
groups to broaden and deepen understanding.
2. Leading inquiry-based learning opportunities that enhance the
information, media, visual, and technical literacies of all members of
the school community. (ALA, 2017, p. 5)

36
B. The school library promotes selection of appropriate resources and tools for
information use by:
1. Demonstrating and documenting how resources and technology are used
to address information needs.
2. Providing opportunities for all members of the school community to
develop information and technology skills needed to promote the
transfer of information-related problem-solving strategies across all
disciplines. (ALA, 2017, p. 7)
C. School librarians act as a resource for using valid information and reasoned
conclusions to make ethical decisions in the creation of knowledge by:
1. Showing a variety of strategies to ethically use and reproduce others'
work and modeling this ethical use.
2. Requiring complete attribution to acknowledge authorship and
demonstrate respect for the intellectual property of others.
3. Promoting the inclusion of elements in personal-knowledge products that
allow others to credit content appropriately. (ALA, 2017, p. 11)
The ALA and ISTE librarian standards referenced above apply not only to teaching
students digital literacy, but also make it clear that the librarian is a digital literacy
resource for educators.
The South Carolina Computer Science and Digital Literacy Standards
The South Carolina Computer Science and Digital Literacy Standards cover an
extensive amount of detailed information concerning technology and digital literacy
instruction. According to the SCDE these standards are to be used “for all students in all

37
grade levels, kindergarten through grade eight” and “embedded in or taught in
conjunction with academic standards in the content areas of mathematics, English
language arts, science, and social studies” (2017, p. 3). For the purpose of brevity while
still providing an example of the South Carolina standards, a small example of the South
Carolina standards is provided below:
Standard 2: Understand risks and responsibilities of being a digital citizen.
The student will:
6.DL.2.1 Identify rules for safe internet use.
6.DL.2.2 Identify appropriate use of social media (e.g., cyberbullying
prevention).
Standard 3: Understand issues associated with appropriate use of personal digital
information.
The student will:
6.DL.3.1 Define and identify personal digital information.
6.DL.3.2 Identify consequences of inappropriate sharing of personal
digital information (SCDE, 2017, p. 35)
The South Carolina Computer Science and Digital Literacy Standards listed above are
educator standards, not librarian standards (SCDE, 2017). The ISTE (2018) standards for
educators and the ALA (2017) and ISTE (2018) standards for librarians discussed earlier
effectively connect educators to librarians through collaboration so that the librarian can
be a resource for educators when they teach digital literacy.

38
Digital Literacy Instruction
The need to teach digital literacy to students to prepare them for full participation
in society is critical (Bejaković & Mrnjavac, 2020; Karnoe et al., 2018; Martzoukou &
Elliott, 2016). In response to this need, national and state education standards have been
established requiring digital literacy be taught by content teachers and librarians in order
to address this condition (AASL, 2017; ISTE, 2017; SCDE, 2017). Regardless of the
instated standards, studies have shown that for the most part students are still not
receiving adequate digital literacy instruction (Crary, 2019; Dooley, 2016; Falloon, 2020;
Shaw, 2017). To that end, researchers have identified several factors that account for this
situation. In this section of the review of literature, some of these factors for inadequate
digital literacy instruction will be explored. Further, the training and preparation that is
provided to both academic teachers and librarians in teacher education programs at
colleges and universities will be examined in terms of teaching digital literacy.
Digital Literacy Instruction and Training for Content Teachers
One factor identified by researchers that is responsible for inadequate digital
literacy instruction for students involves insufficient teacher preparation. Kimm et al.
(2020), when examining preservice teachers’ perceptions of their own technology and
digital literacy skills and their subsequent abilities to teach these skills, concluded that
preservice teachers do not feel confident in their own abilities and are not prepared to
teach the ISTE standards to students. Likewise, Falloon (2020) pointed out that new
teachers are not given adequate preparation and training saying that teacher training
programs often only provide preservice teachers with one technology course and then
assume that this course will prepare them to teach digital literacy integrated into their

39
own learning units. In point of fact, several researchers have found that most preservice
teacher preparation programs include only an undergraduate library introduction and a
brief overview of how to use databases and document sources but that is usually the end
of it (Dodson, 2020; Voogt et al., 2013).
To exacerbate this problem, after these new teachers leave their teacher
preparation programs and enter their professions, quick demonstrations during
professional development sessions provided by the schools where they teach may be all
the support provided for them (Puccia, 2017). Consequently, Reisoğlu and Çebi (2020)
for their research, created and evaluated a program that was specifically designed to teach
preservice teachers’ digital literacy. Still, research and resulting programs for preservice
teachers does not address the needs of older teachers or teachers who entered the
profession before digital literacy became a necessary focus. Marksbury (2017) reported
that teachers who were older or learned to teach prior to the year 2000 were more
uncomfortable teaching with or about technology and thus, indirectly, information
technology. Consequently, the lack of time to properly prepare lessons that integrate
digital literacy into content because of being unfamiliar with technology was also a fear
teachers had when they were asked to address digital literacy standards (Marksbury,
2017). Moreover, this lack of time speaks to most all educators as planning and
implementing lessons that combine core content with deep and meaningful digital
literacy instruction is a significant challenge for many teachers, even if they are fully
capable and feel confident in teaching digital literacy (Blau et al., 2016; Dooley et al.,
2016; Marksbury, 2017). In essence, research has found that a lack of experience, a lack

40
of training, and a lack of time are all possible contributing reasons for this issue (Crary,
2019; Elstad & Christophersen, 2017; King, 2019; Marksbury, 2017; Witte, 2015).
Digital Literacy Instruction and Training for Librarians
In contrast to regular education teachers, modern librarians are trained to teach
digital literacy through graduate level degree programs (Johnston, 2015; Potnis & Allard,
2018; Wine, 2016). In addition to formal, institutional instruction, all certified school
librarians, both seasoned and more recent to the profession, are trained to teach digital
literacy through ongoing, focused professional development as part of the school librarian
recertification process (Cooper, 2015; Luetkemeyer, 2017). Further, teaching and
promoting literacy, in all its forms, has always been at the heart of the educational
preparations that librarians receive from colleges and universities as part their basic
training (Condic, 2016; ALA, 2017, 2019). Before the information age, librarians were
trained to teach and/or help people find and use print materials and other media such as
movies and images to meet their information needs and then how to ethically use that
information to create and share their learning (Secker, 2017). Now, library schools
prepare future librarians to teach people digital literacy as part of the total realm of
information literacy (Davies-Hoffman, 2013). This is the standard for library schools
with 95% of all American MLIS (Master of Library and Information Science) programs
requiring at least one digital literacy course about online sources such as databases, as
well as general sources to find information, assess it for validity and relevance, and then
use this valid and relevant information in an ethical way, meaning citing sources and
sharing new information formed based on research and information gathering (Dodson,
2020). In essence, while many core content teachers have difficulties integrating digital

41
literacy into their lessons, librarians are trained experts on how to do this (Blau et al.,
2016; Davies-Hoffman, 2013; Dodson, 2020; Dooley et al., 2016; Marksbury,
2017). Therefore, a practical solution to the issue is for librarians to collaborate with
educators to teach digital literacy (AASL, 2018b; Dodson, 2020; ISTE, 2018).
Teacher and Librarian Collaboration on Integrated Units
Teacher and librarian collaboration have long been suggested and nominally
required by librarian training institution, government policies, and state school standards
(AASL, 2018b; Dooley et al., 2016; Loertscher, 2000; Montiel-Overall, 2005; Montiel-
Overall & Grimes, 2013; SCDE, 2021). However, this practice is far from common
(Gwyer, 2018; Kammer, 2021; King, 2021; Montiel-Overall, 2007). In this section of the
literature reviewed for this study, research concerning why teacher and librarian
collaboration does not often or easily occur will be discussed. Further, the case will be
made that students benefit academically when teachers and librarians work together to
co-teach lesson that infuse digital literacy and academic content. Likewise, in this
section, the means by which this study investigated student success will be discussed
along with the leading theories that are associated with digital literacy and academic
content that is combined and co-taught by teachers and librarians. Further, research on
how teachers can and have benefitted from teacher librarian collaboration will be
presented. Likewise, a review of the literature concerning the benefits librarians
experience because of this collaboration between teachers and librarians will be
discussed.

42
Difficulties or Challenges for Teacher and Librarian Collaboration to Occur
Some of the main reasons teacher and librarian collaboration does not occur have
to do with time and a lack of shared planning (Maharaj, 2015). Librarians with fixed
schedules have difficulty finding shared planning times with teachers (Gavigan et al.,
2010; Mohamad, 2017). Many librarians function on what is called a fixed schedule
where throughout the week teachers and their classes are scheduled to come to the library
for a library lesson, to have a book read aloud to them, and/or for students check out
books (Gavigan et al., 2010; Kammer, 2021; Mohamad, 2017). This practice severely
limits librarians’ ability to meet with teachers to co-plan and co-teach lessons that
integrate digital literacy into academic content (Mohamad, 2017). Consequently, the
AASL has recommended the transition to what is referred to as a flexible schedule where
librarians are freed to arrange for collaboration (Mohamad, 2017).
An additional barrier reseachers have found that limits librarians’ abilities to
collaborate with content teachers is that teachers are unaware of the potential benefits and
services the librarians at their school can provide (Gwyer, 2018; Kammer et al., 2021;
Montiel-Overall, 2007; Witte et al., 2015). Along those same lines, some researchers
have identified yet another collaboration barrier in that many teachers do not know
librarians are digital literacy experts and/or they fear giving up autonomy in their
classrooms. (King, 2019; Mandrell, 2018; Montiel-Overall & Grimes, 2013; Spengler,
2015). These particular circumstances leave librarians only the option of teaching digital
literacy out of context in stand-alone situations (Phillips & Lee, 2019) and thus unable
perform assessments during real-world research projects (Puccia, 2017; Sondergeld &

43
Johnson, 2019). All of these barriers have been linked to the possible lack of
administrative support (Kammer, 2021).
Benefits of Teacher and Librarian Collaboration
Even though teacher and librarian collaboration has its challenges, the benefits
have been shown to have a significantly positively effect on student success, teachers’
self-efficacy in teaching digital literacy, and librarians meeting their own state standards.
In this section each of these benefits will be explored based on previous research.
Student Benefits of Teacher and Librarian Collaboration
Indeed, studies have shown that when librarians collaborate with teachers to co-
teach lessons, deeper student engagement was reported (Maharaj, 2015; McPherson &
Dubé, 2016). In addition, research has shown increases in students’ overall academic
success when students have been taught in a librarian/teacher collaborative environment
(Gretter & Yadav, 2016; Latham et al., 2013; Lee et al., 2017; Lowe et al., 2020; Ward,
2019). In accordance with these studies, Crary (2019) found that “low level[s] of
collaboration reported has a negative impact on test scores in reading and language arts”
(p. 5). To further illustrate the extent of students’ academic success when the
collaborative relations between teachers and librarians are supported by school
administration, Witte et al. (2015) reported the following:
Where there is more collaboration between librarians and teachers backed up by
administrators, scores on the state Reading and Language Arts tests increase by
about six percent over schools without, a proportional difference of almost 13%
over schools where administrators consider collabo-ration anything less than
essential” and Language Arts tests increase by about six percent without, a

44
proportional difference of almost 13% over schools where administrators consider
collaboration anything less than essential. (p. 211 -212)
For the purposes of this study, students test scores on a social studies unit summative
assessment will be analyzed to gage student success when a teacher and a librarian fully
collaborate and co-teach the social studies unit with digital literacy infused into the
content.
Teacher Benefits of Teacher and Librarian Collaboration
One of the benefits for teachers when they collaborate with librarians in units that
infuse digital literacy is librarian-led embedded professional development, which as
Harada (2016) pointed out, provides a professional development platform for teachers
that is “a learner-centered constructivist approach” (p. 2). In addition, studies have shown
increased content teacher self-efficacy in teaching digital literacy because collaboration
with a librarian allows teachers to watch and participate as the librarian models teaching
digital literacy (Harada, 2016; Sadaf & Gezer, 2020). This gives the teacher a chance to
practice while there is an expert on hand, which helps them develop a stronger sense of
self-efficacy (Harada, 2016; Sadaf & Gezer, 2020). Indeed, Patterson et al. (2017) found
that overall, teachers experience feelings of greater self-efficacy when participating in
collaborative teaching.
In addition to increased teacher self-efficacy in teaching digital literacy, some of
the barriers associated with the amount time it takes for teachers to plan integrated units
can be removed because librarians can help share the burden of planning (AASL, 2018b).
Further, Lawson and Laduke-Pelster (2017) found that with a librarian actually working
alongside of a classroom teacher while teaching, the need for dedicated professional

45
development sessions is often eliminated. One final and perhaps the most important
benefit for teachers when they collaborate with librarians is the positive effects
collaboration has on their students’ academic success, which research has shown includes
higher student test scores and deeper student engagement (Latham et al., 2013; Lowe et
al., 2020; McPherson & Dubé, 2016). These student achievements not only reflect
positively on the teacher’s skills when they are evaluated but also the on the evaluations
of the school and district as a whole (Lei et al., 2018).
Librarian Benefits of Teacher and Librarian Collaboration
As stated earlier, librarians often teach digital literacy in stand-alone situations
and out of context (Phillips & Lee, 2019). The lessons often occur in the form of a brief
library introduction and digital literacy overview at the beginning of the school year
(Phillips & Lee, 2019). These brief digital literacy lessons do not provide complete, real-
world situations, like an integrated unit does, and thus do not provide adequate digital
literacy instruction (Reynolds, 2016). Conversely, collaboration on core content academic
units allows for librarians to teach digital literacy in context so students can better learn
these skills (Dooley et al., 2016). Further, when librarians collaborate with teachers on
real world projects, they have the means to perform contextual assessments and truly
gage their students’ digital literacy learning (Puccia, 2017; Sondergeld & Johnson, 2019).
Finally, besides being able to fulfill their profession responsibilities by meeting the
standards outlined by the AASL and the ISTE, perhaps the most important benefit for
librarians when they fully collaborate with teachers is that they are allowed to help people
become more literate in all ways which is the heart of librarianship as a whole (AASL,
2018a; Condic, 2016; Dodson, 2020; ISTE, 2018).

46
Chapter Summary
In summary, the purpose of this mixed methods action research study was to
investigate the impact of the collaborative teaching of lessons that integrate digital
literacy into social studies content on sixth-grade students’ social studies unit assessment
projects, student engagement, and students’ digital literacy assessment scores during a
social studies learning unit at a small, rural school situated in the midlands of South
Carolina. The literature was reviewed in a scholarly manner using best practices outlined
by Creswell and Creswell (2018) and Mertler (2020). These practices included the use of
scholarly databases using search terms related to the sections of this literature review.
In conclusion and based on the literature reviewed for this research study, students
need to be taught digital literacy, which is the ability to locate, evaluate, use, and share
knowledge in a digital environment so that they can effectively navigate all the digital
information available to them (ALA, 2017, 2019; ED, 2017; Johnston, 2015; Wray &
Mulvihill, 2018). Although classroom teachers are tasked with teaching digital literacy in
their regular academic classes based on national and state academic standards (ISTE,
2018; SCDE, 2017), many of these teachers are not truly aware of what information and
digital literacy entails or the academic benefits of teaching these skills properly (Crary,
2019). The literature shows, however, that librarians are uniquely positioned by dent of
their training to teach information literacy (ALA, 2017; Davies-Hoffman, 2013; Dodson,
2020), and when librarians teach information and digital literacy skills in a structured

47
way, embedded and integrated into a curriculum, students have greater digital literacy
gains and perform better academically (Lowe et al., 2020).
Studies indicate that for students to receive and then benefit from quality digital
literacy instruction, teachers and librarians need to be able to meaningfully collaborate
with one another to infuse digital literacy into academic content (Kammer et al., 2021).
Further, research has demonstrated that not only do students benefit from this
collaboration, but also teachers and librarians benefit as well (Condic, 2016; Dodson,
2020; Harada, 2016; Patterson et al., 2017; Sadaf & Gezer, 2020). Still, additional
research has uncovered significant challenges for this co-teaching and collaboration to
occur (Gwyer, 2018; Kammer et al., 2021; Montiel-Overall, 2007; Witte et al., 2015).
However, investigations have shown that with the support of their administrations
(Phillips & Lee, 2019), shared planning times, and teachers becoming aware of how
librarians can help, these challenges can be overcome (King, 2019; Mandrell, 2018;
Montiel-Overall & Grimes, 2013; Spengler, 2015). In summary, digital literacy is
important to students’ success and because of librarians’ training and expertise, librarians
can and should teach digital literacy in collaboration with regular academic teachers.

48
CHAPTER 3
METHODS
This mixed methods action research study was conducted to investigate the impact
of collaborative teaching involving a school librarian (i.e., the researcher) and a social
studies teacher on sixth-grade students’ summative unit project scores, classroom
engagement, and digital literacy skills at a small, rural school situated in the midlands of
South Carolina. The following research questions guided this study:
RQ1: How does co-teaching instruction that integrates digital literacy and social
studies content influence sixth-grade students’ performance on social studies unit
projects?
RQ2: What are the effects of co-teaching instruction that integrates digital literacy
and social studies content on student engagement in the social studies content?
RQ3: What are the effects of co-teaching instruction that integrates digital literacy
and social studies content on six-grade students’ level of digital literacy?
Research Design
For this study, I chose action research because “action research aims at solving
specific problems within a program, organization, or community” (Patton, 2002, p. 221).
Action research is the most appropriate because, according to Mertler (2020), the
researcher both conducts the study and participates in the research process. Further, true
to the purpose of action research, the outcome and findings of the research efforts will
inform the personal future practices of the researcher as a professional and effect the way

49
lessons will be provided to students and the way professional development will be
provided to colleagues at the school where the research will take place. Accordingly, this
personal application is one of the main aspects of action research (Kemmis et al., 2014;
Mertler, 2020).
Action research is best described by Mertler (2020) as “research that is done by
teachers for themselves” (p. 6). Further, Mills and Butroyd (2014) explain that this type
of research is a four-stage process that involves figuring out that there is a problem,
defining the exact problem, designing and carrying out the plan to fix the problem, and
then afterwards evaluating the situation to see if the plan worked (2014). Mertler (2020)
states that many authors have described action research similarly with the stages being
“the planning stage, the action stage, the developing stage, and the reflection stage” (p.
17). Mertler (2020) further explains that the process should be cyclical in that after the
final stage, the researcher should reflect upon the outcomes and start again with
refinements based on the reflections.
Different from traditional educational research with a primary goal to “explain or
help understand educational issues, questions, and processes” (Mertler, 2020, p. 9), action
research, on the other hand, does not seek to just explain, understand, or to perform
observation but to improve education through activity. In general, the benefit of using
action research is that the work is done by and for the practitioner who has a unique and
personal perspective about a situation in which a traditional researcher who is removed
from the situation would not. Tracy (2020) makes the point that “action researchers
collaborate with research participants to examine issues that are contextually important
and provide findings that are helpful to cultural members” (p. 282). Therefore, instead of

50
broad findings that are generalized for a large population, action research is specific to a
community and is performed in context to the distinctiveness of that particular culture.
Action research suited this study because I worked with students and teachers in my
school community to solve issues that were mostly specific to my school.
This action research ultimately followed a convergent mixed methods approach
which is when the researcher collects quantitative and qualitative data typically during
the same time frame and then “converges or merges the….data to provide a
comprehensive analysis…. in the interpretation of the overall results” (Creswell &
Creswell, 2018, p. 15). The methods that were used for the quantitative portions of the
study were instrument-based questions, performance data, attitude data, and statistical
analysis. The method to collect the qualitative data for this study involved semi-
structured interviews to gather information about the perceptions of the individuals
involved and how they felt the innovation influenced their classroom engagement, and
their social studies and digital literacy proficiencies. Once all the resulting data was
analyzed, the researcher was able to make “inferences across both quantitative and
qualitative databases” (Creswell & Creswell, 2018, p.16) and to continue forward
entering into the reflection and sharing stage of the action research cycle (Mills &
Butroyd, 2014; Mertler, 2020).
Setting and Participants
This study took place at a small, rural school situated in the midlands of South
Carolina. The school is part of a small school district that has only one school for
elementary students (K-4), one school for intermediate students (5-6), one school for
middle school students (7-8), and one high school (9-12), with a total of about 4,000

51
students in the entire school district. The intermediate school where the study was
performed had, at the time of the study, a school population of approximately 530
students with 25% categorized as Latino/Hispanic, 20% as African-American, 50%
White, and 5% as Mixed or Other. All students were 10-12 years old.
The school had eight traditional sixth-grade social studies classes where four
teachers taught two social studies classes per day. Participants in this study included one
traditional sixth-grade social studies teacher and her subsequent two social studies class
groups. The teacher’s two social studies classes had about 24 students with
approximately half being female and half being male. The racial demographic aligned
with the school population. Therefore, this study was comprised of one teacher and
approximately 48 student participants that were statistically similar to the total school
population. Students in traditional sixth-grade classes at the school were randomly
assigned to teachers in class groups at the beginning of the school year, and were not
grouped by ability, race, first language, gender, or special circumstances such as
behavioral or cognitive individual educational plans.
The teacher participant was a white female who has been teaching for 26 years.
She started teaching in another significantly larger suburban school in the midlands of
South Carolina in 1996 with the remaining 23 years being spent in the school district in
which the study was performed. She was certified to teach in South Carolina with a
certification in Elementary Education. The teacher had a Bachelor of Education from
Columbia College. She was elected teacher of the year in 2008/2009 and was considered
by the district to be a master teacher.

52
The specific sampling strategy used to select participants for this study was
purposeful and criterion based (Tracy, 2020). Because the study was action research
aimed at improving the researchers own practice (Kemmis et al., 2014; Mertler, 2020),
and because it focused on combining sixth-grade South Carolina social studies standards
and South Carolina computer and digital literacy standards, the students who were chosen
to participate were sixth-grade social studies students who attended intermediate school
and who were assigned to the participating social studies teacher and to the school
librarian (i.e., the researcher). Further, in order to participate in the study, students had to
provide their consent, as well as their parents’ or guardians’ consent through signed
Informed Consent documents that were provided to the students and the parents prior to
the study.
As discussed above, the collaborating teacher taught two class groups, one in the
morning and one starting right before noon. For each class group, her homeroom, and the
other class group, she was responsible for teaching English Language Arts for about 80
minutes and Social Studies about 45 minutes every day. The teacher also took her student
groups to various related arts classes that were scheduled regularly throughout the week
and ate lunch with her homeroom group in the classroom each day.
Her classroom was 24 feet wide by 30 feet long with one door, one 30-inch-wide
window that could open to the outside, and one classroom sink and counter. The walls
were light blue painted cinder blocks. The room was set up so that students sat in rows in
individual desks arranged perpendicular to the door and all facing a smartboard that was
connected to the teacher’s desktop computer. An Epson projector was also connected to

53
the teacher’s desktop computer and was used to project images and videos onto the smart
board.
For ease of discussion, the two student groups are discussed as Group A and Group
B. Table 3.1 illustrates the demographics of each student group as well as the
demographics of both groups combined. Group A was with the teacher from 8:20 until
9:00 AM for breakfast and then again from 11:00 until 2:10 when she taught them
English Language Arts and social studies. Group B is discussed as her team members
homeroom group whom she taught English Language Arts and social studies to from
9:00 AM until 11:00 daily.
There were 25 students in Group A. All of the students were 11 or 12 years old.
There were 12 white students, 8 African American Students, and 4 Hispanic students.
There were 9 female students and 16 male students. Five students regularly attended pull-
out remediation resource instruction special education for math or ELA and three
students regularly attended pull-out special education Gifted and Talented services. Three
students were emergent English speakers who spoke and read Spanish and received
English Language services.
There were 23 students in Group B. All of the students were 11 or 12 years old.
There were 10 White students, three African American Students, eight Hispanic students
and one student who identified as mixed race/other, which in this student’s case was
White/African American. There were 10 female students and 12 male students. Four
students regularly attended pull-out special education remediation instruction for math or
ELA and no students regularly attended pullout Gifted and Talented special education

54
services. Four students were emergent English speakers who spoke and read Spanish and
who received English Language services.
Table 3.1
Student Participant Demographics
Group A - 25
Group B - 23
Group A & B - 48
Number
%
Number
%
Number
%
Gender
Male
16
64%
13
56.5%
29
60.32%
Female
9
36%
10
43.5%
19
39.68%
Language
English
21
84%
15
65.25%
36
74.88%
Spanish
4
16%
8
34.75%
12
25.12%
Race
White
12
48%
11
47.8%
23
48%
Black
8
32%
4
17.4%
12
25%
Hispanic
4
16%
8
34.8%
12
25%
Other
1
4%
0
0%
1
2%
Special Services
Gifted and Talented
Services
3
12%
0
0%
3
6%
Resource
Remediation
5
20%
4
18.16%
9
19%
English Language
Services
3
12%
4
18.16%
7
15%
Description of the Action/Innovation
The innovation implemented in this mixed methods action research study was the
co-teaching of a social studies unit that incorporated the South Carolina Computer
Science and Digital Literacy Standards co-taught by a social studies teacher and a school
librarian. The researcher, who was the school librarian, and the core-content social
studies teacher, collaborated on the design of the innovation unit based on the South
Carolina sixth-grade social studies standards as well as the computer science digital

55
literacy standards that were prescribed by the South Carolina Department of Education at
the time of the study (SCDE, 2017; SCDE, 2019).
The innovation was twofold in that 1) the social studies unit was infused with
computer science standards that include digital literacy skills instruction, and 2) the
librarian co-taught the unit with the regular social studies teacher. Normally, core-content
teachers at the school taught their instructional units alone, and without incorporating
computer science and digital literacy standards. For this study, the researcher and the
teacher met several times face-to-face to develop the lessons for the unit. The intention
was for the researcher to be in the class every day during the social studies lesson
teaching side-by-side with the regular core content teacher. The core content teacher
taught the South Carolina sixth-grade social studies standards while the researcher taught
the South Carolina Computer Science and Digital Literacy Standards infused within the
social studies content.
In order to achieve this, the researcher provided enhanced images, demonstrations,
and examples using educational technology and digital literacy best-practices, and then
assisted students as they did their regular class work. Further, the researcher assisted the
students with their social studies unit projects and presentations that used the online
presentation tool Prezi which allowed for student collaboration. These specific activities
addressed the 2017 South Carolina Computer Science and Digital Literacy Standards
6.DL.1, “Use software applications to collaborate and create authentic products” (SCDE,
2017, p. 33), 6.DA.2.1, “Explore real-world data collection” (SCDE, 2017, p. 36),
6.DA.3, “Analyze various ways to visually represent data.” (SCDE, 2017, p.36), 6.IC.3.1

56
“Identify guidelines for safely using the internet” (SCDE, 2017, p. 37), and 6.IC.4.1
“Evaluate how legal and ethical issues shape computing practices” (SCDE, 2017, p.37).
Rationale of the Innovation
Core-content teachers are required by state and national teaching standards to teach
digital literacy infused into their content, but they rarely do. Librarians are required by
their state and national standards to collaborate and co-teach with core-content teachers,
but again, they rarely are afforded this opportunity. The innovation for this study was to
allow a core-content teacher and a librarian to fully collaborate on a social studies unit of
study that infused digital literacy, for which the librarian was an expert, into the academic
content, for which the content teacher was an expert, so that students were taught vital
digital literacy skills within a real-world context, all in hopes of showing how this
innovation could enhance student engagement and therefore increase students’ academic
success. If the data collected from this study illustrated enhanced student engagement and
higher project assessment scores, the researcher hoped that those successes would
encourage teachers at the school to be more open to teacher-librarian partnerships.
Further, the researcher hoped that enhanced student success would induce the school
administration to allow more collaboration amongst the librarian and teachers by
allowing time set aside for shared planning which was not accounted for at the time of the
study.
Studies have shown that students who experience greater classroom engagement in
subject matter not only do better in the class in which they are engaged, but also better
academically overall and that this overall academic success influences their chances of
doing better in life as adults (Fredericks et al., 2004; Greene, 2015; Sesmiyanti, 2016;

57
Wallace-Spurgin, 2020). In addition, studies have shown that when teachers and
librarians collaborate and co-teach lessons, students experience greater classroom
engagement (Maharaj, 2015; McPherson & Dubé, 2016). Further, national and state
standards require core-content teachers to provide digital literacy instruction infused
within their content, yet research has shown that teachers do not because they often do
not know that this is a requirement, they do not know how, or they do not have time to
plan these types of lessons (Crary, 2019; Elstad & Christophersen, 2017; King, 2019;
Marksbury, 2017; Witte, 2015). This results in students not receiving satisfactory digital
literacy instruction (Crary, 2019; Dooley, 2016; Falloon, 2020; Shaw, 2017). Librarians
are trained and therefore capable and qualified to teach digital literacy (ALA, 2017, 2019;
Condic, 2016; Cooper, 2015; Johnston, 2015; Luetkemeyer, 2017; Potnis & Allard, 2018;
Wine, 2016). However, during regular and common library operations, librarians do not
have the opportunity to adequately teach digital literacy (Phillips & Lee, 2019; Puccia,
2017; Sondergeld & Johnson, 2019).
In summation and keeping in mind the above-mentioned benefits that occur when
librarians and teachers collaborate, this research study’s innovation addressed both
increased classroom engagement as well as digital literacy instruction infused into
content. In essence, the teacher was able to meet state standards requiring that digital
literacy be infused into the content, and the librarian was able to meet state standards by
collaborating with the teacher. The teacher provided subject matter expertise while the
librarian provided digital literacy expertise, and in doing so, students benefited by being
more engaged and having digital literacy instruction.

58
Regular Social Studies Instruction Without the Innovation
At the time of this study, in South Carolina, social studies was taught by the
teacher first introducing the unit, describing the timeline, and then using mostly
standards-based online links provided by the South Carolina Department of Education as
well as teacher-selected print resources such as the social studies textbook to teach
students about the events, places, and people involved in an era of historical significance.
For South Carolina sixth-grade students, social studies instruction focused on world
cultures and events, as opposed to American or South Carolina history, which were fifth-
grade social studies topics in South Carolina. Within the sixth-grade typical social
studies unit, the teacher covered the topics for the unit divided up in logical chunks for
each day’s instruction on that topic. For example, days one and two would include the
introduction and overview of the era. Then, days three and four would be an overview of
the major events and locations where the events occurred. This would be followed by
days five and six where an overview of the people involved in the changes that occurred
for the era would be provided. Days seven through days ten or twelve would be spent
discussing individual events, people, places, and innovations that occurred during the era
and how those impacted the world at that time, as well as the overreacting impact on
future cultures and societies. This information was mostly delivered through direct
instruction with textbook references and activities such as map-building activities and
worksheets.
The summative assessment for the social studies unit was usually a handmade
project such as a poster or diorama, or a Google Slides presentation. The rubric for
grading these projects included sections on social studies content, appearance and

59
mechanics, and reference and citation skills involving digital literacy (see Appendix B).
There was no written or online test required for proof of mastery as the school had moved
away from traditional summative tests for social studies and had begun to focus on
authentic assessment practices such as project-based assessments.
Regular Digital Literacy Instruction Without the Innovation
For the researcher/librarian at the school where this study was performed, the
typical digital literacy instruction involved showing students the SC Discus website and
then talking to them about the need to cite sources for both images and information to
avoid plagiarism. This instruction occurred in the library during the library orientation
class period when teachers brought their students for the first time at the beginning of the
school year to check out books. This digital literacy instruction was brief and incomplete
because the librarian only had about fifteen minutes to teach students what should be
covered over an extended amount of time and within the context of a research project so
that students could apply what they had learned to a real and relevant exercise.
Co-Teaching Instruction
Core-Content Teacher Instruction with the Innovation
For the innovation unit the teacher used her typical teaching structure for social
studies instruction where the topics for the unit were divided into segments for each day’s
lessons. Before the innovation unit, during the pre-innovation stage, the collaborating
teacher provided all the relevant content information for the researcher to incorporate into
a more detailed, moment-by-moment and day-by-day lesson plan for the entire unit. The
below description of the unit’s daily activities is given with example topics to help clarify
what the final unit looked like.

60
Using Connecting Hemispheres and Intellectual Revolutions and Political
Philosophies as the overreaching topics for the unit, days one and two included the
introduction and overview of the topics. The social studies teacher first explained that
the time period that was to be studied ranged from the fall of the Roman Empire in the 5th
Century to the late Renaissance, and that during this time period the world changed
dramatically. A broad overview of the countries involved, and the beginning philosophies
were mentioned which would include descriptions of Christianity, early Catholicism, and
early scientific discoveries. Days three and four included an overview of the major events
such as the Scientific Revolution and Enlightenment and how expanding global
interactions in commerce and innovations might have caused changes in philosophies.
Days five and six was an overview of the governmental systems involved in the changes
that occurred for the era including absolute and constitutional governments. Days seven
through days twelve were spent discussing individual events, people, places, and
innovations that occurred during the eras and how these impacted the world at that time
as well as the overreacting impact on future cultures and societies. Examples of focused
topics for these days included discussions and research about France’s Louis XIV,
Russia’s Peter the Great, the Ottoman Empire’s Suleiman the Great, and Japan’s Ieyasu-
Tokugawa Shogunate, Lutheranism, Calvinism, the Anabaptists, and later Catholicism.
For these topics that made up the unit as a whole, the social studies teacher used
direct instruction along with her standards-based online links provided by the South
Carolina Department of Education and her selected print resources (i.e., the social studies
textbook, library books, and printed images such as maps and posters) to teach students
about the historically significant events, places, and people of the eras. The researcher,

61
for the social studies instruction, added additional videos, academic history websites,
Google Earth interactive sites, Google Arts and Culture, Ebsco’s History Reference
Center database, SC Discus union database sources, museum databases such as the
Vatican Library, Image, and Museum Database, and interactive games about eras and
people.
Digital Literacy Instruction with the Innovation
Besides adding the additional online social studies content materials mentioned
above, the researcher taught the students how to search for relevant information on the
content subject matter, how to avoid misinformation, how to use web addresses and
information on websites to judge the validity of the information, and how to locate more
in-depth information using union databases such as SC Discus. In addition, the
researcher taught students how to visit museums and international websites that are
interactive and/or in foreign languages. For non-English websites, the researcher taught
students how to translate these sites for readability.
The digital literacy instruction was interwoven within the content instruction. On
days one and two of the innovation unit the researcher provided instruction on how to use
SC Discus to find history databases that offer scholarly articles and images of original
texts associated with the unit such as images of print created by the Gutenberg printing
press. The researcher also taught students how to use limiters within the databases search
options to select Lexile Measures that were on the reading level of typical 6th grade
students. Further, videos from National Geographic and the History Channel were
provided to the students with a brief and preliminary mention of the necessity of citing
references.

62
Days three and four included how to use Google tools to discover deeper, more in-
depth information about places, people, and cultural artifacts (Google Earth and Google
Arts and Culture). Instruments developed during the scientific revolution as well as
images of the sacraments used during religious rites before and after the Protestant
Reformation were used as examples for students to learn how to effectively use Google
tools to conduct research.
On days five and six the researcher covered how to find relevant and reliable
sources from general Google searches using Wikipedia and website URLs that link to
original sources. This also included looking at individual websites and finding
information about when the site was updated, who the author(s) was (were), looking for
propaganda and bias, and checking to see if the source was reliable based on occurrences
such as misspelled words or contradictory information after checking other reliable sites.
On days seven through ten the researcher taught students how to do further, in-
depth, and focused research about topics within the unit’s scope and how to cite sources
needed for research projects. This included students searching for biographies about
Louis XIV, Peter the Great, Suleiman the Great, Ieyasu-Tokugawa Shogunate, or Martin
Luther, and then practicing creating citations for the bibliographic sources that they
discovered.
Following the completed social studies content delivery by the teacher on day 10,
the researcher and the teacher explained to the students that the unit summative
assessment project, which was like the previous unit’s summative project in that the
students would create a project on some topic associated with the era. However, instead
of this project being presented as a physical poster, diorama, or Google Slides

63
presentation, the project was to use the digital presentation platform of Prezi. The
requirements for success were the same as the previous unit with the standard social
studies project grading rubric being used as a guideline for grading.
On days 11 through the end of the unit, day 31, the researcher taught students
where to search to find the best information and how to gather information and images
about their chosen project topic in an ethical manner i.e., observing copyright laws and
citing sources. The researcher also provided students with instruction on how to use
Prezi, and how to share their final projects with their classmates, their teachers, and the
academic community in a safe manner. Finally, the researcher taught students how to
cite their sources in an organized manner using MLA guidelines. Students then created
their projects with the help of the teacher and the researcher. The unit was originally
supposed to be three weeks, but due to COVID-19 disruptions, it lasted a month.
The overall design of the innovation unit was to allow both the core content
teacher and the librarian to thoroughly address both sets of teaching standards fused
together in a coherent collection of learning activities that would keep students engaged
and learning. Table 3.2 outlines the daily activities for the innovation unit aligned with
the South Carolina Social Studies College and Career Ready Standards (SCDE, 2019)
and the South Carolina Computer Science and Digital Literacy Standards (SCDE, 2017).
Table 3.2
Innovation Unit Teaching Activities with Standards Alignment
Daily Activities
Core Content Teacher
Librarian
Days 1 and 2
Introduction and overview of the
era using direct instruction, text
book, print and online resources.
Introduction to scholarly
databases, how to use SC
Discus, and brief overview
of documenting and citing

64
South Carolina Modern World
History Social Studies
Standards:
MWH 6.2.CO
MWH 6.2.CE
MWH 6.3.CO
MWH 6.3.CE
MWH 6.3.CC
MWH 6.4.CO
sources using direct
instruction, guided practice
and independent practice.
South Carolina Computer
Science and Digital Literacy
Standards:
6.DL.2.1
6.DL.2.3
6.CS.1.2
6.IC.4
Days 3 and 4
Discussion and descriptive
overview of the individual major
events and specific locations
where these events occurred
using direct instruction, text
book, print and online resources.
South Carolina Modern World
History Social Studies Standards:
MWH 6.2.CO
MWH 6.2.CE
MWH 6.3.CO
MWH 6.3.CE
MWH 6.3.CC
MWH 6.4.CO
Demonstration using
Google Earth and Google
Arts and Culture to
discover deeper, more in-
depth information about
places, people, and cultural
artifacts using direct
instruction, guided practice
and independent practice.
South Carolina Computer
Science and Digital
Literacy Standards:
6.DL.2.1
6.DL.2.3
6.CS.1.2
6.CS.1.2
Days 5 and 6
Discussion and descriptive
overview of the people and
philosophies that existed and
then arose during the era the
using direct instruction, text
book, print and online resources.
South Carolina Modern World
History Social Studies Standards:
MWH 6.2.CO
MWH 6.2.CE
MWH 6.3.CO
MWH 6.3.CE
MWH 6.3.CC
MWH 6.4.CO
Demonstrations on finding
general research sources
based on currency,
relevance, authority,
accuracy, and purpose
using direct instruction,
guided practice and
independent practice.
South Carolina Computer
Science and Digital
Literacy Standards:
6.NI.1.2
6.NI.1.3
Days 7 and 8
Discussion and descriptions of
individual events, people,
places, and innovations that
Demonstrations on how to
do specific research using
limiters and Boolean

65
occurred during the era and how
these impacted the world at that
time as well as the overreacting
impact on future cultures and
societies using direct instruction,
text book, print and online
resources.
South Carolina Modern World
History Social Studies
Standards:
MWH 6.2.CO
MWH 6.2.CE
MWH 6.3.CO
MWH 6.3.CE
MWH 6.3.CC
MWH 6.4.CO
operators and how to set up
reference lists and format
citations in text using direct
instruction, guided practice
and independent practice.
South Carolina Computer
Science and Digital
Literacy Standards:
6.CS.1.2
6.AP.5.1
6.AP.5.2
Days 9 and 10
Continued discussion and
descriptions of individual events,
people, places, and innovations
that occurred during the era and
how these impacted the world at
that time as well as the
overreacting impact on future
cultures and societies using direct
instruction, text book, print and
online resources.
South Carolina Modern World
History Social Studies Standards:
MWH 6.2.CO
MWH 6.2.CE
MWH 6.3.CO
MWH 6.3.CE
MWH 6.3.CC
MWH 6.4.CO
Continued instruction on
how to do specific research
using limiters and Boolean
operators and how to set up
reference lists and format
citations in text using direct
instruction, guided practice
and independent practice.
South Carolina Computer
Science and Digital
Literacy Standards:
6.CS.1.2
6.AP.5.1
6.AP.5.2
Days 11through 30
Continued discussion and
descriptions of individual events,
people, places, and innovations
that occurred during the era and
how these impacted the world at
that time as well as the
overreacting impact on future
cultures and societies using direct
instruction, text book, print and
online resources.
Guided practice using
research sources, direct
instruction concerning
ethical use of materials,
observing copyright laws,
and avoiding plagiarism.
Direct instruction, guided
practice, and independent
practice using online
presentation tools. Direct

66
South Carolina Modern World
History Social Studies Standards:
MWH 6.2.CO
MWH 6.2.CE
MWH 6.3.CO
MWH 6.3.CE
MWH 6.3.CC
MWH 6.4.CO
instruction and independent
practice on how to safely
share digital artifacts.
South Carolina Computer
Science and Digital
Literacy Standards:
6.DL.1.1
6.DL.1.2
6.DL.2.1
6.DL.3.1
6.NI.2.1
6.NI.2.2
6.DA.3
6.IC.3.1
6.IC.4.1
Data Collection
Four sources of data were used to answer the research questions for this study.
Each data source was chosen to evaluate an aspect of the effects of teacher-librarian
collaboration when teaching content standards infused with digital literacy. The four data
sources included (1) a school developed social studies unit project assessment rubric (see
Appendix B) used to assess student projects at the end of the non-innovation unit just
prior to the innovation unit, and then again at the end of the innovation unit, (2) an online
classroom engagement inventory (see Appendix C) administered to the participating
students right before the end of the non-innovation unit just prior to the start of the
innovation unit, and then again at the end of the innovation unit, (3) an online digital
literacy assessment (see Appendix D) given to the students at the end of the non-
innovation unit just prior to the innovation unit, and then again at the end of the
innovation unit, and (4) semi-structured interviews (see Appendix E) conducted with a
sample of students at the end of the innovation unit.

67
Table 3.3 lists the data sources that were used to collect and analyze information to
answer each research question for this study. The first research question involved
students’ project assessment scores which were quantitative in nature and were analyzed
using descriptive statistical analysis to compare pre- and post-innovation scores.
Qualitative data was used to supplement the quantitative data for this research question
and came from interview data described more in-depth below.
The second research question involved students’ classroom engagement and
contained both qualitative and quantitative elements with two separate instruments
contributing to data sources. The first was the classroom engagement survey given to
students during the unit prior to the innovation unit and then again at the end of the
innovation unit which provided quantitative data and used a Likert scale response format.
The second data source used to answer Research Question 2 was qualitative in nature and
was a semi-structured interview protocol involving questions about classroom
engagement given to purposefully selected top, middle, and bottom scoring students in
each of the two classes as determined by combining the student participants scores from
their classroom engagement survey, their online digital literacy assessments, and their
summative project scores at the end of the innovation unit collaborative teaching cycle.
The third research question involved students’ potential gains from digital literacy
instruction. The data sources to answer this research question also contained both
qualitative and quantitative components. The quantitative data came from the Online
Digital Literacy Assessment adapted from the TRAILS Digital Literacy Assessment
instrument created by Kent State University Libraries (TRAILS, 2019). The instrument
asks students to choose the best of four answers to specific questions related to digital

68
literacy knowledge and best practices. The scores from the tests were given in
percentages of correct answers. The test was given before and after the innovation unit.
The semi-structured post-innovation interviews described above provided qualitative data
concerning students’ perceptions of how digital literacy instruction infused within the
social studies content influenced their scores on the digital literacy assessment and was
used to compliment the qualitative data.
Table 3.3
Research Question and Data Sources Alignment
Research Questions
Data Sources
RQ1: How does co-teaching instruction
that integrates digital literacy and social
studies content influence sixth-grade
students’ performance on social studies
unit projects?
School District Developed Pre- and Post-
Innovation Summative Social Studies
Unit Project Rubric Scores
Semi Structured Post-Innovation
Interviews
RQ2: What are the effects of co-teaching
instruction that integrates digital literacy
and social studies content on student
engagement in the social studies content?
Classroom Engagement Pre- and
Innovation Unit Survey Data
Semi Structured Post-Innovation
Interviews
RQ3: What are the effects of co-teaching
instruction that integrates digital literacy
and social studies content on six-grade
students’ level of digital literacy?
Pre- and Post-Innovation Online Digital
Literacy Assessment Scores
Semi Structured Post-Innovation
Interviews
Classroom Engagement Inventory Data
The Classroom Engagement Inventory is an online questionnaire administered to
students during the latter portion of the pre-innovation social studies unit and then again
during the later portion of the innovation unit. (See Appendix C). The Classroom
Engagement Inventory used for this study was adapted from the Classroom Engagement
Instrument (CEI) created and validated by Wang et al. (2014) to investigate students’

69
emotional, behavioral, and cognitive engagement in a classroom setting. Wang et al.
(2014) created their survey so as to accommodate the subject being taught and the age of
the students. Their CEI has been validated and used in numerous studies related to
student engagement (Cummings, 2020; Manzano-León et al., 2021). According to Wang,
Bergin, and Bergin (2014) the “internal consistency, calculated as Mc-Donald’s omega,
of each of the five engagement factors ranged from .82 to.90” (2014, p. 532). Further, the
CEI developed by Wang, Bergin, and Bergin has been validated and used in additional
studies related to student engagement (Cummings, 2020; Manzano-León et al., 2021),
with Manzano-León et al. (2021) specifically reporting that “the Cronbach alpha values
were higher than 0.70 in the subscales” (p. 1011). Permission to adapt and use this
instrument was granted by Dr. Wang through email on 4 October 2021. (See Appendix
F.)
Using the adapted survey, this study’s data source assessed if students who are
taught content along with digital literacy skills felt more engaged with the content.
Within the survey, students rated their level of agreement with 23 statements. Examples
of these statements are (1) when I work on this social studies unit, I feel excited, (2) when
I am working on this social studies unit, I feel curious about this civilization and I want to
learn more, (3) during this social studies unit I have gotten really involved in classroom
activities. The levels of agreement were 1 meaning “never,” 2 meaning “rarely,” 3
meaning “sometimes,” 4 meaning “most of the time,” and 5 meaning “always.”
Online Digital Literacy Assessment
The Online Digital Literacy Assessment (ODLA) used for this study was adapted
from the Tool for Real-Time Assessment of Information Literacy Skills (TRAILS) which

70
is an assessment instrument that was developed by Kent State University Libraries and
has been used by libraries and librarians all over the world since 2006 to assess students’
information and digital literacy skills (Kent State University Libraries, 2019). The
TRAILS assessment is a work licensed under a Creative Commons Attribution and is free
to use non commercially without permission. The full version of the TRAILS Digital
Literacy Assessment can be found online at https://trails-archive.org/assessment-
downloads/. The assessment has several versions, one of which is specifically for 6th
grade students.
The 6th grade assessment is made up of two general assessments with 20 items
each and five category assessments with ten items each. The category assessments
concern 1) developing topics for research, 2) identifying potential sources for research, 3)
developing, using, and revising search strategies during academic and personal research,
4) evaluate sources and information during academic and personal research, and 5) using
information responsibly, ethically, and legally (Kent State Libraries, 2019). The
researcher adapted the 6th grade TRAILS assessment and administered this adapted
version, the ODLA, to the student participants in this study before and then after the
innovation unit. This assessment was aligned to the following South Carolina Computer
Science and Digital Literacy Process Standard:
4. Create, test, and refine computational artifacts.
a. Consider the purpose of computational artifacts for practical use, personal
expression, and/or societal impact.
e. Consider performance, reliability, usability, and accessibility when evaluating
and refining computational artifacts. (SCDE, 2017, p. 35)

71
The ODLA was also aligned to the International Society for Technology in Education
standards (ISTE, 2018). Appendix G provides an alignment table listing each question
and the SC standard and/or the ISTE standard to which it was aligned. Furthermore,
Salem (2014) investigated the validity and reliability of the TRAILS for grades 3, 6, 9,
and 12 found that the test was valid and did reliably measure students’ information
literacy skills. Salem’s study (2014) reported that the 6th grade TRAILS, with α = 0.78,
which was used for this study “approached the 0.80 threshold for coefficient alpha
recommended for large-scale tests in the social sciences” (p. 128).
School District Developed Summative Social Studies Unit Project Grading Rubric
For both the pre-innovation unit and the innovation unit, students chose and then
created a project concerning some aspect of the unit’s historical era. The school district’s
social studies unit project rubric was designed to be generic enough to be used in all
sixth-grade social studies summative unit projects so regardless of the unit’s topic, the
assessments gage students’ social studies learning. In essence, the rubric addressed the
who, what, why, when, where, of a social studies event or development, and how that
event or development changed the world and the society in which the event or
development occurred. To provide an example of this, students could create a unit project
on the Protestant Reformation, or the Black Death and the rubric would apply to both.
One example from the rubrics’ full credit What Happened criterion is as follows:
“Development or critical incident is clearly described in-depth with correct information
about what happened and with an appropriate image(s). At least 5+ sentences are used.”
Using a student project on the Black Death to illustrate, the student would need to use at
least five sentences to accurately describe what the Black Death was with at least one

72
image that related to the disease. The description and image(s) would need to come from
some documented source.
For the unit just prior to the innovation unit, students created a summative unit
project as they normally would by making a physical poster using printed or drawn
images and hand or machine printed text on poster board or by making a diorama using
found materials and hand or machine printed text. The innovation unit’s summative
project differed from the pre-innovation unit’s summative project in that instead of
creating a physical poster or diorama, students were required to create an online
presentation about a topic using the platform Prezi.
The rubric used to assess both the pre-innovation and post-innovation unit projects
was the same. The innovation unit’s summative project differed from the pre-innovation
unit’s summative project in that instead of creating a physical poster or diorama, students
will create an online presentation about a topic using either Canva or Prezi. The
information and images used in these projects came from various specified online sources
which included using at least one online book, one reliable website (based on criteria
discussed during instruction), one credible online magazine (based on criteria discussed
during instruction), and one article found using a scholarly database (SC Discus).
Students were required to cite their sources and paraphrase the majority of the
information that they used within their projects and presentations. The curriculum coach
for the district, along with the 6th grade social studies teachers, and the librarian created
and then reviewed the rubric to confirm its content validity before the pre-innovation
unit.

73
Semi-Structured Interviews
Semi-structured post-innovation interviews (see Appendix E for the protocol) were
performed during the school days following the innovation unit when all participating
student scores on the classroom engagement survey, the post-innovation rubric, and the
digital literacy assessment had been recorded. Approximately 20% of the student
participants were invited to participate in the individual semi-structured interviews. A
“maximum variation” (Tracy, 2020, p.83) sampling strategy for purposive sampling was
employed to understand the participants’ experience with the co-teaching between their
social studies teacher and the librarian, and the infusion of digital literacy skills into
social studies content. Accordingly, the researcher selected the top, middle, and low
scoring students who represented the gender and racial demographics of the classes from
Groups A and B to engage in one-to-one interviews using the live online Google Meet
platform.
The top, middle and low scoring students were selected by combining each
participating student’s pre-innovation and post-innovation project rubric scores, pre- and
post- innovation online digital literacy assessment scores, and students pre- and
innovation unit classroom engagement survey scores, and then selecting the students with
the greatest gains, the least gains, and students whose gains were in the middle range
from each class group. An example of how these scores were combined is as follows:
Student Pablo scored a 46 on the pre-innovation ODLA and a 48 on the post-
innovation ODLA, this produced gains of 2 points. The same student scored a 15
on the pre-innovation unit project rubric and then a 100 on the innovation project.
This produced gains of 75 points. Finally, this student Pablo scored 68 on the pre-

74
innovation unit CEI and a 115 on the innovation unit CEI which produced gains of
47 points. The gains were then added together, 2, 75, and 47 to produce the sum of
124, which was then used to compare to other student participants within the class
group.
Student Pablo was a top scoring student for his glass group. The researcher followed the
above process for each student to determine the high, middle, and low scoring students
from each class, i.e., Group A and Group B.
A semi-structured interview protocol was developed following the guidance of
Creswell and Creswell (2018), Jacob and Furgerson (2012) and Mertler (2020) for the
structure and Seamon (2017) for loose guidance on the content. Semi-structured
interview protocols are used as “guides” (Mertler, 2020, p.134) for the interviewer to ask
predetermined questions and then follow up with undetermined and additional questions
depending on the subject’s response (Creswell & Creswell, 2018; Mertler, 2020). For
this study, the interview questions were developed to determine how students feel about
the coteaching set-up as a whole, whether the coteaching set-up helped them feel more
engaged in the content, and whether the infusion of digital literacy content into social
studies content helped the student feel more or less engaged and more competent with
digital literacy skills.
Table 3.4 illustrates how each of the questions from the interview protocol aligned
to the research questions. The protocol was examined by the participating social studies
teacher, the school’s curriculum coach, and educational researcher on digital literacy to
determine the appropriateness of the questions in relation to the study and the
appropriateness of the questions and wording regarding the age and abilities of the

75
students. Again, in accordance with the definition of a semi-structured interview, for this
study, if the students’ answers lead to more questions, then the researcher asked related
follow-up questions that were not in the script or documented below in Table 3.4
(Creswell & Creswell, 2018; Mertler, 2020). Each interview was designed to last 30 to
45 minutes and was recorded using the recording feature provided by the Google Meet
application.
Table 3.4
Interview Questions to Research Questions Alignment Table
Purpose or Research Question Alignment
Interview Question
Question included as an icebreaker
(Tracy, 2020).
1) Please tell me how you feel about
social studies as a subject. Please tell me
how you feel about using technology in
the classroom.
RQ1: How does co-teaching instruction
that integrates digital literacy and social
studies content influence sixth-grade
students’ performance on social studies
unit projects?
11) How do you think mixing digital
literacy with social studies might help you
on future social studies projects and in
other classes?
12) Did you experience any challenges
especially on your project, during the time
Mrs. Steinbeck and I were teaching
together? If yes, why? If not, why?
RQ2: What are the effects of co-teaching
instruction that integrates digital literacy
and social studies content on student
engagement in the social studies content?
3) How would you describe your overall
experience of being a student in our social
studies class when Mrs. Steinbeck and I
have been working together? (Prompts:
Have you been more or less interested in
learning? Have you been bored? Have you
happy to be in class?)
4) Please tell me about your attention in our
social studies class over the time Mrs.
Steinbeck and I have been teaching
together. Have you been more or less
focused on our lessons? Why do you think
that is?
Did you pay attention more so you can
answer questions and why do you think
that is?

76
Did you volunteer to answer questions or
make comments more often? Why do you
think that is?
5)Was there a time when you lost interest
and stopped listening or being engaged
while Mrs. Steinbeck and I were working
with your class on our social studies unit?
Is this something that has happened before,
or did it just happen during this unit?
6) Please tell me about the things you do
to help you understand the information.
When you do not understand something,
what do you do? Do you need to ask the
teacher to explain things and to give extra
help to you or other students having
difficulty?
7) Tell me about how you connect what
you learn to anything else.
What strategies do you use to remember
what you learn?
Do you try to compare what you learned to
things you have learned before?
Do you reword information?
Do you try to decide what is important to
study?
Has this changed or was it any different
when Mrs. Steinbeck and I were working
together compared to other social studies
units?
8) How do you feel about the coteaching
set-up?
RQ3: What are the effects of co-teaching
instruction that integrates digital literacy
and social studies content on six-grade
students’ level of digital literacy?
3) Over the last couple of weeks when Mrs.
Steinbeck and I have been working
together, do you feel any different about
how you use technology to find out
information? Why or why not?
9) Did you enjoy learning about digital
literacy along with social studies? Why or
why not?
10) Do you feel more confident about using
digital literacy tools now than you did
before? Why or why not?
11) How do you think mixing digital
literacy with social studies might help you
on future social studies projects and in

77
other classes? (This question also linked to
RQ1)
Closing “catch-all question” (Tracy, 2020,
p. 169).
13) Do you have any questions or
comments you would like to ask or tell me?
Data Analysis
Four sources of data were used to answer the research questions for this study. All
three research questions had qualitative and quantitative components. The quantitative
components involved a grading rubric with numerical scores (RQ1), a questionnaire with
a Likert scale response request (RQ2), and a select response assessment (RQ3) that were
all analyzed using descriptive and inferential statistics to find the measures of central
tendency and dispersion (Adams & Lawrence, 2019; Mertler, 2020). The quantitative
data were “used as a complement” (Maxwell, 2010, p. 480) to qualitative data gathered
from the open-ended question responses that were analyzed using inductive analysis to
develop themes (Creswell & Creswell, 2018; Mertler, 2020; Tracy, 2020). Table 3.5 lists
the data sources and the data analysis procedures that were used to collect and analyze
information to answer each research question for this study.
Table 3.5
Research Question, Data Sources, and Data Analysis Procedures Alignment
Research Questions
Data Sources
Data Analysis
Procedures
RQ1: How does co-teaching
instruction that integrates digital
literacy and social studies content
influence sixth-grade students’
performance on social studies unit
projects?
Social Studies Project
Assessment Rubric
Semi-Structured
Interviews
Descriptive Statistics
Wilcoxon Signed Rank
Test
Inductive Analysis

78
RQ2: What are the effects of co-
teaching instruction that integrates
digital literacy and social studies
content on student engagement in
the social studies content?
Classroom
Engagement
Inventory Data
Semi-Structured
Interviews
Descriptive Statistics
Wilcoxon Signed Rank
Test
Inductive Analysis
RQ3: What are the effects of co-
teaching instruction that integrates
digital literacy and social studies
content on six-grade students’ level
of digital literacy?
Online Digital
Literacy Assessment
Semi-Structured
Interviews
Descriptive Statistics
Wilcoxon Signed Rank
Test
Inductive Analysis
Quantitative Data Analysis
Social Studies Project Assessment Rubric Scores
Quantitative data for Research Question 1 was gathered using the Social Studies
Unit Project Assessment Rubric scores from their pre- and post-innovation projects. The
collaborating teacher and the researcher both graded the pre-innovation projects. At the
end of the innovation unit, the researcher and collaborating teacher graded five of the
innovation projects together using the grading rubric, and then upon mutual agreement on
the scores, the researcher graded the remaining projects. Descriptive statistics were used
to show the measures of central tendency of students’ scores on the pre-innovation and
post-innovation unit project assessment rubrics (Adams & Lawrence, 2019). Then a
Wilcoxon Signed Rank test was performed to determine if there was a difference in the
student performance between the units (Adams & Lawrence, 2019).
Classroom Engagement Inventory
Cronbach's alpha coefficient was used to assure the internal consistency of
students’ scores on the classroom engagement (Adams & Lawrence, 2019). A Shapiro
Wilk Test was performed on the data to test for normality (Taeger & Kuhnt, 2014).
Because most of the subscales were not normal distribution (p <.05), a Wilcoxon Signed

79
Rank test (non-parametric analysis) was run to determine if there was a difference in the
classroom engagement between the units (Adams & Lawrence, 2019; Taeger & Kuhnt,
2014).
Online Digital Literacy Assessment
Students’ scores for both pre-innovation and post-innovation Online Digital
Literacy Assessment (ODLA) scores were collected and compared to determine the
influence that instruction had on students’ digital literacy skills. Particularly, the Kuder
and Richardson Formula 20 (KR20) test was used to calculate the internal consistency of
students’ scores on the pre-innovation and post-innovation ODLA assessment
(Wombacher, 2017). A Shapiro Wilk Test was performed on the data to test for
normality (Taeger & Kuhnt, 2014). Then, a Wilcoxon Signed Rank test was performed to
discover if students’ post-innovation digital literacy skills revealed a statistically
significant difference from their pre-innovation digital literacy skills (Adams &
Lawrence, 2019; Taeger & Kuhnt, 2014).
Qualitative Data Analysis
Qualitative data was collected using the semi-structured post-innovation interviews
whereby the researcher interviewed a representative, purposefully selected sample of the
top, middle, and low scoring students, once all their scores were combined from both
homeroom groups of students. The researcher recorded the interviews using a captioning
application and then transcribed the recorded interview responses using the captioning
transcripts as a guide. Then the researcher developed a “coding scheme…to group data
that provide similar types of information” (Mertler, 2020, p. 174). The codes were then
incorporated into categories of responses (Creswell & Creswell, 2018; Mertler, 2020;

80
Tracy, 2020), which the researcher then began to “describe” (Mertler, 2020, p.175) based
of specific emergent connections between the data and the research questions (Creswell
& Creswell, 2018; Mertler, 2020; Tracy, 2020). These descriptions then led to the
“interpretation” stage of inductive analysis where the researcher “examines events,
behaviors, or others’ observations- as represented in coded categories- for relationships”
(Mertler, 2020, p.175) that answer the research questions. The researcher generated a full
descriptive narrative based on the students’ responses in order to present the qualitative
findings for the research questions.
Procedures and Timeline
This study was conducted in four stages: (1) foundational activities, which
included obtaining consent, final teacher-researcher planning, and preliminary data
collection, (2) innovation, (3) post-innovation data collection, and (4) data analysis. The
section below provides Table 3.6 which was designed to illustrate each stage and its
corresponding time frame, as well as a description of the activities that occurred in
chronological order.
Table 3.6
Research Stages and Timeline
Stage
Action
Timeline
Researcher
Participants
Stage 1:
Foundationa
l Activities
● Obtained IRB
approval
(Appendix A).
● Made final lesson
plans with
collaborative
teaching partner.
● Obtained Informed
Consent and
● Student participants
returned informed
consent forms.
● Student participants
took the pre-
innovation
classroom
engagement
inventory.
3 January – 9
February 2022

81
finalized
participant list.
● Administered the
pre-innovation
Classroom
Engagement
Inventory and
scored student non-
innovation unit
projects along with
collaborative
teaching partner.
● Administered the
pre-innovation
Online Digital
Literacy
Assessment.
● Student participants
took the pre-
innovation online
digital literacy
assessment.
Stage 2:
Innovation
● Taught the
innovation unit
alongside the
collaborating
teacher.
● Student participants
engaged with the
innovation
procedures.
● Students created
unit summative
projects.
10 February –
17 March
2022
Stage 3:
Data
Collection
● Administered the
post-innovation
Classroom
Engagement
Inventory and
scored student
innovation unit
projects along with
collaborative
teaching partner.
● Administered the
post-innovation
Online Digital
Literacy
Assessment.
● Conducted semi-
structured
interviews with
eight students.
● Student participants
took the post-
innovation
Classroom
Engagement
Inventory.
● Student participants
took the post-
innovation Online
Digital Literacy
Assessment.
18 March –
24 March
2022

82
Stage 4:
Data
Analysis
● Transcribed, coded,
and interpreted
interview
responses.
● Used statical
analysis to examine
pre- and post-
innovation data
from project
grading rubrics,
Classroom
Engagement
Inventories and
Online Digital
Literacy
Assessment.
September
2022 –
January 2023
Stage 1
Stage 1 of the research study focused on foundational activities that needed to be
in place before the delivery of the innovation and then the data collection. These
preliminary activities included obtaining participant and parental consent to allow
students to participate in the study, collecting pre-innovation data, and the final planning
and preparation of the day-to-day teaching procedures and duties of both the
collaborating teacher and the researcher. This stage was approximately 4 weeks long.
This stage, as with Stage 2 and Stage 3, was significantly impacted by the extremely high
number of student and teacher absences because of COVID-19 Omicron illnesses and
quarantines. Nevertheless, the researcher provided students and parents with information
about the unit, the research aims, and consent forms, and then gathered student consent
forms to finalize the participant list. Meanwhile, the collaborating core content teacher
and the researcher thoroughly outlined the unit plan instructions. This plan included what
was to be taught and how it was to be delivered with the specific dates and times each

83
teacher would be teaching. Also, during this stage, the researcher administered the pre-
innovation Classroom Engagement Inventory to student participants, jointly scored
student non-innovation unit projects along with the teacher and administered the Online
Digital Literacy Assessment.
Informed Consent
Before the pre-innovation social studies unit, the researcher sent home a parental
consent form (see Appendix H) to the parents of all the students that were in the
collaborating teacher’s two social studies classes. The informed consent form included
an explanation of the potential benefits of the students’ participation in the study which
involved being able to receive digital literacy instruction in the context of a social studies
unit, being able to help the teacher and the librarian strengthen their co-teaching skills,
and being able to help other practitioners improve potential school practices by providing
data that could benefit other teacher-librarian collaborative activities.
Upon receiving the returned parental consent forms, all students whose parents
agreed to allow their children to participate in the study were given a student consent to
participate form to sign (see Appendix I). Those students who had consented to be a part
of the study, and whose parents had also agreed, were noted so that their information and
data was the only data collected.
Final Planning of Unit Instructional Activities
While the non-innovation unit was being taught to the students, and still in Stage 1
of the research study, the researcher and the teacher met several times to finalize the day-
by-day lesson plans for the innovation unit. These meetings allowed the teacher and

84
researcher to specifically outline what content would be addressed, how it would be
taught, when it would be taught, and who would deliver the instruction.
Pre-Innovation Data Collection
Prior to the innovation unit, the students received regular social studies instruction
for a unit of study. At the end of that unit, the researcher needed to gather pre-innovation
data in order to make pre- and post-innovation comparisons on student classroom
engagement (RQ2), summative unit project scores (RQ1), and digital literacy learning
(RQ3). Before the innovation unit the researcher administered the Classroom
Engagement Inventory (see Appendix C) in order to gather pre-innovation classroom
engagement data. Student participants were also given the Online Digital Literacy
Assessment to provide pre-innovation data (see Appendix D). In addition, the researcher
helped to grade the pre-innovation unit projects using the district’s 6th Grade Social
Studies Project Grading Rubric (see Appendix B). This was to ensure consistency in
grading for the unit assessment for the innovation unit.
Following the foundational activities stage for this study, the innovation unit then
took place in which the collaborating teacher and the researcher co-taught social studies
content that was infused with digital literacy instruction.
Stage 2
During Stage 2 of the research study, the collaborative core content teaching
partner and I taught the collaborative social studies unit that infused digital literacy into
social studies content. The student participants learned about the unit’s subject matter and
then created online digital projects about their chosen topics. The collaborating teacher

85
taught social studies content and I taught digital literacy skills within the context of social
studies content.
Stage 3
Stage 3 of the research study is involved in data collection. I provided student
participants with the post-innovation Classroom Engagement Inventory, administered the
post-innovation Online Digital Literacy Assessment, and graded the students’ projects
using the Social Studies Project Assessment Rubric. The first five projects were graded
jointly with the collaborating teacher. During that time, I also determined which students
would be asked to participate in the semi-structured interviews (see Appendix E for
protocol), and then conducted the interviews using recorded Google Meet sessions that
included preliminary transcripts provided through the Google captioning application.
Stage 4
In Stage 4 of the research study, I analyzed the data. First, I listened to the
recorded interviews and cleaned up the transcripts for the semi-structured interview
responses. Then I coded the interviews , created categories from their coded responses,
and discovered emerging themes concerning how students perceived the co-teaching
method and its influence on their engagement and learning. Further, an analysis of the
pre- and post-innovation unit Classroom Engagement Inventory scores was performed
using a Wilcoxon Signed Rank test to determine if there was a difference in the
classroom engagement between the units. This same process was used to analyze the
Online Digital Literacy Assessment scores and the rubric scores.

86
Rigor and Trustworthiness
According to Mertler (2020) “quality research must meet standards of sound
practice” (p. 26). For action research these standards must be applied so that all parts of
the entire process are free from bias and yield results with fidelity (Mertler, 2020).
Further, according to Mertler (2020), rigor “refers to the quality, validity, accuracy and
credibility of action research and its findings” (p.315). To ensure the rigor and the
trustworthiness of the findings, this section reviews the measures that were taken for all
sources of data.
Quantitative Data and Findings
All three research questions had quantitative factors. For RQ1, I relied on the core-
content teacher and the school curriculum coordinator to validate the content and values
assigned to each social studies section and appearance and mechanics section of the
Social Studies Unit Project Assessment Rubric. In the capacity of the librarian and digital
literacy expert, I validated the digital literacy skills sections of the rubric. Both the
teacher and the curriculum coach were trained in assessing students’ social studies
mastery using rubrics. For the digital literacy section, the researcher used the South
Carolina Digital Literacy Standards to determine the requirements needed for mastery
and validated their requirements on the rubric. Both the teacher and the curriculum coach
reviewed the rubric’s entire contents and approved the rubric based on their professional
expertise.
For the quantitative portions of RQ2, i.e., the classroom engagement pre-and post-
innovation survey, and for RQ3, i.e., the pre- and post-innovation Online Digital Literacy

87
Assessment, I adapted two previously validated and well-known instruments used widely
in the field of education.
Evidence of validity is concerned with the fact that the “data that have been
collected accurately measure what they purport to measure” (Mertler, 2020, p. 315). The
validity for the Classroom Engagement Inventory and the Online Digital Literacy
Assessment instruments were confirmed by both peer reviews of the actual responses to
the questions and “statistical estimate[s] of the reliability” (internal consistency) of the
survey and assessment (Mertler, 2020, p. 157). Likewise, the scores from the Social
Studies Project Assessment Rubrics were confirmed by the member checking of the
rubric scores alongside the student project submissions. Employing peer examiners refers
to the process of having other professionals examine a researcher’s data and analysis for
rigor and trustworthiness (Mertler, 2020). For all the quantitative data collected for this
study, extensive peer review occurred.
Qualitative Data and Findings
Qualitative data collected for this mixed method action research study came from
semi-structured interviews. I ensured “the valid use and interpretation” of the data
(Maxwell, 2010, p. 479) through peer examination, triangulation, and rich description
(Tracy, 2020).
Peer Debriefing
I asked fellow doctoral students and my dissertation committee chairman to
provide “peer debriefing” by “reviewing and critiquing the process of data collection,
analysis, and interpretation” (Mertler, 2020, p. 143) which allowed me to reflect and
assess the methods and findings for this study.

88
Triangulation
Triangulation occurs when a researcher uses several different sources to collect
data about a topic to ensure trustworthiness (Mertler, 2020). In mixed methods research,
triangulation can mean combining qualitative and quantitative data (Creswell & Creswell,
2018). For this study, I collected data from several sources (i.e., unit project assessment
rubrics, digital literacy assessments, student interviews, and classroom engagement
surveys) in order to use triangulation.
Rich, Thick Description
Rich, thick description (Creswell, 2013) is a means by which researchers describe
in detail the findings or assertions that they are able to make based on the analysis of their
qualitative data. By combining the findings from students’ semi-structured interviews, the
I developed a thick and fully developed narrative to provide information about the
students’ perceptions of the innovation involved in the study.
Sharing and Communicating Findings
The findings and resulting plan of action were to be shared with participants,
including both the teacher and the students, through a detailed email message. This email
message included a link to a Google Form survey filled out anonymously that asked
participants to provide their thoughts and recommendations concerning the study findings
as well as the research process that was followed. The administrators of the school, the
curriculum coach, the other librarians in the district, the district technology coordinator,
and the district superintendent all had an interest in the findings of this study, and as such
received a printed, detailed report of the findings. The University of South Carolina,
College of Education, received the findings of my study included in my dissertation.

89
In order to protect the identities of the participants, all names, email addresses, and
identifiable test scores (for students) were removed from documents shared with any
school or district stakeholders. Further, the school and school district names and any
other identifying information, along with the identifiable participant information, was
removed from the entire document before being submitted to the dissertation committee.

90
CHAPTER 4
ANALYSIS AND FINDINGS
The purpose of this mixed methods action research study was to investigate the
impact of collaborative teaching involving a school librarian (i.e., the researcher) and a
social studies teacher on sixth-grade students’ summative unit projects, classroom
engagement, and digital literacy skills. The research questions used to guide the
investigation were 1) How does co-teaching instruction that integrates digital literacy and
social studies content influence sixth-grade students’ performance on social studies unit
projects? 2) What are the effects of co-teaching instruction that integrates digital literacy
and social studies content on student engagement in the social studies content?, and 3)
What are the effects of co-teaching instruction that integrates digital literacy and social
studies content on six-grade students’ level of digital literacy?
In order to collect data for this study, I, in the role of the school librarian,
surveyed social studies students on their classroom engagement at the end of a social
studies unit taught solely by the content teacher, administered an online digital literacy
assessment, and helped grade students’ pre-innovation social studies projects with the
social studies teacher. Then, I, adding digital literacy instruction infused into the learning
content, co-taught a social studies unit with the sixth-grade social studies teacher. Near
the end of this innovation unit, I administered the Classroom Engagement Inventory
(CEI) again. Further, at the end of the innovation unit, students retook the online digital
literacy assessment and completed a unit project that was graded using the same rubric as

91
the pre-innovation unit project. Using this quantitative data, that is the data collected
from the pre-innovation and post-innovation CEI, ODLA, and project scores, I used
purposeful sampling to select eight students to conduct follow-up interviews to further
help answer the research questions.
The findings from this study were derived from both the quantitative data
gathered from the pre-innovation and post-innovation CEI instrument, the ODLA
instrument, the project rubric, and data gathered from the interviews. This data was used
to answer the research questions and to demonstrate the potential academic gains students
are capable of when a librarian and an academic teacher collaborate on extended projects.
Chapter Four provides the analysis and findings of this study and is divided into three
sections. The first section involves the presentation and analysis of the quantitative data
that came from the three separate sets of pre-innovation and post-innovation sources,
namely the Classroom Engagement Inventory (CEI), the Online Digital Literacy
Assessment (ODLA), and the social studies project rubric scores. The second section of
this chapter describes the collection and analysis of the qualitative data gathered for this
study which were derived from eight semi-structured interviews. The third and final
section of this chapter is a discussion of the combined quantitative and qualitative
findings of this study.
Quantitative Data Analysis and Findings
This section describes the analysis and findings for the quantitative data collected
for this study. This data was gathered using three separate instruments which include the
1) Classroom Engagement Inventory, 2) the Online Digital Literacy Assessment adapted
from the TRAILS digital literacy assessments (Kent State University, 2019), and 3) the

92
Social Studies Project Rubric. Each of these three instruments were used twice. First
they were used during the pre-innovation unit and then once again at or near the end of
the innovation unit.
Classroom Engagement Inventory (CEI)
Description and Reliability
The Classroom Engagement Inventory (CEI) used for this study was an online
questionnaire adapted from the Classroom Engagement Instrument (CEI) created and
validated by Wang et al. (2014) to investigate student’s emotional, behavioral, and
cognitive engagement in a classroom setting. Dr. Wang’s instrument contained 24
questions that were designed to gage students’ engagement in five separate domains. The
first is Affective Engagement (AE) described as “experiencing enjoyment or interest in
the learning activities” (Wang et al., 2014, p. 531). The second is Behavioral Engagement
Compliance (BEC) described by Wang, Bergin, and Begin (2014) as “tries hard and pays
attention” and is “due to external pressure” (p.531). The third is Behavioral Engagement
Effort (BEE) which is described as “effortful class participation” (Wang et al., 2014, p.
530) where students intentionally share in classroom activities like whole group
discussions and classroom question and answer sessions. The fourth is Cognitive
Engagement (CE) described as “mental effort, such as meaningful processing, strategy
use, concentration, and metacognition” (Wang et al., 2014, p. 518). The fifth domain is
Disengagement (DE) where the student is not affectively, behaviorally, or cognitively
engaged in classroom activities or academic materials (Wang et al., 2014). According to
Wang, Bergin, and Bergin (2014) the “internal consistency, calculated as Mc-Donald’s
omega, of each of the five engagement factors ranged from .82 to.90” (2014, p. 532).

93
Further, the CEI developed by Wang, Bergin, and Bergin has been validated and used in
additional studies related to student engagement (Cummings, 2020; Manzano-León et al.,
2021), with Manzano-León et al. (2021) specifically reporting that “the Cronbach alpha
values were higher than 0.70 in the subscales” (p. 1011).
The CEI used for this study was adapted from Wang, Bergin, and Bergin’s (2014)
in order to account for the subject being taught and the age of the students and assessed if
participating students who are taught social studies along with digital literacy skills felt
more engaged with the content. Using the survey, students rated their level of agreement
on 23 statements. Examples of these statements are (1) when I work on this social studies
unit, I feel excited, (2) when I am working on this social studies unit, I feel curious about
this civilization and I want to learn more, (3) during this social studies unit I have gotten
really involved in classroom activities. The levels of agreement were 1 meaning “never,”
2 meaning “rarely,” 3 meaning “sometimes,” 4 meaning “most of the time,” and 5
meaning “always.” For this research study, one of the questions from the original 24-
item Classroom Engagement Instrument was removed due to concerns over students’
implicating themselves for disobedience. Specifically, Question 2 of the original, “In
THIS social studies class, I pretend like I am working” was removed. This resulted in a
23-question instrument. Furthermore, two of the questions were reverse coded on the
original CEI and were therefore left reverse coded on the CEI used for this study. These
two items were Item 9. In THIS social studies class, I am "zoned out," not really thinking
or doing class work, and item 12 “In THIS social studies class, I let my mind wander to
other things. Table 4.1 details the CEI subscales and questions that relate to each. See

94
Appendix C for the full questionnaire administered to student participants during the pre-
innovation unit and during the innovation unit.
Table 4.1
Subscales for Pre-innovation and post-innovation CEI
Subscale
Items
AE - Affective Engagement
2, 3, 10, 15, 20
BEC - Behavioral Engagement
Compliance
6, 11, 19
BEE - Behavioral Engagement
Effort
1, 4, 5, 14, 18
CE - Cognitive Engagement
7, 8, 13, 16, 17, 21, 22, 23
DE - Disengagement
9,12
The adapted CEI was administered to students using a Google Form that was
linked through the Google Classroom created for this study and shared with the
classroom teacher. Respondents received the pre-innovation survey near the end of the
pre-innovation unit in early February of 2022 and then again near the end of the
innovation unit in mid to late March of 2022. In total, 47 students completed both the
pre-innovation and post-innovation CEI surveys. The Google Forms that were used for
the pre-innovation and post-innovation CEI have the ability of recording the responses in
a Google Sheets document. Once all the responses were recorded in these Google Sheets
documents, I downloaded the data to Excel and converted the responses to numerical
data. The responses for the reverse coded CEI questions 9 and 12 were coded as Always
= 1, Most of the time = 2, Sometimes = 3, Rarely = 4, and Never = 5. For all other
question (1-8, 10-11, 13-23) responses were codes as Always = 5, Most of the time = 4,
Sometimes = 3, Rarely = 2, and Never = 1.

95
After converting all CEI responses to numbers, duplicate responses by students in
each homeroom for both the pre-innovation and post-innovation units were removed. One
student did not take the pretest but did take the posttest. I removed the CEI posttest data
collected on this student. Then, once all conversions were made, I combined all the data
into one document/spreadsheet with students listed aphetically by the teacher. From this
point the data was prepared for quantitative analysis.
The subscales for the CEI were analyzed for internal consistency which is “the
degree to which sets of items on an instrument behave the same way… quantified by
Cronbach’s alpha (α) value that ranges between 0 and 1 with optimal values ranging
between .7 and .9 (Creswell & Creswell, 2018, p. 154). Below, Table 4.2 details the
Cronbach’s α reliability analysis for the CEI data collected for this study.
Table 4.2
Reliability Analysis Cronbach’s alpha for Pre- and Post-Innovation CEI
Subscale
Items
Pre-Innovation α
Post-Innovation α
AE - Affective
Engagement
2,3,10,15, 20
.935
.928
BEC - Behavioral
Engagement
Compliance
6, 11,19
.940
.794
BEE - Behavioral
Engagement Effort
1, 4, 5,14, 18
.893
.597
CE - Cognitive
Engagement
7, 8, 13, 16, 17, 21, 22,
23
.934
.879
DE - Disengagement
9,12
.712
.830
All
All
.963
.903
Overall, the pre-innovation and post-innovation Cronbach’s α was α =.963 and
α = .903 respectively indicating a “high degree of internal consistency” (Creswell &
Creswell, 2018, p. 154). However, it must be pointed out that the reliability analysis for

96
the innovation CEI items relating to students’ effortful classroom participation, subscale
BEE, was α= .597 indicating that these questions had low “intercorrelations among
responses” (Adams & Lawrence, 2019, p. 79).
CEI Findings
Descriptive statistical analysis was used to analyze data collected from the pre-
innovation and post-innovation CEI scores. According to Mertler (2020), “descriptive
statistics allow researchers to summarize, organize, and simplify data” (p. 12). When
descriptive statistical analysis was applied to the data, participants’ Affective
Engagement (AE, “experiencing enjoyment or interest in the learning activities” [Wang
et al, 2014, p. 531]) improved moderately (M = 3.034, SD = 1.343 to M= 4.123, SD =
1.053). Likewise, for the subscale Behavioral Engagement Compliance (BEC, “tries hard
and pays attention” [Wang et al., 2014, p. 531]) an improvement was also indicated
through analysis (M = 3.163, SD = 1.475 to M = 4.270, SD = .809). Participants scores
for Behavioral Engagement Effort (BEE, “effortful class participation” [Wang et al,
2014, p. 530]) and Cognitive Engagement (CE, “mental effort” [Wang et al., 2014, p.
518]) both improved modestly as well (M = 3.043, SD = 1.250 to M = 4.119, SD = .7048
and M = 3.008, SD = 1.242 to M = 4.180, SD = .868, respectively). Disengagement (DE)
was a reversely coded construct. After the reverse coding, the result showed a decrease in
student disengagement (M = 2.926, SD = 1.137, to M = 3.138, SD = 1.326). Finally,
when all subsets for the CEI were combined data analysis indicated that students did
experience overall improved classroom engagement during the innovation unit (M =
3.033, SD = 1.110 to M = 4.074, SD = .662). Table 4.3 provides the mean and standard
deviation for the pre-innovation and post-innovation scores of the CEI.

97
Table 4.3
Descriptive Statistical Analysis for Pre- and Post-Innovation CEI
Subscale
Pre-Innovation
Post-Innovation
M
SD
M
SD
AE - Affective
Engagement
3.034
1.343
4.123
1.053
BEC - Behavioral
Engagement Compliance
3.163
1.475
4.270
.809
BEE - Behavioral
Engagement Effort
3.043
1.250
4.119
.704
CE - Cognitive
Engagement
3.008
1.242
4.180
.868
DE - Disengagement*
2.926
1.137
3.138
1.325
ALL
3.033
1.110
4.074
.662
* The mean score for disengagement is reversely coded.
Then inferential statistics were used to investigate whether the change in students’
engagement was statistically significant. First, a Shapiro Wilk Test was performed on the
data to test for normality (Taeger & Kuhnt, 2014). The Shapiro Wilk Test for the
subscales Affective Engagement and Behavioral Engagement Compliance, as well as the
overall combined significance was p <.001. The distribution for the subscale Behavioral
Engagement Effort was p = .011, and the distribution for the subscale for Cognitive
Engagement was p = .002. Finally, the revers coded subscale Disengagement was p =
.064. Table 4.4 outlines the results of the Shapiro Wilk Test was performed for normality.
Table 4.4
Shapiro Wilk Test for Normality for CEI
Difference in
Subscales
w
df
Sig.
AE - Affective
Engagement
.896
47
<.001
BEC - Behavioral
Engagement
Compliance
.897
47
<.001

98
BEE - Behavioral
Engagement Effort
.934
47
.011
CE - Cognitive
Engagement
.914
47
.002
DE – Disengagement*
.954
47
.064
ALL
.899
47
<.001
* The mean score for disengagement is reversely coded.
Because most of the subscales were not normal distribution (p <.05), a Wilcoxon
Signed Rank test (non-parametric analysis) was run to determine if there was a difference
in the classroom engagement between the units (Adams & Lawrence, 2019; Taeger &
Kuhnt, 2014). The Wilcoxon Signed Rank test results for CEI indicated that participants’
improvement in AE, BEC, BEE, CE, and overall engagement was statistically significant
(p < .001), but the change in DE (p = .309) was not significant. Table 4.5 outlines the
results for the Wilcoxon Signed Rank test performed for the Classroom Engagement
Inventory.
Table 4.5
Wilcoxon Signed Rank Test Results for CEI
Subscale
Median
Z
p
Pre-innovation
Post-innovation
AE - Affective
Engagement
2.80
4.60
-4.72
<.001
BEC - Behavioral
Engagement
Compliance
2.67
4.67
-3.84
<.001
BEE - Behavioral
Engagement Effort
2.80
4.40
-4.14
<.001
CE - Cognitive
Engagement
2.63
4.50
-4.47
<.001
DE - Disengagement
3.00
3.00
-1.02
.309
ALL
2.70
4.17
-4.873
<.001

99
Online Digital Literacy Assessment
Description and Reliability
The Online Digital Literacy Assessment (ODLA) for this study was administered
to participants near the end of their pre-innovation social studies unit in early February of
2022 and then again at the end of the co-taught innovation unit in mid-March of 2022. A
total of 45 students took both the pre-innovation and post-innovation unit’s ODLA. The
ODLA used for this study is an adaptation of the TRAILS (Tool for Real-Time
Assessment of Information Literacy Skills) Digital Literacy Assessment developed by
Kent State University. The TRAILS is a select-response test used to assess students’
information and digital literacy skills (Kent State University Libraries, 2019) whereby
students select an answer to a test question from four potential answers (Kent State
University, 2019c).
I adapted the 6th grade TRAILS assessment by selecting 64 of the original 90
assessment questions removing assessment question that did not pertain to online
research or that did not relate to the study such as assessment questions concerning topic
development in a research project because for this study students were given the topics of
who, what, why, when, where, and how to focus their projects. Appendix D lists the
questions for this study’s Online Digital Literacy Assessment with the answers marked.
Further, each of the ODLA questions aligned with the ISTE standards and the South
Carolina State Digital Literacy Standards (see pages 63 in Chapter 3 for standards
alignment). Table 4.6 outlines the five different categories of digital literacy assessed by
the adapted ODLA and the specific question numbers that correspond to the category.

100
Table 4.6
Information/Digital Literacy Category and Corresponding Test Questions for ODLA
Category
Corresponding Test Questions
1) Developing topics for research:
1, 2, 3, 4, 5, 6, 39, 40
2) Identifying potential sources for research:
15, 16, 17, 35, 41, 42, 43
3) Developing, using, and revising search
strategies during academic and personal
research:
27, 28, 29, 30, 31, 32, 33, 44
4) Evaluate sources and information during
academic and personal research:
7, 8, 9, 10, 11, 12, 13, 14, 34, 45, 46, 47
5) Using information responsibly, ethically,
and legally:
18, 19, 20, 21, 22, 23, 24, 25, 26, 36, 37, 38,
48, 49, 50
The pre-innovation and post-innovation unit ODLA for this study was
administered to students using Google Forms. The pre-innovation and post-innovation
student responses from the Google Forms resulted in Google Sheets spreadsheets that
were downloaded as Excel files. The correct answer to each question was coded as 1 and
incorrect answers were coded as 0. The maximum score therefore was 50 and the
minimum score was 0. Three of Mrs. Steinbeck’s students took the ODLA posttest twice.
I kept the highest score.
ODLA Findings
In order to analyze the results from the pre-innovation and post-innovation ODLA
a Kuder-Richardson Formula 20 reliability analysis described by Cleary and Linn (1968)
as a “parallel-form correlation and internal consistency measure” (p. 1) was run on the
data. The Kuder and Richardson Formula 20 showed that the pre-innovation test had
acceptable reliability (Pretest: ρKR20 = 0.70). However, the ODLA results taken at the
end of the innovation unit were slightly lower than .70 (Posttest: ρKR20 = 0.68)
indicating that the internal consistency was less than the earlier test. Though less .70 it

101
can be argued that the innovation ODLA results (ρKR20 = 0.68) are near enough to .70 to
have acceptable reliability.
Following this, the student scores of the ODLA test were analyzed using
descriptive statistics. For the subscale Developing Topics for Research the mean post-
innovation scores improved (M = .410, SD =.195. from M =.355, SD =.188), while the
subscale Identifying Potential Research Sources declined (M = .283, SD = .145 from M
=.349, SD = .181). Though not declining, the subscale scores Developing, Using, and
Revising Search Strategies During Academic and Personal Research improved only
modestly (M =.388, SD = .203 from M =.378, SD = .192). Likewise, the subscale scores
for Evaluate Sources and Information During Academic and Personal Research also
improved modestly (M =.391, SD = .185 from M = .338, SD =.155). For the Using
Information Responsibly, Ethically, and Legally sub-scale, the scores also showed an
improvement (M =.435, SD = .165 from M =.395, SD =.172). When all the values for
pre-innovation and post-innovation subset means were combined a modest improvement
overall was revealed through analysis (M = .391, SD = .113 from M =.365, SD =.118).
Table 4.7 provides details of the pre-and post-innovation descriptive statistics.
Table 4.7
Descriptive Statistics for the Pre-and Post- Innovation ODLA
Subscale
Pre-Innovation
Post-Innovation
M
SD
M
SD
1) Developing
topics for research
.355
.188
.410
.195
2) Identifying
potential sources
for research
.349
.181
.283
.145
3) Developing,
using, and revising
search strategies
during academic
.378
.192
.388
.203

102
and personal
research
4) Evaluate sources
and information
during academic
and personal
research
.338
.155
.391
.185
5) Using
information
responsibly,
ethically, and
legally
.395
.172
.435
.165
Total
.365
.118
.391
.113
Following the descriptive statistical analysis, the data was analyzed using
inferential statistical analysis. Similarly, the Shapiro Wilk Test was run on the data to test
for normality (Taeger & Kuhnt, 2014). The p values for Developing Topics, Identifying
Sources, Evaluating Sources, and Using Information Ethically, all when taken separately,
did not show a normal distribution (p < .05). However, Developing Strategies for
Research had a p-value greater than .05 as well as the overall total (p = .337) which
indicated that the scores were normally distributed. Table 4.8 shows the p-values for the
subscales within the ODLA.
Table 4.8
Shapiro Wilk Test for Normality of ODLA
Subscale
W
df
Sig
1) Developing topics for
research
.939
45
.020
2) Identifying potential
sources for research
.944
45
.030
3) Developing, using, and
revising search strategies
during academic and personal
research
.955
45
.079
4) Evaluate sources and
information during academic
and personal research
.949
45
.048

103
5) Using information
responsibly, ethically, and
legally
.909
45
.002
Total
.972
45
.337
Because the Shapiro Wilk Test indicated that the subscales were not normally
distributed (p < .05), non-parametric analysis was necessary using the Wilcoxon Signed
Rank test (Adams & Lawrence, 2019; Taeger & Kuhnt, 2014). The results from the
Wilcoxon Signed Rank test indicated that the five subscales and the total scores for the
ODLA had a p-value greater than .05, indicating that although students did improve some
on their digital literacy skills, the change was not statistically significant. Table 4.9
illustrates the results of non-parametric analysis.
Table 4.9
Wilcoxon Signed Rank Test for ODLA
Subscale
Median
Z
p
Pre
Post
1) Developing topics
for research
.380
.380
-1.62
.105
2) Identifying
potential sources for
research
.290
.290
-1.55
.121
3) Developing,
using, and revising
search strategies
during academic and
personal research
.380
.380
-.124
.902
4) Evaluate sources
and information
during academic and
personal research
.330
.420
-1.90
.058
5) Using information
responsibly,
ethically, and
legally
.400
.400
-1.54
.124
Total
.340
.380
-1.59
.111

104
Social Studies Project Rubric
Description
The social studies rubric for this study is one that was developed by the school
districts’ curriculum coordinator and used across all 6th Grade social studies classes to
assess student learning at the end of each social studies unit. The rubric was created so
that regardless of the topics covered within the unit, the rubric still applies. The rubric
addressed social studies content, appearance and mechanics, and digital literacy skills.
One the rubric, social studies content had six categories with the total points available
equaling 60% of the total. The appearance and mechanics section of the rubric had two
components with appearance equaling 4% and mechanics equaling 10% for a total of 14
% of the total grade. Finally, the digital literacy skills component had four categories
which included finding appropriate sources (4%), creating proper citations (12%),
creating a properly formatted references section (6%), and sharing the project or images
of the project online (4%) all combined to be 26% of the student’s total grade.
In order to get the maximum score for social studies content, students had to
thoroughly describe six separate components of an historical event, development, or topic
including who was involved, what happened, why the event, development, or invention
or innovation happened, when the event, development, or invention or innovation
happened, where the event, development, or invention or innovation happened, and how
the event, development, or invention or innovation changed the world. In addition to
thoroughly describing the topic, students had to provide clearly labeled images to
illustrate their descriptions. In order to receive the maximum number of points for
appearance and mechanics student projects needed to be neat, attractive, and creative

105
with no spelling, grammar, or punctuation errors. In order for the student to receive the
maximum number of points for the digital literacy skills component of the rubric students
needed to demonstrate their ability to use appropriate online sources, correctly cite all of
their sources incorporating the images they used, create a thorough reference section that
was correctly formatted, and share their project or images of their project online.
For the pre-innovation unit, the topics spanned early civilization to the fall of
Roman Empire. Students were required to create a physical brochure to meet the rubric’s
criteria. The unit’s time frame spanned late 2021 until the first part of February 2022. The
innovation unit’s time frame spanned early February to mid-March of 2022. The
innovation unit covered historical events from the fall of the Roman Empire through the
Protestant Reformation and the Age of Enlightenment.
The summative unit projects completed for this innovation unit were online
presentations using the Prezi platform. During this time, the Covid-19 pandemic had a
large Omicron variant spike which severely affected school attendance by both students
and teachers. For this reason, three students completed neither their pre-innovation
projects nor their innovation projects, ten of the students involved in the study did not
complete their pre-innovation projects and six students did not complete their innovation
projects. Therefore, after the data from the pre-innovation and post-innovation project
rubrics was cleaned, only 29 of the students’ projects were used for analysis.
The rubric used to grade these projects was the same as the pre-innovation project
rubric. For the pre-innovation unit, the social studies teacher and I graded all the projects
together. For the innovation unit, the social studies teacher helped to grade about five of
the innovation projects to ensure inner rater reliability and then I graded the remaining

106
projects alone. A printed pre-innovation and post-innovation project rubric was filled out
for each project that was turned in by the students so that as the projects were graded the
scores were filled in on a paper rubric for each student.
Social Studies Project Rubric Findings
Once all the projects were graded, I transferred the scores for each student into an
Excel workbook separating the subscales of social studies content, mechanics and
appearance, and digital literacy skills. The maximum allowable score for Social Studies
Content was 60, for Mechanics and Appearance it was 14, and for Digital Literacy Skills,
26. The subscale data as well as the overall score data was then analyzed using
descriptive statistics. The mean social studies content score improved considerably
(M=8.48, SD=3.21 to M=35.10, SD=21.06). Likewise, the mean Appearance and
Mechanics score showed improvement (M = 1.90, SD = 1.63 to M=11.66, SD=4.33), as
well as the mean Digital Literacy Skills score (M=1.38, SD = 1.15 to M=9.59, SD=9.07).
With all the subscales combined, students total scores showed a significant increase after
the innovation unit (M=11.79, SD=5.15 to M=56.03, SD=30.09). Table 4.10 details the
descriptive statistics findings for the pre-innovation and post-innovation social studies
project grades based of the common 6th Grade projects rubric used for the school.
Table 4.10
Descriptive Statistics for Pre-innovation and Post-innovation Projects
Subscale
Pre-Innovation
Post-Innovation
M
SD
M
SD
Social Studies
Content
8.48
3.21
35.10
21.06
Appearance &
Mechanics
1.90
1.63
11.66
4.33
Digital Literacy Skills
1.38
1.14
9.59
9.07
Overall
11.79
5.18
56.03
30.09

107
A Shapiro Wilk Test was performed on students’ score differences between pre-
innovation and post-innovation unit project to test for normality (Taeger & Kuhnt, 2014).
Table 4.11 outlines the results of the Shapiro Wilk Test performed for normality.
Table 4.11
Shapiro Wilk Test for Normality for Unit Projects
Subscales
w
df
Sig.
Social Studies Content
.929
29
.050
Appearance and
Mechanics
.833
29
<.001
Digital Literacy Skills
.739
29
<.001
Overall
.951
29
.189
Because the Shapiro Wilk test did not show an overall normal distribution (p <.05),
a Wilcoxon Signed Rank test was performed on the data to determine if there was a
statistically significant difference between the students’ unit scores (Adams & Lawrence,
2019; Taeger & Kuhnt, 2014). Wilcoxon Signed Rank test results indicated that
participants’ improvement in Social Studies Content, Appearance and Mechanics, Digital
Literacy Skills, and Overall scores was statistically significant (p <.001). Table 4.12
outlines the results for the Wilcoxon Signed Rank test performed for the Social Studies
Unit Project scores.
Table 4.12
Wilcoxon Signed Rank Test Results for Unit Project Scores
Subscale
Median
Z
p
Pre-innovation
Post-innovation
Social Studies Content
9.00
36.00
-4.46
<.001
Appearance and
Mechanics
2.00
14.00
-4.49
<.001
Digital Literacy Skills
2.00
4.00
-4.55
<.001
Overall
13.00
57.00
-4.57
<.001

108
Qualitative Findings and Interpretations
The qualitative data for this study were derived from eight semi-structured
interviews conducted with students after the innovation unit was complete. The
interviews followed an interview protocol that was designed to address aspects of each of
the three research questions that guided this study. The interviews were performed using
Google Meet and were recorded using Google Meet’s captioning extension. After
refining the resulting transcripts for accuracy, the interview data were used for qualitative
analysis for this study. The following sections detail (a) the interview participant
selection, (b) the data collection procedures and analysis, and (c) the qualitative findings.
Interview Participant Selection
The selection process for students to participate in the semi-structured interviews
for this study was purposeful using a representative sample described by Tracy (2020) as
a group whose “members are chosen specifically to replicate characteristics of the larger
group” (p. 102). Students were selected using three criteria. First, I combined all
participating students’ pre-innovation and post-innovation scores for all three qualitative
instruments which included the ODLA, CEI and the unit project rubrics. After identifying
students with the least combined gains, the central combined gains, and the top combined
gains, I selected four students from each homeroom class from these scoring groups to
represent the demographics of gender and race for all the students participating in the
study. Table 4.11 outlines the student participant data for each of the eight students
selected to participate in the semi-structured interviews conducted for qualitative data
collection for this study.

109
Table 4.13
Student Participant Data for Semi-Structured Interviews
Participant and
Homeroom
Group
Gender
Race
Combined ODLA, CEI, Project Score
Gains
Casy (Mrs.
Steinbeck)
Male
White
-2
Elisa (Mrs.
Steinbeck)
Female
White
-1
Cathy (Mrs.
Joad)
Female
African
American
8
John (Mrs.
Steinbeck)
Male
African
American
54
Dora (Mrs.
Joad)
Female
Hispanic
64
George (Mrs.
Steinbeck)
Male
White
77
Rosa (Mrs.
Joad)
Female
White
87
Pablo (Mrs.
Joad)
Male
Hispanic
124
Qualitative Data Analysis
The sources of qualitative data were eight individual semi-structured interviews
conducted with the participants selected from all the students who took part in this study.
The interviews took place online using Google Meet and were recorded using Google
Meet’s captioning extension which produced transcripts of the interview. After each
interview, I downloaded the transcript and listened to the recorded interview several
times while editing the transcript for accuracy. Once the transcripts were accurate, I
uploaded the transcripts to the Delve Tool, which is a web-based software used for
coding qualitative data. Then I proceeded to the first cycle of coding the qualitative data.

110
Inductive analysis was used to analyze the qualitative data for this study.
Inductive analysis as it is applied to this study is a process whereby the researcher,
through several rounds of reading and rereading transcripts, develops short, descriptive
codes for information that reveals itself through scrutiny. The researcher then uses these
codes to uncover patterns within the codes. Once the patterns emerge, these are used to
develop categories of information which then ultimately reveal themes that have emerged
from the categories (Creswell & Creswell, 2018; Mertler, 2020; Saldaña, 2021; Tracy,
2020).
Saldaña (2021) defines a code as a "researcher-generated word or short phrase
that symbolically assigns a summative, salient, essence-capturing, and/or evocative
attribute for a portion of language-based or visual data” (p. 362). Researchers usually
perform coding in several cycles including first-cycle and second-cycle methods.
According to Saldaña (2021), first-cycle methods “are those processes that happen during
the initial coding of data” (p. 88). Saldaña (2021) describes second-cycle coding as the
act of analyzing these initial codes generated during the first rounds of coding and then
“classifying, prioritizing, integrating, synthesizing, abstracting, [and] conceptualizing” (p.
89) them to form patterns which in turn helps to reveal themes that emerge from the data
(Mertler, 2020; Saldaña, 2021).
For this study, I performed three rounds of first-cycle coding and then two rounds
of second-cycle coding on the data. Throughout the entire qualitative data collection and
analysis process, I kept comprehensive notes about each step, process, and decision that
was made. The following section provides details regarding the first and second-cycle
coding methods used to analyze the qualitative data collected for this study.

111
First-Cycle Methods
In order to conduct the first-cycle coding of the interview data, I created three
projects within the Delve Tool which is a web-based software used for coding qualitative
data. The projects were named for the type of first-cycle coding that were to be applied to
each project. Then each of the eight transcripts were uploaded into each of the three
projects. Using the Delve Tool, I used In Vivo, Initial, and Values, Attitudes, and Beliefs
first-cycle coding methods to analyze the data.
In vivo coding. In vivo coding is “a word or short phrase from the actual
language found in the qualitative data record” (Saldaña, 2021, p. 137). These codes are
the words used by the interviewee and are, according to Saldaña (2021), “more likely to
capture the meanings inherent in the people’s experience” (p. 138). I first used in vivo
coding to analyze the transcripts in Delve. For this study in vivo coding allowed me to
identify specific words and phrases that the students used to describe their experiences as
students in both the single-teacher classroom and during a co-teaching class. Further, the
actual words of the students were often far better at getting to the essence of what was
being discussed at the moment. Figure 4.1 is an image of an in vivo code in Delve where
the student’s words perfectly summed up what she was trying to say when she was asked
if she enjoyed the co-teaching set-up. In all, there were 175 in vivo codes applied to the
transcripts.
Figure 4.1 Example of In Vivo code in Delve Tool.

112
Initial coding. According to Saldaña (2021), initial coding is a method of coding
that allows the researcher to “reflect deeply on the contents and nuances” (p.148) of the
data by examining the relationships and differences between and within the information
that has been collected. During the initial coding cycle, I looked closely at each transcript
section and phrases not easily apparent with in vivo coding. One example of a code
developed during the initial coding cycle was “faster paced with two teachers.” This
became a thread that I noticed throughout several of the transcripts. One student, George,
commented that “there's so much information about it that once y’all were actually done,
my mind couldn't wander and I had to start processing it. No, I immediately had to start
working.” Likewise, the statement “instead of one person just talking about the whole
thing y’all could talk about it like really quickly back and forth instead of one person, one
teacher, just talking about it like slowly” was also coded “faster paced with two
teachers.” There were several such instances during initial coding where nuanced
information within the transcripts became apparent. A total of 135 initial codes were
applied to the transcripts.
Values coding. Values, Sentiments, and Beliefs was the third type of first-cycle
coding method I used to analyze the qualitative data for this study. With this type of
coding, transcript comments that reflect what a person feels, thinks, or believes about a
situation or individual are coded (Saldaña, 2021). In many qualitative data analysis
situations, the researcher needs to code the data in such a way as to label and distinguish
between values, sentiments, and beliefs; however, Saldaña (2021) stated that “values
coding does not necessarily have to code for all three or differentiate between them
unless the study’s goals include determining participant motivation, agency, causation, or

113
ideology” (p.168). For this reason, I did not distinguish between the three but coded
simply as values for this cycle of coding.
In order to perform values coding for this study, I revisited each transcript and
examined each line of text searching for indications of how the students felt or what they
believed and then coded their words with descriptions of these feelings. Examples of
values codes developed during this cycle include the codes “likes social studies” and
“social studies sometimes boring” which were applied to the same phrase by Rosa where
she said, “I like social studies but sometimes it just gets a little boring.” Another example
of a values code applied to the data for this study is “confidence with digital literacy”
applied to Elisa’s phrase “Oh, like 10 out of 10. I'm so confident.” In all, a total of 239
values codes applied to the transcripts.
Peer debriefing. Throughout the first-cycle coding process, I met regularly with
my co-advisor to discuss the codes that were applied to each transcript and for each type
of coding. She made several suggestions including shortening some of the initial code
lengths. For example, “can use tools in future lives” was shortened to “future benefits.”
An additional suggestion that she made was to use brackets to fill in in vivo codes for
clarity such as the code “the co-teaching was, it made it more funner” which was
changed to “the co-teaching was, it made [social studies] more funner.” This suggestion
helped immensely during second-cycle coding when the context of the code was
removed.
Transition to second-cycle coding. Once all the first-round coding cycles were
complete I downloaded each cycles’ codes from Delve into an Excel workbook with a
sheet for in vivo, a sheet for initial coding, and a sheet for values coding. The Delve

114
downloads for these cycles included each actual code, the interviewees initials, the
snippet of the transcript for which the code was applied, and the code or codes
themselves that were created. I made a second Excel workbook and placed all the codes
into one spreadsheet. When I had all the codes on one sheet, I used Excel’s color-fill tool
to assigned different colors to very broad groups of related codes. Figure 4.2 illustrates
the groupings used to separate the first-cycle codes by rough topics. Figure 4.3 shows an
example of the broad group “Feelings about Technology.”
Figure 4.2 Groupings used to separate the first-cycle codes by rough topic.
Figure 4.3 Example of the broad group “Feelings about Technology.”
After all the codes had colors assigned to them based on their relationships to the
groupings, I used the different colors to separate the codes into different pages in the
Excel workbook and labeled the sheets according to the grouping. Figure 4.4 illustrates
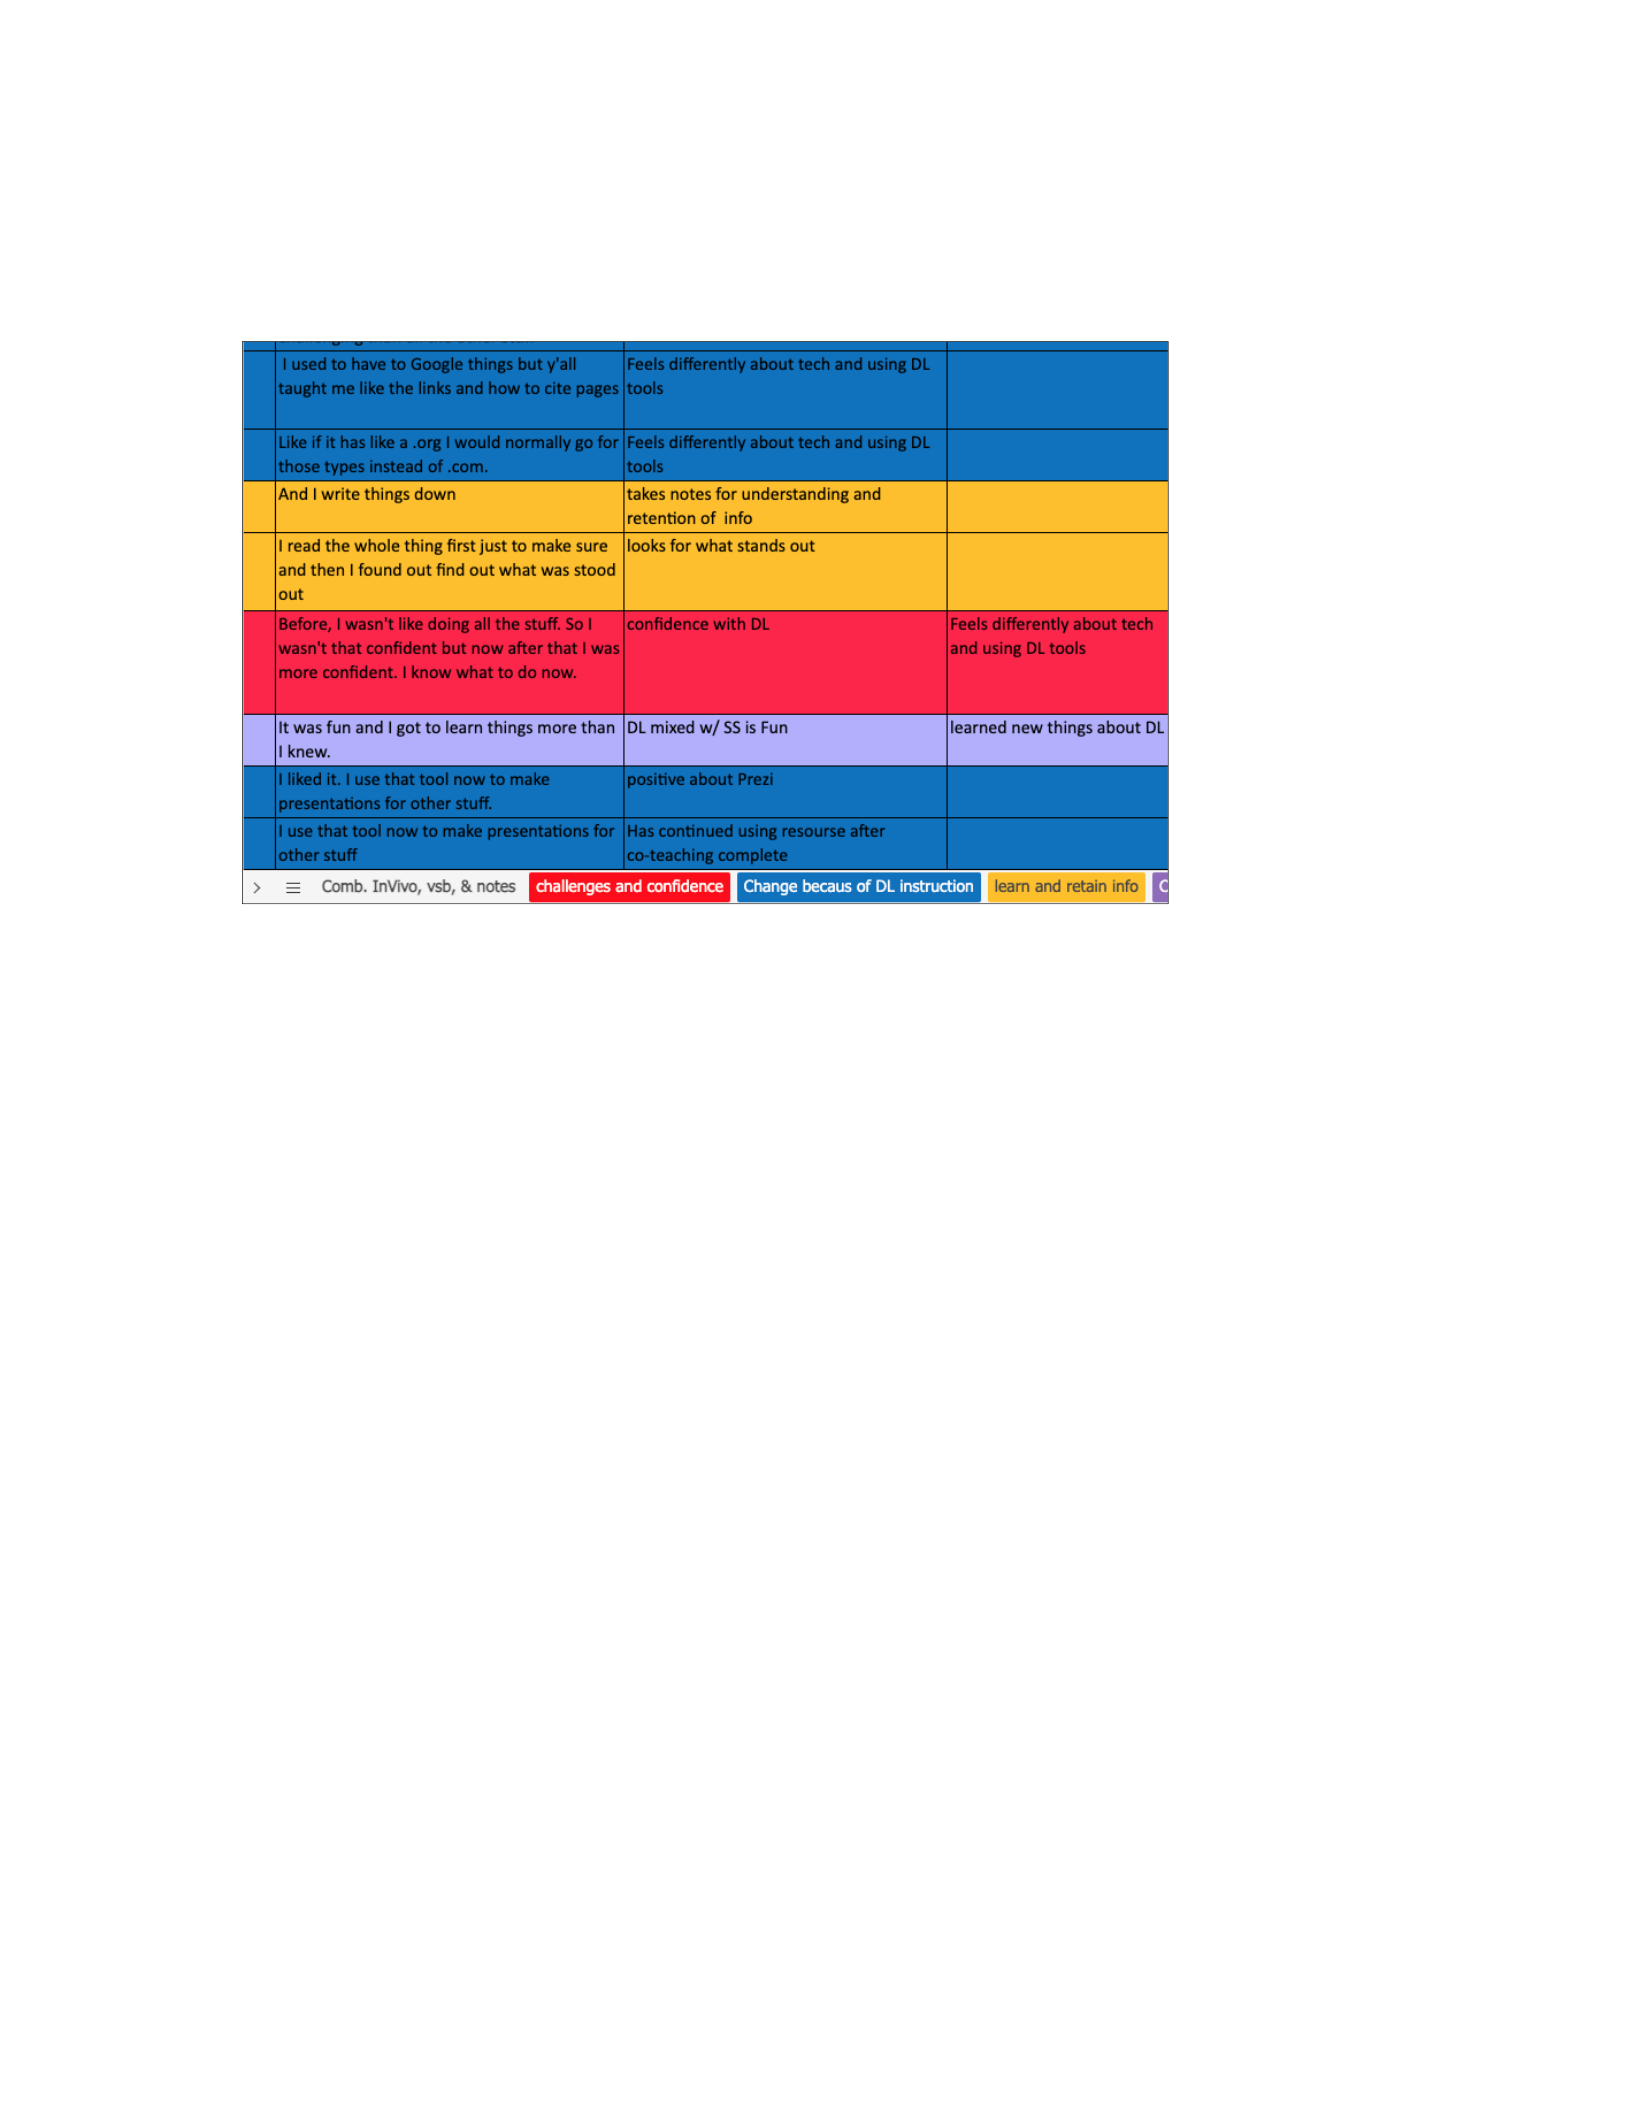
115
the color filled codes with the separate page tabs for each grouping visible at the bottom
of the workbook page.
Figure 4.4 Example of the color-filled codes and Excel tabs groupings.
Once the codes were separated into their broad groups, I deleted duplicate codes,
removed the colors from each of the group pages in the Excel workbook, and printed the
pages in black and white, stapling the broad grouping pages together. Figure 4.5 shows a
portion of the challenges and confidence grouping before it was printed.
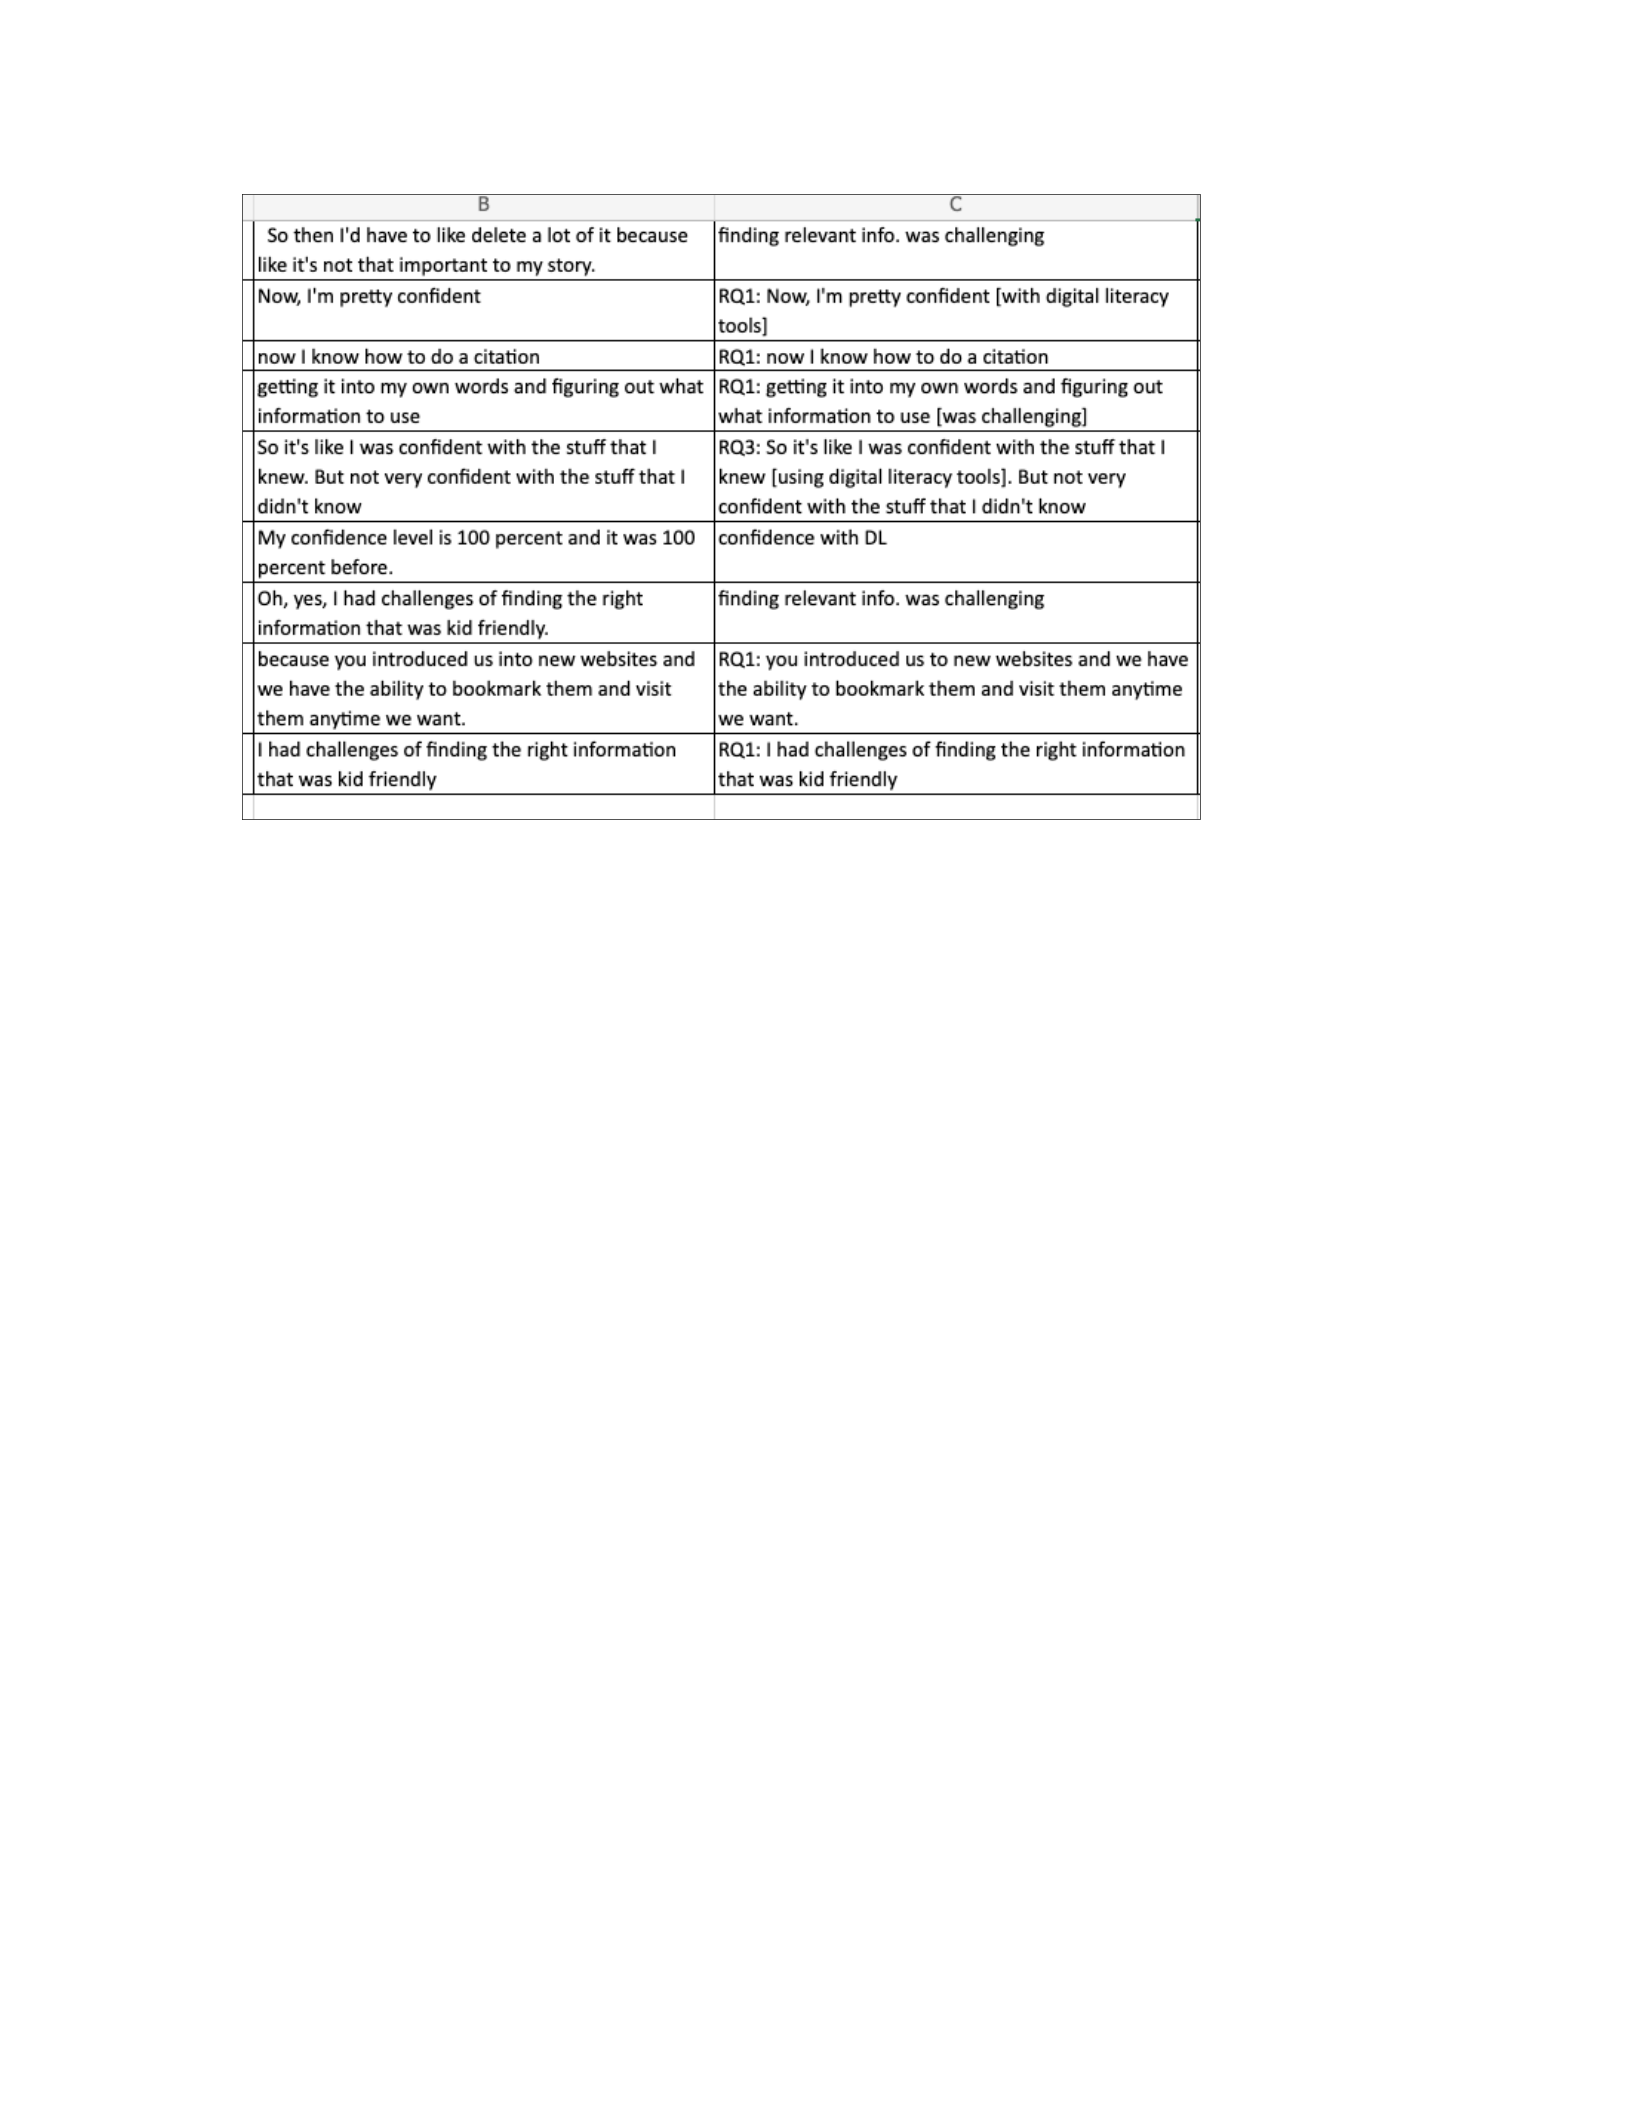
116
Figure 4.5 Example of codes before they were printed.
Second-Cycle Methods
Second-cycle coding involves a researcher judiciously examining the codes
generated during the first-cycle coding process in order to “organize” and “synthesize”
(Tracy, 2020, p.225) these codes into more conceptual groupings. Although there are
several different methods for performing second-cycle coding (Saldaña, 2021; Tracy,
2020), I used pattern coding to begin organizing my data. Pattern coding, according to
Saldaña (2021), is a way of grouping… [codes] into a smaller number of condensed”
“segments of data” (p. 322) that relate to each other and can be organized and
reorganized as patterns in the data as they become apparent. I chose to manually pattern
code my data as this method provides more visibility of the codes than just an Excel
spread sheet on a computer screen and as Tracy (2020) points out, is considered
“especially valuable among those new to qualitative analysis and for those who [are]
attracted to physically interacting with empirical materials” (p. 216). Thus, in order to
117
begin pattern coding my data, I used scissors to cut out each first-cycle code that I had
printed during the transitional phase between first and second cycle coding. In the
beginning, I kept the cut-out codes in bundles according to their broad groupings. Figure
4.6 illustrates the stapled together broad groups and one group of pattern codes that had
already been cut up.
Figure 4.6 Example of pattern code groups assembled and bundled.
Once all the codes were cut up, working on the surface top of two black chest
freezers that live in my home-office, I began reading and arranging them into groups that
seemed to establish patterns. At this point I started naming the pattern codes and writing
these new code names on post-it notes to summarize the codes that they subsumed. I
often rearranged and combined pattern groups until I arrived at more refined pattern
codes. Figure 4.7 illustrates the first cycle codes being arranged into patterns with the
pattern code names on post-it notes.

118
Figure 4.7 First-cycle codes sorted into named pattern codes.
This first round of pattern coding yielded 76 pattern codes hand printed on post-it
notes. I collected the post-it notes, carefully bundling their associated first cycle codes
together, and typed each pattern code name into an Excel spreadsheet. I used the color fill
tool in Excel to keep the pattern codes organized into their original broad groups but
lightened the colors to make the sheet more printer friendly and to symbolically prepare
the pattern codes for rearrangement. From here I created several possible categories in
preparation for a meeting with my dissertation advisor. Figure 4.8 shows the printed
pattern codes arranged in temporary categories.
Figure 4.8 Example of pattern codes arranged into temporary categories.

119
I then met with my dissertation advisors who read over my pattern codes and
initial potential categories to guide my category development. They had several
suggestions for revising my pattern codes and creating categories. One example of a
refinement that I made as a result of this peer-debriefing was that I had grouped “students
comfortable using tech, students like tech, and technology a part of everyday life” into a
category that included “technology gives access to more information,” and “tech allows
to work and own pace.” After our meeting, I made two separate categories from the codes
I had lumped into one. The categories I then created from my advisor's suggestions
concerning students and technology became “students’ perceived benefits of technology”
and “student perceptions and attitudes about technology.” Also, during this discussion
with my dissertation advisor, potential themes were discussed as they began to emerge
from my developing categories. My advisor recommended that I look across my pattern
codes and initial categories in order to see similarities.
After this meeting with my advisor, I stepped away from my work for several
days and then reviewed all 549 of my initial codes contained in Delve. I reviewed my
research questions and revisited the spreadsheets I had used to create my pattern codes.
This review resulted in my adding two additional pattern codes that I had initially
removed as partial duplicates. These were “finding ‘kid friendly’ information was
challenging,” and “overwhelmed with pace and amount of info from co-teaching.” With
this new perspective that I gained from talking to my advisor, from distancing myself
from the data for a few days, and from reviewing my research questions and original
codes, I put aside the possible categories I had previously begun to develop and began
creating categories anew. In order to do this, I arranged my pattern codes in a printable
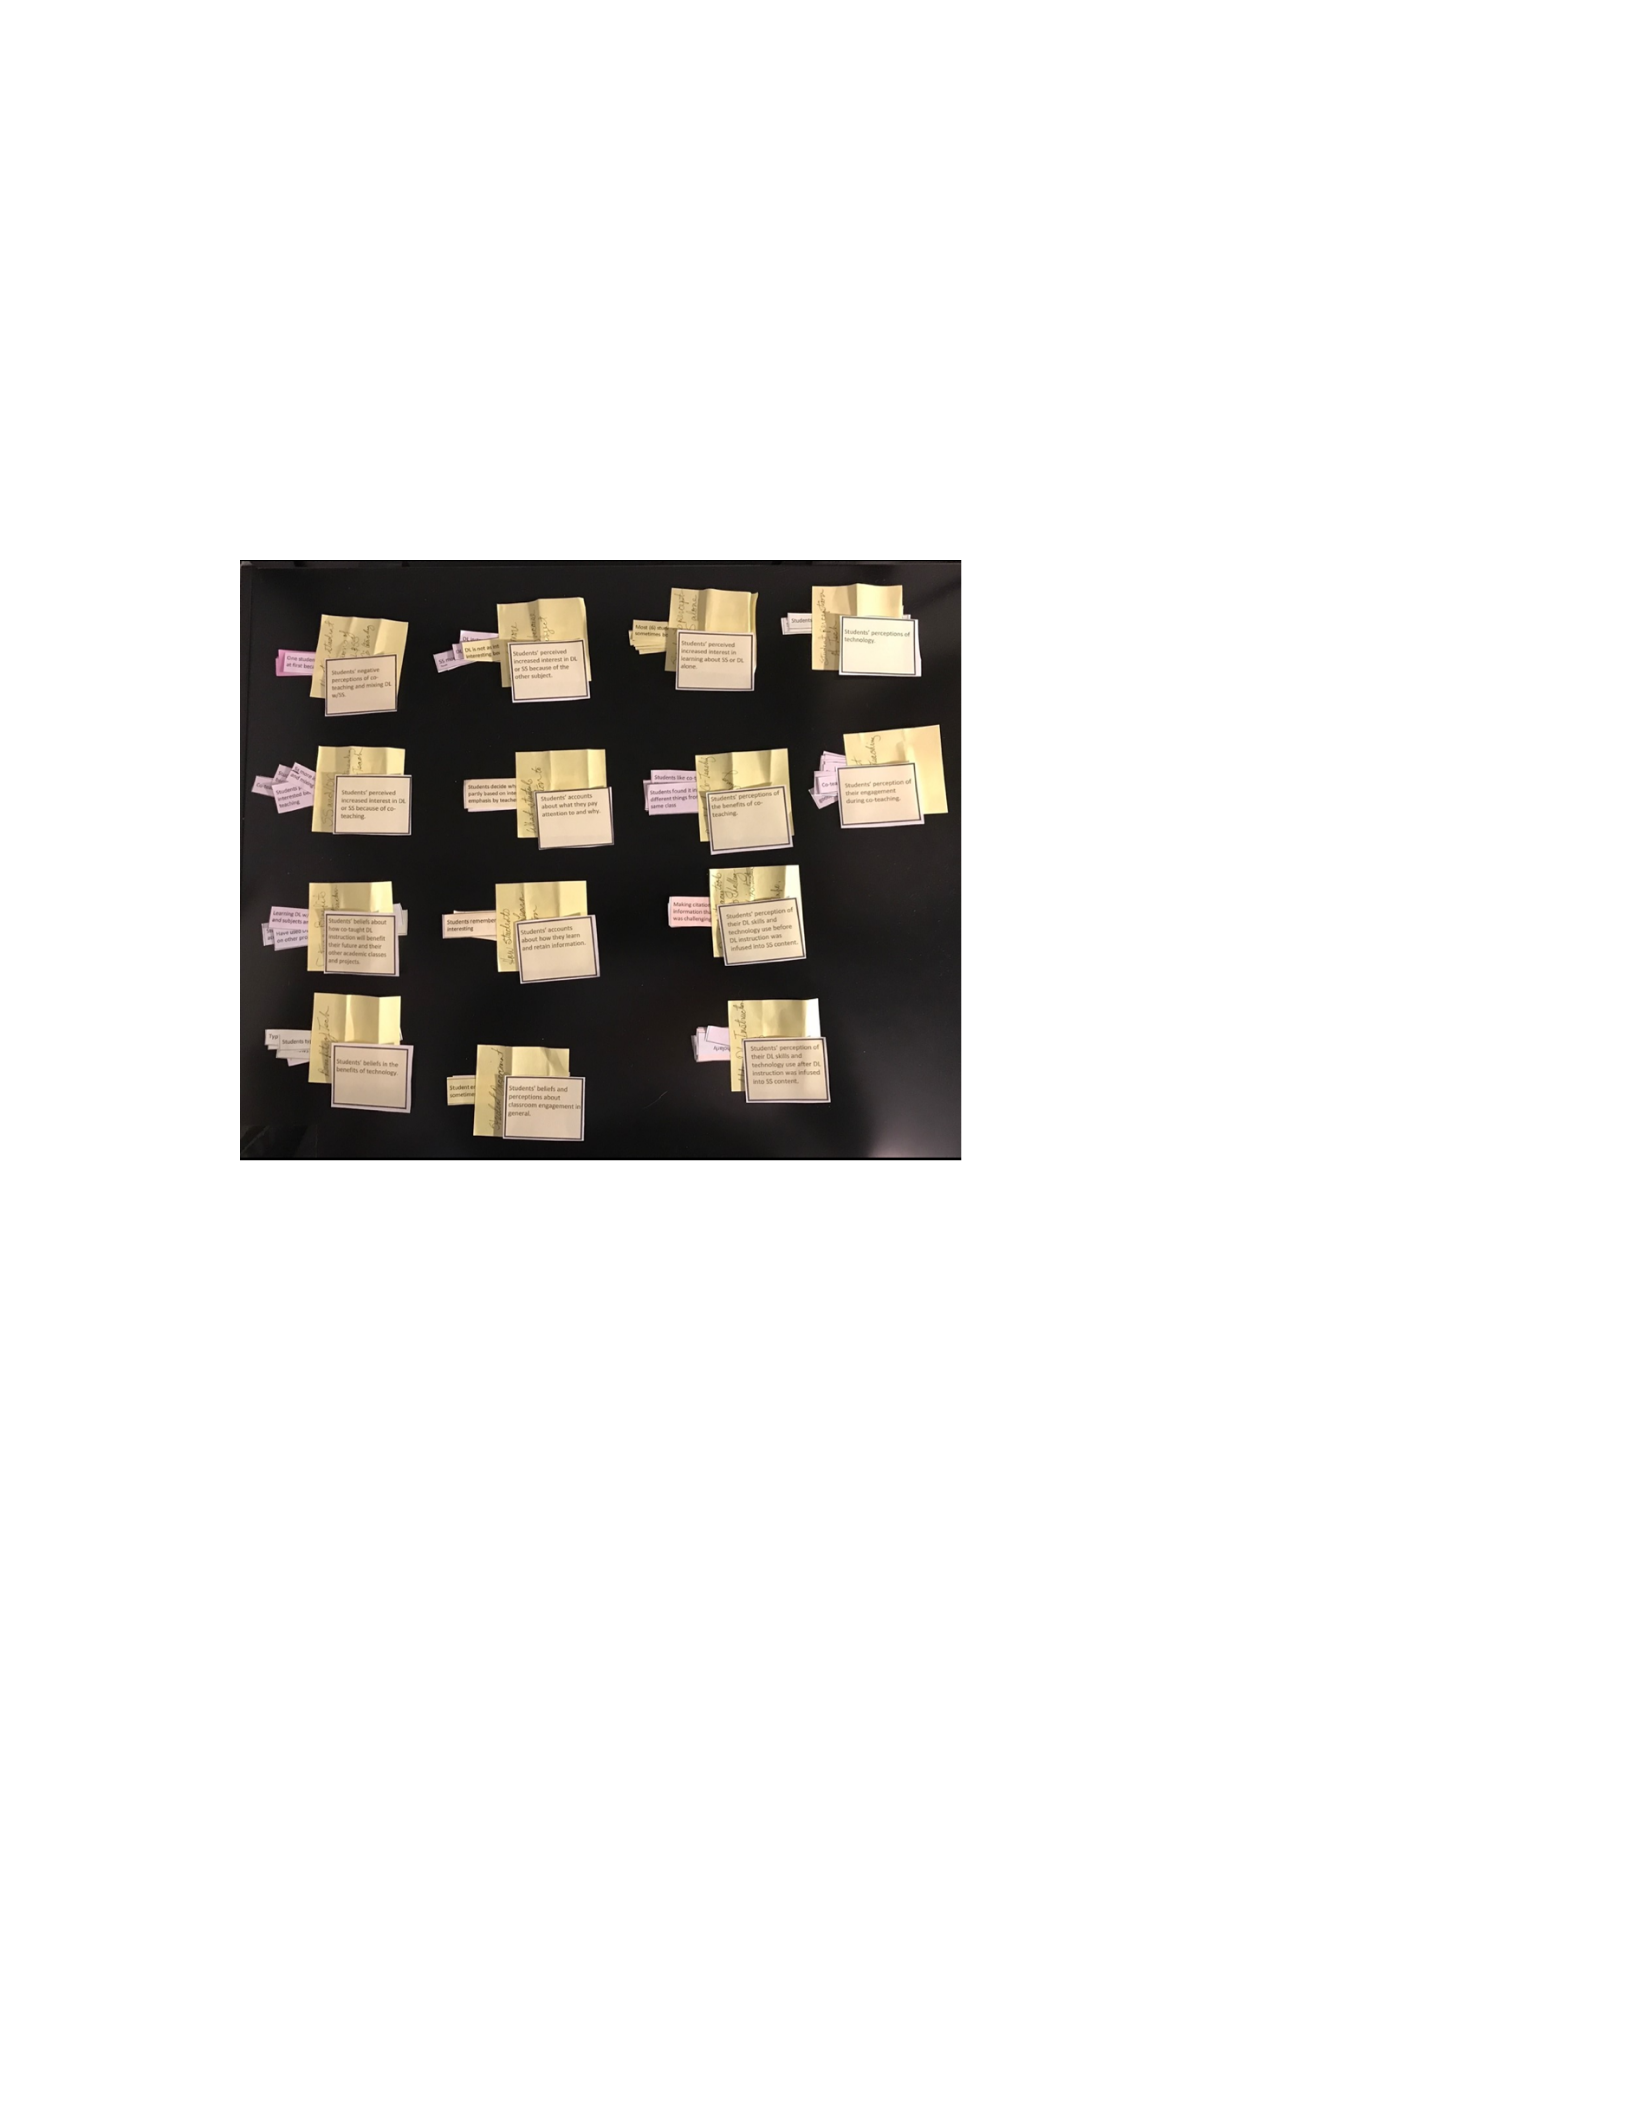
120
word document and printed all 78, which included the two additional pattern codes I had
arrived at after a second round of pattern coding . I cut out each pattern code with scissors
and began to group them into more specific and pointed categories, labeling each with a
post-it note, again working on the surface top of two black chest freezers that live in my
home-office. Figure 4.9 shows the pattern codes being arranged into possible categories.
Figure 4.9 Pattern codes arranged into possible categories.
Initially, I arrived at 14 categories. From here I created another Excel spread sheet
where I typed the category name across the top of the page and then used the pattern
codes that had been placed under the category labels on my flat surface to fill in under the
header row for each category on my spread sheet. Figure 4.10 provides a view of a
portion of the spreadsheet created for the categories and the pattern codes that they
subsumed.
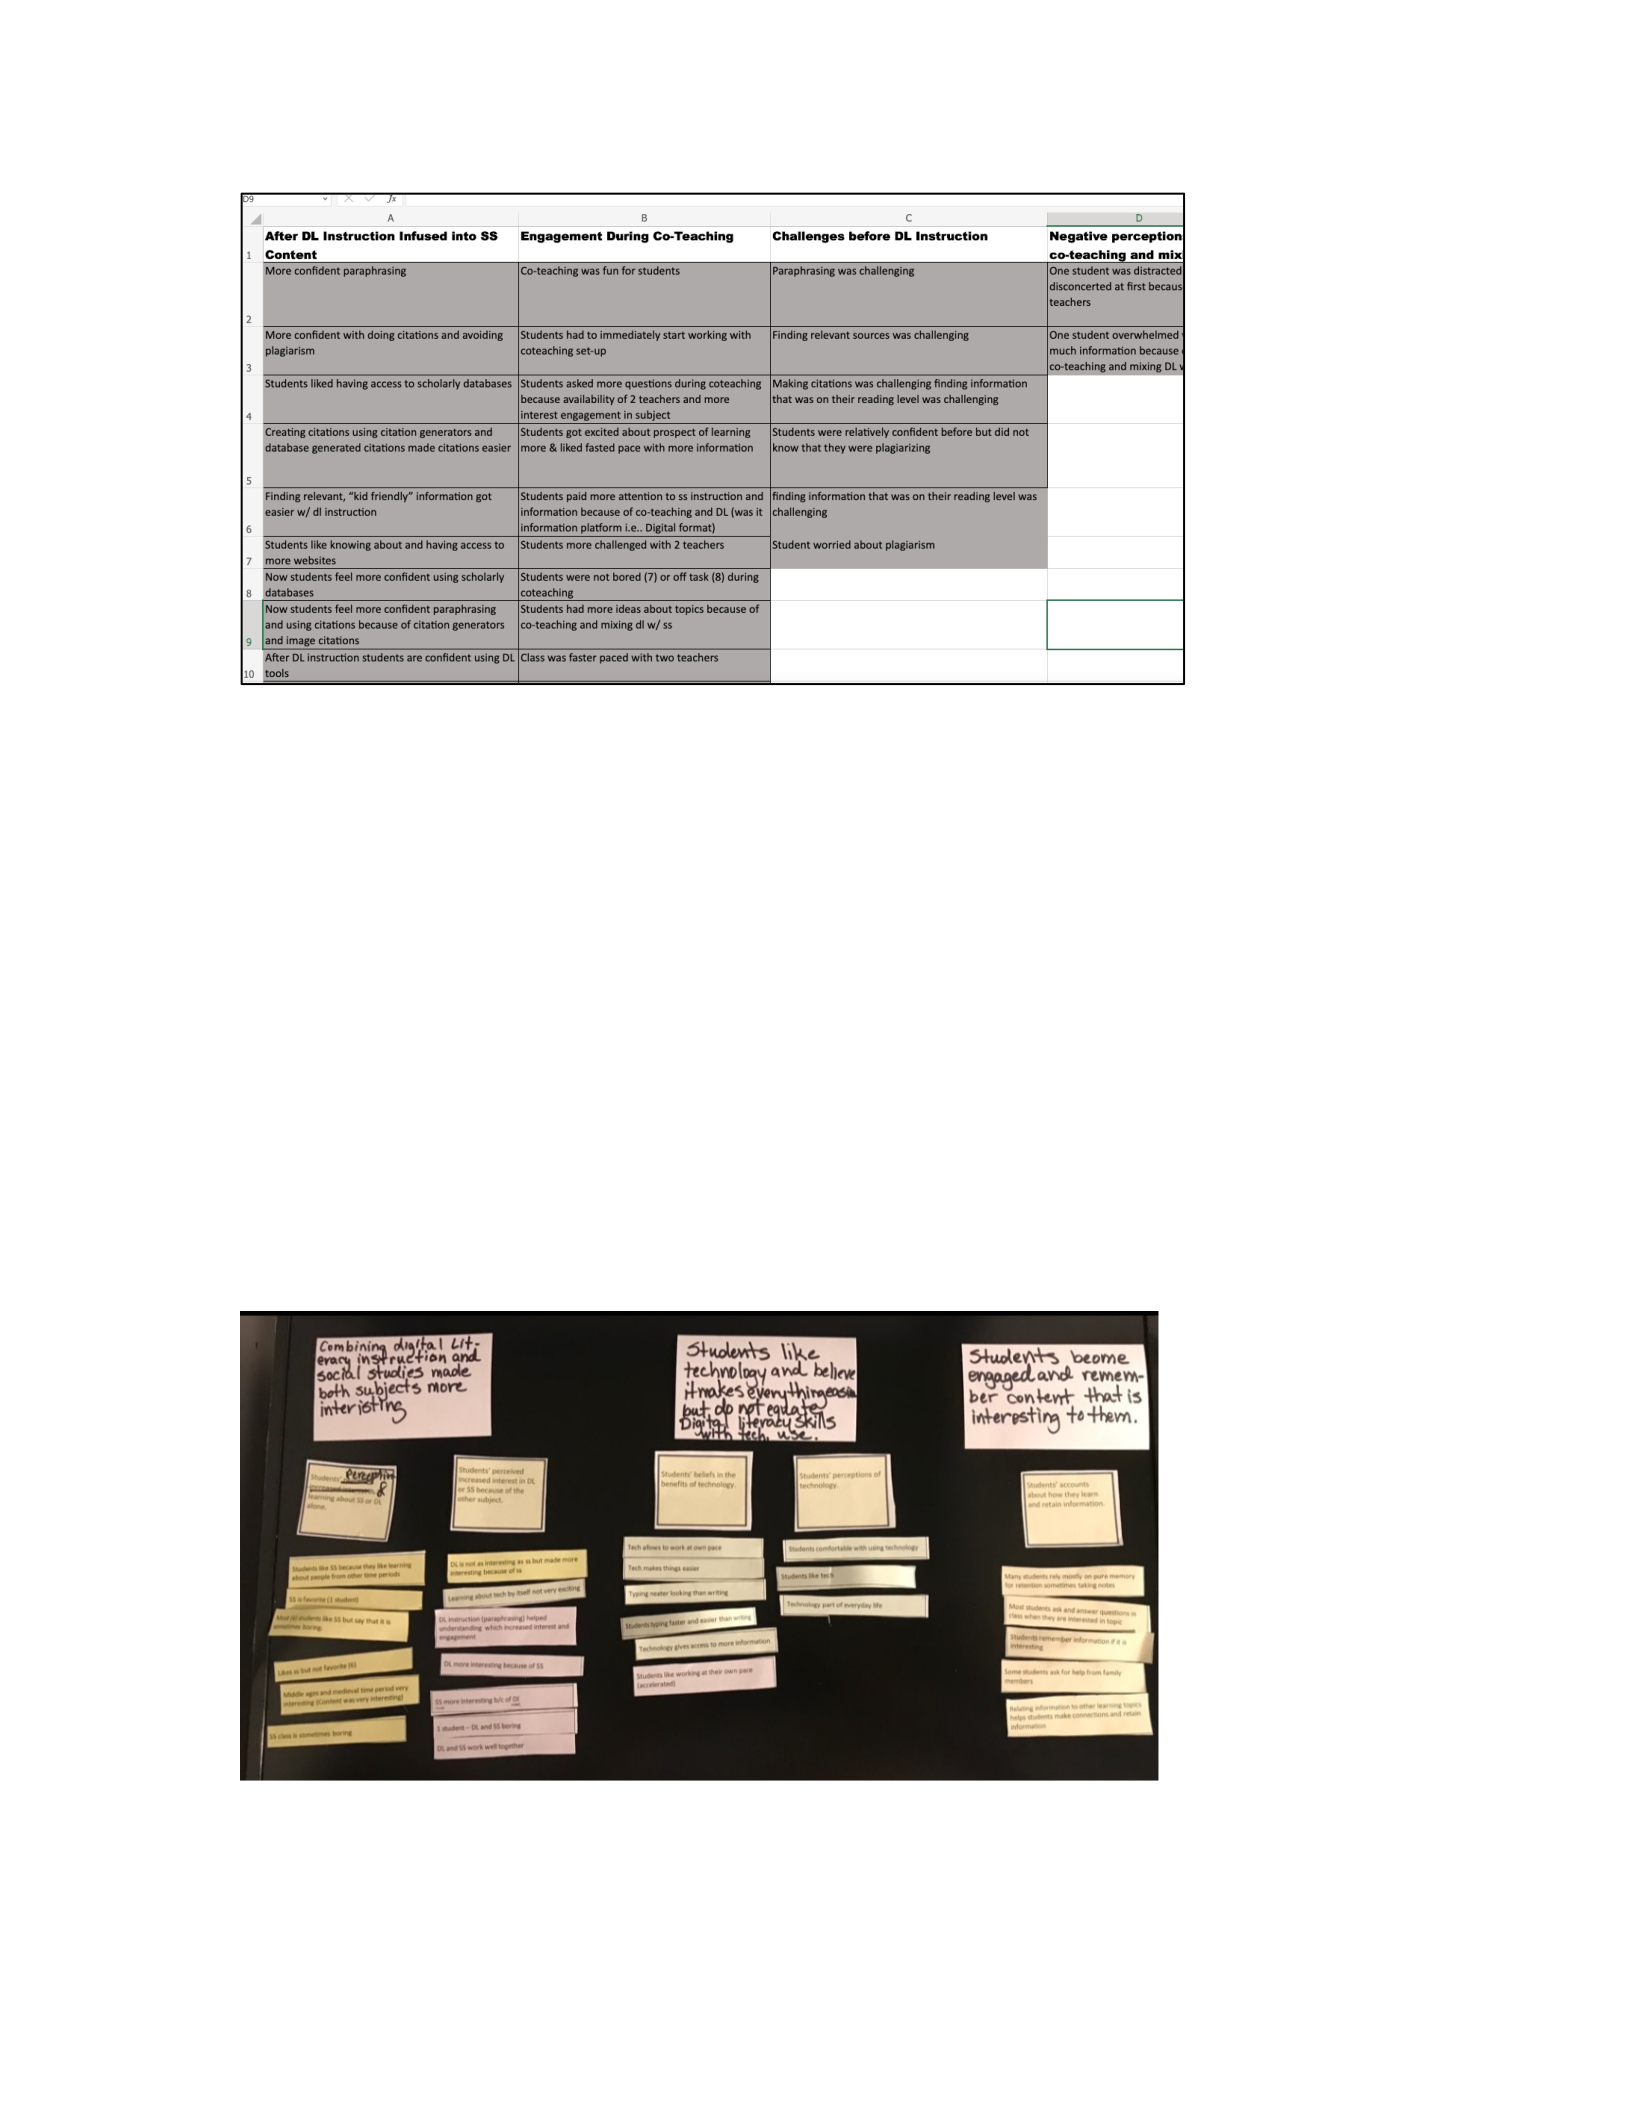
121
Figure 4.10 Partial view of the categories and pattern codes spreadsheet.
Here again, I stepped away from my work for a day. When I came back, I realized
that I needed an additional category to accommodate what general classroom attributes
might influence student engagement. I added this category and moved the appropriate
pattern codes underneath in the Excel spreadsheet. As I arranged and reviewed each
pattern code and category, I began to consider emerging themes. I tentatively created six
themes that I thought represented and embodied the qualitative data gathered for this
study. Figure 4.11 illustrates three of the six tentative themes I first arrived at.
Figure 4.11 Example of my first attempt at developing themes.

122
At this point I met with my dissertation advisor who suggested that I review both
my pattern codes and my categories. They gave several suggestions concerning
combining my pattern codes which reduced the number from 78 to 44. One example of a
new, more concise pattern code that was created from this suggestion was the combining
of the pattern code “students happy and excited during co-teaching” and “co-teaching
was fun for students” into “coteaching experience was enjoyable.” After the pattern codes
were revised, I modified my categories and reduced the number to 12. I met again with
my advisor, and we revisited the themes I had originally developed. With the help of both
my advisor and my dissertation chair, ultimately three themes emerged from my
qualitative data analysis.
Presentation of Findings
Three themes emerged from the qualitative data collected through the eight semi-
structured interviews conducted for this study. Table 4.12 shows the individual themes
along with the categories, examples of the pattern codes, and examples of the first-cycle
codes from which the themes were derived.
Table 4.14
Themes, Categories, Example Pattern Codes, and Example First-Cycle Codes.
Themes
Categories
Pattern Codes
First-Cycle Codes
Students perceived
bringing digital
literacy into social
studies content
improved their
awareness of and
skills in digital
literacy.
Lacked digital
literacy skills
before instruction
Unaware of
inappropriate
citations
“I never did that
[citations] before, but
now I know how to do
it.”
Challenged by lack
of digital literacy
skills
“finding appropriate
sources challenging”

123
Awareness of the
benefits of digital
literacy
Helps with other
classes and future
jobs
“we can use for
presentations,
business, whatever”
Students perceived
that co-teaching
supported their
learning in the
social studies
class.
Engagement
increased during
co-teaching.
Inclusion of
librarian increased
interest and
engagement
“cool to hear you
[librarian] teach”
Social studies more
interesting because
of co-teaching.
“I was more
interested”
Exposed to
broader range of
perspectives and
knowledge.
Resources of two
teachers contribute
to learning
Teacher
experiences and
interactions created
stimulating
learning
environment
“had more questions
because I found out
more”
“interesting to hear
about different things
from different
teachers”
Pace with two
teachers
Fast pace for two
domains in 45
minutes
“there's so much
information”
Combining digital
literacy instruction
and social studies
made social
studies more
engaging.
Social studies
more interesting
because of digital
literacy instruction
DL and SS work
well together
“those subjects really
work good together"
“two favorite things,
it's just really fun to
do”
Social studies more
interesting because of
research and Prezi.
Paraphrasing made
historical content
more
understandable/
Research increased
interest
“It [paraphrasing]
made me understand it
more.”
“access to more/better
sources”

124
“I like it, because
sometimes I get to
research some new
things.”
Likes social
studies but
sometimes it is
boring
Like learning about
people from other
time periods
"I really like social
studies because it
teaches us about like
what happened in the
past and what, how
much we changed.”
“I like learning about
new people that were
back in the old ages.”
Social studies
sometimes boring
“Social studies, I enjoy
it, but sometimes all
we get is boring.”
“because social studies
is so boring”
Theme 1: Students perceived bringing digital literacy into social studies content
improved their awareness of and skills in digital literacy.
As discussed earlier in Chapter 2, the need to teach digital literacy skills to
students in order to prepare them for future study and employment is exceptionally
important (Bejaković & Mrnjavac, 2020; Karnoe et al., 2018; Martzoukou & Elliott,
2016). From the academic and educational practitioners’ point of view, much has been
written about the benefits of digital literacy instruction (NCSL, 2017; P21, 2019), yet
very little, if any, research has discussed young students’ perceptions of this need.
Consequently, the first theme that qualitative analysis revealed was students perceived
teaching digital literacy infused into social studies content improved their awareness of
digital literacy and improved their digital literacy skills. The two categories that this

125
theme emerged from involved (a) students’ lack of digital literacy skills, and (b) students’
awareness of the benefits of digital literacy.
Lacked Digital Literacy Skills Before Instruction
This category was defined as students’ partial unawareness of digital literacy and
their lack of possessing digital literacy skills before digital literacy was taught within the
context of an academic class. From the interview data collected for this study, students
indicated that before they were taught digital literacy they partially knew about
plagiarism and were concerned about it but did not know how to properly cite sources.
Further, students indicated that they relied heavily on basic Google searches and text-
book materials to provide information for their research. After students were taught how
to research using techniques to locate and verify accurate and reliable scholarly sources
and then paraphrase and cite these sources, their digital literacy skills increased.
Unaware of inappropriate citations. During the interviews several students
indicated that they had heard about plagiarism before the innovation unit, but they did not
know how to avoid it by using citations. For instance, one student, George, stated that
without digital literacy instruction and learning about proper citations “if I ever did a
presentation for anything, I'd probably just copy and paste.” Additionally, Pablo said, “I
never did [citations] before, but now I know how to do it.” Likewise, Rosa said, “now I
know how to do a citation, and … I've learned more about plagiarism.” These student
examples show that not only were students unaware of how to create a proper citation,
but when they received digital literacy instruction, they felt that they could then apply
these new skills.

126
Challenged by lack of digital literacy skills. During the interviews performed
for this study it became apparent that students were not only concerned about creating
proper citations but that other digital literacy skills were challenging to them as well.
Finding appropriate sources was one of the main challenges students discussed. Several
students talked about how, prior to the innovation unit, they had used general Google
searches to find information for their projects and research reports. For example, Pablo in
his interview stated that “I used to have to Google things but y'all taught me like the links
[SC Discus].” Likewise, Elisa stated that before, “when we did like the, who, what, why,
when and where stuff, I had trouble finding it.” Additionally, John mentioned several
times during the interview that he had difficulties finding information that he could read
and understand. When asked specifically if he had challenges before he stated, “Oh, yes, I
had challenges of finding the right information that was kid friendly.” Through digital
literacy instruction, this challenge was eased because students were taught how to use
reading level limiters within scholarly databases to locate information written on their
reading level.
Besides having trouble finding information written on a level that a sixth-grade
student could read and understand, one student indicated that searches prior to instruction
were often not reliable. When asked if there had been changes in his ability to find
suitable information after learning digital literacy skills, Casy stated, “Yes. I can get more
information to make sure it's not a site that's off whack, and not telling you real answers.”
This was because during the innovation unit, students were taught how to look at the
URLs of webpages to determine if the websites were maintained by education,
government, or nonprofit organization and therefore more reliable. An additional

127
example of how learning digital literacy helped reduce students’ challenges in finding
relevant information was seen when Elisa was asked if she felt more confident using
digital literacy skills after instruction. She stated the following:
Oh, like 10 out of 10. I'm so confident of what I read because of the thing that
they have at the end of it. Like, I know not .com because that can just be opinions,
but to use like .org. Like, I know now to look at the very end.
Here, Elisa is describing using the URL to determine the possible purpose of a website as
a means of discovering bias. In this statement, Elisa is relating how confident she is about
using the URL of a website to decide if the site is from a company (.com), an
organization (.org), a network (.net), a government institution (.gov), or an educational
institution (.edu). If the site is from an organization or a government/educational
institution then Elisa feels confident she can trust it.
In addition to students using general internet sources, students were also taught
how to locate reliable and scholarly sources through SC Discus, a South Carolina State
Library union database of safe and reliable online information sources. Elisa described
how using this database helped her find better information saying, “when you helped me
find new articles and like new websites to like, find new things, it was a lot easier.” All
in all, data indicated that students felt like they had more and better information available
to them after learning how to use digital literacy skills and tools. Moreover, the data
collected from student interviews showed that students perceived that the digital literacy
instruction they received during their innovation social studies unit made them more
aware of how to avoid plagiarism, gave them the tools necessary to locate relevant and
reliable information, and provided material written on their reading level.

128
Awareness of the Benefits of Digital Literacy
The second category for the first theme in this study was defined as students’
perceptions of the benefits that digital literacy instruction will have on their future classes
and on their adult lives as productive and contributing members of society. Again,
research based on students’ awareness and beliefs concerning the benefits of digital
literacy instruction is scant. Nevertheless, the data collected for the qualitative portion of
this study revealed that students recognize digital literacy instruction will help them be
more successful now in other classes, as well as in their future studies and ultimately in
their future jobs.
One example of a code that supported this category was related to how students
were using and transferring their new digital literacy skills to other current classes. The
code was “Have used DL resources in other classes and on other projects.” Here, the
student Pablo, when speaking of Prezi, a new online collaborative tool he learned to use
during the innovation unit, said “I use that tool now to make presentations for other
stuff.” Other codes that contributed to this category dealt with what students perceived as
the future benefits of digital literacy instruction. For example, John stated, “I think it will
help really good because you introduced us into new websites and we have the ability to
bookmark them and visit them anytime we want.” Likewise, when asked why his
feelings had changed toward digital literacy instruction, John’s reply was “because you
introduced me in our class to new websites that we can use for like presentations,
business, whatever in our free time and work in our future lives.” An additional comment
made by Cathy also illustrated this point when she stated simply, “[digital literacy] will
help with projects.” These comments gathered from student interviews indicated that

129
students perceived receiving digital literacy instruction within the context of social
studies would benefit them in the future, both academically and in their future lives.
Summary
Although a great deal of research has shown that digital literacy instruction is
necessary for students (Bejaković & Mrnjavac, 2020; Karnoe et al., 2018; Martzoukou &
Elliott, 2016), research on students’ perceptions of this instruction is scarce. Based on the
qualitative data gathered for this study, the first theme identified that students perceive,
understand, and recognize that digital literacy taught within the context of a social studies
unit improved not only their awareness of the necessity for having good digital literacy
skills but also improved their abilities using these skills. Prior to the innovation unit,
students’ citation abilities were limited or, in some cases, they did not know that they
were plagiarizing, but after instruction they felt more able to create and use citations.
Likewise, before digital literacy instruction was infused into academic content, their
ability to search for and identify relevant, reliable sources was limited. Qualitative data
analysis revealed that after digital literacy instruction, students were more able to apply
digital literacy skills and felt that they had benefited from the instruction. They believed
that the benefits of digital literacy instruction would carry over into future classes and
their adult lives.
Theme 2: Students perceived that co-teaching supported their learning in the social
studies class.
The second theme that emerged from the qualitative analysis in this study was
that students perceived co-teaching supported their learning in the social studies class.
According to Kammer et al. (2021), numerous studies concerning the benefits of co-

130
teaching and having two teachers, specifically a content teacher and a librarian, in a
classroom exist. In point of fact, research has shown that not only do students become
more engaged in the content being taught but also their academic achievement increases
(AASL, 2018b; King, 2019; Loertscher, 2000; Lowe, et al., 2020; Montiel-Overall &
Grimes, 2013). However, for this study, Theme 2 concerns students’ perceptions of the
benefits of coteaching, which has been the focus of fewer studies (Anwar et al., 2021).
This limited research has shown that students perceive they are more engaged in
classroom activities and content when there are two teachers (Anwar et al., 2021).
Consequently, the first category that Theme 2 was derived from, “engagement
increased during co-teaching,” has research that supports the findings (AASL, 2018b;
King, 2019; Loertscher, 2000; Lowe, et al., 2020; Montiel-Overall & Grimes, 2013).
However, the last two categories that Theme 2 subsumed, “exposed to broader range of
perspectives and knowledge” and “pace with two teachers,” appear to be unique to this
study in that related research did not present itself. This theme is comprised of the
following categories: (a) engagement increased during co-teaching, (b) exposed to
broader range of perspectives and knowledge, and (c) pace with two teachers.
Engagement Increased During Co-teaching
The category “engagement increased during co-teaching” was defined as students
reporting or discussing their affective engagement during the innovation unit compared to
traditional classroom experiences because of the presence of the of two-teachers. As
discussed in previous chapters, classroom engagement is the deep intellectual connection
that occurs when students are thoroughly interested in the academic content which is
identifiable by student behaviors such as questioning, sustained effort on challenging

131
projects, reviewing, reading ahead, and researching outside sources not only for academic
reasons but personal ones as well (Greene, 2015; Lowe et al., 2020; Sadaf & Gezer,
2020; Sesmiyanti, 2016; Wallace-Spurgin, 2020). Research supports the category
“engagement increased during co-teaching” in that studies have found students are more
engaged when a teacher and a librarian collaborate and co-teach lessons (Maharaj, 2015;
McPherson & Dubé, 2016). For example, Kammer et al. (2021), in their qualitative
meta-analysis concerning teacher and librarian collaboration found “that student
engagement increased as a result of the strategies implemented during the collaboration”
(p. 13) in all the studies they analyzed. This category was derived from the pattern codes
“inclusion of librarian increased interest” and “engagement and social studies more
interesting because of co-teaching,” both of which, for the purposes of defining this
category, accept that when a student is interested in a topic or situation they are more
affectively engaged, defined by Wang et al. (2014) as “experiencing enjoyment or
interest in the learning activities” (p. 531).
Inclusion of librarian increased interest and engagement. This pattern code
was defined as instances where students specifically mentioned the librarian as a reason
for why they were more interested and engaged in the content and classroom activities.
For example, one student, Rosa, when asked about her experience during co-teaching
stated, “I enjoyed it, when you teach. Because it was, it was cool to hear you teach and
hear all that you came to tell us.” This student went on to say, “Hearing all you knew
compared to like sometimes she wouldn't know some things you were talking about so it
was like cool to hear some other things." Another student, George, when asked about his
experience during co-teaching and why he paid more attention in class stated, “Uh,

132
because mainly because of the stuff that you were teaching was pretty interesting,
honestly.” Moreover, two out of eight students who participated in the interviews for this
study claim specifically that their engagement increased during co-teaching not just
because of two teachers, but specifically due to the inclusion of the librarian. However,
one student, Cathy, indicated during her interview that the inclusion of an additional
teacher, specifically the individual librarian, made the class more boring. In all, seven
out of the eight students claimed that their engagement increased because of two teachers
thus reinforcing the part of Theme 2 concerning how students perceived the presence of
two teachers increased their engagement.
Social studies more interesting because of co-teaching. This pattern code was
defined through data in which students expressed increased interest in social studies
specifically because of co-teaching not the inclusion of digital literacy instruction.
Qualitative data gleaned to form this pattern code were found throughout student
interviews. One example was when John stated simply, “I was more interested in learning
about social studies…because the co-teaching made it more funner.” When asked why
he thought co-teaching made class fun, John replied, “Because it's two teachers that I
know and they're both really good. I think that the co-teaching was excellent.” Another
example was seen when Dora said, “Well, I've paid more attention to social studies when
we were doing social studies in class. Um, um, because [co-teaching] made it more
interesting.” Additionally, when this student was asked to elaborate on this comment, she
said, “I pay more attention, when I'm interested in it and I want to learn more.” This was
an important statement because it linked paying attention to personal interest which spoke
directly to Wang et al.’s (2014) description of Affective Engagement (AE) described as

133
“experiencing enjoyment or interest in the learning activities” (p. 531). Likewise, the
student Casy connected learning with personal interest saying that “I remember [new
information] like, if it's so interesting.” These examples illustrate that students found
social studies as an academic subject more interesting because of co-teaching.
Exposed to Broader Range of Perspectives and Knowledge
This category was derived from qualitative data concerning how co-teaching
provided students with the knowledge and ideas of two separate education professionals
in one classroom. This category is supported by Montiel-Overall’s (2005) seminal work
about librarian and teacher collaboration whereby the research shows students benefit
because “each collaborator brings to the process their expertise in the subject content,
knowledge of standards to be included in instruction, methodology, research process,
writing process, etc.” (p. 15). Interview data showed that students recognized and enjoyed
this broader range of perspectives and knowledge afforded them through co-teaching.
Resources of two teachers contribute to learning. The code “Resources of two
teachers contribute to learning” is defined by qualitative data gathered from student
interviews whereby students discussed their ideas about having two separate teachers
available to help and teach them at the same time. One student, Pablo, when asked how
he felt about the co-teaching unit replied that because there were two teachers “I had
more questions about things because I found out more.” Another student, Elisa,
commented that “I feel like when it was just Mrs. Steinbeck, I learned a lot less because
she was trying to get everything done instead of asking questions.” Elisa expounded on
this with the following statement:

134
I was learning more information that I really, really wanted to know. And like,
um, so you would say something and then Mrs. Steinbeck would say another
whole another thing. And I just learned a lot more.
Here Elisa was talking about how she was very interested in the topic that was being
taught and how when each teacher provided information about that topic from a different
perspective she felt like she learned more.
Likewise, Elisa, when asked how she felt about co-teaching she replied that “Um,
it was good, because I got help from two different people and two different perspectives.”
Another student, John, when asked if he liked the co-teaching set up replied, “yes”
because with “co-teaching, you had the ability of two teachers.” Another example is
when Dora, when asked if she like the co-teaching setup replied, “yes, pretty good
because I got help from both of you.” These comments directly addressed the fact that
students felt having two teachers exposed them to a broader range of knowledge.
Teacher experiences and interactions created stimulating learning
environment. This code is defined by comments students made concerning how the
interaction between two teachers from two separate disciplines made a more interesting
classroom environment. An example of how the interaction between two teachers was
stimulating to students is seen when Elisa stated that it was “interesting to hear about
different things from different teachers. Um, I liked it because y'all gave each other ideas
of what to do like to teach in class.” Elisa went on to say the following:
When it was both y'all [teaching], you like we're talking, and she asked questions
like a student, and I feel like that was just a lot more fun. Like it just got my
attention and gave a lot more information.

135
Here Elisa was talking about how when the librarian was teaching about different
resources like the Vatican website or visiting the palace of Versailles, she (the librarian)
also shared her personal experiences about her physical visits to these places. Elisa was
excited to hear the collaborating teacher ask questions about the places and the different
experiences that these historical places offer both online and in person. Casy also
commented that he enjoyed being in a class with two teachers working together. As
evidence of this he said, “I liked it [the co-teaching set-up] because I learned a lot cuz
both of y'all are working together… and both y'all teachers work really good together. I
had more interest. So, I had more ideas to what y'all said.” These comments indicate that
students enjoyed the interplay between the two teachers and found that these interactions
increased interest in the subjects.
Pace with Two Teachers
This category was derived from pattern codes where students discussed how they
enjoyed class and remained engaged with two teachers teaching because there was no
down-time. During co-teaching, the pace of the class was considerably accelerated
because two separate types of academic content were being presented to students during
one forty-five-minute class period. To illustrate how the qualitative data revealed that the
pace of the class kept students more engaged, one student, Elisa, when asked why she
liked co-teaching made the following comment:
Because, um, it was two people talking about one whole thing. Like they could
like talk about it like really quickly back and forth instead of one person, one
teacher, just talking about it like slowly and trying to like handle the whole class

136
from not like zoning out. When it was just Mrs. Steinbeck people were like
zoning off and it distracted me.
In this statement, Elisa was discussing how the classroom teacher would make a point
and then the librarian would immediately follow up on that point with an illustration or
demonstration of where more information could be found online. Elisa is saying that this
set-up left no time for students to become disengaged. Likewise, another student, George,
also indicated that the pace of the class kept him focused. He stated during co-teaching he
experienced “less of the mind wandering the entire time that you two were teaching
together because there's so much information about it that once you two were actually
done, my mind couldn't wander. I immediately had to start working.” This need to
immediately start working came from the fact that once class discussions and whole
group teaching about both social studies and digital literacy ended students needed to
complete their online work quickly before the end of class.
Although several students talked about how they enjoyed the accelerated pace of
the class, one student, Pablo, reported being disconcerted in the beginning when the co-
teaching innovation unit started. Pablo remarked that at first, he was overwhelmed by so
much information being presented, but then he said, “I got used to it. I found out that it's
okay….I got more focused because all the facts and stuff was interesting.” This statement
showed that once Pablo got accustomed to co-teaching, he enjoyed the faster pace
because it kept him engaged. On the other hand, another student, Cathy, never got
accustomed to the co-teaching situation and indicated that the class was “boring” because
of having two teachers, especially the librarian. However, Cathy did say, “social studies,
it’s not like my favorite, but um, uh I don’t really understand social studies that much.”

137
This statement indicated that Cathy did not like or understand social studies initially even
before co-teaching.
Summary
The second theme that emerged from the qualitative analysis for this study was
students perceived that co-teaching supported their learning in the social studies class.
Data revealed the inclusion of the librarian was a factor that contributed to their increased
interest and engagement in class, which helped support their learning. In addition,
students perceived social studies to be more interesting because of the presence of two
teachers. Students also found that they were exposed to a broader range of perspectives
and knowledge during co-teaching. Having two teachers provided a situation where
students’ questions could be answered quickly, which students found increased their
engagement. Furthermore, data revealed the interaction between the teachers from their
unique disciplines made the classroom more interesting and stimulating. Finally, students
indicated that the faster pace of a co-taught class kept them engaged and interested by not
allowing time for their thoughts to wander.
Theme 3: Combining digital literacy instruction and social studies made social
studies more engaging.
Research has shown that infusing digital literacy instruction into academic content
helps students learn digital literacy skills and increases students’ overall academic
success (Gretter & Yadav, 2016; Ward, 2019). Likewise, student engagement, which
occurs when a student is deeply interested in academic content, has been linked through
extensive research to students’ academic success (Fredericks et al., 2004; Greene, 2015;
Sesmiyanti, 2016; Wallace-Spurgin, 2020). Little research, however, has been conducted

138
on how teaching digital literacy skills within a subject affects student engagement with
that subject. This is an important concept because if teaching digital literacy within a
subject makes that subject more interesting, then it follows that students will become
more engaged in that subject, thus increasing academic success in that subject. For this
reason, Theme 3 focused on qualitative data gathered concerning the effects that teaching
digital literacy within social studies had on students’ interest in social studies and
included the categories (a) social studies more interesting because of digital literacy
instruction and (b) like social studies but sometimes it is boring.
Social Studies More Interesting Because of Digital Literacy Instruction
The category “social studies more interesting because of digital literacy
instruction” was defined as students indicating social studies and digital literacy
instruction work well together and that they were more interested in social studies
because of the inclusion of the specific digital literacy skills that they were learning. The
definition of this category came from pattern codes that were subsumed by it, which were
“social studies and digital literacy instruction work well together” and “paraphrasing
made historical content more understandable/research increased interest.” This category
speaks directly to how mixing digital literacy instruction and social studies can increase
student engagement.
Social studies and digital literacy work well together. This code was
developed through qualitative data analysis that revealed students’ perceptions of
combining digital literacy instruction and social studies instruction. During the interview
process, students were asked to describe how they felt about combining the two subjects.
Most students said that digital literacy and social studies work well together. For

139
example, John stated, “those subjects really work good together.” Likewise, when Elisa
was asked about combining digital literacy and social studies, she replied, “so, it just
combines some of my two favorite things and it's just really fun to do.” George
commented that he thought social studies was more interesting because he was able to
research a topic he was specifically interested in, Japanese Feudalism, and then do a
presentation about it. He stated, “I think [digital literacy instruction] made [social studies]
more interesting because if we were just learning about, um, social studies, then we
probably wouldn't be doing a Prezi.” These statements indicated that students thought the
subjects worked well together and learning digital literacy skills enhanced their interest in
social studies.
Paraphrasing made historical content more understandable/research
increased interest. This code subsumed codes relating to how learning and applying
digital literacy skills increased students understanding of social studies topics and gave
them access to more personally interesting information. For example, during her
interview, Dora described how the process of paraphrasing information so she would not
just copy and paste text helped her understand the social studies content better. She said,
“when, um, the way you helped us learn it like paragraph - like paraphrasing- and like,
put the words in our own words, it made me like understand it more and like be more
interested in it.” Similarly, Pablo explained that he was more interested in social studies
because he had learned how to use SC Discus to find more and better sources than just
Google. He said, “I was more interested because I could find new things.” Based on the
data collected from this study, the new knowledge of how to paraphrase text and how to

140
find more high-quality sources caused an increase in these students' interest in social
studies.
Likes Social Studies But Sometimes it is Boring
This category was defined by examples within the qualitative data where students
talked about liking social studies as an academic subject but that the class and content
were sometimes boring. The pattern codes that were incorporated together to create this
category were “like learning about people from other time periods” and “social studies
sometimes boring.” This category emphasizes that although students claim they enjoy
learning about history they sometimes become bored and thus disengaged when it is
taught in isolation. Coupled with the previous category, “social studies more interesting
because of digital literacy instruction,” this category shows why mixing digital literacy
instruction and social studies can increase student engagement.
Like learning about people from other time periods. Comments students made
during the interviews clearly indicated that they liked social studies. For example, Elisa
said, “I really like social studies because it teaches us about like what happened in the
past and what, how much we changed.” Similarly, Pablo stated in his interview, “I like it.
I like doing, like learning about new people that were back in the old ages.” An additional
example of how students claimed to like history came from Casy when he said, “I like
social studies. I like because I like the history of different, like all the stuff, like
medieval.” Another student, George, specifically talked about how he liked the Medieval
Era. He explained that there was so much to learn from the time period, “The Middle
Ages because of the how broad that is, it is like there's so many things.” John also talked
about how he liked social studies saying, “I feel social studies is a really great subject

141
because kids can learn about like the Native Americans and other things and do fun
projects.” All but one of the students, Cathy, who participated in the qualitative data
collection for this study said that they enjoyed learning about history.
Social studies sometimes boring. This code was defined by instances where
students talked about how social studies could become tedious. The one student, Cathy,
out of eight who said she did not like social studies said the reason why was “because
social studies is so boring.” In contrast, George talked about how although he really liked
social studies, his mind often wandered. He said, “like, um, every now and then, like my
mind, like I'm staring somewhere and it's like, I'm just stuck in my head. It's just me
sitting there and like thinking about stuff.” An additional example was seen when Rosa
said, “social studies, I enjoy it, but sometimes all we get is boring. But most of the time I
enjoy it.” An additional example was found when the student Dora was asked if she
enjoyed learning about social studies with digital literacy, she replied, “yes, it made
social studies less boring because it was more interesting.” In short, qualitative data
analysis revealed that although seven out of the eight of the students interviewed for this
study enjoy social studies when it is taught in isolation, four out of eight said that it was
sometimes boring.
Summary
The third theme that emerged through the qualitative analysis of data collected for
this study found combining digital literacy instruction and social studies made social
studies more engaging for students. Data revealed that students feel digital literacy and
social studies work well together. Furthermore, applying skills learned during digital
literacy instruction made social studies more understandable and interesting. Data also

142
revealed that students enjoy learning about the past, but social studies class is sometimes
unexciting. However, when digital literacy was infused into social studies content, social
studies was more interesting and engaging to students.
Chapter Summary
This mixed methods action research study utilized qualitative and quantitative
data to investigate the impact of co-teaching involving a school librarian and a social
studies teacher on sixth-grade students’ summative unit projects, classroom engagement,
and digital literacy skills. Quantitative data were collected using three instruments. The
first was the Classroom Engagement Inventory administered to 47 students before the
innovation unit and then during the innovation unit. The second quantitative instrument
was the Online Digital Literacy Assessment administered to 45 students before the
innovation unit and then after the innovation unit. The third instrument was the schools’
standard social studies unit project rubric which was used to grade 25 students’ pre-
innovation projects and students’ innovation unit projects. When taken together,
quantitative analysis revealed that students’ classroom engagement increased during the
innovation unit, students scored higher on their post-innovation digital literacy
assessments, and students social studies projects for the innovation unit were higher than
the pre-innovation unit.
Qualitative data were collected through the analysis of eight student participant
interviews. The qualitative analysis revealed three themes: (a) students perceived
bringing digital literacy into social studies content improved their awareness of and skills
in digital literacy, (b) students perceived that co-teaching supported their learning in the
social studies class, and (c) combining digital literacy instruction and social studies made

143
social studies more engaging. The qualitative and quantitative findings were combined in
order to answer the research questions for this study.

144
CHAPTER 5
DISCUSSION, IMPLICATIONS, AND LIMITATIONN
The purpose of this mixed methods action research study was to investigate the
impact of collaborative teaching involving a school librarian (i.e., the researcher) and a
social studies teacher on sixth-grade students’ summative unit projects, classroom
engagement, and digital literacy skills. Quantitative data were collected using three
separate instruments prior to the innovation unit when the collaborating teacher was
teaching alone. These three instruments were then used again at or near the end of the of
the innovation unit when the school librarian and the collaborating teacher were co-
teaching digital literacy skills infused into the social studies content. The first of these
instruments, the CEI, gathered data concerning students’ classroom engagement during
the pre-innovation unit and the again during the innovation unit. The second instrument,
the ODLA, gathered data on students’ digital literacy skills before and after the
innovation unit. Finally, the third quantitative instrument used for this study, the Social
Studies Project Rubric, was the school designed social studies project rubric that was
used to grade students’ end of unit projects for both the pre-innovation unit and then
again for the innovation unit projects.
After all the quantitative data were collected from the CEI, ODLA, and the Social
Studies Project Rubric, the students’ combined total gains from the above-described
instruments were calculated and eight students were purposely selected to participate in
semi-structured interviews that yielded the qualitative data for this study. The students’

145
pre-innovation and post-innovation scores from the classroom engagement survey, digital
literacy skills test, their social studies project grades and the interview were analyzed to
answer the following research questions: 1) How does co-teaching instruction that
integrates digital literacy and social studies content influence sixth-grade students’
performance on social studies unit projects?, 2) What are the effects of co-teaching
instruction that integrates digital literacy and social studies content on student
engagement in the social studies content?, and 3) What are the effects of co-teaching
instruction that integrates digital literacy and social studies content on six-grade students’
level of digital literacy? This chapter combines the quantitative and qualitative findings
from this study and draws connections with existing research within the following
discussion, implications, and limitations sections.
Discussion
In order to answer the research questions, quantitative and qualitative findings
from this study were combined. These findings were then connected to the larger body of
previous research concerning the effects that co-teaching digital literacy skills infused
into academic content has on students’ classroom engagement, digital literacy skills, and
social studies projects. This study’s findings and the connecting research are based on the
need for students to acquire digital literacy skills in order to prepare them for a future that
is productive, safe, and rewarding. By infusing the instruction of digital literacy skills
into academic content by means of co-teaching, this study aimed to discover possible
academic benefits beyond increased competency with digital literacy skills. These
possible benefits related directly to the three research questions that guided this study.

146
The discussion of the findings and related research are organized according to the
research questions in the following section.
Research Questions 1: How does co-teaching instruction that integrates digital
literacy and social studies content influence sixth-grade students’ performance on
social studies unit projects?
Through the findings of this study, it was revealed that students performed better
and made higher grades on their summative social studies unit projects when the unit
combined digital literacy instruction infused into the content and the unit was taught
collaboratively by a librarian and a social studies content teacher. The data that were
analyzed to reveal this finding came from the Social Studies Project Rubric used across
all 6th Grade social studies classes within the school district to assess student learning at
the end of each social studies unit. The Social Studies Project Rubric has three
components and applies a numerical grade to each. Students are graded on social studies
content which has a total of 60 possible points, appearance and mechanics which has a
total of 14 possible points, and digital literacy skills which has a total of 26 possible
points. When all three component scores are added together the rubric has a total of 100
possible points. Pre-innovation and post-innovation unit project rubric scores were
analyzed using descriptive and inferential statistics separating the three components, i.e.,
social studies content, appearance and mechanics, and digital literacy skills, into
subscales, to determine if there was a change between the scores from the pre-innovation
unit and the innovation unit.
Quantitative data analysis revealed that the social studies content scores for the
pre-innovation projects were significantly lower than the mean content scores for the

147
innovation unit. Likewise, the appearance and mechanics scores for the pre-innovation
project were also significantly lower than those for the innovation unit. Additionally, the
digital literacy skills scores for the pre-innovation project were significantly lower than
the post-innovation unit. With all the subscales combined, students’ total scores for the
pre-innovation unit projects were significantly lower than their total score values for the
post-innovation unit. These finding show that students’ performance on their innovation
unit projects was significantly better than on their pre-innovation unit.
These quantitative findings can be explained through the qualitative data collected
for this study in two ways. First, student engagement has been linked to increased student
success (Perry & Steck, 2015). Both Themes 2 and 3 that emerged from the qualitative
data analysis of this study indicated that students felt more engaged during the innovation
unit compared to the pre-innovation unit. Theme 2 related to the fact that having two
teachers increased engagement, while Theme 3 directly related to how mixing digital
literacy instruction into social studies content made social studies more engaging. These
two findings when combined indicate that students were more engaged which led to
success on the content portion of the grading rubric.
The second way that the quantitative findings for this study can be explained
through the qualitative data arises from Theme 1 of this study. Theme 1 involved
students’ perceptions of the benefits of digital literacy instruction taught within the
context of social studies in that they felt bringing digital literacy into social studies
improved their awareness of digital literacy skills and the need to be digitally literate.
Data revealed that students felt more able to apply digital literacy skills on the final
project for the innovation unit because they had been taught how to use these skills. On

148
the project rubric, using digital literacy skills appropriately was worth a total of 26 points.
Students lost most of these 26 points on the pre-innovation unit because they were not
using appropriate sources, citing their sources, or because the citations were incorrectly
done. The instruction during the innovation unit helped with this. For example, Pablo said
that “before, I wasn't like doing all the stuff, but now I am more confident. I know what
to do now.” Pablo was talking about using citations in this statement. When he was
taught how to create and use citations his innovation project received full points for
citations.
Taken together the quantitative data collected from this study illustrated that
students’ scores on their post-innovation social studies projects were significantly higher
while the qualitative data helped to explain the reason why, which was because the
students were more engaged and had a better understanding of how to use digital literacy
skills. These findings thus indicated that co-teaching instruction that integrates digital
literacy and social studies content positively influenced sixth-grade students’
performance on social studies unit projects.
This study’s findings are consistent with those found in related literature in that
studies have shown that students experience greater academic success when they are
taught digital literacy skills and academic content together in a collaborative environment
where a librarian and a content teacher co-teach (Gretter & Yadav, 2016; Latham et al.,
2013; Lee et al., 2017; Lowe et al., 2020; Ward, 2019). However, this existing literature
mostly focuses on students’ overall academic success not specifically unit project
success. Nevertheless, Chu (2009) conducted a study that focused on students’ unit
project success as a result of librarian and teacher collaboration. Chu’s (2009) research

149
produced similar findings to this study in that students were significantly more successful
on their unit projects.
Research Questions 2: What are the effects of co-teaching instruction that integrates
digital literacy and social studies content on student engagement in the social studies
content?
Through the findings of this research study, it was revealed that students report
higher classroom engagement when they receive instruction that integrates digital literacy
and social studies content taught collaboratively by a librarian and social studies content
teacher. This study’s findings are connected to previous research concerning co-teaching
between a teacher and a librarian on integrated lessons found in many works that support
the American Library Association’s (2017, 2019) and the International Society for
Technology in Education’s (2018) national and international standards. In point of fact,
the studies by Maharaj (2015) and McPherson and Dubé (2016) revealed that students
become more engaged and thus comprehend more of the information being taught when
librarians and teachers co-teach. Likewise, additional studies not only link co-teaching
between a teacher and a librarian on integrated lessons to student engagement but also
these studies have shown that these types of teaching and learning environments
contribute significantly to students’ greater overall academic success (AASL, 2018b;
King, 2019; Loertscher, 2000; Lowe, et al., 2020; Montiel-Overall & Grimes, 2013).
For this study, however, the research questions were aimed not at students’
greater overall academic success but at increasing students’ success digital literacy skills
and social studies learning through increased classroom engagement. The following

150
section includes the quantitative findings, the qualitative findings, and a discussion on
how their combined analysis provides insight into students’ classroom engagement.
The quantitative data analyzed to answer Research Question 2 came from the
Classroom Engagement Inventory (CEI) administered to students during the pre-
innovation unit and then again during the innovation unit. The Classroom Engagement
Inventory (CEI) was an online questionnaire designed to measure students’ engagement
in five separate domains. These engagement domains are Affective Engagement (AE),
Behavioral Engagement Compliance (BEC), Behavioral Engagement Effort (BEE),
Cognitive Engagement (CE), and Disengagement (DE). Descriptive and inferential
statistical analysis were used to analyze data collected from the pre-innovation and post-
innovation CEI scores. When descriptive statistical analysis was applied to the data,
students' pre-innovation mean scores for all subscales were lower than their innovation
unit mean scores. This indicated that the co-taught unit with social studies and digital
literacy skills combined improved students’ affective, cognitive, and behavioral
engagement. These findings are consistent with the findings from related literature
concerning student engagement and academic success when a teacher and a librarian co-
teach integrated lessons (Kammer et al., 2021; King, 2019; Loertscher, 2000; Lowe, et
al., 2020; Maharaj, 2015; McPherson & Dubé, 2016; Montiel-Overall & Grimes, 2013).
The qualitative data used to reveal the finding for Research Question 2 came from
the analysis of eight semi-structured interviews that produced themes. Within Theme 2,
i.e., students perceived that co-teaching supported their learning in the social studies
class, numerous incidences occurred were students indicated that they knew that they
were more engaged in the classroom activities and the subject matter because of the

151
presence specifically of the librarian and the co-teacher and how the two teachers’
working relationship created a more exciting and dynamic atmosphere. Consequently,
Anwar et al. (2021) found similar results in their study revealing that students perceived
they were more engaged in classroom activities and content when there were two
teachers. Regardless of whether students perceive the benefits of co-teaching or just
simply benefit from the practice of co-teaching, qualitative findings for this study
indicated that students were more engaged because of the co-teaching set-up.
There were several factors that came to light concerning the reasons why having
two teachers, specifically the librarian and the content teacher, working collaboratively
increased student engagement during the innovation unit compared to traditional
classroom experiences. First, data from this study revealed that students perceive the
inclusion of the librarian as a factor that contributed to their increased interest and
engagement in class. For example, George commented that the reason he was more
engaged in the class was “mainly because of the stuff that you [the librarian] were
teaching was interesting, honestly.” A second factor revealed within the data was that the
subject of social studies was more engaging because of the co-teaching set up. A
comment by the student John is as an example of this where he said, “I was more
interested in learning about social studies… because the co-teaching made it more
funner.” In essence, the inclusion of the librarian as the second teacher in a co-teaching
set-up increased student engagement.
The reasons why students reported feeling more engaged in classroom activities
and the content because of the co-teaching set-up are an important finding for this study
in that few related research studies exists concerning specifically why co-teaching

152
increases student engagement in the content and classroom activities (Anwar, et al.,
2021). To that end, this study, through qualitative data analysis, revealed that having been
exposed to a broader range of perspectives and knowledge piqued students’ interest. For
example, the student Pablo, when he was asked why he was more engaged during the
innovation unit said, “because I had more questions about things because I found out
more.” This finding was supported by Montiel-Overall’s (2005) research concerning how
during co-teaching students benefit because they are exposed to broader range of
perspectives and knowledge.
An additional reason students gave for being more engaged during the innovation
unit was the interaction between the teachers from their unique disciplines’ perspectives
which made the classroom more interesting and stimulating. One example of how a
student explained this idea was when the student Elisa stated, the following:
It was interesting to hear about different things from different teachers. Um, I
liked it because y'all gave each other ideas of what to do like to teach in class….
When it was both y'all, you like were talking, and she asked questions like a
student, and I feel like that was just a lot more fun. Like it just got my attention
and gave a lot more information.
This statement helped clarify that the reason why she was more engaged during the
innovation unit was the interplay between two teachers from separate disciplines which
made the classroom environment more stimulating.
The pace of the class during the innovation unit was another factor that came to
light concerning why students felt more engaged in the content and classroom activities.
Students reported that because they were having to learn the content from two subject

153
areas and from two teachers during one 45-minute class period, there was no time for
them to become bored or disengaged. The student George gave an example of this with
the following statement:
I had less of the mind wandering the entire time that you two were teaching
together because there's so much information about it that once you two were
actually done, my mind couldn't wander. I immediately had to start working.
Because of coteaching, students perceived that the pace of the class during the innovation
unit was accelerated and that this faster pace kept them focused, engaged, and interested
by not allowing them time for their thoughts to wander.
In addition to how co-teaching affects student engagement, the effects that mixing
the two content areas have on student engagement also provided insight into how the
innovation unit helped students experience overall increased engagement. As mentioned
earlier, previous research has shown that combining digital literacy instruction with
academic content helps students learn digital literacy skills and increases students’
overall academic success (Gretter & Yadav, 2016; Ward, 2019). Likewise, student
engagement in academic content has been related to students’ academic success
(Fredericks et al., 2004; Greene, 2015; Sesmiyanti, 2016; Wallace-Spurgin, 2020).
However, existing research about how teaching digital literacy skills within a subject
affects student engagement with that subject is limited. This is a significant shortcoming
in the existing literature in that if teaching digital literacy within a subject makes that
subject more interesting then it follows that students will become more engaged, and
therefore ultimately more academically successful within that particular subject.
Consequently, this study did make the connection that the academic content (i.e., social

154
studies) was made more interesting and thus more engaging to students because of the
inclusion of digital literacy instruction. These findings were revealed through the third
theme that emerged from the qualitative data analysis showing that digital literacy
instruction and social studies made social studies more engaging.
Several examples from the data provided evidence for this finding. One example
is seen when the student George said he thought social studies was more interesting
because he was able to apply digital literacy skills he was learning during the innovation
unit to research and then create a presentation about a topic he was personally interested.
His statement “I think [digital literacy instruction] made it more interesting because if we
were just learning about um, social studies, then we probably wouldn't be doing a Prezi.”
Likewise, learning how to paraphrase helped students become more engaged in social
studies. Evidence of this was found when the student Dora stated: “When, um the way
you helped us learn it like paragraph - like paraphrasing- and like, put the words in our
own words, it made me like understand it more and like be more interested in it.” Another
example of how learning digital literacy skills, specifically learning about finding
appropriate, relevant, and reliable research sources, made social studies more interesting
and engaging for students was seen when the student Pablo said he was more interested
in social studies because he had learned how to use SC Discus to find more and better
sources than just Google.
In order to fully address Research Question 2 both the quantitative findings from
the Classroom Engagement Inventory and the qualitative findings from the student
interviews needed to be merged. For this study, the quantitative data provided the degree
to which student engagement increased during the innovation unit and the qualitative data

155
explained why the students were more engaged. Further, two different factors came into
play when analyzing the data for this study. One factor was the effects on engagement
that mixing the two subjects might have had on student engagement, and the other was
the effects that having to two teachers might have had on engagement. As discussed
earlier, related literature has shown that having a librarian and an academic teacher co-
teach together increases classroom engagement (Maharaj, 2015; McPherson & Dubé,
2016), but why this is so needs exploration.
Through the merging of the qualitative and quantitative data collected in this
study, findings not only show that students do, indeed, experience greater classroom
engagement when they receive instruction that integrates digital literacy and social
studies content taught collaboratively by a librarian and social studies content teacher, but
also suggest the answer as to why this is so. Quantitative data from the CEI showed an
increase in students’ classroom engagement during the innovation. Qualitative data
revealed that not only did students experience increased classroom engagement but also
revealed that the reason why they were more engaged had to do with the pace of the
class, the dynamic interplay between the two teachers involved, the additional
perspectives involved in having two teachers from two disciplines available, and the
additional help and assistance they received. Further, it was revealed that digital literacy
instruction increased students' engagement in the social studies content by providing
students access to more interesting and engaging academic content. The findings for this
study indeed suggest that students were more interested and engaged in social studies
because digital literacy skills were being taught.

156
Research Questions 3: What are the effects of co-teaching instruction that integrates
digital literacy and social studies content on six-grade students’ level of digital
literacy?
The Online Digital Literacy Assessment (ODLA) is an instrument that was
designed to yield quantitative data for this study. It was administered as a pre-test before
the innovation unit and then again as a post-test at the end of the innovation unit.
Students average scores increased on the ODLA following the innovation. Although the
quantitative data analysis findings technically answered the research question, qualitative
findings help to provide a more complete understanding of students’ digital literacy
learning gains. The following section first describes the ODLA and the quantitative
findings it produced and then examines how Theme 1, which emerged for the qualitative
data analysis, relates to the quantitative findings.
The Online Digital Literacy Assessment (ODLA) for this study was an adaptation
of the TRAILS (Tool for Real-Time Assessment of Information Literacy Skills) Digital
Literacy Assessment developed by Kent State University (Kent State University
Libraries, 2019). According to Kent State University (2019b), the TRAILS assessment
has been used to assess the digital literacy skills of more that 2 million students. Further,
according to numerous studies, the TRAILS provided researchers and librarians with a
reliable tool that could be used to assess students’ digital literacy skills (Miller, 2016;
Morriston, 2007; Salam, 2014; Spisak, 2018). The TRAILS and, therefore, the adapted
ODLA used for this study was a select-response test used to assess students’ information
and digital literacy skills within five domains which concern 1) developing topics for
research, 2) identifying potential sources for research, 3) developing, using, and revising

157
search strategies during academic and personal research, 4) evaluate sources and
information during academic and personal research, and 5) using information
responsibly, ethically, and legally (Kent State Libraries, 2019).
Descriptive and inferential statistical analysis were performed on students’ pre-
innovation and post-innovation ODLA scores after they had had digital literacy
instruction that was infused into social studies content. The ODLA had five category
subsets for digital literacy mastery. When all the values for pre-innovation and post-
innovation subset means were combined the total post-innovation mean showed an
increase, although modest (M = .3911, SD = .11374), in students’ scores when compared
to the pre-innovation mean scores (M =.3653, SD =.11889). These findings revealed
instruction that integrates digital literacy and social studies content taught collaboratively
by a librarian and social studies content teacher helps to increase sixth-grade social
studies students’ performance on the ODLA.
Although Research Question 3 was answered using quantitative data collected
through the analysis of the ODLA, qualitative data analysis produced findings that relate
to students’ digital literacy skills, as well. Indeed, Theme 1 from the qualitative data
analyzed from students’ interviews uncovered that students perceived bringing digital
literacy into social studies content improved their skills in digital literacy. Indeed,
students recognize that having adequate digital literacy skills is important but find
mastering them challenging. This finding concerning mastering the skills being
challenging resounds throughout related literature (Crary, 2019; Dooley, 2016; Falloon,
2020; Shaw, 2017), and is the main reason why national and state education standards

158
have been established requiring digital literacy be taught by content teachers and
librarians in order to address this condition (AASL, 2017; ISTE, 2017; SCDE, 2017).
The qualitative data gathered from this study illustrated that prior to the
innovation unit, students lacked full awareness of digital literacy and how to apply the
skills. For example, students recognized that their ability to use citations was poor or they
had not known that they were had been plagiarizing. Further, their ability to search for
and identify relevant, reliable sources was limited. Qualitative data analysis revealed that
after digital literacy instruction, students were more able to use digital literacy skills and
felt that they had benefited from the instruction. One student, Casy, expressed how he
had made improvements because of digital literacy instruction citing his ODLA post-test
gains as evidence stating: “when I first took the test that we had taken in the first part, I
got a higher score by the other one.” Taken together, through the quantitative and
qualitative data analysis provided by this study, the findings indicated that students
perceived that teaching digital literacy skills infused into academic content improved
their awareness of digital literacy and their digital literacy skills.
Implications
The implications that arose from this action research study are threefold in that
they inform the practice of school librarianship as a whole, they inform my personal
practice as an educator, and they help to inform further research. Consequently, this
discussion of the implications for this study is divided into three sections. The first
section involves implications for practice, the second includes personal implications, and
the third section concerns implications for future research.

159
Implications for Practice
As mentioned throughout this document the purpose of this action research study
was to investigate the impact of collaborative teaching involving a school librarian and a
social studies teacher on sixth-grade students’ projects, classroom engagement, and
digital literacy skills. Through the literature reviewed for this study it was found that
students should be taught digital literacy so that they can effectively navigate all the
digital information available to them (ALA, 2017, 2019; ED, 2017; Johnston, 2015; Wray
& Mulvihill, 2018). Classroom teachers in South Carolina and indeed many other states
are required to teach digital literacy skills in their regular academic classes (ISTE, 2018;
SCDE, 2017), yet many of these teachers do not know what information and digital
literacy involves or they do not understand the necessity and benefits of teaching these
skills properly (Crary, 2019). Librarians understand this need and are trained to teach
digital literacy through collaboration with classroom teachers (ALA, 2017; Davies-
Hoffman, 2013; Dodson, 2020). Furthermore, when this collaboration does take place,
students have greater digital literacy gains and perform better academically (Lowe et al.,
2020). However, significant challenges exist that make it difficult for teacher and
librarian coteaching and collaboration to occur (Gwyer, 2018; Kammer et al., 2021;
Montiel-Overall, 2007; Witte et al., 2015). Research has shown that the remedy to these
challenges is increased support from school level administrations (Phillips & Lee, 2019),
shared planning times, and greater teacher awareness of how librarians can help (King,
2019; Mandrell, 2018; Montiel-Overall & Grimes, 2013; Spengler, 2015). So, in essence,
the true purpose of this study was to provide evidence to teachers and administrations that
when students are taught digital literacy skills within academic content and through the

160
collaboration of the teacher and the librarian, students become more engaged in the
academic content. When students become more engaged in the academic content they are
more academically successful which in turn increases their standardized test scores which
is one of the ultimate goals of most classroom teachers and school administrators (Gretter
& Yadav, 2016; Latham et al., 2013; Lee et al., 2017; Lowe et al., 2020; Ward, 2019;
Witte et al., 2015). In short, this study aimed to give librarians added impetus in their
struggle to convince administrators and teachers to let librarians help.
Consequently, the findings from this study show that when a librarian collaborates
with an academic content teacher and helps teach digital literacy skills within the context
of that content, students learn more because they are more engaged with the content, and
they learn more because of the skills that digital literacy instruction provides. These
findings have implications that effect all school librarians because they help shore up the
purpose of library standards that are present nationally and they add to existing literature
concerning both digital literacy instruction and teacher librarian collaboration. By
providing another study, one that not only found that students were more engaged in
content, but also was able to give insight into why that increased engagement in the
content might have occurred, this study has implications that might influence other
librarians to push harder to make collaborative partnerships in their schools more of a
reality.
School librarians in my district, in South Carolina, and across the nation have a
difficult time convincing their teachers and administrators that librarians are trained to
teach digital literacy through collaborative partnerships (Johnston, 2015; Luetkemeyer,

161
2017), and that the benefits far out way the complications. The findings from this study
when added to that of other researchers can help show these benefits.
Personal Implications
The findings and indeed the journey to the findings for this action research study
have several personal implications. The process of conducting research, my role as an
educator within the broader community and my plans for further research, and finally my
role and responsibility as the as the librarian in my school are all three part of the personal
implications that will be discussed within this section.
Process of Conducting Research
Although through other academic pursuits I had conducted some research, it was
never action research and it was never on this grand a scale. The process of conducting
action research for this study has given me the knowledge and skills needed to continue
forward as a practitioner researcher in my educational community. Further, this process
of conducting a mixed methods study has taught me how to conduct truly scholarly
quantitative and qualitative analysis, which were more complicated than I had imagined,
and I had already imagined that both were difficult.
Action research. Choosing action research was a means of finding a solution to a
problem that exists at my school. It was truly done for me by me to solve a problem that
is unique to my personal situation (Mertler, 2020). Having learned the action research
process through this study I am much more prepared to continue the cyclical process
started with this research and I am prepared to confront other difficulties that are or
become apparent in my professional settings. Likewise, I am now better prepared to assist
my colleagues with their own research endeavors.

162
Mixed methods study. Because this was a mixed method research study I have
learned how to combine data to provide a much clearer picture of findings. For example,
if I had only used quantitative data to analyze students’ classroom engagement during my
study I would never have found out the reasons why they were more engaged, such as
how the dynamic interaction between the two teachers made class more interesting.
Consequently, this was a significant finding for my study because in most other studies
concerning collaboration between librarians and teachers the focus is on how co-teaching
affects academic success (Maharaj, 2015; McPherson & Dubé, 2016), but not why,
during collaboritive efforts, students are more engaged. Realizing how important
combining quantitative and qualitative data has had a significant impact on how I will
conduct research in the future as I had mostly done quantitative research in the past.
Qualitative data analysis. As discussed earlier, I had had only a limited amount
of experience gathering and analyzing qualitative data. This study has helped me to
understand exactly how limited my previous experience was. Being able to have the
guidance and expertise of other researchers throughout this process has helped me
immensely. Learning about the Delve tool, coding, and developing themes the proper
way will help me in my future research as well as help me guide others in my
professional community who wish to conduct informal research.
All in all, besides learning how to combine data for mixed methods studies, this
action research process has taught me how I can contribute further to the broader
community through additional action research studies now that I understand the process.
It also has provided me with ideas on how I can recreate and improve this study and
continue the action research cycle.

163
Role as an Educator
As stated previously, now that I understand the process of action research I can
and will continue to seek out problems within my professional community that can be
solved through the reflective teaching and systematic inquiry that occurs during action
research (Mertler, 2020). Further, librarians are in a unique position in that they are, in a
sense, professional researchers. This fact, and the fact that librarians are also part of many
decision-making teams within a school and district’s organization puts me in a position of
truly being able to continue research that can not only positively affect my community
but also the broader community of educators that deal with digital literacy, librarianship,
and information technology.
My Role and Responsibility as the Librarian in My School
As mentioned throughout this document the purpose of this action research study
was to investigate the impact of collaborative teaching involving a school librarian and a
social studies teacher on sixth-grade students’ projects, classroom engagement, and
digital literacy skills. This study was born of a need, a problem of practice, within my
school were as the librarian at my school I found that teachers were not integrating digital
literacy instruction into their lessons to meet the South Carolina Department of
Education’s Digital Literacy Standards. Additionally, I found that these teachers did not
know that I was a resource that could help them meet the standards required of them.
True to the definition of action research, my study aimed at solving this specific
problem within my educational institution (Patton, 2002), where I was both the researcher
and a participant in the study (Mertler, 2020). Furthermore, true to the purpose of action
research, the outcome and findings of this research study will affect my personal future

164
practices as a professional and, I hope, the way digital literacy instruction will be
provided to students at my school and in my district. In essence, the implications of this
study have only strengthened my belief that collaboration between teachers and librarians
needs desperately to be embraced so that students can benefit from digital literacy
instruction that will help them succeed in school and then lead better and more productive
lives. School librarians in my district, in South Carolina, and across the nation have a
difficult time convincing their teachers and administrators that librarians are trained to
teach digital literacy through collaborative partnerships (Johnston, 2015; Luetkemeyer,
2017), and that the benefits far out way the complications. The findings from this study
when added to that of other researchers can help show these benefits.
Implications for Future Research
Rigorous action research by its very definition is a process that starts with a
practical problem within a community and seeks to solve that problem through a series of
cycles of research each building on the last in order to improve the findings and refine the
process itself (Mertler, 2020). The action research study presented in this document is but
the first cycle of hopefully more to come. The findings for this study were based on very
specific data collection where a librarian and a social studies teacher worked together
with 6th grade students during a spike in cases of the COVID-19 Omicron Variant which
already was responsible for over 6 million deaths worldwide (Yang, J., et al., 2023).
Further, this study was conducted in a very small school in a very small and very
rural school district in the midlands of South Carolina. The implications on further
research just based on variations within the school are tremendous. For instance, what
would be the outcome of research where a different academic subject was used, or what

165
might occur if a different age of student might be participating, finally, what might be the
outcome if there were no sickness on a scale such as occurred during the Omicron spike.
All of these variables make the need for future research very plain.
Even as the implications for more research conducted by this researcher are made
clear, so are the implications for additional research by other practitioners made clear as
well. Researchers from other areas of the state and nation might benefit from conducting
similar studies. Likewise, students’ age groups and other subject areas might create an
entirely different atmosphere in which to study the effects of co-teaching digital literacy
instruction. Additionally, other researchers might consider using different instruments to
measure engagement and digital literacy skills.
Limitations
Most research studies have limitations and this one is no exception. The nature of
action research, the instrumentation used to collect data, and the researchers on
subjectivities are just a few of the limitations that are present in this study. The most
obvious limitation is found in the nature of action research itself. Although it may be
possible to perform similar studies which were discussed in the previous section, this
study is specific to my circumstances. In fact, as stated before, this study was performed
by me for me to solve a problem in my school and with my students (Mertler, 2020), and
as such is not generalizable (Creswell & Creswell, 2018).
Besides the limitations that come with this study being action research, the
instruments that were used had signification limitations as well. First, the Classroom
Engagement Inventory used for this study had only 23 question, yet many students rushed
through it both times. I discovered this because two of the questions were reverse coded.

166
These two items were Item 9. In THIS social studies class, I am "zoned out," not really
thinking or doing class work, and item 12 “In THIS social studies class, I let my mind
wander to other things. Many students who had indicated that they were “always”
engaged on all the other questions, also answered “always” to these questions as well,
which is contradictory and skewed the results. Possible ways to remove this problem are
to talk to students beforehand and tell them that they need to read the questions very
carefully, reverse code considerably more than two questions, or remove the reverse
coded questions altogether. However, I found that the reverse coding gave me a better
sense of who was paying attention to the survey.
An additional limitation found within the instrumentation was the length of the
Online Digital Literacy Assessment. The ODLA was 64 questions that took about 30
minutes for the students to get through if they carefully read and answered each question.
However, many students got about halfway through and then started clicking random
answers. When I asked them if this happened, most apologized but then said that the test
was too long and boring. Again, this skewed the results. I therefore would recommend
shortening the ODLA to 20 or 25 questions for future research.
Another limitation to the instruments used in this study is that the Social Studies
Unit Project Rubric which was a district-created grading rubric that was not validated
outside of the district and is designed purposely for the school district alone. Testing this
rubric’s validity outside of the district but within the state, which has the same academic
standards, is recommended. On a final note concerning the social studies projects and
lessons, keeping digital artifacts and lesson plans from the units is recommended. For this
study neither images of the day-to-day lesson plans nor examples and images of students

167
pre- or post-innovation projects were kept. Having these items would be enormously
helpful for future research.
Besides the limitations caused by the instruments, the researcher’s participant bias
and the novelty effect were perhaps both at play within this research study. As part of this
being an action research study I am by definition a member of my school’s community
(Mertler, 2020). Further, I am what Suwankhong and Liamputtong (2015) described as an
indigenous insider, which means that I not only work in the school, but I also live in the
community and am a member of the cultural and social structure. I have known many of
the students that were participants in this study since they were babies, I have gone to
church with them and their families, and I taught some of their parents. Their behavior
and interest in class when I was co-teaching may have this been significantly affected by
both participant bias and the novelty effect.
Although I am sure there are other limitations to this study, the final one that may
have perhaps had the greatest effect of the findings and certainty had a huge impact on
the research process is the COVID-19 pandemic. This research study process started mid-
January of 2021 at the very height of the Omicron winter case spike. There were days
when my school did not have enough students or teachers in the building to maintain
normal operations. Many students that began this study were unable to finish their
innovation unit projects, and many students were out of school for weeks and unable to
turn in their pre-innovation projects. Furthermore, the sheer strangeness of the whole
situation was disconcerting to the teachers and the students. The complexity of the
situation caused a highly uneven experience for the teachers and students. In short this

168
research was performed under very abnormal circumstances which surely produced
untold limitations.
Closing Thoughts
This findings for this action research study indicated that through collaborative
teaching between a librarian and a social studies teacher students were more engaged in
the social studies content, they scored higher on their social studies unit projects, and
their digital literacy skills increased. In summary, I know that this study helped me
become a better teacher and a better librarian. Further, I hope that these findings and my
work will help other librarians push for more collaboration within their schools to help all
students benefit from being digitally literate citizens.

