INTRODUCTION The global population
The global population has increased to over 7 billion individuals, and more than
half (54%) live in urban settings (While and Whitehead 2013; Nations 2014). The urban
environment is where the majority of commercial, cultural, and political activities occur;
and these areas may be disproportionally impacted by climate change (Hamin and Gurran
2009; Corburn 2009; Revi, A., D.E. Satterthwaite, F. Aragón-Durand, J. Corfee-Morlot,
R.B.R. Kiunsi, M. Pelling, D.C. Roberts 2014). As urban populations continue to grow,
more individuals will be susceptible to projected impacts such as decreased water
availability, increased temperatures, and increased exposure to extreme weather events
(Mills 2007; Janković and Hebbert 2012a; Revi, A., D.E. Satterthwaite, F. AragónDurand,
J. Corfee-Morlot, R.B.R. Kiunsi, M. Pelling, D.C. Roberts 2014). Therefore, it is
important to consider how individuals in urban settings can best adapt to and mitigate the
risks of a changing climate.
Several major cities and some small municipalities across the U.S. and abroad
have been considered in case studies of the impact of climate on urban areas, particularly
with regards to the role of landscape architecture in mitigating and adapting to climate
change. These include London and its many surrounding boroughs and counties, Seattle,
WA; New York, NY, Keene, NH, and Göteberg, Sweden (Dierwechter and Wessells
2013; Hampshire 2004a; Eliasson and Upmanis 2000; Eliasson 1996; Eliasson and
Svensson 2003; Eliasson 2000a; Oke et al. 1991a; Hodson et al. 2013; Williams 2000a).
In the Southeast U.S., the city of Atlanta has been studied extensively, primarily with
regards to the urban heat island and its measurement using remotely-sensed data and
geographic information systems (Debbage and Shepherd 2015).

The first known research paper on the climatic influences of cities was The
Climate of London by Luke Howard (1833). His work showed that there was a notable
difference in temperature between cities and the outlying rural area, resulting in what has
become known as the urban heat island effect (UHI) (Howard 1833). Howard’s research
was later adopted in Sweden, where Ingegärd Eliasson examined variations in wind
patterns and solar radiation in urban areas (Eliasson 1996; Eliasson and Upmanis 2000;
Eliasson and Svensson 2003; Eliasson 2000b). Her work provided empirical evidence that
the urban form (i.e. physical structures and materials) does alter the surface energy budget
and the resulting local-scale circulation. Recent research in London by Katie Williams has
focused on how quality of life in neighborhoods is affected changes in urban density. Her
work identifies issues such as ‘town cramming’, a loss of neighborhood character, and
aversion to new residents by more established segments of the population (Williams
2000b).
In the U.S., the city of Keene, NH (population of 23,409 according to the 2010
U.S. Census) has taken steps toward mitigating for climate, beginning in the early 2000’s.
Specifically, the mayor and the city council put forth a local action plan, the Cities for
Climate Protection Campaign, outlining how Keene could decrease its carbon emissions
and limit its impact through use of cleaner, cost-effective energies. The plan references
the results of the Intergovernmental Panel on Climate Change (IPCC) and the likely
impacts by climate change on the state of New Hampshire, most notably to the skiing and
fishing industries (Hampshire 2004b). The plan also includes recommendations for
individuals on how to reduce their carbon footprint, and even offers tax incentives for
businesses that choose to adopt carbon-reduction strategies. While the size of Keene may
make it easier to implement climate change mitigation strategies, larger cities and

municipalities, such as Seattle, have begun to follow suit and take direct measures to
reduce carbon emissions (Hampshire 2004b; Dierwechter and Wessells 2013).
While the plan developed for Keene focused almost exclusively on a reduction in
energy usage, larger cities may be able to adopt strategies to address both energy
efficiency and the UHI. One strategy is sustainable urban design, which comes out of
John Lyle’s Regenerative Design for Sustainable Development (1994). The idea is to
reconnect human development with the surrounding environment by taking into account
the ways of using, reusing, and replenishing the natural resources of the environment to
maintain or improve quality of life (Lyle 1996). Sustainable urban design can be
implemented at the level of individual buildings and structures as well as at the level of
urban planning and the design of communities and cities. It also addresses the growing
need to build resiliency to climate change in urban areas, as highlighted in both the latest
IPCC and U.S. National Climate Assessment reports. Such an effort will require greater
collaboration between atmospheric scientists, landscape architects, and urban planners.
While work has been done to examine the impact of urban form on climate at the
city level (Debbage and Shepherd 2015), relatively little attention has been paid to the
relationship between urban form and climate at the scale of the individual, or “urbanite”.
This level of analysis is important, as differences in urban form often exist within specific
neighborhoods, which can lead to variations in the urban microclimate resulting from
vegetation patterns, street orientation, and building materials (Kuras et al. 2015). In this
study, temperature and humidity were measured across the city of Jackson, Mississippi
using hand-held instruments on two clear days in the late summer and autumn of 2015. The
locations in Jackson chosen for this study represent different forms of urban design, and

therefore provide a framework for examining the relationship between urban form and the
local climate.
Jackson is the largest city in Mississippi with a population of 539,057 according
to the 2010 U.S. Census, ranking it 140th out of 357 metropolitan statistical areas in the
U.S. Over the past decade, Jackson has seen an increase in population of approximately
8% (US Census Bureau 2010). The city has diverse fabric of urban architecture, ranging
from traditional neoclassical architecture to Art Deco, as well as 1950’s suburbia to
modern subdivisions and retail centers. The architecture and urban form is important as
they are an expression of how people live, and how they interact with and effect their
local environment. Therefore, this thesis seeks to apply concepts and techniques from
urban climatology and landscape architecture to answer the following research questions:
(1) is there any thermal variation throughout the different areas of Jackson, Mississippi?
(2) Could any variation in the weather and climate around Jackson, Mississippi be
attributed to the built environments of these different areas?
A better understanding of how the urban environment is affecting the local climate
over small distances, such as those of a neighborhood, would be beneficial to forecasters
and the general public. Ultimately, the goal of this research is to improve our
understanding of the UHI effect and how sustainable urban design can increase climate
resiliency in mid-sized cities and semi-urban settings which are prevalent across the
American South.

CHAPTER II
LITERATURE REVIEW
An examination of the relationship between climate and urban landscapes must be
informed by several bodies of literature. Global changes in climate driven primarily by
anthropogenic carbon emissions have received the most attention and have been
summarized, along with their likely impacts, in a series of assessment reports conducted
by the IPCC (Barker 2007; IPCC 2013). These reports (and ones published by the
National Climate Assessment in 2014) also provide recommendations for adaptation and
mitigation strategies and the impacts of climate change may be particularly notable in
urban areas, where roughly 80% of the U.S. population currently resides (Revi, A., et al.
2014). The urban landscape and infrastructure also contribute to local changes in climate
that may exacerbate the regional-scale changes discussed above. For example, cities tend
to be warmer than the surrounding rural areas, particularly at night due to building
materials and changes in albedo (Jackson et al. 2010). Urban climatology is the branch of
climatology that examines and describes the effects of urban areas on the climate, and
vice versa. Urban climatology has become a popular research theme in places like Europe
and Asia where rates of urbanization and population growth have been increasing
significantly. In fact, many cities in China were burgeoning metropolitan areas even
before Europeans discovered North America (Veeck et al. 2011). European scientists have
long documented the effect that urban areas have on the local and regional climate (Mills
2007, 2008; Howard 1833). This effort has been led in large part by British climatologist
Timothy Richard Oke. His work in urban climatology has been widely published over the
past 30 years and has become the foundation for this growing field of study. Many of

Oke’s studies have involved theoretical and applied concepts related to increased
nocturnal temperatures in urban areas compared to surrounding rural areas (Oke 1981).
More recently, Scandinavian scientists have built upon Oke’s seminal work in
urban climatology, including study of the patterns of wind flow through cities,
temperature differences between old new construction, and quantifying street shading
through fisheye lens photography of the sky from the street (Figure A.1). Such studies
have incorporated both in situ and mobile measurement techniques, and have taken
advantage of unique photographic equipment to better understand how thermal energy is
distributed, retained, and released across several urban areas across Sweden (Eliasson and
Upmanis 2000; Eliasson and Svensson 2003; Eliasson 2000a, 1996).
In the U.S., much of the work in urban climatology has involved the observation
and evolution of the urban heat island (UHI) and its effects on the local and regional
climate (Figure A.2). Other studies have also looked at its effect on human health and
other socioeconomic patterns. The UHI is a simple way to determine the influence of the
built environment on the climate of a location by looking at temperature differences
between the urban location and nearby rural areas. Formally, the American
Meteorological Society offers the following definition:
“The physiographic analogy derives from the similarity between the pattern of
isotherms and height contours of an island on a topographic map. Heat islands commonly
also possess "cliffs" at the urban–rural fringe and a "peak" in the most built-up core of the
city. The annual mean temperature of a large city (say 106 inhabitants) may be 1°–2°C
warmer than before development, and on individual calm, clear nights may be up to 12°C
warmer. The warmth extends vertically to form an urban heat dome in near calm, and an
urban heat plume in more windy conditions (American Meteorological Society 2016)”.

The UHI is most pronounced on cold, calm nights (Oke et al. 1991b; Corburn
2009; Arnfield 2003; Eliasson 1996, 2000b; Eliasson and Upmanis 2000; Hamin and
Gurran 2009; Gallo and Owen 1999; Janković and Hebbert 2012b; Oke 1981). Studies on
the UHI in the U.S. have been conducted in large cities such as New York City, Seattle,
and Atlanta, among others (Debbage and Shepherd 2015; Kuras et al. 2015; Dierwechter
and Wessells 2013; Corburn 2009). Far fewer investigations of the UHI have been
performed for mid-sized cities. Mid-sized cities are defined by an urban core of at least
10,000 people (according to the 2010 U.S. Census) with at least 50,000 people in the
broader metropolitan statistical area (U.S. Census, 2010; Debbage and Shepherd 2015).
Determining the intensity and spatial extent of the UHI in mid-sized cities would
allow these municipalities to better understand how a changing climate may impact their
city and what adaptation and mitigation strategies could be adopted to reduce their UHI.
Additionally, an improved understanding of small-scale temperature variation across
these cities (i.e. at the scale of individual city blocks or neighborhoods) could help in
reducing the UHI through adoption of sustainable urban design choices and planning
practices (Kuras et al. 2015; Debbage and Shepherd 2015).
There are a variety of ways for sustainable urban design to be utilized within a
city. One way is in the choice of surface material. In much of the Southeast U.S., a
common paving surface for roads is asphalt, which absorbs energy effectively and
contributes to increased runoff of stormwater. The albedo of a surface is a measurement
of the amount of energy reflected from the surface and is based on the material type,
color, and other physical or biological properties (Lechner 2009; Debbage and Shepherd
2015). Albedo is one aspect of the urban form that plays an important role locally in the
surface energy budget (Figure A.3). Specifically, the albedo of the surface affects the

distribution of radiation that is absorbed and reflected by the surface, and therefore affects
local temperature patterns within the city and between the city and surrounding rural
areas (Mills 2013; Arnfield 2003). Generally speaking, darker surfaces such as asphalt
have a lower albedo than lighter surfaces, and therefore absorb more incoming shortwave
radiation, resulting in higher surface temperatures (Table A.1). In addition, most urban
materials have a lower albedo than natural (e.g. vegetated) landscapes.
Materials such as asphalt are characterized as impervious. In the context of
sustainable urban design, the use of pervious materials for things such as roads and
sidewalks could help reduce heat retention within the city (i.e. increase the albedo) and
allow for stormwater to infiltrate into the ground, reducing runoff and flooding potential
(Kuang et al. 2015; Drake et al. 2014). This type of surface can also help maintain the
quality of stormwater by naturally filtering pollutants and sediment, thereby reducing the
demand on water treatment plants. The infiltration of stormwater may also increase
groundwater levels, improve streamflow, and help recharge aquifers. Several types of
pervious surfaces have been employed in urban areas, including cobblestone, brick,
gravel, and even new forms of concrete (such as modular concrete blocks, porous asphalt,
and porous concrete) that allow for water to flow through them and infiltrate into the soil
and groundwater underneath.
The underlying soil type does play a role in determining the types of paving
surfaces that may be used. Around the Jackson Metro, several types of soil exist,
including sand, clay, and a clay/shale mix. Sandy soils composed of large granules allow
for water to infiltrate readily through the large pore spaces, resulting in efficient
recharging of groundwater and aquifers. Clay soils have a much finer granular
composition, allowing the soil to more effectively retain water, leading to much slower

rates of infiltration. These characteristics lead to a greater potential for flooding should
rainfall rates exceed the rate of infiltration in the soil. Clay/shale soils are a blend of the
two types, leading to lower risks for flooding than pure clay soil. Each of these soil types
poses limitations to the kinds of paving techniques and materials that can be used, such as
the expansion and contraction of soil as water is retained and drained (USGS 2016).
Recent research and technological advancements have provided new methods and
opportunities for adopting sustainable practices in urban surface design and
implementation. Scholz and Grabowiecki (2007) reviewed research done in porous
pavement and pervious pavement systems and found evidence of reductions in
stormwater runoff, improved groundwater infiltration rates, and improved filtration of
pollutants. Additionally, these surfaces have been shown to be highly durable and capable
of handling the traffic loads approved for traditional asphalt (Brattebo and Booth 2003).
The different types of porous pavement include porous asphalt (macadam pavement),
porous concrete (the omission of fine aggregates), modular interlocking concrete blocks,
and polymer-modified porous concrete. While pore clogging can occur over time, it is
largely preventable with proper maintenance. In general, permeable pavement systems
have performed better than porous surfaces without proper maintenance in terms of pore
clogging (Scholz and Grabowiecki 2007).
Among permeable pavement systems, there are several commercial types:
Grasspave2s is a flexible plastic grid system with virtually no impervious area, filled with
sand and planted with grass. Gravelpave2s is an equivalent plastic grid, filled with gravel.
Turfstones is a concrete block lattice with about 60% impervious coverage, filled with
soil and planted with grass. Finally, UNI Eco-Stones are small concrete blocks with about
90% impervious coverage, with the spaces between blocks filled with gravel. Each of

these were studied by Brattebo and Booth with results that were encouraging in
comparing each of these systems to traditional asphalt. These surfaces were able to
withstand the loads expected for traditional asphalt, yet they also were better at reducing
stormwater runoff, improving groundwater infiltration rates, and better at the filtration of
pollutants from stormwater (Brattebo and Booth 2003).
Another area of research in sustainable pavements is being conducted by a
company called Solar Roadways. Solar Roadways are solar panels with a tempered glass
on top, allowing for the roadway to generate electricity as well as heat the surface in the
winter (Figure A.4). Additionally, the system has built in filtration and storage capacity
for stormwater, and LED screens can light up to give information and signals to vehicles
and individuals on the roadway (Transportation 2014). The U.S. Department of
Transportation has encouraged research to be performed with this company to determine
the feasibility for U.S. roadways. These forms of paving could be utilized in various ways
around the city, increasing the diversity of the city’s appearance and improve the
aforementioned issues related to temperature and water resources as well as energy use
(Tanguay et al. 2010; Singh et al. 2009; Lyle 1996)
Improving the physical structure of the paved surface is a useful form of
sustainable urban design; however this process could be time-consuming and expensive,
particularly if improving paved surfaces requires full replacement of existing surfaces.
Another option in sustainable urban design is street shading. Exposure to solar radiation
and extreme temperatures can become a health issue, especially during the summer
months and in places like cities where the UHI effect increases heat vulnerability locally.
Without options for shading, particularly on sidewalks, roads, open spaces, and buildings
within the city, the temperature experienced by individuals could be even higher than the

measurements recorded at official weather stations. Buildings will consume more energy
to maintain thermal comfort within the building without shading options (Lyle 1996).
Street shading can be accomplished through several different means. Awnings and
overhangs from the buildings along the sidewalks can be especially useful in certain areas
of the city where there is not enough room to plant trees. In many areas of Jackson, there
are wide streets and roads that have a median between the opposing lanes of traffic,
which could be filled with vegetation. While there could be issues with traffic flow by
inappropriately sited vegetation, the option for planting deciduous trees to increase
shading would be another viable option for reducing the temperature for pedestrians and
cutting building energy usage during the warmer months by shading the building from
excessive heating (Golany 1996; Lyle 1996).
There are many benefits of utilizing deciduous trees to shade buildings in urban
areas, including a reduction in energy consumption to maintain the interior temperatures
of the buildings, as well as the ability to cool the air through evapotranspiration.
Additionally, as deciduous trees lose their foliage in winter, the resulting reduction in
shading would allow buildings to warm more naturally during the colder months and take
advantage of the lower sun angle (Golany 1996; Lyle 1996; Lechner 2009). The increased
vegetation would also help clean the air and reduce pollutants in the city, as well as
remove carbon dioxide and add oxygen to improve air quality within the city (Golany
1996). Increased tree coverage can also improve air flow and increase ventilation (Golany
1996). The evapotranspiration of the vegetation cools the air directly around the building.
This has a two-fold effect, by shading the building to reduce energy consumption and
cooling the atmosphere around the building. Ultimately, street shading could be a

relatively cost-effective method to begin the process of improving the urban landscape in
the Jackson Metro.
Another way to increase vegetation in the city is through green roofs. The lower
albedo of the city results in greater absorption of solar radiation during the day and slower
emittance (cooling) at night (Oke et al. 1991b). Green roofs afford property owners the
ability to add a thin layer of soil onto the roof to grow vegetation. Not only does this
increase the albedo of the urban surface, this vegetation has other benefits, similar to the
benefits that are offered by deciduous trees (i.e. improving air quality, increased oxygen
to atmosphere, and reducing energy consumption for buildings). Additionally, a green
roof can reduce stormwater runoff, filter the water, and improve water supply in urban
areas by collecting and storing rainwater for various uses (Lyle
1996; Shaviv 2008; Ong 2003; Merem et al. 2011; Tanguay et al. 2010).
The urban density, or number of people per unit area, has been shown to
contribute to the UHI, as it is closely related to the amount of surface area which is
developed for human habitation, recreation, and industry. Increasing the urban density in
Jackson could improve the traffic flow of the city, inflate property values through higher
demand, as well as improve the city’s transportation infrastructure and provide feasible
options for enhancing the human fitness of the city via increased forms of human
movement (Williams 2000; While and Whitehead 2013; Revi, A. et al. 2014). Traffic flow
might be improved with greater density as people are located closer to the good and
services they need. Higher urban densities also encourage the creation of public
transportation infrastructure since there is less area to be included in the system resulting
in shorter distances to be covered. However, without proper guidelines and use of public
transportation, traffic flow could become more congested (Williams 2000a). Overall
population health could be improved as human-powered modes of transportation become

feasible due to shorter commutes to work, entertainment, and commercial districts (Xu
and Wang 2015). Finally, if the urban density increases, the property values will rise as
more revenue may be obtained from those locations with a higher demand for residency
in the area and more tenants in one building. Whether land is zoned for residential,
commercial, or industrial use, an increase in nearby human populations may result in
more desirable living areas and lead to a rise in property values. A current trend in urban
planning is multi-use zoning. This helps integrate and diversify land use in urban areas by
allowing a building to be used in multiple ways. A building in a multi-use zone could be
used as a commercial or retail space at the ground floor with apartments in the spaces
above. As such, multi-use zoning integrates the different types of urban land-use and
reduces commuting distance for goods and services people need.
A final form of sustainable urban design and energy usage is the heating,
ventilation, and air conditioning (HVAC) systems for buildings in urban areas. Like most
other places, Mississippi has greatly benefited from the use of air conditioning; however,
the architectural designs of houses and buildings before this luxury have largely been
forgotten in many parts of Jackson. Dogtrot houses (Figure A.5) and vaulted ceilings were
common designs in the Deep South aimed to reduce the impact of excessive heat and
humidity on the daily routines of people’s lives (Sherman-Morris et al. 2012; Lechner
2009). A return to these non-mechanical forms of HVAC would greatly reduce energy
consumption, maintain adequate levels of human comfort, and reduce urban air
temperature in the summer (Lyle 1996; Shaviv 2008; Oke 1984). While these
architectural designs may not be trendy, or even feasible for some parts of the country, a
commitment to building design with the local climate in mind is essential to improving

energy efficiency and reducing energy costs. Each of the aforementioned sustainable
urban design aspects is summarized in Table A.2.
Ultimately, urban climatology and urban planning depend on one another to help
develop resilient and sustainable cities for the future. Research has begun to be pursued at
the intersection of the two disciplines through one of two means. First, there is the
remotely-sensed method of determining low-level atmospheric variables as well as land
use practices. The second approach involves the collection of in situ data. There are
several examples of research performed around Atlanta, GA that utilize remotely sensed
methods including the National Land Cover Database (NLCD) and the
Parameterelevation Regression on an Independent Slopes Model (PRISM) (Debbage and
Shepherd 2015; Stone Jr. and Rodgers 2001). Brian Stone and colleagues studied the
density of the urban form on land parcels throughout Atlanta, and found that higher
densities of buildings do in fact have lower thermal efficiency of reflecting radiation.
Thus, urban areas develop higher surface temperatures than low density areas (Stone Jr.
and Rodgers 2001).
Debbage and Shepherd (2015) also examined the density of urban areas and its
effect on the magnitude of the UHI. They focused on cities in the U.S. with the 50 largest
metropolitan statistical areas and used high-resolution land cover and meteorological data
to relate urban density to the UHI. Their study found that cities having areas of the same
land use type, specifically high-density urban development, clustered together (i.e. greater
urban contiguity) would increase the magnitude of the UHI. This work suggests that by
intermingling residential, commercial, industrial, and green space across the metropolitan
area, and thereby reducing the spatial contiguity of high-density urban development, the
UHI can be reduced. In particular, the addition of green space provides a cooling

influence via evapotranspiration that can offset some of the additional heat absorption by
urban materials.
Another recent approach involves personal monitoring and the measurement of
individually-experienced temperatures (Kuras et al. 2015). This approach involves
equipping individuals with hand-held or personal monitoring devices and recording the
atmospheric variables in their immediate environment as they go about their daily routine,
moving through various landscapes and microclimates on short time and space scales.
This approach was used by Kuras and Hondula to identify differences in individually-
experienced temperatures and how they compared to official weather observations during
a heat wave in Boston, MA. One of the main advantages of this approach is that it allows
for meteorological observations to be taken at locations where deployment of standard
meteorological equipment are not possible or practical. The spatial and temporal
resolution of these personal or individual-level observations also allows for examination
of more local-scale effects on the urban climate, such as street shading, changes in surface
type, building geometry, “waste heat” sources, and cloud cover. Therefore, the personal
monitoring approach was used in this thesis project to examine small-scale variations in
the urban climatology of Jackson. Specifically, this research seeks to determine how
meteorological variations across the Jackson Metro area are related to the character of the
built environment and local architecture. In this sense, it is hypothesized that fine-scaled
variations in the local climate do in fact coincide with different forms of urban design.
These results are further examined in the context of sustainable, regenerative, and carbon
neutral designs and how such approaches could help mitigate the effects of climate
change in urban areas such as Jackson. In particular, it is hypothesized that the differences

in climate across the urban landscape could be mitigated through certain types of
sustainable urban design.
CHAPTER III
DATA AND METHODS
This section describes the locations in Jackson selected for analysis, including
their land cover characteristics, and the instrumentation and procedures used to assess the
temperatures and moisture variability at each location.
3.1 Site Selection
Six locations were selected to represent spatial variations in climate and urban
design across the Jackson Metro: Fondren, Lakeland Drive, Renaissance at Colony Park,
State Capitol Building, Governor’s Mansion, and Clinton Nature Center (Figure B.1).
Fondren is one of the most established neighborhoods in the Jackson area, approximately
three miles north of downtown. The area has been undergoing much revitalization in
recent years and includes a mix of old and new development with much green space.
Meteorological data for Fondren were collected in the asphalt parking lot of a small
shopping center at the intersection of Lakeland Drive and Old Canton Road (Figure B.2).
The site is also near a large asphalt parking lot adjacent to the Mississippi Veterans
Memorial Stadium and the University of Mississippi Medical Center complex (Figure
B.3). The developed land uses make up over 98 percent of the land use around Fondren
according to the USGS National Land Cover Database (2011) (Figure B.4). While there
are a few areas that are considered forested, the rest of the area is developed, with nearly
70 percent of the land being used as developed space with some sort of use intensity
(over one-third medium to high intensity).

Lakeland Drive is the location of an outdoor mall that straddles Highway 25
(locally Lakeland Drive) in Flowood, called the Dogwood Shopping Center. There are
four sections to this mall, with each section having its own anchor box store, asphalt
parking lot, and chain restaurants along the periphery. The NLCD denotes nearly 60
percent of the area as comprised of developed space, with another 20 percent composed
of forested areas. The other 20 percent is a variety of vegetation, farmland, and water land
uses (Figure B.7). Meteorological data for Lakeland Drive were collected in the oldest
parking lot of the Dogwood Shopping Center (Figure B.5). The asphalt parking lot is
fully exposed to direct sunlight, though a few small shaded berms are found along each
row of parking spaces (Figure B.6). There is some green space between the main parking
lot and Lakeland Drive (MS Highway 25), as well as two small detention ponds. Three
other sections to the shopping center have equally sized asphalt parking lots and are
located to the south and west (i.e. upwind) of the Lakeland Drive site.
The Renaissance at Colony Park, located in the town of Ridgeland, is a relatively
new outdoor mall setting, completed in 2008 with its own set of codes and ordinances
established through a partnership with the town and developed to help attract business
(Figure B.8). There is an intended European, particularly Italian influence, with brick and
cobblestone used through the main thoroughfares and a boulevard of trees and parking
spaces with larger parking lots along the periphery. There are wide sidewalks with
abundant tree shading, especially near the center of the mall. The combination of light
colored building and paved materials, ample street shading, green space, and ponds
provide a cooling effect across much of the property. In terms of land use, there is a
marked increase in vegetation and cultivation around the mall (compared with other
sites), making up over a fifth of the land use (Figure B.10). Additionally, only 5 percent is

considered developed, high intensity land use, while the rest of the area is either low
intensity (~25 percent), or open space (>30 percent). Meteorological data at the
Renaissance were collected near the center of the mall with varying shade and direct
sunlight depending on time of day (Figure B.9). The mall is flanked by two small asphalt
parking lots with several shaded grass berms and is within several hundred feet of two
landscaped retention ponds to the south as well as large office and hotel buildings to the
north.
The first of two downtown locations is the Mississippi State Capitol Building
(Figure B.11). The Capitol Building has an asphalt parking lot on the north side of the
property with heavily landscaped grounds on the south side. The large trees and an
expansive grassy, irrigated surface on the south side of the building provide a cool,
tranquil respite from the rest of the downtown area (Figure B.12). The south side of the
property is where the meteorological data were collected. Around the Capitol Building,
10 land use types are found, though the majority (over 60 percent) consist of medium to
high intensity developed space (Figure B.13). Only about nine percent is comprised of
developed open space, part of which is likely is the grounds of the Capitol Building with
much grass and a large tree canopy. The rest of the city is surrounding it, resulting in over
60 percent of the land being developed at a medium to high intensity.
The second location in downtown Jackson is the Governor’s Mansion, just two
blocks south of the Capitol Building (Figure B.14). When compared to the Capitol
Building, there is less shading and green space around the Governor’s Mansion, though a
mixed-surface with much shading sits across the street on the northern end of the
property. Meteorological data at the Governor’s Mansion were collected at the southwest
corner of the block that the mansion sits on (Figure B.15). There is a moderate amount of

street shading from the trees and tall buildings, but the area has recently been redesigned
with roundabouts; thus opening the street view and reducing the street shading. The
roadway is paved with black asphalt and the sidewalks are white concrete. The
roundabouts do improve traffic flow, but there is an increase in solar radiation as there is
less shading at the intersection. The Governor’s Mansion consists of 11 land use types
from the NLCD and over 90 percent of that being developed space (Figure B.16). Over a
quarter of the land use is considered high intensity developed space, while 35 percent is
medium intensity land use. There are also some small percentages of undeveloped forest,
farmland, wetlands, and water within the 1-mile radius.
Approximately 10 miles west is the city of Clinton. This Jackson suburb has
created a green space along a portion of the Natchez Trace Parkway and National Park
that is a community nature center (Figure B.17). The nature center is a large greenway
with many trees, wooden structures, and walking trails through the greenway. The center
is almost entirely unpaved, aside from the dark gravel paths throughout the nature center
and the same colored parking lot (Figure B.18). Generally speaking, the parking lot is the
least shaded part of the nature center and the most urbanized as cars are parked there to
access the nature center. The Clinton Community Nature Center has 12 NLCD land use
types. Despite being a nature center, much of the area around it is developed, albeit
mainly open space or low intensity (Figure B.19). Only about 5 percent of the radius is
forested, with nearly 40 percent of the space being developed open space. Developed
spaces with some sort of use intensity account for just over 50 percent of the radius.
Meteorological data were collected at this site from the parking lot of the nature center.

3.2 Data Collection
Meteorological observations were made at each location using a WeatherHawk
SM-28 SkyMaster hand-held weather meter. The SkyMaster is a portable weather meter
that measures and displays various meteorological variables. In particular, the jackknife
design allows the user to hold the device in such a way that the heat and moisture from
the user is unlikely to influence the environmental sensors (Figure B.20). For the
purposes of this research, the only variables measured and recorded were air temperature
(i.e. dry-bulb temperature) and dew point temperature. The accuracy of the device is
limited to +/- 2˚ F for temperature, and +/- 3˚ F for dewpoint. The device was calibrated
for several minutes on-site prior to use. The calibration involved allowing the device to
record measurements for several minutes to ensure the device was measuring reasonable
values for the atmosphere. If a device was not able to measure the variables in use, the
device was not used. For example, one of the SkyMasters had problems measuring
moisture content in the air. Therefore, this device was not used for moisture or for
temperature variables, and documented as needing technical repairs before being used for
this purpose. Another device was missing an anemometer, this device was recording the
other atmospheric variables properly; however since it was not able to measure wind
speeds, the wind speeds were measured from a device that had an anemometer, but could
not properly measure other atmospheric variables (i.e., temperature and moisture
variables). The missing anemometer was also noted as needing repair. These tools were
compared with the observations from the ASOS and AWAS sites, which have a much
higher precision, and a longer calibration. A third variable, apparent temperature, was
calculated using the equation from Steadman (1979), which incorporates both air and dew

point temperature and is used by the National Weather Service to calculate the operational
heat index. All measurements were taken between 5.5 and 6.5 feet above the ground.
In addition, local surface temperatures were recorded using an infrared
thermometer. This device uses infrared radiation to determine the energy emission of a
surface. As previously discussed, variations in surface material across the urban landscape
play a key role in the thermal characteristics of the city. Indeed, the locations chosen for
this research include a variety of surfaces, including grass, gravel, cobblestone, asphalt,
and concrete. All of these types of surfaces will have different thermal emissions. The
relationship between energy emission and temperature is described in the Stefan-
Boltzmann equation:
𝐸 = 𝜎𝑇4 3.1
Where E = emission (Wm-2), T = temperature (K), and σ = Stefan-Boltzmann
constant (5.67*10-8 Wm-2 K-1). For convenience, the infrared thermometer automatically
solves a form of this equation and displays the resulting temperature. This device has a
fixed emissivity of 0.95, where emissivity is a number quantifying an object’s ability to
emit thermal energy. Emissivity is ranked on a scale from 0 to 1, with a blackbody
(perfect absorption) object having a value of 1. This emissivity value changes with every
object. Since the emissivity value is fixed at 0.95 for the IR gun, this could lead to
measurements being skewed for the sake of simplicity in measuring. However, since all
skin temperature measurements were made using these guns, this bias is controlled for,
with an accuracy of about +/- 2 ˚ F. Surface temperatures measured with the infrared
thermometer were taken at approximately the same time as the air temperature and dew
point measurements from a height of 6-12 inches above the ground (Figure B.21).

Air temperature, dew point, and surface temperature data were collected at five of
the six locations on August 28, 2015 (Day 1) and October 18, 2015 (Day 2). Only five
individuals were available to collect data on Day 1 and so the decision was made to
remove Fondren from analysis on that day. On Day 2, security personnel at the Dogwood
Shopping Center prohibited the collection of data on the property and so no data were
collected there on that day. These days were chosen for this research because they were
characterized as having weak synoptic flow whereby temperature variability across
Jackson would be influenced primarily by local-scale processes and not large-scale
weather features such as fronts. Both days selected for this research met the criteria for
weak synoptic flow as defined by Dixon and Mote (2003): no synoptic-scale forcing
mechanism within 500km and average surface wind speeds less than 10 knots (Figure
B.22, Figure B.23). GPS units were used to mark the measurement site at each location
on Day 1 to ensure that the same site was used on Day 2.
One of the objectives of this research is to compare the temperature and moisture
characteristics at each location to official observations. Automated weather observations
are made 10 minutes prior to each hour at three airports in the Jackson area: Jackson
Medgar-Evers International Airport (KJAN), Bruce Campbell Airport (KMBO), and
Hawkins Airport (KHKS) (Figure B.1). Therefore, comparisons of air temperature and
dew point between each airport and study locations were made at the following times
(CDT) on both days: 11:50, 12:50, 13:50, 14:50, and 15:50. Surface temperatures for
each location were also recorded at these times with the infrared thermometer; however,
because this variable is not measured at the airport locations, comparisons could not be
made. Air temperature and dew point observations from each airport were obtained
within 24 hours of each collection period:

• KJAN: http://w1.weather.gov/data/obhistory/KJAN.html
• KMBO: http://w1.weather.gov/data/obhistory/KMBO.html
• KHKS: http://w1.weather.gov/data/obhistory/KHKS.html
The corresponding observations at each location were calculated from an average
of measurements taken at 30 second intervals beginning 5 minutes before and ending 5
minutes after the official airport observation times. The instruments were calibrated each
morning prior to the beginning of the research itself. The calibration was limited to
ensuring proper battery function and life, and then 1-2 minutes of cycling through the
measured variables to ensuring they were recording reasonable values.
3.3 Land Cover
Another goal of the research was to determine the role urban form has on its local
climate. Land use practices were recorded by the United States Geological Survey
(USGS) Multi-Resolution Land Characteristics Consortium (MRLC) in 2011 with the
latest version of the National Land Cover Database (NLCD). The NLCD is a database of
land use and land cover that is based on classifications of LandSAT data by the MRLC.
The specific categories are modifications of the Anderson Land Cover Classification
System. Spatial resolution is set at 30 meters with 20 distinct categories within the 2011
NLCD (USGS 2011). The NLCD was used in this study to determine the land use type
around the Jackson Metro and in the vicinity of each observation site (Figure B.24). The
20 land cover categories range from four types of urban development and three distinct
categories of forestation, to a variety of wetlands and cultivated land cover types.
3.4 Statistical Methodology
Statistical analysis of the data was necessary to analyze the significance of the
data. The resampling method of bootstrapping was selected due to small sample sizes and

the unusual distribution of the data. The data at each site were combined into site specific
lists of air temperature and apparent temperature, then statistically resampled through the
bootstrapping method. This method resamples the data with replacement a set number of
times (in this case 10000) to get a bootstrapped statistic with a normal distribution when
using the mean as the bootstrapped statistic. Confidence intervals of 2.5% and 97.5%
were then taken of the data to gain an understanding of the spread about the mean of the
bootstrapped data. The choice of these intervals is to limit the type II error that lead to
misdiagnosing a statistically insignificant value as significant (failure to reject when the
null should be rejected).
CHAPTER IV
RESULTS
4.1 Air Temperature
Air temperatures Day 1 (August) ranged from the mid 80’s to the upper 90’s (˚ F).
Some sites, such as the Governor’s Mansion and Lakeland Drive, were consistently
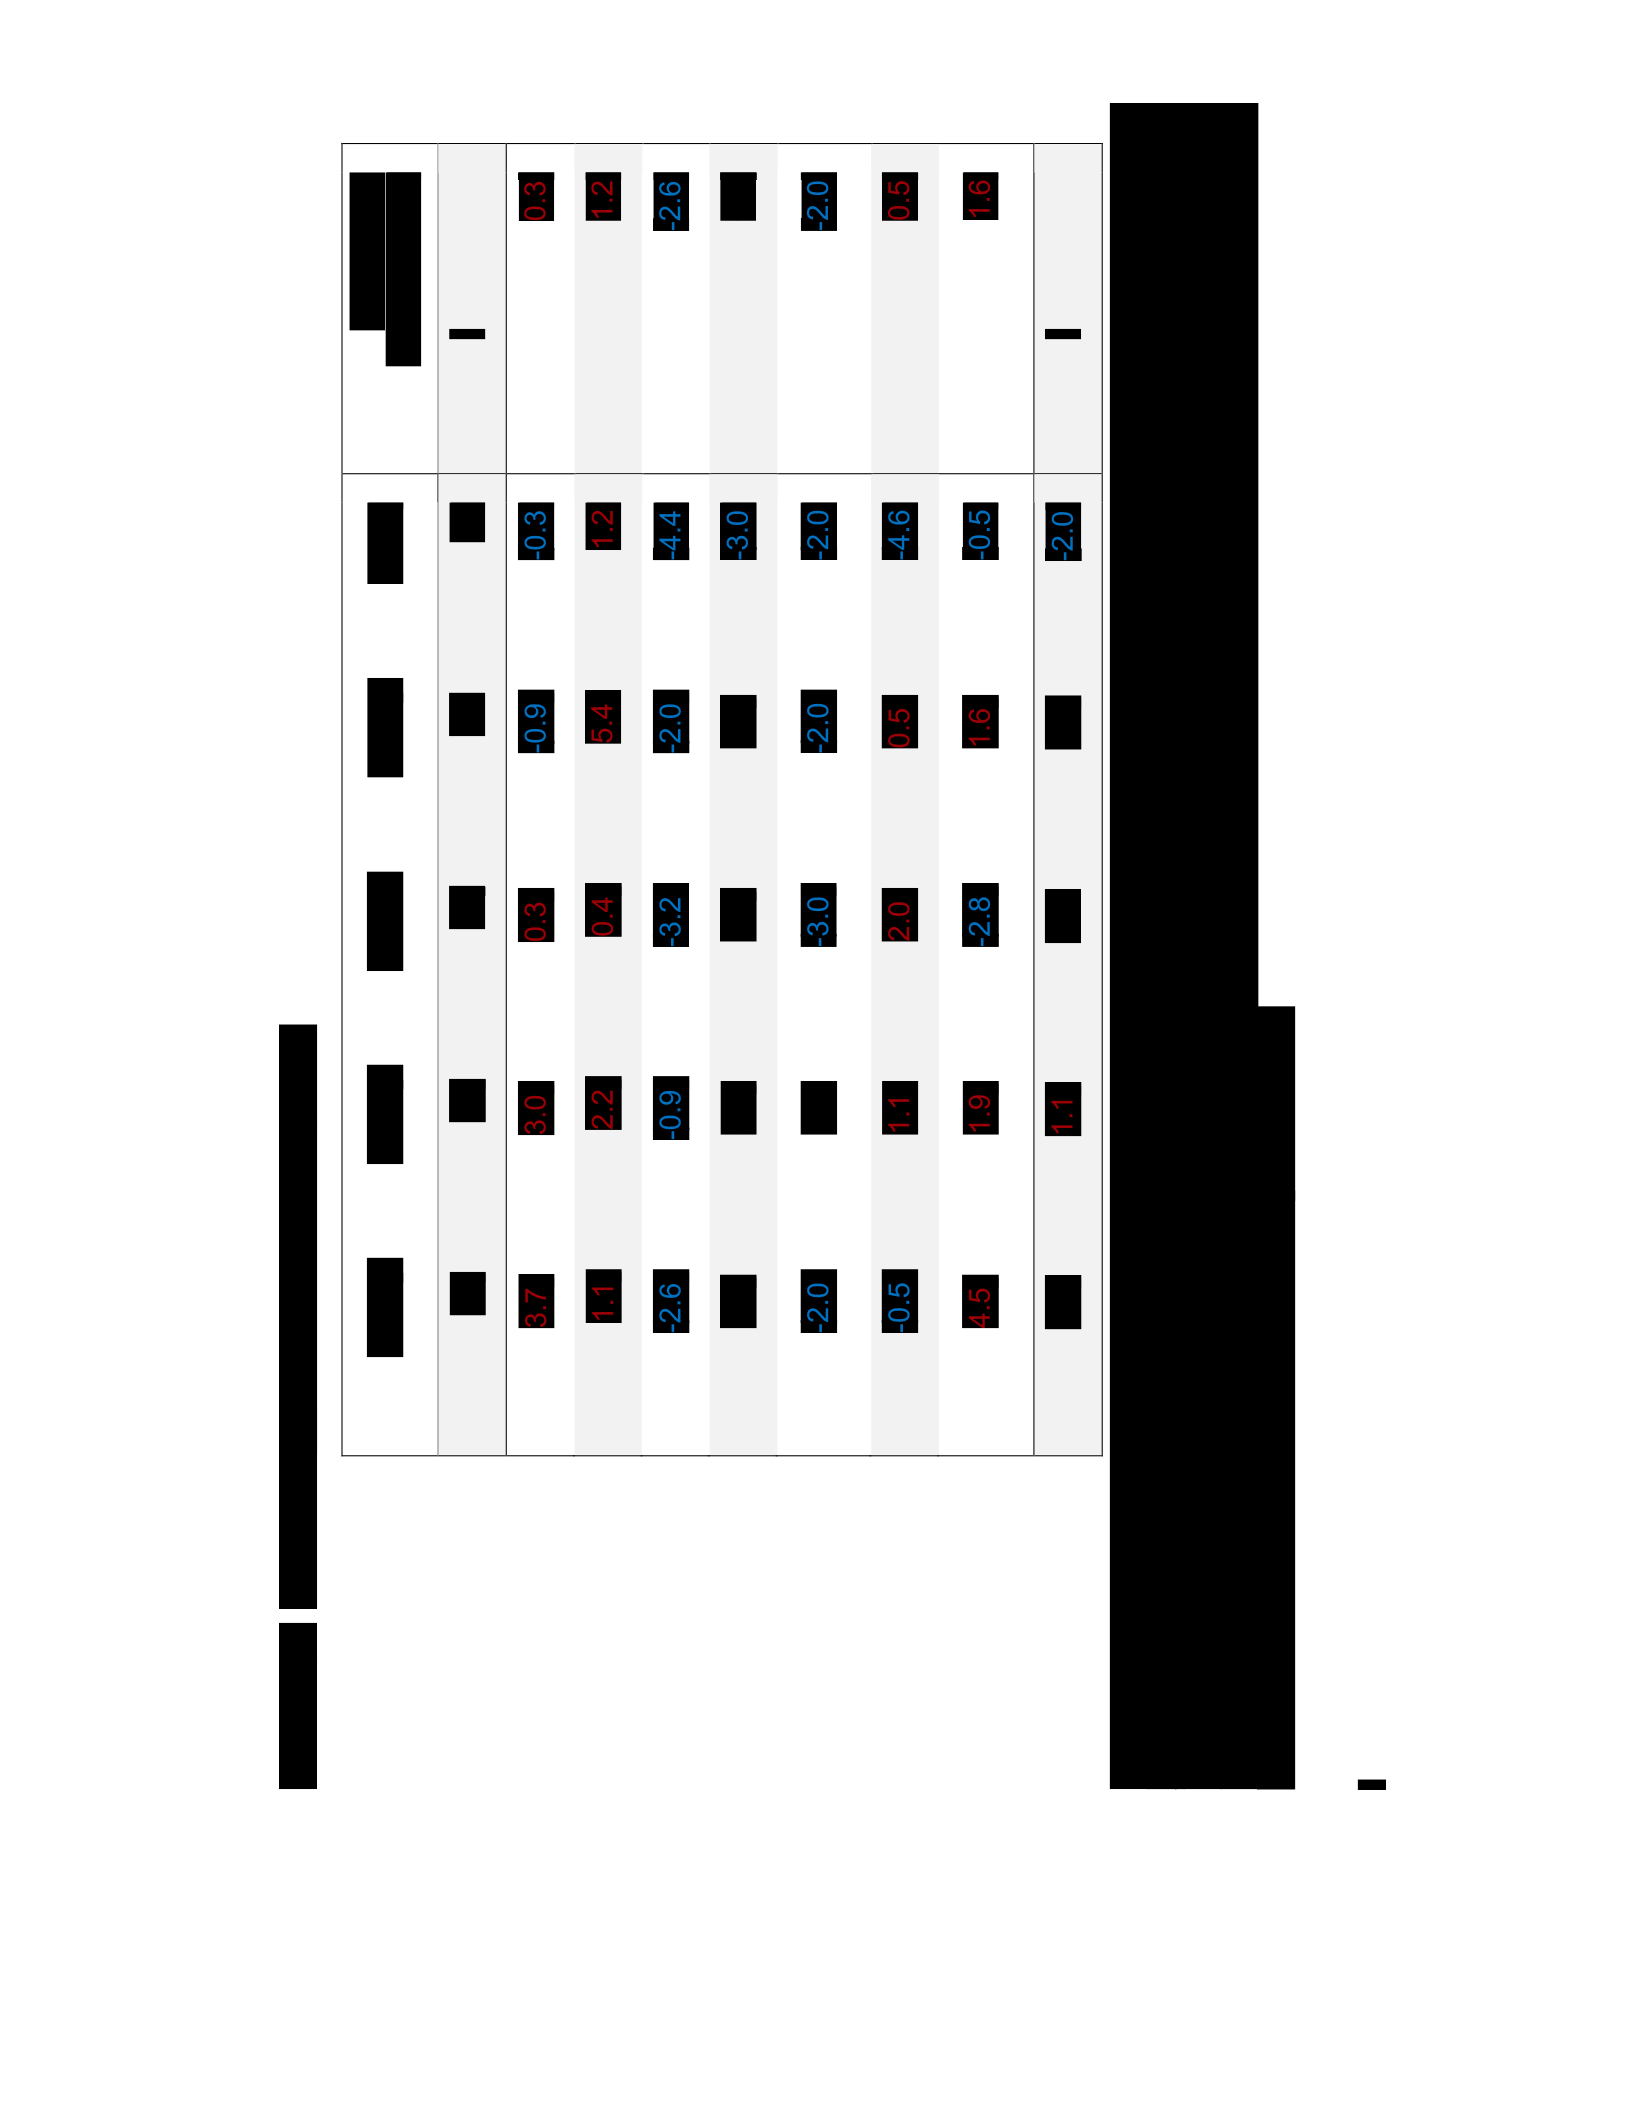
warmer than KJAN during all observation times (Table C.1). The only site to remain
consistently cooler was the Capitol Building. The median values for Lakeland Drive, the
Governor’s Mansion, and the Clinton Nature Center recorded warmer temperatures than
KJAN on Day 1, while Hawkins Field (KHKS), Bruce Campbell (KMBO), the
Renaissance, and the Capitol Building were measured with cooler median air
temperatures. The median air temperature differences show Lakeland Drive and the
Nature Center to be warmer than all of the airports, but the Capitol Building to be cooler
(Table C.2).
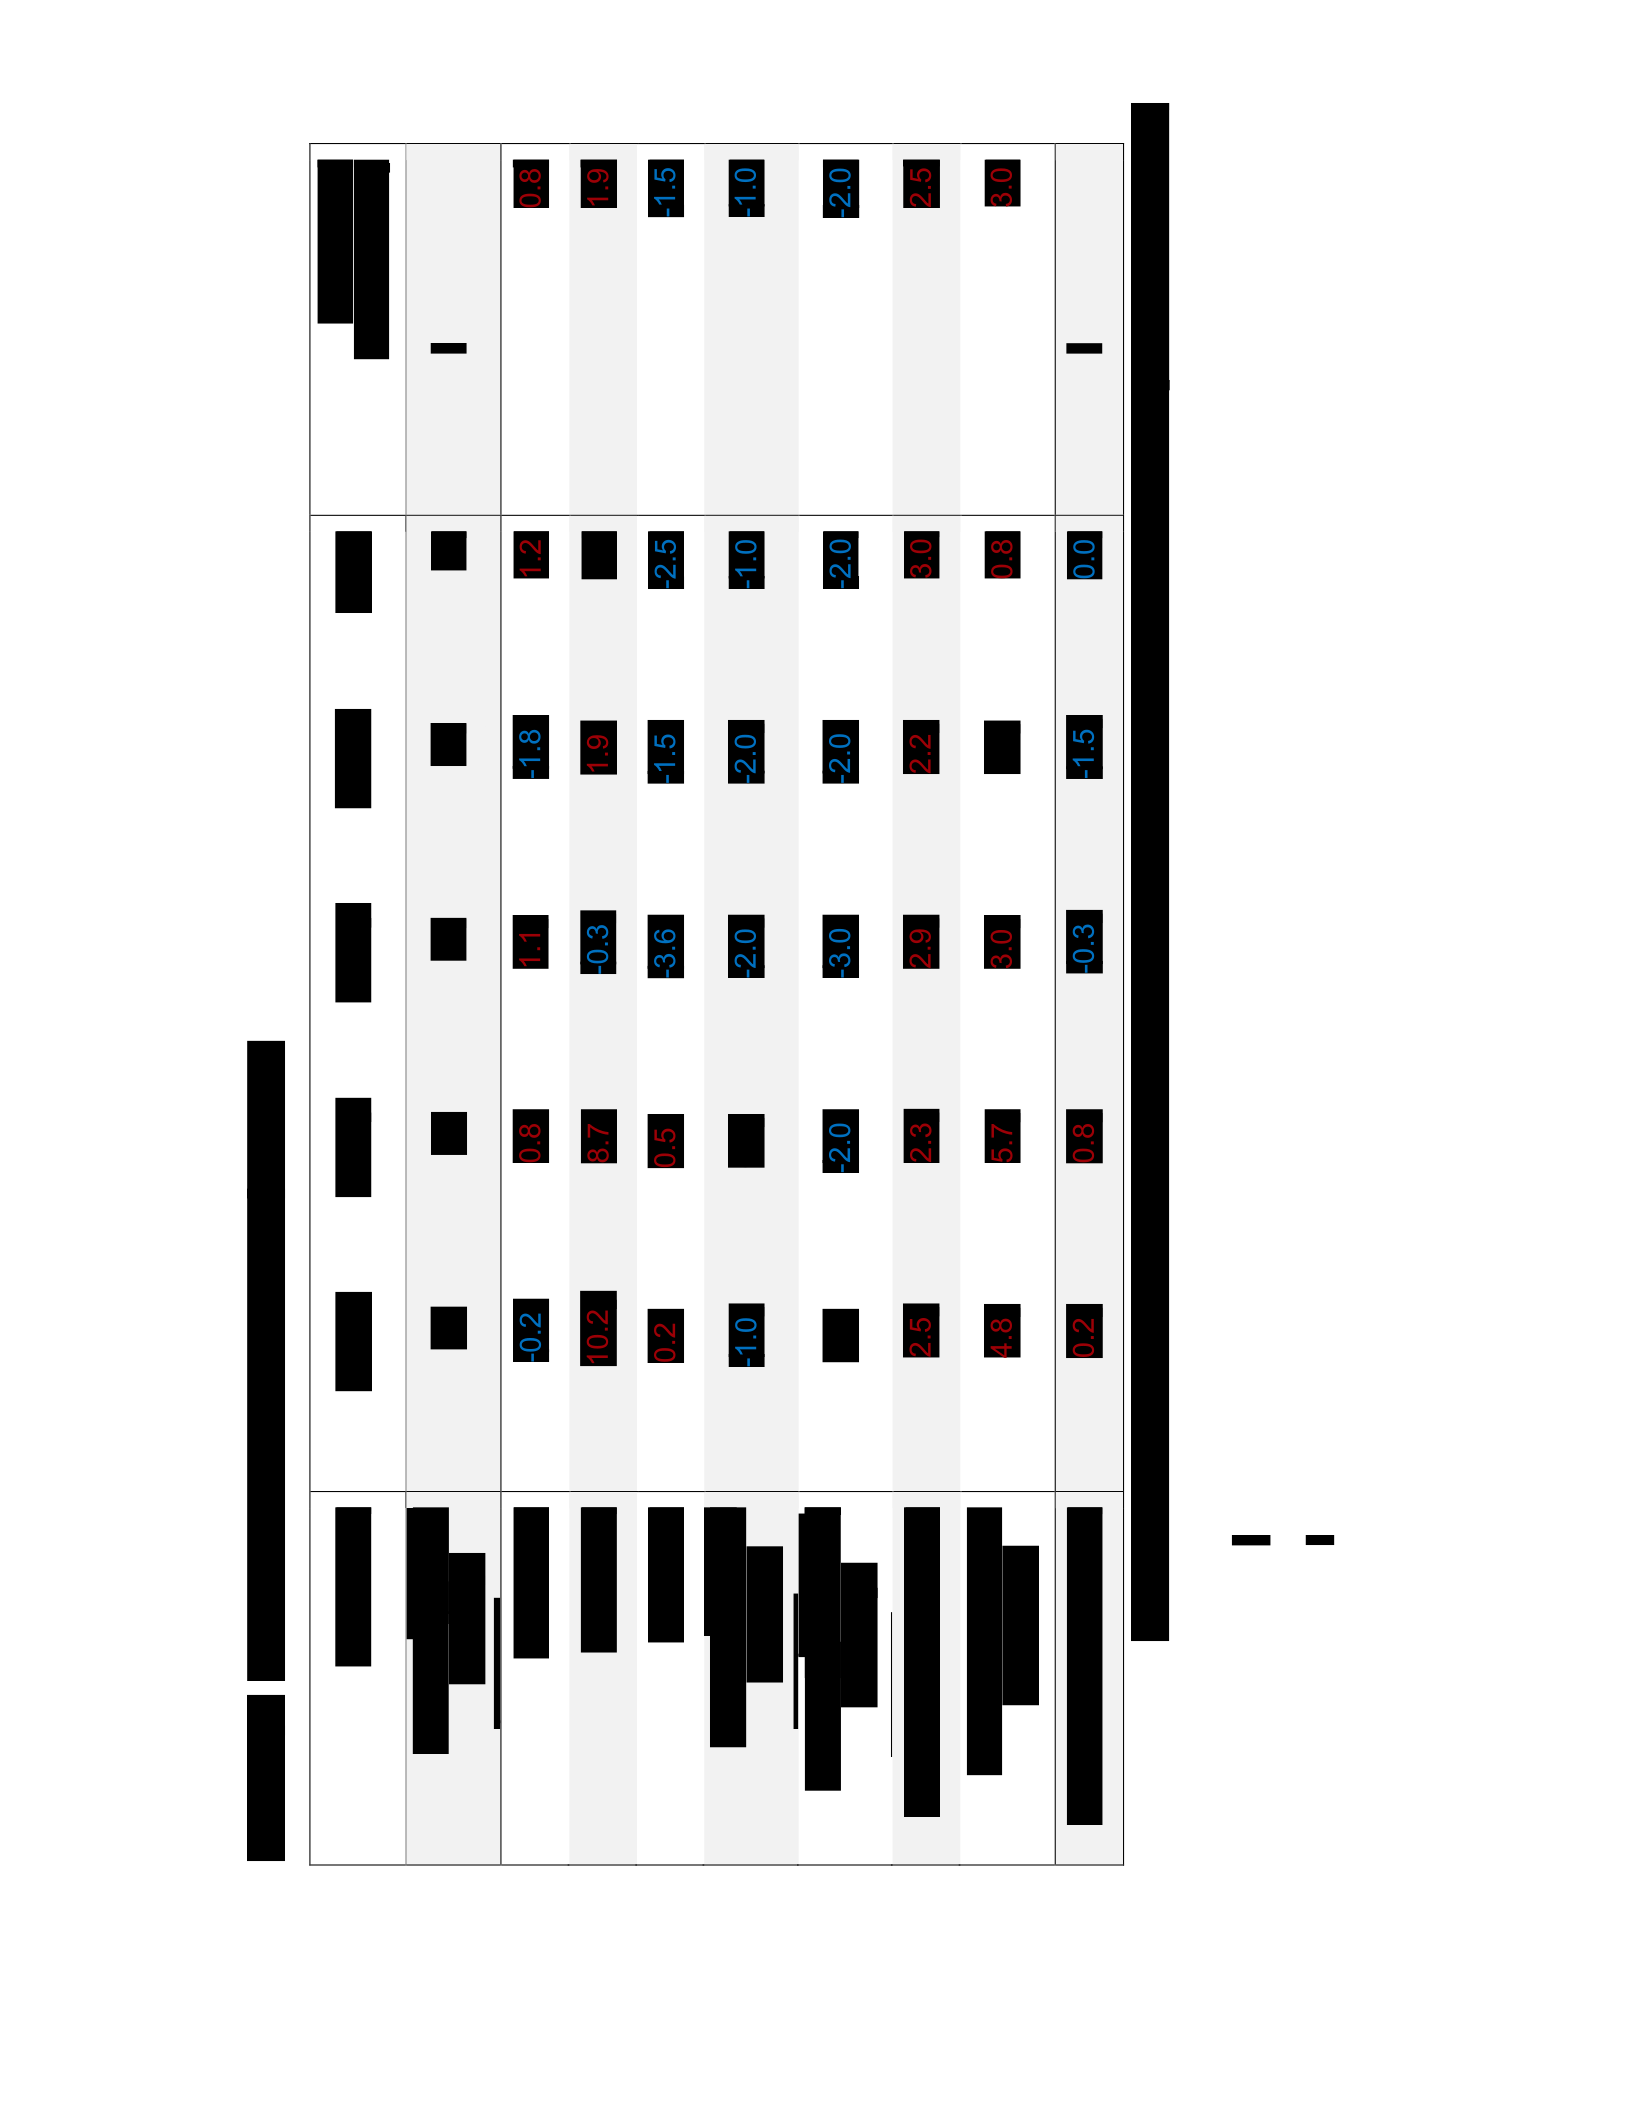
On Day 2 (October), air temperatures ranged from the low 60’s into the mid 70’s
(˚ F). The Governor’s Mansion was much warmer than the rest of the observation values

at the first observation time, but as the day progressed, the observations became more
homogenized with the rest of the observations (Table C.3). Temperatures at the
Renaissance and the Nature Center were consistently warmer than KJAN, while the
Capitol Building, and the two other airports were consistently cooler than KJAN. Median
temperature differences between the observation sites and the airports show nearly all
observation sites to be warmer than the airports. The only exception is the Capitol
Building, which is cooler than KJAN and KHKS, though still warmer than KMBO (Table
C.4).
The only site through bootstrapping analysis that could be considered statistically
significantly cooler than KJAN was the Capitol Building (~1˚ F cooler at the 97.5% CI),
and some of the site distributions (such as Lakeland, Fondren, and the Renaissance Mall)
straddle KJAN and therefore cannot be considered statistically different from KJAN. The
Governor’s Mansion is about 1˚ F warmer at the 2.5% CI and the Clinton Nature Center
is also warmer at the 2.5% CI (0.33˚ F) (Table C.9), therefore both can be considered
statistically significantly higher than KJAN. The 97.5 percentile was considered for the
Capitol as this would determine if the extreme high end of the Capitol’s distribution
would be below that of KJAN. The 2.5 percentile was considered when studying the
Mansion and the Nature Center to determine if the extreme low end of their distributions
was indeed warmer than KJAN.
4.2 Apparent Temperature
Heat index values on Day 1 were generally in the mid 80’s to upper 90’s (Table
C.5). The differences in apparent temperature between observation sites and KJAN were
highly variable. Most of the median heat index values at each observation site were
higher than KJAN, though the two regional airports reported lower median heat indices.

Day 2 saw lower heat indices, remaining in the 70’s throughout the day (Table C.6). All
of the observation sites consistently measured higher heat indices than KJAN at the initial
observation period, with most sites recording heat indices 5+˚ F higher than KJAN. Once
again, the median apparent temperatures across all observation locations were higher than
what was recorded at KJAN. The two other airports did record lower heat indices at
various times throughout the day.
When bootstrapping the apparent temperatures, the method indicates that all of the
observation locations have statistically higher heat indices than KJAN. The Lakeland
Drive site was the closest to the airport, negligibly warmer at the 2.5% CI (0.02˚ F). The
Governor’s mansion was also the warmest again, over 1.5˚ F warmer at the 2.5% CI
(Table C.10). These confidence intervals suggest that the normal data for these locations
would be warmer than KJAN. For values to be statistically higher than KJAN, the 2.5 %
CI is considered to ensure that the lower end of the normal distribution is above KJAN.
4.3 Surface “Skin” Temperature
Aside from the shaded grassy surface at the Capitol Building, every site had
surface skin temperatures above 100˚ F on Day 1 (Table C.7). The asphalt surfaces at the
Governor’s Mansion and the Lakeland Drive sites recorded the warmest values, both in
excess of 140˚ F during the day. Generally speaking, there was more consistency in the
values at a given location than at a given time. The shaded Capitol Building grounds had
the least variation, with the nearby Governor’s Mansion having the most variability (as
indicated by higher standard deviations). Day 2 skin temperatures were lower, with some
locations have skin temperatures as low as 63˚ F (Table C.8). Even so, in mid-October,
many of the locations saw skin temperatures above 80˚ F, with the nature center

experiencing skin temperatures over 100˚ F. Unlike Day 1, variation in skin temperatures
on Day 2 was greater by time period than by location.
4.4 Land Cover
If the urban form influences its local climate, then a relationship should exist
between land use type and climate. Using the NLCD data on developed space near each
location, the six locations were compared based on their percentage of total developed
space, high intensity developed space, and medium intensity developed space (Figure
C.1). Median temperature difference at each location were then compared with the
percentage of total developed space (Figure C.2). The trend in the correlation is a
negative one, more developed space is correlated with lower median temperature
differences. This trend is also found when studying high intensity and medium intensity
developed space (though the slope of these lines vary significantly) (Figure C.3, C.4).
Overall, there is a negative linear correlation between developed space (all, high intensity,
and medium intensity) and median temperature difference. Additionally, Spearman rank
correlation coefficients were calculated to determine the non-parametric dependence of
the variables (Table C.12). Aside from August temperature differences and all developed
space, the Spearman correlations were negative (-0.6 to -0.9). Both the linear and
Spearman correlations would imply that more developed space reduces the difference
between the site observations and the observations at KJAN.
The two downtown locations were the most dissimilar in median temperature
difference, yet they have similar percentages of developed space, and the two largest
percentages of high intensity developed space. These two locations also have the highest
percentage of medium intensity developed space, showing the same disparity (Figure

C.4). The large difference between the Governor’s Mansion and the Capitol Building in
terms of median temperature difference may hint that the urban form’s influence on its
climate may be at a finer scale than a one mile radius around a point.

CHAPTER V
DISCUSSION AND CONCLUSIONS
5.1 Summary of Results
A goal within this research is to determine the thermal differences across the city
of Jackson, and to offer a potential explanation as to why the individually experienced
temperature in a given location is different from what is officially recorded. The results
showed discontinuity between the airfields and the rest of the locations. The airfields
were typically cooler than the observation sites. This suggests that during the summer and
autumn months, adjustments to the warning thresholds and the creation of more specific
heat warnings may need to be considered for certain events. Specifically, these events
would include when the airfields approach dangerous atmospheric thresholds of high
humidity and temperature, while the rest of the city may have already exceeded these
values.
The results suggest that there is both thermal and moisture variation among the
airports and the observed locations. These could be indicative of micro-scale processes
being influenced by the urban environment. Urban form could be a contributing factor in
the noticeable increase in temperature and heat indices at the observed sites compared
with the airports. If the airfields are several degrees cooler as in the case of heat indices
(Table C.3, C.4), then heat warning thresholds used by the National Weather Service
could be reconsidered. Although the heat indices do not approach these thresholds in
October, it is still important to note that large temperature differences still exist across the
Jackson Metro during other times of the year (Table C.4). Heat response plans and
warning procedures should consider intra-city temperature and moisture variability.

The distance between the Capitol and the Governor’s Mansion is only 2 city
blocks, yet some of the largest differences between observation sites are found between
these two (Table C.4, C.9). Air temperature at the Capitol is statistically significantly
cooler than KJAN (per the bootstrapping method), while the Mansion is statistically
significantly warmer (Table C.9). The apparent temperature for both sites were
statistically significantly warmer (Table C.10). Intra-city comparisons do reveal some
interesting pieces of information about land use, urban heating/cooling, and urban design
in Jackson. The Capitol Building, with plenty of green space around it, consistently
experienced cooler, more humid, and tranquil conditions. Although the land uses are
similar, and some of the NLCD types overlap, the two sites are distinctly different in their
meteorological observations. These differences may be attributed to the vegetation at the
Capitol building, which would shade the area, but also increase the moisture level in the
atmosphere. This combination could lead to the change in the Capitol’s measurements
relative to KJAN. Despite the Governor’s Mansion site being a mere two blocks away,
this site saw some of the warmest weather conditions in the experiment (Figure B.8).
Therefore, the land use influences are likely at a finer scale than one mile and the
immediate surroundings are key to the experienced thermal environment at the Capitol
Building. This falls in line with what was observed in a study of individual-level thermal
variation in a Boston neighborhood (Kuras et al. 2015). Thus, the urban form could have
a significant role in these differences and the variations could become amplified in the
future as urbanization grows and the median temperature increases.
There are noticeable differences across the observation sites when studying the
land use alongside the meteorological data. At the Lakeland Drive site, the developed
space is closest to the observation site, and of note, medium and high intensity developed

land uses make up over a third of the developed areas around the site (Figure B.7).
Through bootstrapping, this site is statistically warmer than KJAN in apparent
temperature, though not in air temperature (Table C.9, C.10). Fondren also experienced
statistically significantly warmer apparent temperatures, however it is not statistically
significantly different from KJAN when looking at air temperature (Table C.9, C.10).
Fondren is heavily developed; although much of this developed area is composed of low
intensity and open development (Figure B.4). Specifically, the observation site is
surrounded by an older, well established neighborhood with plenty of trees lining the
streets and covering the lawns. The vegetation may be aiding in the increased heat indices
adding moisture to the air. Therefore, even for areas that are older, with more developed
open space and street shading (Figure B.4), the airports may not always be representative
of the environment people are experiencing.
The Renaissance location is just as diverse in land use as the Lakeland Drive site,
and the immediate surroundings are developed space, with a variety of land uses outside
of the immediate area (Figure B.10). The Renaissance also has no statistical significant
differences in temperature from KJAN; however the site is statistically significantly
warmer in apparent temperature (Table C.9, C.10). Some differences that change the
albedo at the Renaissance relative to Lakeland include trees, light colored buildings, as
well as the pavement in the center of the mall, which is either white cement, brick, or
cobblestone. Even at the Nature Center, the site observations suggest that the immediate
surroundings play a more important role than land use a mile away (Figure B.19). The
nature center itself is secluded from the nearby neighborhood and roadways. The forested
area reduces airflow, trapping heat and moisture, and keeping the nature center warmer
than what would be anticipated in a less urban area. The nature center was one of the only

two sites to be statistically significantly warmer than KJAN in both air temperature and
apparent temperature (Table C.9, C.10).
Finally, linear and Spearman correlations weakly suggest that the two variables
(temperature and developed space) are negatively correlated, implying that increasing
developed space leads to lower air temperatures. This is intriguing as this is counter to
what is normally thought of in regard to the UHI. The overall small sample size of the
data could easily be limiting these correlation methods from gaining a full perspective, as
the R-squared values for the linear trends were low. But even within this trend, there is a
difference between measurements at the Capitol and the Mansion despite having very
similar land uses surrounding them. These differences may point to variability at a finer
scale than what was being measured.
5.2 Discussion of Urban Form Improvements
With these results in mind, there are numerous ways of re-designing the urban
environment of the Jackson Metro to be more sustainable, with reduced energy usage and
more efficiency in the thermoregulation of the urban form. By utilizing some of these
urban design methods, there are ways of reducing the impact of the UHI in Jackson
through landscape architecture. Even as the local climate changes, these methods can
help prevent stress on the urban form from climate change. Increased stress from
weathering and atmospheric changes can lead to shorter structure life and decrease the
ability of the building to be efficiently heated and cooled (Hamin and Gurran 2009;
Eliasson 2000a). This discussion highlights some of the short-term solutions and
longterm changes to the urban planning and design of Jackson that can produce a more
resilient mid-sized city to climate change. Ultimately, Jackson must choose for itself to
pursue opportunities to become a more resilient city. While scientific evidence can

support the decision to become more resilient, the populace of Jackson must want change
and willingly act upon results of urban planning research to produce resiliency.
More specifically, a city-wide change in urban design would not be the best
approach. Each site discussed has unique aspects of it that would determine what
improvements can be made (Table D.1). At the Clinton Community Nature Center, there
are opportunities to combat the rather stagnant air mass within the nature center. One
option to accomplish this is in thinning the trees to allow more wind flow to reach the
ground, potentially cooler the air temperature as the air flow would provide be able to
advect cooler air to the area and remove some of the heat and moisture as well. This is not
an urban design, but may help in cooling the atmosphere at the nature center. The nature
center is limited in its urbanization with only one building and two small concrete slabs
for handicapped parking. The lack of urbanization would reduce the number of options in
terms of urban design despite the data that indicate the site is statistically significantly
warmer in both air temperature and apparent temperature.
In Fondren, with an established community and mature trees for street shading in
the residential areas, a push could be made for more street shading and canopy cover in
the small shopping centers of the neighborhood. The canopy and street shading could
reduce the air temperature and provide more shading to reduce the UHI. Fondren only
experienced statistically significantly warmer apparent temperatures, yet increasing
shading could still reduce the heat indices around the location. Additionally, the parking
lots and streets in Fondren could be used as a testing bed for the feasibility of pervious
pavements in the city of Jackson. Despite the shaded streets, there is not a lot of green
space in this neighborhood, which could be another opportunity for mitigation. However,
the density of this neighborhood and its commercial areas may limit the opportunity to

expand the green space. With a varied mix of land-use in Fondren, including adding more
green space, Debbage and Shepherd (2015) have suggested that this would decrease the
UHI in Fondren. Parks and other types of green spaces also provide areas of recreation
and relaxation in the neighborhood, and encourage more outdoor human activity in the
vicinity of the green space. Placing green spaces into Fondren could provide another
incentive to bring more residents back into the core of the city, helping combat the urban
sprawl that is a contributing factor to the UHI (Williams 2000b).
Further north at the Renaissance Mall, the central part of the mall is fairly
welldesigned with street shading from trees and some pervious pavements. The addition
of tress to the asphalt parking lots on the periphery would be useful to mitigate the heat
island; although the moisture levels may increase some due to the added vegetation. A
study on the HVAC system use and management could help reduce energy consumption
at the mall, and limit the amount of heat being expelled from the buildings into the
surrounding environment. Each added sustainable design could help reduce the apparent
temperatures experienced at the center of the Renaissance Mall.
The Dogwood Shopping Center on Lakeland Drive is another location that could
benefit from a study in sustainable urban design. Redesigning the large stores and their
HVAC systems as well as the addition of street shading and green space could aid in
lowering the apparent temperature relative to KJAN. The large asphalt parking lots and
stores could be shaded through either awnings or trees, additionally, pervious pavements
would help as well due to the expansive amounts of paved surfaces at the site. The vast
expanses of paved surface could be a major contributor to the warmer conditions there
relative to the airport.

Street shading via trees would take some thought and planning at the Dogwood
Shopping Center and in other parts of the city. Strategic placement of deciduous trees
would improve the number of shaded areas around the city, improve air quality, reduce
the canyon geometry of the city (i.e. windiness), and lower the UHI. The selection of
deciduous trees is a choice that could help cool the air during the warm summer months,
as well as reduce the skin temperature of surface materials by blocking some direct
sunlight from reaching the ground. During the winter months, these trees become
dormant, losing their leaves and allowing more incoming solar radiation to reach the
surface, moderating the temperatures at the surface. The moderation of temperature
would warm the surface during the heat of the day, which would improve thermal comfort
during the winter. Another benefit to increased tree canopy would be the reduction of soil
erosion and stormwater runoff around the Dogwood Shopping Center (Golany 1996). A
trade-off with more solar radiation is that the wind reduction the trees provide would be
reduced during the months with bare limbs during the dormant season.
The Capitol Building is another site like the nature center where urban design
adaptation and mitigation strategies may not work as well. The landscaping of the
grounds do use more water resources, and so a consideration for water recycling might be
relevant, but in terms of mitigating for the UHI, this location might consider adding more
trees, or redesigning the HVAC systems of the Capitol itself. The statistically cooler site
(in terms of air temperature) does suggest that the added green space and tree canopy
does help in cooling the air at the Capitol Building, and reducing the UHI. The apparent
temperature remains statistically higher than KJAN, but this likely due to increased
moisture levels from the vegetation and irrigated landscaping.

The Governor’s Mansion site is more commercial in nature and would benefit
from HVAC system considerations, additional street shading from deciduous trees, as
well as planning for pervious pavements in the future. Each of these would help reduce
the air temperature at the Governor’s Mansion and the UHI of the downtown area. These
would be helpful at this site as the data indicate that the Governor’s Mansion experiences
statistically warmer air and apparent temperatures. The addition of green roofs in
downtown Jackson could lead to decreased expense of HVAC. This could free up
businesses to expand their company and make more sustainable improvements to their
business and the buildings themselves. Should Jackson consider sustainable urban design
for downtown buildings, then strategies to decrease the need or dependency on HVAC
systems would be created to minimize the UHI and adapt to a changing climate. This can
be done through using alternative energies, such as solar and hydro-electric energy, as
well as improving airflow through the building by designing buildings to bring in outdoor
air through vents and send it out the other side of the building (Lyle 1996; Mills 2006;
Ndubisi 2008; Egger 2006; Petrova et al. 2013).
The extensive paved network of roadways increases solar radiation absorption and
stormwater runoff. Both of these are common to urban areas but could be mitigated
through the use of porous pavements as previously discussed. While some of these trends
in road networks and urbanization are common to many other urban areas around the
country, Jackson’s urban growth has also been influenced by the rivers, lakes, and the
national park that are located around and throughout the city, leaving some gaps in the
urbanization process. These gaps provide opportunities for more study into the
importance of green space in a metropolitan area and the quantification of their impact.

5.3 Limitations and Future Research
While efforts were made to prevent any biases in the data collected, biases and
errors still exist in this thesis. First, the data were collected through the work of eight
different student volunteers going out to the sites and collecting data. There would be
copy and rounding differences, exact timing of measurement, and strategic selection of
the specific location at the sites which cannot be fully accounted for. Additionally, these
instruments are relatively poor quality when compared with the ASOS and AWAS
stations that are located at the three airports. The automated stations have been calibrated
over several years to ensure they are functioning properly, whereas these instruments
were calibrated for a just few minutes.
The lack of multiple observations around one location limits the ability of the
research to robustly conclude definite differences between the sites; however, future
research should take into consideration how the observations may change as data is
gathered from around the sites. For example, moving a few feet from shaded to full
sunshine should have a noticeable impact on the observations. Additionally, the wide
variety of land use around the locations may all be impacting the observations, creating a
lot of “noise” in the data as to what are the main contributors and influencers to the
observations. It is difficult to determine what land uses are affecting the location’s
observations, and at what distance away do the impacts become negligible. This is
something that would require more research and study to accomplish, but could studied in
future research.
The number of locations and observations in this study were not large enough to
draw major statistical conclusions about the thermal variations across Jackson, although
the data were bootstrapped, the number of repetitions was very high to reach a normal

distribution. The high number of repetitions limits how reliable this statistical measure of
significance is. The bootstrapped data do suggest that many of the locations may be
warmer, but, more research to confirm this is needed. Most of the statistical differences
still fall within the 4-6˚ F window of error associated with the instrument. This also
detracts from the significance of the data. Additionally, the lack of heat flux information
prevents significant results in UHI quantification for Jackson.
The results of this thesis provide several avenues for future research. The
methodology could be the groundwork for more extensive studies in Jackson, possibly
using personal temperature sensors such as iButtons (Kuras et al. 2015) or other forms of
data collection. However, future research should consider the heat flux at the locations to
aid in quantifying the UHI. This research did not calculate the heat flux due in part to
unreliable means of measuring atmospheric pressure and wind. The continuous
observation of meteorological data within the city would be another next step in
measuring the thermal fingerprint of the Jackson Metro and provide better understanding
of the UHI during the winter months and overnight when the UHI is most prominent.
Continuous measurement would also allow for more statistical analyses of the data to
generalize and assess the information. This data would also improve the temporal scale of
the research, allowing for a seasonal study of the urban climate of Jackson.
In landscape architecture, studies to show the feasibility and cost effectiveness of
sustainable urban design in the city of Jackson and these neighborhoods are needed.
Architectural sketches and designs tailored to mitigate for the UHI in these locations as
discussed in this research could be done and offered to the city as a means of encouraging
more discussion of how the urban form can be manipulated to mitigate for a changing
climate. Strategies to renovate and retro-fit current structures in Jackson can be used to

lower the HVAC needs of the city. Jackson has a diverse urban architecture as the city has
grown, developed, and expanded over a period of time with multiple architecture patterns
and motifs used across the city.
5.4 Conclusions
Studies in urban climatology have been ongoing for over 150 years, and there are
clear indications that there does exist an urban heat island effect in many cities.
Additionally, landscape architects have determined that building material and design of
buildings and cities can be manipulated to reduce the energy usage and pollution from a
building or city. When considering and studying the atmospheric environment of the city
of Jackson, there is a discernible difference in both temperature and moisture levels
around the city. The variations may well be related to the types of urban form found in the
neighborhoods and suburbs of the Jackson Metro. Land use and land cover data suggest
that influences by the urban form occur at a very fine scale (<30 m). Further research is
needed to confirm this; however, this research suggests that some effort to mitigate and
adapt for the changing climate (i.e. reducing the UHI) would help improve the resiliency
of the city of Jackson.
Beyond the city of Jackson, the urban centers of the world must consider ways of
using landscape architecture to reduce their vulnerability to climate change. An
international push toward considering the climate has been the catalyst for many
considerations of urban climatology, landscape architecture, and sustainable urban design.
If smaller municipalities are willing and able to adopt these strategies, they can make
faster and more efficient decisions to create a more resilient society in the face of a
different future climate. Opportunity for increased resiliency in an area anticipated to be
highly impacted by a changing climate would be beneficial to the United States as a

whole in determining ways of improving national resiliency in light of global climate
fluctuations.
The goal of this research was to determine if there is any thermal variation
throughout Jackson, and if these variations could be connected to the built environment.
With limited statistical support, there is evidence that there is variation and that this
variation is at a very fine scale. While there is no hard evidence to support the hypothesis
that the built environment is contributing to the thermal variability around the city, the
fine scale variations require closer investigation of the built environment around them to
confirm or deny this hypothesis.
REFERENCES
Arnfield, a. J., 2003: Two decades of urban climate research: A review of turbulence,
exchanges of energy and water, and the urban heat island. Int. J. Climatol., 23, 1–
26, doi:10.1002/joc.859.
Barker, T., 2007: Climate Change 2007 : An Assessment of the Intergovernmental Panel
on Climate Change. Change, 446, 12–17, doi:10.1256/004316502320517344.
http://www.ipcc.ch/pdf/assessment-report/ar4/syr/ar4_syr.pdf.
Brattebo, B. O., and D. B. Booth, 2003: Long-term stormwater quantity and quality
performance of permeable pavement systems. Water Res., 37, 4369–4376,
doi:10.1016/S0043-1354(03)00410-X.
http://linkinghub.elsevier.com/retrieve/pii/S004313540300410X.
Carter, L. M., J. W. Jones, L. Berry, V. Burkett, J. F. Murley, J. Obeysekera, P. J.
Schramm, and D. Wear, 2014: Chapter 17: Southeast and the Caribbean. Clim.
Chang. Impacts United States Third Natl. Clim. Assessment., 396–417,
doi:10.7930/J0N-P22CB.On.
http://nca2014.globalchange.gov/report/regions/southeast.
Collins, M., and Coauthors, 2013: Long-term Climate Change: Projections,
Commitments and Irreversibility. Clim. Chang. 2013 Phys. Sci. Basis. Contrib.
Work. Gr. I to Fifth Assess. Rep. Intergov. Panel Clim. Chang., 1029–1136.
Corburn, J., 2009: Cities, Climate Change and Urban Heat Island Mitigation: Localising
Global Environmental Science. Urban Stud., 46, 413–427,
doi:10.1177/0042098008099361.

Debbage, N., and J. M. Shepherd, 2015: The urban heat island effect and city contiguity.
Comput. Environ. Urban Syst., 54, 181–194,
doi:10.1016/j.compenvurbsys.2015.08.002.
http://dx.doi.org/10.1016/j.compenvurbsys.2015.08.002.
Dierwechter, Y., and a T. Wessells, 2013: The Uneven Localisation of Climate Action in
Metropolitan Seattle. Urban Stud., 50, 1368–1385,
doi:10.1177/0042098013480969. <Go to
ISI>://WOS:000319130400004\nhttp://usj.sagepub.com/content/50/7/1368.full.pd
f.
Dixon, P. G., and T. L. Mote, 2003: Patterns and Causes of Atlanta’s Urban Heat Island–
Initiated Precipitation. J. Appl. Meteorol., 42, 1273–1284,
doi:10.1175/15200450(2003)042<1273:PACOAU>2.0.CO;2.
Drake, J., A. Bradford, and T. Van Seters, 2014: Stormwater quality of spring-summerfall
effluent from three partial-infiltration permeable pavement systems and
conventional asphalt pavement. J. Environ. Manage., 139, 69–79,
doi:10.1016/j.jenvman.2013.11.056.
http://dx.doi.org/10.1016/j.jenvman.2013.11.056.
Egger, S., 2006: Determining a sustainable city model. Environ. Model. Softw., 21, 1235–
1246, doi:10.1016/j.envsoft.2005.04.012.
http://ac.elscdn.com/S1364815205001313/1-s2.0-
S1364815205001313main.pdf?_tid=f99e69a8-a8d0-11e4-8453-
00000aab0f26&acdnat=1422657802_41c332aec992b44a2717dcbf3c063608
(Accessed January 30, 2015).
Eliasson, I., 1996: Urban Nocturnal Geometry Temperatures and Land Use. Atmos.
Environ., 30, 379–392.
——, 2000a: The use of climate knowledge in urban planning. Landsc. Urban Plan., 48,
31–44, doi:10.1016/S0169-2046(00)00034-7.
——, 2000b: The use of climate knowledge in urban planning. Landsc. Urban Plan., 48,
31–44, doi:10.1016/S0169-2046(00)00034-7.
——, and H. Upmanis, 2000: Nocturnal airflow from urban parks-implications for city
ventilation. Theor. Appl. Climatol., 66, 95–107, doi:10.1007/s007040070035.
Eliasson, I., and M. K. Svensson, 2003: Spatial air temperature variations and urban land
use — a statistical approach. Meteorol. Appl., 10, 135–149,
doi:10.1017/S1350482703002056.
http://doi.wiley.com/10.1017/S1350482703002056.
Gallo, K. P., and T. W. Owen, 1999: Satellite-Based Adjustments for the Urban Heat
Island Temperature Bias. J. Appl. Meteorol., 38, 806–813,
doi:10.1175/15200450(1999)038<0806:SBAFTU>2.0.CO;2.

Golany, G. S., 1996: Urban design morphology and thermal performance. Atmos.
Environ., 30, 455–465, doi:http://dx.doi.org/10.1016/1352-2310(95)00266-9.
http://www.sciencedirect.com/science/article/pii/1352231095002669.
Hamin, E. M., and N. Gurran, 2009: Urban form and climate change: Balancing
adaptation and mitigation in the U.S. and Australia. Habitat Int., 33, 238–245,
doi:10.1016/j.habitatint.2008.10.005.
http://dx.doi.org/10.1016/j.habitatint.2008.10.005.
Hampshire, N., 2004a: City of Keene , New Hampshire Cities for Climate Protection
Campaign Local Action Plan. City,.
——, 2004b: City of Keene , New Hampshire Cities for Climate Protection Campaign
Local Action Plan. City,.
Hodson, M., S. Marvin, and H. Bulkeley, 2013: The Intermediary Organisation of Low
Carbon Cities: A Comparative Analysis of Transitions in Greater London and
Greater Manchester. Urban Stud., 50, 1403–1422,
doi:10.1177/0042098013480967. <Go to
ISI>://WOS:000319130400006\nhttp://usj.sagepub.com/content/50/7/1403.full.pd
f.
Howard, L., 1833: The Climate of London. London, Edinburgh, Dublin Philos. Mag. J.
Sci., XXX.
IPCC, 2013: Annex I: Atlas of Global and Regional Climate Projections. Clim. Chang.
2013 Phys. Sci. Basis. Contrib. Work. Gr. I to Fifth Assess. Rep. Intergov. Panel
Clim. Chang., 1311–1394, doi:10.1017/CBO9781107415324.029.
Jackson, T. L., J. J. Feddema, K. W. Oleson, G. B. Bonan, and J. T. Bauer, 2010:
Parameterization of Urban Characteristics for Global Climate Modeling. Ann.
Assoc. Am. Geogr., 100, 848–865, doi:10.1080/00045608.2010.497328.
Janković, V., and M. Hebbert, 2012a: Hidden climate change - urban meteorology and the
scales of real weather. Clim. Change, 113, 23–33, doi:10.1007/s10584-0120429-1.
——, and ——, 2012b: Hidden climate change - urban meteorology and the scales of real
weather. Clim. Change, 113, 23–33, doi:10.1007/s10584-012-0429-1.
Kuang, X., G. Ying, V. Ranieri, J. Sansalone, and M. Asce, 2015: Examination of
Pervious Pavement Pore Parameters with X-Ray Tomography. 04015021, 1–13,
doi:10.1061/(ASCE)EE.1943-7870.0000826.
Kuras, E. R., D. M. Hondula, and J. Brown-Saracino, 2015: Heterogeneity in individually
experienced temperatures (IETs) within an urban neighborhood: insights from a
new approach to measuring heat exposure. Int. J. Biometeorol.,
doi:10.1007/s00484-014-0946-x. http://link.springer.com/10.1007/s00484-
0140946-x.

Lechner, N., 2009: Heating, cooling, lighting. xix, 698 pp.
Lyle, J. T., 1996: Regenerative Design for Sustainable Development. John Wiley & Sons,
352 pp.
https://books.google.com/books?hl=en&lr=&id=qB3v3gYofSUC&pgis=1
(Accessed March 9, 2015).
Merem, E., S. Yerramilli, C. Richardson, J. Wesley, T. Walker, D. Foster, J. Williams, and
C. Romarno, 2011: Using Geospatial Information Systems in Analyzing
Urbanization Impacts on Stream Habitats in Southern Mississippi Coastal
Ecosystem. 5, 1624–1641.
Mills, G., 2006: Progress toward sustainable settlements: A role for urban climatology.
Theor. Appl. Climatol., 84, 69–76, doi:10.1007/s00704-005-0145-0.
——, 2007: Cities as Agents of Global Change. Int. J. Climatol., 27, 1849–1857,
doi:10.1002/joc. http://www3.interscience.wiley.com/journal/4735/home.
——, 2008: Luke Howard and The Climate of London. Weather, 63, 153–157,
doi:10.1002/wea.195.
——, 2013: Urban climatology: History, status and prospects. Urban Clim., 10, 479–489,
doi:10.1016/j.uclim.2014.06.004. http://dx.doi.org/10.1016/j.uclim.2014.06.004.
Nations, U., 2014: World Urbanization Prospects, the 2014 Revision.
Ndubisi, F., 2008: Sustainable Regionalism. Landsc. J., 27, 51–68, doi:10.3368/lj.27.1.51.
http://lj.uwpress.org/content/27/1/51.full.pdf+html.
Oke, T. R., 1981: Canyon geometry and the nocturnal urban heat island: Comparison of
scale model and field observations. J. Climatol., 1, 237–254,
doi:10.1002/joc.3370010304. http://dx.doi.org/10.1002/joc.3370010304.
Oke, T. R., 1984: Towards a prescription for the greater use of climatic principles in
settlement planning. Energy Build., 7, 1–10, doi:10.1016/0378-7788(84)90040-9.
Oke, T. R., G. T. Johnson, D. G. Steyn, and I. D. Watson, 1991a: Simulation of surface
urban heat island under ideal conditions at night. Boundary-Layer Meteorol., 56,
339–358.
Oke, T. R., G. T. Johnson, D. G. Steyn, and I. D. Watson, 1991b: Simulation of surface
urban heat island under ideal conditions at night.
Ong, B. L., 2003: Green plot ratio: An ecological measure for architecture and urban
planning. Landsc. Urban Plan., 63, 197–211, doi:10.1016/S0169-2046(02)00191-
3.
Petrova, S., D. Posova, a House, and L. Sykora, 2013: Discursive Framings of Low
Carbon Urban Transitions: The Contested Geographies of “Satellite Settlements”

in the Czech Republic. Urban Stud., 50, 1439–1455,
doi:10.1177/0042098013480964. <Go to
ISI>://WOS:000319130400008\nhttp://usj.sagepub.com/content/50/7/1439.full.pd
f.
Revi, A., D.E. Satterthwaite, F. Aragón-Durand, J. Corfee-Morlot, R.B.R. Kiunsi, M.
Pelling, D.C. Roberts, and W. S., 2014: Urban Areas. Climate Change 2014:
Impacts, Adaptation, and Vulnerability. Part A: Global and Sectoral Aspects.
Contribution of Working Group II to the Fifth Assessment Report of the
Intergovernmental Panel on Climate Change, Cambridge University Press, 535–
612.
Rosenzweig, C., and W. Solecki, 2010: Chapter 1: New York City adaptation in context.
Clim. Chang. Adapt. New York City Build. a Risk Manag. Response New York City
Panel Clim. Chang. 2010 Rep., 1196, 19–28,
doi:10.1111/j.17496632.2009.05308.x.
http://www.ncbi.nlm.nih.gov/pubmed/20545646.
Scholz, M., and P. Grabowiecki, 2007: Review of permeable pavement systems. Build.
Environ., 42, 3830–3836, doi:10.1016/j.buildenv.2006.11.016.
http://linkinghub.elsevier.com/retrieve/pii/S0360132306004227.
Shaviv, E., 2008: Passive and Low Energy Architecture (PLEA) VS Green Architecture
(LEED). PLEA 2008 25th Conf. Passiv. Low Energy Archit. Dublin., 6.
Sherman-Morris, K., M. Brown, and C. Wax, 2012: Mississippi Weather and Climate.
http://eds.a.ebscohost.com/eds/detail/detail?sid=8853383c-4070-47e5-8f77-
618eeca3f43f%40sessionmgr4001&vid=0&hid=4111&bdata=JnNpdGU9ZWRzL
WxpdmU%3d#AN=mstate.2411604&db=cat00043a (Accessed January 20,
2016).
Singh, R. K., H. R. Murty, S. K. Gupta, and A. K. Dikshit, 2009: An overview of
sustainability assessment methodologies. Ecol. Indic., 9, 189–212,
doi:10.1016/j.ecolind.2008.05.011.
http://www.sciencedirect.com/science/article/pii/S1470160X08000678 (Accessed
July 12, 2014).
Steadman, R. G., 1979: The Assessment of Sultriness. Part I: A Temperature-Humidity
Index Based on Human Physiology and Clothing Science. J. Appl. Meteorol., 18,
861–873, doi:10.1175/1520-0450(1979)018<0861:TAOSPI>2.0.CO;2.
Stone Jr., B., and M. O. Rodgers, 2001: Urban form and thermal efficiency. J. Am. Plan.
Assoc., 27, 186–198.
http://d.wanfangdata.com.cn/NSTLQK_10.108001944360108976228.aspx.
Tanguay, G. a., J. Rajaonson, J. F. Lefebvre, and P. Lanoie, 2010: Measuring the
sustainability of cities: An analysis of the use of local indicators. Ecol. Indic., 10,
407–418, doi:10.1016/j.ecolind.2009.07.013.

Transportation, U. D. of, 2014: Telling The Story - The FHWA 2015 R&T Story ,
September 2014 - FHWA-HRT-14-091.
USGS, 2011: Multi-Resolution Land Characteristics Consortium (MRLC).
http://www.mrlc.gov/nlcd11_leg.php (Accessed March 20, 2016).
USGS, N., 2016: Jackson Soils Map. http://websoilsurvey.nrcs.usda.gov/app/.
Veeck, G., C. W. Pannell, C. J. Smith, and Y. Huang, 2011: China’s Geography:
Globalization and the Dynamics of Political, Economic, and Social Change.
Voisin, N., L. Liu, M. Hejazi, T. Tesfa, H. Li, M. Huang, Y. Liu, and L. R. Leung, 2013:
One-Way coupling of an integrated assessment model and a water resources
model: Evaluation and implications of future changes over the US Midwest.
Hydrol. Earth Syst. Sci., 17, 4555–4575, doi:10.5194/hess-17-4555-2013.
While, a., and M. Whitehead, 2013: Cities, Urbanisation and Climate Change. Urban
Stud., 50, 1325–1331, doi:10.1177/0042098013480963.
http://usj.sagepub.com/cgi/doi/10.1177/0042098013480963.
Williams, K., 2000a: Does Intensifying Cities Make Them More Sustainable? Achiev.
Sustain. Urban Form, 30–45.
https://books.google.com/books?hl=en&lr=&id=q8K4yV4ig0YC&pgis=1
(Accessed March 6, 2015).
——, 2000b: Does Intensifying Cities Make Them More Sustainable? Achiev. Sustain.
Urban Form, 30–45.
https://scholar.google.com/citations?view_op=view_citation&hl=en&user=YYXF
_u4AAAAJ&citation_for_view=YYXF_u4AAAAJ:9yKSN-GCB0IC (Accessed
March 6, 2015).
Xu, Y., and F. Wang, 2015: Built environment and obesity by urbanicity in the U.S.
Health Place, 34, 19–29, doi:10.1016/j.healthplace.2015.03.010.
http://www.sciencedirect.com/science/article/pii/S1353829215000441.
Zahran, S., H. Grover, S. D. Brody, and A. Vedlitz, 2008: Risk, Stress, and Capacity.
Urban Aff. Rev., 43, 447–474, doi:10.1177/1078087407304688.
http://uar.sagepub.com/cgi/content/abstract/43/4/447.
LITERATURE REVIEW TABLES AND FIGURES
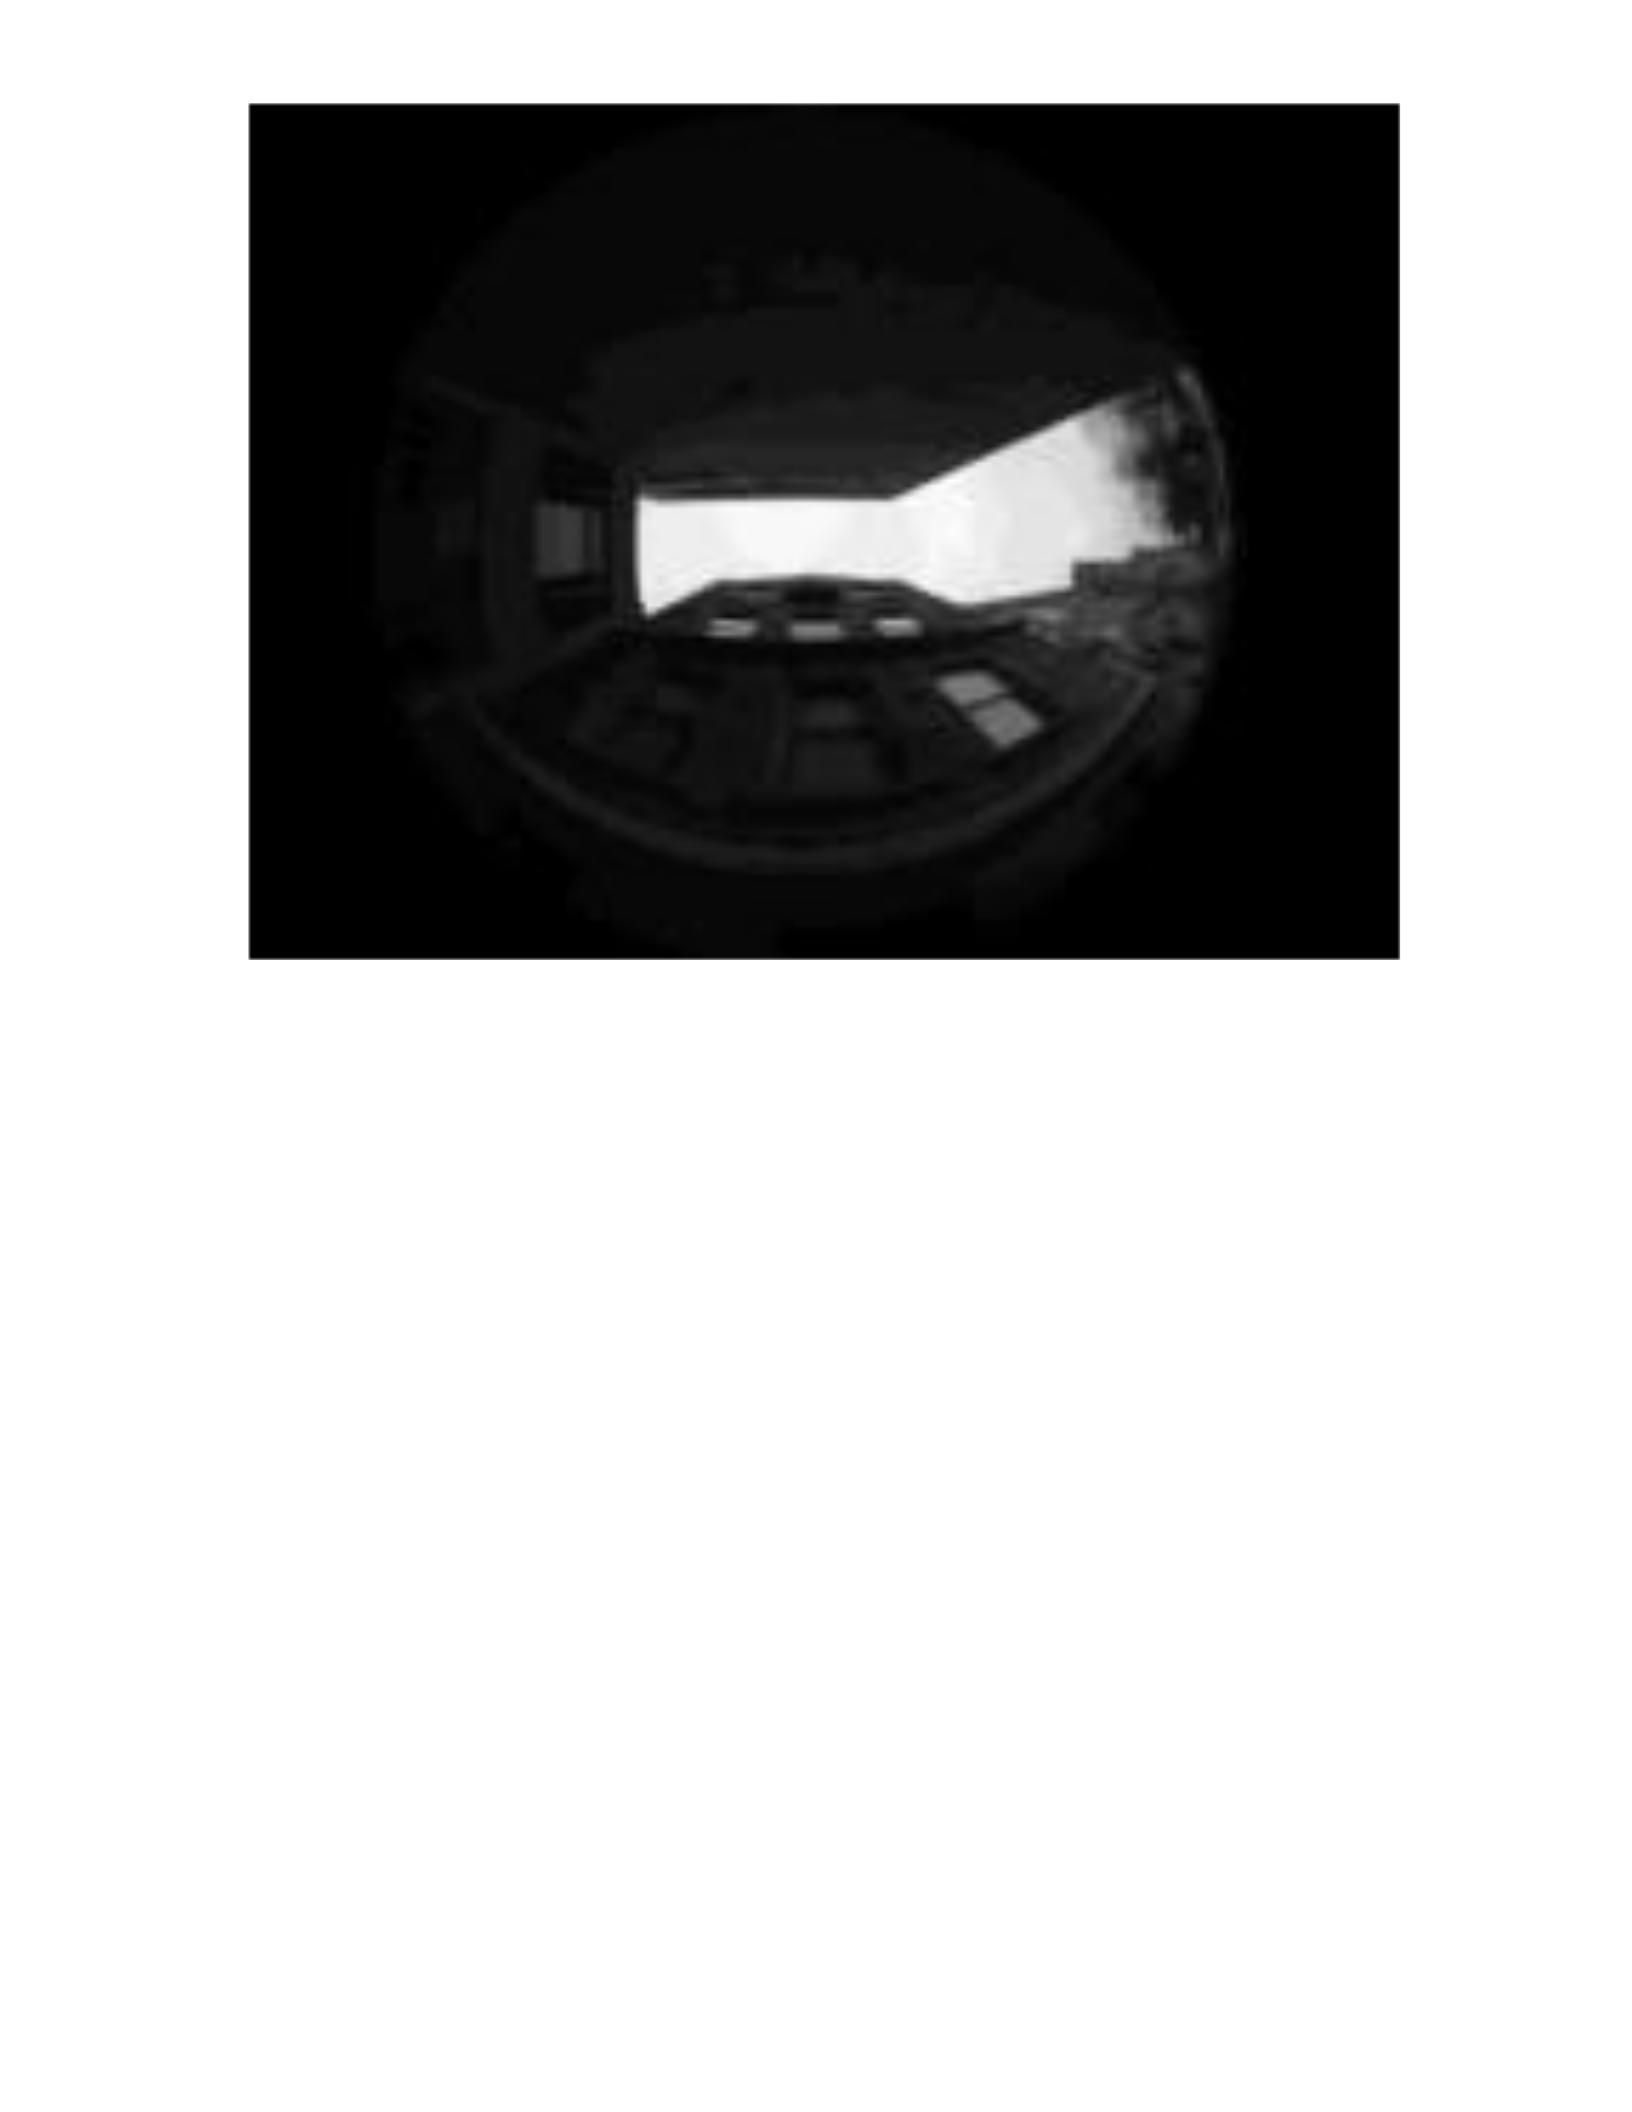
Figure A.1 Fish-eye lens example
Example photograph of a sky-view using a fish-eye lens. Taken from research performed
by Grimmond et al. (2001), where a Nikon CoolPix 950 was fitted with a Nikon FC-E8
fisheye lens.
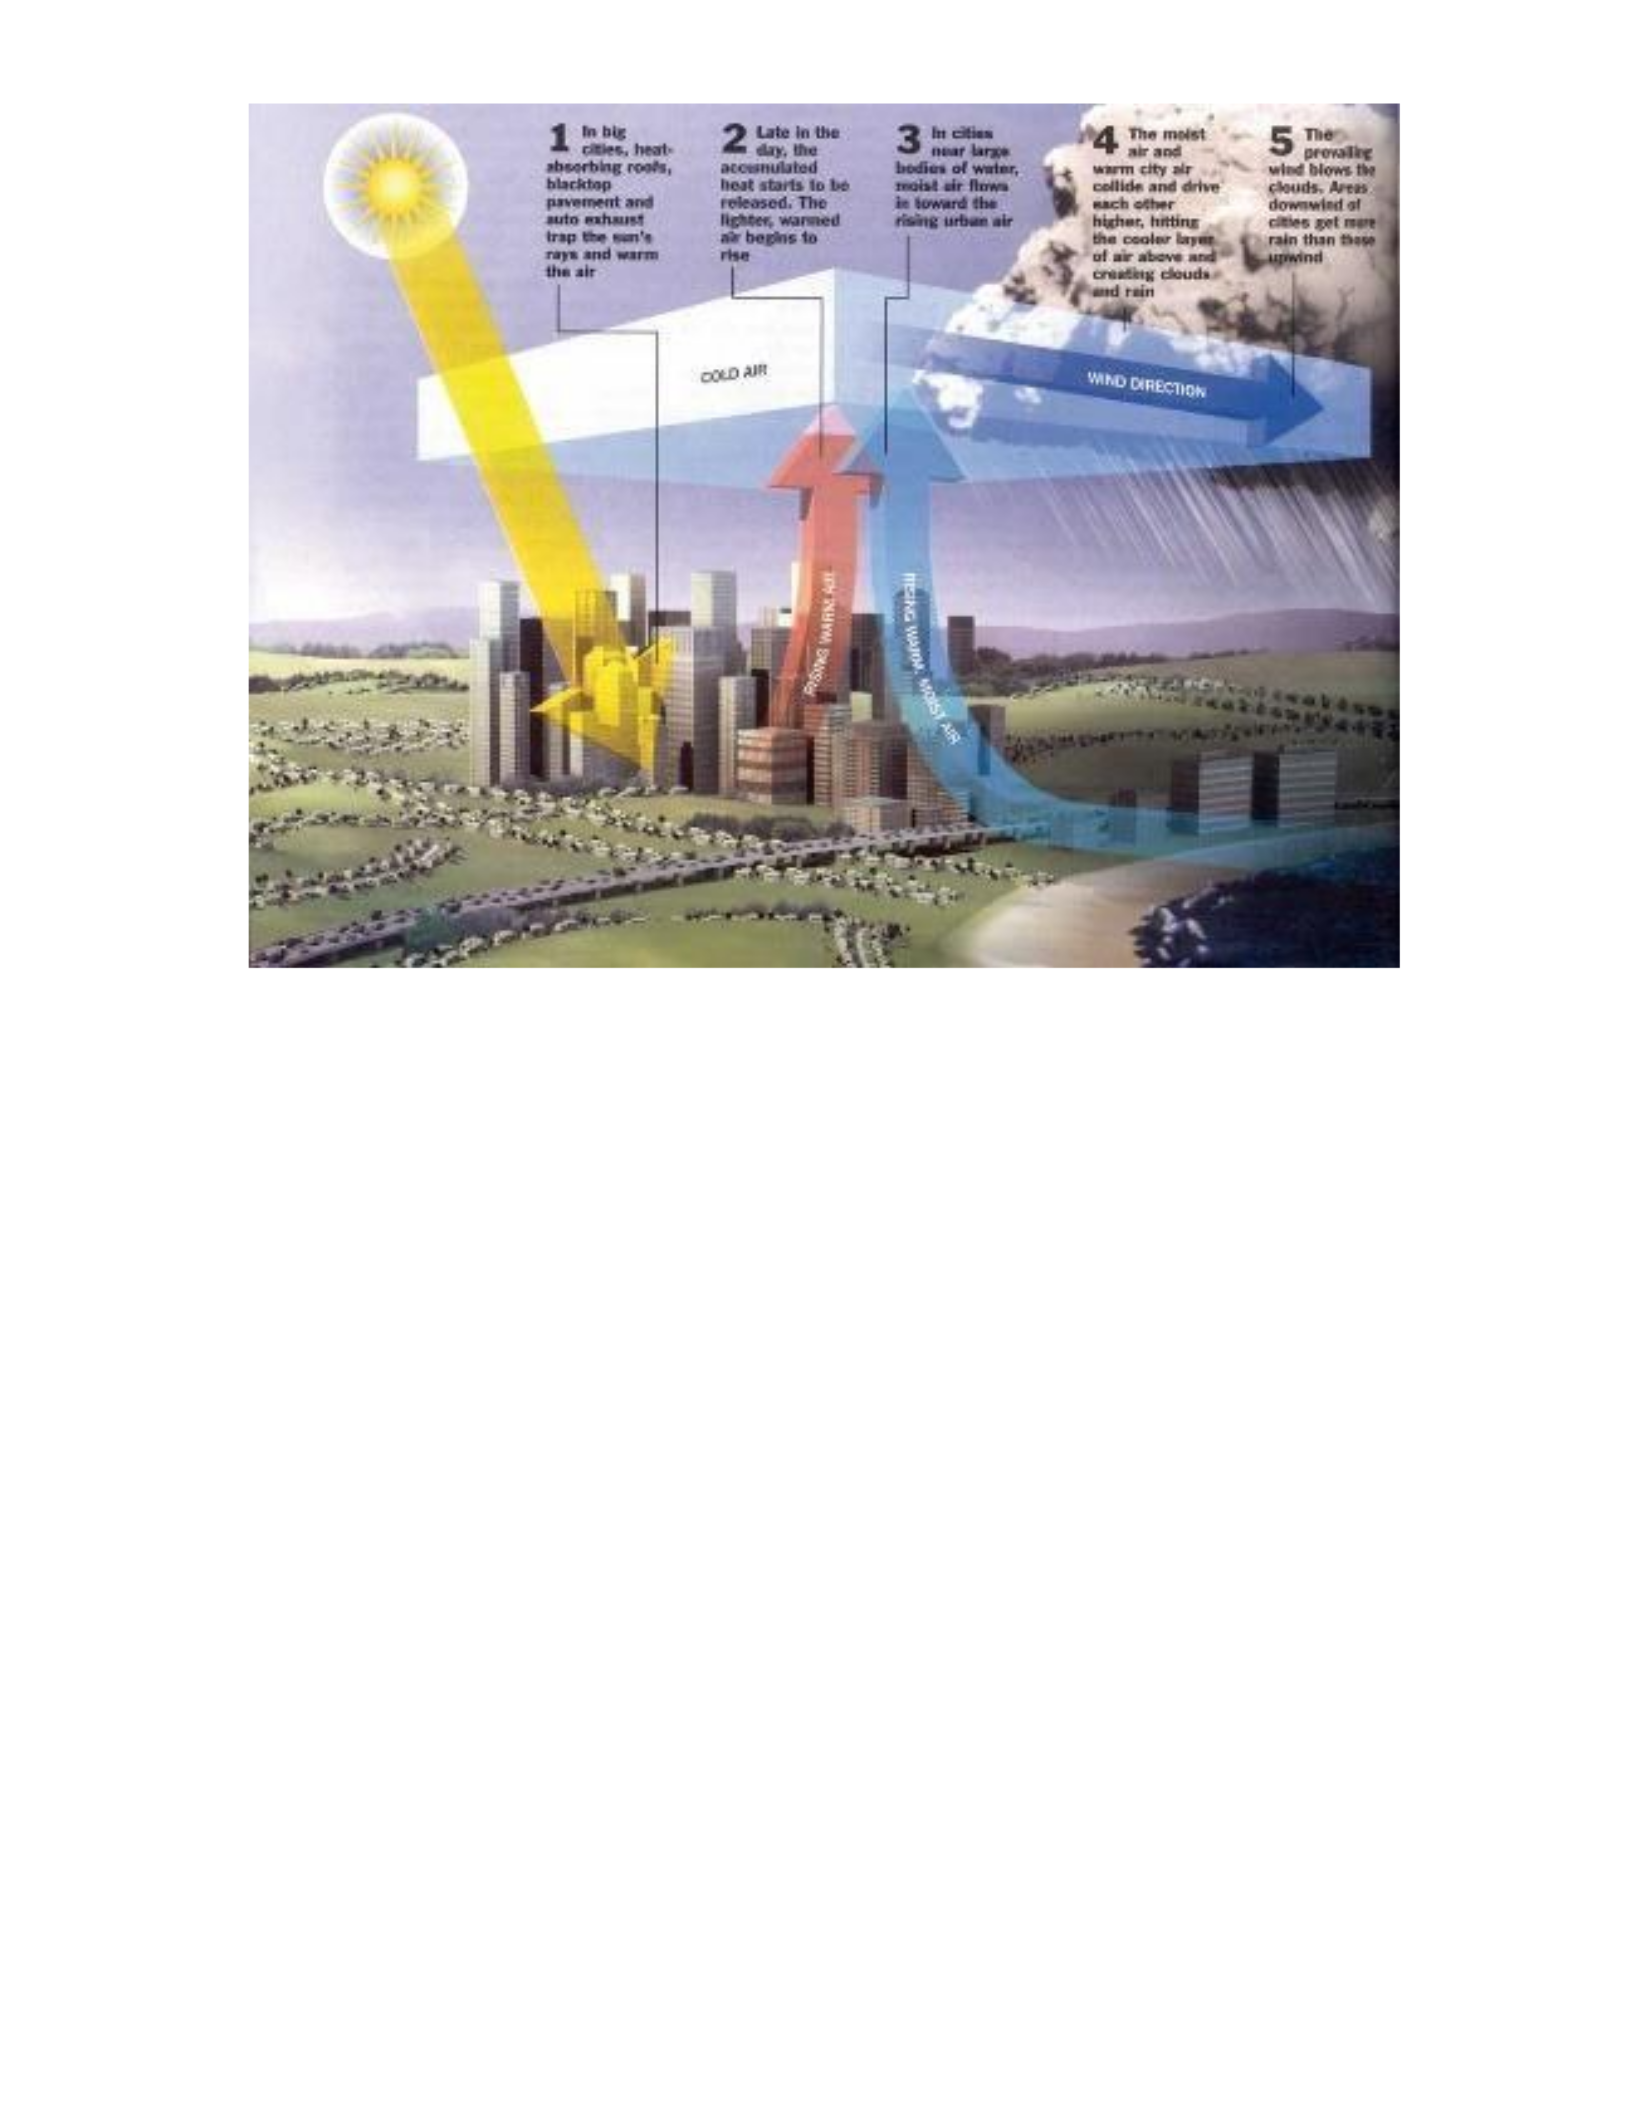
Figure A.2 Urban heat island
World Meteorological Organization’s Diagram of the urban heat island effect. This
diagram details the change in airflow and precipitation patterns around the urban areas.
http://www.wmo.int/pages/publications/bulletin_en/archive/57_4_en/57_4_tang_en.html
Accessed: 2/24/2016
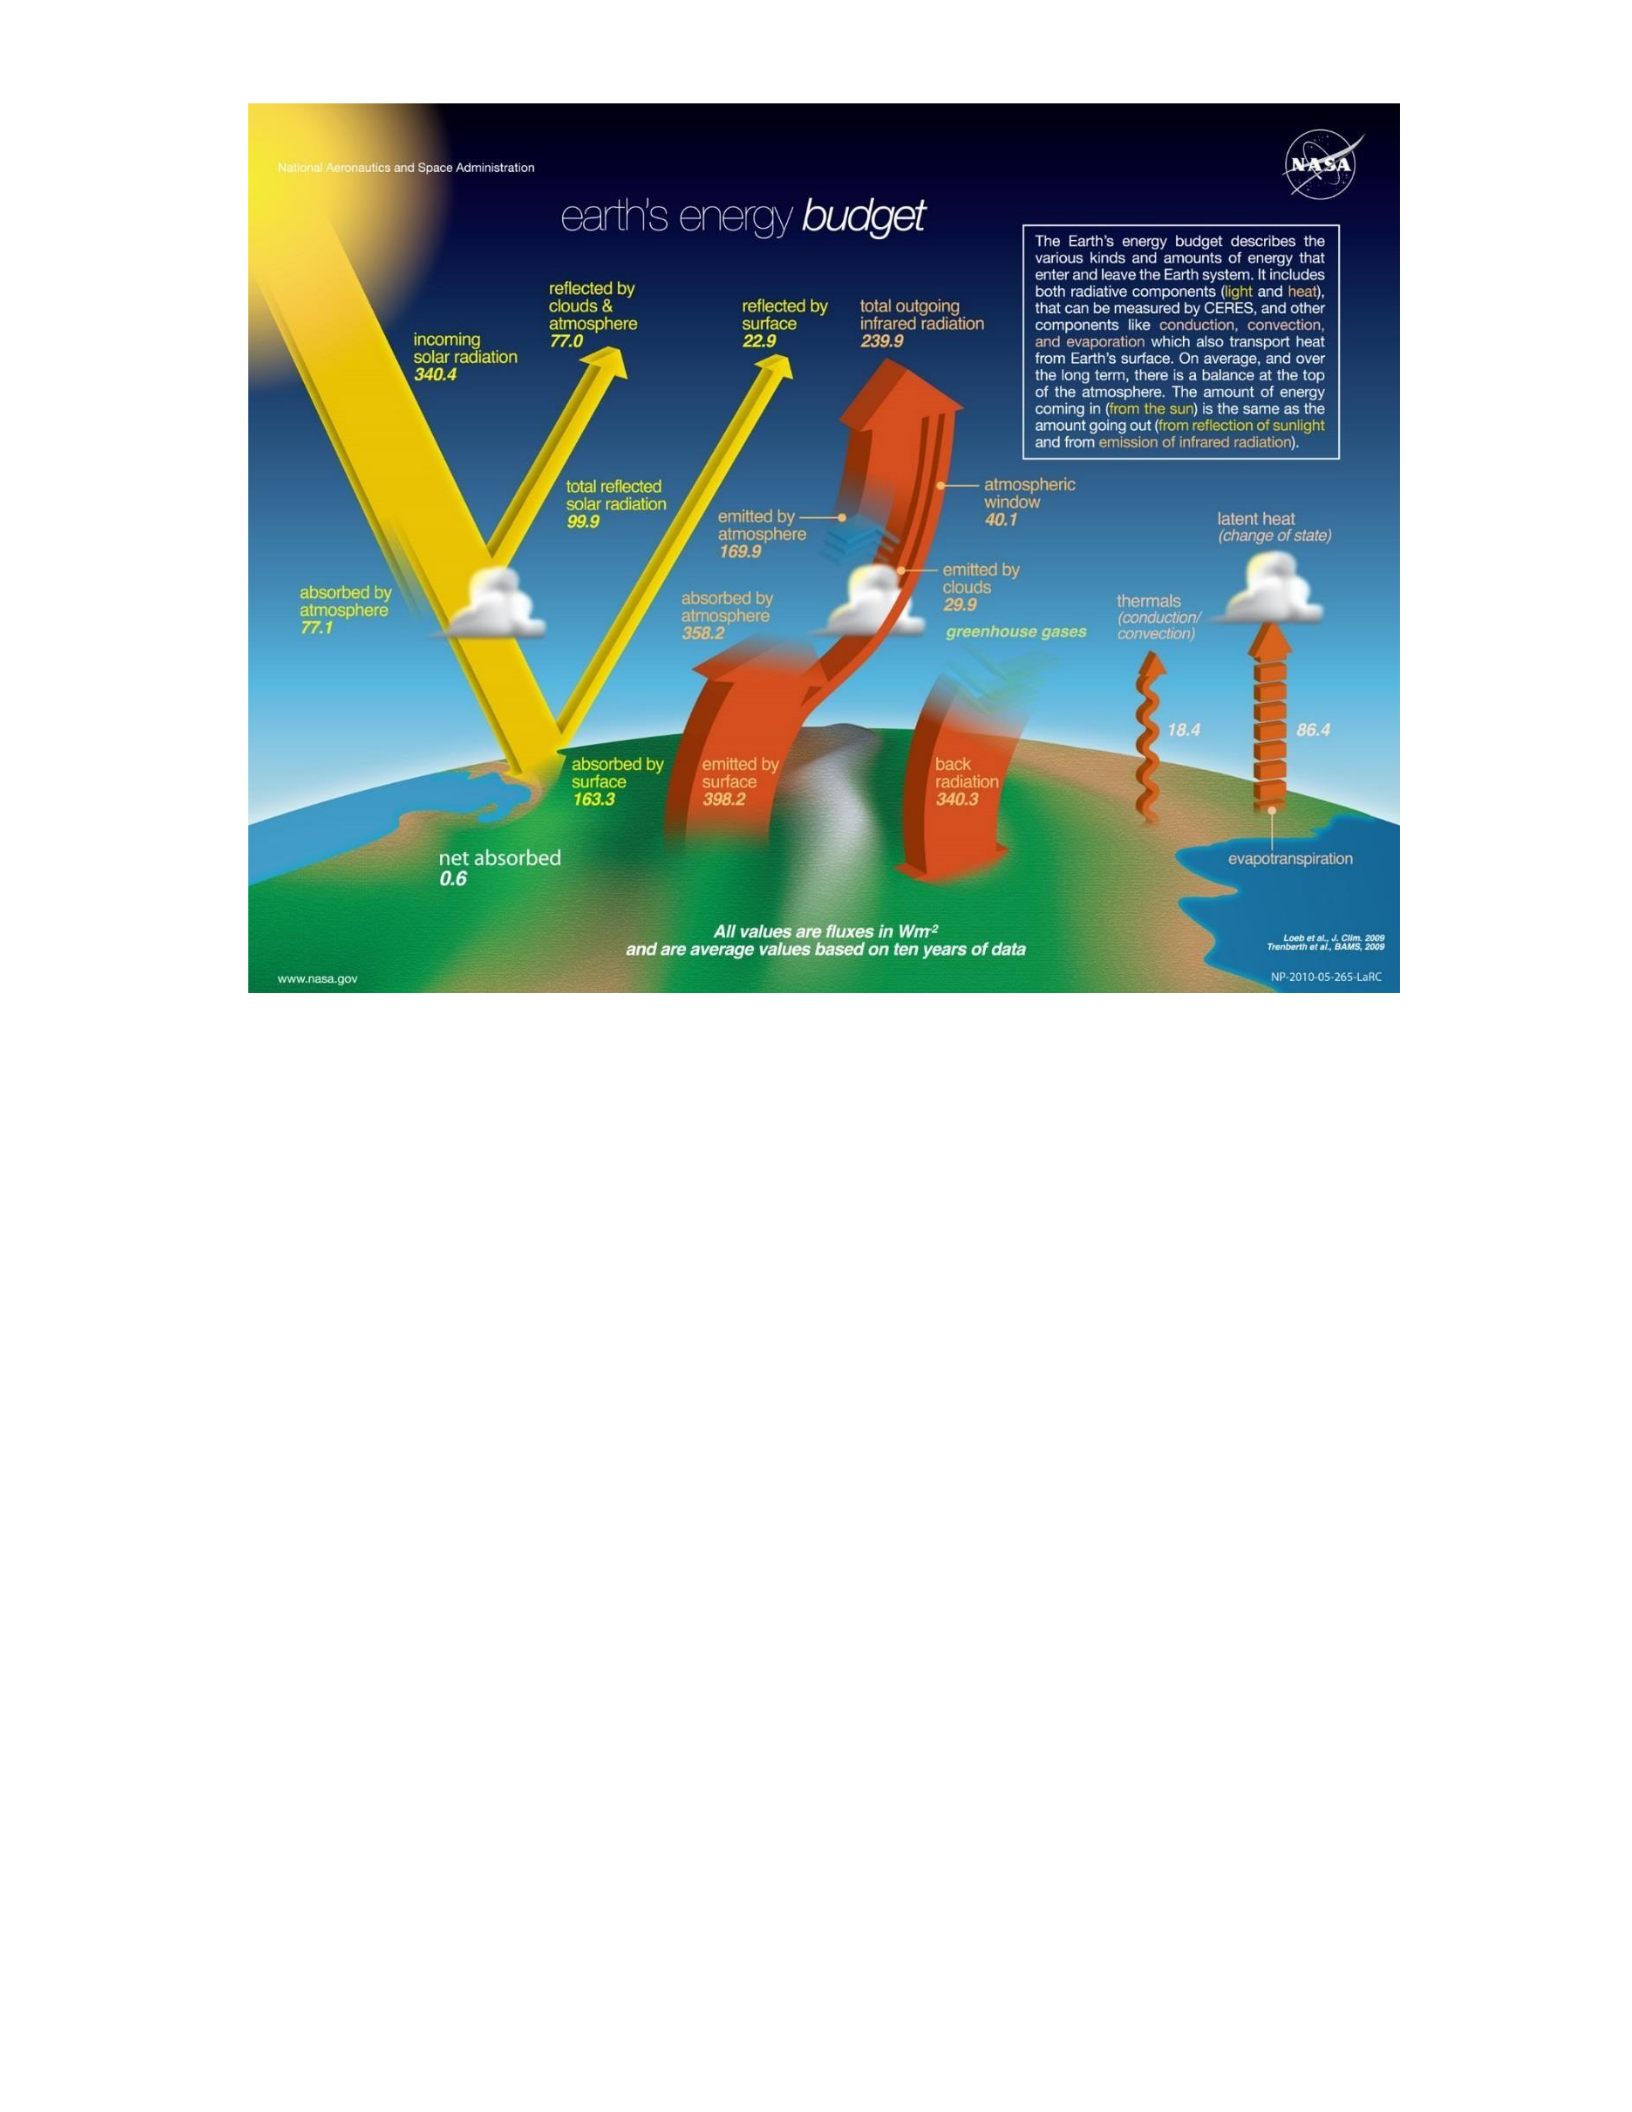
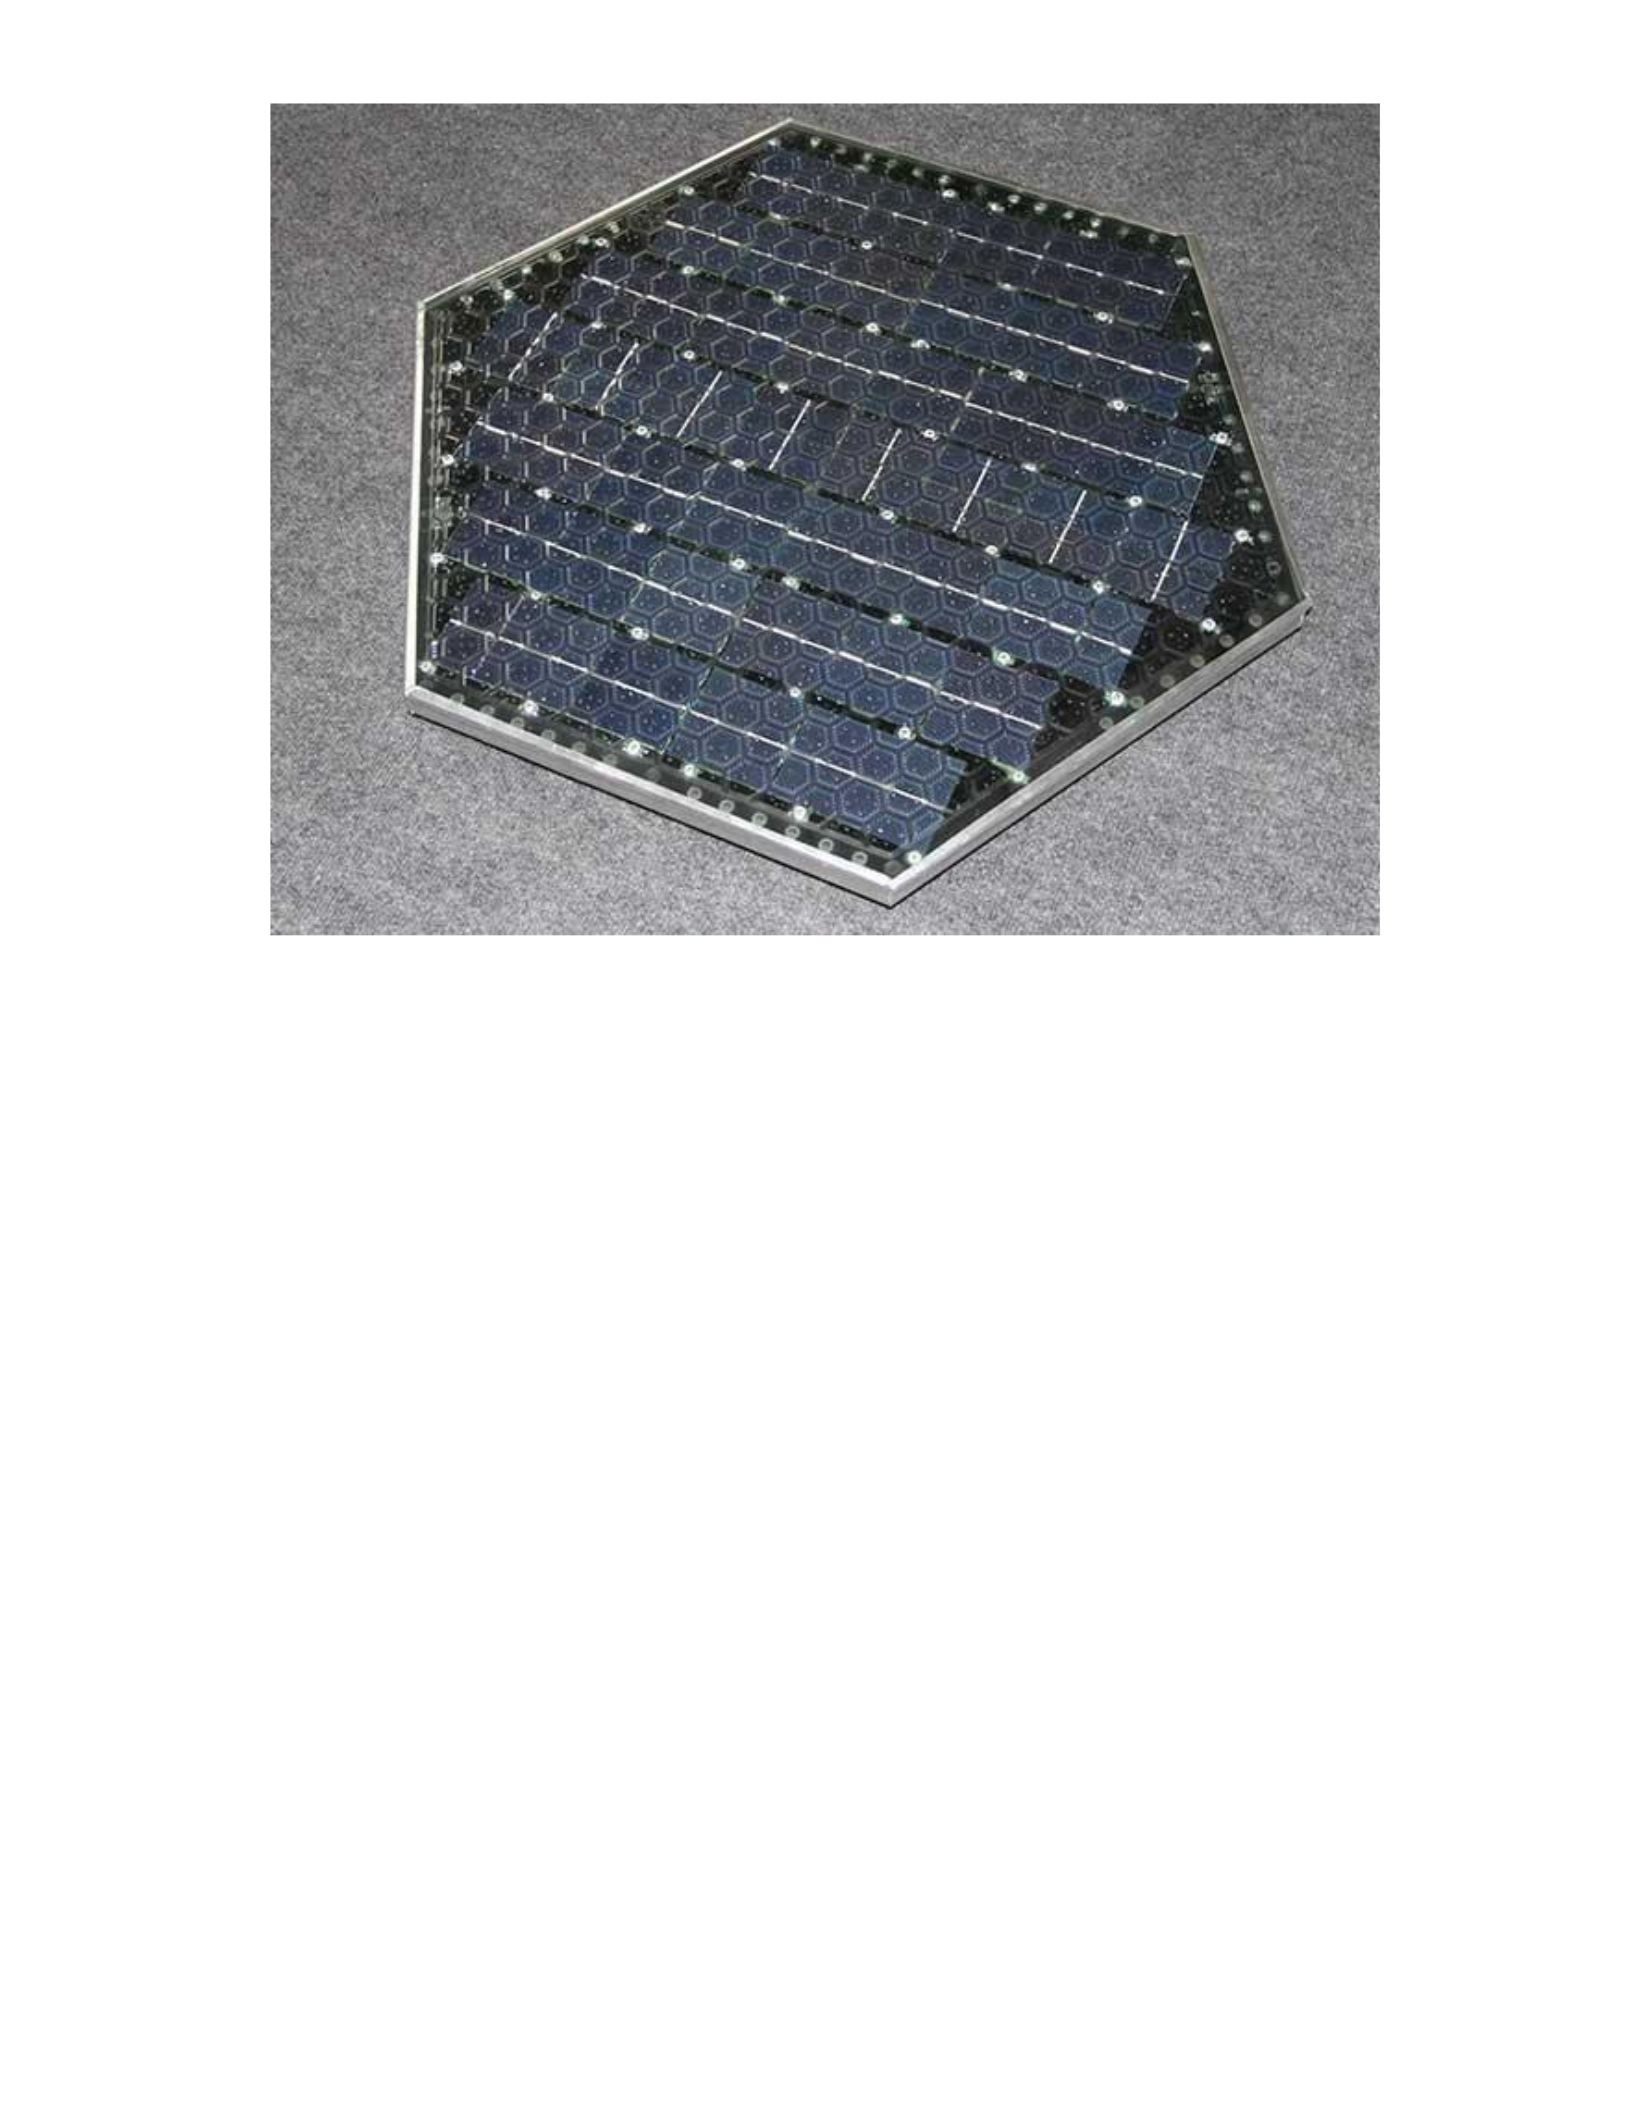
Figure A.4 Solar Roadways Panel
A panel designed for the Solar Roadways Company. This hexagonal panel includes the
tempered glass, LED lighting, and solar panels. The interlocking grid of these panels
creates the road surface, with drainage and stormwater storage underneath.
http://www.solarroadways.com/Home/Specifics
Accessed: 3/1/2016
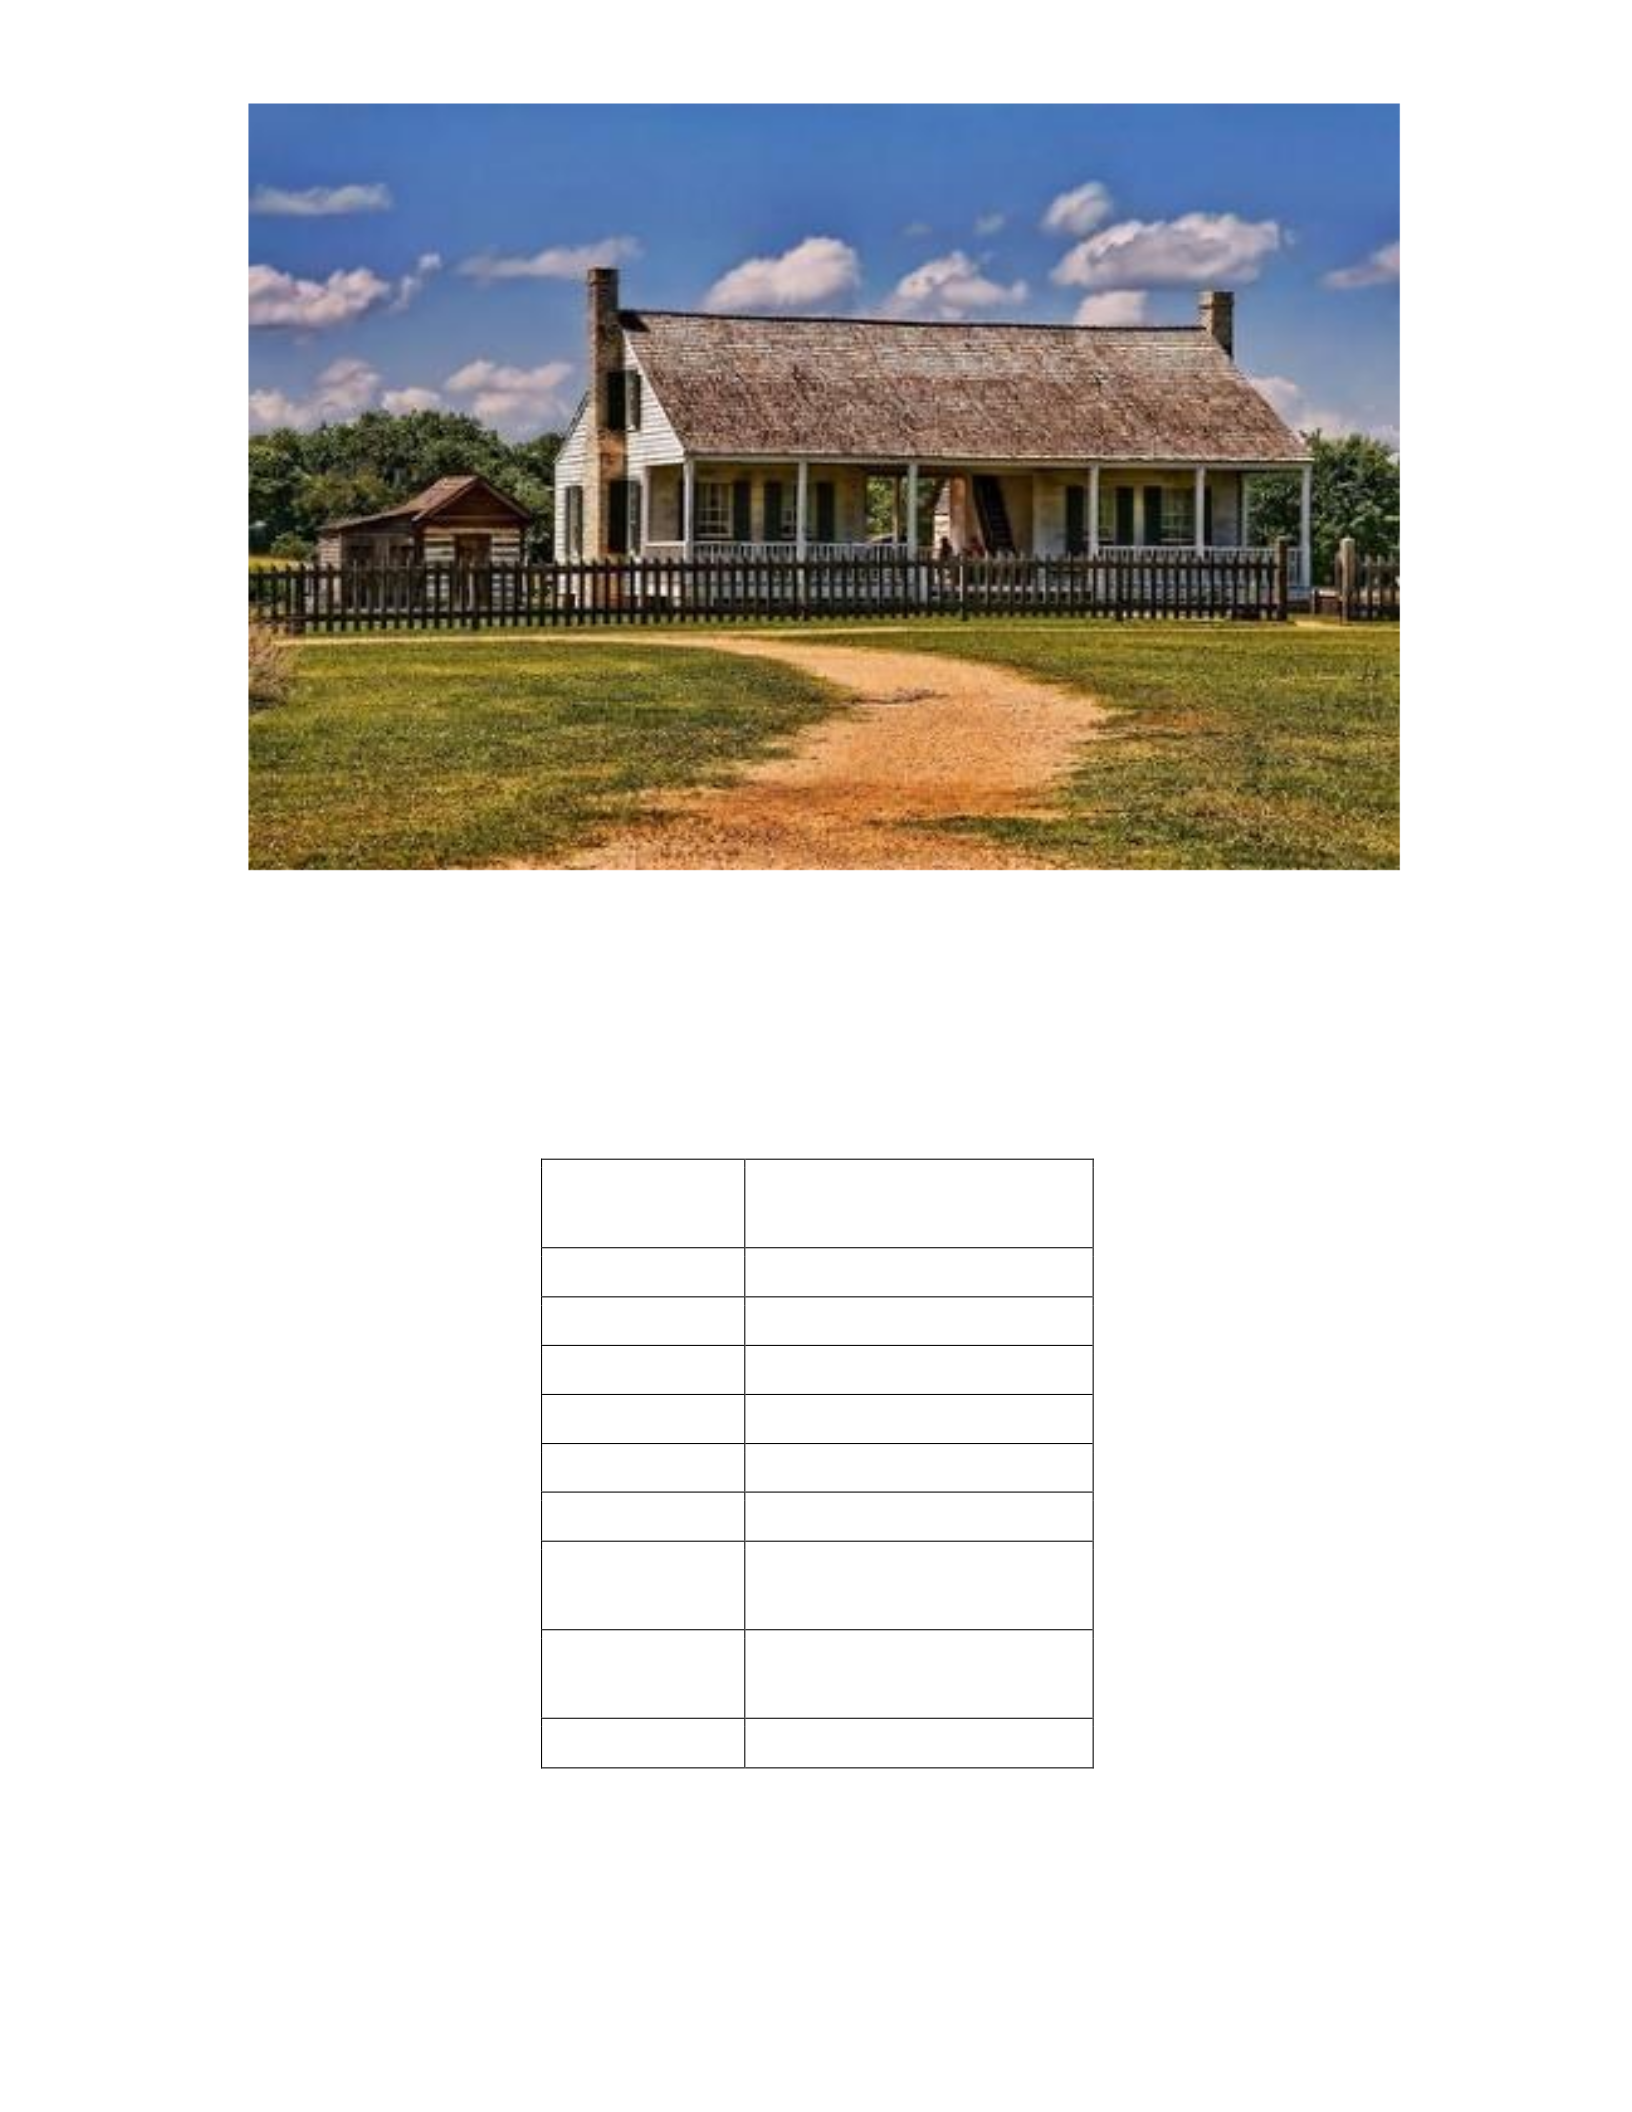
Figure A.5 Dogtrot House
A dogtrot house has a breezeway through the middle of the structure, allowing wind to
flow through, cooling the upper floor with air flow underneath it. Additionally, this
creates more shaded outdoors space for individuals to utilize as a means to staying cool.
http://livingvintageco.com/2013/08/our-home-is-an-old-dogtrot/ Accessed: 2/24/2016
Table A.1 Albedo Values
Surface
Albedo
Water
5-10
Snow
75-95
Sand
25-45
Soil
5-20
Concrete
15-30
Asphalt
5-10
Deciduous
Forest
10-20
Coniferous
Forest
5-15
Clouds
50-90
Examples of surfaces and their associated albedo. Low values indicate high absorption
rates, high values indicate low absorption (high reflectance). Developed from information
provided by Iowa State University.


Table A.2 Sustainable Urban Designs
Urban Design Feature
Meteorological Variable
Street Shading
Cool surface “skin” temperature and air
temperature; reduce windiness.
Green Space
Cool air temperature; improve air quality;
reduce windiness.
Green Roofs
Improve air quality; decrease albedo and
heat absorption of buildings.
Pervious Surfaces
Reduce stormwater runoff; improve water
infiltration; reduce drought underneath the
city.
Sustainable HVAC System
Reduces amount of energy consumption in
the city; decreasing the air temperature
around the building.
Urban Density
Higher densities may reduce traffic
congestion and fossil fuel consumption,
leading to lower air temperature and
improved air quality.
Recycling
Reduces amount of waste produced by the
city, leading to lower energy consumption;
water recycling can improve infiltration
rates and water resource demand.
Multi-Use Zoning
Mixes traditionally separated land uses to
improve the diversity of the city, may
decrease the UHI.
Summarization of sustainable urban design methods and their impacts on the UHI and
meteorological variables in a city.
DATA AND METHODS TABLES AND FIGURES

Figure B.1 Jackson Metro Map
Google Earth map Jackson Metro Area. Map pinpoints each of the observation sites and
the airports. Created: March 7, 2016.
Figure B.2 Fondren
Google Earth Map of Fondren with roads labeled. Tack indicates the location of the
collection site. Created: March 7, 2016.
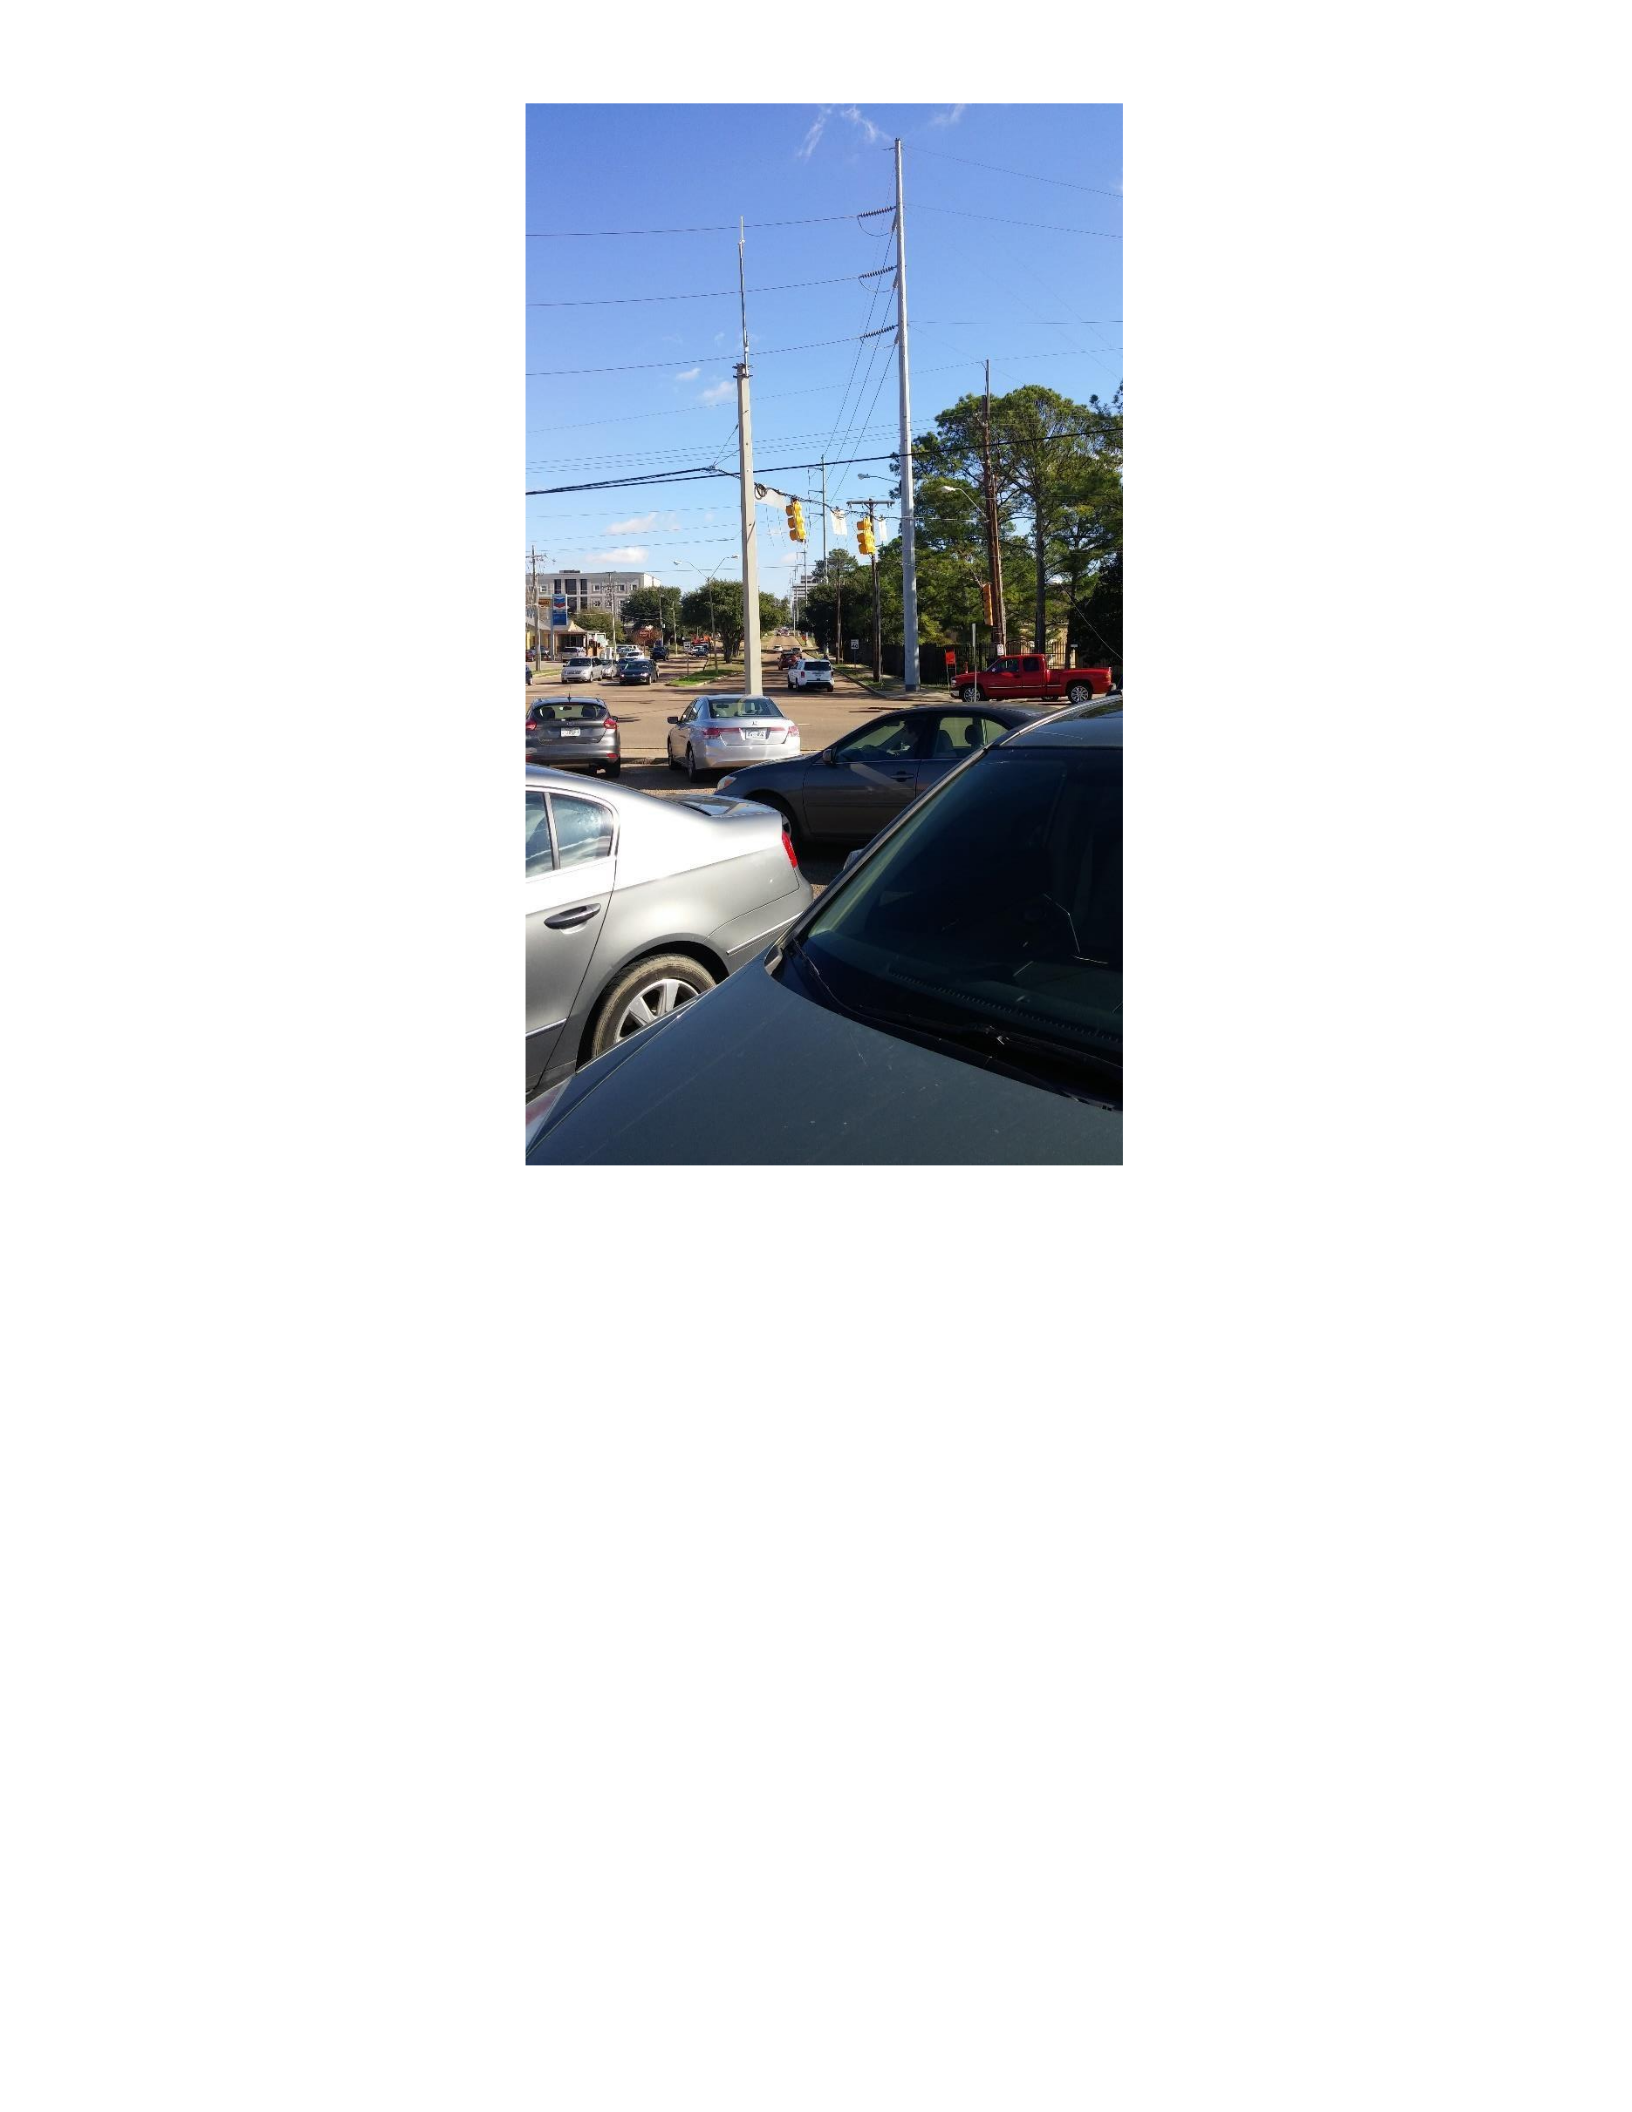
Figure B.3 On-site photograph of Fondren
Photo taken of the observation site in Fondren. Photo looks east across the central
intersection of the shopping center. Photo credit: Peter Crank (August 28, 2015).
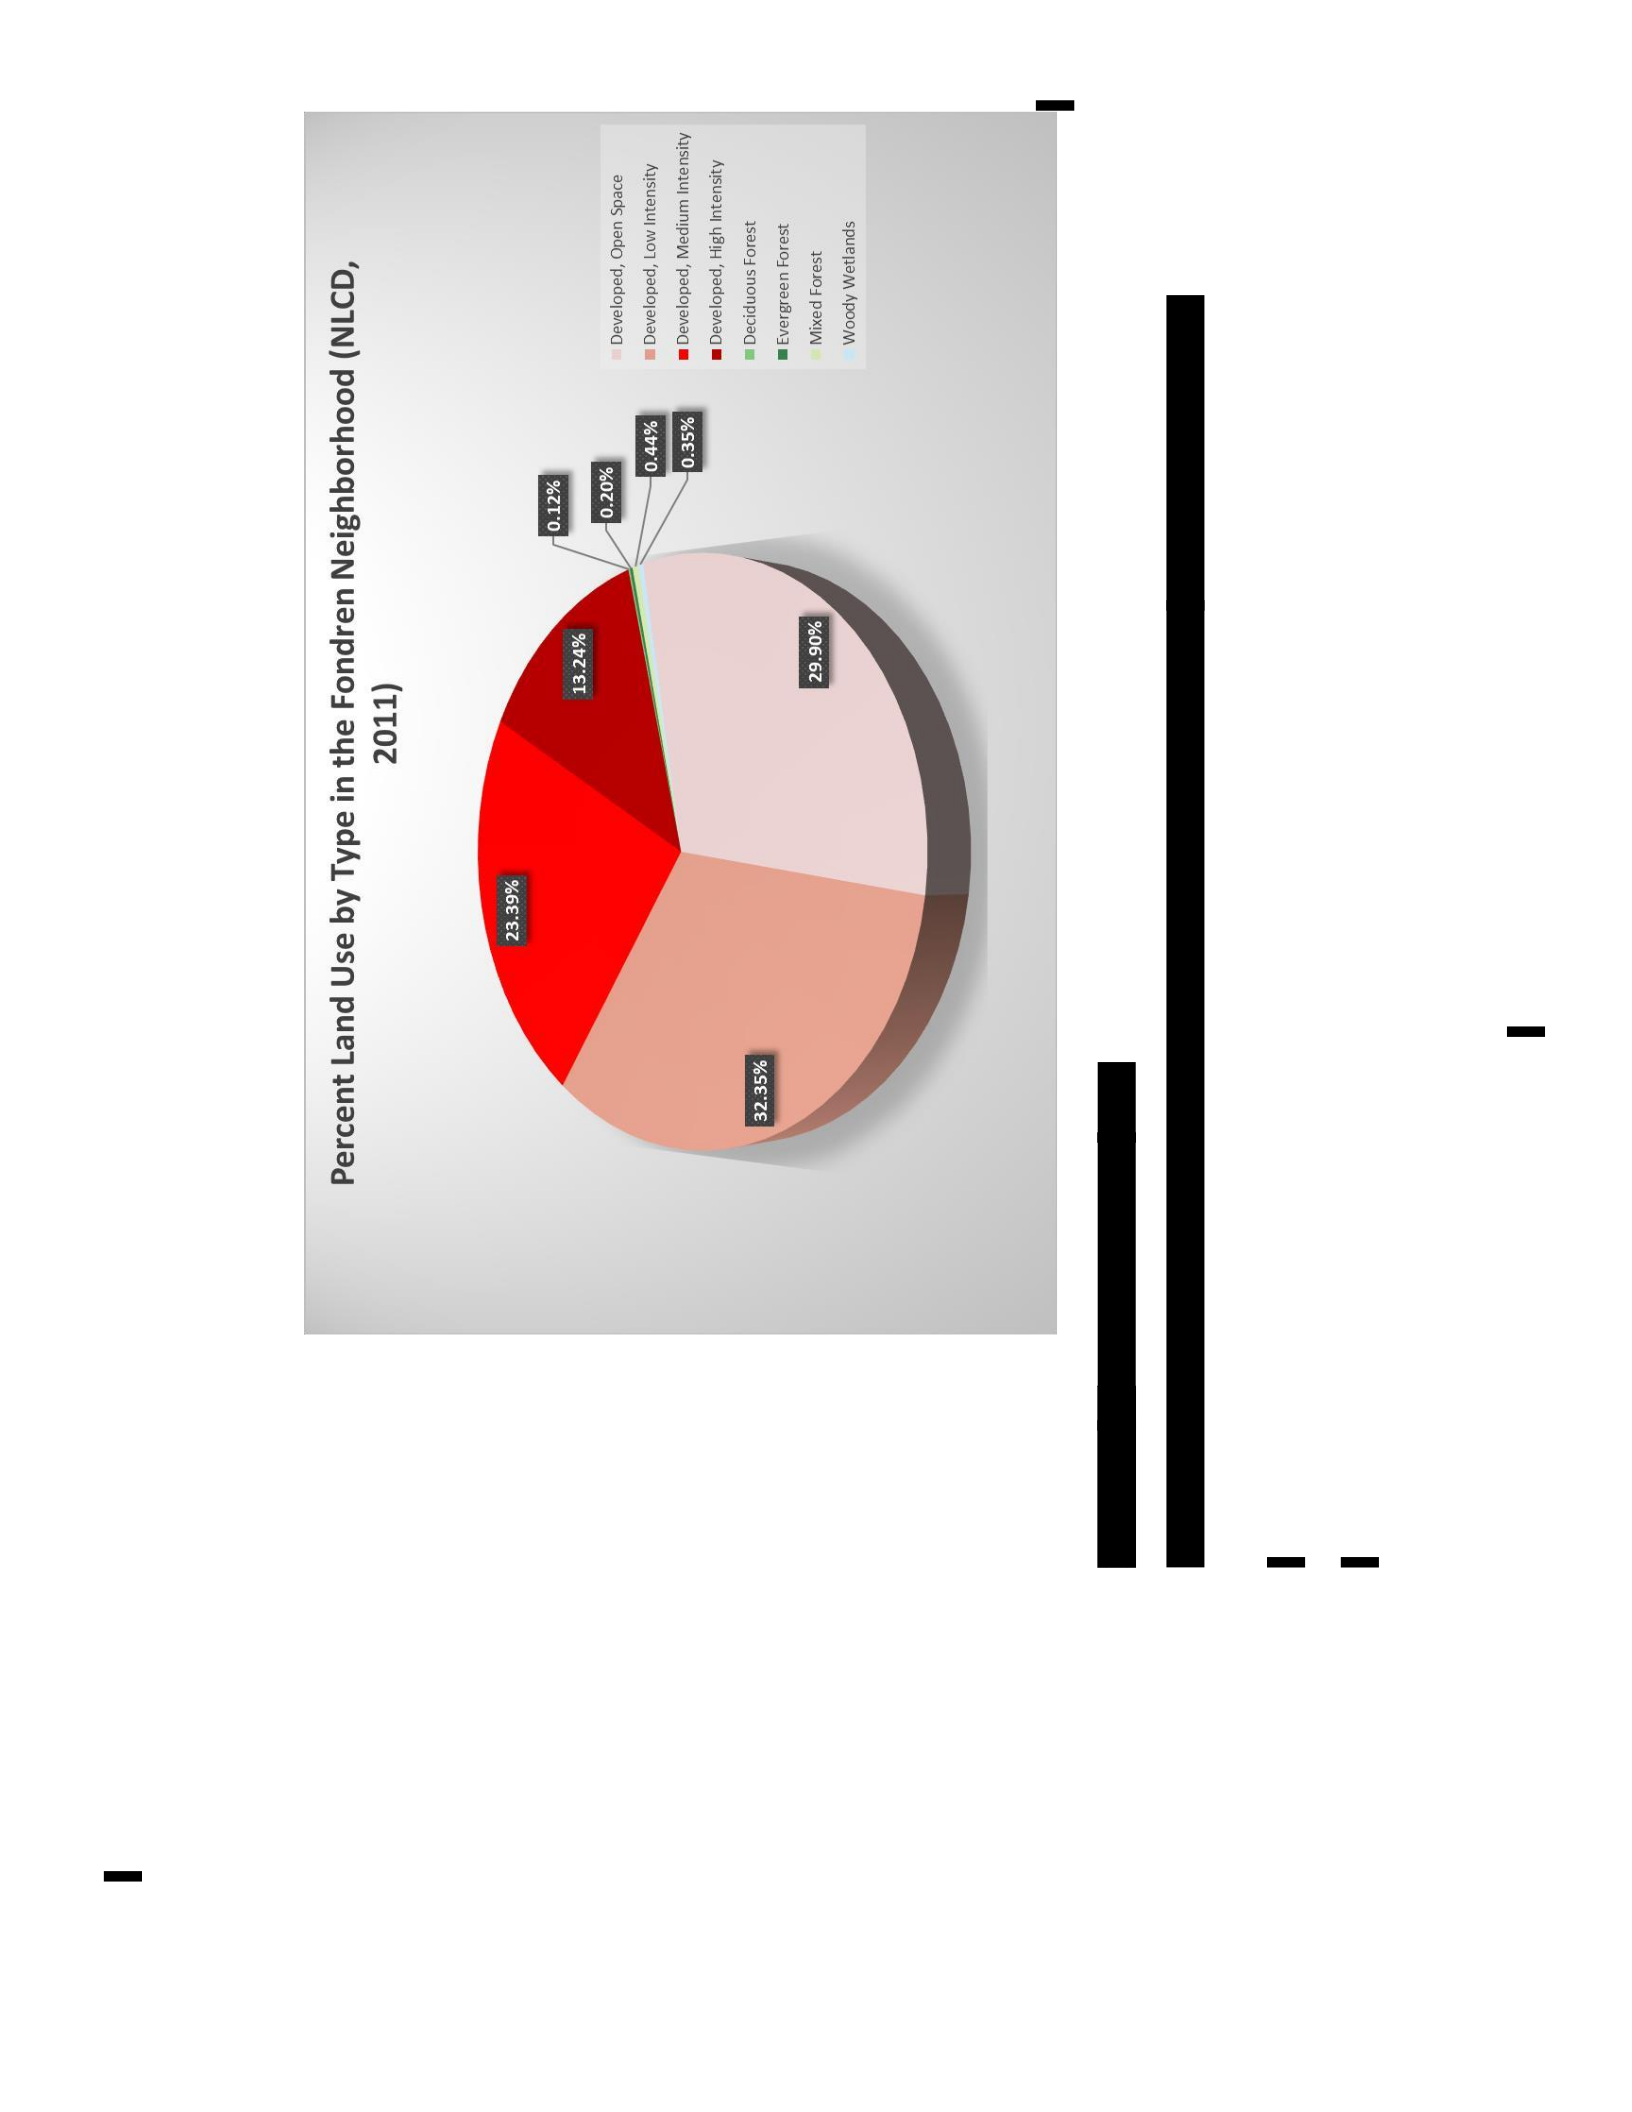

Figure B.5 Lakeland Drive Map
Google Earth Map of the Dogwood Shopping Center on Lakeland Drive with roads
labeled. Tack indicates the location of the collection site. Created: March 7, 2016.

Figure B.6 On-site photograph of Lakeland Drive
Photo of the Lakeland Drive collection site. Photo looks north across the expansive
asphalt parking lot. Photo Credit: Google Street View (January 26, 2016).
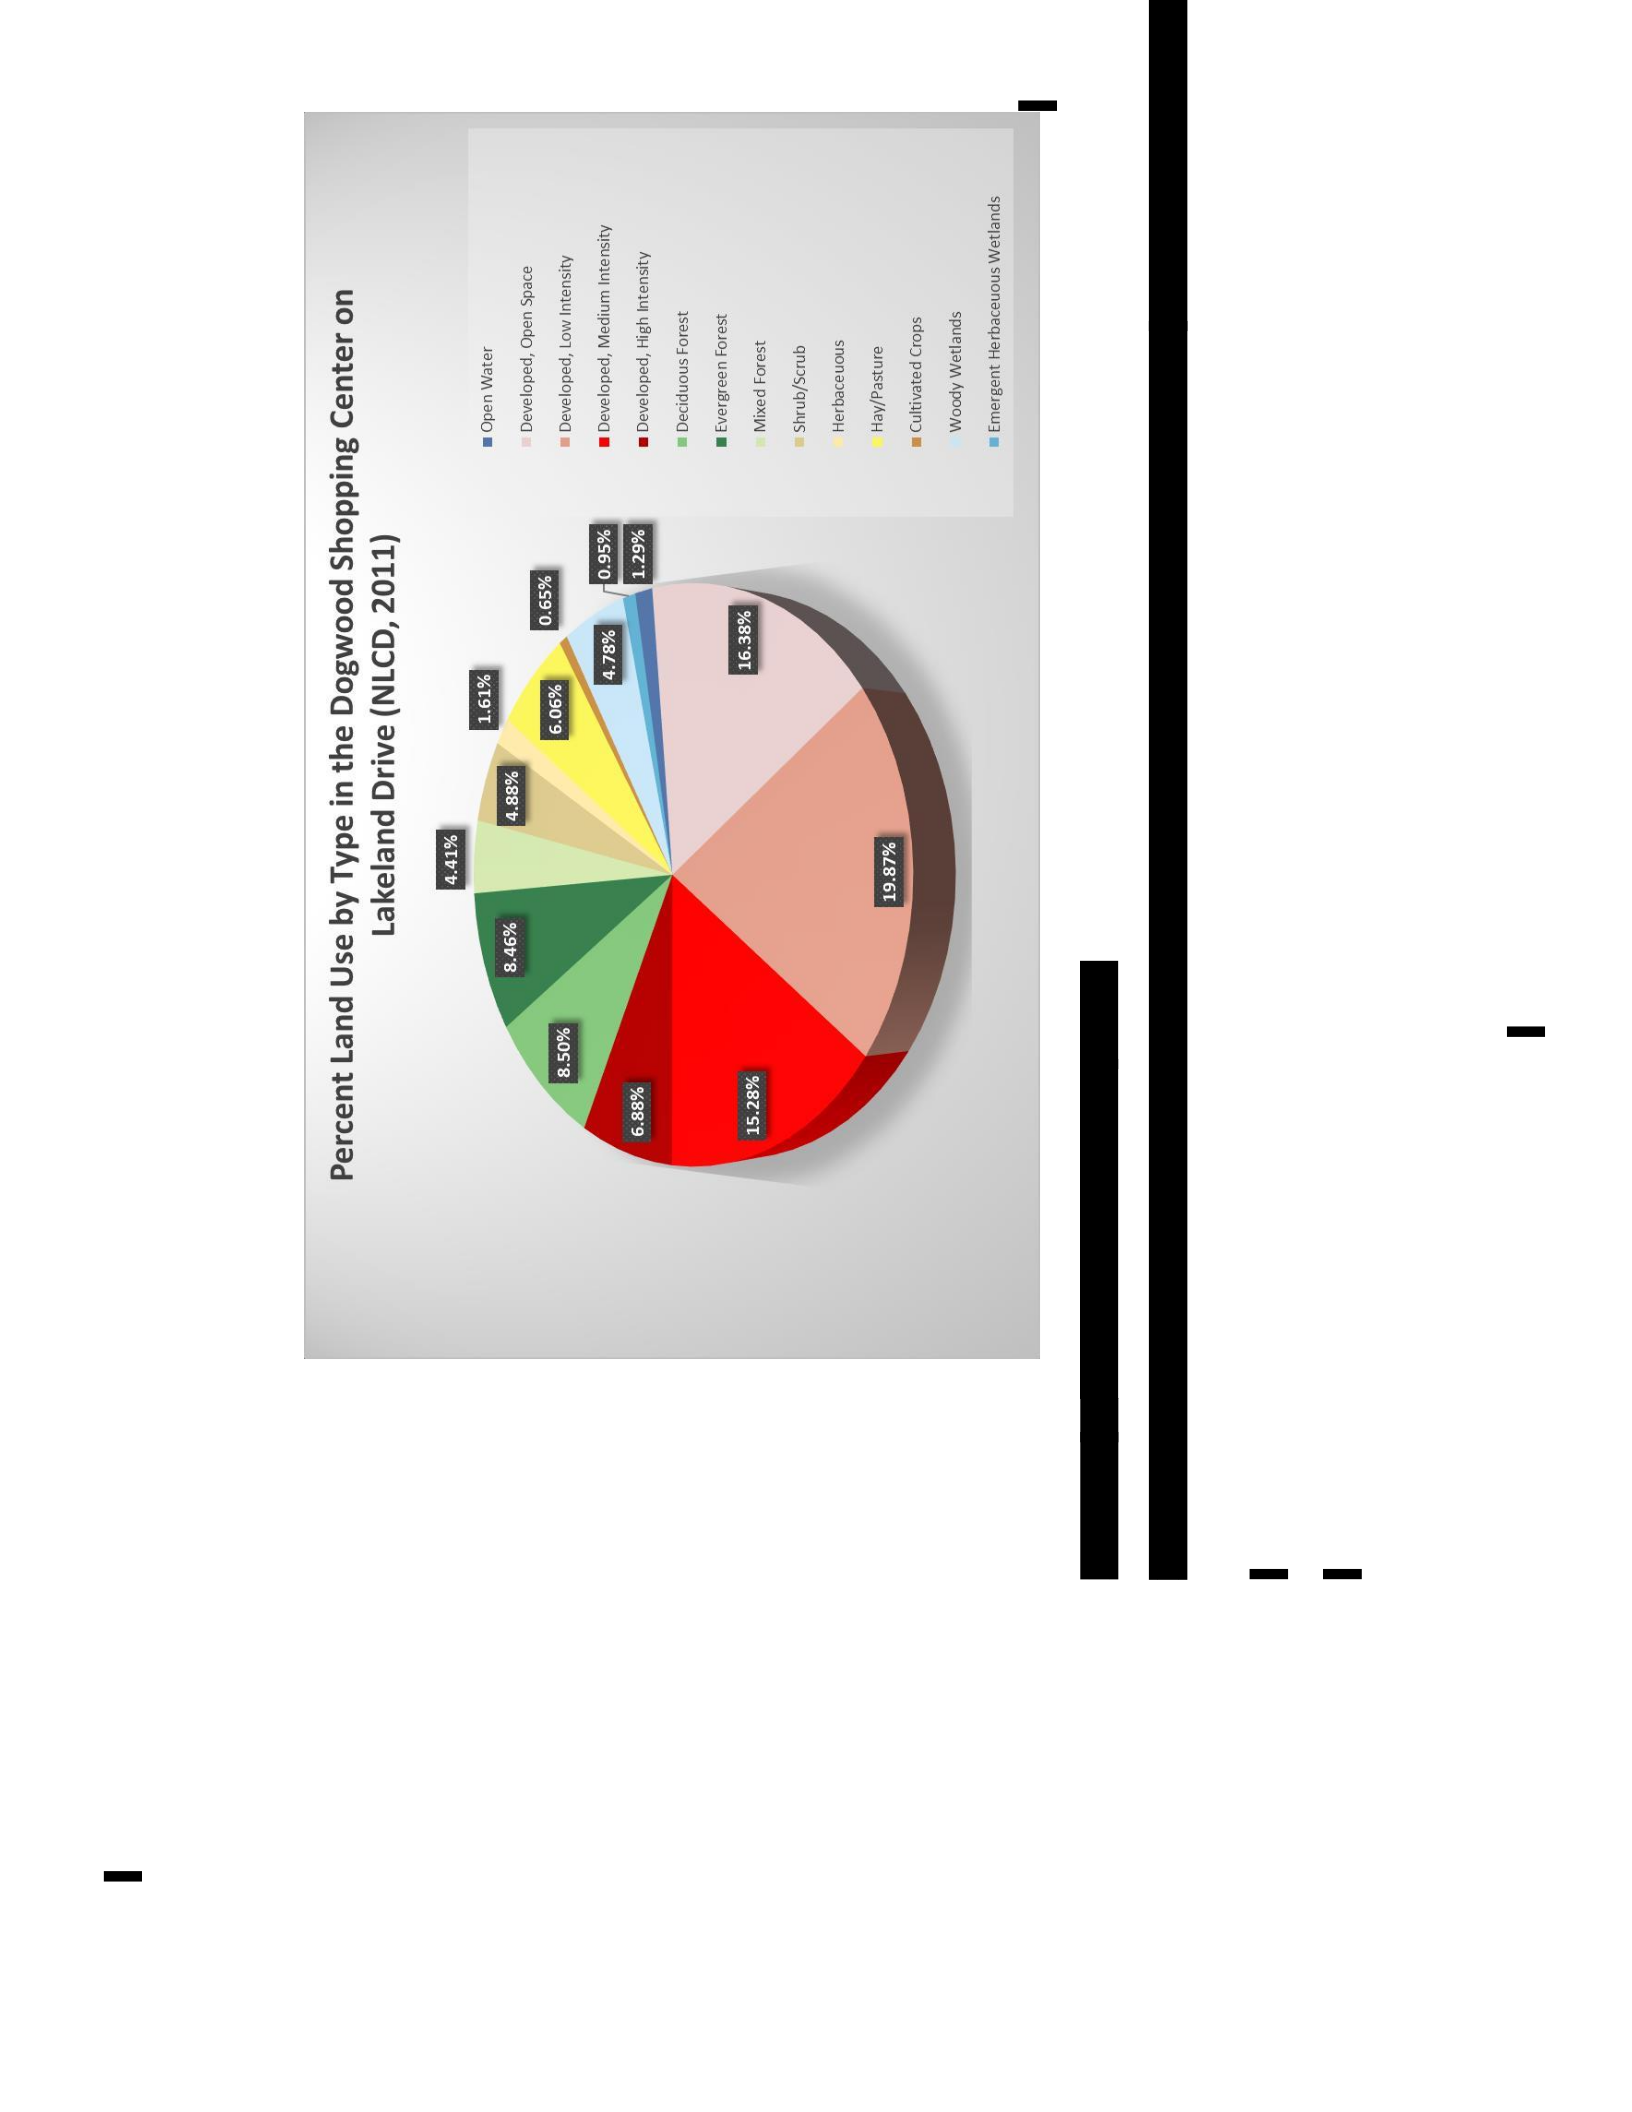
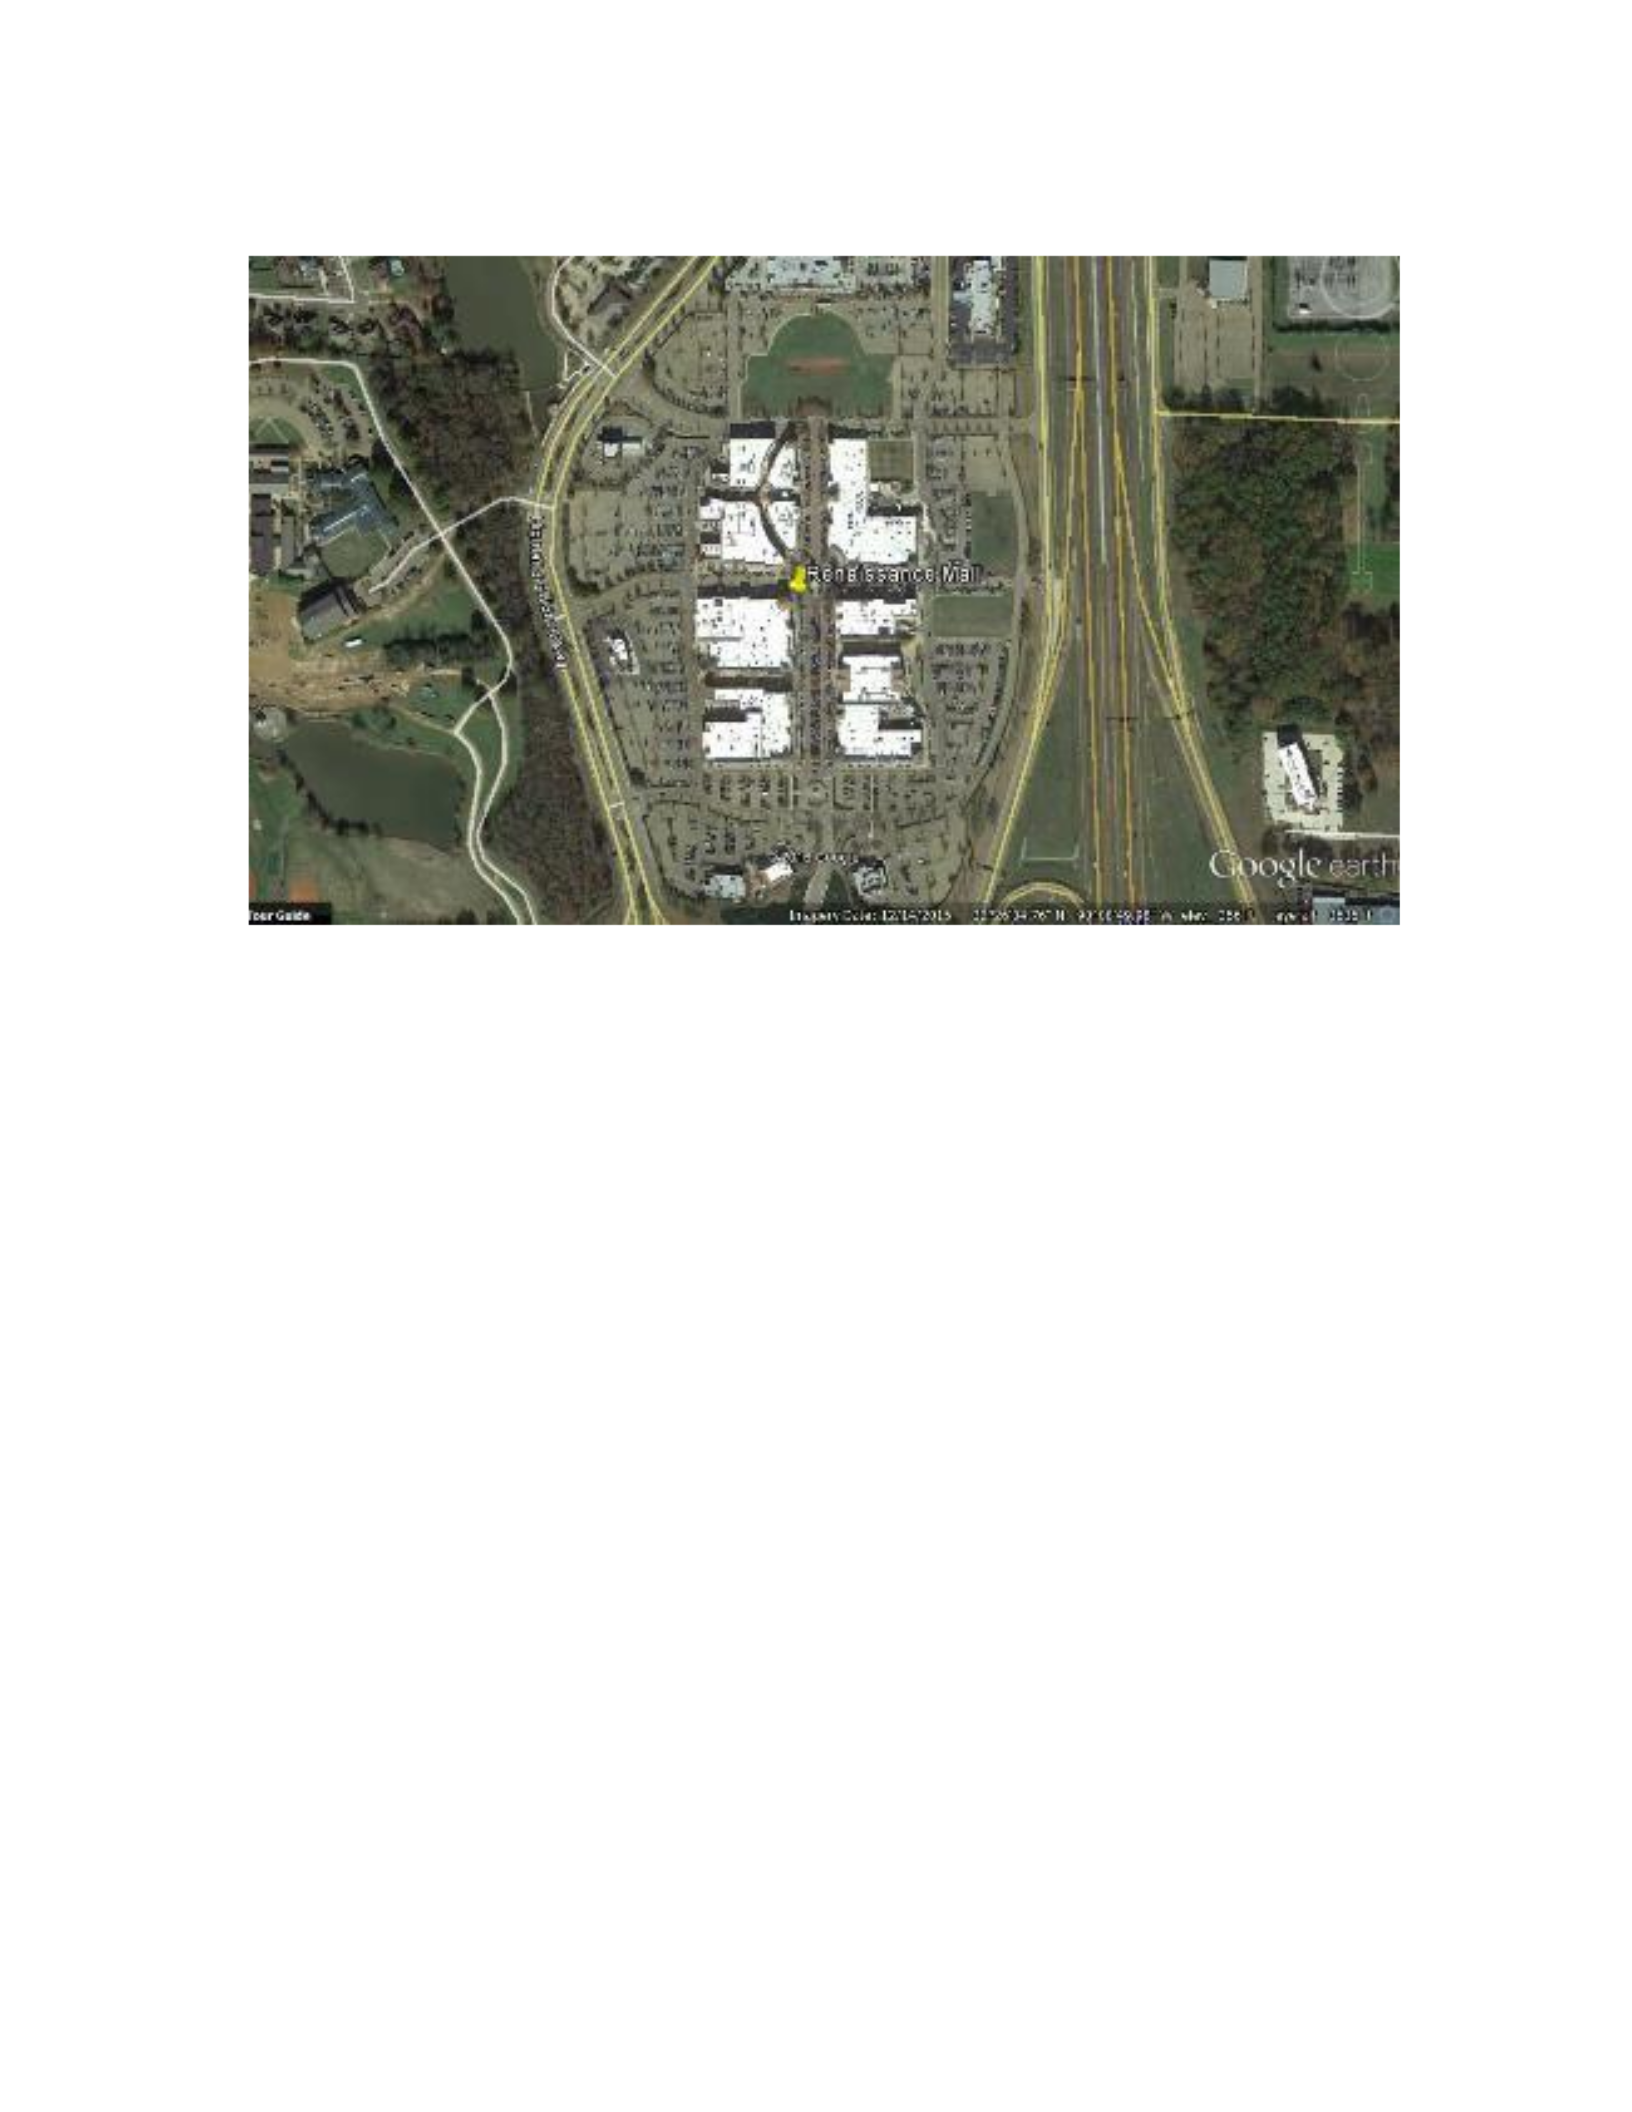
Figure B.8 Renaissance Mall Map
Google Earth map of Renaissance at Colony Park with road labels. Tack indicates the
location where observations were measured. Created: March 7, 2016.
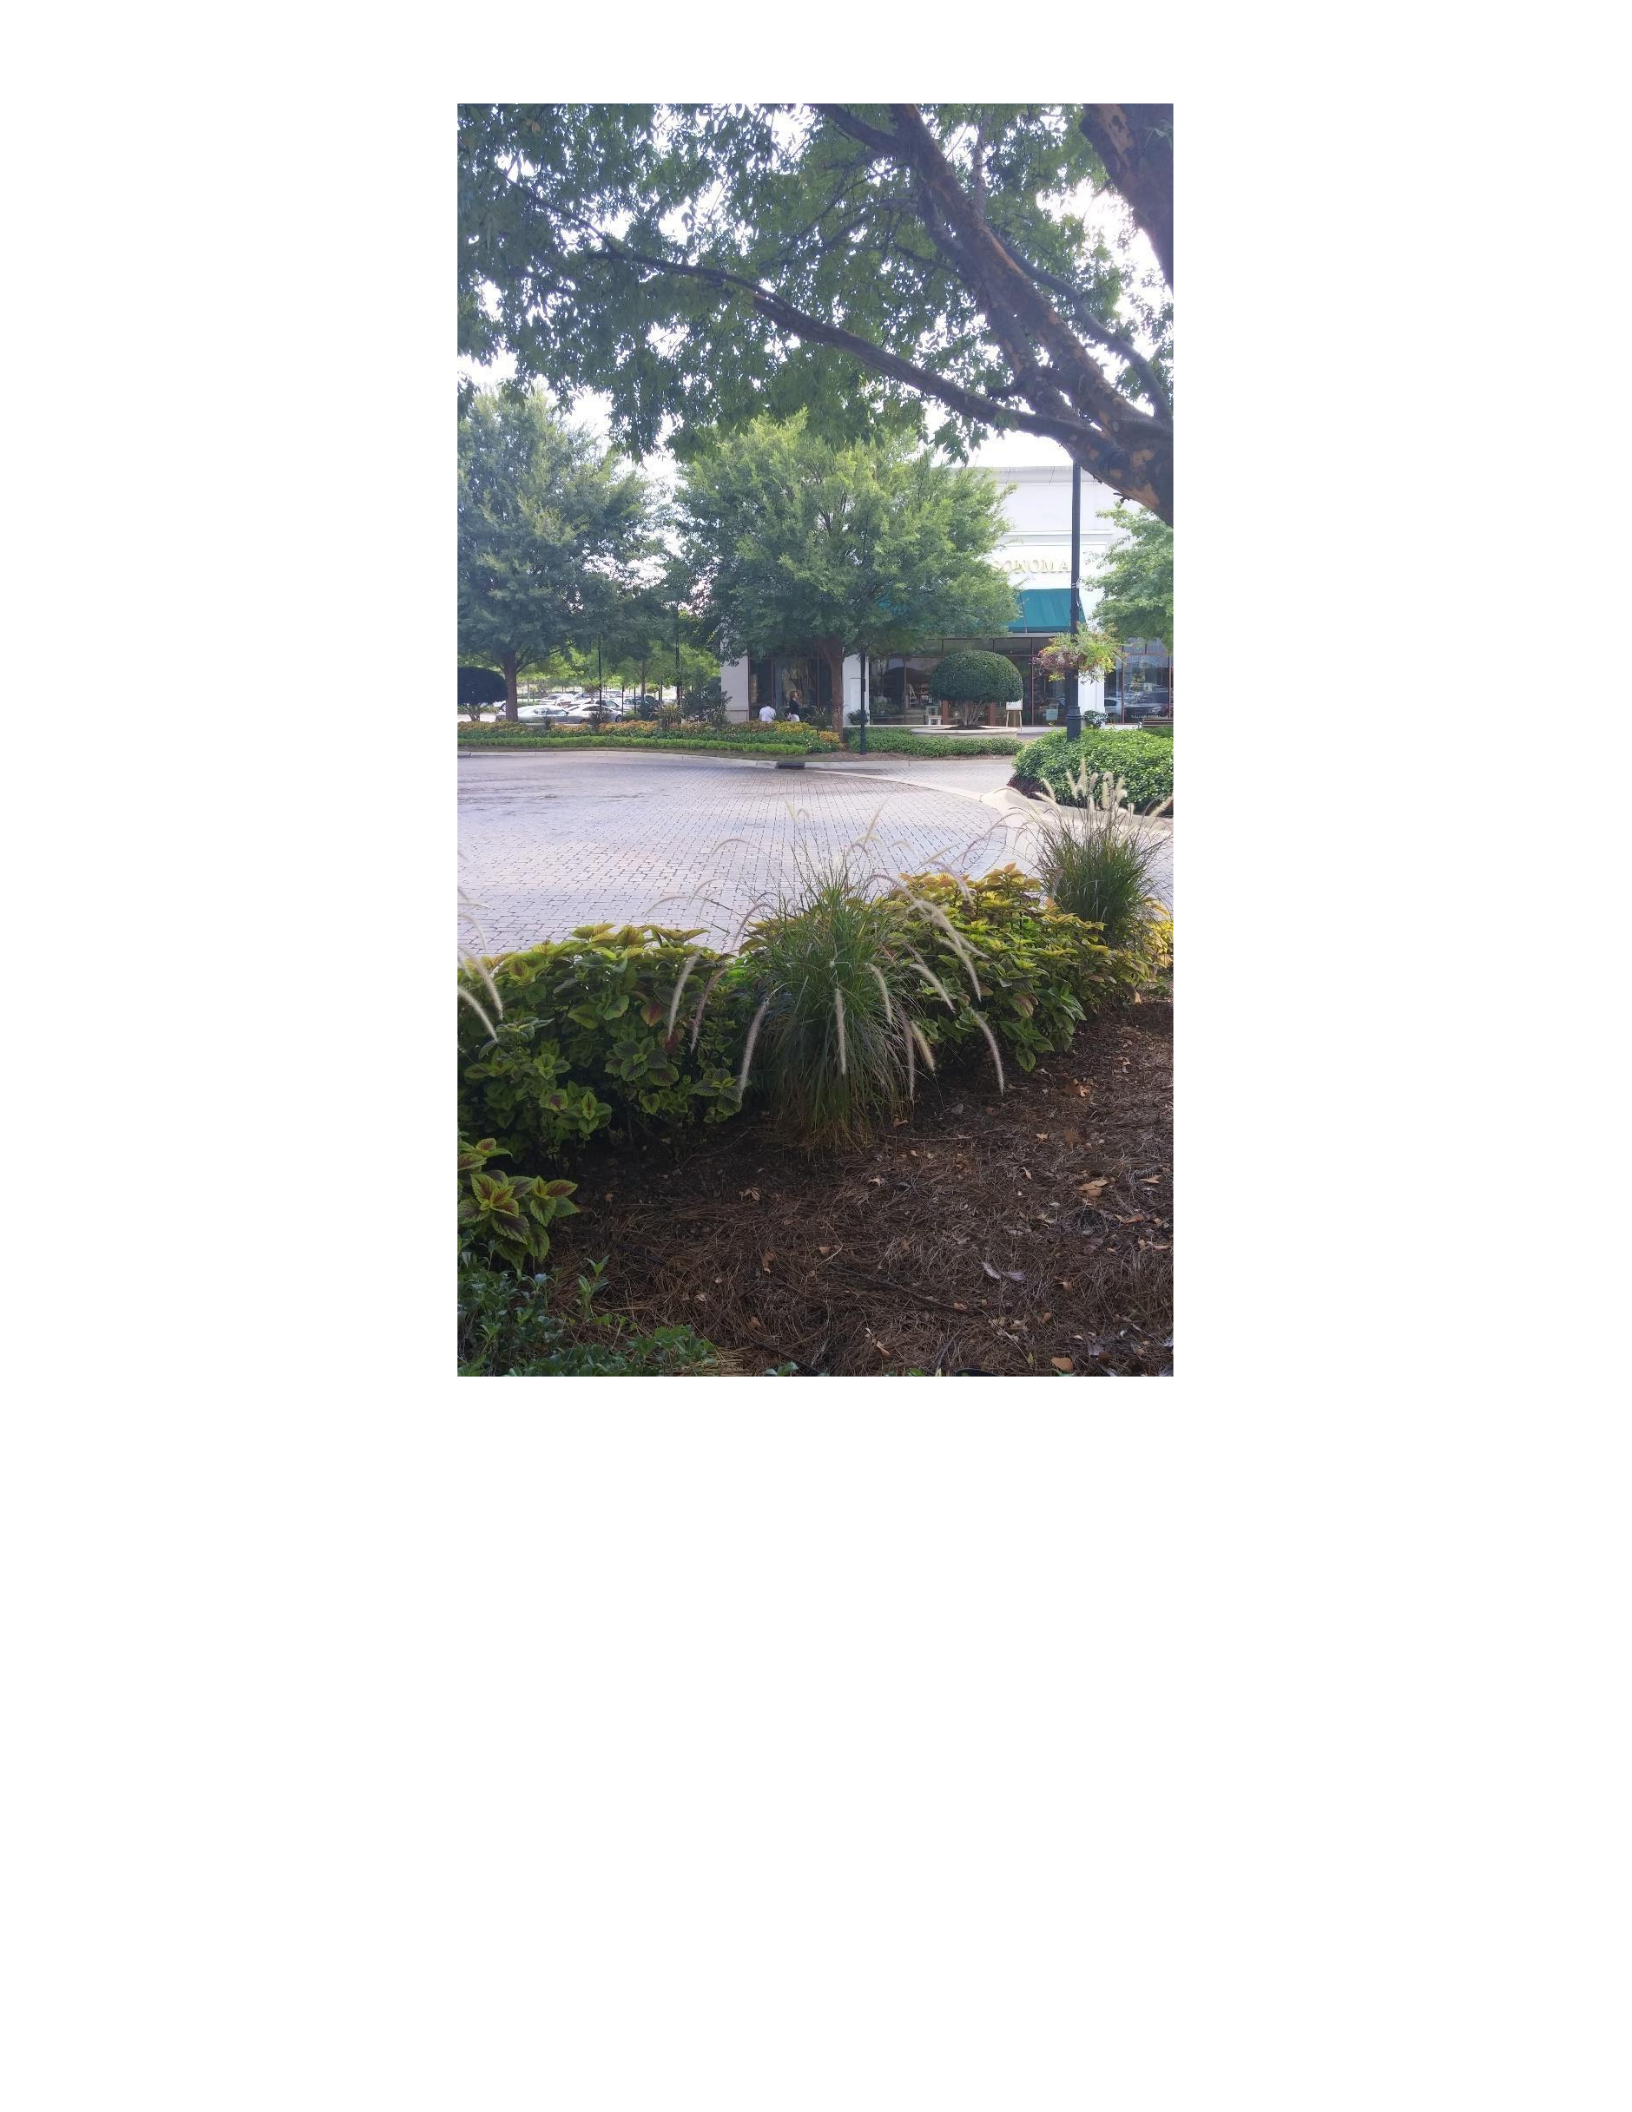
Figure B.9 On-site photograph of the Renaissance Mall.
Photo taken of the observation site in the Renaissance at Colony Park. Photo looks east
across the central intersection of the shopping center. Photo credit: Peter Crank (August
28, 2015).
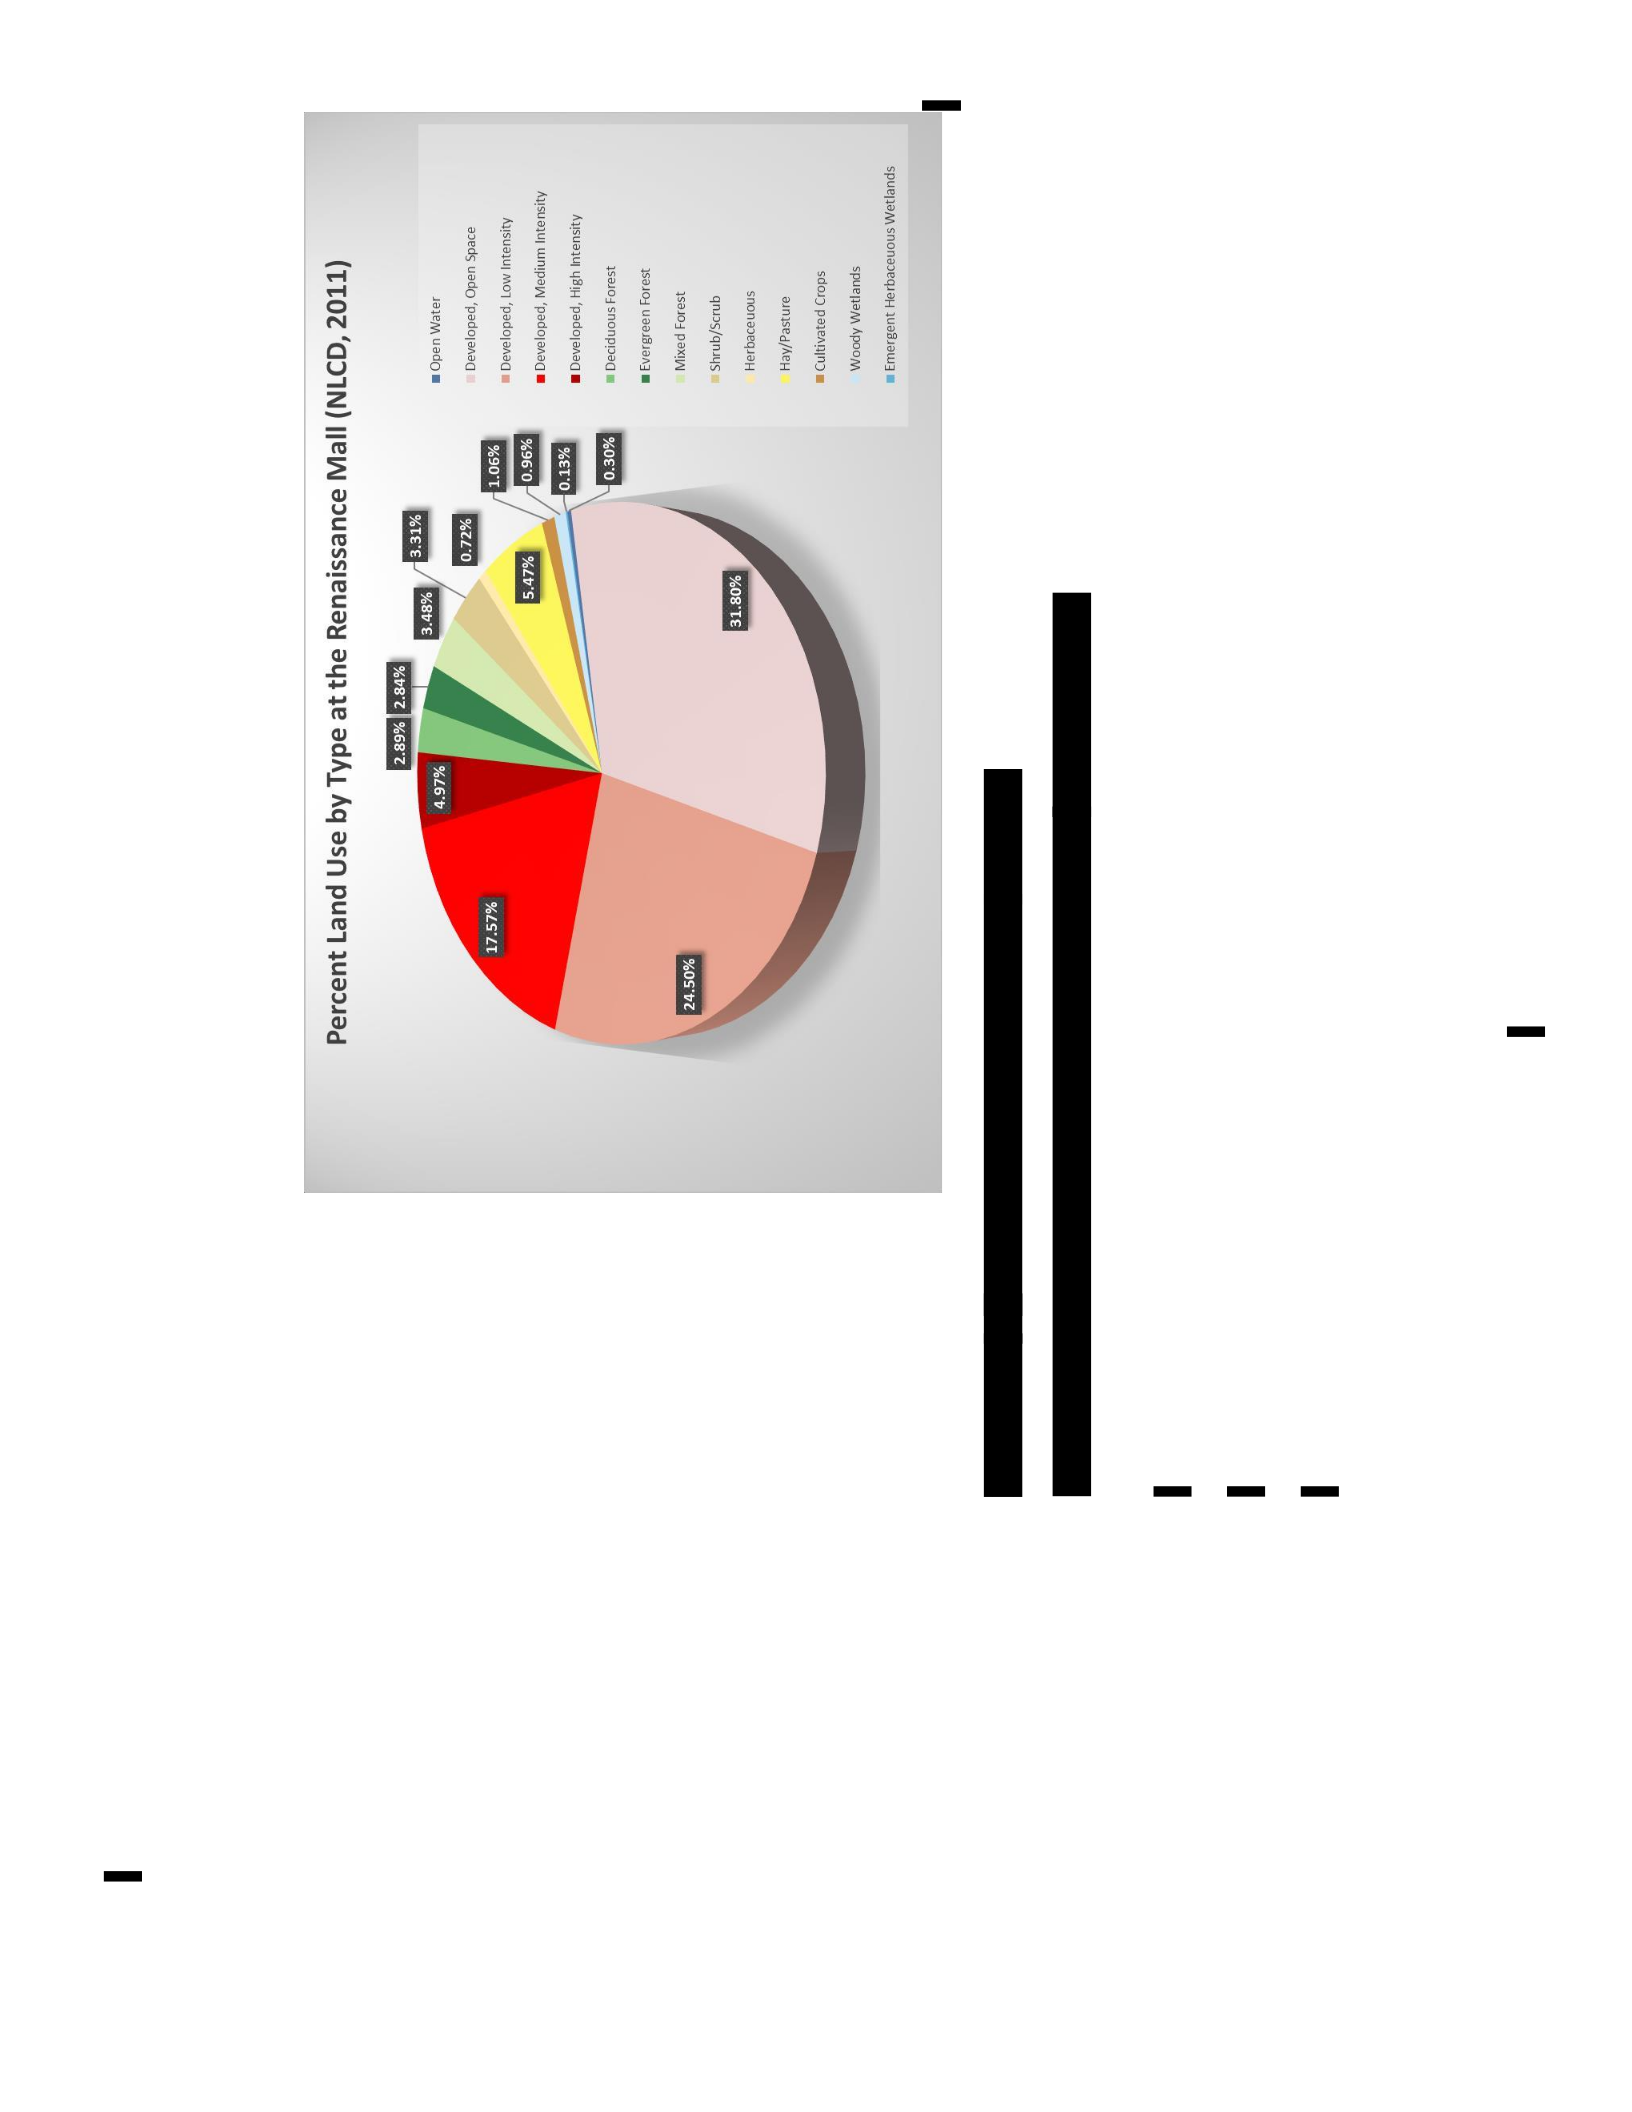
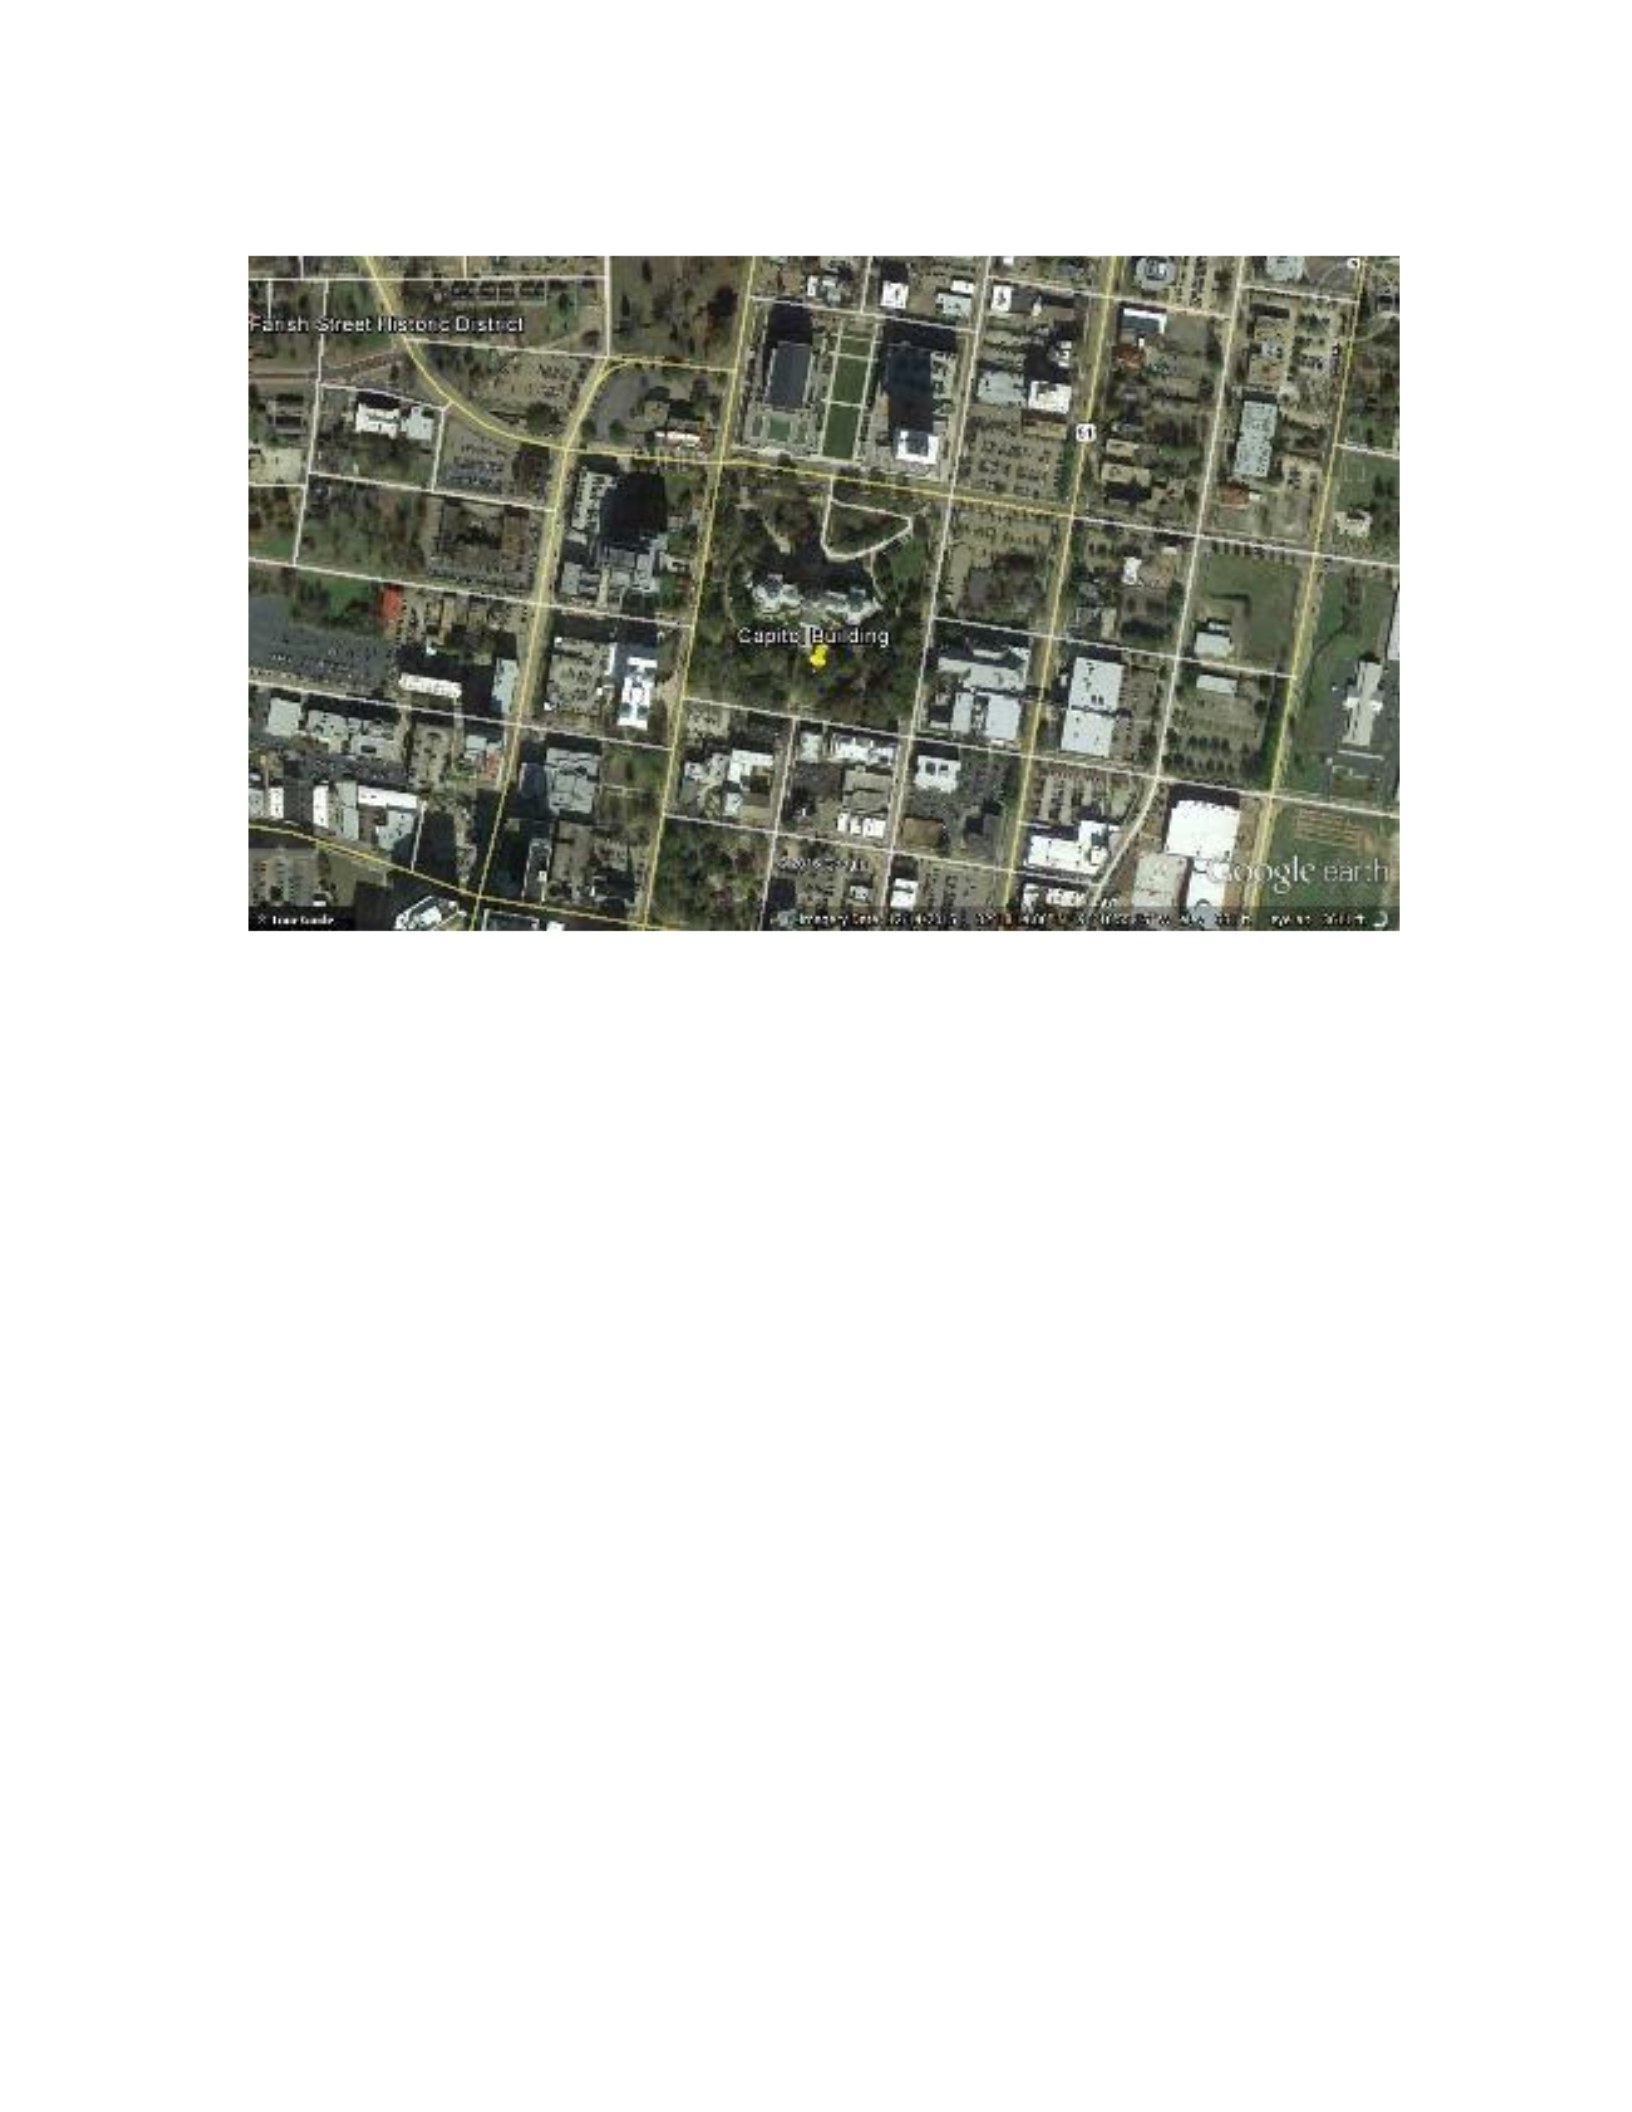
Figure B.11 Capitol Building Map
Google Earth map of downtown Jackson and the Mississippi State Capitol Building.
Roads and major neighborhoods are labeled. The tack indicates the site where
observations were measured. Created: March 7, 2016.
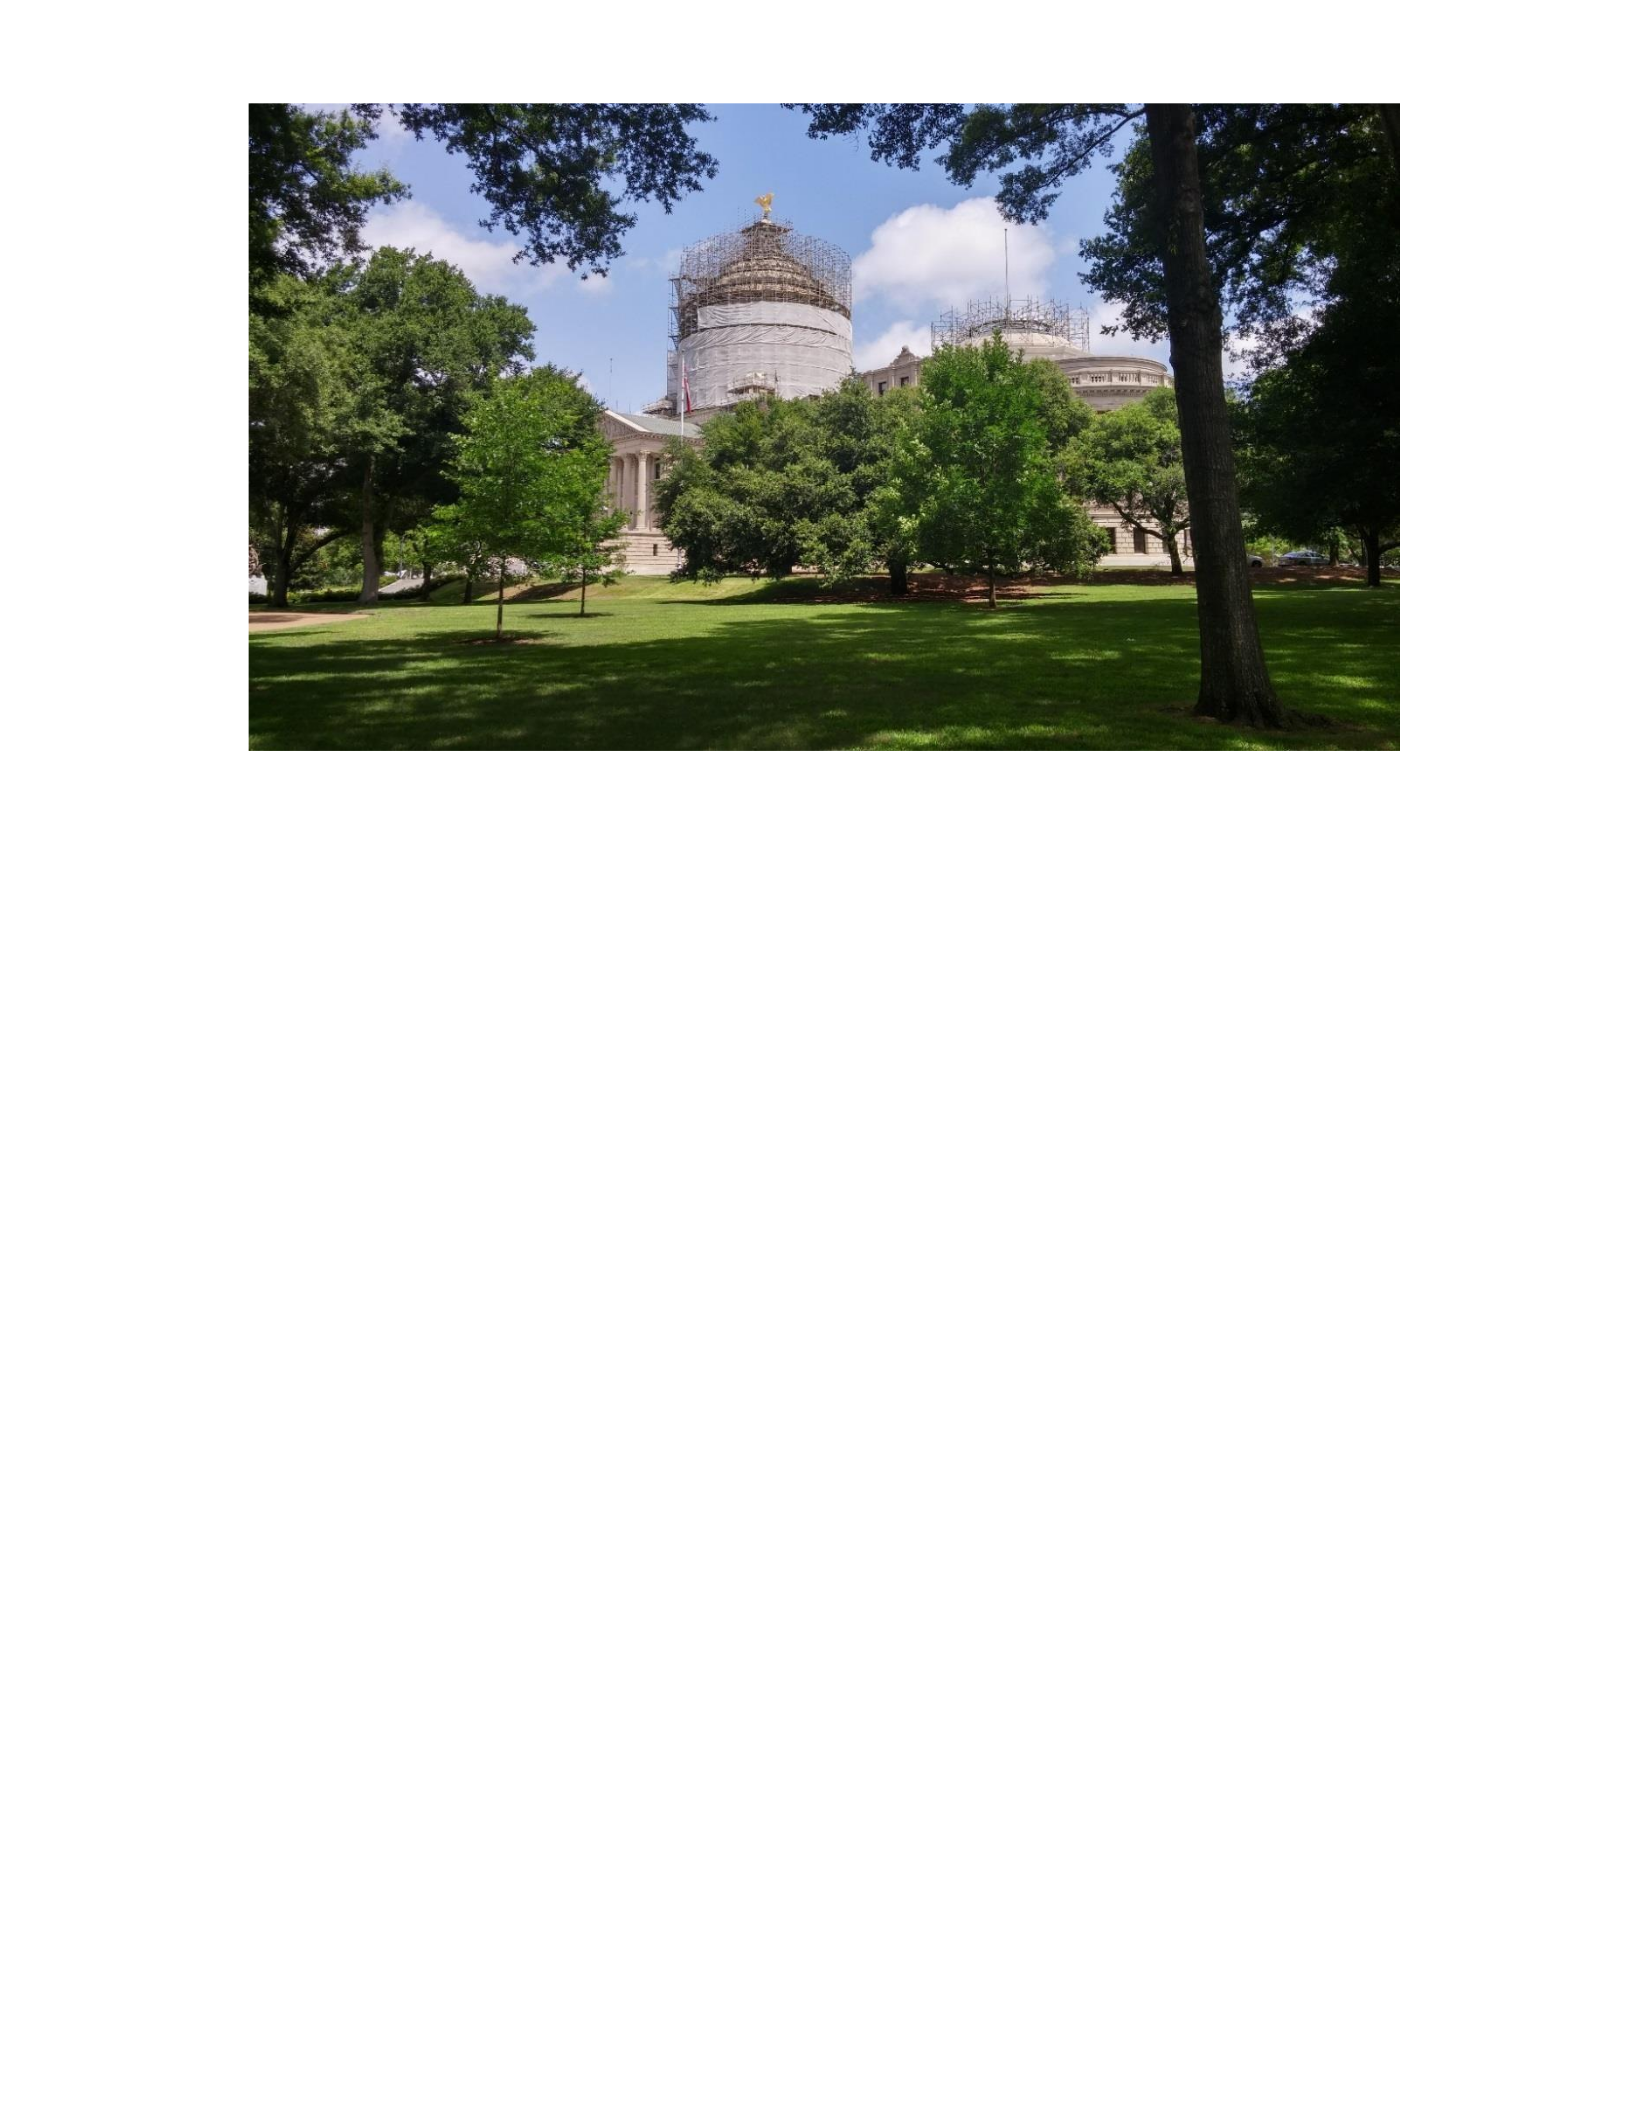
Figure B.12 On-site photograph of the Capitol Building.
The Mississippi Capitol Building is in the center of photograph. The photo was taken
from the southeastern edge of the grounds looking northwest. The landscaped grounds in
the foreground are where the Capitol Building site observations were taken. Photo credit:
Peter Crank (June 16, 2015).
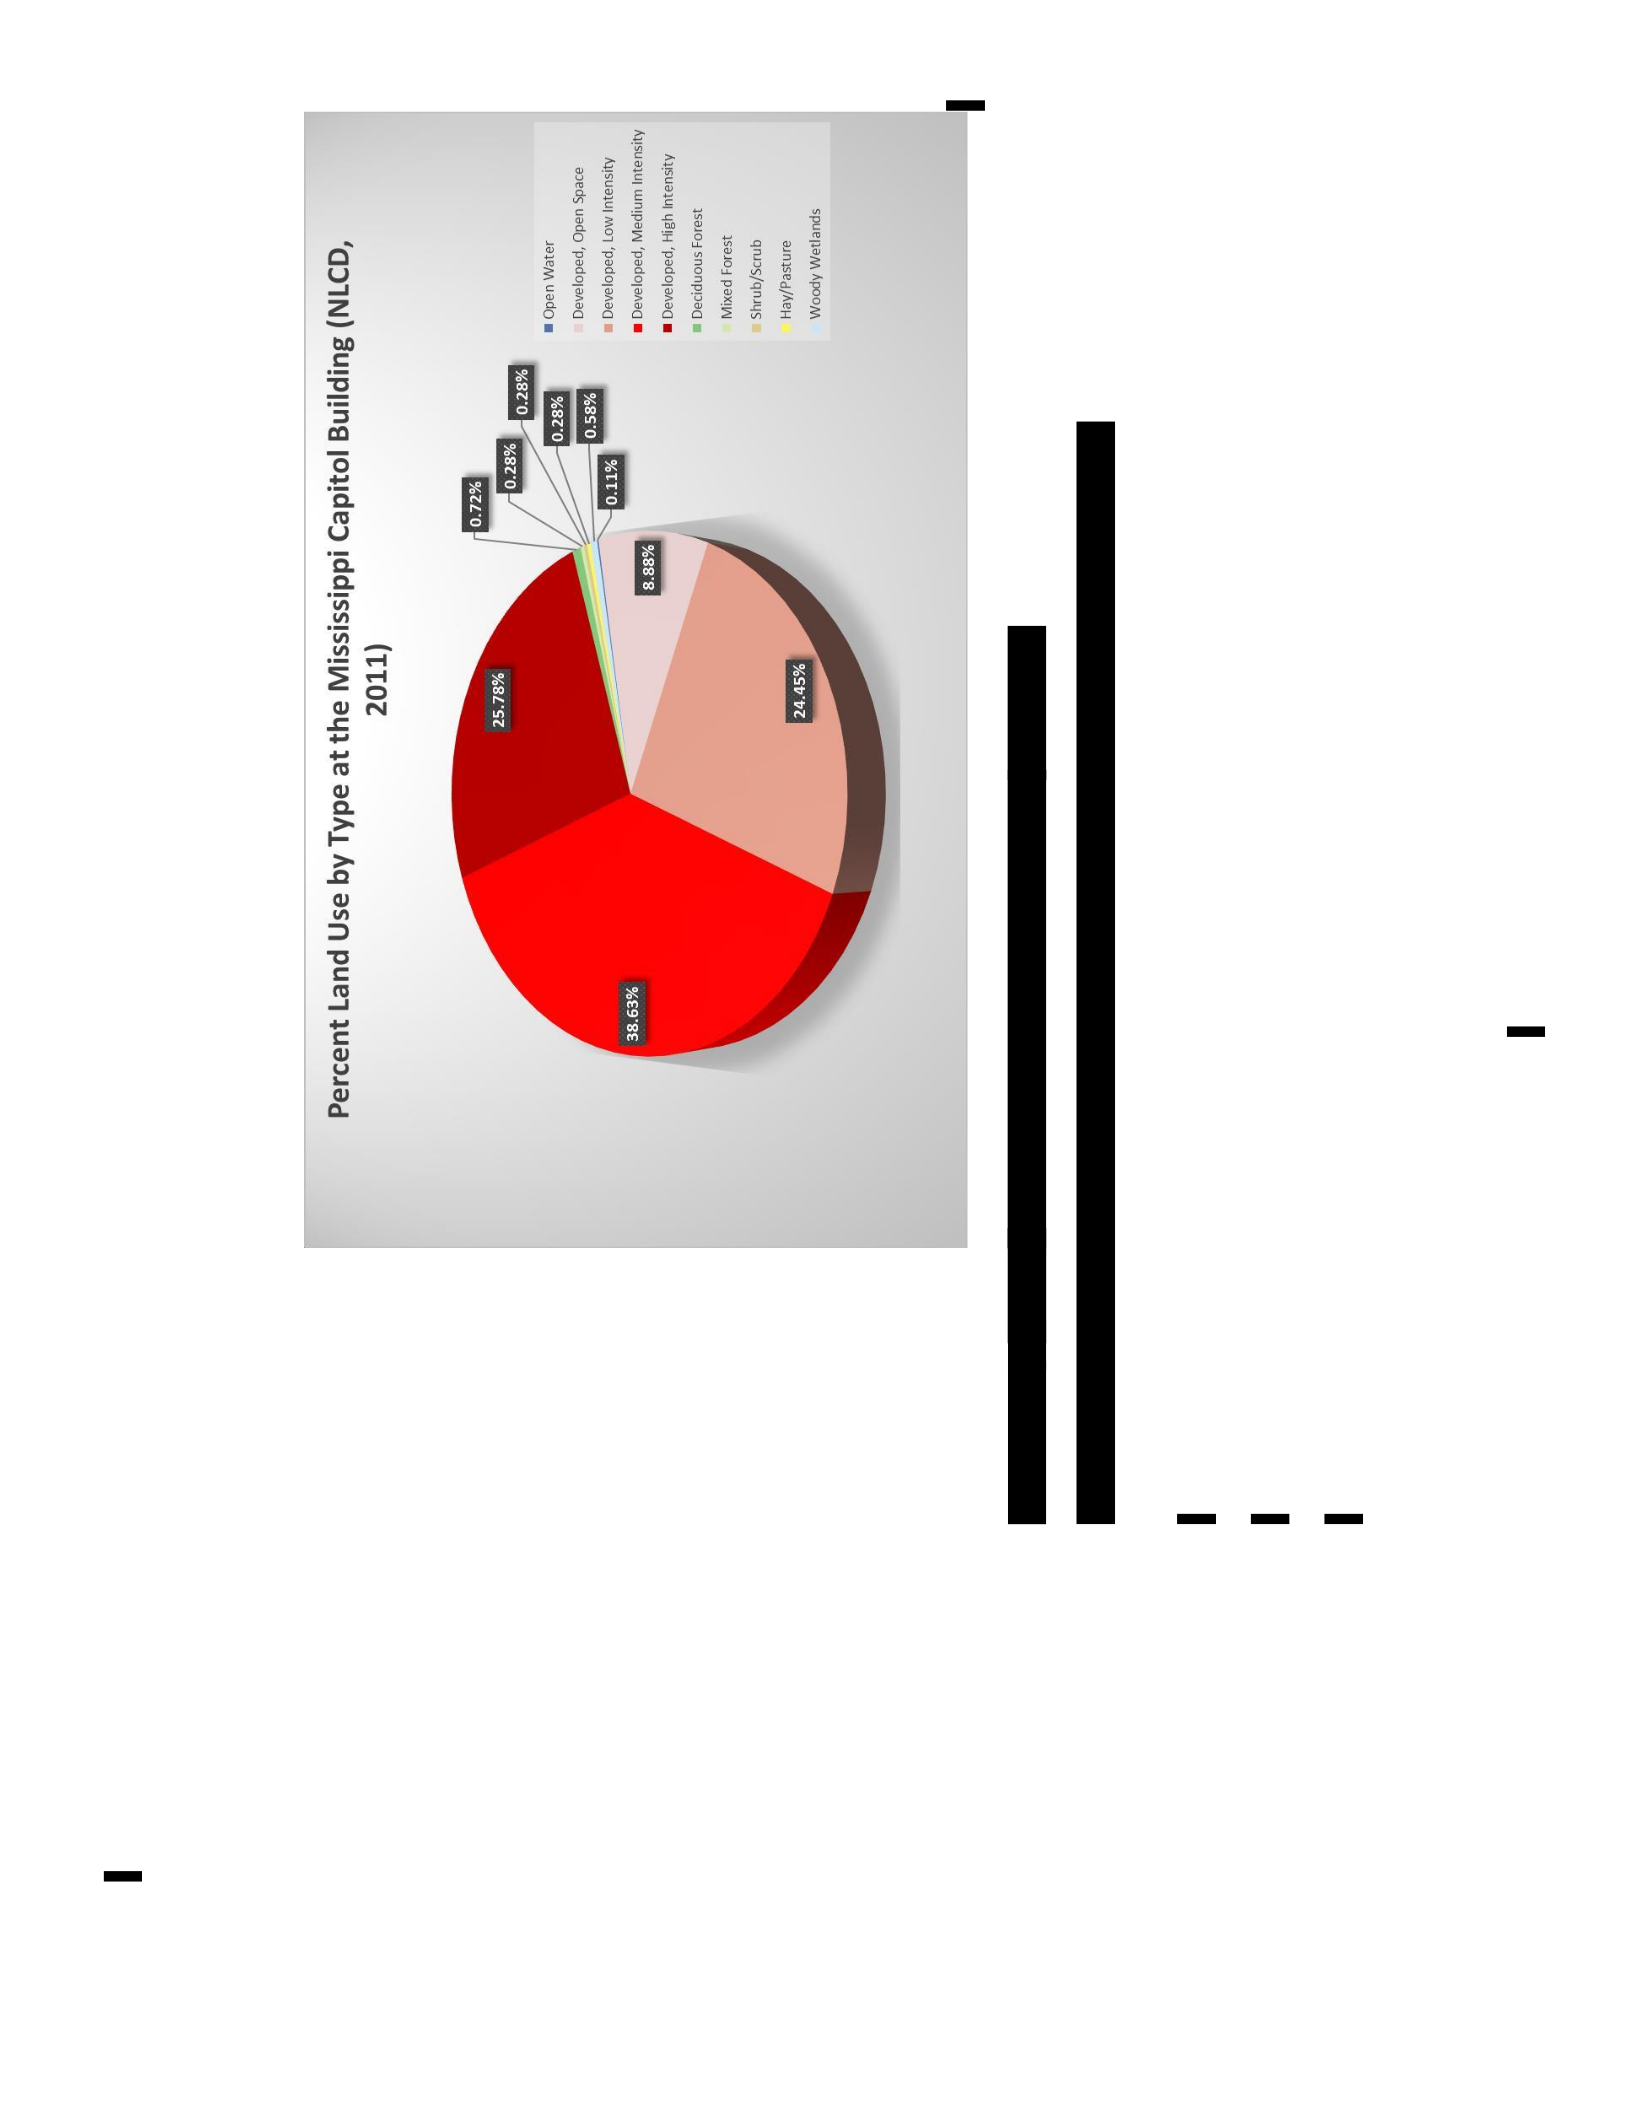
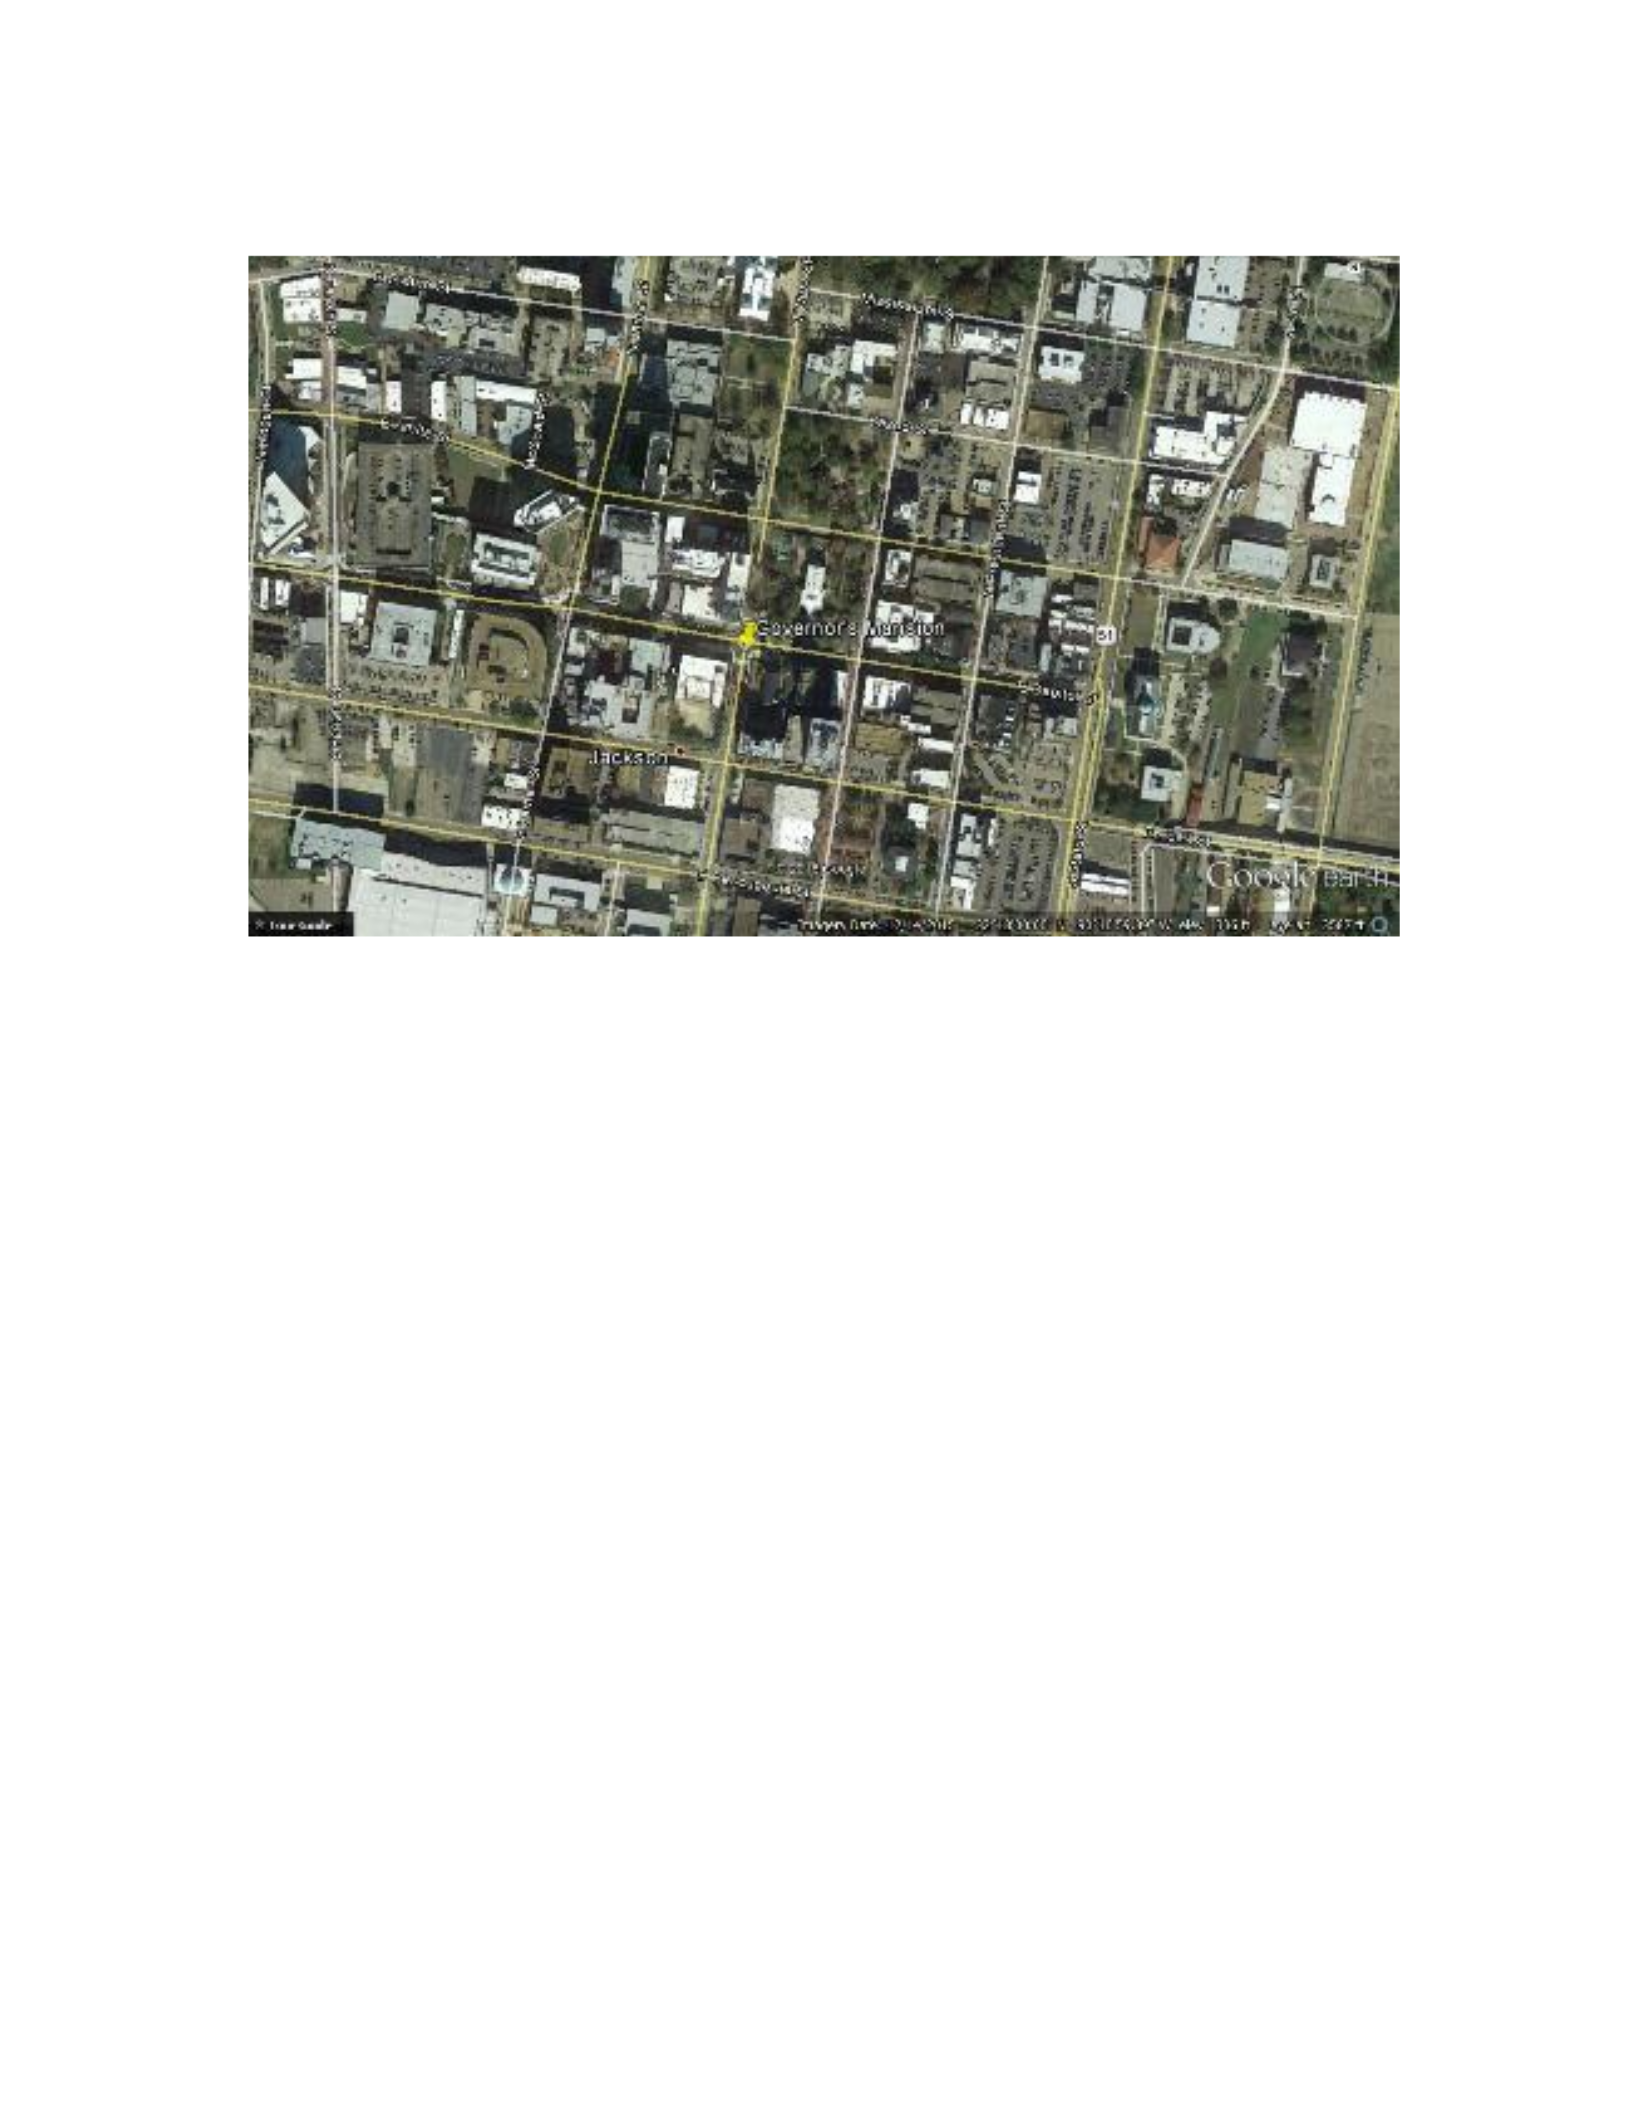
Figure B.14 Governor’s Mansion Map
Google Earth map of downtown Jackson and the Governor’s Mansion. The city and its
roads are labeled on the map. The tack indicates the intersection where the Mansion
observations were measured. Created: March 7, 2016.
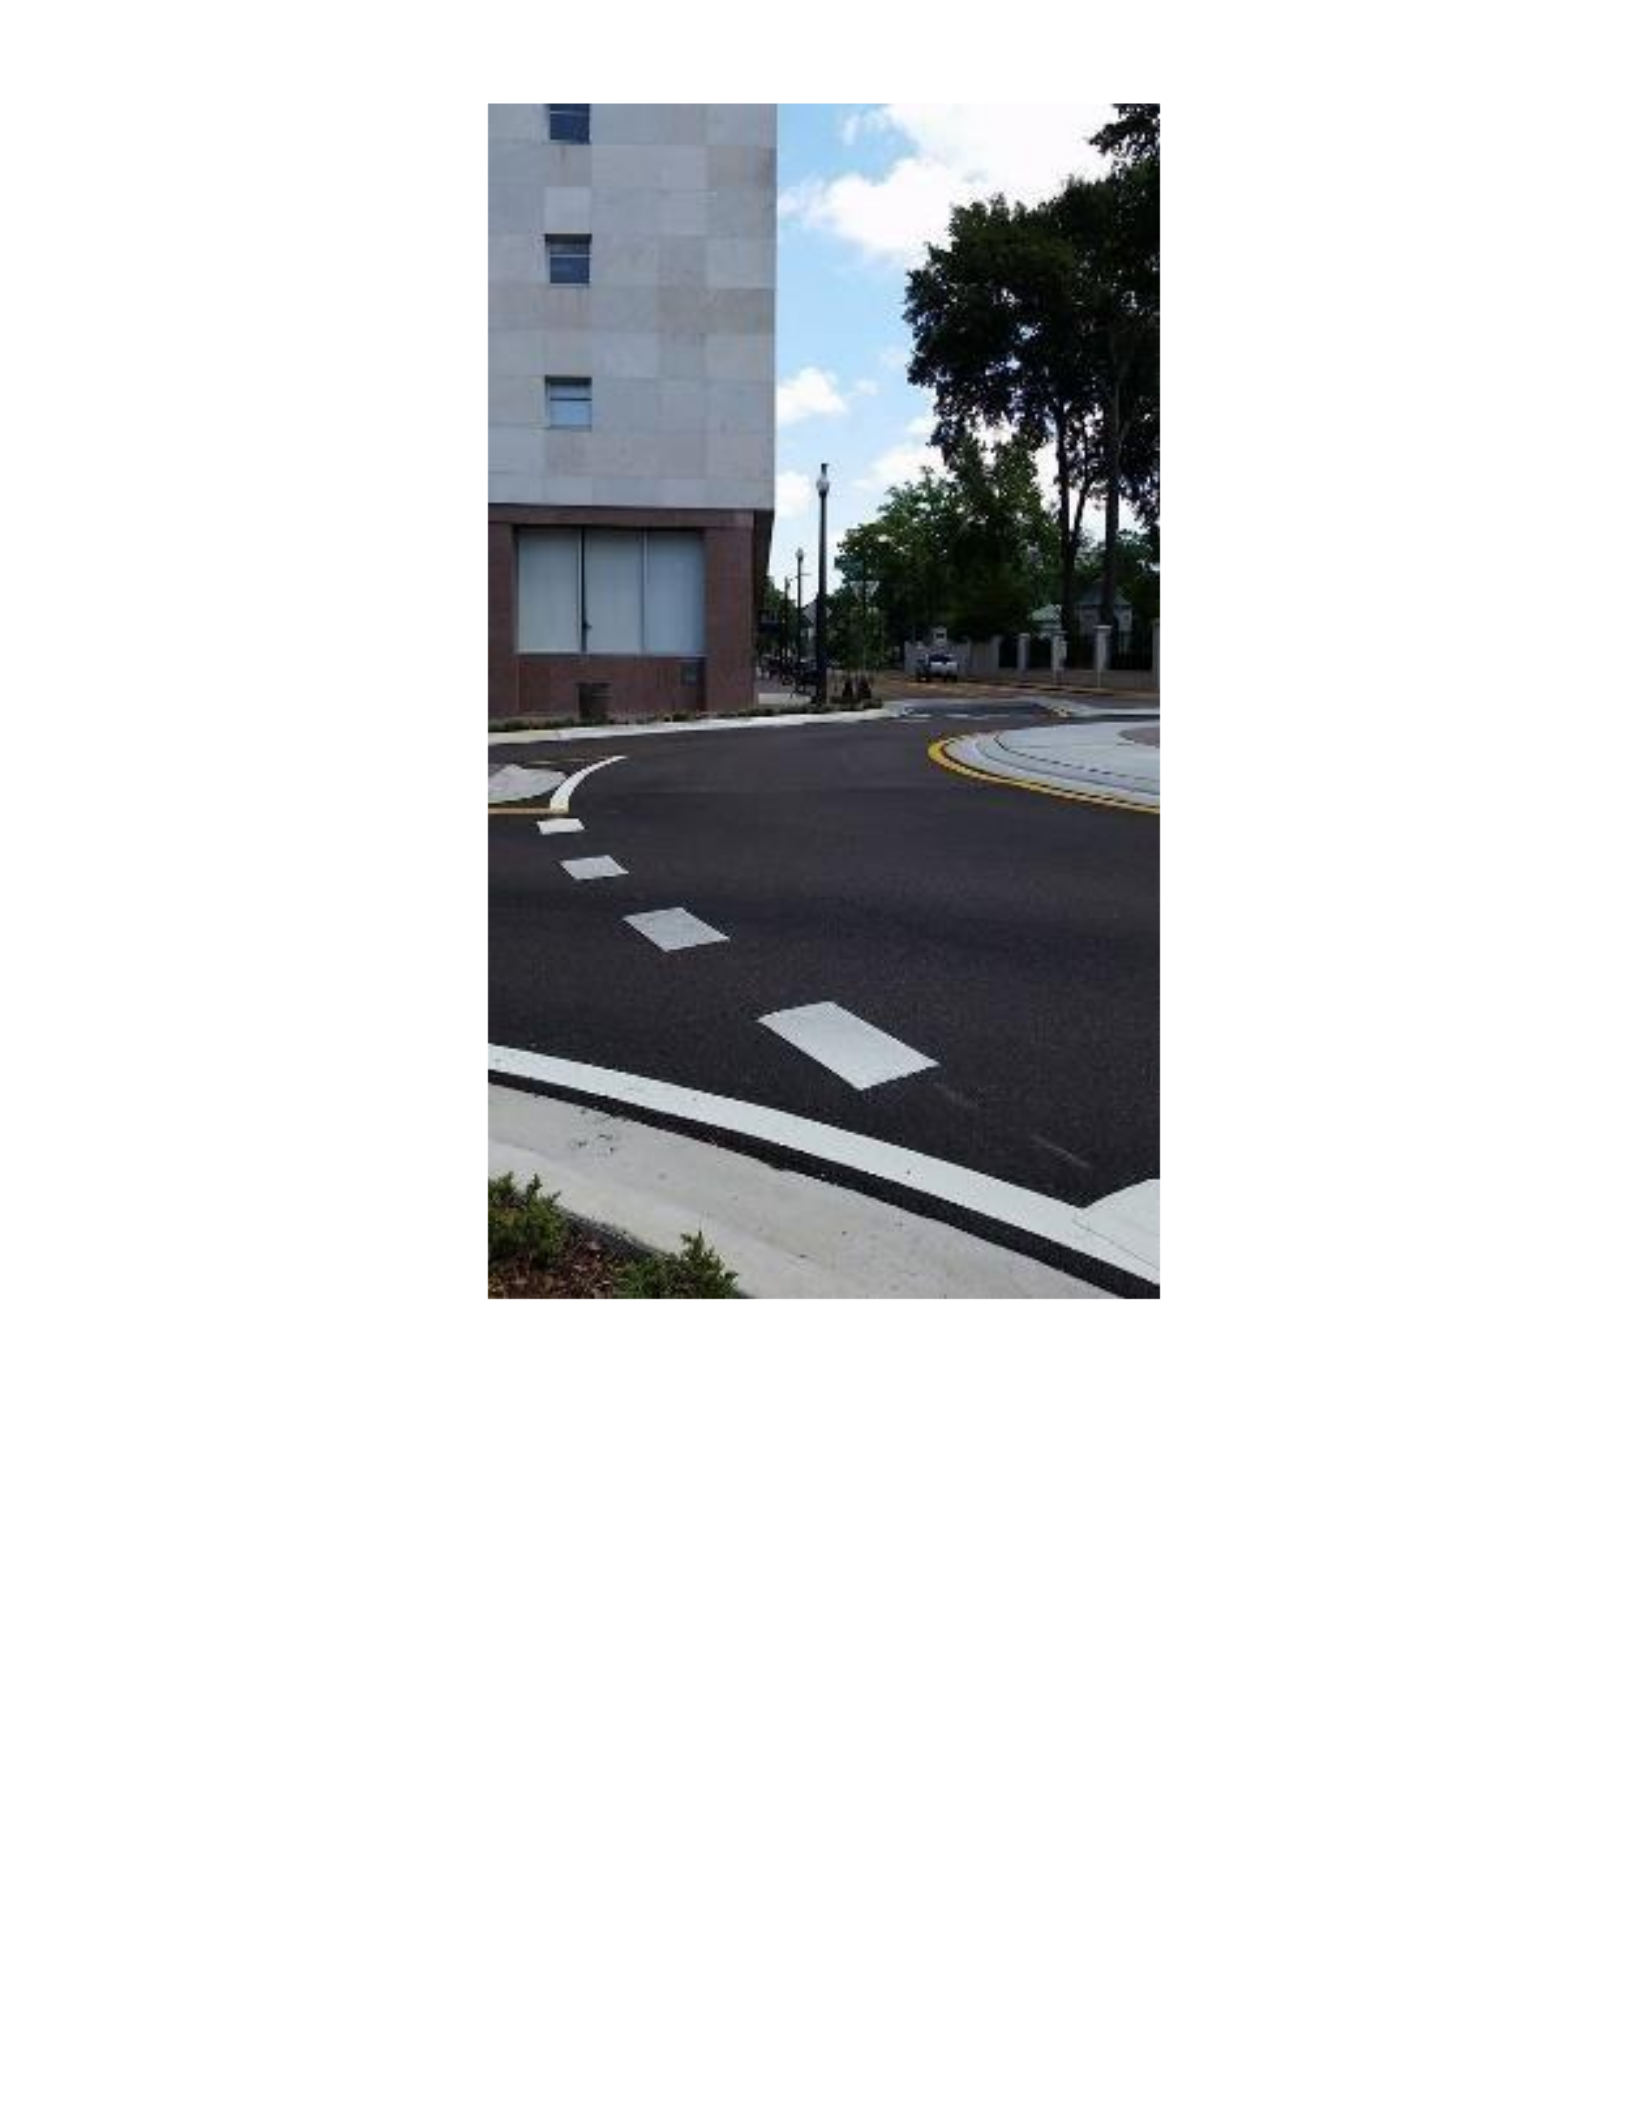
Figure B.15 On-site photograph beside the Governor’s Mansion.
Photo of the intersection on the southwest side of the Governor’s Mansion property.
Photo looks north across the intersection. Photo credit: Holly Lussenden (August 28,
2015).
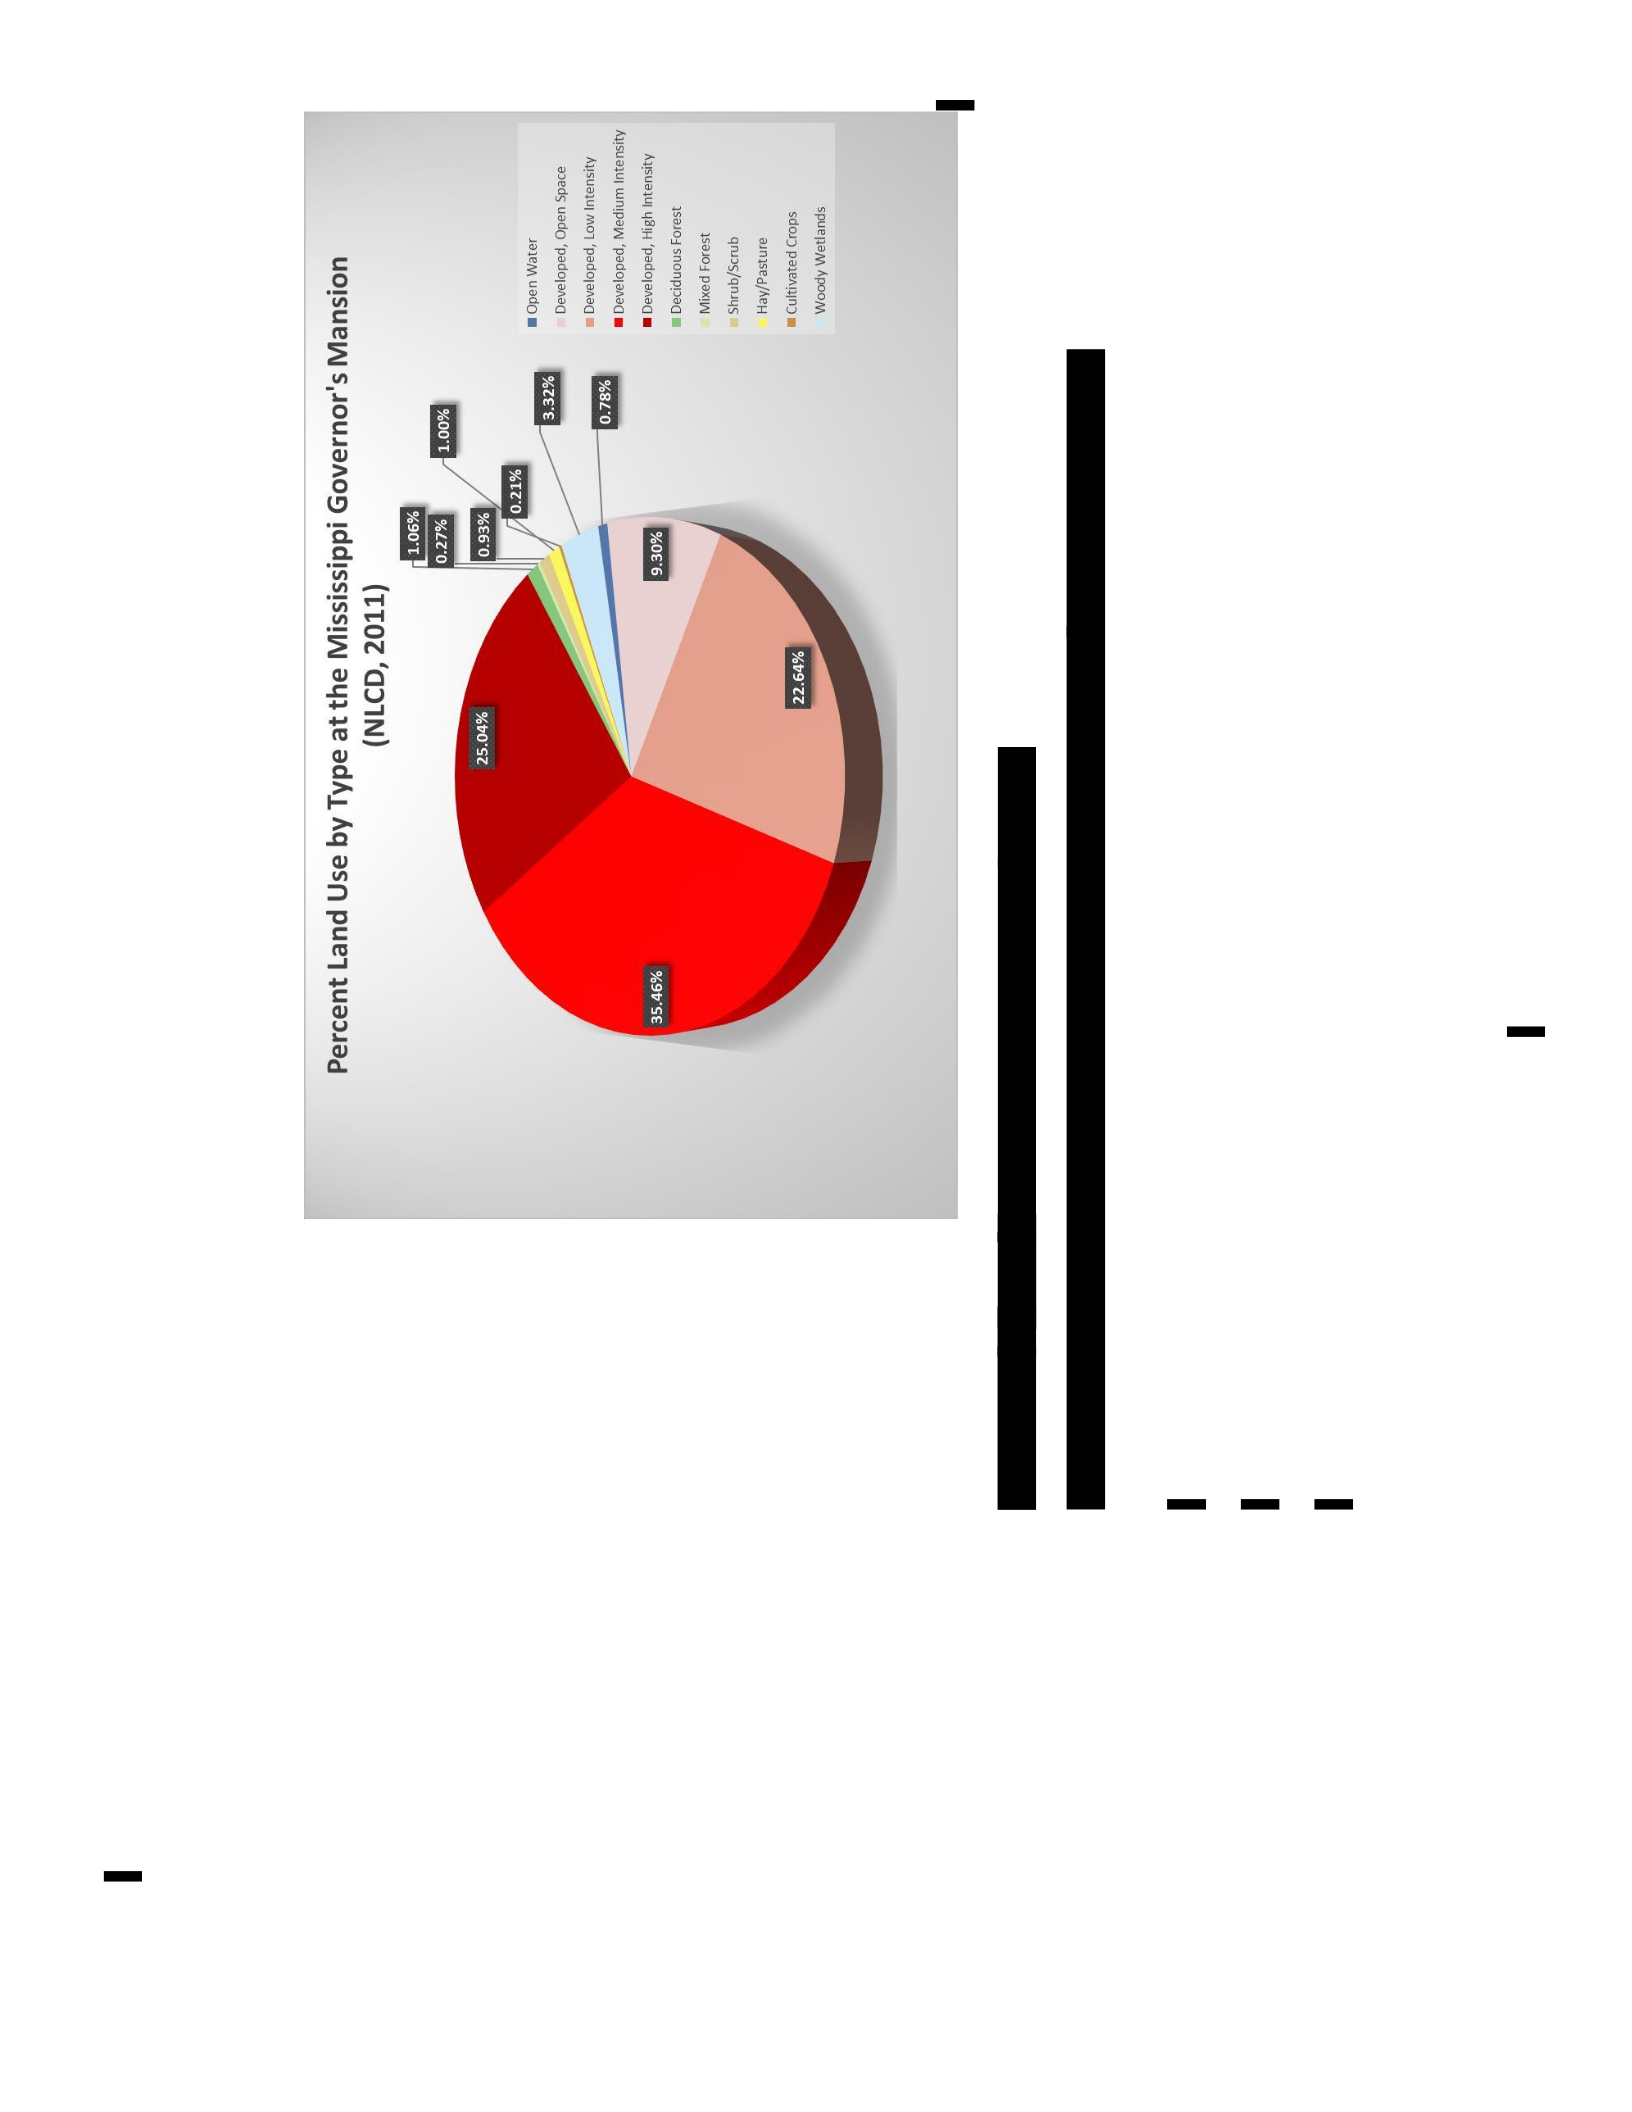
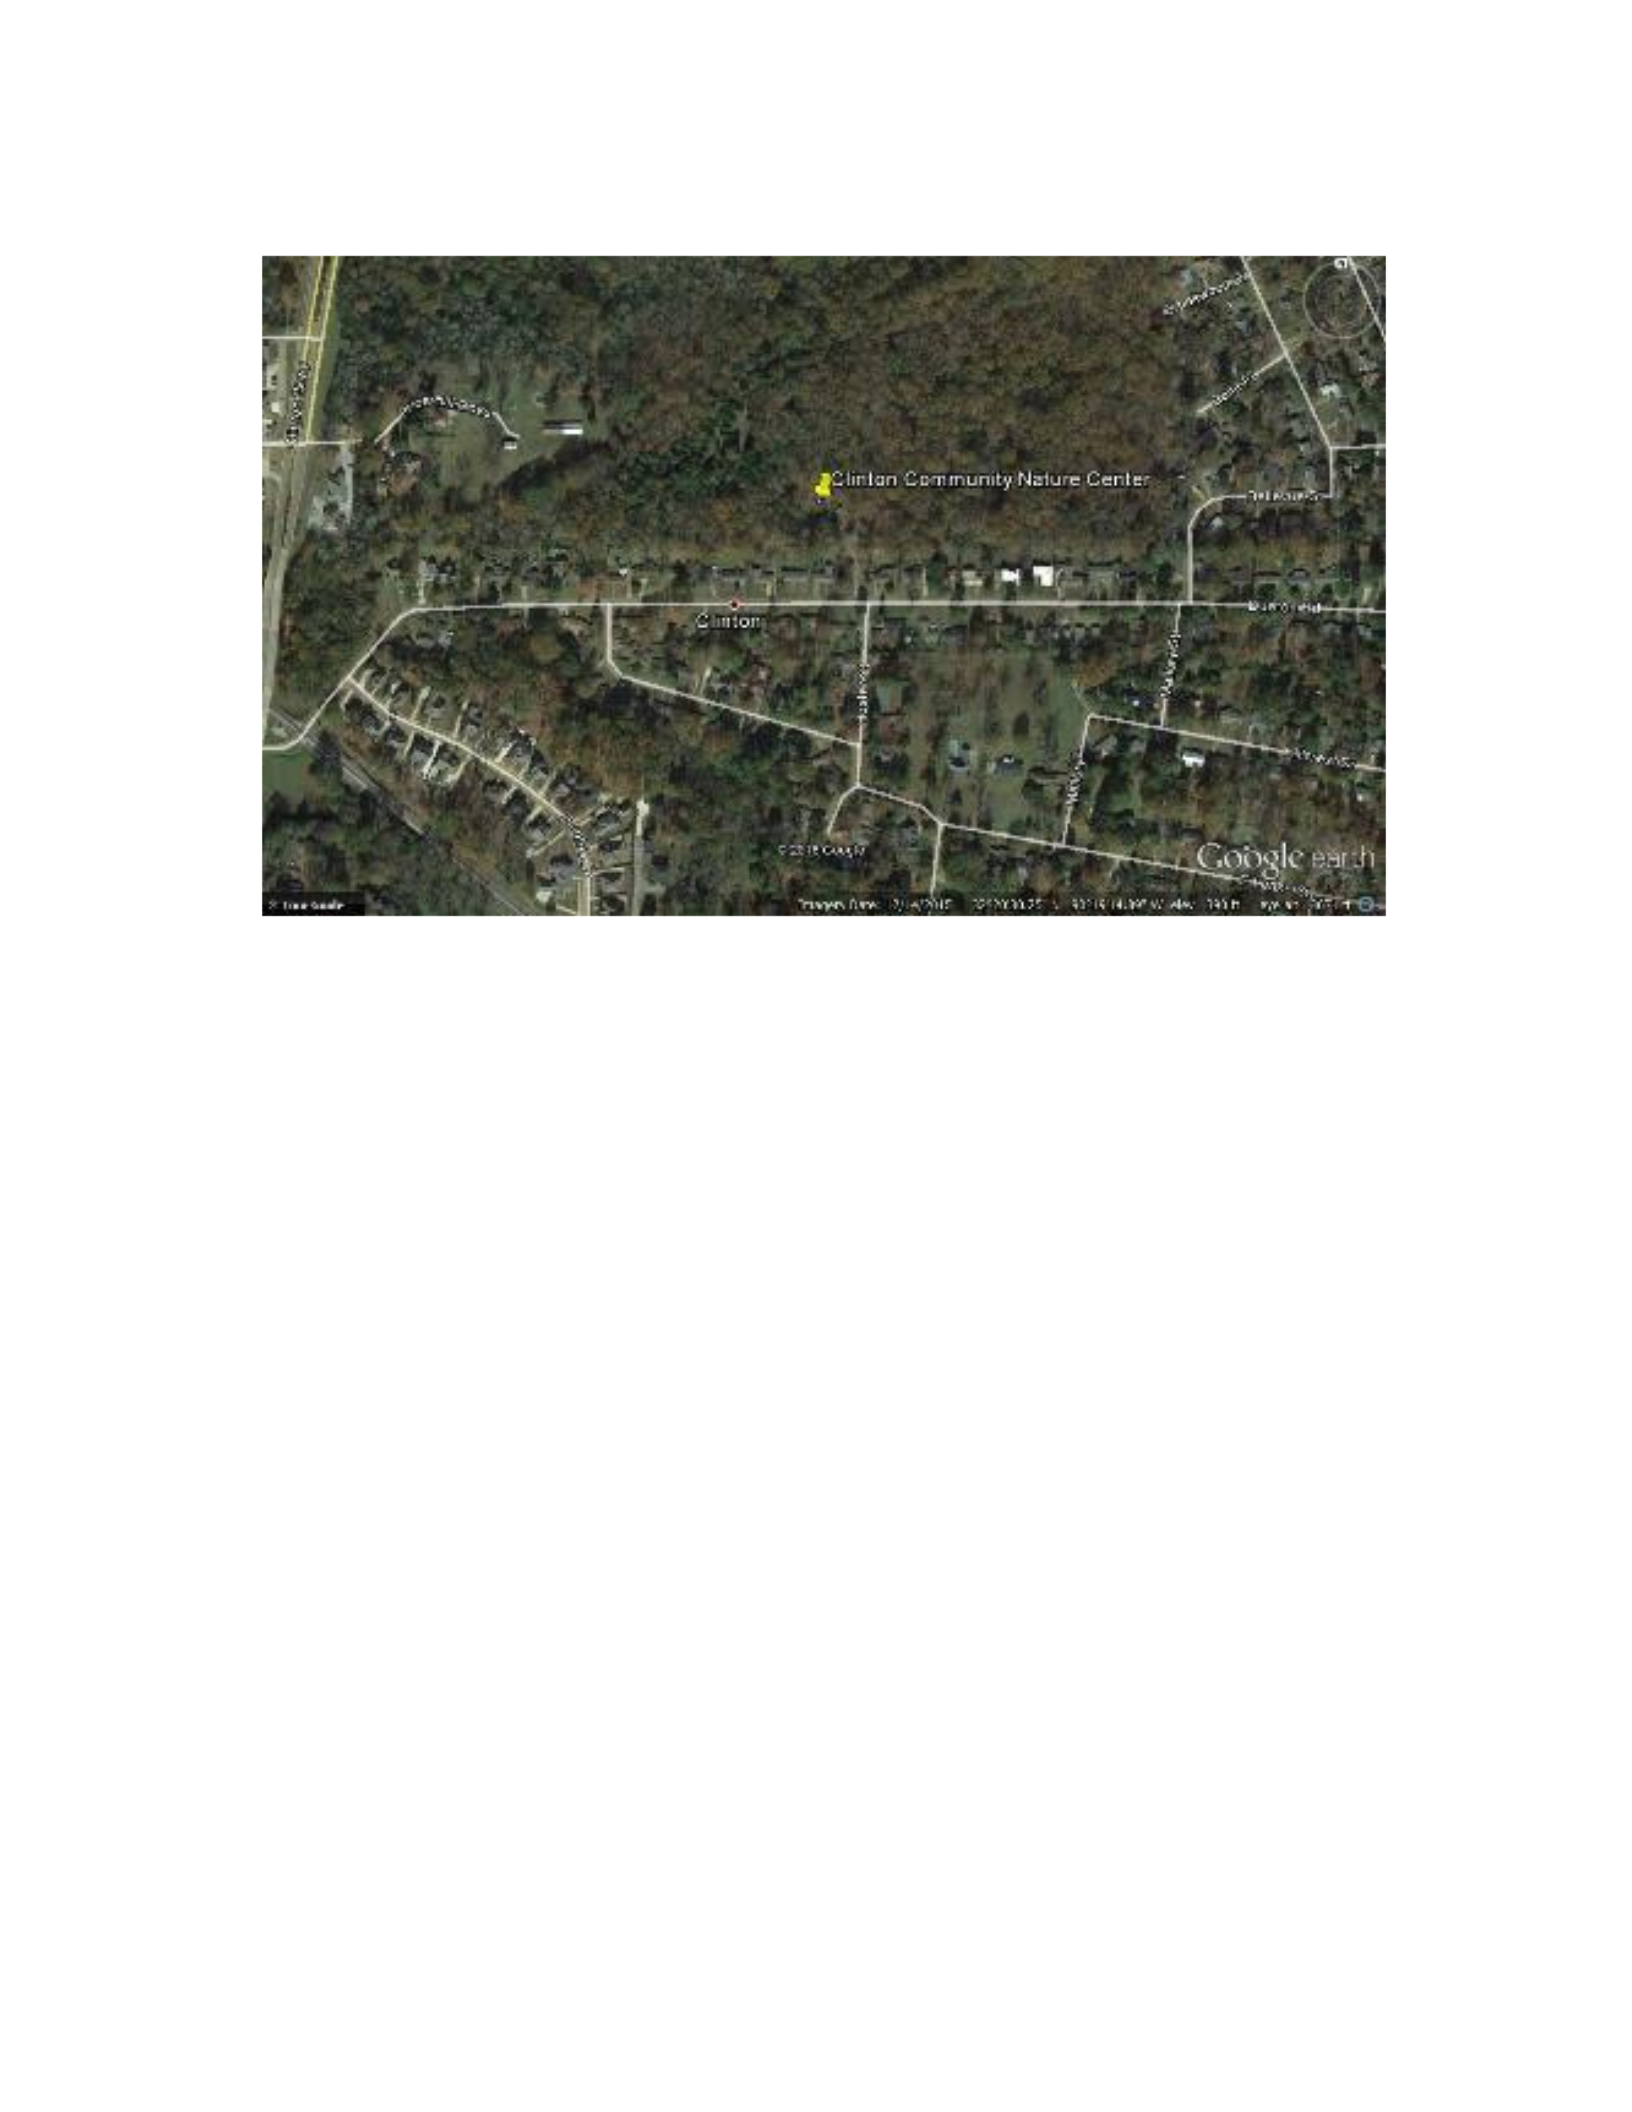
Figure B.17 Clinton Community Nature Center
Google Earth map of the Clinton Community Nature Center. Roads as well as city names
are labeled on the map. The tack indicates the location where the Nature Center’s
observations were measured. Created: March 7, 2016.
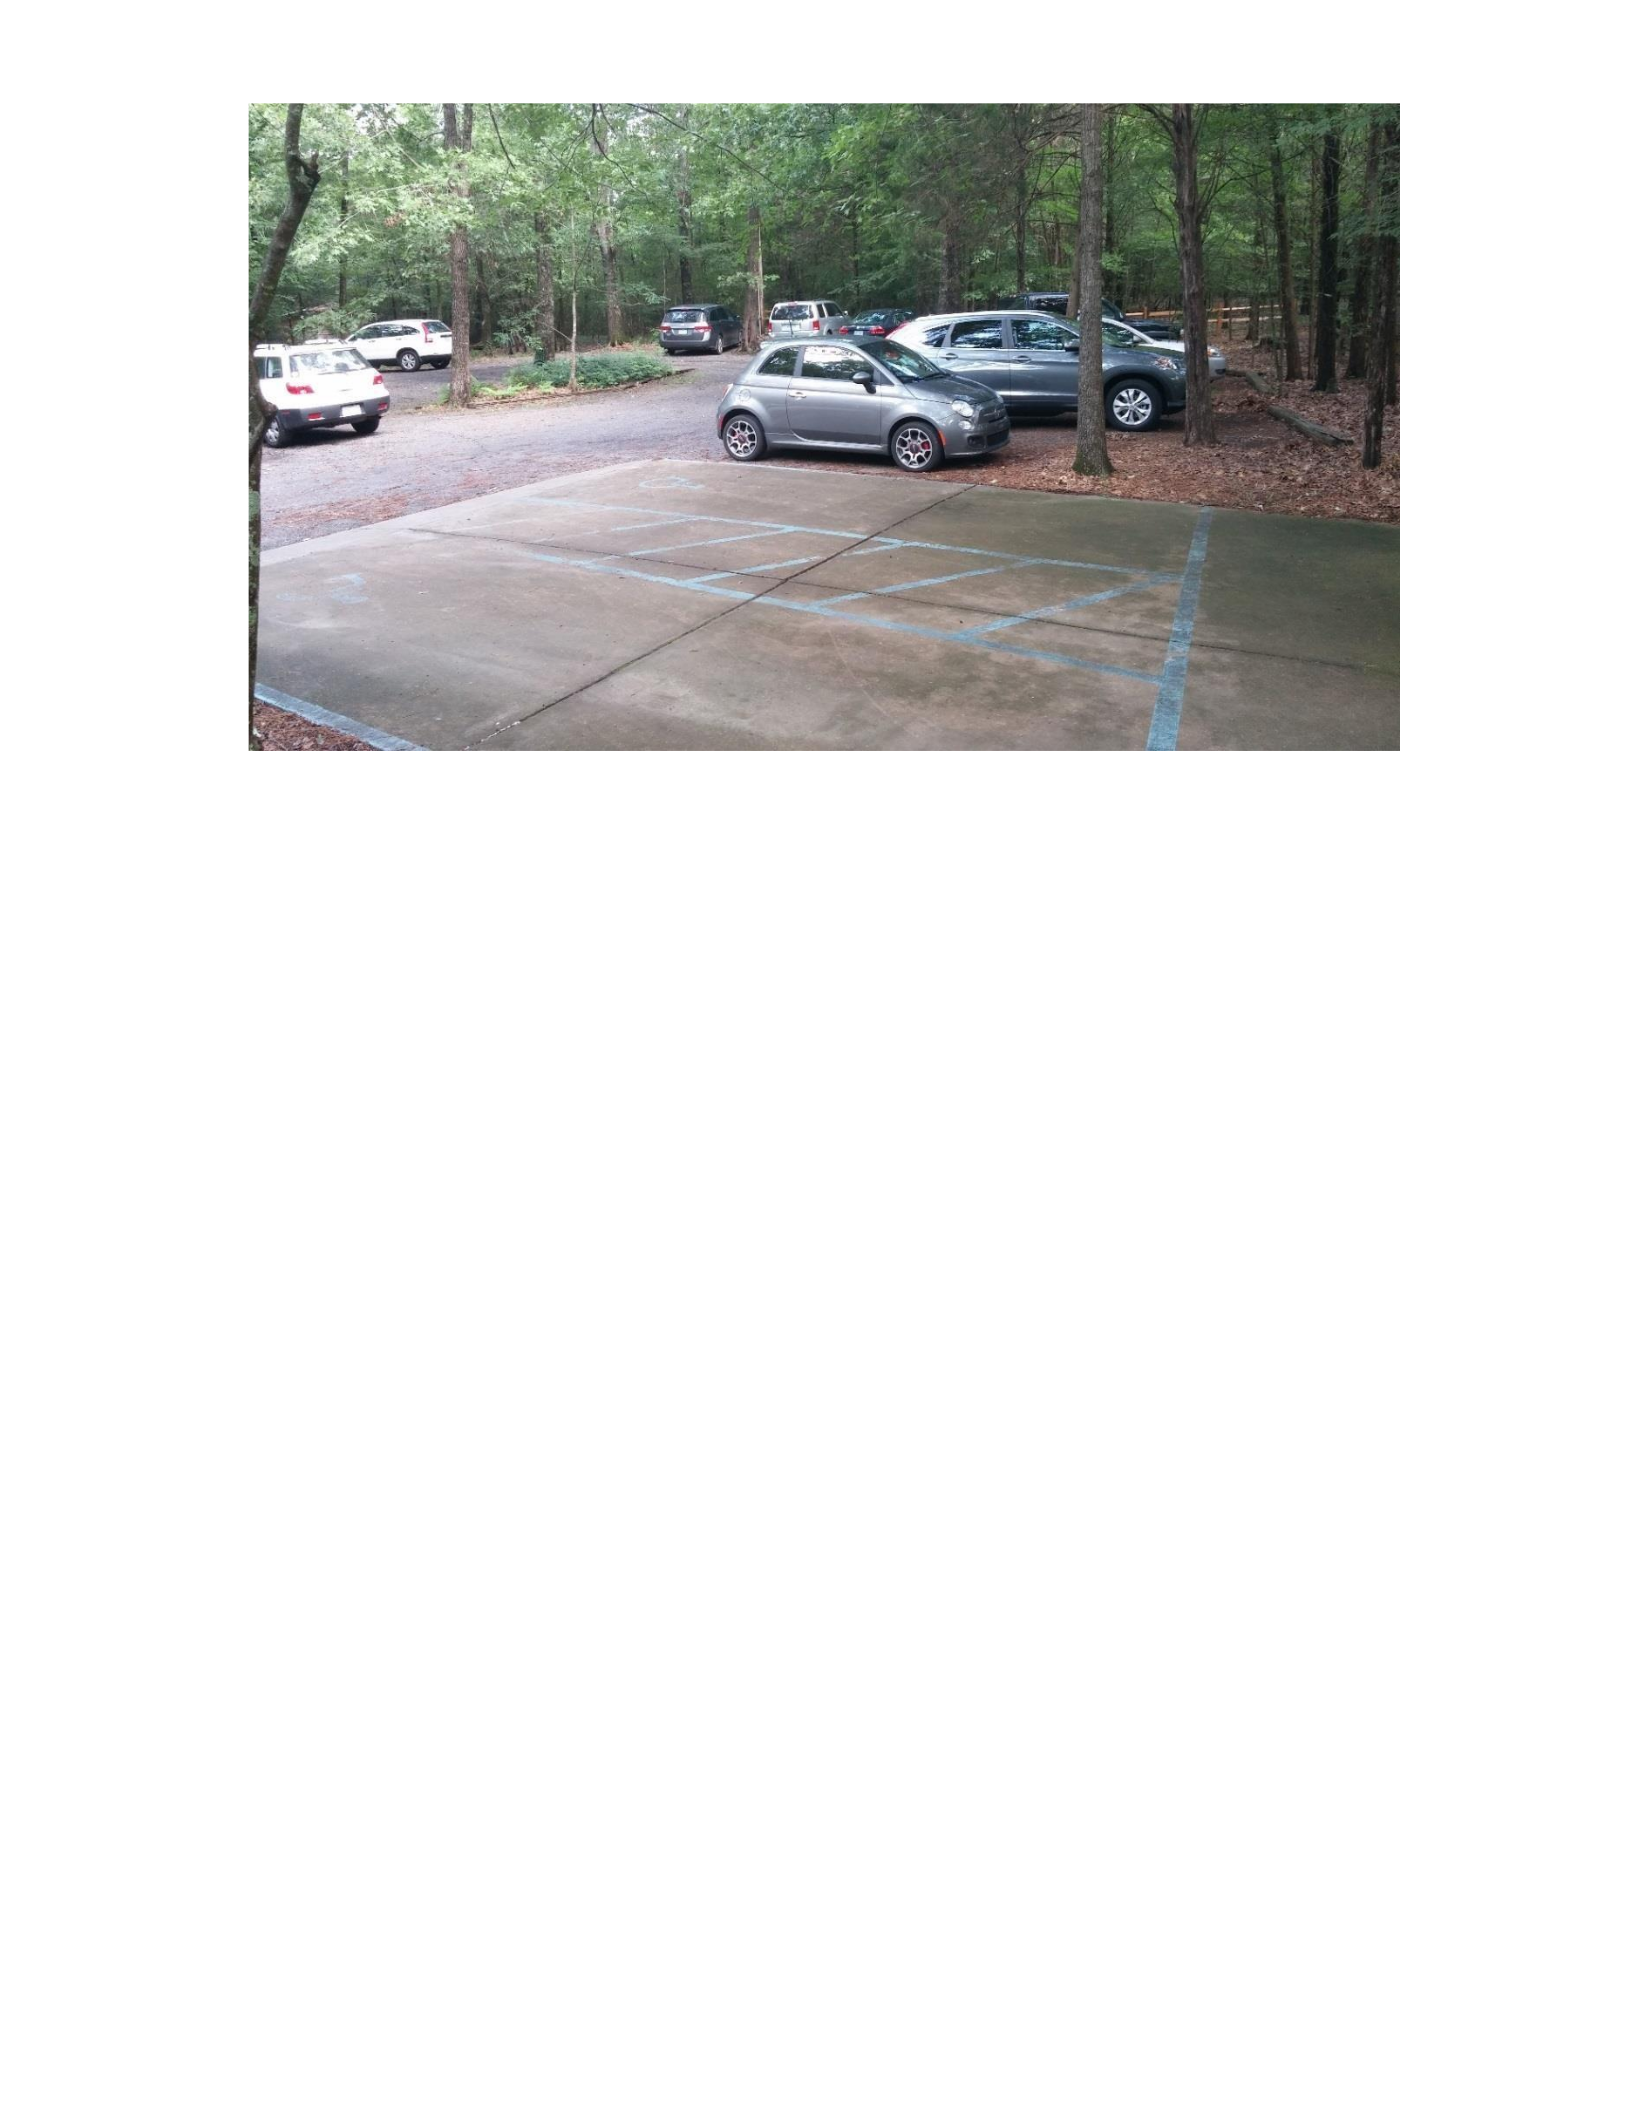
Figure B.18 On-site photograph of the Nature Center
Photo of the Clinton Community Nature Center parking lot. The parking lot is where the
observations were collected. The photo looks north-northwest from the nature center.
Photo credits: Peter Crank (June 16, 2015).
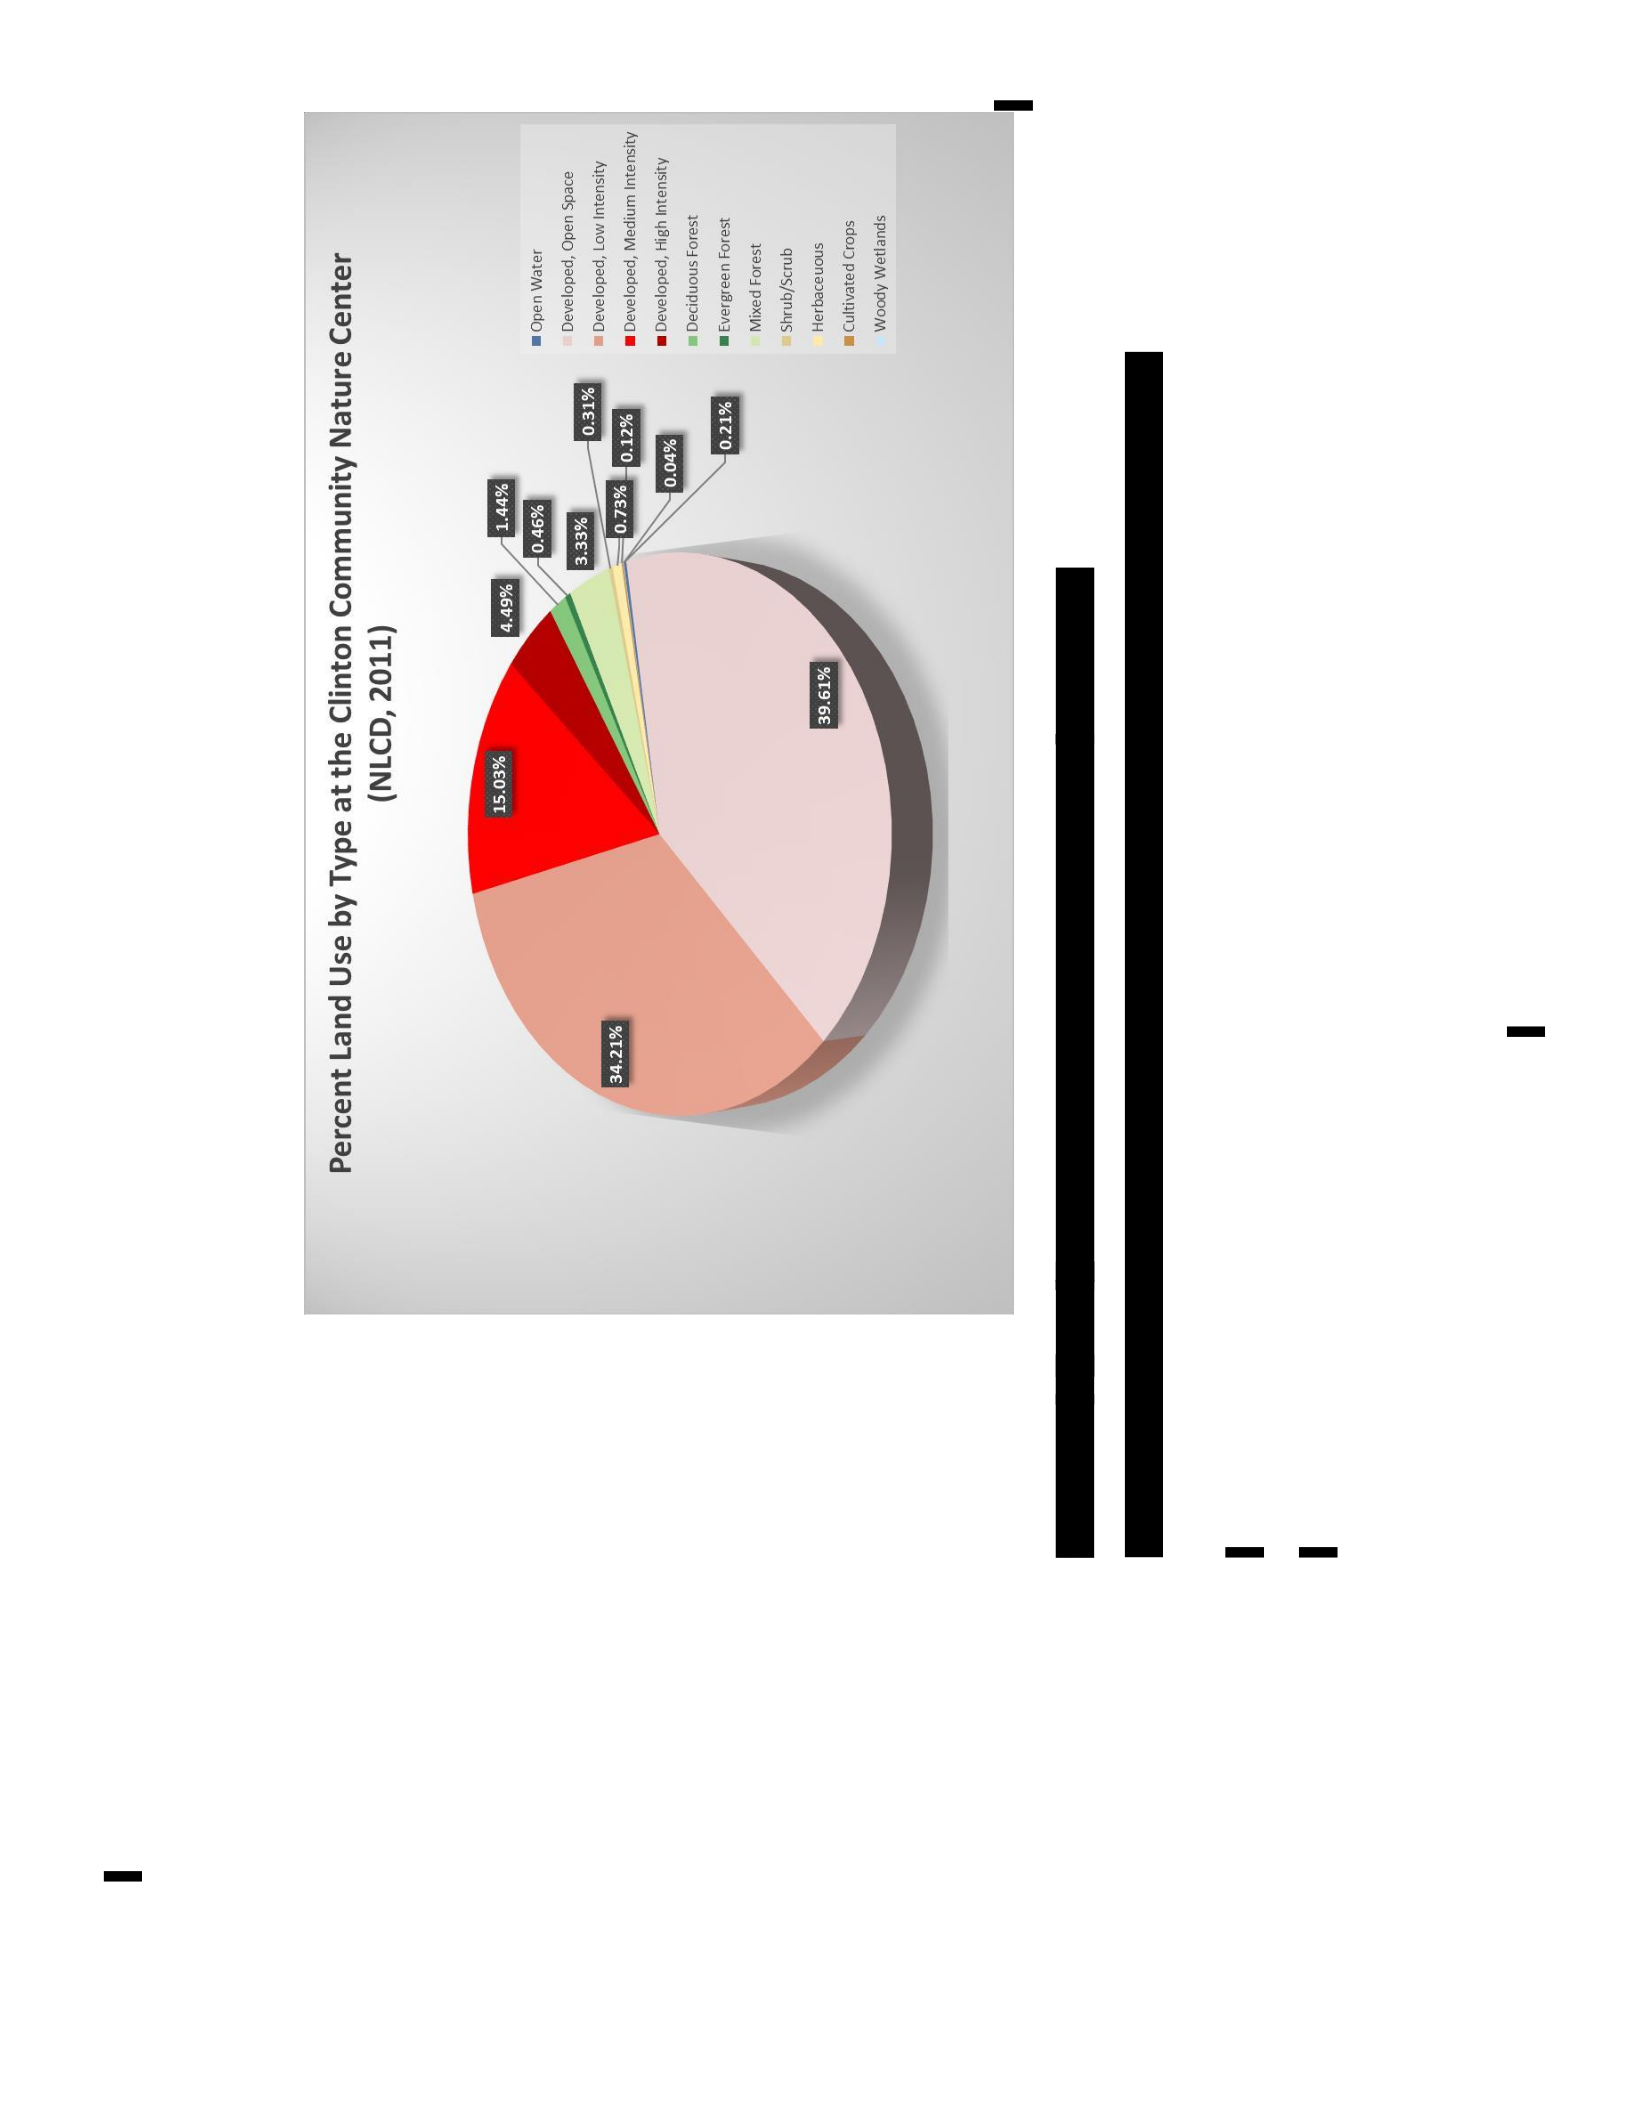
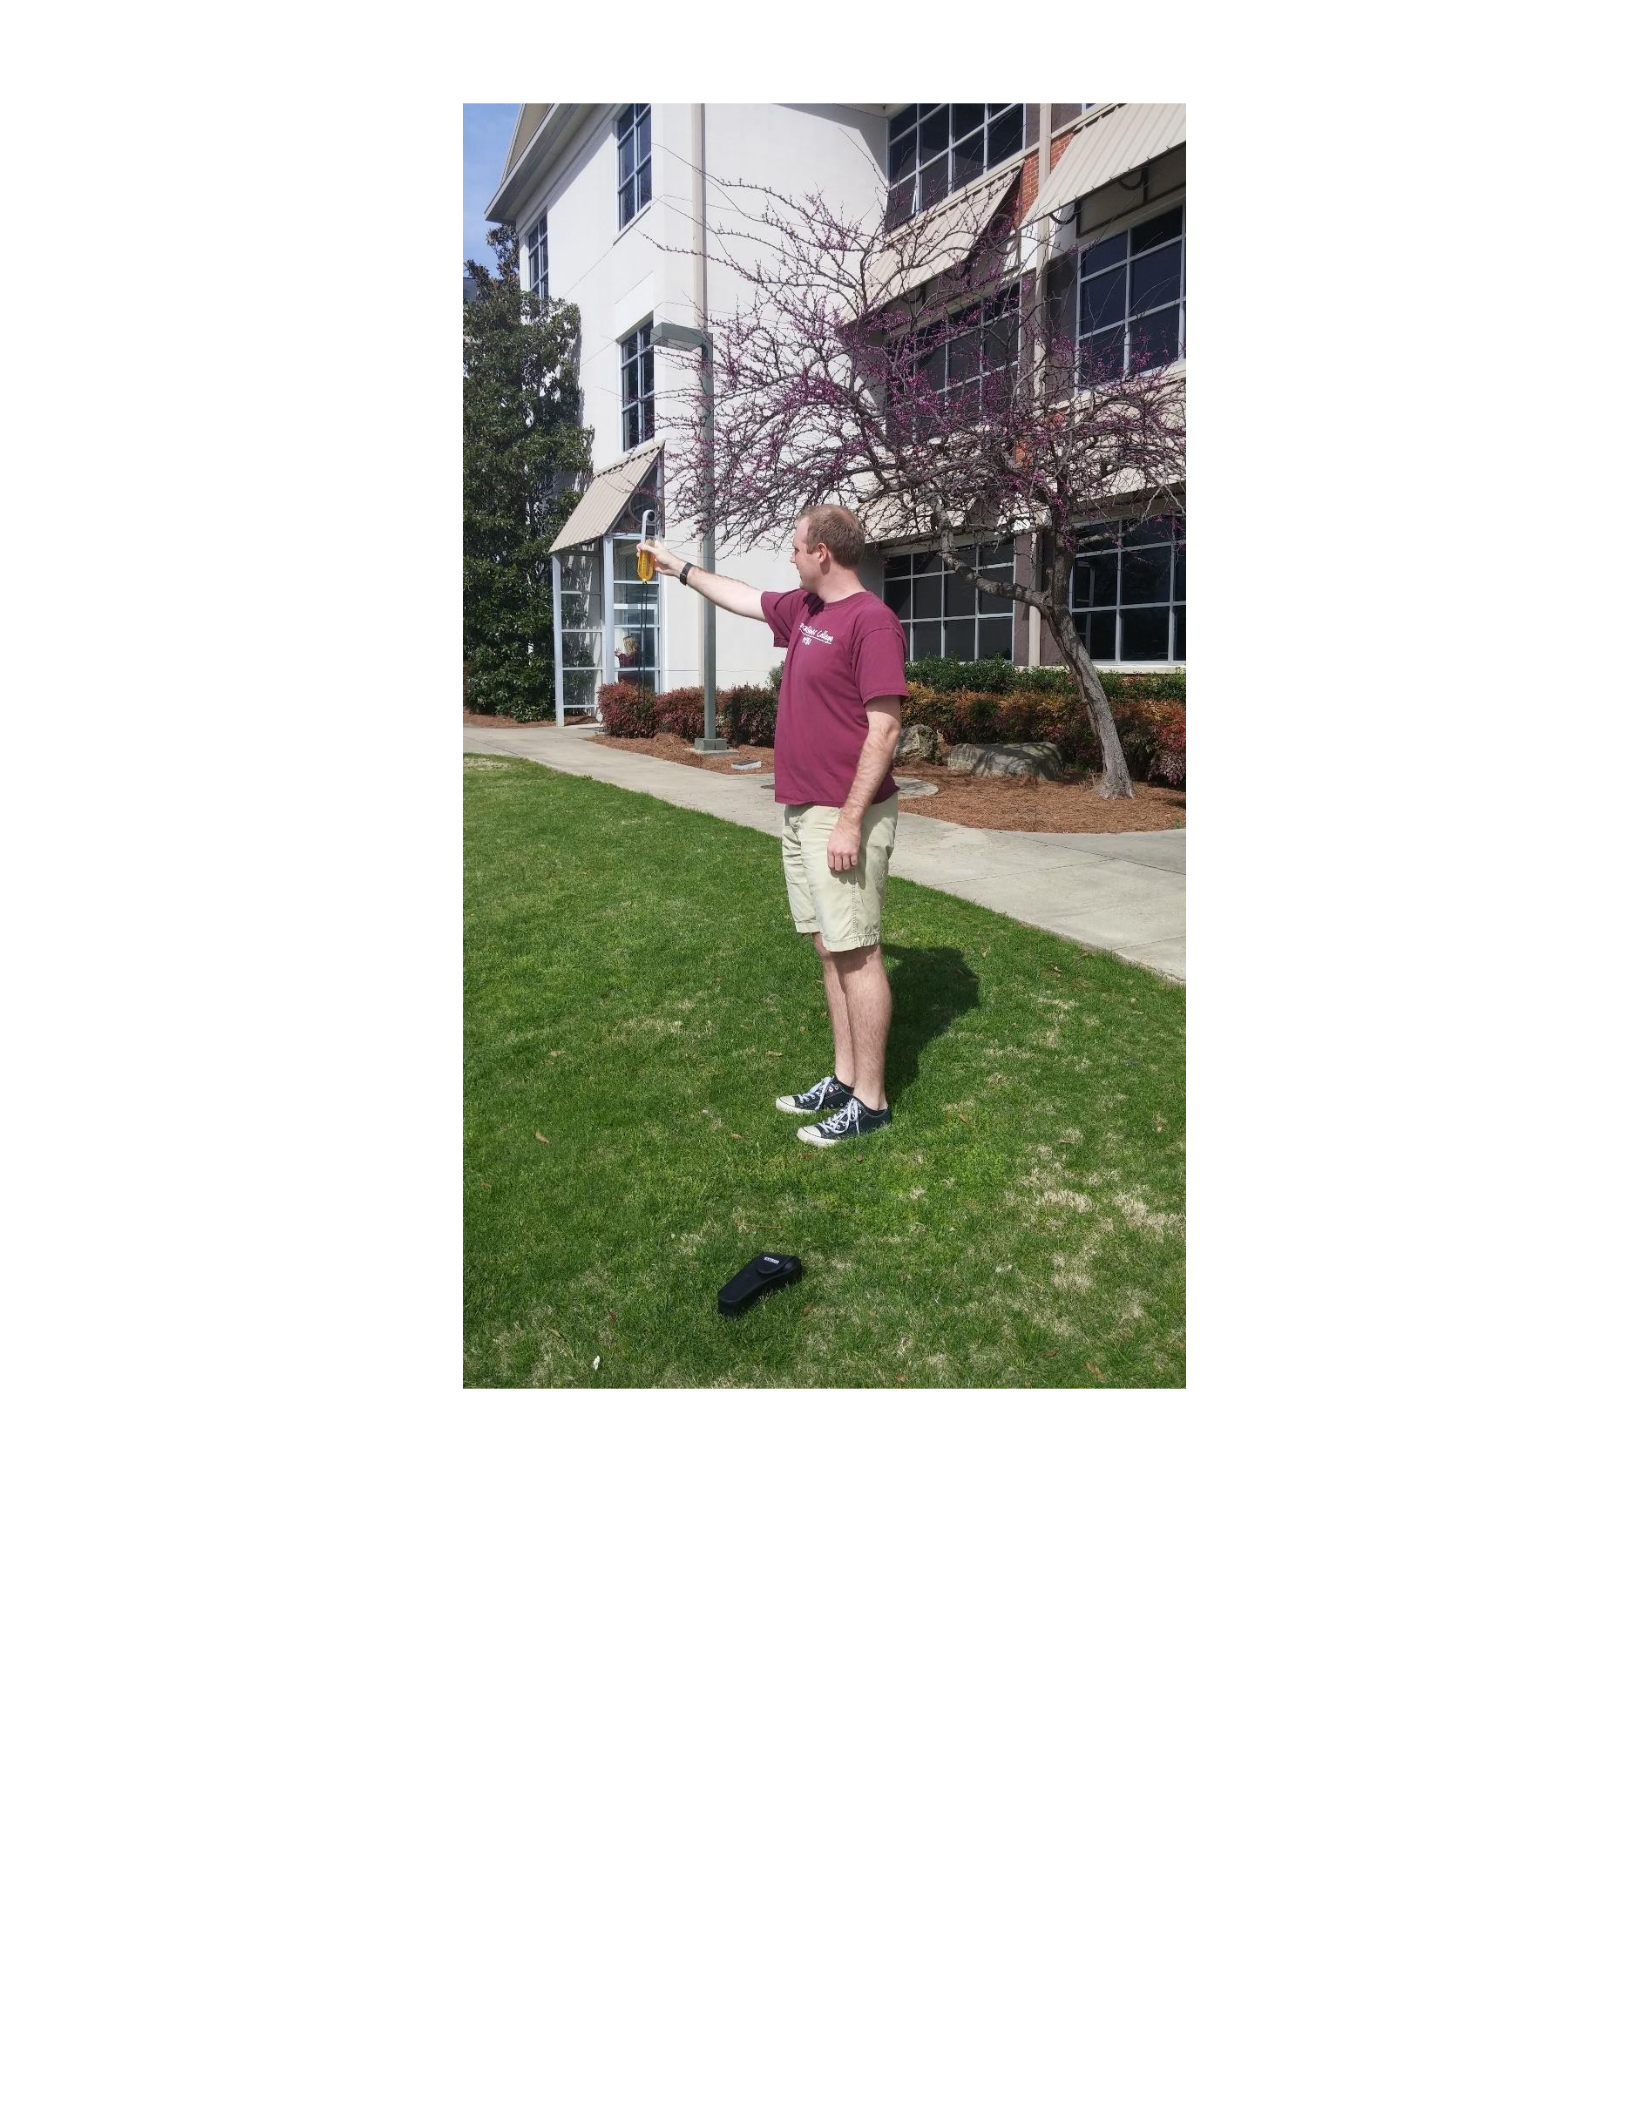
Figure B.20 SkyMaster Instrument
Photo of the SkyMaster instrument in use. The photo displays an appropriate height of
device. Photo credit: Katie Martin (March 8, 2016).
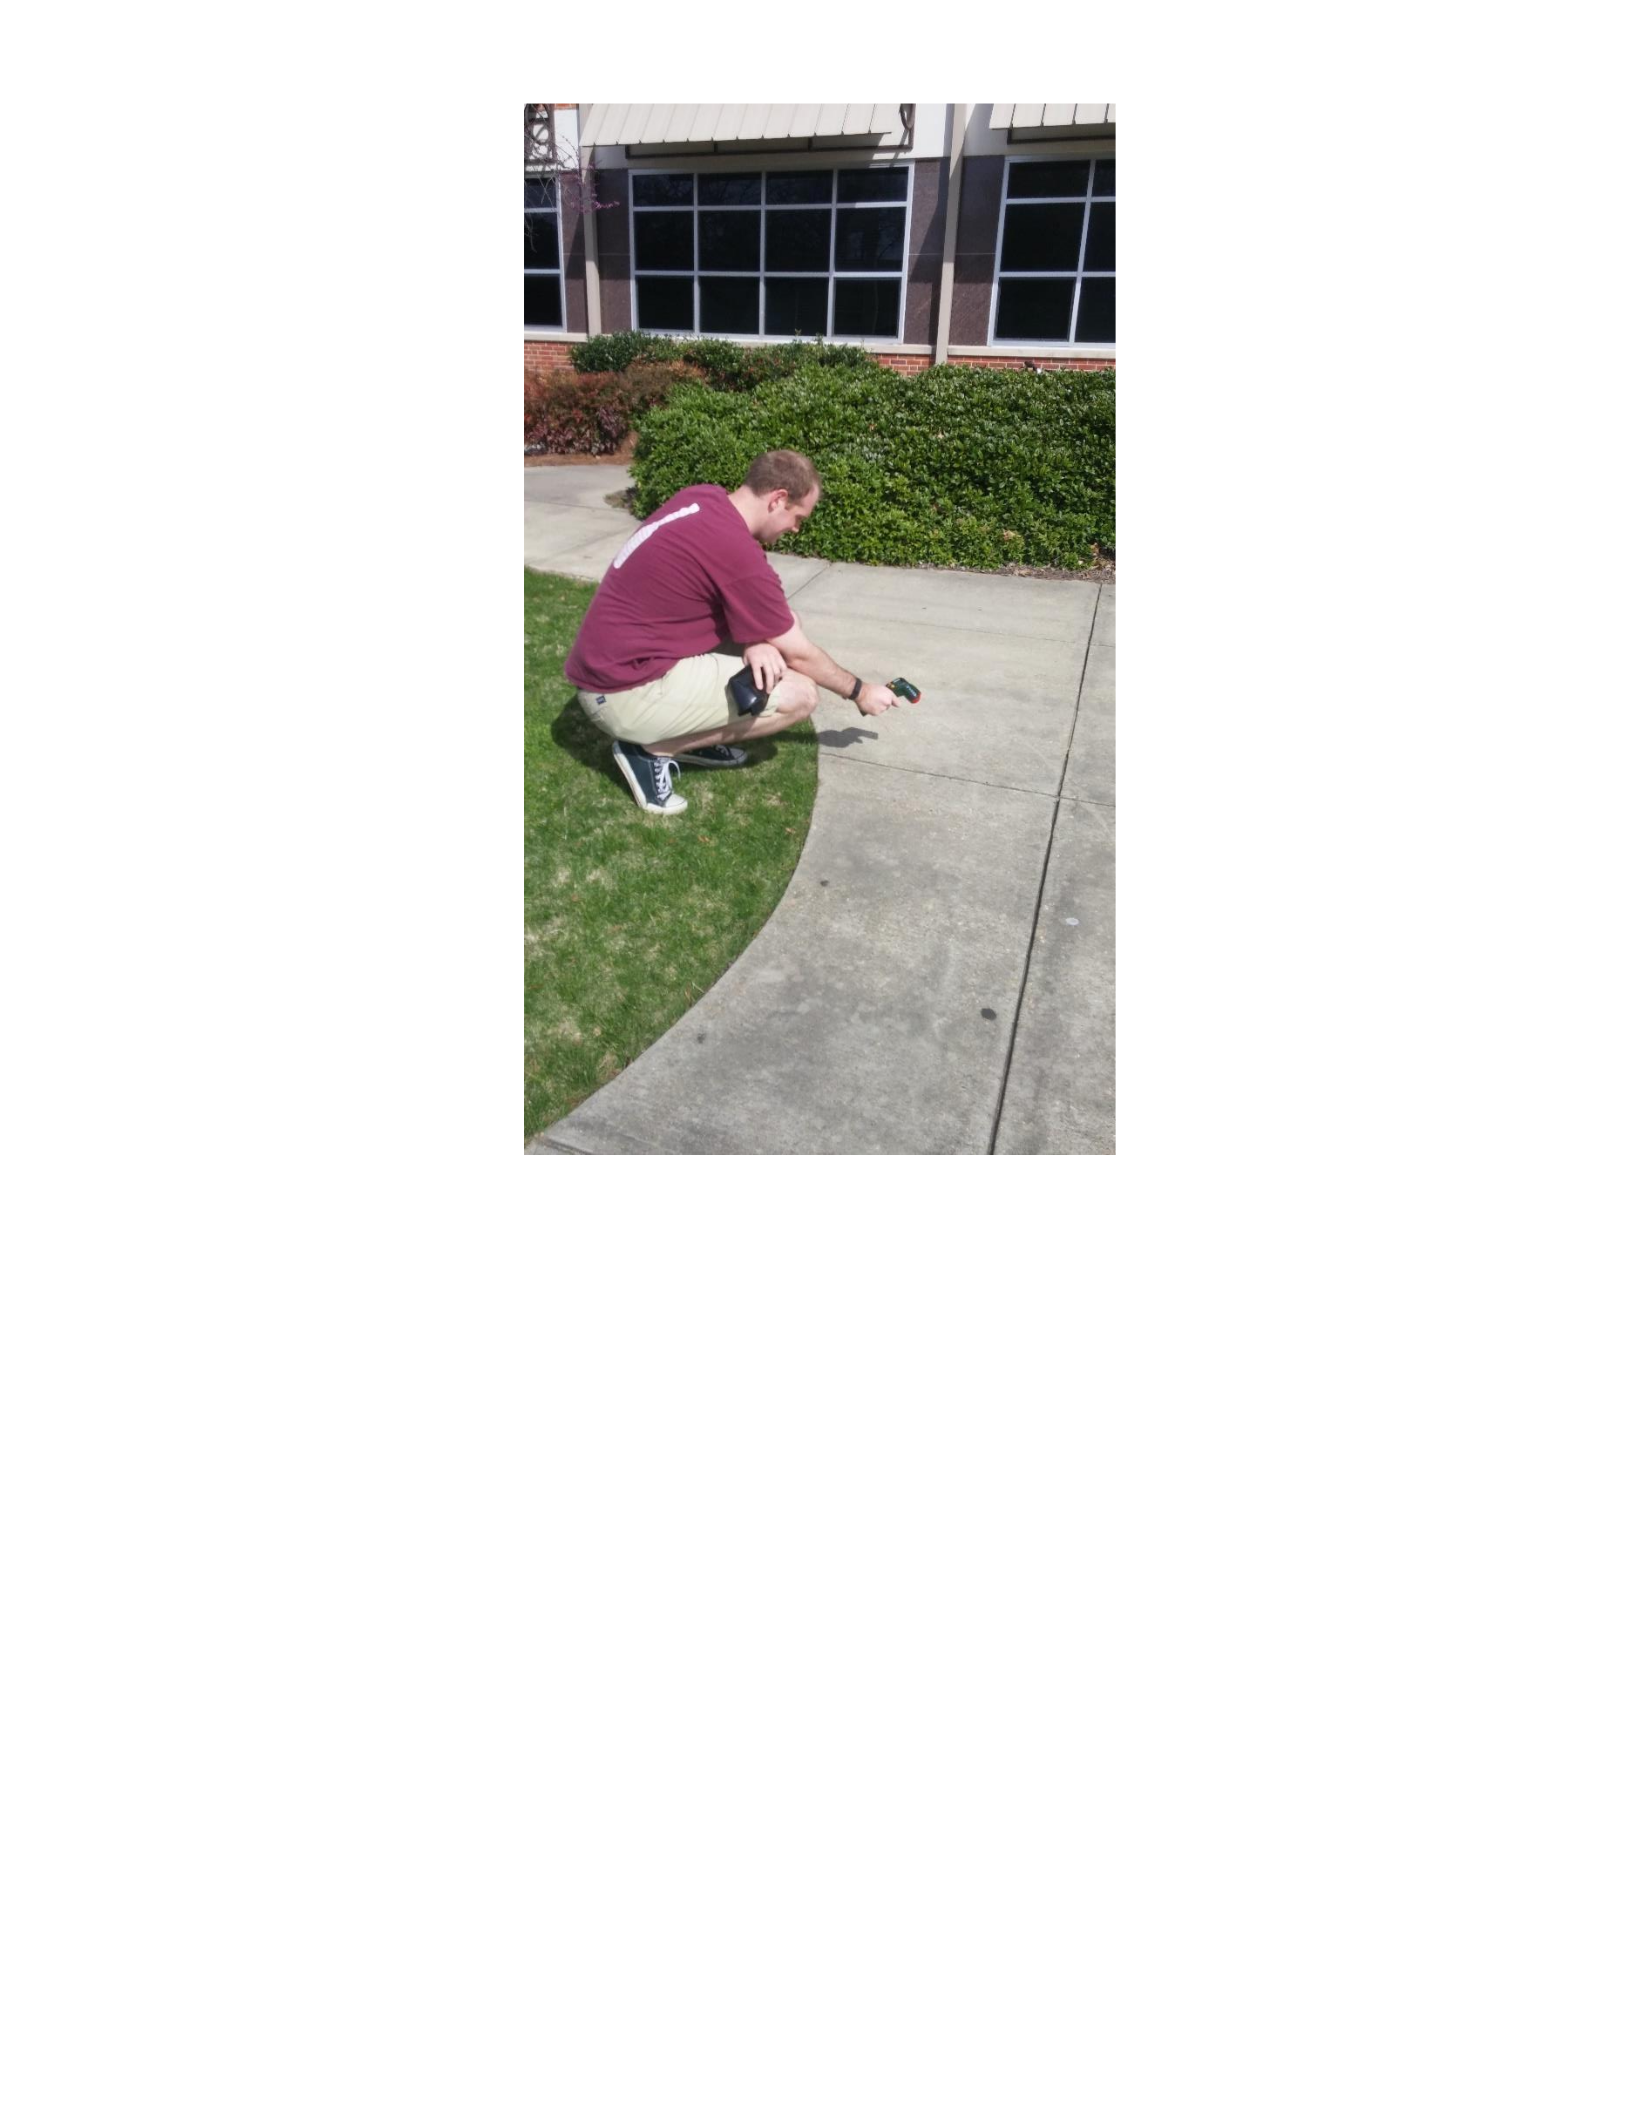
Figure B.21 Infrared Thermometer
Photo of the Infrared Thermometer instrument in use. Photo shows appropriate technique
when using the instrument. Photo credit: Katie Martin (March 8, 2016).
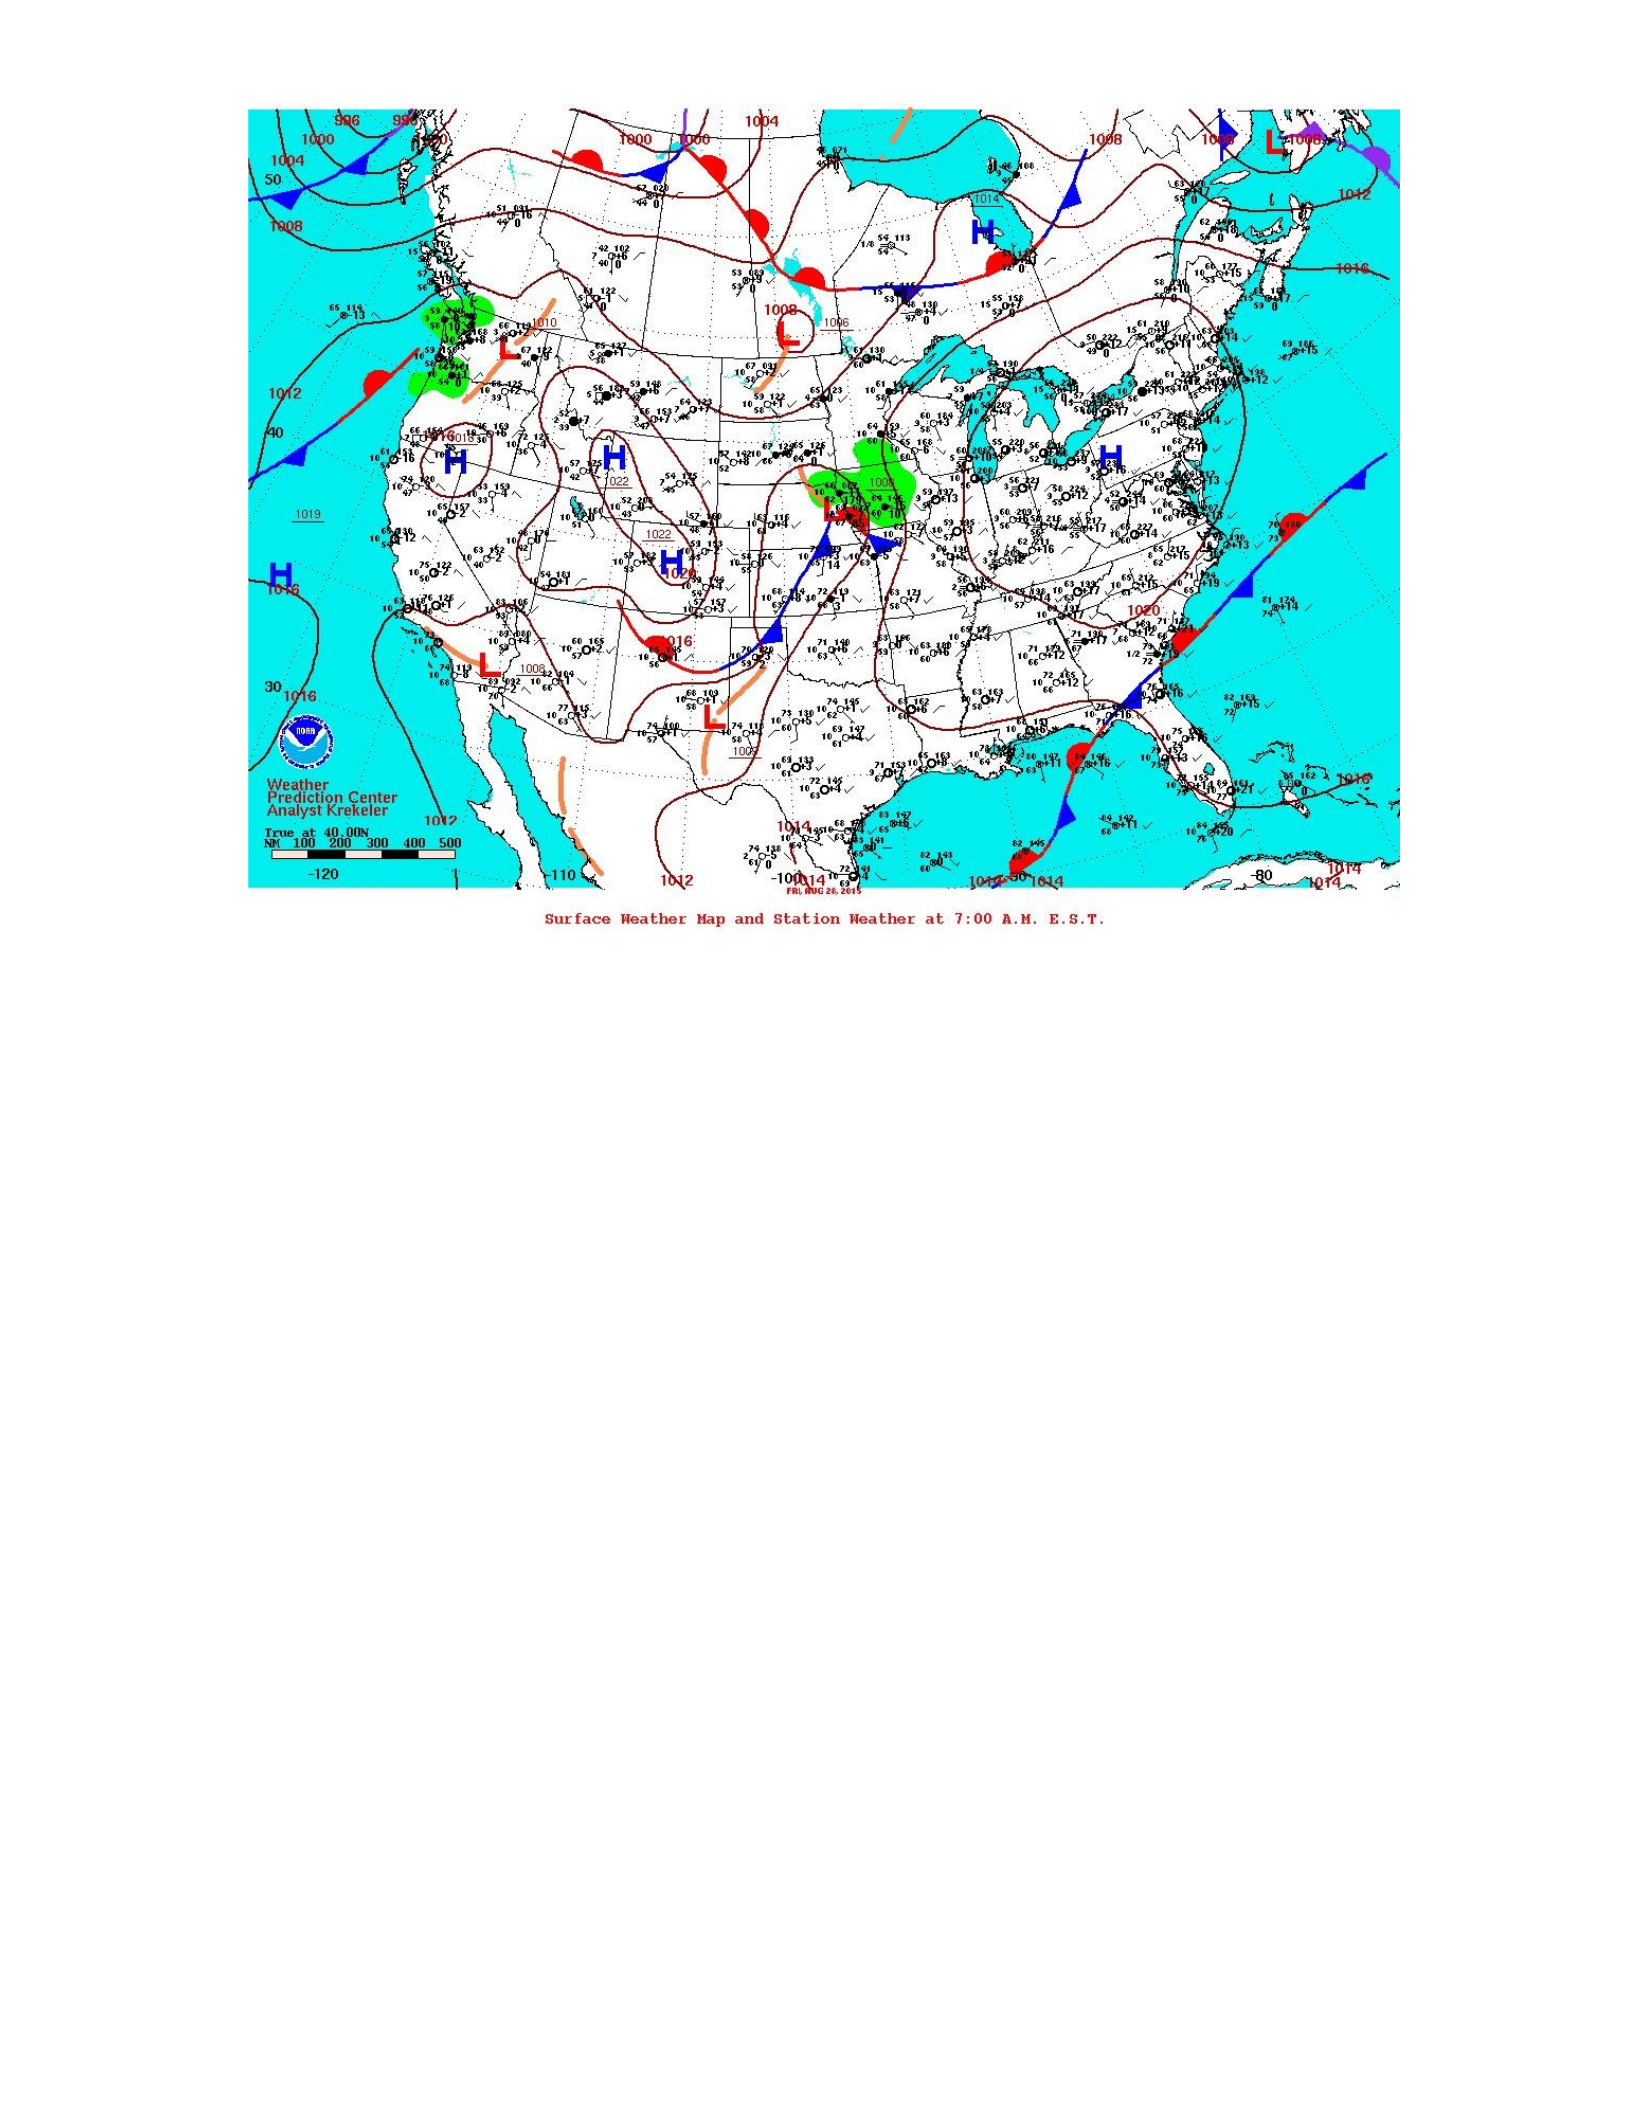
Figure B.22 August surface weather map
August 28, 2015 surface map from the Weather Prediction Center. The surface map shows
surface weather features across the Continental U.S. This surface map shows the weak
synoptic flow needed for a synoptically benign day over Jackson, MS as defined by
Dixon and Mote (2003).
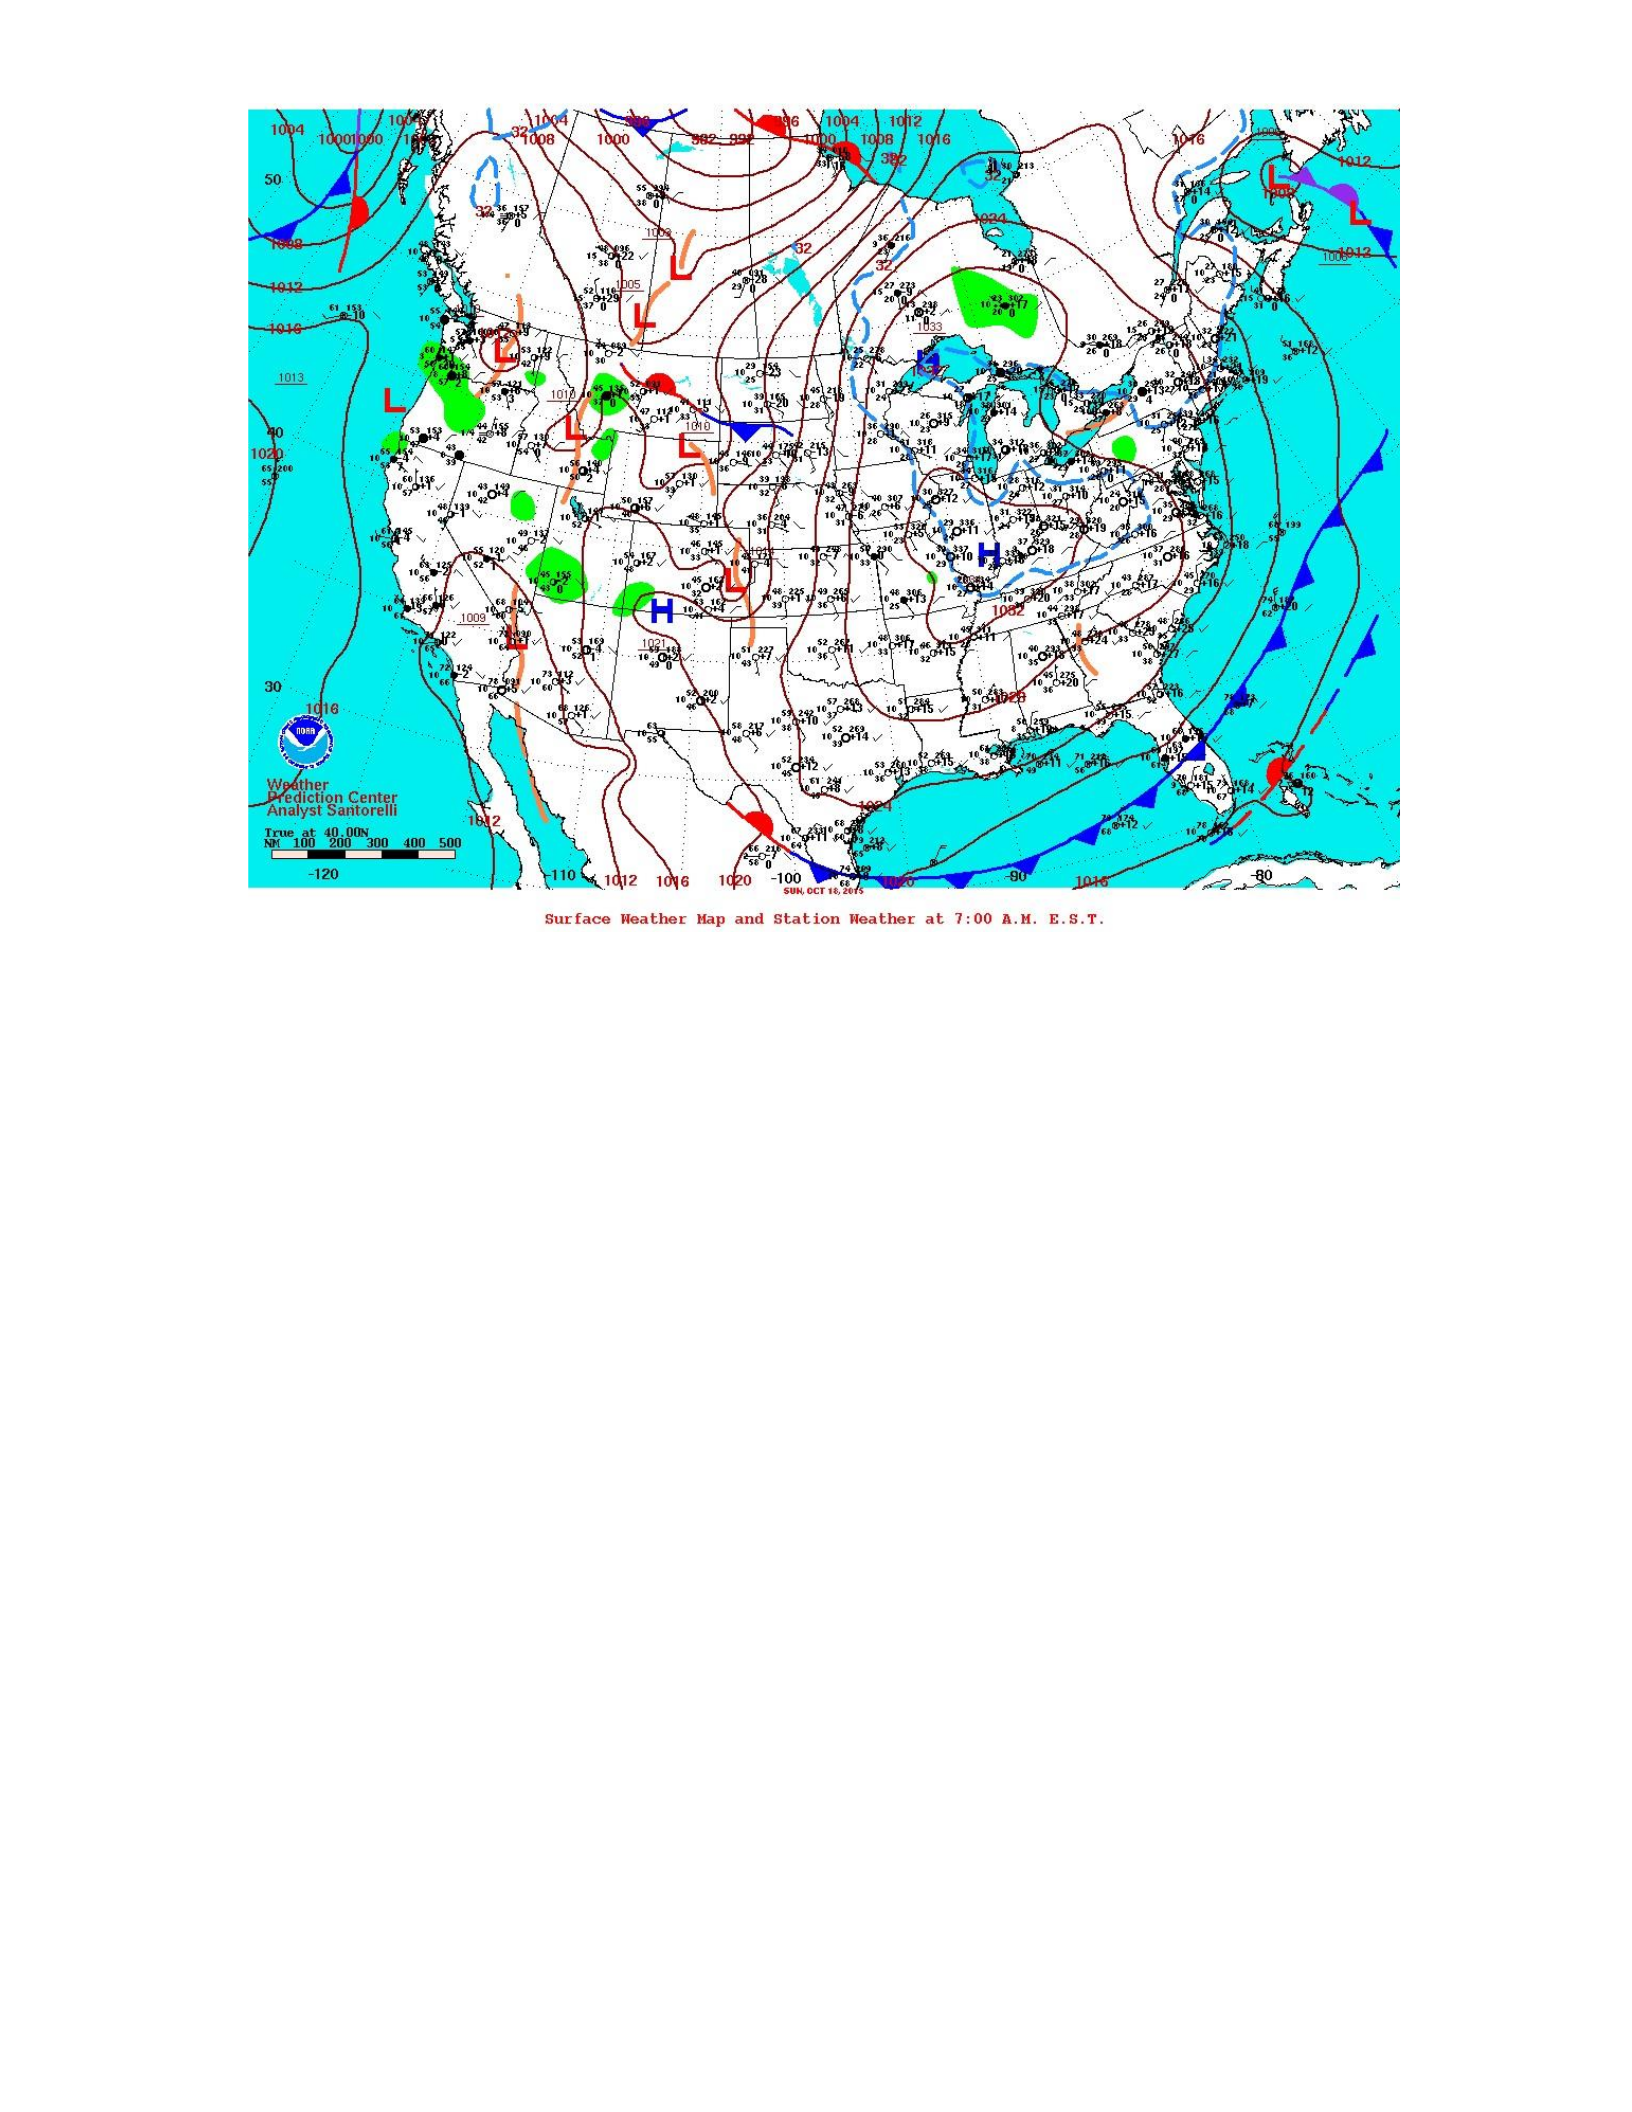
Figure B.23 October surface weather map
October 18, 2015 surface map from the Weather Prediction Center. The surface map
shows surface weather features across the Continental U.S. This surface map shows
generally weak synoptic flow, which is needed for a synoptically benign day over
Jackson, MS as defined by Dixon and Mote (2003).
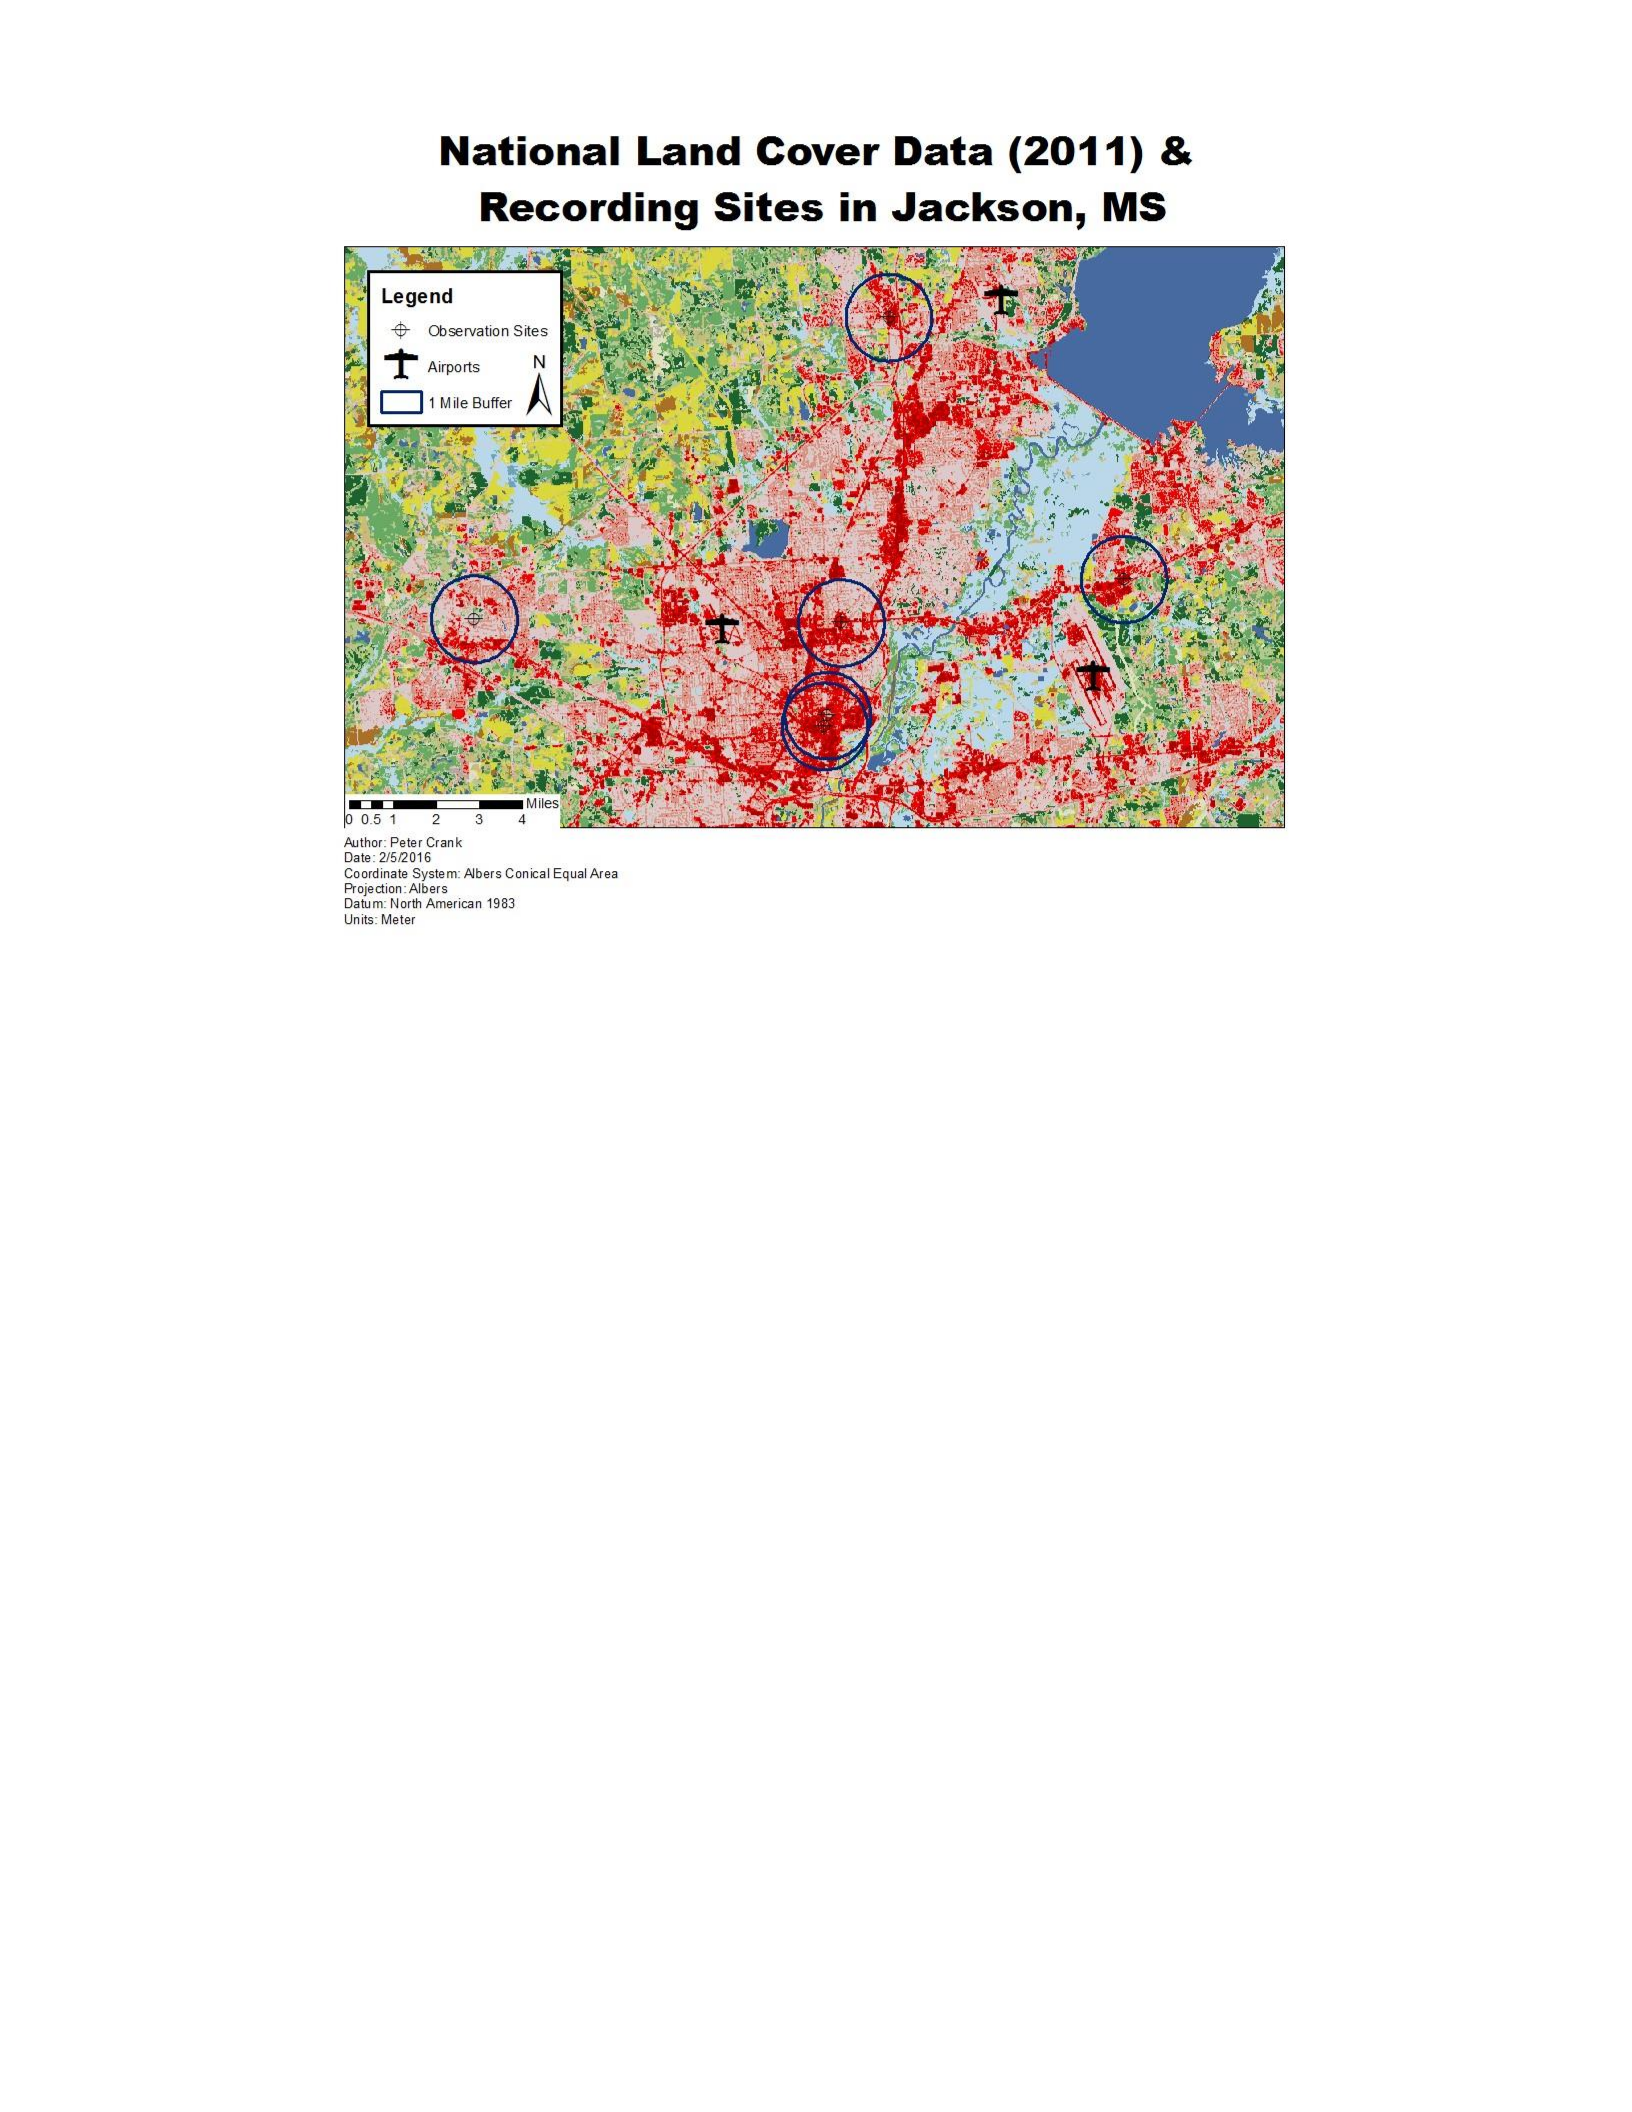
Figure B.24 NLCD Map
A 2011 National Land Cover Database map of Jackson. The various shading of the map is
determined by land use type defined by the 2011 NLCD by the USGS. The legend in map
defines which icons are used. Each of the airports as well as the observation sites and
their associated one mile radii are labeled. Created: February 5, 2016.

APPENDIX
C
RESULTS TABLES AND FIGURES