


1
Chapter 1 Introduction
"When we try to pick out anything by itself, we find it hitched to everything else
in the Universe" (Muir 1911, p.110).
Policy is inherently spatial. Policy is the product of a political world and is typically defined and
implemented within specifically bounded areas. The linkages between policy and space are
central to understanding contemporary government and society, yet the interrelationships
between policy and its spatial extent are fraught with complexity.
Public policy would logically occur in a space that can be precisely defined. However, it is more
often the case that policy space is ambiguous, fuzzy, uncertain, imprecise, and subject to other
superimposed and intersecting spatial extents that are essentially multiscalar in nature.
Historically, the most frequent coping mechanisms employed to address the spatial expression of
public policy has been to use legacy boundaries that often correspond to governmental units such
as counties or states, or to create new boundaries such as watersheds or regional entities such as
the Appalachian Regional Commission (ARC). Alternately, many policies are simply treated as
being ‘aspatial’ and applicable to everywhere, usually within the nation state, if not beyond.
There is good reason to believe that these spatial coping mechanisms based on historical
boundaries or precedence are problematic because of the resulting imprecise spatial context of
public policy; the growing magnitude and extent of policy statutes and regulations; and the
apparent overlap of multiple policies across space (Carlisle et al, 2019; Cash et al., 2006; Cundell
and Fabricius, 2009; Gibson et al., 2000; Mitchell, 2003; Thrift, 2010).
The advent of precise mapping software such as GIS has brought the spatial manifestation of
public policy to the foreground. As the case study of solid waste disposal in this dissertation will
emphasize, public policy is awash with numerous spatial extents that overlap, conflict, or which
are imprecise, undocumented, or unmapped. Such fuzziness can lead to public confusion,
jurisdictional tensions, and ultimately inefficiencies in policy enactment, implementation, and
evaluation.
The goal of this dissertation is to examine the spatial nature of public policy and to explore ways
in which the often-complex spatial manifestations surrounding public policy implementation and
evaluation can be identified and understood. The study develops policysheds based on the

2
spatial concepts and methodological applications embedded within GIS and Application
Programming Interfaces (AAPIs).
Public Policy and the Spatial Dimension
Public policy impinges on many disciplines, stages of a policy life cycle system, and policy
outcomes. Because of the complexity of public policy these stages of policy development and
implementation are often viewed as opaque, enigmatic, and floating in the conceptual policy
‘black box’ that seems to continually stand on the verge of becoming unknowable. Arguably, all
public policy must be spatially grounded in that it applies to some specific area such as a tract,
region, or nation. In practice, however, there seems to be a disconnect between policy stages and
spatial designation because policy, as it is enacted, is often spatially imprecise, misunderstood by
stakeholders, or is held, stored, or perceived differently by varying groups and at different levels
of the policy system.
Public policy impinges on many disciplines, stages of a policy life cycle system, and policy
outcomes. Because of the complexity of public policy these stages of policy development and
implementation are often viewed as opaque, enigmatic, and floating in the conceptual policy
‘black box’ that seems to continually stand on the verge of becoming unknowable. Arguably, all
public policy must be spatially grounded in that it applies to some specific area such as a tract,
region, or nation. In practice, however, there seems to be a disconnect between policy stages and
spatial designation because policy, as it is enacted, is often spatially imprecise, misunderstood by
stakeholders, or is held, stored, or perceived differently by varying groups and at different levels
of the policy system.
The Punctuated Equilibrium Theory (PET) in public policy, influenced as it is by biological
theory, comes close to capturing this dichotomy whereby ad hoc policy sub-groups address
specific parts of a policy area but fail to comprehend the overall holistic extent of the spatial,
temporal, or the content of the entire policy enactment (Brummel et al., 2012; deLeon and Varda,
2009; Hall et al., 2004; True et al., 2019). Concepts of emergent scale in geography suggest that
issues of scale could be a direct contributor to punctuated forms in that groups or agencies
emerge with new powers and agency at differing levels and scales of the policy process to impact
parts of that policy trajectory (Harris and Ferber, 2013). It is here that the praxis of policy

3
enactment, implementation, and evaluation plays a significant role in the varied understanding
and spatialization of public policy.
Any discussion of how public policy issues are spatially delineated, in theory or in practice, must
of course begin with some firm understanding of policy itself, not least because public policy is
multifaceted and made up of administrative, legislative, judicial, and evaluative components.
Furthermore, policy is also language, symbolism, intention, history, decisions and even non-
decisions, or a combination thereof. These elements of policy can be offset or can run concurrent
to each other and to other policies or policy arenas, often at varying spatial extents and scales.
Although the interdisciplinary nature of policy means there is no overarching definition of the
term policy, it is generally accepted that public policy is governance for the public good and is
comprised of what is termed ‘Big P’ policy and ‘small p’ policy. For clarity hereafter, the term
public policy is used to encompass all public policy combined unless otherwise indicated
specifically as ‘Big P’ or ‘small p’ public policy. ‘Big P’ public policy occurs at the
international, nation-state, and local-level and is typically enacted by formal laws, rules, or
regulations that assume an implementation process that is fixed or embedded within a nested,
aggregated, hierarchical or chronologically ordered scalar format with fixed spatial extents
(Piettoni, 2009). In contrast ‘small p’ public policy is the articulation of standards of practice
that are typically unregulated such as social norms, internal decisions, or best practices that are
often held as part of personal, group, or institutional knowledge. The latter embodied knowledge
can account for new experiences faster than traditional policy but is more easily lost because it is
difficult to capture experiences or best practices due to their informal and often tacit nature,
immersed as they are in shared history and experiences (Brownson et al., 2009; Cundell and
Fabricrium, 2009; Raymond et al., 2010). As Freeman and Sturdy (2014, p.51) suggest, “We
note that knowledge is a local phenomenon, structured within a specific context and holding
significance for social actors based on their purposes and objectives in that context.” Because of
the differences between ‘Big P’ and ‘small p’ policy, the spatial delineation of ‘Big P’ public
policy, such as policy regulation and evaluation, tends to have more rigidly defined spatial
extents, while ‘small p’ public policy, such as policy implementation and development, tends to
be more fluid or vaguely defined in their spatial extents and as a result are often open to
interpretation.

4
The lack of integration between policy development, implementation, evaluation, and analysis is
a major challenge to the policy environment and policy must be approached as an overarching
process because a global view of policy can become meaningless due to overgeneralization
(Castellani et al., 2015; Fischer, 1998; Grindle and Thomas, 1989). Overgeneralization is more
likely to occur when the target audience for policy researchers are politicians or agencies because
they tend to prefer quantitative methods that provide a standardized and universal view of policy.
Ironically, focusing on situations or countries through case studies can equally overemphasize
the idiosyncratic. The complexity and multiscalar nature of politics is often seen in legal actions,
media accounts, and case studies, which is why when the target audience for policy researchers
is their peers, they tend to use narrative case studies or qualitative methods to capture the
surprisingly imprecise nature of public policy (Abel et al., 2006; Cumming, and Redman, 2006;
Kok and Veldkamp, 2011; Pede, 2019).
The ‘Big P’/’small p’ quandary suggests that public policy must be studied within context and
with due recognition of its dynamic nature, history, social and political culture, and location. Yet
public policy itself strives to be parsimonious because of the mental constraints of processing a
host of complex information involved in decision-making (Walt, 1994; Jones, 2001; Pollit,
2008). One of the more effective ways to link multiple policy areas and their spatial expression
may be through mapping and geovisualization, which provides the ability to capture the spatial
complexity of policy implementation and evaluation in the context of multiple policy arenas.
However, this is no easy task. For example, the Canadian government took decades to determine
who had the rights to manage or control its country’s ocean spaces and marine resources and this
was largely because of the difficulty in defining what constituted ice, land, and water (Nichols
and Monahan, 1999). Such spatial and semantic complexity created legal ramifications
involving the mapping of the coastal region amid conflicting public and private rights, and
jurisdictional uncertainty arising from decisions made by the Atlantic Provinces before the
creation of Canada in 1867. The need for a spatio-political framework becomes apparent when
policy is required to be specified in some geographical space with precise boundaries. Borders,
therefore, are central to policy and policy mapping endeavors (Agnew, 2012; Cash et al., 2006;
Castellani et al., 2015; Harris, 2006; Nichols and Monahan, 1999; Staeheli, 2010; True et al.,
2006).

5
Boundaries, Space, and Scale
A border is often, but not always, considered to be the crisp meeting of two or more areal
boundaries. A boundary can be based on physical features, such as an island, mountain range,
river, ravine, ocean, or a cultural boundary. A political boundary can be a physical structure,
such as Hadrian’s Wall or the Great Wall of China, or politically or culturally defined such as for
nation-states and their subregions. A border can be defined by the once seemingly unalterable
borders of temporal zones or be socially constructed such as in the case of community
neighborhoods. The classic boundary study question, “Where is my border? Draw me a line” is
still vitally important in today’s world because there are few simple lines of demarcation, and yet
most policy decisions require some defined spatial unit.
Politics invariably demands hard boundaries. Yet, boundary concepts themselves have always
been imbued with intertwined meaning and are complicated by a sense of place. As Rankin and
Sofield (2004, p.3) suggest, boundary concepts are more than just the technicalities of boundary
specification: “border, frontier, line, border line, bounds, front line, edge, limit, margin,
periphery, rim, frame perimeter, circumference, fringe, lip, brim, enclosure, outskirt, belt…”
imbue a multitude of cultural, economic, social, and political perspectives on border issues.
Notions of space may also evoke more than the specification of a boundary and may include
feelings and emotions about place rather than space. Addressing spatiality in political policy is
among one of the most significant challenges facing the study of policy. Ignoring the challenges
of spatiality potentially contributes to erroneous conclusions with significant real-world
implications (Agnew, 1994; Fotheringham et al., 2003; Fotheringham et al., 2021; Elden, 2011).
The spatial nature of policy is thus complicated. Agnew (1996, 2014), Johnston et al. (2004) and
other political geographers have argued that politics are context-based and that recognizing the
complexity of mapping space and place is one of the first steps in addressing the spatiality of
policy. One clear issue concerning the spatio-political in practice is that of the modifiable areal
unit problem (MAUP), an axiom expounded by Openshaw (1984). The MAUP in the context of
policy mapping is inevitable. Openshaw (1996) proposed zonal systems to make the MAUP as
neutral as possible. However, in the case of spatio-political boundaries, the MAUP is often used
to describe the arbitrary, deliberate, or unintended ways in which political parties and institutions
use geography to determine electoral voting districts, shape messaging, and mobilize their base.
To political geographers, gerrymandering is clearly not a neutral process but the overt

6
manipulation of electoral constituency boundaries to favor one party or class over another and
with the clear intent to influence electoral outcomes. The impact of the spatial manipulation of
electoral boundaries is highlighted by the increased involvement of the U.S. federal court
decisions concerning congressional election districts and gerrymandering (Forest, 2001).
Agnew (1987) stresses the importance of place in the creation of personal political identities in
that the same person or group can operate or have relations that overlap, even at multiple scales,
and that has implications for spatio-political boundaries. The significance of boundary studies
across disciplines has led to the growing call for the interdisciplinary conceptualization of
boundaries and reflects the fuzzy, overlapping, porous, fluid, and ‘soft’ nature of boundaries
arising from a multitude of causes, including transboundary regions and differing cultural
perceptions of political borders (Agnew, 2012; Allmendinger and Haughton, 2009; Castellani et
al., 2015; Elden, 2006; Harrison, 2006; Hess, 2004; Klitzner, 2002; Newman and Sheba, 2006).
The nature of this fuzziness can be found in the classic boundary issue of a river, which is often
used as a ‘hard’ political boundary because, by its physical nature, it can usually be found drawn
as a line on a map. And yet a river is a place of water movement and changing water courses, and
despite being politically or physically bounded, it represents the incorporation of history, events,
relationships and personal boundaries specific to many groups that created the extent(s) of a
river’s placial geography and because rivers are themselves scaled boundaries (Allmendinger
and Haughton 2009; McKinney and Johnson 2009; Warner et al., 2014). Arrhenius (2015)
encapsulates the very real problems involved in the conjoining of public policy and geography in
the example of Northern Ireland:
The boundary problem is not only a conundrum of philosophical interest but also a
pressing practical political problem. For example, what is the relevant constituency for a
democratic solution to the conflict in Northern Ireland? Should a treaty be approved by
the citizens (or their representatives) of Northern Ireland alone or should it also involve
those of the United Kingdom and the Irish Republic as well?
The recent debacle of the United Kingdom’s exit from the European Community (EU) and the
resulting need to enforce some form of trade boundary in the Irish Sea to separate the non-EU
member Northern Ireland from a contiguous EU member, the Republic of Ireland, without
reinstating a hard border and reigniting the ‘Troubles’ but as a result creating an internal UK

7
trade border demonstrates the complexities that creating borders entails. Many other examples
exist as in the Middle East and northeast Africa.
Boundary scholarship is evolving such that ‘the boundary problem’ is now well recognized and
not least because of the tensions that exist between areas defined by space and those defined by
palatial associations. As Castellani et al. (2015) identified in Place and Health as Complex
Systems a Case Study and Empirical Test, there is a need for a framework that uses theory and
application to capture the complexity of place (COP) because despite the technological
advances in social network analysis, agent-based modeling, topographical neural nets, and even
initial forays into geospatial modeling, there is no rigorously-defined theory of place that can
capture the multiscalar nature of typical problems. “In short, places need to be treated as
complex systems” (Castellani et al. 2015, p.2; Cox, 2008; Hudson, 2012; Penrose, 2002; Reid-
Henry, 2010).
It is perhaps the very nature of boundaries that causes policy studies to lack precision and
consistency. Problems arise when varying definitions, understandings, terminology, scale, and
spatial aggregation lead to mismatches and gaps in the delineation and recognition of boundaries,
which in turn leads to multiple interpretations of policies and their spatial extents. While multi-
disciplinary ambiguity is a serious challenge to boundary studies, it is not a problem that can be
easily fixed or ignored. However, the political and public policy process does not become less
valid because boundaries are imprecise or are being challenged. Instead, a new understanding of
the spatial nature of public policy is required that encourages research toward a more effective
framework that captures the spatiality of policy.
Research Goal and Objectives
Addressing these spatio-political issues is challenging. One possible way forward is to develop a
framework, such as that of policy-sheds as proposed here, that can organize and represent
complex public policy spatial manifestations of space and place, while retaining some practical
sense of bounded rationality.
Nowhere are the issues of policy and space more evident than in the field of solid waste,
traditionally paired with water and roads as one of the purest examples of a public good and

8
shared resource that predate the United States as a country (Anderies and Janssen, 2013;
Bickford, 2013; Harden, 1968; Ostrom, 1990; World Bank, 2006).
Given the concern and issues raised about public policy and its spatial manifestation the
objective of this research is to examine the spatial components integral to policy formation,
implementation, and evaluation, and to use solid waste as a case study to explore a multiscalar
GIS policy-shed framework.
To this end, the goal of this dissertation is to examine the spatial nature of public policy and to
explore the complex spaces surrounding public policy implementation and evaluation. These
spaces are identified and understood using spatial concepts and multiscalar methodological
applications embedded within GIS and geovisualization representations.
To achieve this objective, the research is structured according to six objectives and related sub-
questions:
1. Review how public policy is spatially delineated, in theory, and practice.
2. Evaluate the spatial tensions in public policy.
3. Explore the spatio-political complexities of solid waste policy.
4. Conceptualize a multiscalar spatial framework for policy based on ‘policy-sheds’.
5. Develop a policy-shed framework for solid waste with a focus on Monongalia County,
West Virginia
6. Examine, evaluate, and assess the design, implementation, and effectiveness of a
multiscalar, policy-shed framework for specifying the spatiality of public policy.
The first two objectives are to review how public policy is spatially delineated and to then
evaluate the resulting spatial tensions that arise in public policy. The third objective is to use this
information to explore the spatio-political complexities of solid waste policy. The fourth and
fifth objectives are to conceptualize a multiscalar framework for public policy based on a
proposed concept of policy-sheds and to then develop a policy-shed framework for solid waste.
The final objective will be to evaluate and assess the multiscalar, policy-shed framework and to
summarize the results and make recommendations for future research.

9
A Brief Methodological Overview
This dissertation uses an integrated GIS approach to obtain an understanding of the spatial extent
of solid waste policies by extracting and digitizing the spatial units embedded in the written
regulations, laws, rules, and code, and to then codify these regulations and assign them to the
applicable areal units to create a dynamic, interactive system that allows users to interrogate and
operationalize solid waste policy. This methodological approach uses GIS, geovisualization, and
geoprocessing to create a policy-shed framework that conjoins policy, space, and place based on
a feature attribute table using a modified Tremper, Thomas and Wagenaar (2009) policy law
template. The resulting policy-sheds are then used to display the spatial nature of waste policy
and to identify instances of omission, commission, and spatial tensions and conflict associated
with the cross-cutting policies related to solid waste disposal in Monongalia County, WV.

10
Chapter 2 The Geography of Public Policy
Public Policy and Spatial Tensions
Placing the spatial into public policy necessitates understanding why no agreed upon standard
exists for what constitutes public policy other than the oft-repeated statement that public policy is
governance for the public good. A review of public policy literature suggests that definitions of
public policy are, seemingly, purposely subjective (Hill and Hupe, 2009). Commonly used
characterizations of public policy are Lasswell’s perspective: Politics: Who Gets What, When,
How (Lasswell, 1936). Wildavsky (1979) describes public policy as simultaneously a process of
decision-making and a product of the decision-making process while Dye (1992) describes
public policy as the real-world action or inaction of government and the intentions behind those
actions. Cumulatively, public policy can be regarded as the intersection of a series of inter-
related sets of decisions that are continuously changing and are made by multiple people or
organizations over time to achieve goals intended for the public good. This chapter undertakes an
extensive review of public policy, the study of public policy, and the models, frameworks and
concepts that underpin its study. As will be seen, applying a spatial perspective to public policy
in later chapters is wrought with many challenges not least because of the inherent nature of
public policy itself. Modern public policy has its roots in the U.S. Progressive Era (1890 –
1920s) when policy reformers believed that a more transparent and accountable government
would improve U.S. society. To further that end, President Woodrow Wilson promoted the
separation of politics and administration whereby legislative statesmen would make laws and
regulations, but public law would be implemented by public administration personnel. According
to Wilson (1887; p.201) “Where government once might follow the whims of a court, it must
now follow the views of a nation. And those views are steadily widening to new conceptions of
state duty; so that, at the same time that the functions of government are every day becoming
more complex and difficult, they are also vastly multiplying in number.” The complexities
Wilson alluded to include the impact of telegraph and railway networks, utilities, corporate
businesses, as well as town, city, country, state, and federal government. Areas recognized by
geographers today as scalar and spatial.

11
Public administration personnel used thematic mapping as a powerful tool to examine and
explain societal change during the Progressive Era. These maps often originated from public
policy sub-disciplines such as sociology with projects such as those of pioneer investigative
journalist William T. Stead, who incorporated maps into his articles and most notably his If
Christ Came to Chicago that exposed inequalities in Chicago in 1893 (Figure 2.1). Florence
Kelley and Agnes Sinclair Holbrook and Hull House used maps in humanitarian efforts to
persuade politicians and the public to improve the health and welfare of Chicago immigrants and
became the groundwork for social work in the United States. The Hull House maps (Figure 2.2),
collected by the U.S Bureau of Labor as part of a study into the slums of Baltimore, Chicago,
New York and Philadelphia, were commissioned by the United States Congress in 1892. Today,
these studies, along with Bois’s work in The Philadelphia Negro, are recognized as early efforts
in community-based participatory research and public policy (Schastock, 2016; Stuart, 2018).
The Chicago School of Sociology used maps in their sociological studies of urban patterns and in
developing a sociological concept of space and home space. (Bulmer, 2019; Rezeanu, 2018). In
other social reforms, maps were used to further the suffrage movement (Dando, 2010).

12
Figure 1: William T Stead's map from If Christ Came to Chicago (1895) Source: Boston Rare Maps and
Prints website https://bostonraremaps.com/inventory/if-christ-came-to-chicago-1894/
Figure 2.2: Hull House Nationality Map. Source: The Hull House Maps and Papers Northwestern
https://florencekelley.northwestern.edu/historical/hullhouse/

13
Other developments in public policy arising from the Progressive Era included the creation of
new public agencies which were tasked with collecting, analyzing, and mapping data and
included the U.S. Department of Labor’s slums project (United States. Bureau of Labor, 1895),
the National Conference on City Planning which focused on strengthening municipal
administration and city planning (Fairfield, 1994; Peterson, 2009) and the Pure Food and Drug
Act which dealt with the interstate commerce of adulterated goods, and which became the
precursor to the FDA (Law and Libecap, 2007). Cartographic mapping then played a small part
in the politics and laws of the Progressive Era as evidenced by the Ratification of the 16th
Amendment or Income Tax Law (1913) that required property mapping (Schenk, 2012), and the
Treaty of Versailles (1919) which created new territorial boundaries (Herb, 2017). However,
government and public confidence in administrative expertise waned after the U.S. New Deal
Era (Cocks et al., 2009; Frederickson et al., 2015; Robertson et al., 2015; Whittington et al.,
2013)
Public policy failed to gain prominence again until the major political changes of the 1960s and
the era of modern governance of the New Administrative Era (1960s – 1980s). During the New
Administrative Era, the purpose of most policy was for prescriptive solution finding. Maps and
statistical data were increasingly used to support public policy and especially so as computer
technology became more efficient and cost-effective. Computing reinvigorating the former
Progressive Era’s shift towards data collection and analysis for policy decision-making.
Lasswell (Farr et al. 2006) is credited with creating the discipline of policy science in the late
1950s to train policy experts drawn from economics, law, political science, anthropology,
psychology, statistics, mathematics, and physical and natural sciences. Notably the discipline of
geography was not included in this multi-disciplinary group though mapping was intertwined as
a visual aid across different levels of government and academic disciplines (Farr et al. 2006;
Lasswell, 1951; Lasswell, 1970; Turnbull, 2008). According to Friendly and Denis (2001), “In as
much as their histories [probability, statistics, astronomy, cartography] are intertwined, so should
be any telling of the development of data visualization. Another reason for interweaving these
accounts is that practitioners in these fields today tend to be highly specialized and unaware of
related developments in areas outside their domain, much less their history.” Lasswell and
policy scientists believed policy leaders could mediate between academia, government, and

14
citizenry to collectively solve society’s problems. A major stage in the development of public
policy science was President Johnson’s War on Poverty (Bailey et al., 2014; Roucek, 1966) in
which statistical models and demographic data were used to determine poverty levels and
mathematical models used for the allocation and distribution of resources (Burkhauser et al.
2020; Haveman et al., 2015). Johnson believed in the ability of public policy to overcome
societal problems and build a Great Society and eradicate poverty in the United States (DeLeon,
1988; Hill and Varone, 2014; Flusberg et al., 2018; Friendly and Denis, 2001; Rodriguez and
Weingast, 2015).
However, both Wilson’s and Lasswell’s visions of using regulatory public policy to solve
societal problems were difficult to achieve due to the subjective nature and complexity of public
policy itself. Even the term poverty had no clear or agreed upon definition leading to the
tendency for policy scientists to favor parsimonious, normative approaches to policy problem
solving. According to Waldo (1968, p. 2), “….to argue that coherence can be found by stating
that the problems, objectives, boundaries, and so on, all concern public administration is hardly
helpful as it is unclear what public administration is”. Later, Lasswell (1972) himself referred to
public policy as being highly contextual, and increasingly complex and different from what he
first envisioned as policy science. While a hierarchical, data-driven, problem-solving approach to
policy problems was found to have questionable impact on the public good, it nonetheless
remains one of the primary methods underpinning public policy. Shulock (1999), in The Paradox
of Policy Analysis: If it is not used, why do we produce so much of it? found it paradoxical that
the U.S. invested heavily in policy analysis even though political science research and theory had
revealed that policymakers do not use policy analysis to make policy decisions. Shulock (1999)
studied quantitative data on Congressional policy analysis for the years 1985-1994 and
determined that despite its scientific origins, policy analysis may be a more effective instrument
and indicator of the democratic process than of the problem-solving process. Shulock argued
that as a problem-solving process, public policy rarely attained the desired outcomes (DeLeon,
1988; Fischer, 2003; Head and Alford, 2015; Learner and Lasswell, 1951; Jenkins, 1978;
Lasswell, 1972; McCandless and Guy, 2013; Rittel and Webber, 1973: Rutgers, 2010; Schastok,
2015; Schulten, 2012).

15
Dye (1992) suggested that as the end of the twentieth century approached public policy had
moved beyond a belief that government legislation was the only form of public policy that could
influence real-world governmental action (or inaction). Prunty (1985) believed that taken in
context, the process of pursuing public policy is used more to create an image of an ideal society
than to achieve it. Fischer (2003) has argued that public policy is associated more with Big P
policy elites, experts, and legislators, but that small p policy making was equally important.
Fischer (2003) suggests that while public policy is often considered to be a process of agreement
on a course of action or inaction that could then be evaluated, public policy was in fact a
discursive construct or analytical category with substantive content that is subjective and
interpretable. Lasswell’s (1971, p.2) 20-year study of policy science considered the World
Health Organization (WHO) work to eliminate smallpox, cholera, and other diseases to be a
major policy science milestone which he attributed to the medical community and advances in
epidemiology. In the modern era, the Obama administration focused on Open Government
initiatives and interagency data sharing that included spatial data (Fenster, 2015; Fischer, 2003;
Jaeger and Bertot, 2010; Lasswell, 1971; Leszczynski, 2015; Rutgers, 2010). However, while
spatiality is a thread that runs implicitly throughout public policy the spatial metrics have to be
interpreted or specifically sought out from the policy process.
The public good, is a term that is often invoked in public policy to justify political decision-
making and as a core part of the mission of public policy. Public good is often interpreted as
shared societal benefits obtained through governance. In the U.S., Thomas Jefferson (1776)
believed that the promotion of the public good was indeed the purpose of government, while
other early founders advocated for more individual rights, a discourse that continues in
governance today (Stiglitz, 1999). As such the definition, intent, and scope of what is a public
good within public policy varies depending upon who is defining the public good and for whom.
Democracies tend to have high public good requirements linked to the apportionment of votes,
while dictatorships tend to have low public good requirements (Deacon, 2009). According to
Rutgers (2010), the recent use of the comprehensive term, “Governance” seems to suggest a
social reality where the state-society bifurcation disappears although governance often lacks
bounded meaning found in the specificity of terms such as “state and society” or “public
administration.”

16
The scope of public policy extends beyond regulation and legislation to include interactions that
take place at multiple levels of government. Public policy is not one action or decision but the
interaction of Big P policy and small p policy. Big P policy often takes the form of formal laws
or regulations at all levels of government and takes many forms such as written legislation,
statutes, executive orders, vetoes, appointments, zoning laws, and judicial decisions. Small p
policy is characterized through the articulation of standards of practice, and these are typically
unregulated, un-codified, non-legislated actions, best practices, non-governmental partnerships,
and institutional knowledge. Small p policy includes administrative behaviors such as the
enforcement of laws, decisions about which judicial cases to hear, and precedent based on the
history of past policy decisions or actions. Small p policy can be expressed via symbology,
language, text, forms, images, and maps, but as best practice it is often recorded or manifests
only as oral narrative. Public policy is thus concurrently a political ideology; a political process;
a type of governance; the outcome of governance decisions; a field of study; a professional
discipline; and an analytic object of study. These diverse interpretations of public policy
complicate any attempt to assign spatial representations to policy implementation or the
assessment of policy outcomes.
The Study of Public Policy
Given the difficulty in defining public policy it is perhaps not surprising that a variety of
approaches exist for the study of public policy. According to Goodin et al. (2006 p.5) both the
practice of public policy making, and the study of public policy are more a form of persuasion,
“It is mood more than a science, a loosely organized body of precepts and positions rather than a
tightly integrated body of systematic knowledge, more art and craft than genuine science.”
Even the scope of the disciplines that arguably fall within the study of public policy are
contested. Rutgers (2010) critiqued Waldo’s (1968, p.1) attempt to clarify one aspect of public
policy, that of Public Administration, due to its lack of internal consistency stating, “I have used
upper case to refer to the self-conscious enterprise of study, and the like, and lower case to refer
to the practices or processes which are the object of our attention”. Fan (2013) describes public
policy, “As an interdisciplinary study, …… situated at the intersection of traditional academic
disciplines combined with the needs of policy research in the governmental sphere”. While “At
its core, the study of public policy can exist only through the intellectual constructs of other
disciplines” (Shafritz et al., 2005, p. viii), nonetheless the lack of a single pedagogical

17
framework or approach to the study of public policy has contributed to the nebulous nature of
public policy because different disciplines have used, and continue to use, their own doctrinal
windows embedded in their disciplinary roots. This contributing sub-disciplinary design was
intentionally developed by Lasswell (1956) to address public policy issues through a normative,
multidisciplinary approach but the lack of a coherent framework for the study of public policy
has been problematic. Some doctrines and disciplines can be distilled I would argue that anchor
the study of public policy. Almost all the public policy books that Fan (2013) examined, for
example, originated from political science, public administration, or economics. In many cases,
public policy sub-fields are older than the discipline of public policy itself and except for
countries such as Great Britain, the development of public policy studies has been largely an
American phenomenon that was disseminated to other countries (Fisher, 2003). Peters and
Pierre (2006) theorized that the shared physical proximity of scholars at American university
campuses in the early 20th century contributed to a shared interdisciplinary approach to the study
of public affairs and government (see also Fan, 2013; Fischer, 2003; Rutgers; 2010; Shafritz et
al., 2005).
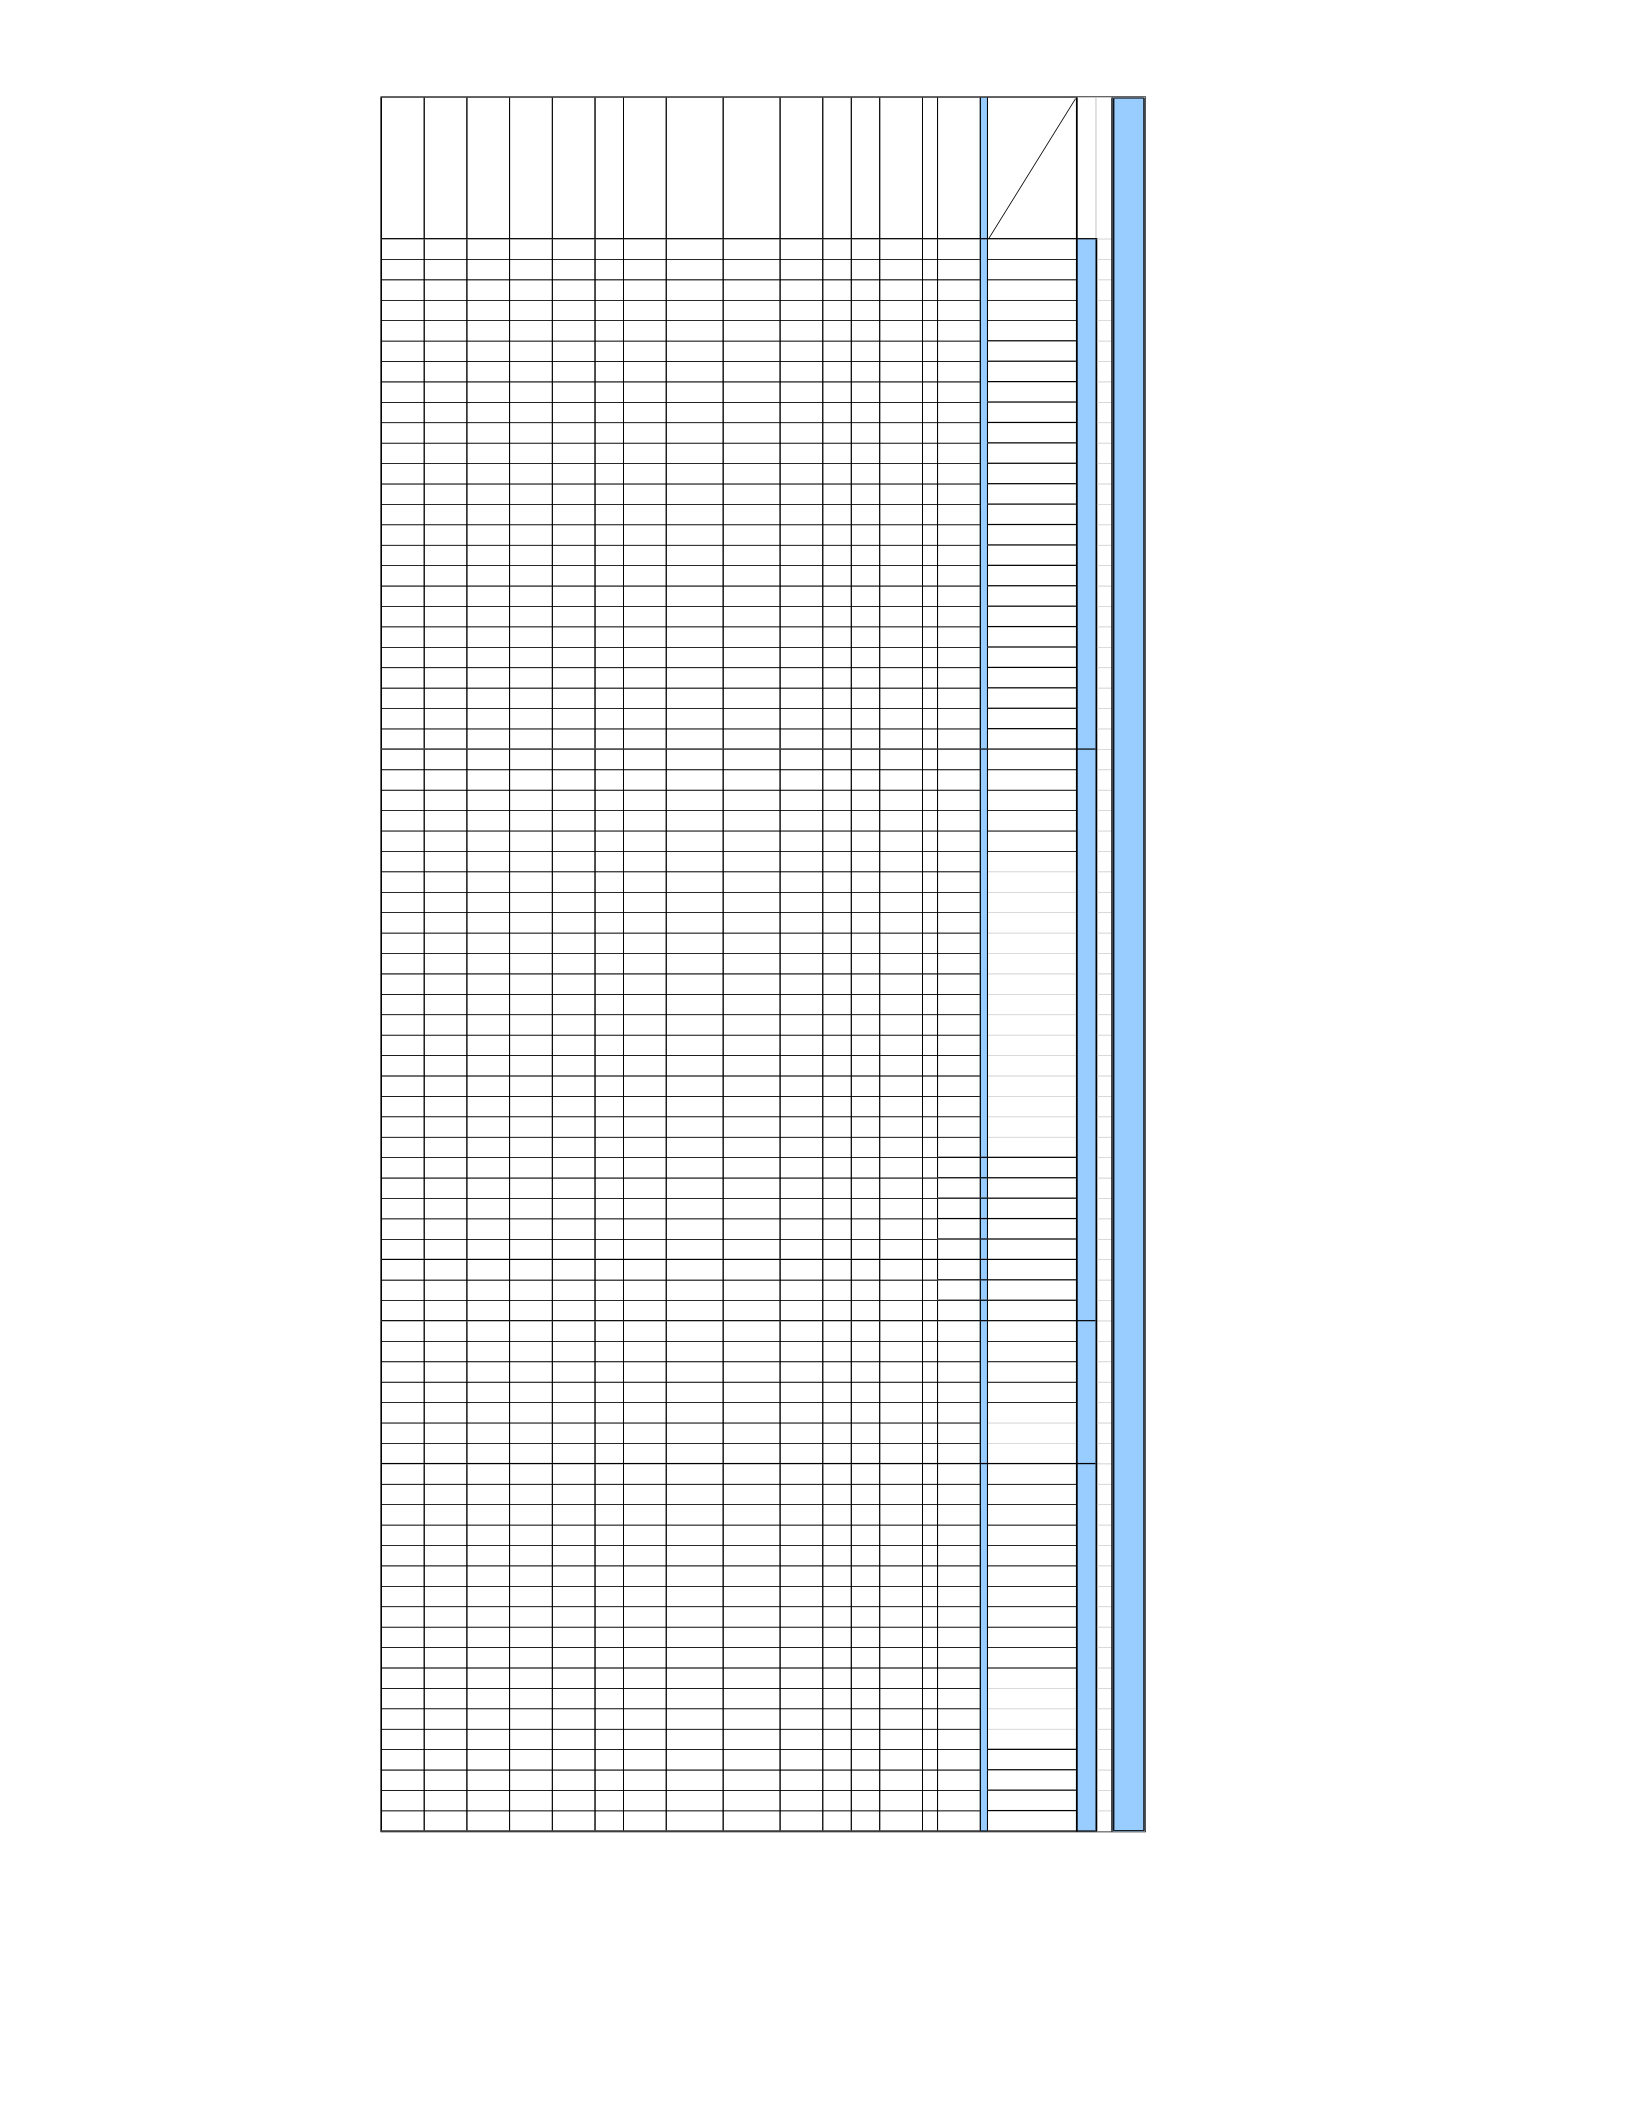
A review of schools of public policy by this researcher (Table 2.1) found that most offered
accredited master’s in public affairs or master’s in public administration. In some countries, such
as the U.K., these qualifications are vital to obtaining a state sector position. A greater number of
schools offer master’s programs with public policy specializations such as management, health,
or planning, than offer doctoral degrees. Doctoral degrees tend to be in political science and
economics departments. Lasswell’s public policy subfields of economics, law, political science,
public administration, anthropology, psychology, statistics, mathematics, and the physical and
natural sciences remain at the disciplinary core of public policy study. Economics and law are
the languages of the state (Lowi, 1992; Nathan; 2014). Political science and public
administration also remain as dominant disciplines in the study of public policy. While Brooks
and Cooper (2013) believe that science is central to the public good, some U.S. Government
administrations have controversially criticized the academic relationship between public policy
and the natural sciences in areas such as climate change for example.
18
Table 2.1 Review of Schools of Public Policy Matrix
E+B5:BQ5conom
ics/Finance,
Political Science
Public
Administration
Law/Legal
Studies
Sociology
Multi-disciplinary
Governance
Public Policy
Public Affairs
Geography
Physcology
History
Math
Business
Social Work
Natural
Resources
Education
Student -
Designed Policy
Media and
Journalism
Psychology
Statistics
Program
Evaluation
Anthropology
Arts and Culture
Physical
Sciences
Internatoinal
studies/Dev
Communication
Public
Health/Medical
POPULATION
STUDIES
Engineering
Area Studies
Big Data
Energy
Education
Immigraton
Social Welfare
Civility and
Democratic
Governing
IT/Technolgoy
Homeland
Security/Defense
Leadership
Policy Research
Public Affairs
Neuroscience
Science/Environ
mental Policy
Conflict Studies
Crime
Transportation
Mgmt
Child, Family,
Aging
URBAN POLICY,
PLANNING/CITy
Joint Programs,
Dual Degrees
Specific
Country/Region
Non-Profit
MGMT/Philanthro
Certificate
Executive
Programs
Applied
Experience
Public
Leadership
Fellows
On Line MPA
Study Abroad
Public Policy M.A
(MPP)
Public Admin.
M.A (MPA)
Masters Public
Mgmt
Masters of Public
Affairs
International
Dev./IR M.A.
Concurrent
Degrees
Doctorate Ph.D.
Ph.D in Political
Economy &
Ph.D In Public
Policy (PPOL)
Ph.D in Health
Policy
PhD In Public
Affairs
PhD in Urban
Planning
PhD in
Envriomental
Undergrad
Degree
Undergrad Minor
University of California - Berkeley,
Goldman School of Public Policy
https://gspp.berkeley.edu/
XXXCD X X CD CD CD CD CD CD CTR CTR CTR CTR CTR X X X X X X X X X X X X
Harvard University - Kennedy X X X X X X X X X CTR CTR CTR CTR X X X X X X X X X X X
University of Michigan - Ann Arbor, Gerald
R. Ford School of Public Policy
http://fordschool.umich.edu/
X X X X X X X X X X X X X X X
Duke University, Sanford School of
Public Policy https://sanford.duke.edu/
X X X X INST SCH
L
SCH
LCTR X X X X X X X X X X X
University of Chicago- Harris School of
Public Policy http://harris.uchicago.edu/
X X X X X X X X X X X X X X X X X X X X X X
Syracuse University- Maxwell School of
Citizenship and Public Affairs
https://www.maxwell.syr.edu/
X X X X X X X X CTR CTR CTR CTR CTR CTR CTR X X X
Indiana University, Bloomington, School
of Public and Environmental Affairs
https://spea.indiana.edu/index.html
X X X X X X MNR MNR X MNR X X X X X X X X X X X X
Carnegie Mellon University, Heinz
College School of Public Policy and
Management
http://www.heinz.cmu.edu/index.aspx
X X X X X X X X X X X X X X X X X
Princeton University, Woodrow Wilson
School of Public and International Affairs
http://wws.princeton.edu/
CTR X CTR X CTR X CTR CTR CTR CTR CTR X CTR CTR X CHN X X X X X X X X X X
University of Wisconsin - Madison, La
Follete School of Public Affairs
CD X X X CD CD X X CD CD CD X X X X X X X X
University of Southern California - Sol
Price sChool of Public Policy
http://priceschool.usc.edu/
X X X X X X X X X X X X X X X X X X
University of Texas - Austin, LBJ School
of Public Affairs
http://www.utexas.edu/lbj/
X X X X X X X X X CTR CTR X CTR CTR CTR X X X X X X
University of Washington,Evans School
of Public Policy and Governance
http://evans.uw.edu/
X X X X X X X X X X X X X
George Washington University,
Trachtenberg School of Public Policy &
Public Adminstration
CD CD X X X X X
Georgetown University, McCourt School
of Public Policy
https://mccourt.georgetown.edu/
CD CD XCD X CTR X X X X X X
With
Type of Program
Schools of Public Policy Review (Source: 2016 U.S. News and World Reports Rankings)
PH.D. Core Courses and STUDY AREAS (X)
Concurrent Dual Degree Programs/Centers, Institute, School/Minor and Specialities
MISSION
Public Policy Analysis
Graduate School

19
Significantly for this study, geography has historically not been a core component of public
policy and its presence has been peripheral at best in the form of cartographic mapping and even
this has often been through disciplines other than geography. Geography lacks a cohesive
presence in public policy and even political geography is seen as a subgenre of political science
or of international relations (DeLeon, 1999; Friendly and Denis; Lasswell, 1956; Lasswell, 1941;
Lasswell et al., 1943; Nagel; 1994; Peters and Pierre, 2006; Sabatier, 1993). More recently,
Geographic Information Systems (GIS) are making some inroads into public policy studies but
again often through a discipline other than geography.
Public Policy Theory
While the study of public policy was envisioned as using a holistic approach, in reality political
science, public administration, and economics have dominated theoretical contributions. David
Easton (1965) provided a framework for understanding the political process from demand to
policy formulation and implementation to societal feedback, and this has become the basis for
the stages heuristic that moves from conception to policy. The stages heuristic policy process is
often divided into the following stages:
▪Identify the problem
▪Set the agenda by focusing the media on the situation
▪Formulate policy proposals
▪Legitimize policies through governmental and political groups
▪Implement policy through bureaucracies
▪Evaluate policies through governmental agencies
Describe the policy process and implement public policy. Defining appropriate theories for the
study of public policy is problematic because of its multidisciplinary background. Cairney
(2013) found that in public policy studies “different definitions of theory are linked strongly to
the different assumptions we make about the nature of the world and our ability to understand
it.” Hill and Varone (2014) liken the study of policy to effective engineering, “While – at least
in the past – many successful engineers have operated pragmatically, using trial and error
methods and accumulating experience with only an intuitive understanding of physics, the latter
can inform their activities. When things go wrong, moreover, for example when a bridge

20
collapses, questions will be asked about the extent to which practice was based upon the relevant
body of scientific knowledge.” Mead (2013, p.390), suggests that the science of politics, or the
science of policy, may at one time have been synonymous in the practice of statecraft,
nonetheless:
“As they have developed, however, these programs seldom teach statecraft as officeholders
experience it, with policy and politics in constant tension. Rather, research and teaching in the two
subjects are largely separate. Policy analysis, or the study of what government should do about
public problems, is done and taught mostly by economists; the subjects here include microeconomics
and statistics. Studies about politics are done and taught largely by political scientists; the subjects
here include the legislative process, implementation, and administration. The first group focuses
largely on policy, the second mostly on politics, and neither says much about the other. Thus,
ironically, economics tells government what to do while ignoring it, while political science does
focus on government but will not tell it what to do. Neither achieves that union of policy and politics
that Aristotle imagined.”
Sabatier’s (2007) proposed that a well-defined, parsimonious, scientific approach was required to
determine if a public policy decision was based on sound theory, and this has become a
commonly used metric especially for political scientists. Rosenbloom (2008) suggests that some
contributing disciplines have moved away from a reliance on a hierarchical authority, even
though elected officials and other government organizations continue to define themselves using
hierarchical theory and rely on positivist and quantitative methods for policy analysis (DeLeon,
1999; Hill and Varone, 2014; Nagel; 1994; Sabatier, 2007). Lasswell envisioned policy science
as the basis for training policy scientists, the forerunner to the policy analyst, with the skills
necessary to work towards the public good:
“If, as political scientists, we were omniscient, we would have at our disposal descriptive and
analytic tools enabling us to do the following: make a rapid survey of the predispositions
found everywhere in the world, “predict” (retrospectively) the conditioning factors
accounting for the direction and intensity of these predispositions; predict the way in which
these predispositions would express themselves under the impact of any conceivable
constellation of future conditional factors; predict the probable occurrence of future

21
constellations; outline the strategies by which the probability of future factor constellations
can be modified (at stated cost in terms of values); and connect past and prospective
sequences of events with specifications of goal (in our case, the goal of realizing the dignity
of man—and other advanced forms of life—on the widest scale.” (Garson, 1980)
Policy analysts are immersed separately within the many sub-discipline that produced them and as such
often perceive policy through dissimilar lenses (Sabatier, 2007 p. 5). Dunn (2015) suggests that these
dissimilar lenses have produced bifurcated goals and evaluations. Furthermore, policy analysts tend to
be rewarded for creating applied knowledge while academics tend to be rewarded for theory creation
(Dunn, 2016, p31) and this has implications for policy analysis. The University of North Carolina
Public Policy program, for example, pointedly notes that the academic mission of the program was not
to produce what the founder of the Public Policy program in 1984 called ‘technocratic policy analysts’
but rather to embed the program in the application of the liberal arts and sciences to important civic
issues (UNC, 2016). As a result of these differing perceptions to public policy and its study, many sub-
disciplines have at some point questioned their own contributions and impact on real world public policy
and theory. Such is the case in the relationship between Political Science and Public Administration,
often called ‘The Great Dichotomy.’ The origins of The Great Dichotomy began with Woodrow
Wilson’s separation of political administration from politics, which marginalized the role of public
administration in politics, and which did not change until the 1960s, despite attempts by Lerner and
Lasswell and the influence of Political Science on public policy. In the 1960s Political Science and
Public Administration adapted their respective theories to deal with the rise of government pluralism and
the increased number of actors involved in government. The Great Dichotomy debates included tense
discussions about theory and practice, the appropriate role of public administration in political science
(largely due to the latter emphasis on quantitative methods), and questions about the rise of public
management within public administration. In the 1990s and early 2000s, some political science scholars
feared that public policy had become hegemonic in their discipline (Guy, 2003). Similarly, sociologists
questioned whether their contribution to public policy was the metaphorical equivalent of adding salt for
flavor. Cairney (2013) questioned that though no one sub-field of public policy was to be greater than
another, nonetheless some disciplinary-based theories have been adapted and hybridized to the detriment
of a unifying public policy theory, which he claimed then failed to capture the complexities of
contemporary public policy.
22
Theory wars in public policy
Until recently, the scientific method was considered superior to experience in public policy studies
because of its emphasis on empirical study and ‘verifiable’ testability. Indeed, Dunn (2015, p. XVII)
defines policy analysis as an applied social science and that “the methodology of policy analysis rests or
should rest on epistemological foundations that differ from those of the disciplines of which policy
analysis is comprised” and should not be stove-piped into the theories of economics or politics, or be
“reduced to an academic spectator sport in which knowledge is prized for its own sake.”
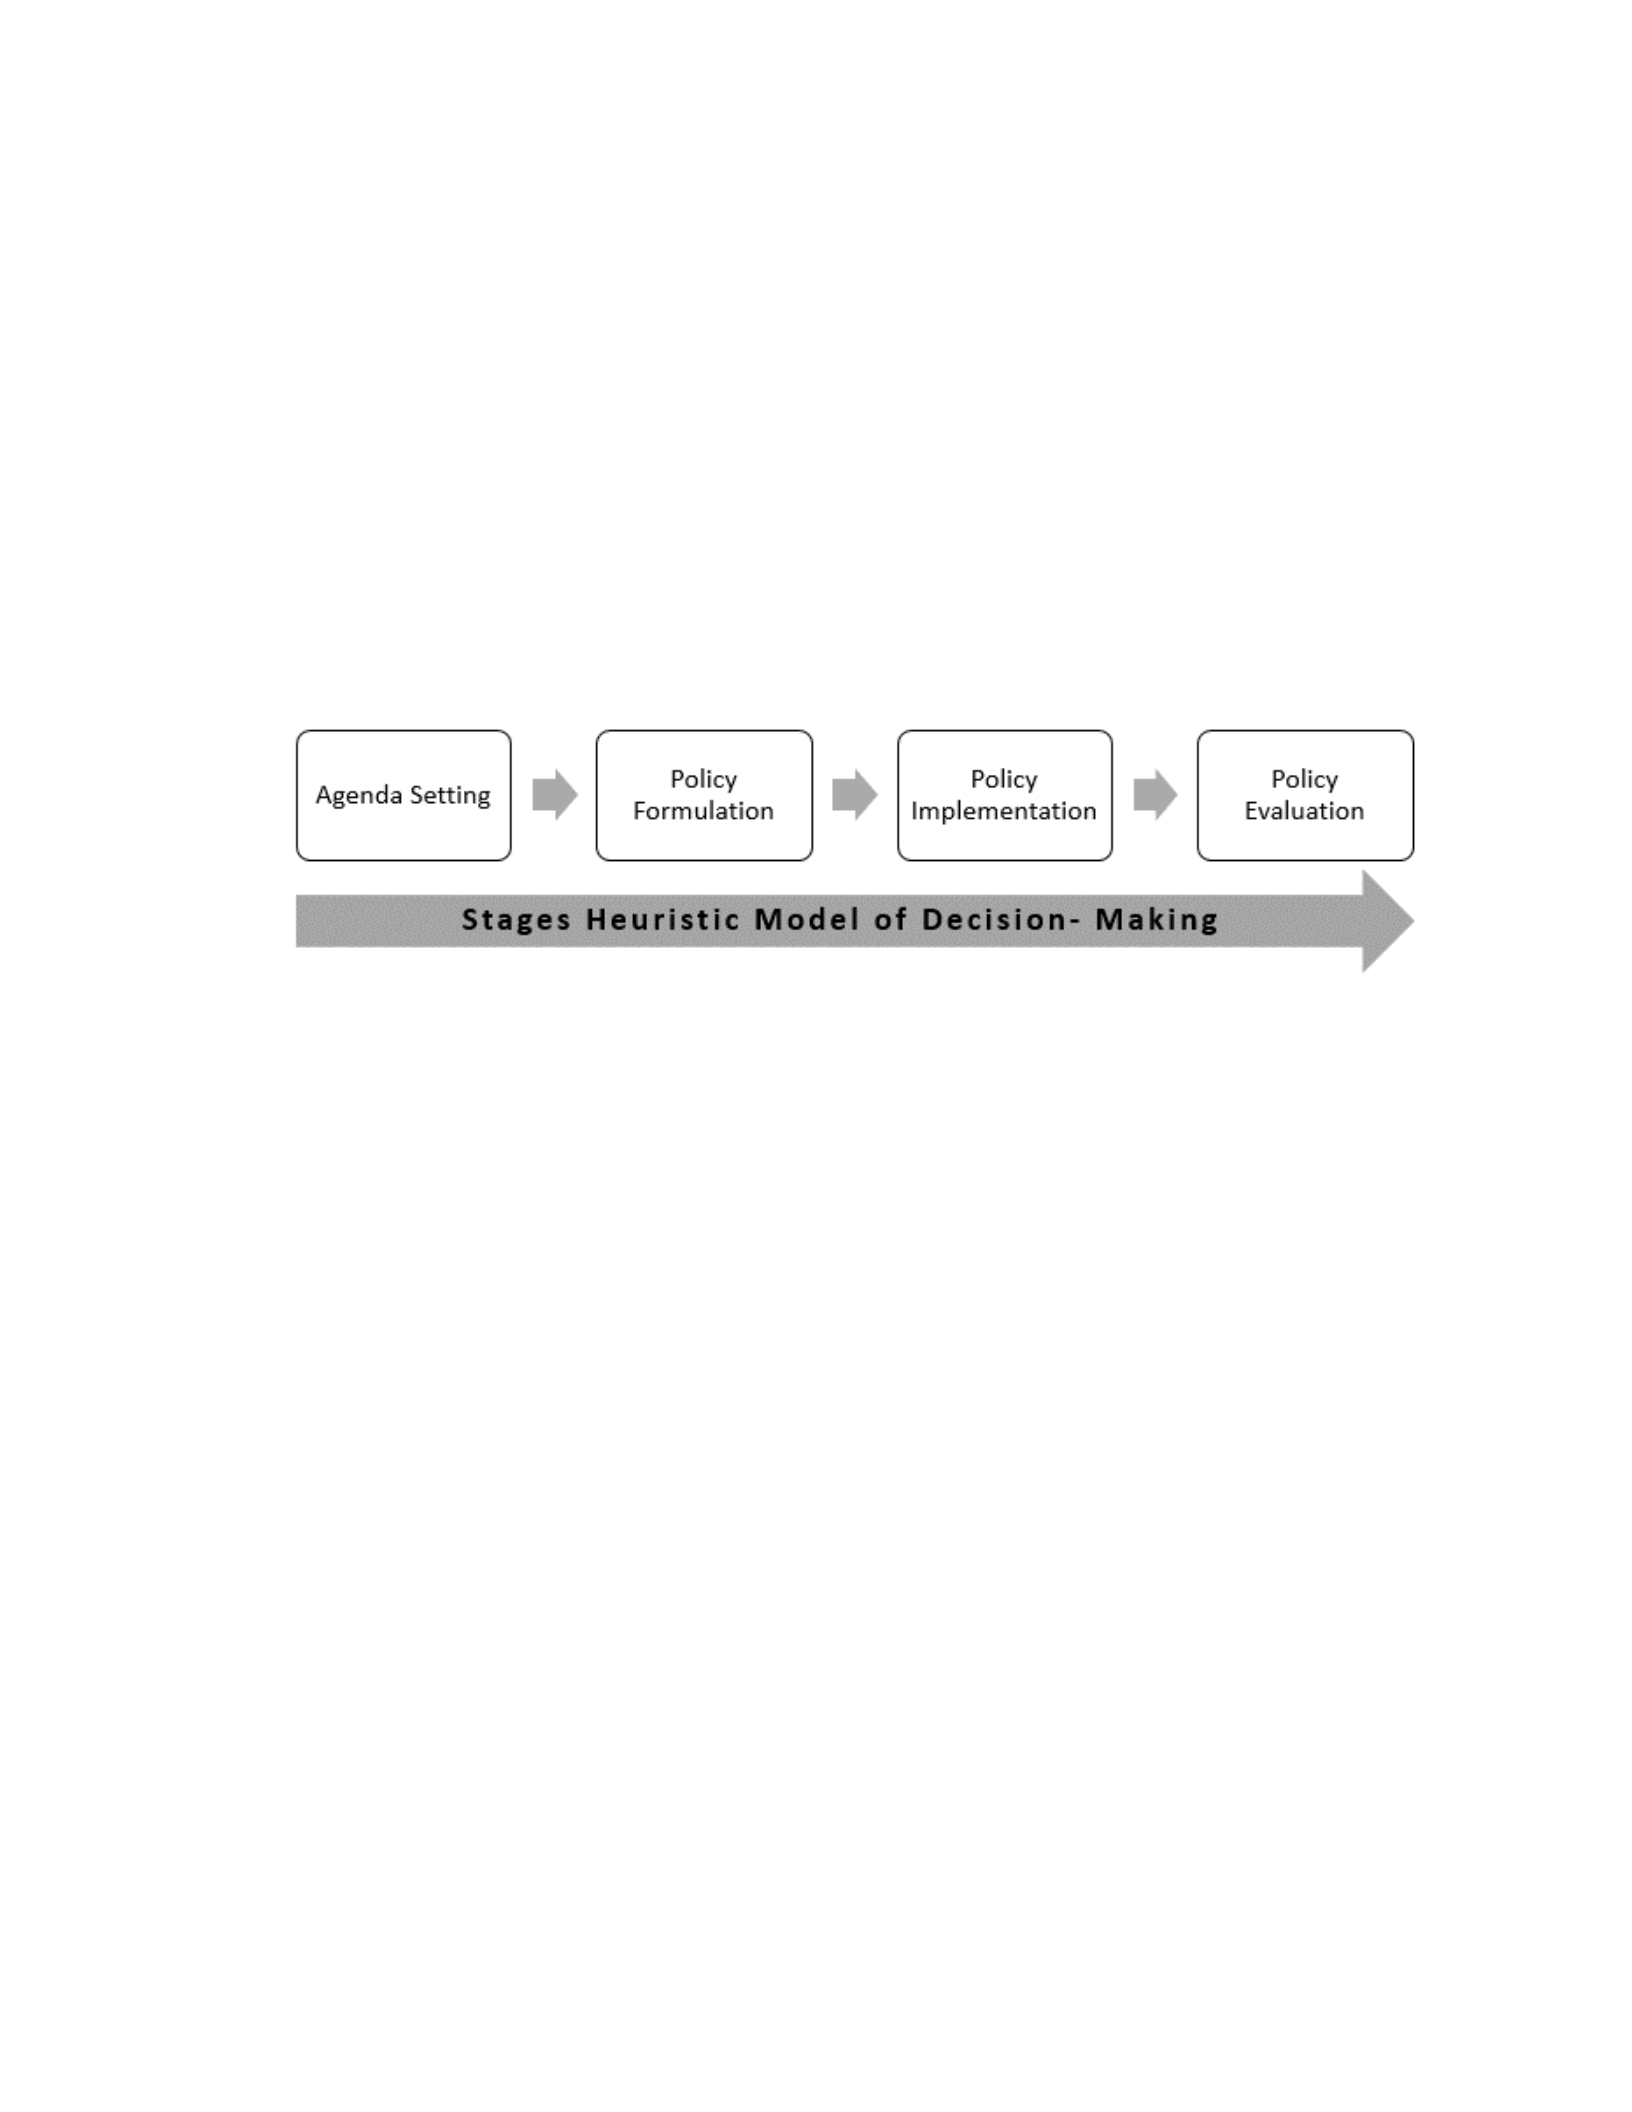
Figure 2.3: Stages Heuristic Model of Decision Making
Lasswell’s Stages Heuristic (Figure 2.3) is often referred to as the “textbook approach” to policy
because it is the most common heuristic technique used to describe the policy process. The
Stages Heuristic was created to operationalize ideas about improving the quality of information
provided to, and by, government. Urgent issues tend to gain more traction at the agenda setting
stage and wane through subsequent stages. Lasswell termed the concept “knowledge of and in
the policy process” (Torgenson, 1975 p.45) and proposed seven categories for a step-by-step,
linear, hierarchical, top-down decision-making process: 1. intelligence or the aggregation and
dissemination of information used by players in the decision process, 2. efforts to influence
others to bring about the desired outcome through agenda setting, 3. prescription or the
development and stabilization of norms including Big P (laws and regulations) and small p
(codes of conduct), 4. Invocation or the original evaluative case of an implementation,
prescription or approach, 5. application of the final implementation for a particular case, 6.
appraisal, evaluation, or reflection on policies and to what extent policy goals were achieved, and
finally 7. termination, cancelation or reformulation of a policy or approach (Aeur, 2017). The
Stages Heuristic evolved into a policy process premised on a hierarchical set of stages involving
23
agenda setting, policy formulation and legislation, implementation, and evaluation and each
stage is supported by respective concepts, theories, models, and processes. The heuristic is
considered a useful and analytically powerful approach to public policy analysis but is criticized
for being hierarchical and top-down and oversimplified in the context of multi-level government
(Aeur, 2017; Aeur, 2018; Lasswell, 1956; Jones, 1970; Cobb, Ross, Ross, 1976; Hjern and Hull,
1982; Brewer and de Leon, 1983; Kingdom et al. 1984; Sabatier, 1986; Nakamura, 1987).
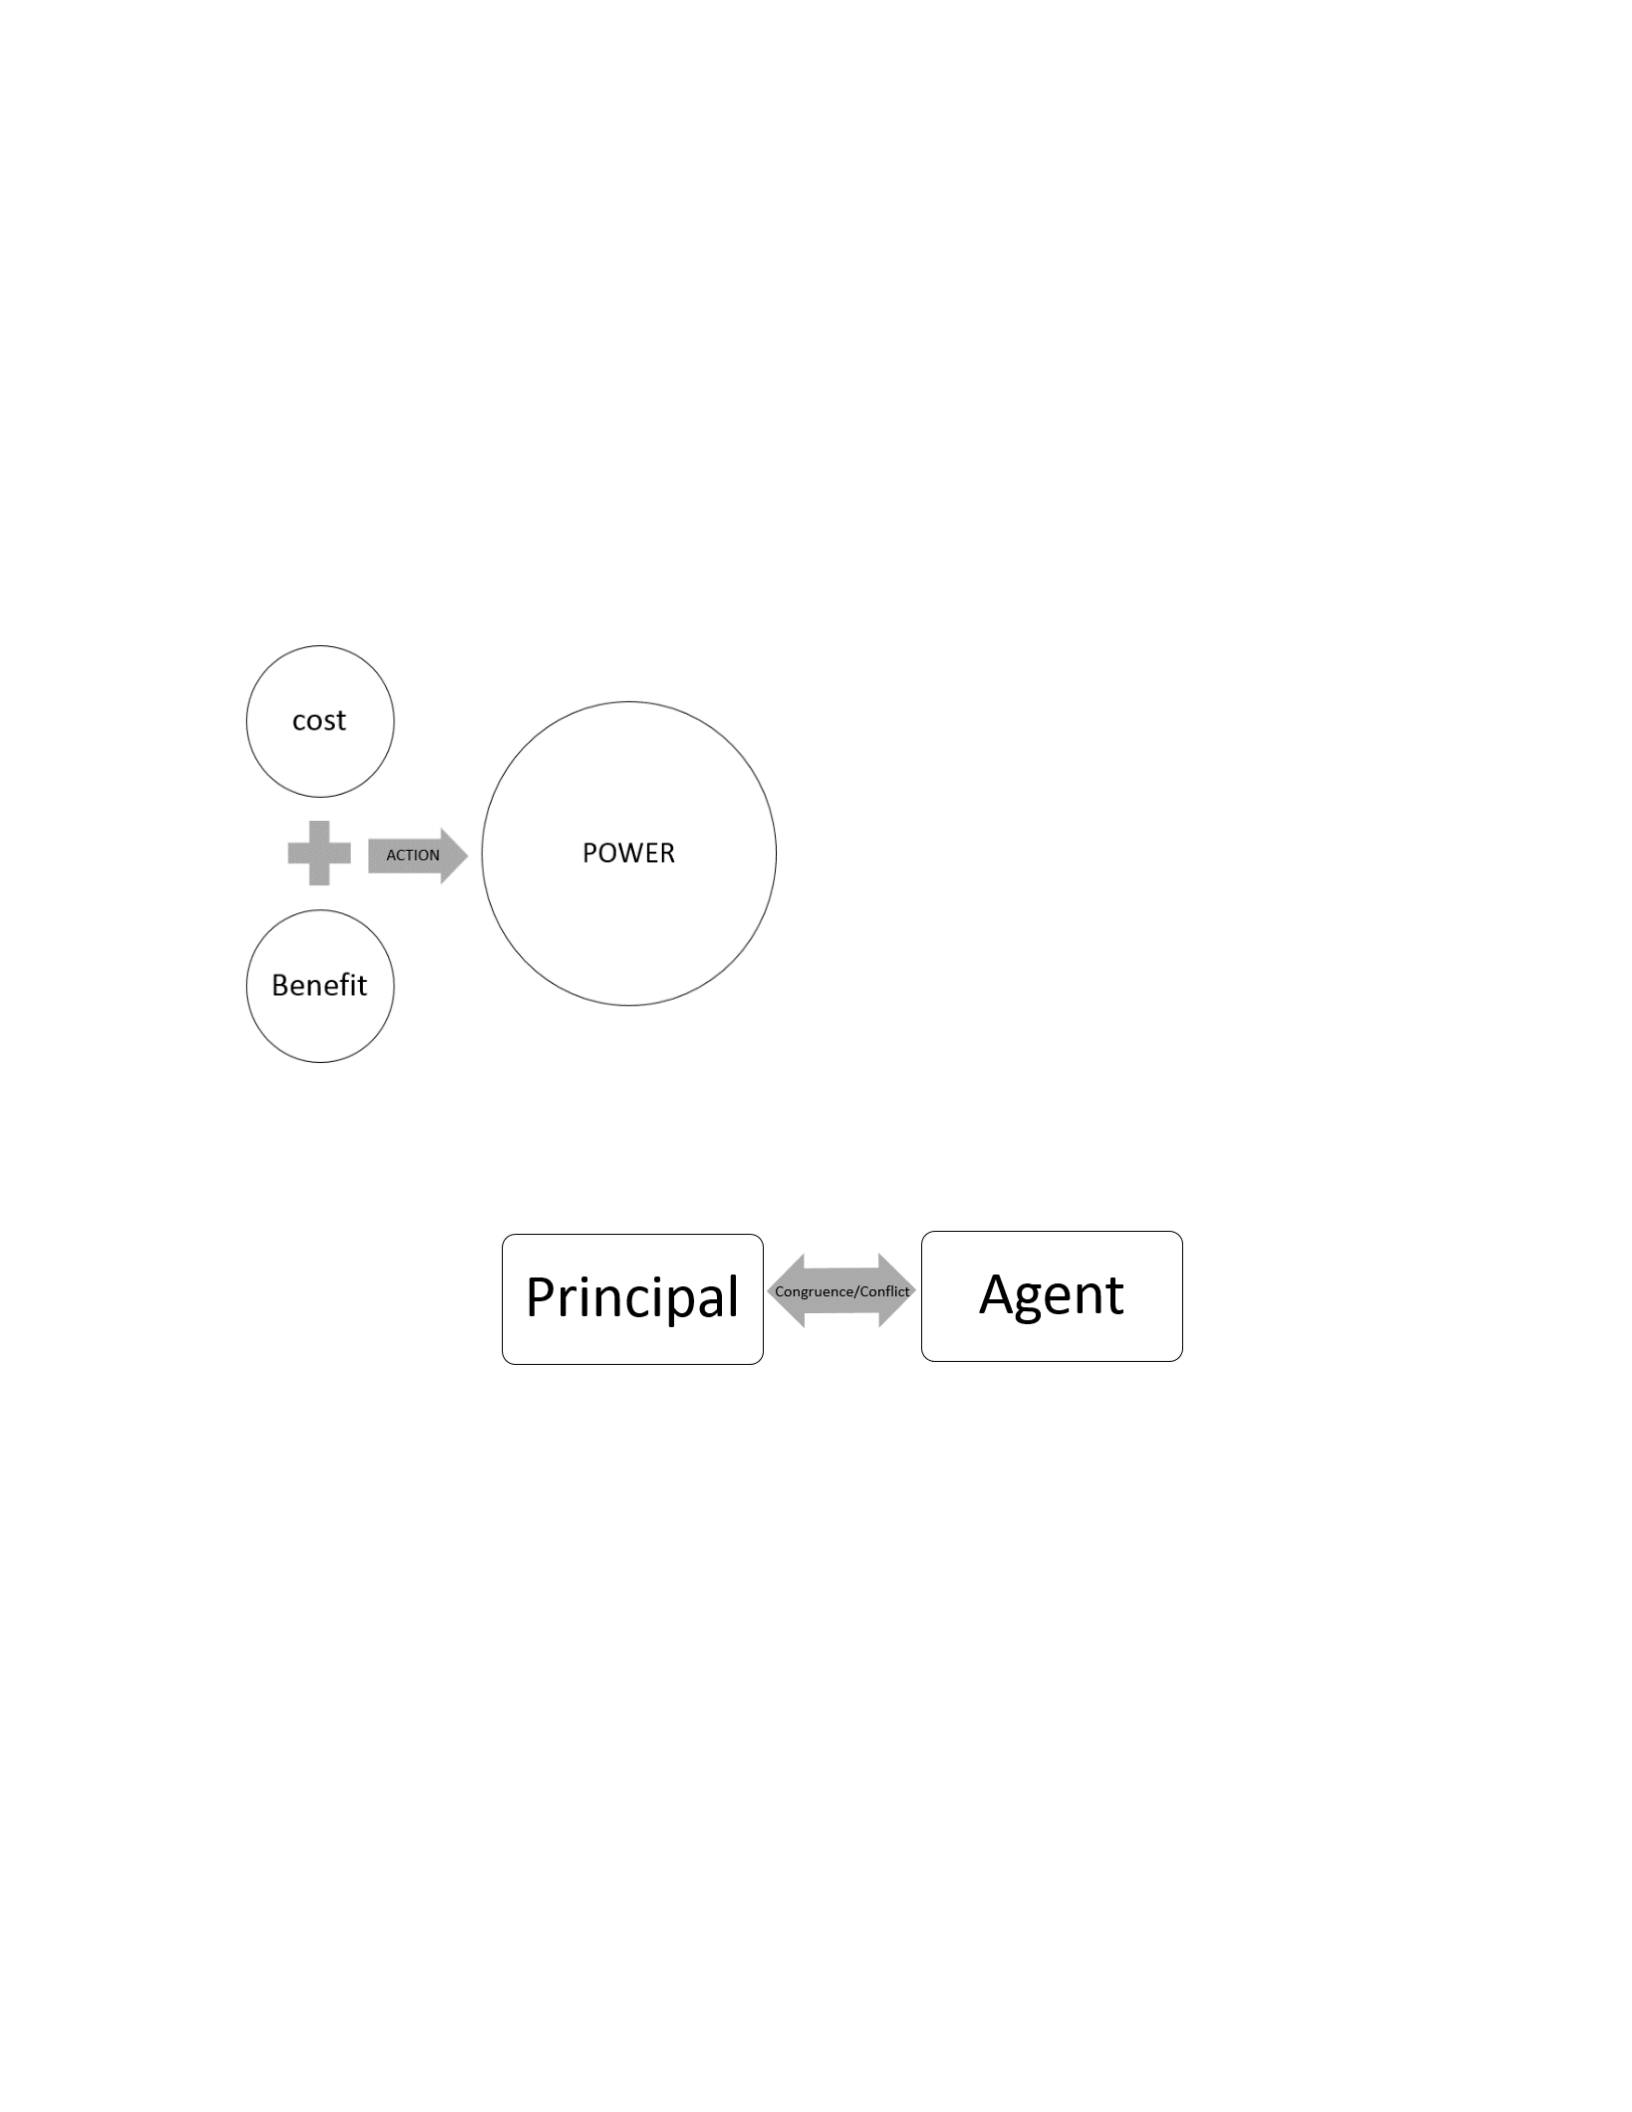
In similar fashion, the Institutional Rational Choice Framework (Figure 2.4) proposes policy
decision-making as a rational process that
focuses on the specific instructional
relationships between Congress and
administrative agencies in the U.S. A key
concept of the Rational Choice
Intuitionalism Framework is the principal
agent theory taken from neo-classical
economics that is integrated into the neo-
institutionalism or resurgence in
institutional theory.
Figure 2.5: Principal Agent Theory
The principal and agent theory (Figure 2.5) assumes a cooperative relationship between the
President, Legislature (the principal), or agency which relies on bureaucrats (the agent) to
provide expertise on complex problems and issues. Although, the principal is in charge, they
cannot function without an agent or agents to carry out their needs. These agents of central or
local government find how the goals of the political system or principal can be implemented. It is
the nature of these institutions that drives political decisions, either through incentives or
constraints that permit certain decisions to be implemented and which drives rational choice.
Figure 2.4: Institutional Rational Choice Framework
24
Agents in close proximity to their principal are considered more likely to share common values
with the principal than if they were distanced in another agency with which they are more likely
to share those organizational or cultural values (Miller 1992; Ostrom et al.,; 1994; Dowding
1995; Scharpf, 1997; Sokolowski; 2001, Worsham and Gatrell; 2005).
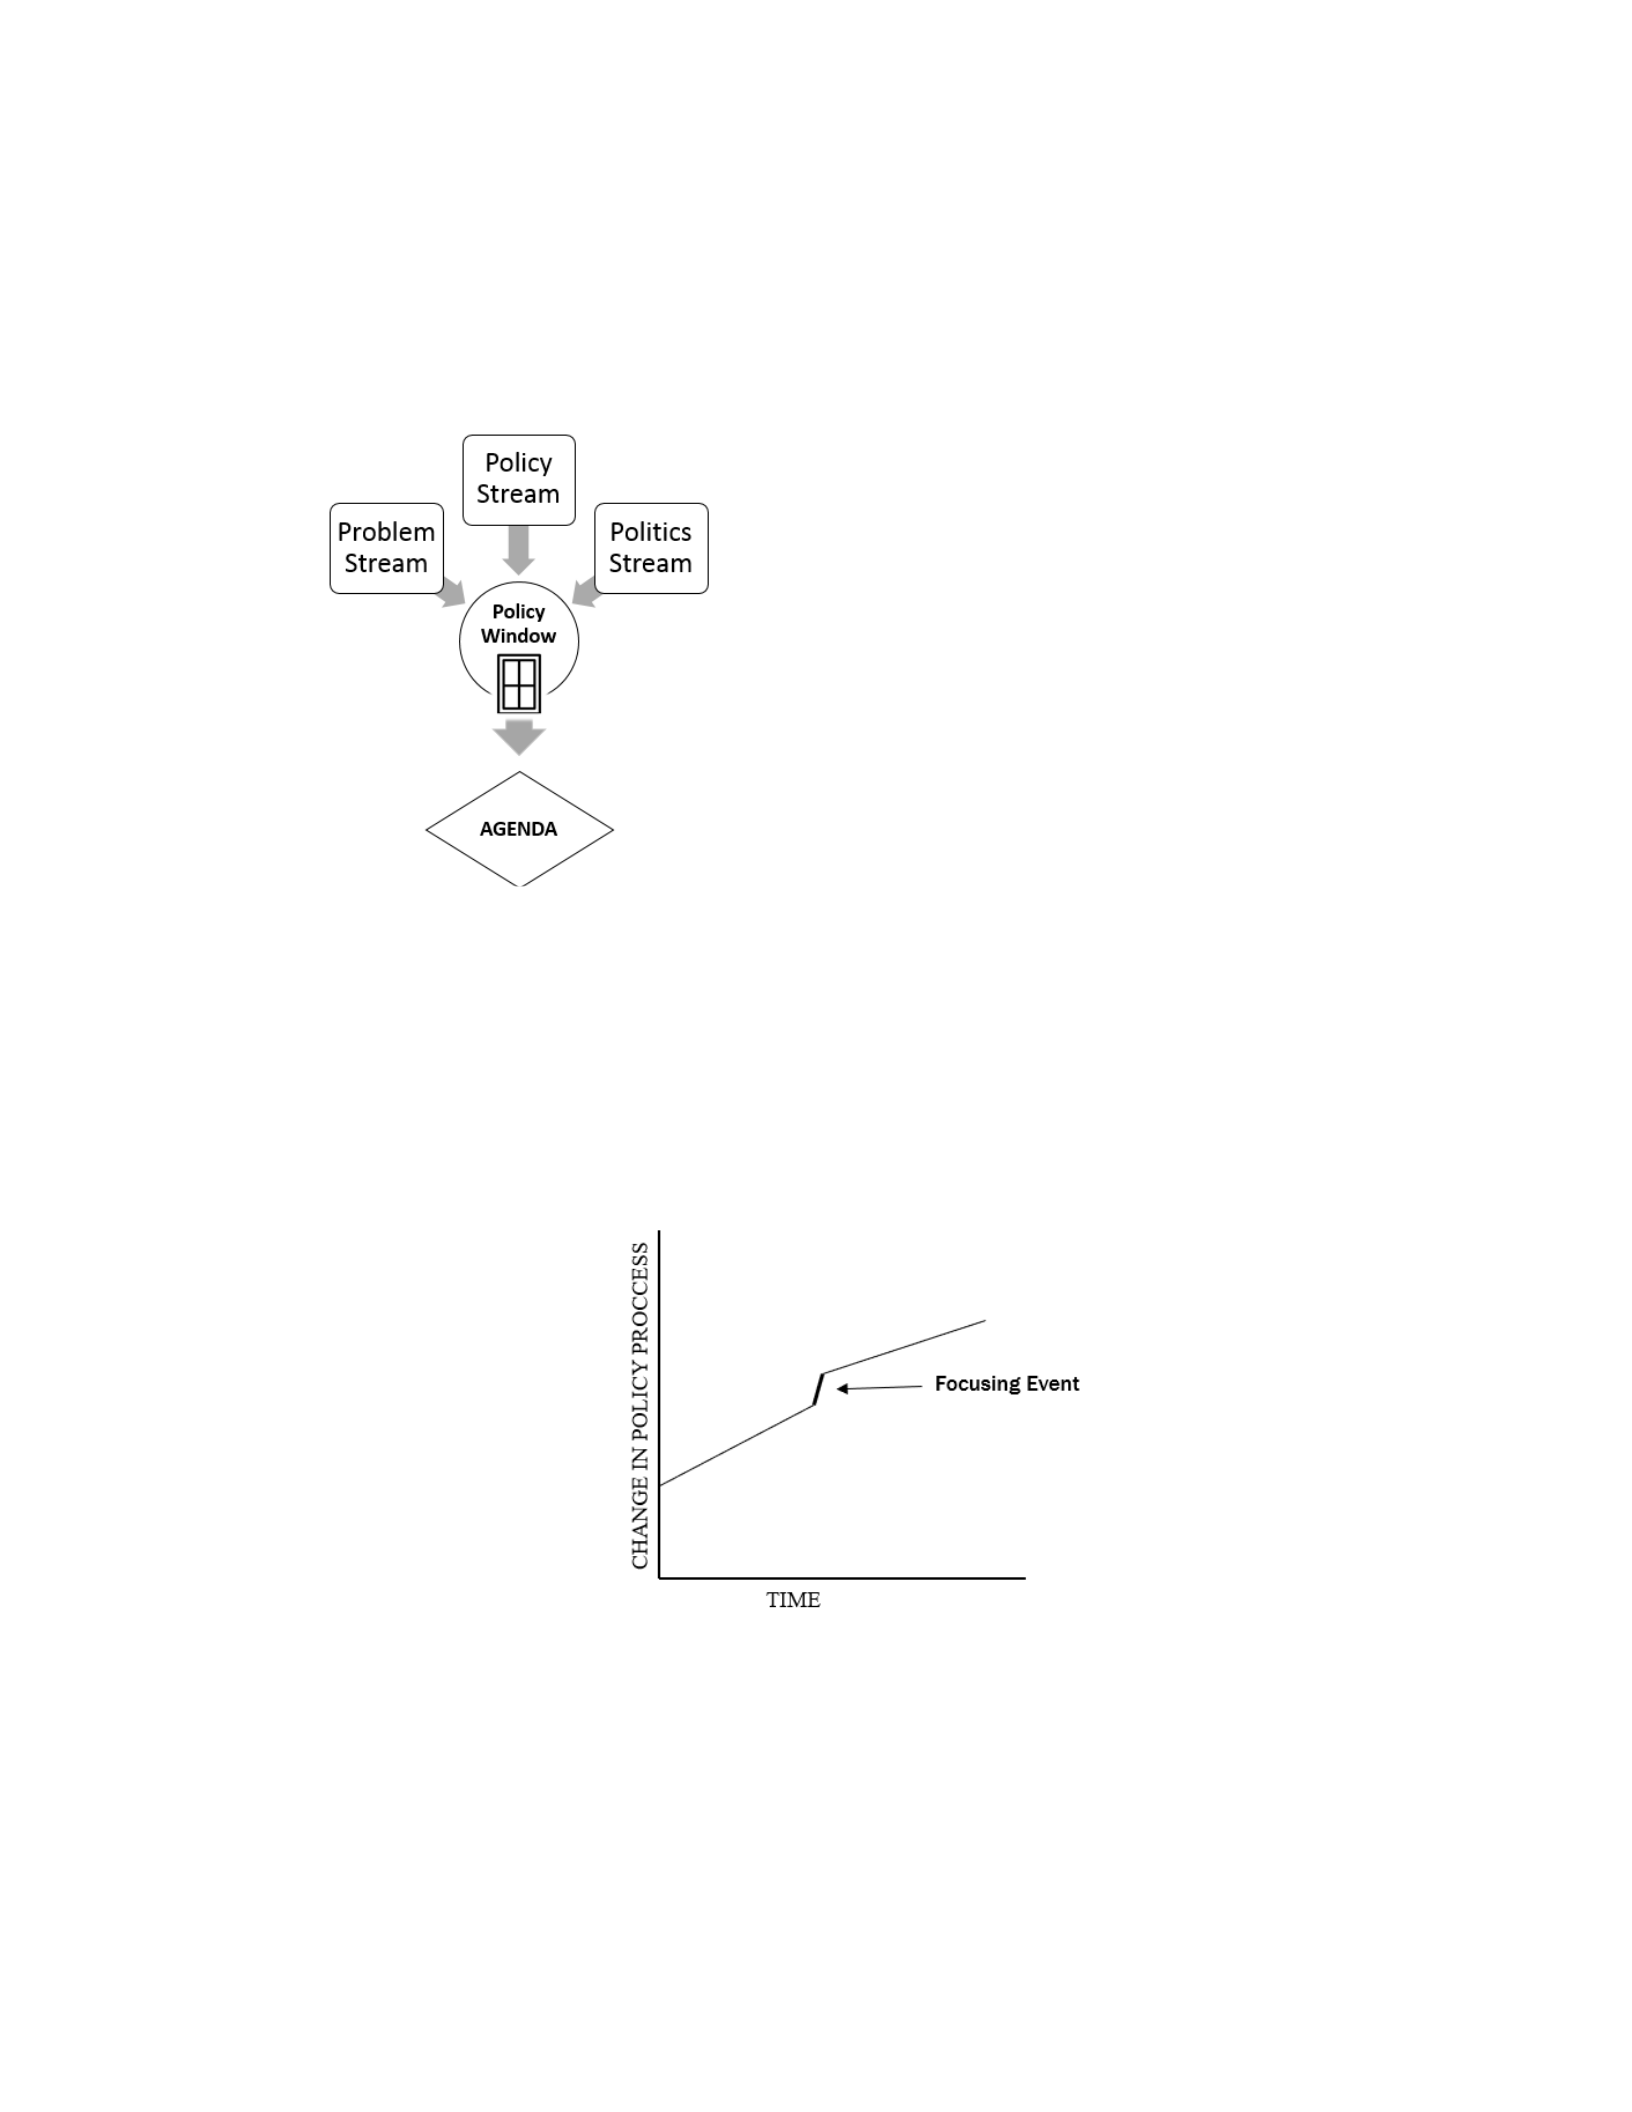
The Multiple Streams Framework (Figure 2.6)
and as adapted by Zahariadis (2014, 2019),
divides the public policy process into three
streams of actors and processes:1) a ‘problem
stream’ consisting of problems and their
proponents; 2) a ‘policy stream’ containing a
variety of policy solutions and their proponents;
and 3) a ‘politics stream’ consisting of public
and elected officials. These streams often
operate independently except during “windows of opportunity” when some or all the streams
may intersect and contribute to policy change. The Multiple Streams Framework has been
criticized for its inability to handle fuzzy or ambiguous conditions; its inability to present
multiple perspectives; and its seeming separation of complex themes into separate streams.
Figure 2.7: The Punctuated Equilibrium Framework
The Punctuated Equilibrium Framework (Figure 2.7) created by Baumgartner and Jones (1993)
seeks to explain why policymaking in the U.S is characterized by long periods of incremental
change punctuated by brief periods of major policy change. Baumgartner and Jones believed that
Figure 2.6: The Multiple Streams Framework

25
government institutions typically gravitate to maintaining the status quo and have a “monopoly”
over defining the issues and decision making. As such ‘punctuated’ change occurs when
opponents to the existing status quo manage to fashion new “policy images” or exploit multiple
policy venues through the courts, legislatures, or local, state, and federal government. Significant
change, therefore, might or might not occur when certain conditions exist. As to what creates the
conditions for change will vary and might include the introduction of new actors, heightened
media attention which increases issue salience, a narrative or narratives which mobilizes the
public to demand change, and more rarely a fundamental reevaluation of a foundational truth
(Baumgartner et al., 2014; Jones et al., 1998; Baumgartner and Jones, 1993).
The Advocacy Coalition Framework (ACF) (Sabatier et al., 2019) is one of the more influential
public policy theories in use and emphasizes the role of external shocks to the political system
and the role of technical knowledge and expert communities in influencing that system. The
members of ACF communities are professional experts who closely follow and debate a shared
policy problem. The ACF was created as a more sophisticated stages approach and incorporates
the best features of the top-down and bottom-up approaches and incorporates technical
information into the policy process. The ACF acknowledges the role played by technical
information provided by the media, think tanks, and other outside experts; it takes long term
view for this information to be disseminated, absorbed, and evaluated by the system; it
emphasizes sub-domains as more useful units of policy analysis because they can account for
when multiple groups might combine to advocate for a specific issue; and finally interest groups
and journalists are acknowledged as policy actors. The ACF focuses on the interaction and
lobbying of advocacy coalitions and actors from a variety of institutions who share a set of
policy beliefs intent on overturning the status quo. These coalitions often explore multiple
avenues to bring about change, which can lead to alignments between unlikely allies.
The policy diffusion framework developed by Berry and Berry (1992) seeks to explain variations
in the adoption of specific policy innovations across states or localities. The policy diffusion
framework posits that policy adoption is a function of the characteristics of specific political
systems and of diffusion processes operating across boundaries. Mintrom and Vergari (1998)
integrated the policy diffusion framework with a policy network structure. While the Policy
Network Approach is not a theory, it draws upon hypotheses and models from other theories in
which clusters of actors, and not governmental organizations, steer the policy process. Policy
26
networks are made up of micro-level relationships in policy-making, network structures, and
individuals and groups. These networks form around an interest or have a stake in each policy
and because these actors are treated as mutually interlinked, networks are self-organizing,
autonomous, self-governing, and resistant to governmental influence. The success of a policy
network depends on the type and quantity of actors involved; the complexity of the policy
networks; the degree to which that network is self-referential; the cost-benefit analysis; and the
absence of conflicts of interest. Adam and Kriesi (2007) criticized policy networks for their
focus on national networks to the neglect of complex interactions at transnational and specific
policy-domain levels (Kenis and Raab, 2003).
Complexity Theory is often considered a new scientific paradigm in public policy that shifts
analysis from a focus on the individual components of the political system to a consideration of
the political system as a whole network of interrelated elements that exhibit systemic behavior
(Cairney and Geyer, 2017; Morl, 2012). Cairney (2013, p. 33) argues that “The best hope for
complexity research, and public policy theory more generally, may be to develop such ‘toolkits’
in cooperation with policymakers, since that interaction can produce new ideas and ways of
thinking.”
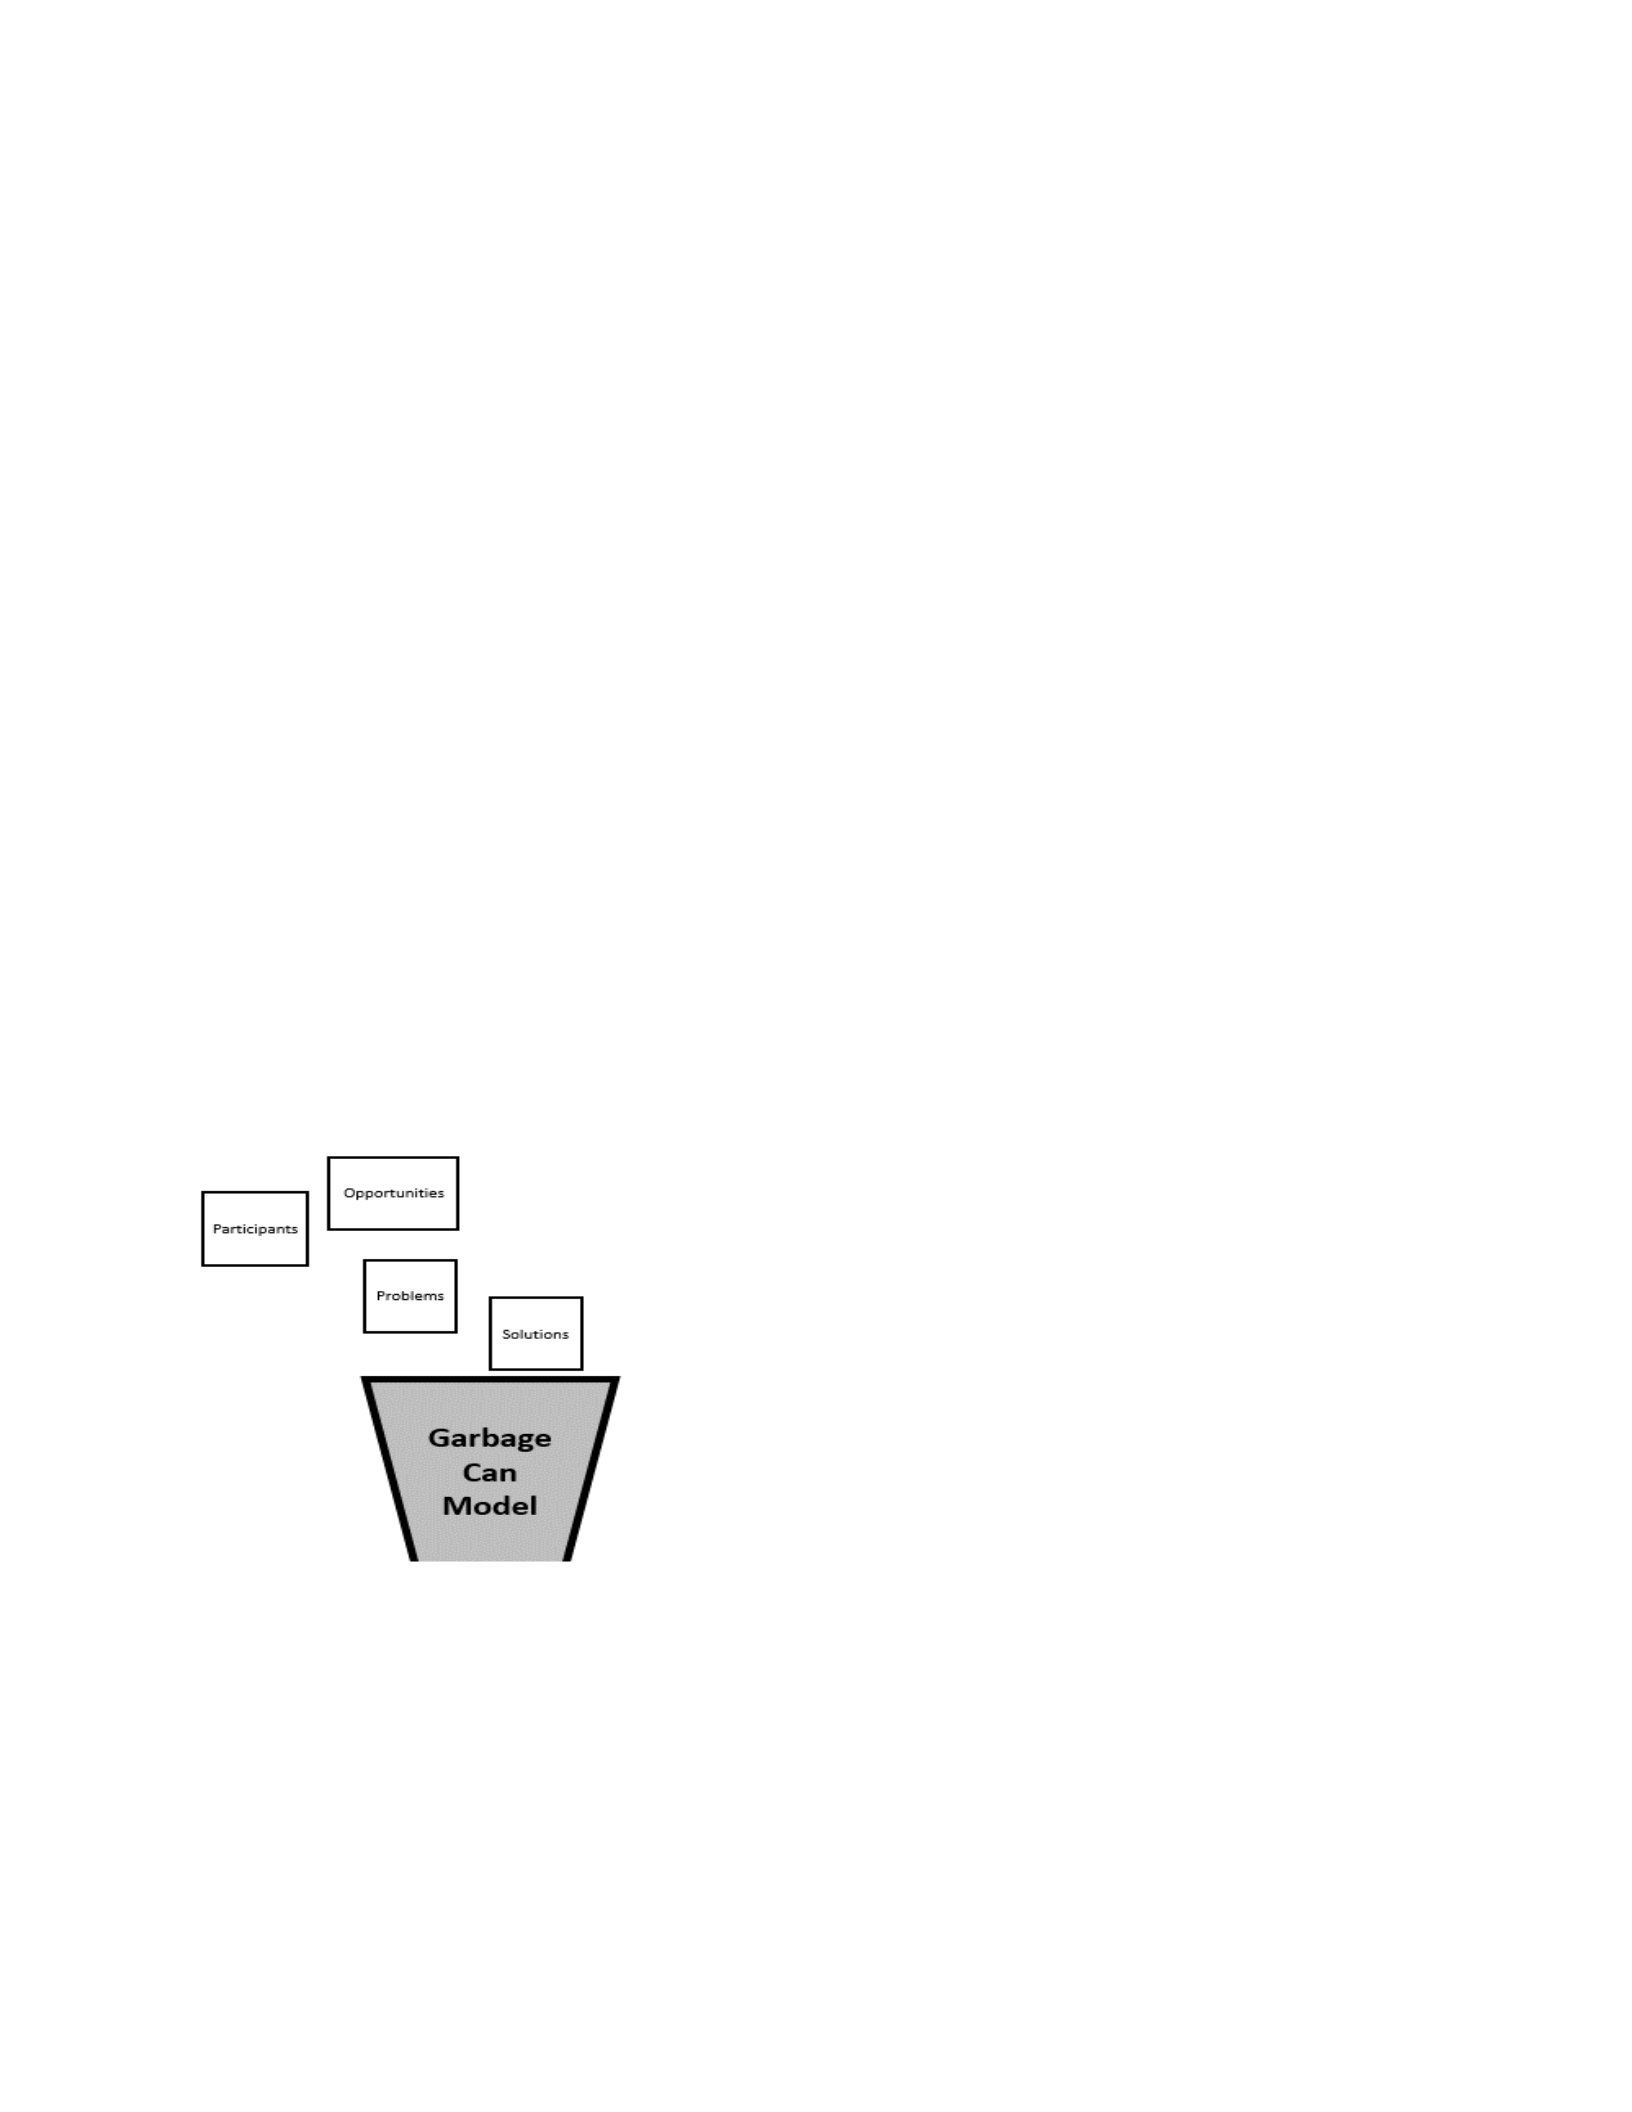
But in contrast to these rational and unifying models, and
perhaps revealing of the challenges faced in the
spatialization of public policy, is the so-called ’Garbage
Can’ model of organizational decision- making developed
by Cohen, March, and Olsen (1982) (Figure 2.8) who
were dissatisfied with formal models of decision-making.
In the studies by March and Olsen
(1976) and by Cohen and March (1982) the authors found that while ambiguity was a major
feature in the decision-making of public organizations, this uncertainty was rarely
acknowledged. The Garbage Can Model recognizes that problems, solutions, participants, and
choice opportunities are unpredictable in any policy decision-making process. The model posits
that few know the political motivation behind policy decisions because political minds are like
Figure 2.8: Garbage Can Model

27
garbage cans collecting information from a diverse number of places and people all of which
contribute to decision-making which is thus as much due to chance and the unknowable psyche
of politicians as to any formalized analysis. According to Cohen, March, and Olsen (1982), a
decision emerges based on ‘temporal proximity,’ as problems, solutions, and participants collide,
and solutions get attached almost coincidentally in the proverbial garbage can. Public policy is
thus, “a collection of choices looking for problems, issues, and feelings looking for decision
situations in which they might be aired, solutions looking for issues to which they might be the
answer, and decision-makers looking for work” (Cohen et al., 1972, p.1). In the context of this
study, where the spatial representation of public policy based on some formal rules or logic
might reasonably be assumed, the Garbage Can Model shifts the focus away from formalized
geographic reasoning and spatial representation to more of a mental mapping exercise in which a
seemingly random and unsystematic decision-making takes place in an environment of
considerable uncertainty (Lomi et al., 2012; p. 3-18).

28
Chapter 3 Spatiality, geography, and public policy
For a number of reasons then, the discipline of geography, with the recent exception perhaps of
GIS, has been peripheral to public policy science and has played only a minor role in the
formation and application of public policy. While Gatrell and Worsham (2002) posited that
some public policy theories such as the principal-agent relationship were implicitly geographical
there have been few attempts to capture the spatiality and geographical complexity of public
policy. In common with initiatives elsewhere some scholars have suggested that geography as a
discipline inherently integrates theory from other disciplines into its own works, but less
commonly experiences its own concepts being integrated into other disciplines (Bodman, 1991;
Kaplan and Mapes, 2015; Ethington and McDaniel, 2007).
Public policy science and political geography
Ethington and McDaniel (2007) in reviewing the political science and political geography
literature determined an apparent lack of collaboration between the two fields despite their
seemingly shared interests. While the subject matter may be similar, they suggested, this lack of
synergy was attributed to the differing analytical frameworks employed by the disciplines:
“Geography is distinct from other disciplines for good reasons. It is founded on spatial or
spatialized concepts: points, lines, polygons, distance, direction, place, area, network, path,
context, scale, region, motion, boundary, borders, nodes, center, periphery, and so on”
(Ethington and McDaniel, 2007; p. 129). Indeed, this analytical divergence may go deeper in
that political geography in the early twentieth century was involved more in territorial decisions
and world politics and environmental determinism, as propounded by the Nazis, which
ultimately contributed to political geography retreating from political involvement. Later,
political geography underwent further change through Marxist approaches (Harvey, 1973) which
splintered the field further. Johnson (1984), for example, termed this “a political geography
without politics” or it could be added spatial boundaries. The radicalization of the social
sciences in the 1960s and 1970s prompted political geography to redefine itself in terms of
Lasswell’s definition “who gets what and why” by adding the “where” component. (Dikshit,
2015).

29
Lasswell, who once viewed himself as an intellectual in exile, found his theories were held
suspect because his work was largely in the service of government. Policy science had been
viewed as being theory-driven but became increasingly viewed as being the government’s
handmaiden and a technocratic force (Straussman, 1978). The cultural turn in human geography
in the 1990s challenged the seeming reification of scale and focus on economic structures and in
political geography competing theoretical perspectives arose based tension between those critical
of government policy on one hand and government administrators or politicians looking for
geography to provide tools and analysis on the other. This was especially so involving topics
such as the war on terror and the role of geography in foreign policy (Dictionary of Human
Geography, 2011). Haynes, et al. (2004) contrast the public policy process typically pursued by
policy analysts with the approaches of political geography which focused on scale, and the
importance of geographic context in policymaking. Haynes et al. (2004) identified an apparent
shift in public policy analysis that had the effect of diminishing the spatial dimension in policy
debates and they argued for a geographic perspective to reinvigorate policy analysis. The term
“geography of public policy” was used by House (1973) in his work Geographers and Decision
Makers as he questioned the apparent separation of geography from the study of public policy.
Dorling and Shaw (2002) and Martin (2001a) argued that geography’s focus on the “cultural
turn” and the post-modern/post-structural turn was to the detriment of a more applied geography
in public policy. Martin posited that engagement in a geography of public policy would enable
geography to be more relevant to the governmental arena and lamented that the lack of such
engagement might ironically actually amplify social inequalities. Massey (2002) counters that
human geography is still in the process of working out its own internal theories and should not
be pressured by outside disciplines to chase political dollars or politicians, who often thought of
geography as dull or irrelevant. Johnston (2008) suggested that the “geography of geographies”
that emerged in the wake of World War II was a unified discipline focused on the study of
regional differentiation or cartographic mapping, though Martin (2001) suggests that the
dialogue with public policy science over the past two decades had been impacted by a
fragmented discipline and that a wholesale rethinking of geography and public policy was
required. Cutter (1988) in a pointedly titled work, Geographers and Nuclear War: Why We Lack
Influence on Public Policy similarly identifies the lack of a comprehensive geographic approach
to public policy as contributing to geography’s lack of impact on specific policy areas. Imrie

30
(2004, p. 701) suggests that even advocates for a policy-turn tend to sidestep policy issues and
conceptualization to focus on matters internal to geography and geographers. Johnston (2005) in
Geography: Coming Apart at the Seams? questioned the increasing number of sub-disciplines in
geography, which he argued weakened the discipline and contributed to a fragmented geography
lacking presence in academia.
Warf (2010) suggested that public policy clearly intersected with political geography but he saw
this cross cutting more narrowly as being largely pragmatic and technocratic in nature and based
largely on remote sensing and GIS (Openshaw, 1989).
Indicative of the tensions being played out in political geography, geography, and public policy
science, and despite the advent of GIS and the urging of some geographers such as Berry (1970)
and Abler (1993a) for geography to be more involved in the public sphere in order to sustain the
discipline’s survival, by the early 2000s political geography took a significant turn toward
structuralism, Marxist theory, and social theory. Such a change can be seen in the rise of new
journals in political geography that focused on space and polity, geopolitics, and society and
space such as Geopolitics (1998 – current) formally known as Geopolitics and International
Boundaries (1996-1997), Space and Polity (1997-2020), Territory, Politicas and Governance
(Since 2013) (Flint, 2003; O'Loughlin and Sidaway, 2008). These approaches were in some
contrast to the positivist and applied approaches embedded within public policy science.
Peters and Pierre (2006) argued that the lack of an applied positivist approach in the study of
public policy would make public policy analysts’ historians and journalists and they argued for
the continued focus on applied contributions to public policy. Only in a few arenas does there
appear to be some overlap between political geography and public policy and this is with regard
to studies on the state, nationalism, and international politics – all part of the politics of
representation and governance, or small ‘p’ politics (Flint, 2003a). An exception to this might be
with studies on state and territory primarily undertaken by Agnew (1994), Taylor (1973), Martin
(1989), Johnston and Pattie (2006), and Ethington (2007). These geographers are among the few
to be cited in the policy science literature (Agnew, 1994; Jones and Clark, 2020).

31
Geography and Public Policy
It is argued here that geography and political geography especially, has largely been missing
from the table about public policy discussion. Massey (2002) and Cairney (2013) suggested that
communication was one roadblock to this peripheralization and argued that geographers needed
to use an appropriate language for target audiences in public policy, “Yet, there is a major barrier
to that conversation: both may have a different language (or jargon) to understand it and a
meaningful conversation may require considerable translation” (Cairney, 2013, p. 22).
Contributing to this communication blockage, Cairney (2013) suggested was the need for
compromise between the relatively pure theory of political geography and the practical
application of public policy science for modern policy analysts to survive in the complex and
messy real world.
Public policy then might be perceived as seemingly aspatial, but the inclusion of small p policy
has forced a reevaluation within public policy science. Critiques of public policy science
(Whitworth, 2019; Cairney, 2013; Termeer et al. 2010; Jones and Clark, 2020) highlight the
missing spatial component and note that places are different and reflect local, regional, and
national complexities and realities that are scalar in nature (Cairney, 2013; Martin, 2001; Ward,
2006). One area that might at first sight appear to be an exception to the peripheralization of
geography from public policy is in Geographic Information Systems (GIS). GIS is a relatively
new field in geography and has become an important component in many parts of social science
such as public health, elections, social issues, and community development. The US is a leader
in public policy theory and GIS respectively and government and private partnerships and a
multitude of spatial databases and technology companies such as ESRI and Google, have
reinforced these technological contributions. Government open mapping initiatives such as the
National Spatial Data Infrastructure and Federal Geographic Data Committee, have created
standards and protocols that apply to every government organization and participant in the US
data infrastructure (Bevington,2015). The Obama administration, for example, encouraged
shared data platforms and egovernment which are seen as critical for democratic procedures to
operate in many Western countries (Bekkers and Moody, 2014; Bevington, 2015). These
technological advances in geography certainly lend themselves to small p policy even though
Box (2015) would assert that geography is needed to capture both Big P and small p policy.

32
As geospatial technologies and spatial data have become more accessible, one would have
thought that the spatial has become more and more ingrained in public policy practice. The link
between GIS and public policy, however, has been limited more to the use of GIS as a mapping
tool, and the greater potential role of GIS as a media and analytical toolset to frame public policy
has been diminished, ostensibly because of the heavy resource needs in expertise, hardware, and
software. Significantly, Jerret et al. (2010) note the use of GIS in public policy but to the
exclusion of geographers and geography. The role of GIS in contributing to the semantic web,
wiki maps, and mashups, that are often the by-product of framing public policy, along with the
use of location-based services, has been restricted. Lasswell (1971), in his review of 20 years of
policy science, identified technology to advance the practice of public policy stating that:
“The trend toward a policy sciences viewpoint – contextual, problem-oriented, multi-
method – is a move away from fragmentation. Too often a differentiated approach is
permitted to degenerate into a fragmented “worm’s eye view” of policy matters. When
properly linked with law and jurisprudence, political theory and philosophy, the new
instruments of policy analysis and management provide tools of unpreceded versatility
and effectiveness. Even an abbreviated list indicates the extraordinary richness of
contemporary innovations: operations research, linear and dynamic programming,
program budgeting, cost-benefit analysis, systems analysis, forecasting (Delphi and other
techniques), computer simulation and gaming, sensitivity training, “brainstorming,”
decision seminar techniques, social accounting, prototyping.”
Yet, despite the advent of GIS, a new spatially informed phase of public policy management and
dissemination has been somewhat stifled. To this end the following chapters explore the use of
GIS in public policy through the creation of policy-sheds based on statutory, administrative, and
best practices and specifically in the waste industry.

33
Chapter 4 The Spatiality of Solid Waste Policy: The
Solid Waste System and Policy Framework
Waste disposal is an everyday necessity and yet the field is rarely accorded the attention
given to other essential infrastructures such as electricity, clean water, or transportation
(Columbia, 2003; Higgs and Langford, 2009). Trash is intrinsically spatial. The methods
used in dealing with solid waste have changed little since early times and involve
burying it, burning it, storing it, or finding a way to reuse it (Bowler et al., 2009; Gifford-
Gonzalez, 2014). Increasingly, however, as the mass of waste generated by modern
society has increased, the ability to dispose of trash locally is now greatly diminished and
often requires transportation to other jurisdictions or even export abroad. Due to the
many demands on the national land stock, trash must compete with other land uses and,
since space is finite, these spatial conflicts have become ever more evident, not least in
the age of NIMBY-ism (Not in my backyard). Furthermore, solid waste disposal is
interconnected with many other areas of everyday life including health, environment,
transportation, homeland security, planning, economic development, water quality, and
more recently, international relations -- all of which impinge on proper waste disposal
(Fennell, 2011). Thus, solid waste disposal and its spatial delineation cannot be treated in
isolation for it overlaps with many other policy areas with often differing spatial extents.
Solid waste can arise from many sources and contrary to popular thought household waste is not
the dominant source of waste materials. Regulatory authorities may vary depending on the type
and source of solid waste. Industrial waste is regulated because of concern for air, water, and
land pollution which impacts public health and the environment. The regulation of industrial
waste can be case specific as in the case of chemical waste which is controlled through the U.S.
Clean Air Act (Kondo, 2014). Waste arising from natural and man-made disasters are less
common and extend beyond everyday prescribed boundaries but events such as earthquakes and
hurricanes even as exceptional events, can wreak havoc and overwhelm the solid waste disposal
system. Brown et al. (2016), in a qualitative study of recycling disaster waste feasibility found
that even when waste disposal and recycling are incorporated as part of a formal disaster waste

34
management system, its effectiveness depends on available and existing knowledge of the
specific area and type of disaster event, resources and cooperative structures and groups
(Holstrom, 2016; NFPA, 2009). Medical waste introduces further complications in the sourcing
and handling of solid waste and not least with endocrine disrupters. West Virginia residents, for
example, average over 18 prescriptions each year, while the national average is 11.6. The
disposal of these pharmaceutical products causes problems with water bodies, commercial
animal feed operations, surface applications of manure and biosolids, recycling operations, and
wastewater treatment plants (Bhati, Dhawan, and Maheshwari, 2013). As a result, drug waste
falls under several regulatory bodies including the Department of Highways, law enforcement,
Environmental Protection Agency (EPA), and Department of Health and Human Resources
(DHHR) in addition to other state authorities. In 2015 the U.S. EPA proposed The Management
Standards for Hazardous Waste Pharmaceuticals Rule to regulate the management of hazardous
waste pharmaceuticals by healthcare facilities to protect water quality from flushed medications
(Vogler, 2014).
Similarly, interstate commerce associated with fracking waste is a growing problem in waste
management worldwide that harks back to the Garbage Wars of the 1980s. Although well
drilling is often performed by out-of-state companies the drilling waste is disposed in local
landfills which are governed by Solid Waste Authorities (SWA) and are subject to the
regulations and practices of the U.S. Centers for Disease Control, the U.S Groundwater
Protection Council, and the U.S Department of Energy (Farah, Tremolda, 2013; Greenburg,
2018; Kotcon, 2014; Swickl, 2019). The case of scrap metal further reflects multiple levels of
regulatory authority with the added complication arising from the intersection of municipal
waste, volatile solid waste commodity markets, and transboundary issues arising from the global
trade in waste. Solid waste has a cyclical nature and events can punctuate waste disposal policy
based on a combination of global economics, world conflict, environmental and health concerns,
and consumption patterns (Sabatier, 2007).
Thus, the Integrated Solid Waste approach adopted as standard industry and government practice
has been criticized for using idealized waste scenarios and policy situations that focus on
municipal waste, Big P regulations, and economics; all actions that take the crucial

35
understanding of place and space out of the waste equation. Each type of waste, depending on its
location, has its own jurisdiction and spatial dimension. The U.S. government has created sets of
laws related specifically to regulate federal waste practices, federal buildings, lands, and prisons.
These laws are often stricter and preempt any local or state laws and are adhered to no matter the
location of the federal agency. Airports, for example, operate as if they were a small federal
town and are subject to different recycling, reuse, and waste rules than the jurisdiction within
which they are located. The U.S. Department of Defense has its own policies concerning solid
waste disposal and not least because of defunct armament (Abraham, Eick-Cost et al., 2014;
Scavenger, 2011; Turner, 2002).
The disaggregated nature of the solid waste system further compounds the situation.
While most people view waste disposal as a dyadic relationship between householder and
the trash disposal company, there are multiple and varied actors and stakeholders
involved in the process. Solid waste is often treated as a monolithic entity instead of an
aggregation of many differing types of waste types and disposal systems, each incurring
separate jurisdictional control and protocols. In addition, the respective agencies have
their own procedures, policies, and practices. Attempts to stovepipe solid waste policy,
therefore, is impossible. The extent of these interlocking forces is further compounded
by a heightened public awareness of trash, from local issues of trash collection and
recycling to climate change and the Great Pacific Garbage Patch. Popular movies such as
WALL-E (2008), Gravity (2013), and The Story of Stuff (2012), and Sir David
Attenborough’s Blue Planet II (2019) have inspired zero-waste activist movements and
raised the public awareness of trash, recycling, and waste disposal.
Correct waste disposal behavior often depends on community values and behaviors and the role
of environmental groups, religious organizations, and individuals who perform stewardship
through community involvement. Importantly, policy is often written that depends on the input
and support of these organizations. Non-governmental groups often volunteer to perform
community clean-ups of rivers, parks, and neighborhoods and take the initiative in recycling
initiatives. Concerns to make volunteers aware of the risk of used heroin needles or

36
methamphetamine waste, for example, have necessitated the need for training resources for these
groups (Hitzhusen, Tucker, 2013; Leary, Minton, Mittlestaedt, 2016).
Recent events have highlighted the transboundary nature of solid waste. Instances of
transboundary waste disposal includes the waste deposited by hurricanes on distant shores, man-
made waste generated by activities such as horizontal drilling and ‘fracking’ waste, and
prescription drug disposal. The simplified, linear, and homogeneous portrayal of solid waste
depicted in most public media, such as the Story of Stuff (2012), belies the complexities
involved in the solid waste system and the related policies and jurisdictions that can range from
natural resource extraction to product manufacturing and distribution, to public consumption and
disposal. Despite appearing as a unified policy area, solid waste encompasses many political,
technological, service, and environmental activities that transcend the local and garner the
attention of multiple agencies. Added to which are the many constituents, actors, and
stakeholders that make up waste policy disposal and best practices. Further, waste disposal is an
everyday challenge punctuated by crisis events that can seriously disrupt the system and the
procedures laid down for waste disposal (Achillas et al., 2013; Allmendinger and Haughton,
2009; Colin, 2007; Duany et al., 2010; Meadows, 1999; Li et al., 2014; United Nations
Environmental Program, 2009; EPA, 2014; MacBride, 2012; MacLennan and Stiller, 2010).
This chapter reviews three central themes to the solid waste disposal system as a prelude to
discussing the potential role of policy-sheds to capture the spatiality of the solid waste system.
First, the chapter reviews the solid waste industry itself and how the quantity and value of waste
is determined and calculated. Second, the chapter reviews the nature of waste disposal in the
context of a scaled geography, that at its simplest level extends from the local to the global, but
in reality, exhibits other forms of scale that bypass hierarchical scale through worm-hole-like
connections that connect the local directly to the global. Third, the chapter lays out the basis for
the laws and regulations that surround solid waste disposal and especially so in the context of the
regulatory system controlling the relations between waste, the environment, and people.
The solid waste industry
For the average home in the U.S., municipal trash comprises over 300,000 types of individual
items used in everyday life and including furniture, electronics, clothes and textiles, cleaning

37
supplies, food, mementos, paperwork, and medications (human and pet) to name just a few.
Each item has its own complex life cycle, and each is associated with its own set of policies and
regulations that extend from source to manufacture to disposal. It is generally accepted that each
person in the U.S. generates an average of 4.4 pounds of potential municipal solid waste (MSW)
per day (Leahy, 2018). Yet, this figure only constitutes only 3% -7% of the waste generated
within the U.S. (EPA, 2014). While a greater variety of items exist within municipal waste, other
solid wastes, such as industrial waste, account for the bulk of solid waste worldwide
(WorldBank, 2018). Taken in its entirety, waste items and the materials that subsequently
become waste are constantly changing as new materials are developed, new trends followed, and
conveniences desired. Alongside these new items, legacy items such as mercury, remain in the
waste stream through either storage or continued use and these require specific handling for
disposal. The material composition of an item determines the disposal method that might be
available and the impact of that item on an individual, community health, or economy (Achillas
et al., 2013a, 2013b; Gifford-Gonzalez, 2014; EPA, 2014; EPA, 2021; Gopalakrishnan et al.,
2021; MacBride, 2012; MacLennan and Stiller, 2010).
Recent studies have revealed confusion concerning the appropriate disposal of waste materials.
Waste materials that require specialized disposal such as medical, household hazardous waste,
and electronic waste are a growing concern because they are more difficult to dispose of and
usually need specialized knowledge, handling, and methods to keep harmful materials from
impinging or adversely affecting human health or water quality. Advances in material science are
often ahead of the methods available for disposing of new types of waste. This is made more
complex since manufacturing is invariably disconnected from disposal, thereby leaving the
responsibility for proper disposal to the buyer. In addition, waste companies often need to
reverse engineer products to appropriately dispose of the material. Disposal practices struggle to
keep pace with material changes. Reusable water bottles and plastic bottles, for example,
replaced polyethylene-lined disposable paper cups, which were formerly lined with wax. These
disposable cups had, in turn, replaced public water sources, such as water fountains with tin
cups, and catalyzed the invention of processing methods for plastic materials. More recently,
disposable products have gained traction as a marketing practice, and items such as disposable
and biodegradable wipes, cups, or kitty litter require more specialized processing methods such

38
as composting because modern landfills were not designed for an increase in compostable
material. In addition, now defunct materials that make up legacy items, many of which would
now be banned, are often stockpiled to be disposed of later (Vining and Ebreo, 1990; ISRI,
2014). Waste materials are closely tied to economics because of their potential value as
secondary materials which are items composed of materials which can be returned to near raw
material state for further manufacture as new items which are highly desirable commodities.
Counting, under-counting solid waste
Current data used to estimate the amount of waste generated stems from multiple sources, such
as the U.S. EPA Municipal Solid Waste Generation Chart and The Waste Atlas, that out of
necessity have focused on readily generated data. Local waste generation is the foundation of
aggregated waste data, analysis, and logistics, yet many publications refer broadly, “to the same
cities for similar periods, different waste generation per capita rates, different overall waste
generation, and internally different populations” (Waste Atlas, 2014 p. 17). Recent studies have
found that this data contrasts with the fuzzy and complex real-life nature of waste, and
consequently under-reports waste estimates which then go through an over-simplified waste
analysis (U.S. EPA, 2015). One cause for under reporting waste data reporting is that waste
estimates are based on a presumption that waste is homogenous, singular entity, which
contributes to inaccurate normative estimations. Not least, waste sources use differing
definitions of waste dependent on geography, economics, culture, history, and applicable law.
The Waste Atlas (2016) postulates that the usual approaches used in waste analyses are based on
data that assumes that waste generation has a steady relationship related to per capita population
while ignoring economic growth/decline and other dynamic uncertainties. These assumptions
hide the full scope of waste generation and disposal that comprises a multitude of specific items
destined for sites that often compete such as landfills, recyclers, and non-profits. Waste can also
be hoarded, dumped, or burned and may be generated by crisis events such as flooding or
irregular events such as sporting events, concerts, and holidays. Another overlooked aspect in
waste disposal is that the tracking and analysis of waste may occur outside of the data collected
by governments or contracted companies. These overlooked waste sources include farms,
restaurants, schools, businesses, small waste recycling operations, non-profits, the informal
waste sector, and even community organizations. These waste sources intersect, partner, or work

39
alongside large municipal, private, and industrial waste disposal companies. Further
complicating the under-reporting of solid waste is that the data is often recorded based on oral
agreements, historical partnerships, or cash-in-hand deals that contribute to under-counting
issues.
Calculating the full extent of waste generation is complicated by the time-consuming, expensive,
and often infeasible means of undertaking these audits. Waste audits are often estimated for
specific areas and are then extrapolated to other areas. The audits are invariably performed by
collecting and recording items such as cigarette butts, litter, landfill waste, and industrial wastes
and then extrapolating these figures for regions and countries. Pre-waste audits, waste estimation
from receipts or inventory, can also serve as waste audits when factors such as safety or time
constraints hinder traditional waste audit analysis (Pickles, 2008; Powell, 2014; Work and
Hayward, 2011). Even when waste audits are conducted, the data may be proprietary and not
widely distributed or not made available in an accessible format. In some instances, waste data
for some items might not be available for all locations, as was found with scrap metal which does
not appear in some accounting frameworks because industries are identified by their primary
products, and scrap metal has no assigned industry (Jackson et al, 2008).
Self-reporting rules further complicate waste data due to the probability of unreported,
inaccurate, or false data which generates waste profiles that are vague, misleading, or outright
false. Self-reporting errors are often caused by the differing spatial units used for each waste item
generated. When New York Times columnist John Tierney (2015), for example, questioned the
need for recycling in his article The Reign of Recycling, he received negative responses by the
independent waste industry. As the body representing the largest waste handlers, the industry
argued that portraying recycling as one homogeneous municipal practice discouraged people
from recycling altogether because most people cannot comprehend the scope of waste even
within their own homes. Municipal waste, because it is the most visible aspect of the waste
process, is the easiest to analyze compared to the real extent and complexity of the waste system.
Other parts of the waste stream including businesses, industry, and infrastructure are not so well
understood and yet generate by far the greater quantity of solid waste (ISRI, 2015).

40
The Fuzzy Value of Waste
Waste items are valued based on local to global commodity markets that trade alongside and
intersect with four key commodity areas comprising energy, metals, food, and raw non-food
agricultural materials. The secondary recycling commodity markets have grown along with the
market for new technologies, such as electric cars, solar power units, and satellites. The
secondary waste recycling market has also been impacted in part due to the recognition that there
is a limited supply of raw materials and that the costs associated with material extraction can be
volatile and influenced by economics, political events, and social contracts. The complexity of
the waste system is difficult to appreciate and especially so when the secondary commodity
markets, which tend not to track waste figures, is added to the solid waste system. Although a
vast amount, about four billion tons of municipal, industrial, and hazardous waste by-products,
are sold on the commodities market each year, the line between waste and valuable commodity is
fuzzy and often determined by the seller, buyer, or market. Unlike ‘virgin’ or ‘raw’ material,
secondary waste commodities are bought from the waste and recycling industry, usually
comprising smaller companies, and then aggregated to create a viable source of raw material
(Irwin et al. 2006; Cooper et al., 2008). The market for ‘virgin’ plastics material versus recycled
commodity plastics material, for example, touches every manufacturing and product market from
plastic drink bottles to car parts to medical devices, and vinyl siding. Raw plastic materials are
manufactured from the by-products of the oil industry, and when oil prices are high the market
for plastic made from raw materials decreases and the secondary or recycled materials market
increases. In contrast, low market prices for raw plastic can create a crisis that can reverberate
throughout the recycled plastic markets worldwide because secondary plastic commodities
become more expensive than ‘virgin’ plastic. If oil prices slump, then the secondary market for
plastics declines. Crashes in the secondary commodities market affects local recycling collection
and private trash businesses because haulers and communities might stop collecting plastic items
for recycling because the disposal cost is no longer offset by sales. Conversely, a 2015 series of
earthquakes in Chile, a copper producing country, significantly reduced ‘virgin’ copper
production thereby increasing copper prices for local scrap dealers in the U.S. and created a
demand for recycled copper from any source including dilapidated houses.

41
While industrial and recycled building materials make up the largest bulk of traded waste
commodity materials, electronic devices containing rare earth materials are particularly valuable.
Recyclable items made from materials such as wastepaper, scrap metal, and plastics, among
many others, have become a major part of global international trade. This trade often flows from
waste generating developed countries to waste processing developing countries. Some items,
such as glass, remain a locally traded commodity due to high transportation costs and a declining
market for glass made products. Transportation for secondary commodities generally will only
be cost effective over short travel distances, and while the market may be international in scope,
the process itself is largely confined to local waste markets.
Decisions that impact the global exchange of waste commodities are not always directly related
to the specific waste commodity involved. For example, industries in states and countries
compete against each other for secondary commodities, which in turn, compete with ‘virgin’
commodities. Some waste items retain higher value in the secondary commodity market based
on purity and proximity to the ‘virgin’ commodity. However, this is not always feasible or a
desirable option that is open to municipalities or businesses that must weigh the cost of waste
commodity collection with other priority needs. Waste is often a hand-to-mouth proposition that
is highly subject to even small events, such as snow, that can delay waste pickup, to large global
events such as market crashes. Underpinning all this is the potential impact of changing
population growth and population density (Beukering, 2013; McKinsey Report, 2016; Swiss
derivatives, 2015; Pew, 2015; Veryspatial, 2016; United Nations Comtrade Database).
Population and the waste system
Solid waste generation and disposal is often shaped by geographic region, population density,
and economics. Even though population density is a defining factor in the waste material market
owing to the complexity involved in providing services to different geographies and population
densities, the ability to provide waste services tend to be treated as being homogeneous across
the United States. Waste worldwide, from small haulers to multi-national conglomerates, is still
based on the same basic principle of competition by haulers for territory, land, and cheap
disposal options. Market share is often based on obtaining contracts, often decades-long in the
making, to valuable population dense areas. These contract territories can be fuzzy because

42
multiple contracts can be differentiated between business and residential. Waste generated by
events such as sporting occasions, outdoor concerts, and school graduations are often overlooked
even though these can equal, or exceed, ‘every day’ trash collection quantities. Food waste
generated, at home, by retailers, and during events, is homogenized with other types of waste
which can obscure the figures (Jones 2006; Rathje 1992; Reynolds et al., 2014; USDA, 2015).
Many areas in the United States lack the population density and quantity of waste or
transportation routes to support a trash pickup service, let alone a recycling service. Haulers
often rely on informal negotiations that are dependent on local circumstance and
knowledge. Information on these haulage routes is often worth large amounts of money,
sometimes millions of dollars, and are rarely, if ever, shared. Once again, this can contribute to
the under-counting of waste.
If waste is treated as a homogenous entity, then, so too are the waste behaviors that are shaped by
local populations. Communities are often treated as though waste behavior has no impact on
waste generation or disposal, even though waste behavior research has found that improper
disposal by industry is heavily driven by the need to minimize costs and maximize profits.
Improper waste disposal can be caused by prohibitive cost, lack of proper disposal outlets, or
most often what educators term ‘fossilized knowledge’ or lags in training or best practices
(MacLennan et al., 2014; Aksan et al., 2019; Dijkema, 2000; Scerri, 2009). Fossilized
knowledge can be promulgated and passed down within a community in the guise of tradition
(MacLennan et al., 2014; Scerri, 2009). Waste services are not standardized across the U.S.
which complicates matters since each hauler, municipality, or neighborhood have their own rules
about what constitutes ‘proper’ waste storage, handling, and disposal. The National Waste and
Recycling Association President and CEO Sharon Kneiss believes that waste contamination
occurs in part, due to ‘aspirational recycling’ or waste behavior “where people with the greatest
intent believe you should be able to recycle this, so the logic is, (the processors will) figure it out.
It just, unfortunately, doesn't work that way." (ISRI, 2014). Aspirational waste behavior happens
when the public does not differentiate between the variations in waste disposal options
applicable at their location relative to generalized waste education, consumer advice, or public
outreach based on an often-homogeneous perception of waste disposal. For many residents,

43
knowledge about correct waste disposal has fossilized at a certain stage of learning, such as in
elementary school when most people learn waste disposal practices, or from their parents, or
later during career preparation. This is reflected in the former practice of ‘dilution is the solution
to pollution’, a practice that led to low-level toxins and prescription drugs being present in the
water supply. Many residents were told by home care attendants, for example, to flush
prescription drugs down the toilet; some dump paint down sewer and storm water drains; and
contractors empty buckets containing blacktop residue onto lawns. These actions are not
questioned if they align with received knowledge of waste disposal often emanating from what
an individual’s parents practiced, what they learned in school, or what a professional advocated,
even if these conceptualizations are wrong.
Waste disposal behavior can also be shaped by different worldwide conceptualizations of solid
waste and who is the responsible body for the collection and treatment of different types of
waste. Municipalities have differing conceptualizations of waste which impacts everything from
creating waste collection and disposal programs to metrics for measuring waste disposal
success. Municipal jurisdictions vary and so too their responsibilities for the collection and
treatment of different waste types. For example, many municipalities have ceased collecting
waste as a public entity but rather issue licenses to private sector waste companies (Foggarty et
al., 2008). Termeer et al. (2010, p.29) consider, “There is a trade-off involved here: while a small
municipality will not have the capacity to deal with complex environmental permits, a big
municipality could risk losing political trust among its citizens.” Widely publicized incidents
involving loss of public trust have occurred in locations such as Beirut, Naples, and New York
City. Love Canal remains one of the worst environmental disasters in U.S. history. Caused by a
seemingly innocuous decision by the local government, and like many such municipal waste
decisions, Love Canal was a cost saving measure to use the abandoned Love Canal near the
Niagara River, Niagara Falls for waste disposal. Between 1942-1953 the local government gave
the Love Canal site, a former free municipal waste dump adjacent to the working-class Love
Canal neighborhood, to Hooker Chemicals and Plastics Corporation (now Occidental Chemical
Corporation, or OXY) to use as a chemical waste dump. Hooker Chemicals and Plastics later
sold the site back to a residential builder and the local school board with a codicil in the property
deed absolving the company of any future liability. The buried chemical waste leached out via

44
previously unknown underground swales into the local sewer system and creeks which after hard
rains flooded neighborhoods with contaminated water. Louis Gibbs and other parents suspected
that the Niagara Falls elementary school playground built over the canal was making children
sick and the Love Canal parents used local knowledge to link the swales to illness clusters and
the chemical waste dump (Haraway, 1988; Temper et al., 2015). Complaints to New York State
officials went unheeded until national media drew attention and caused President Carter to twice
declare Love Canal as being in a state of emergency. The Love Canal disaster contributed to
public pressure for legislation to make polluters financially responsible for the cleanup of toxic
waste sites. The result was the creation of the U.S. environmental justice movement and creation
of the Comprehensive Environmental Response, Compensation, and Liability Act (CERCLA)
(Superfund Law) of 1980 which identifies and remediates contaminated land (U.S. EPA, 2015).
Waste disposal permeates almost all critical elements of a healthy modern-day society.
Solid waste disposal practices
This author suggests that there are three identifiable epochs in modern waste practices and
beliefs: The Golden Age of Waste, The New Age of Waste, and the tentatively named, Third
Industrial Era. These epochs encapsulate the experiences and practices of the solid waste
profession since the 1940s when waste practices began to extend beyond the hyper-local
community.
The Golden Age of Waste, which extends from about the 1940s to 1980s, shaped the current
public and political perception of waste practices as local municipalities built and owned
traditional landfills (now considered dumps) following the World War II manufacturing boom.
These precursors to modern landfills proved to be profitable enterprises as American waste
generation increased by a staggering 65% during the period, reflecting the symbiotic relationship
between waste and consumption. Dubbed the ‘disposable age’ by Time-Life, companies
marketed product packaging and disposable (single-use or one time use) products invented for
the war effort to baby-boomers with large economic buying power. Disposable product
consumption became a hallmark of modernity in the U.S. and according to the United Nations
and World Bank, the biggest waste producer by volume in the world. Despite this increase in
waste production, major changes in waste practices did not occur until the early 1980s with the

45
development of new landfill technologies, the privatization of many waste related industries, the
rise of the global market in recyclables, and subsequent implementation of the U.S. solid waste
legislation in the face of lax state requirements.
The end of the Golden Age of Waste and the beginning of The New Age is marked by the so-
called Garbage Wars: a period of intense change in the solid waste disposal industry. The 1986
Khian Sea Waste Incident and the 1987 Mobro Garbage Barge Incident marked the start of the
modern recycling movement. The 1986 Khian Sea waste incident involved a cargo ship, the
Khian Sea, which was carrying incinerator ash from the city of Philadelphia (home of one of the
U.S. largest incinerators) that was denied entry into Haiti and then several other countries for
several months before dumping the hazardous ash cargo into the ocean. The Khian Sea waste
incident raised public and official awareness about hazardous waste disposal and led to the
adoption of stricter solid waste regulations in many countries, such as the U.S. Resource
Conservation and Recovery Act (RCRA). The incident also increased the cost of hazardous
waste disposal. In similar vein, Dan Rather called The Mobro 4000 Barge “The most watched
load of garbage in the memory of man.” In this incident an Alabama businessman affiliated with
Long Island mob boss, Salvatore Avellino, speculated that he could convince a landfill authority
on the U.S. east coast or the Caribbean to convert municipal waste to methane without having a
prior contract in place or permission from the target municipalities or ports. As with the Khian
Sea, the Mobro wandered the Atlantic for months having been denied entrance by Mexico and
Belize, before finally returning to New York City and having the waste buried in the same Islip
landfill from which it originated. These two incidents, among many others, raised public
awareness about the changing geography of solid waste and solid waste policy and the process
transformed solid waste disposal from a local to an international and global issue (Brown, 2015;
Cosgrove, 2014; EPA, 2003; MSW, 1999; Rogers, 2005; Taylor and Allen, 2006). In 1989, the
international community drafted the Basel Convention on the Control of Transboundary
Movements of Hazardous Wastes and their Disposal treaty to reduce the flow of hazardous
wastes from industrialized countries to developing countries. The convention's mission was to
regulate the international transfer of hazardous wastes and to ensure that waste was managed and
disposed of in an environmentally sound manner. However, these trade agreements have been
problematic U.S. bilateral agreements overlap, contradict, or fail to address such waste issues.

46
From the New Age of waste onward, the fuzzy nature of waste has been most evident in the legal
proceedings of the U.S. Supreme Court, where many solid waste lawsuits have occurred related
to the Commerce Clause Article 1, Section 8, Clause 3, of the Constitution that empowers
Congress "to regulate Commerce with foreign Nations, and among several States, and with the
Indian Tribes." Lawyers consider solid waste cases, such as state disputes, hauler disagreements,
renewable energy, pharmaceutical ‘take-back’ programs, ‘bottle bill’ recycling laws, brownfield
reclamation and others, as being subject to the Commerce Clause. However, “virtually all
dormant Commerce Clause challenges involve some difficult knots and hidden nuances” and
these are often drawn from local knowledge (Adam, 2014; Gold, 1993).
The 1993 U.S. Municipal Solid Waste Landfill Criteria and the U.S. EPA Integrated Solid Waste
(ISW) programs signified the beginning of The New Age of Waste. Although practices from
The Golden Age of Waste co-exist alongside the New Age of Waste (1990s-2010s), the latter
ushered in an era of globalization in the solid waste disposal industry and the creation of
secondary commodity markets. In addition, environmental impact studies increasingly
emphasize the need for solid waste regulation. U.S. EPA studies connected the contamination of
local hydrological systems to traditional municipal landfills which threatened public health and
water resources and led to an emphasis on waste regulation and proper solid waste disposal. Due
to stricter and more complex international, federal, state, and local environmental regulations
that originated in the 1980s, many municipalities transferred the task of waste disposal, along
with the related environmental liability, to private companies. In response to these stricter
regulations, small waste companies merged into larger multinational private waste corporations
capable of handling all aspects of solid waste disposal including municipal waste hauling,
recycling, landfilling, and toxic waste removal. This all-encompassing solution is often called a
transboundary linear system of waste management (Cash, 2006; Duany, 2000; EPA, 2003;
Goktug, 2014; Klingle, 2007; MSW, 1999; Northrop, 2010; Openshaw et al., 2012; Rogers,
2005; Strasser, 2005; Taylor and Allen, 2006). One unforeseen consequence of these regulations
and mergers was the rise of criminal influences within the solid waste industry: “Beginning in
the 1980s, globalization and the liberalization of international trade policies made it easier for
legitimate entities to conduct business, but it also facilitated the growth of transnational
organized crime—all manner of goods, including waste materials, could more easily cross

47
international borders. More strict environmental laws and regulations concurrently precipitated a
steep rise in the costs of safe and legal disposal, and so it was that the perfect storm of conditions
created the opportunity for the illicit (and cheaper) dumping of nonhazardous and toxic wastes”
(Liddick, 2011, p 13-14).
In 2013, the waste commodities market experienced a worldwide crash which many
professionals regard as the beginning of the Third Industrial Era of solid waste. The market share
of many waste industries fell precipitously and caused fundamental change in the industry. The
worldwide decline began as China, the largest importer of waste commodities, enforced its
Green Fence Policy, the first of many subsequent waste import bans that banned the import of
several types of waste. The bans were in response to internal Chinese policies to promote
investment in domestic recycling facilities and innovation. This action caused many businesses
around the world to reduce trash exports in response to the decline in the commodities market.
Consequently, sustainable materials management (SMM) was conceived involving the use and
reuse of materials in the most productive and sustainable ways across an entire waste product life
cycle. SMM emphasized resource conservation, waste reduction, climate change mitigation, and
minimizing environmental impact of waste materials (U.S. EPA, 2016).
Historically, solid waste was the responsibility of the individual, but this has over time assumed
by local government. The basic waste problem, however, has remained constant throughout
history, in that trash originates from a location, a home or business, and a decision is made to
bury, burn, stockpile, reuse, incinerate, or illegally dump the trash. John Ehrlichman, President
Nixon’s policy chief, expressed the unwritten U.S. policy that “the Federal Government has no
business being in the garbage business” and that waste management policy is based on U.S.
common law or common practice (Johnson, 2014). Even as trash policy has become more
involved, there is a tendency to simplify an inherently complex trash disposal system. Disposal
remains a personalized experience and is heavily dependent on local knowledge. The solid
waste industry encompasses many political, technological, service, and environmental activities
that transcend the local and involves multiple government agencies and policies, differing
disposal needs, and the reality of varying spatial and trans-boundary issues. Added to these
elements are the many constituents, actors, and actions that make up small ‘p’ policy. Many

48
private companies, associations, and organizations in the waste disposal system operate under a
system of best practices rather than one of regulation. This is especially true concerning
municipal solid waste. In 2015, The American Society of Civil Engineers (ASCE) wrote Policy
Statement 516 Municipal Solid Waste Management, which was approved by the Federal Energy,
Environment, and Water Policy Committee. The policy asserts that the ASCE supported federal
and state legislation to promote, enhance, and facilitate development of resource recovery
facilities, including those for recycling, composting, energy recovery, and waste reduction
technologies. for the reduction of waste generation. The ASCE also indicated support for the US
Environmental Protection Agency’s Resource Conservation Challenge (RCC) strategic plan
which sought to achieve a national recycling rate of 35% for municipal solid waste. The RCC
promoted the beneficial use of secondary materials, and toxic chemical reduction, along with the
reuse and recycling of electronic devices. However, the ACSE opposed federal legislation that
would ban the interstate movement of municipal solid waste to regional solid waste facilities
even though designed under state and federal regulations because many private waste services
had invested in transboundary, linear waste systems that would be severely impacted.
Jurisdictions and autonomous waste disposal
For many municipalities, waste management implementation is often problematic because
municipal waste practices and regulatory policies can conflict at the municipal, state, and federal
levels. Berman (2015) found that such conflicts between local and state government often had
historical roots in legal, political, and intergovernmental politics. Thrift (1983) suggested that
political outcomes are usually place-specific because knowledge is interpreted through the
varying contexts of institutional memory, local knowledge, and traditions. Some states create
constitutional amendments giving specific municipalities home rule and the authority to pass
their own laws and procedures for trash removal. In the U.S., two types of home rule give
governmental groups, county commissions or board of supervisors, jurisdiction over
unincorporated areas including important zoning issues. Dillon’s Rule (1868) upholds a narrower
interpretation of a local government's authority, whereby a local government may engage in an
activity only if it is specifically sanctioned by the state government. Unlike home rule, which
gives greater authority to substate municipalities, Dillon’s Rule is sometimes used by states that
want to give municipalities limited home rule to determine the bounds of its authority (Berman,

49
2015; Silva et al., 2015; Povich, 2021; Thrift, 1983). Approaches to the waste system certainly
differ between urban and rural areas, but even within urban areas these policies vary markedly.
Denmark, for example, “provides more frequent waste collections for more densely populated
areas and provides customized infrastructure for those in flatted accommodation while in Seattle,
targets for recycling and composting are lower for residents of flatted accommodation.” (Fogarty,
H. et al., 2008).
Local Waste Disposal strategies
The most studied form of waste, although not the largest in quantity, is municipal solid waste
(MSW), known as trash or garbage, which comprises everyday household items such as product
packaging, grass clippings, furniture, clothing, bottles, food scraps, newspapers, appliances,
paint, and batteries. Municipal solid waste originates from homes, schools, and local
businesses. All municipal solid waste management comprises the same choices of either disposal
through internal or external management systems. Handling solid waste internally gives
municipalities greater control over what is collected and where the trash is disposed. In some
instances, it can also reduce budget costs by using construction debris as clean fill on municipal
projects, for example. Municipalities are then free from profit-making pressure or paying taxes
on profits. However, internal waste management can be cost prohibitive in terms of personnel
and equipment, as well as being logistically difficult to operationalize or sustain. A municipality
can contract waste management control to external private service providers. This option is
often chosen by densely populated municipalities because private contracts typically require less
personnel and can be cost-effective. The waste, however, can only be managed in specific ways
determined by the service provider such as by collecting, hauling, incinerating, recycling, or
landfilling. When localities create bonds based on revenue from recycled materials, waste-to-
energy (WTE) production, or other waste generated resources, it often requires a steady flow of
revenue for the life of the bond (Gold, 1993). Municipalities, states, and interstate regions often
try to increase correct disposal by creating economic incentives for recycling, establishing fines
for not recycling or littering, or promoting public education on proper disposal. However, while
financial motives may provide a strong incentive for recycling in many municipalities, when
market prices fall, many local authorities stop recycling. Tucker (2011) posits that every locale

50
has jurisdictional problems with public services, which tend to have overlapping and often
conflicting jurisdictions shaped by geography and local history.
In the past, many individuals have dealt with trash by throwing it over the hill into valleys,
dumping it into or near flood plains where it could be carried away, dumping it into karst
hollows or caves in the ground, or disposing of it in other hidden from sight areas. While no
longer considered appropriate solid waste management, these are still common ways for
residents and companies to dispose of unwanted trash. The U.S. EPA created a waste ranking of
the most desirable management methods which include cleaner production, sustainable
consumption, and prevention methods for reusing waste in its current form (reduction and reuse),
processing waste to recover commercially valuable products (recycling/composting), and the
least desirable method of safe disposal in a landfill (residuals). Of these options, landfilling
remains one of the most feasible and commonly practiced methods of waste disposal for most
areas in the U.S.
Solid waste professionals differentiate between a historic landfill or ‘dump’, usually a hole in the
ground where waste had been essentially dumped, and a landfill, which is an engineered and
correct means of waste disposal. The public, even those who live near landfills, often believe
their waste goes to a ‘dump’. Confusion about dumps versus landfills occurs so often that
landfills are often labeled ‘dumps’ for clarity in online and phone directories. However, dumps
are banned by federal regulation because of the consequences that arise from the waste dumped,
regardless of waste type. Legacy waste sites, especially of hazardous waste, are often
unrecorded and as with brownfield sites require special handling to identify and mitigate
potential dangers (Colten, 1990; DeSousa, 2005). In the case of above ground and underground
tanks the U.S. EPA Solid Waste Management Act maintains regulatory power. The water
contamination of the Elk River in West Virginia on January 9, 2014 is indicative of the need for
special jurisdiction over such abandoned waste. The transition from dumps to current closed-
system landfills was challenging for many because U.S. federal law regulates closed landfills as
brownfield sites requiring cost-prohibitive remediation for subsequent uses. Landfills that have
been closed have also become a growing problem because competition for land has led to
construction on former dumps that are unmapped or forgotten. The U.S. EPA Hazardous and

51
Solid Waste Amendments of 1984 (HSWA) revised the criteria for landfills which receive
hazardous household waste or small quantities of industrial hazardous waste. As new materials
and waste by-products are created, the HSWA modifies its policies and disposal methods. To
reduce landfill disposal and transportation costs, for example, municipalities now give away
wastewater sewage sludge to farmers as cheap crop fertilizer. Until recently, this practice was
considered to have an innocuous impact on areas and local waterways until the sludge was found
to contain residue from medications and heavy metals (Kaufmann, 2014; Taylor and Allen,
2006; Thompson, 2009).
Incineration is often an alternative to landfills and is used to burn municipal waste. These plants
have come under strict regulation, however, due to emissions containing carcinogens, heavy
metals, and other particulates. Incinerators are typically located outside suburban areas but in
low-income areas which place low-income households and minorities at risk (Melosi, 2005).
Waste-to-Energy (WTE) uses waste incineration to create energy through heat. However, the
large volume of trash needed for WTE requires a densely populated area to supply the necessary
quantity of waste and this can often cross several municipalities or even states.
Recycling is a rapidly growing alternative to landfill disposal and is often the first environmental
civic act that parents and children do together. Every municipal or private recycling service,
whether curbside or drop-off, has its own rules about what can be recycled. In the Institute of
Scrap Recycling Industries (ISRI) poll, 28% of recyclers said the recycling challenge was
"understanding what types of plastic my municipality accepts in their curbside recycling
program.” (ISRI, 2018). Some recycling services take plastic bags, but many do not. A few take
Styrofoam, but the majority do not. It is important for residents to know and practice the rules to
avoid contaminating the recycling stream.
The link between energy extraction and recycling is often overlooked, even though the by-
products of energy extraction are used to create materials like plastic and synthetic rubber that
are recyclable. Plastic exemplifies this relationship. A 2013 Nature article summed up the
characterization of plastics as solid waste with its title "Policy: Classify plastic waste as
hazardous" to give environmental authorities greater power to counter its impact on people and
the environment (Rochman et al., 2013).

52
The ‘dormant’ Commerce Clause has become a way for the waste industry to compete by
challenging laws involving recycling, landfill, and incinerator waste reduction, or those that
impact the importation of waste. Some states do not use federal regulation to deter the import of
large volumes of waste from waste-exporting states such as New York. Rural states with lower
disposal rates and low-cost land, such as those in Appalachia and the Midwest, are considered
more attractive for landfills and incinerators than those areas with higher property costs such as
Massachusetts. Pennsylvania is a top waste importer though in 2015, U.S. Senator Bob Casey
(D-PA) introduced the Trash Reduction and Sensible Handling Act (TRASH) to restrict the flow
of out-of-state waste into Pennsylvania and impose higher fees for disposal. In 2014, the state
accepted waste from 21 states, the District of Columbia, and Puerto Rico. New Jersey sent the
most, 3.5 million tons (Arosova et al., 2008; Breitenbucher, 1997; Kimmel, et al., 2014; Harper;
1991, Heinzerling, 1995; U.S. EPA, 2015; UN Basel. int, 2015).
The culmination of educational campaigns and outreach is that many municipalities, universities,
and some countries such as Sweden, have adopted the goal of zero waste. However, unlike
companies which have centralized control, the flow of waste in and out of an area is more
difficult to regulate or implement, making the recycling or reuse of all items unachievable
(Kurdve et al., 2015; Mann, 2015; Kondo et al., 2014).
Finally, there exist a growing number of alternative means for dealing with waste, especially
non-municipal waste. These include tire collection events, non-profit runs, thrift stores, for-
profit consignment shops, church rummage sales, and other non-profit collections such as textile
or aluminium can drives. Informal waste sector activities even include dumpster diving and trash
picking in the search for sellable or reusable items. The evolution of the Maker Movement and
the emergence of online stores such as eBay and Etsy have shifted the informal waste sector into
the mainstream with upcyclers and others competing with traditional pickers, often the homeless
and poor (Peppler and Bender, 2013). Pre-cycling, is the preferred method for integrated solid
waste management by the U.S. EPA because it addresses the creation of waste at source before it
is purchased but involves implicit judgments over modes of consumption (MacLennan and
Stiller, 2012).

53
The solid waste industry is thus complex and varied in the stakeholders involved. The
spatial narratives associated with the case study of Monongalia County, WV reveal
further complexities about the spatial nature of the solid waste system.

54
Chapter 5 The WV solid waste system and policy
framework
Policy at the macro level, the Big P, provides the framework around which the regulatory system
operates on a daily basis, small p policy. The solid waste challenges faced by West Virginia
reflect many of the issues and evolving problems associated with trash and trash transportation.
In seeking to create an exemplar geospatial policy-shed system for Monongalia County in West
Virginia it is necessary to narrow the policy framework to the state and county level and from
there develop and codify the hundreds of laws, regulations and best practices associated with
solid waste disposal and that apply to what is a surprisingly large and varied number of spatial
units. Subsequently, this codified regulatory structure is geospatially mapped as policy-sheds
that display a spatially defined regulatory system for solid waste that illustrates not only the
spatial complexity of the system but areas of omission and commission and conflicting
regulatory protocols.
The West Virginia solid waste system
As a rural state, formal waste services in West Virginia came later than in many other states in
the U.S. and many households and businesses used non-documentable disposal methods. In
response to domestic pressure to establish correct waste disposal approaches in West Virginia
and the need to satisfy the 1976 Resource Conservation and Recovery Act and associated
regulations, the state created the first official solid waste management organization. The
Resource Recovery-Solid Waste Disposal Authority was established in the Department of Health
and later became the Solid Waste Management Board (SWMB). The SWMB later became part
of the Department of Environmental Protection and sought to eliminate dumped car and
appliance sites and instituted the daily covering of landfills with soil. Until 1992 no official
statistics concerning solid waste in West Virginia are available but in that year the first waste
study undertaken on the Feasibility of Volume-based Collection Fees for Private Waste Hauler
(Ackennan, Breslow, Samuels, 1992). The study was conducted by the Boston-based Tellus
Institute, an environmental resources strategy non-profit, in partnership with the West Virginia
Public Service Commission (WVPSC), West Virginia Solid Waste Management Board

55
(WVSWMB), and the West Virginia Development Office (WVDO). With the intent to create an
economically sound waste practice for the state, the study found that multiple definitions of
waste were in use in the state which had contributed to significant variation in solid waste
estimates. Even after implementing labor-intensive manual waste audits to fortify the study, the
relative scarcity of state-specific information coupled with omissions due to exempted cities not
subject to WVPSC regulation, impeded any actionable strategy being implemented for West
Virginia solid waste. The report ultimately concluded that local communities were best able to
determine how to meet local needs albeit such actions might impact adjacent areas. It was
determined that the state Public Service Commission (PSC) would implement the checks and
balances for the ‘system’ and resolve any such conflicts (Problems Associated with the
Management of Solid Wastes: Is there a Solution in the Offing?, 83 W. VA. L. REV. 131,
137,1980; WV Feasibility Study, 1992).
In 1995, a report made to the State of West Virginia examined the economic costs of
Intermediate Resource Recovery Facilities (IRRF) based on an analysis of waste data garnered
through landfill audits. The study found that waste in West Virginia consisted of a dozen major
categories each linked to a specific end-use industry and waste cycle. These categories
comprised paper (25%), plant material (vegetation) debris (25%), wood (10%), plastics (7%),
glass (5%), metals (5%), reusable goods (5%), putrescible (food waste/compostable) (5%),
ceramics (5%), textiles (3%), soil (3%), and chemicals (2%) (Gorell, Evans, Diener; 1995).
These categories, however, did not specifically identify electronic waste (E-waste), specialized
wastes such as household hazardous waste (HHW), low-level radioactive waste, prescription and
medical waste, or industrial waste such as fracking waste.
In 1997, a comprehensive waste characterization study by the WVSWMB indicated that the
average per capita waste generated in West Virginia was 4 pounds per person per day, noticeably
less than the EPA national average (EPA, 2015). However, despite attempts to collect data
according to EPA standards, the WVSWMB waste characterization report concluded that the
lack of a reliable reporting system encompassing all waste including recyclables and non-MSW
waste made it difficult to accurately determine waste data for the state. In 2015, some 1,189,021
tons of classified municipal waste was recorded as being deposited in 18 landfills, but a further

56
810,727 tons of ‘special’ waste, such as industrial sludge, petroleum contaminated soil, industrial
waste, drilling waste, and construction and demolition waste was also deposited in landfills
(WVSWMB, 1997; WVSWMB, 2015). In West Virginia specialized waste from coal and gas
processing are unclassified because they are treated as a useable by-product even if most of the
waste goes to landfills. Reliance on the self-reporting of waste further exasperates data
collection and waste classification (WV Feasibility Study, 1992). In addition, the waste arising
from small-business, home-businesses, and micro-businesses with less than five employees,
which account for almost 90% of West Virginia businesses, are absent from almost all U.S. data
analysis (MacLennan and Stiller, 2015).
Despite the lack of reliable waste data, it is suggested that West Virginia experienced the three
epochs of solid waste management albeit shaped by its unique geography, history, industry, and
land-uses. Until recently, what was considered waste in other regions was not typically
considered as waste in West Virginia (Ackennan, Breslow, Samuels, 1992; Jackson et al., 2008).
The state has many isolated communities where materials are repurposed and taken out of the
waste stream. Thus, scrap metal, tires, and industrial waste are often repurposed and private
recyclers and independent small waste haulers such as scrap metal merchants, self-provisioners,
tinkers, and others play an important but often unnoticed role in ‘waste disposal’.
Many West Virginia solid waste practices stem from the state’s resource extraction and
manufacturing past. Company towns, for example, acted as the de facto local government and
established waste practices that were often based on ‘gentleman’s’ agreements and these
continue today. In the 1920s some 80% of West Virginia miners lived in company owned
houses though company towns were also based on glass, metal, and chemical industries. Over
past decades, municipal and industrial waste dumpsites filled entire valleys and many are
unmapped. In 1970, for example, Senator Robert C. Byrd wrote in his ‘Byrd’s-Eye View’ about
his concern for the mountains of trash and the numerous trash dumps. Instances of such past
dumpsites continue to cause problems such as when a former battery dumpsite caught fire when
acres of tires dumped by haulers caught fire and caused an emergency situation as black smoke
particulate settled in the D.C. area. Uncontrolled open dumps are a recognized problem in West
Virginia and affect both public and private property values and land use. The decline of the
extraction economy, however, has caused many of these company towns to decline leaving local
government and waste agreements in a legacy limbo. Company town culture could be said to

57
remain engrained in municipal and state solid waste law. One example of this engrained
company town culture are the community expectations that have grown out of past practices such
as the landfill ‘Free Day’. Free days are a West Virginia tradition whereby residents, “not in the
business of hauling or disposing of solid waste”, can dispose of solid waste for free at certain
solid waste landfills though not at transfer stations (W. Va. Code § 22-15-7). Many
municipalities and landfills have considered imposing limits on the ‘Free Day’ but have incurred
significant resident opposition who consider it a ‘common good’. In 2016, the private Raleigh
County Landfill counted upwards of 1,000 vehicles on such a free day.
Some counties now have transfer stations instead of landfills and independent haulers and family
businesses, which West Virginia’s Small and Independent Hauler Association believe personify
West Virginia’s can-do heritage, undertake the role of solid waste removal. Many independent
haulers have updated their practices and equipment to stay competitive in the midst of clients
unwilling to see fees increase from past historic low rates. One hauler family business created a
makeshift transfer station in their barns and outbuildings before transferring the waste to a near
landfill facility. However, the area became a dumpsite and it took a 15 year joint effort between
state organizations including the EPA, the Department of Environmental Protection (DEP), the
Pollution Prevention and Open Dump Program (PPOD), the Monongalia County Commission,
and Monongalia County Public Health to remediate the property and the uncooperative elderly
owner was fined and incarcerated. Ultimately, the agencies paid for what had become a
brownfield site to be cleaned-up but despite the dump site’s impact on health, safety, and
property values, some residents still felt the punishment was arbitrary and harsh for a family
business that had provided consistent service over the decades. Modern waste disposal requires a
paradigm shift in waste behavior, but local community viewpoints on waste disposal can vary
and diverge from official norms and long-established practices such as trash burning linger on.
Such cultural traits and behavior concerning trash is reflected in West Virginia which with
Washington are the only states that regulate solid waste as a utility through a state Public Service
Commission (PSC) with established hauling territories assigned to PSC-certified haulers.
Residents do not have to use waste services by law but do need to provide proof of correct
disposal. Part of this approach can be seen in the rural economics of solid waste disposal.
Thompson (2015) reported that, “West Virginia did not have even the protection of landfills.
Much of the state did not even have access to regular solid waste collection services. Because a

58
sustainable waste business relies on trash volume, high population density, and low travel costs,
West Virginia, a low-density, mountainous state, was not profitable for many haulers who
focused on population dense WV cities with calculable waste”. West Virginia became the only
state with a comprehensive regulation of solid waste landfills to ensure public access. Aspects of
the management of solid waste was divided among several state agencies including the
Department of Environmental Protection, the Public Service Commission, and the Solid Waste
Management Board. In many West Virginia counties, solid waste authorities, litter control
officers, and landfills were also established. The WVDEP monitors industry and communal
impacts, mine water run-off, illegal dump clean-ups, the Governor’s REAP (Rehabilitation
Environmental Action Plan) program, and the State Recycling Coordinator’s office. The
WVSWMB coordinates with county and regional solid waste authorities to provide planning
help, solid waste management grants, and solid waste disposal revenue bonds. The WVSWMB
is responsible for the West Virginia Solid Waste Management Plan.
Waste management in West Virginia is based on wastesheds as mandated under the Federal
EPA Resource Conservation and Recovery Act of 1976 (RCRA) (Figure 5.1) and similar to the
concept of watersheds (Figure 5.2). The RCRA wastesheds empower state and local authorities
to qualify for federal aid. The West Virginia Resource Recovery - Solid Waste Disposal
Authority, now the WVSWMB, defined wastesheds based on geographic regions with similar
demographic characteristics in order to promote shared best practices and management practices
(W. Va. Code § 22C-3-9). Since its inception, the WVSWMB has maintained monthly
municipal solid waste tonnage estimations based on these wastesheds. This process has given
them on-the-ground insight into the operation of waste management and its recording. In some
states such as Oregon, wastesheds are defined based on county boundaries, whereas because
accurate waste characterization depends on population density, states like West Virginia created
wasteshed regions. These artificial regions are effectively static, irrespective of changing
population characteristics. However, wastesheds rarely serve other administrative uses beyond
waste management. The American Society for Testing and Materials (ASTM) D 5231-92
waste composition analysis protocol is used to measure municipal solid waste (Bobman and
Culbertson, 2010). ASTM International is a for-profit company that establishes voluntary
reporting standards. Wastesheds have become the de facto method for settling waste disputes
and are used in legal disputes brought before the WV Public Service Commission. As
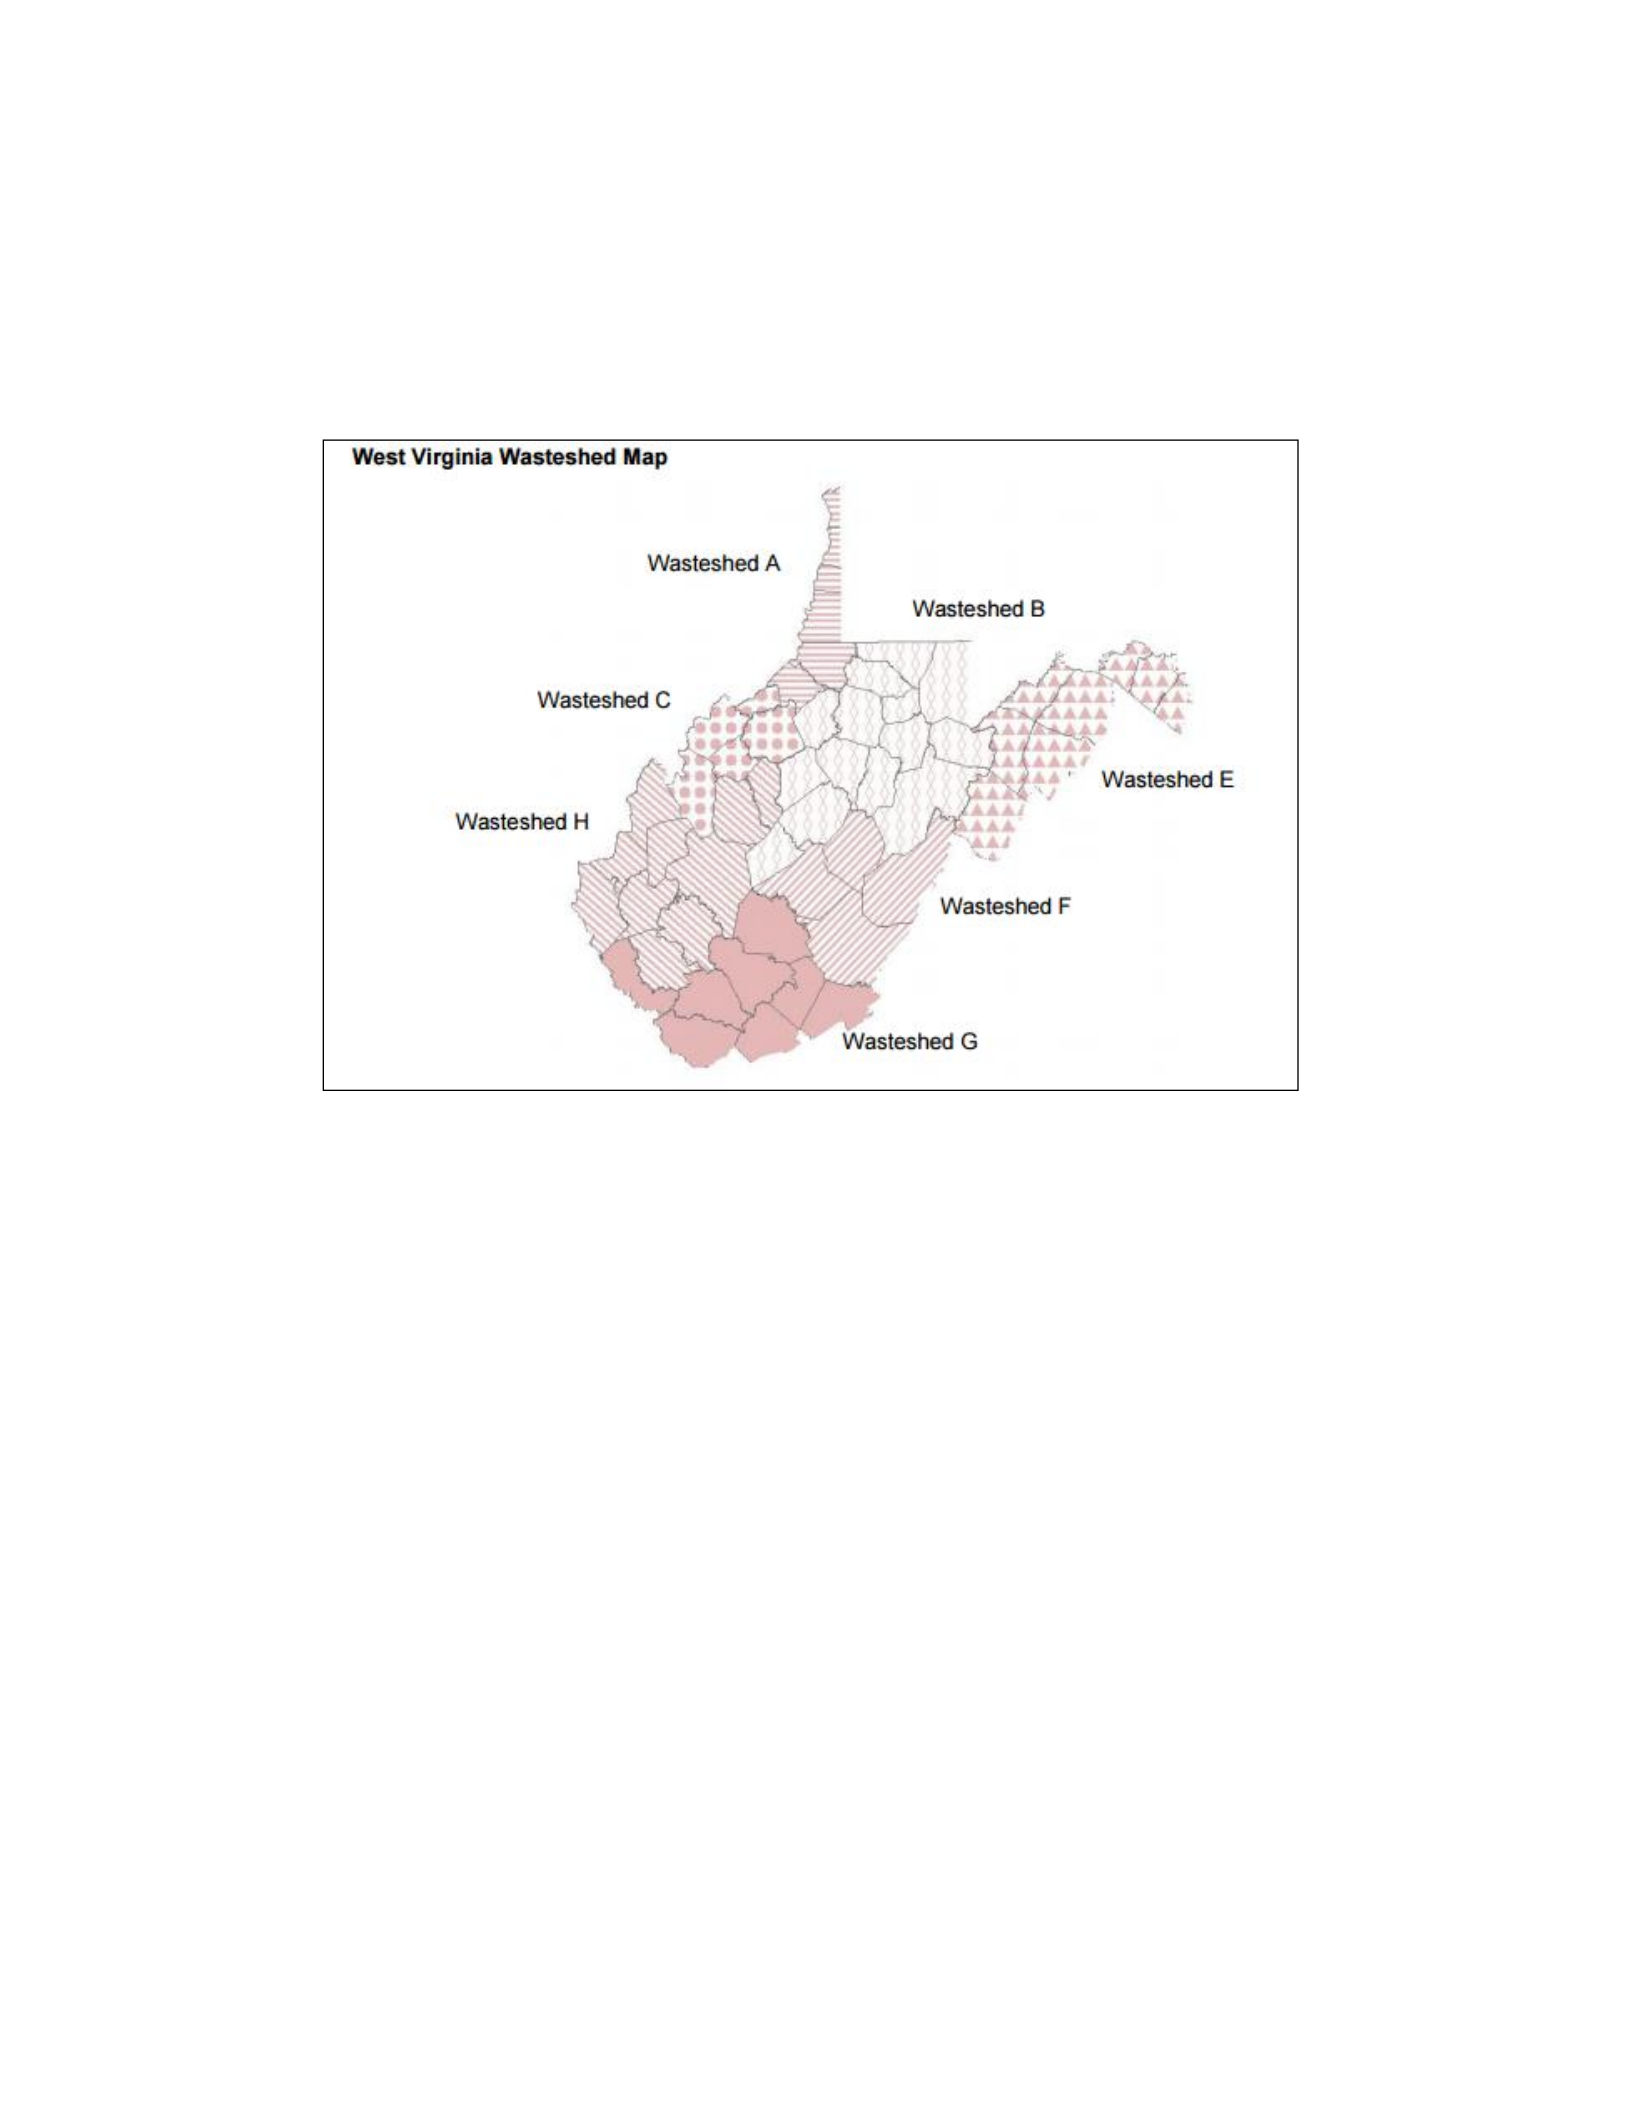
59
artificially defined units, wastesheds can be problematic not least because they do not transcend
state lines (McGowen, 2015).
Figure 5.1: West Virginia Wasteshed Map Source: 2016 WVSWMB Report
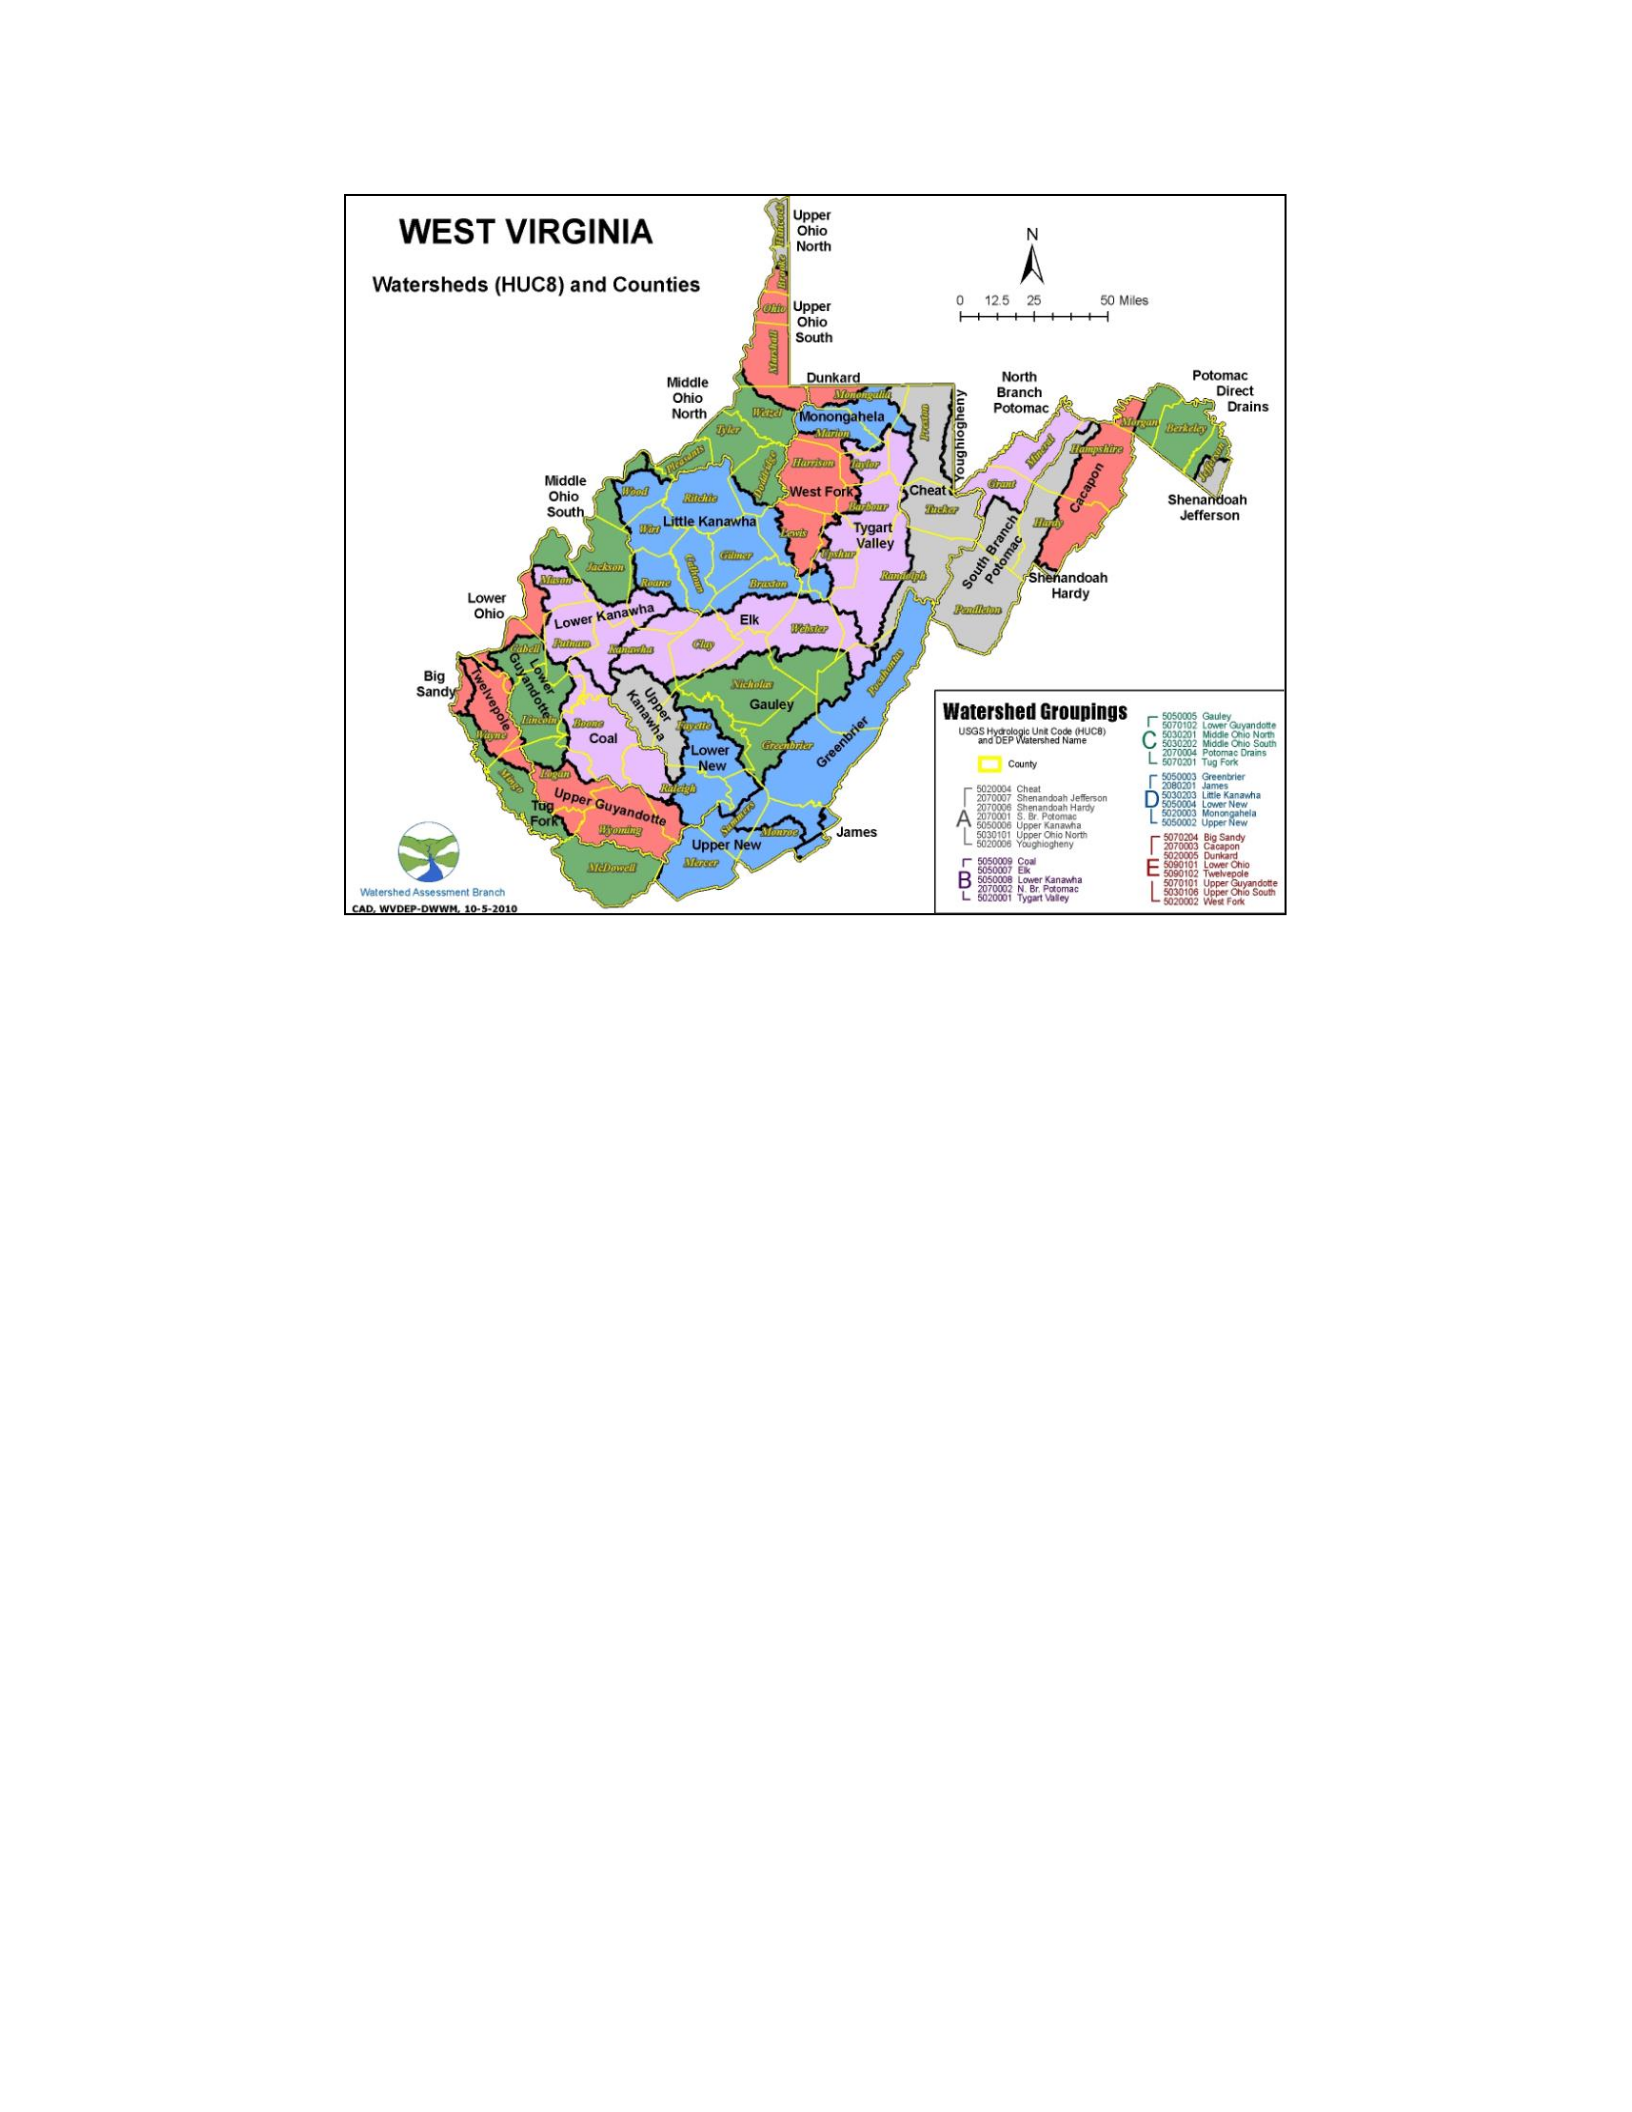
60
Figure 5.2: West Virginia Watershed Map Source: WV DEP
West Virginia solid waste disposal practices
The WVPSC has statutory authority over solid waste such as flow control and can direct where
solid waste “generated in the surrounding geographical area of a solid waste facility be
processed or disposed of at a designated solid waste facility or facilities” (W. Va. Code§24-2-
1h). However, even this designation caused concern for the WVSWMB because solid waste
management in the state requires the ability to predict the movement of solid waste into or out
of the state, “This ruling has impacted the solid waste market in areas adjacent to West Virginia
borders, resulting in greater exports of solid waste by out-of-state haulers, and a resulting loss of
market-share by certified local haulers and disposal facilities. This trend has had a negative
impact on the collection of solid waste assessment fees and on the revenue of local disposal
facilities and has consequently generated interest in implementing flow control in some areas to
require local waste be disposed of at local facilities” (WVSWMB, 2016). The WVSWMB
promoted an integrated solid waste management plan though there are numerous instances
where solid waste was and is treated in isolation with seeming exceptions to an integrated solid
waste infrastructure. One local example would be the case of a large shopping center in

61
Morgantown, WV, for which waste collection was not planned or implemented until after the
stores were in operation and when access roads had to be built retroactively for trash trucks to
access the buildings (MacLennan and Bergeron, 2014).
For most local solid waste authorities in West Virginia the primary concern is acquiring and
permitting sufficient land for a landfill or transfer station to be created. Disputes with
surrounding neighborhoods are common. Supporting these landfills are a myriad hauler
companies that collect and dispose of the municipal waste and whose routes are regulated as a
public utility. The WVPSC uses established route tariffs to assign territories to solid waste
haulers. These route tariffs, however, exist only in text form and no maps have been or are
produced for these territories (MacLennan and Bergeron, 2012). Often, these tariffs can be
confusing because territory in one tariff area will overlap with another hauler’s territory
particularly when one hauler might cover residential areas while another covers business waste
for the same area. Competition for hauler territories is fierce and the most common formal
complaint to the WVPSC involves territorial disputes and permits. Many lawsuits are between
large mega-hauler companies, such as Republic Services of West Virginia, and other haulers or
waste organizations. The relationship between the WVPSC defining hauler territories and
transportation routes even when awarded by the WVPSC are problematic. MacLennan and
Bergeron (2012) sought to translate the narrative-based tariffs into an accurate GIS data layer for
a small town in north-central West Virginia but were confronted by a lack of detail in the older
tariffs and the use of boundary conventions that had changed. In contrast, more recent tariffs
issued to larger companies are more detailed and give more specific locational information on
territory boundaries (Figures 5.3 and Figures 5.4). Further, while the WVPSC tariffs are a matter
of public record, most solid waste haulers are reluctant to make customer lists available to solid
waste authorities, even though this is an annual requirement of the WVPSC. Knowledge of
hauler routes is integral to the value of a competitive waste company.
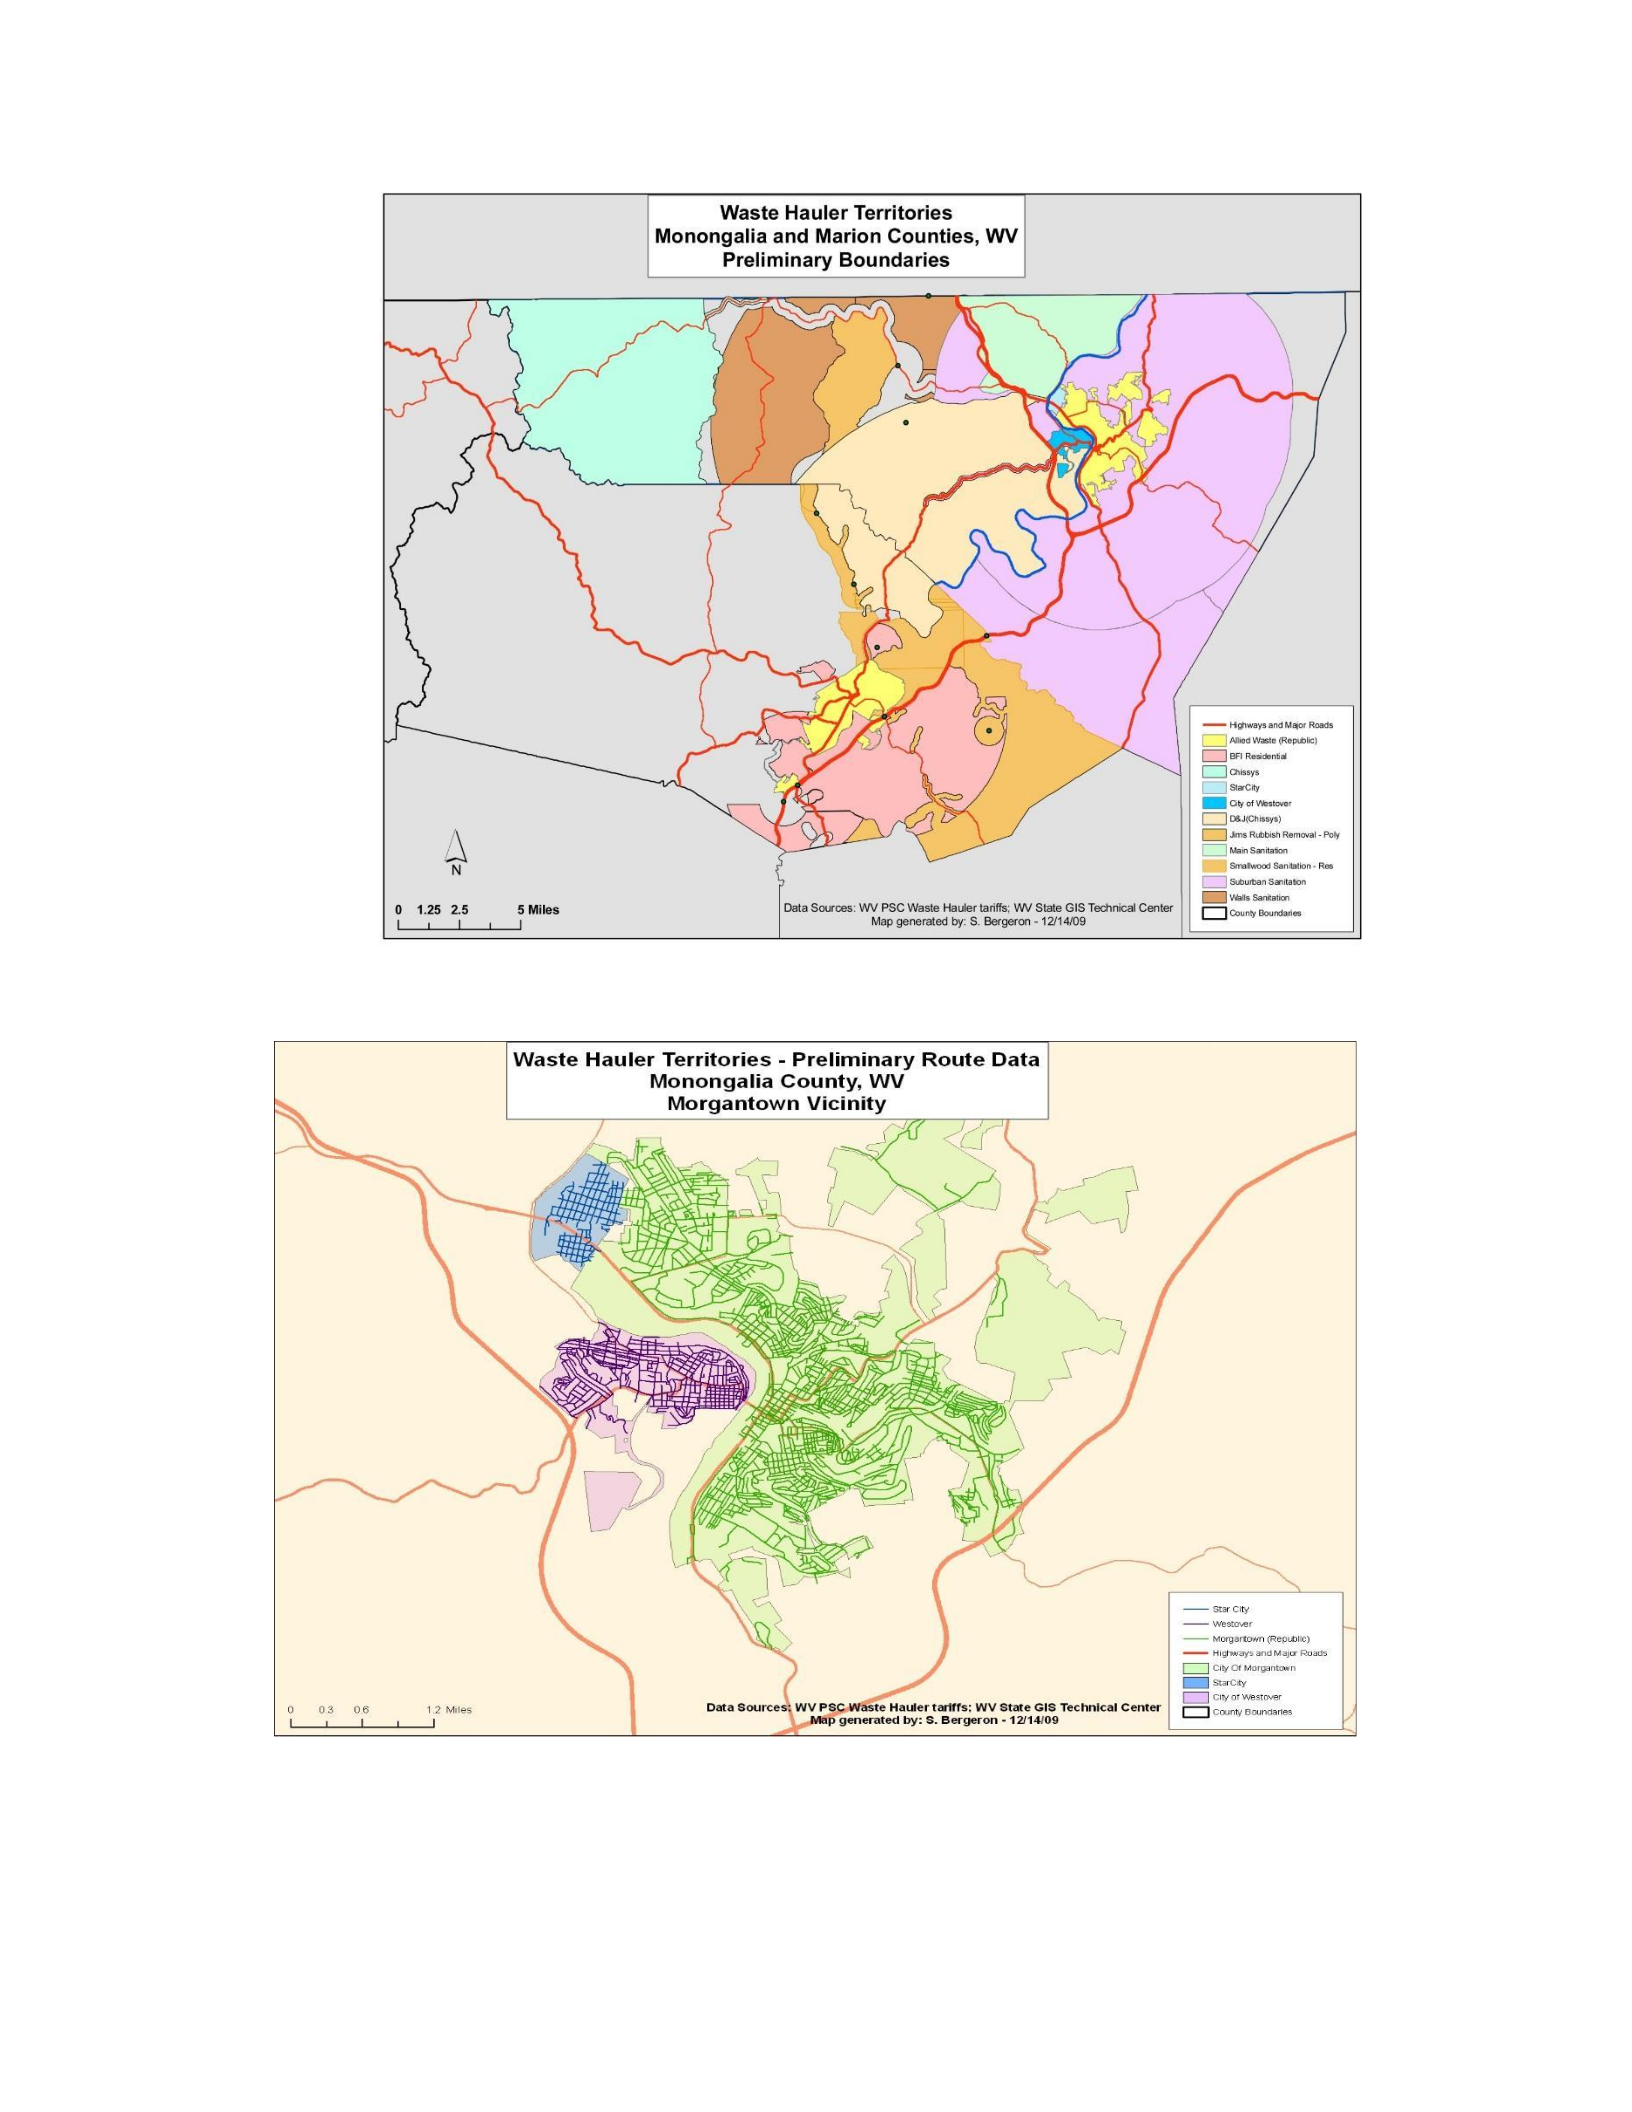
62
Figure 5.3: Preliminary hauler boundaries Source: (MacLennan and Bergeron, 2012)
Figure 5.4: Monongalia hauler route data Source: MacLennan and Bergeron, 2012

63
West Virginia and the Garbage Wars
While the focal point of this chapter is on the solid waste framework of West Virginia itself it
would be remiss to treat the state as an isolated island immune from trends in the solid waste
industry and the actions of its five surrounding states. Royte’s (1992) article Other People’s
Garbage, published in Harper’s Magazine, sparked national and international interest into West
Virginia’s central role in the so-called transboundary Garbage Wars. Royte wrote about
following the route her own trash took from New York City to McDowell County, WV:
“At the end of Lower Shannon Branch, a dirt road that winds for six miles through West
Virginia's hill country, there sits a vast, bowl-shaped hollow, its sides carpeted with 6,000
acres of second-growth hardwood trees. This particular piece of land holds little attraction
for most people in rural McDowell County. It's not especially scenic—it looks like a
thousand other wooded hollows in southern Appalachia that were first timbered and then
mined. But the valley's ordinariness and resolute quiet belie a brewing national storm. Like
many out-of-the-way sites in poor, rural communities across America, this hollow is
considered by some an ideal place to dump the disposable diapers, orange rinds, Coca-Cola
bottles, and chicken bones of several million people who live very far away. The scarred
hillsides of this valley provide a good vantage point from which to view the nation's
garbage wars," (Royte, 1992 p.42).
The importation of waste from outside the state, whether viewed as economic opportunity,
industry competition, or exploitation (particularly of economically disadvantaged regions), is
highly contentious and not only in West Virginia. Some West Virginia municipalities and
landfills wrote flow control regulations to curb the importation of waste from other states, but in
1998, 2006, and again in 2009 a federal judge held that it was unconstitutional to discriminate
against the importation and disposal of waste from other states under the U.S. Constitution’s
Dormant Commerce Clause. West Virginia statutes used flow control practice to impose a
monthly limit on the amount of imported waste that could be handled at state solid waste
facilities. A central legal outcome of the Dormant Clause was the Stamp Decision and the
determination that the West Virginia solid waste statutes tonnage caps were unconstitutional
because again they discriminated against out-of-state waste entities. In 1998, West Virginia
amended the law (WV law S.B. 178) to keep tonnage caps in place and to maintain WVDEP

64
jurisdiction over tonnage limits for each solid waste facility. Class B waste facilities under the
control of local solid waste authorities were redefined as Class A waste facilities under the
jurisdiction of county commissions. Valero Terrestrial Corp and others contested sections of the
West Virginia Landfill Closure Act enabling revenue to be collected in the “Closure Cost
Assistance Fund” claiming it was unconstitutional because it violated the U.S. Commerce
Clause and Valero’s due process rights. West Virginia's Landfill Closure Assistance Program
provides funds for landfills that do not meet environmental criteria set by the U.S. EPA to
prevent groundwater contamination. The case lacked subject jurisdiction under the Tax
Injunction Act because the West Virginia legislature imposed the landfill closure cost (and not
an administrative agency), a charge imposed on anyone disposing of waste into a landfill and
hence paid for by the service collection fee incurred by state citizens and businesses. Tensions
escalated as West Virginia haulers and landfill owners met state standards for waste disposal
that were not required for out-of-state haulers. In 2006 and again in 2011 entities such as the
WV Solid Waste Hauling and Recycling Association went to court to demand out-of-state
haulers be required to adhere to the same regulations. However, in 2009
WV Senate Bill 641 required the operator-driver of every solid waste motor carrier who
deposited solid waste in a commercial landfill or transfer station to give written declaration,
under oath, of the county and state of origin of the solid waste so disposed.
Yet not all are opposed to such import control. In 2011, Tucker County Solid Waste Authority
(TCSWA) petitioned the state for municipal waste from Preston, Randolph, and Tucker
counties to be disposed of at the TCSWA landfill because competition from out-of-state
disposal facilities in nearby states had led to a 40% decline in the solid waste it received. The
WVPSC dismissed the case as discriminatory, protectionist, and damaging to interstate
commerce. In McDowell County, where the Garbage Wars captured the world’s attention, the
garbage dump has become one of the few economic development opportunities in one of the
poorest counties in the U.S. The Copper Ridge Landfill Class A facility managed by Enviro
Solutions, Inc., is permitted to accept up to 50,000 tons of waste per month and still receives
trash from New York City via double-decker trash cars on a high-speed rail line.. Indeed, out-
of-state source waste generators paid to change the height of the rail infrastructure and rail
tunnels along the route. In 2015 New York City implemented a zero-waste plan for the city that

65
requires internal disposal and treatment of trash by the year 2030. While the Garbage Wars
have lost public attention, the controversy over transboundary garbage rights in West Virginia
has never ceased and was recently reignited by plans to import low-radioactive medical waste,
fracking waste, and nuclear waste (Arosova et al., 2008; Breitenbucher, 1997; Brglez, 2003, pp.
26; Kimmel et al., 2014).
While the garbage wars may have diminished, the secondary commodities market in which West
Virginia had become a competitive force in the global waste market has created its own issues.
During the boom years of the secondary waste commodity market, West Virginia was an
aggressive participant in waste recycling and many small, independent waste haulers in relatively
population dense areas sold their companies to larger waste companies, such as the sale of BFI-
Waste to Republic in North Central West Virginia, and new haulers emerged. The secondary
commodities market plummeted in 2013 largely because of China’s Green Wall program and
much of West Virginia’s solid waste recycling program was thrown into turmoil. Not least these
market losses were compounded because some municipalities and businesses had based their
business model on cost savings achieved from not having to pay landfill fees (Pew, 2016). In
Monongalia County WV, for example, the recycling center was closed and yet communities
expected recycling collection to continue. Because incineration and waste-to energy-plants are
not permitted in West Virginia to limit competition with coal-fired power plants, much of this
recycling, trash, and contaminated commodities is sent to a waste-to-energy plant in Pittsburgh
(incidentally also a reason why cremation services must take place outside West Virginia).
These events and the discontinuation of recycling services for many West Virginia counties
points to the close link between local waste disposal and the national-global arena. Embedded,
of course, within this solid waste scenario are the laws, statutes, regulations, and rules that
determine what happens to differentiated solid waste materials in differing places throughout the
state.

66
Chapter 6 Mapping public policy regulation
Solid waste policy and its regulatory framework is complicated by its multiscalar nature and the
need to grapple with macro-level national and international policy, the Big P, alongside the local,
small p, and to do this for multiple organizations and agencies, if not individuals (De Man, 2007;
Mellouli et al., 2009; Nelson and Brewer, 2015; SciDev. Net, 2017; Wang et al., 2016). These
policy structures are not necessarily hierarchical but can intertwine multiple jurisdictions at a
variety of scales (Kidd, 2007; Stead and Meijers, 2009; Zorica and Nedovic-Budic, 2016).
Mapped representations of the solid waste industry are rare, and that even applies to the hauler
routes which if mapped are proprietary or the routes are handed on by word-of-mouth. The
regulatory rubric may define to which the regulation applies and even then this will be in text
form buried in the ruling. At best, any mapping arising from monothetic studies have tended to
focus on specific policies and their spatial representations (Nelson and Brewer, 2015).
Despite the everyday grounded experiences of the many people involved in solid waste disposal,
representing the spatial dimensions of related policies and regulations is highly problematic.
Complexity arises not only from the need to derive the entirety of the regulatory and statutory
components of the solid waste system embedded deep in statutes, legal documents, and
agreements, but also determine and assign the underlying spatial dimensions of those regulations.
Irregularities in the spatial disposition of a policy itself, gaps in the policy life cycle, and
overlapping jurisdictions conspire to further complicate the spatiality of the solid waste system.
Furthermore, some parts of the solid waste system are not recorded in formal regulatory code but
are unwritten practices of everyday solid waste collection and disposal that have arisen over the
course of generations. The spatial component of solid waste policy and the identification of the
locations to which these rules apply is like the proverbial black hole and essentially leads to an
aspatial solid waste unbeknownst to anyone except for those directly involved in that particular
part of the system. A disconnect exists that often obscures public policy as understood and public
policy as enacted. Certainly, as related to solid waste disposal this is exacerbated by spatial
coping mechanisms that are used and which are often based on historical precedence and legacy
boundaries. This is problematic and perhaps a surprise that such a scenario has not prompted
earlier solutions not least because of the growing magnitude and extent of policy statutes and

67
regulations (Cash et al., 2006; Cundell and Fabricius, 2009; Gibson et al., 2000; Mitchell, 2003;
Thrift, 2010).
A major challenge then to spatializing policy is how to capture and portray the spatial
dimensions of a complex regulatory environment which operates at multiple scales. Currently no
discernible spatial framework for use in public policy can be found (Cash et al., 2006; Martin,
2001; Nelson and Brewer, 2015; Wang et al., 2016). However, several researchers have
attempted to capture some elements of the waste industry that include the Waste Atlas, the
Hauler Map, and the Digital Star City. The following chapter discusses the conceptual basis for
policy-sheds as proposed in this study.
The Waste Atlas: a crowd-sourced GIS
GIS has considerable power in spatializing information and its use in mapping the trash industry
would seem to have considerable appeal to display the spatiality of the system, and its patterns,
relationships, and governance. The Waste Atlas, is an interactive map that is based on nationally
reported official data and on self-reported data collected worldwide. It is the only extensive
source of waste data available worldwide and is used by professionals, government, scholars, and
urban planners. As it also addresses solid waste in the context of public health, it is a primary
source referenced by municipalities during the creation of their waste disposal plans. It has also
been recently used as a source to create future scenarios of global waste generation and disposal
(Lebreton and Andrady, 2019); to create an integrated approach to e-waste management for
developing countries (Ikhlayel, 2018); to analyze the solid waste economy in Colombia and
Latin America (Rua-Restrepo, Echeverri, and Colorado; 2019); and to demonstrate that the lack
of data in decision making impacts the circular economy at the city scale (Owen and Liddell;
2016).
Yet, while the Waste Atlas provides a large and readily available worldwide map of waste
generation it is nonetheless limited and flawed, and these limits are openly acknowledged by the
Waste Atlas. There is considerable underreporting, and many gaps exist in the coverage of the
Atlas, perhaps surprisingly including the generally data centric U.S. Further, its reliance on the
aggregation of data into large areal units is unhelpful in examining the solid waste system (Waste
Atlas, 2019; U.S. EPA, 2019).
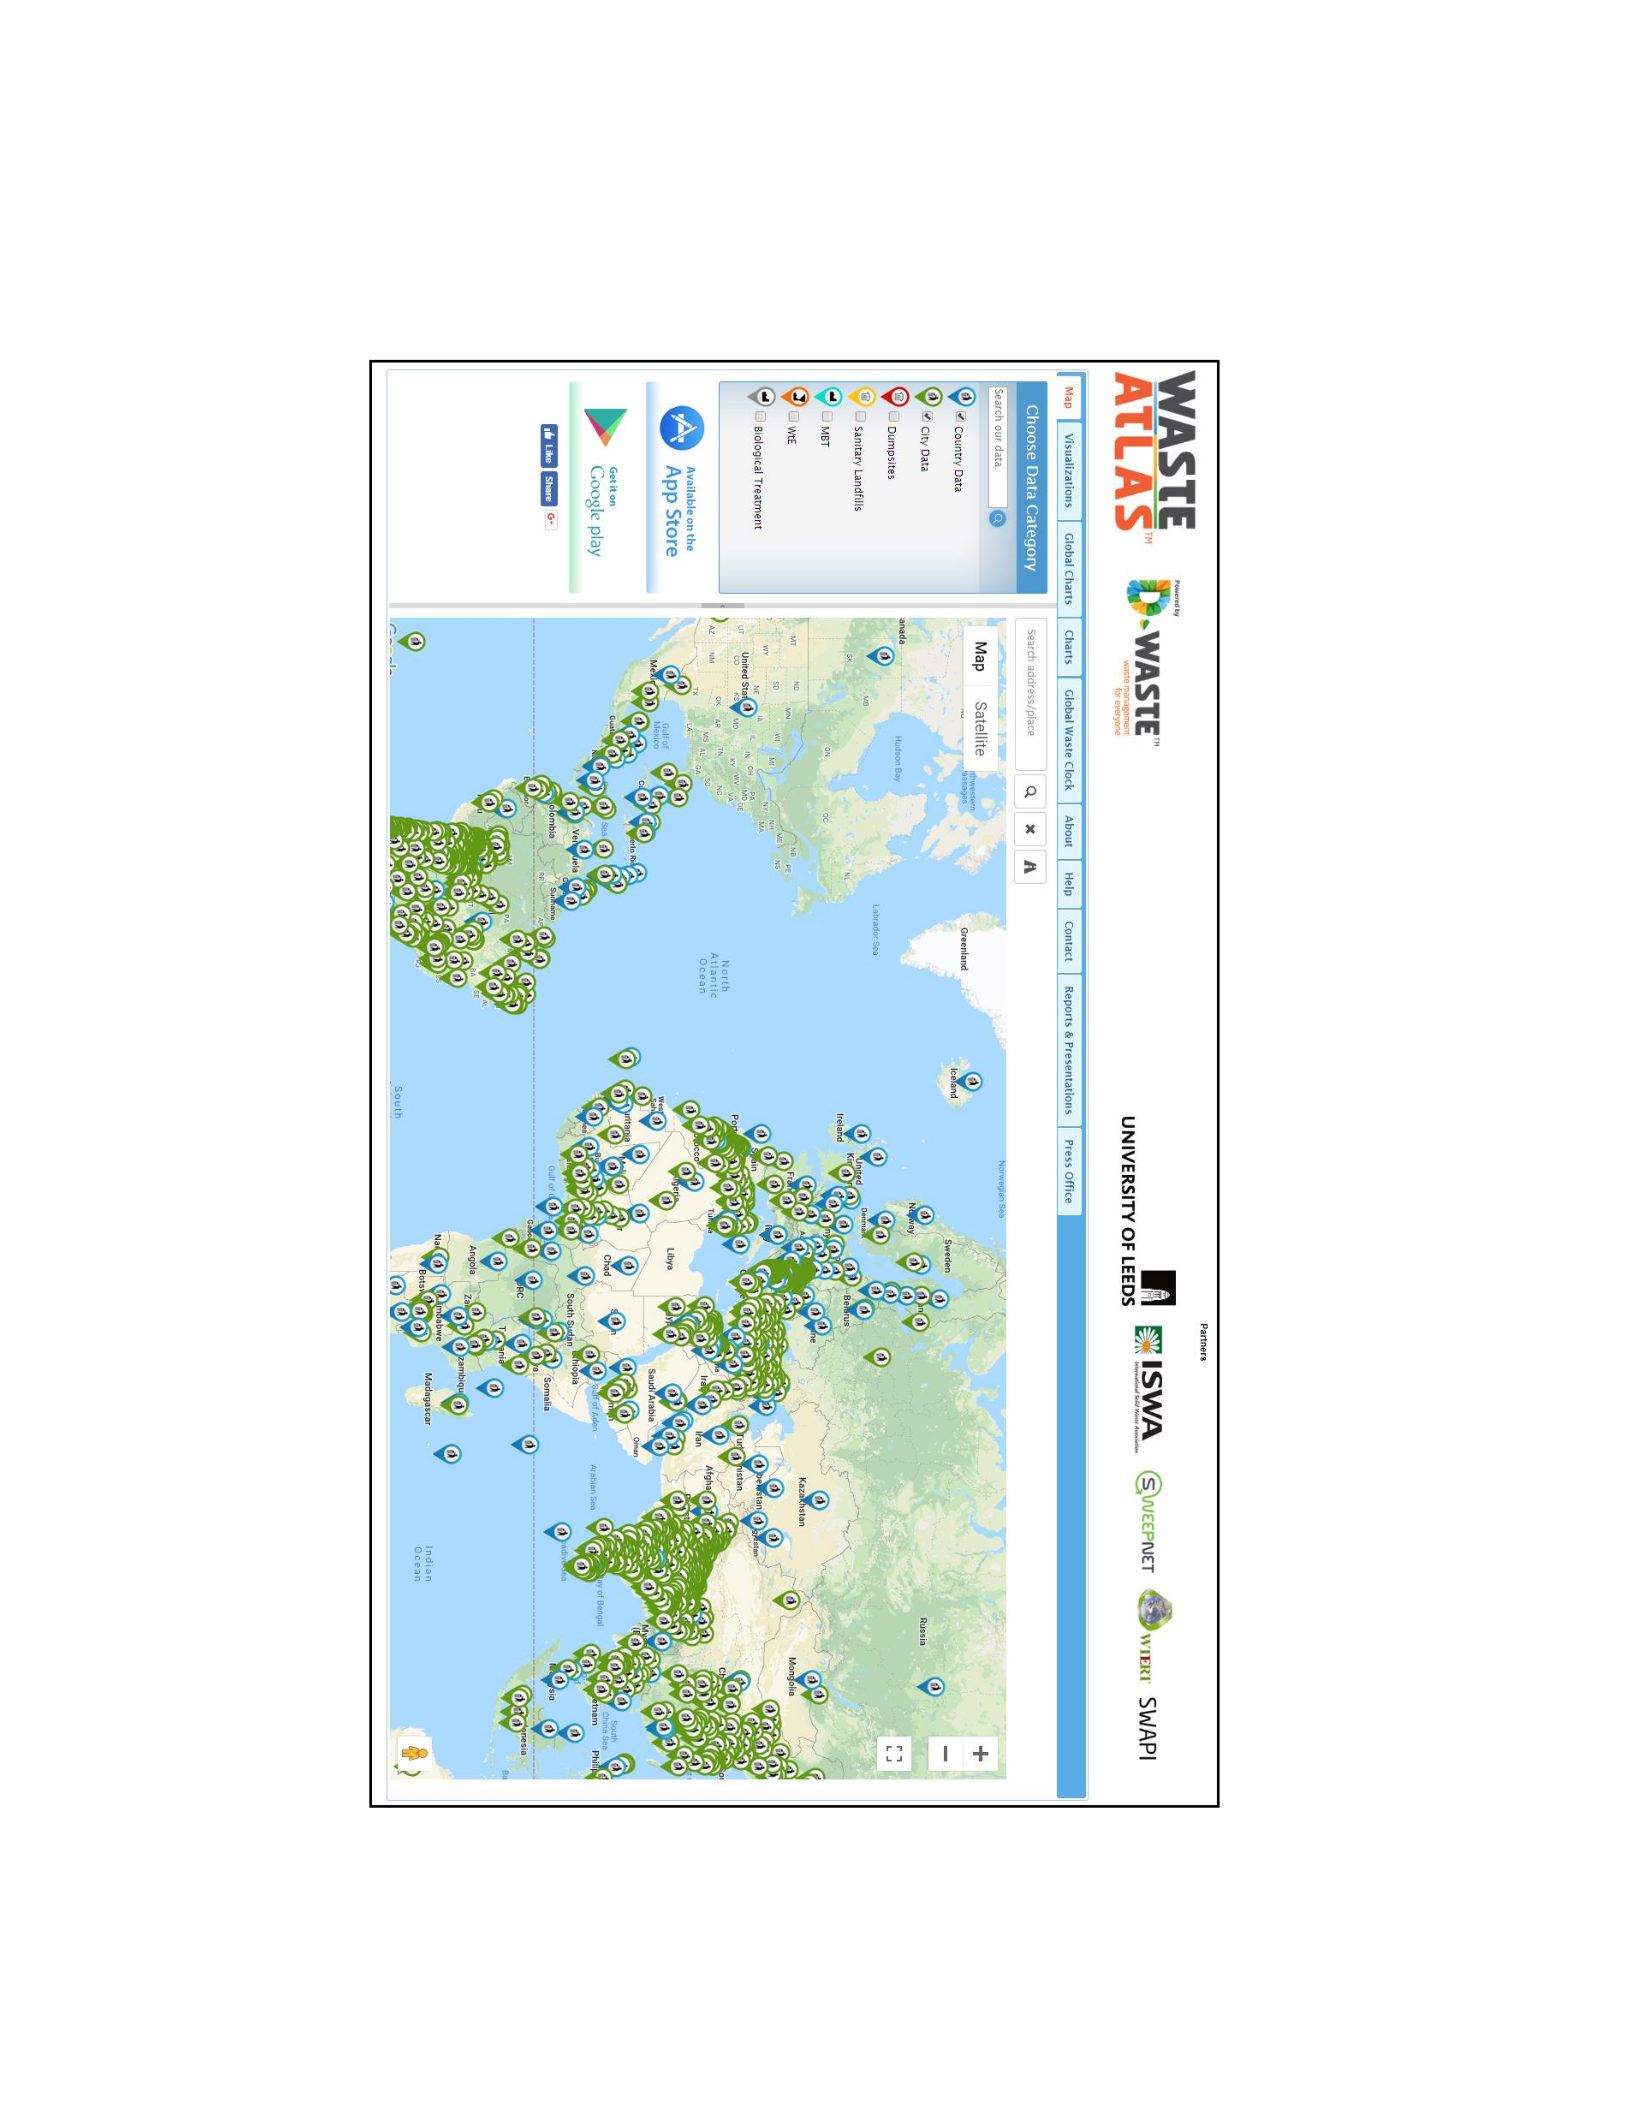
68
Figure 6.1 is indicative of the map product achievable through Waste Atlas showing layers of
country data (blue marker) and revealing the density of data available for regions of the world.
The sparsity of data for the United States, Canada, and Eastern Europe, for example, is notable.
Figure 6.1: Waste Atlas Country and City Data
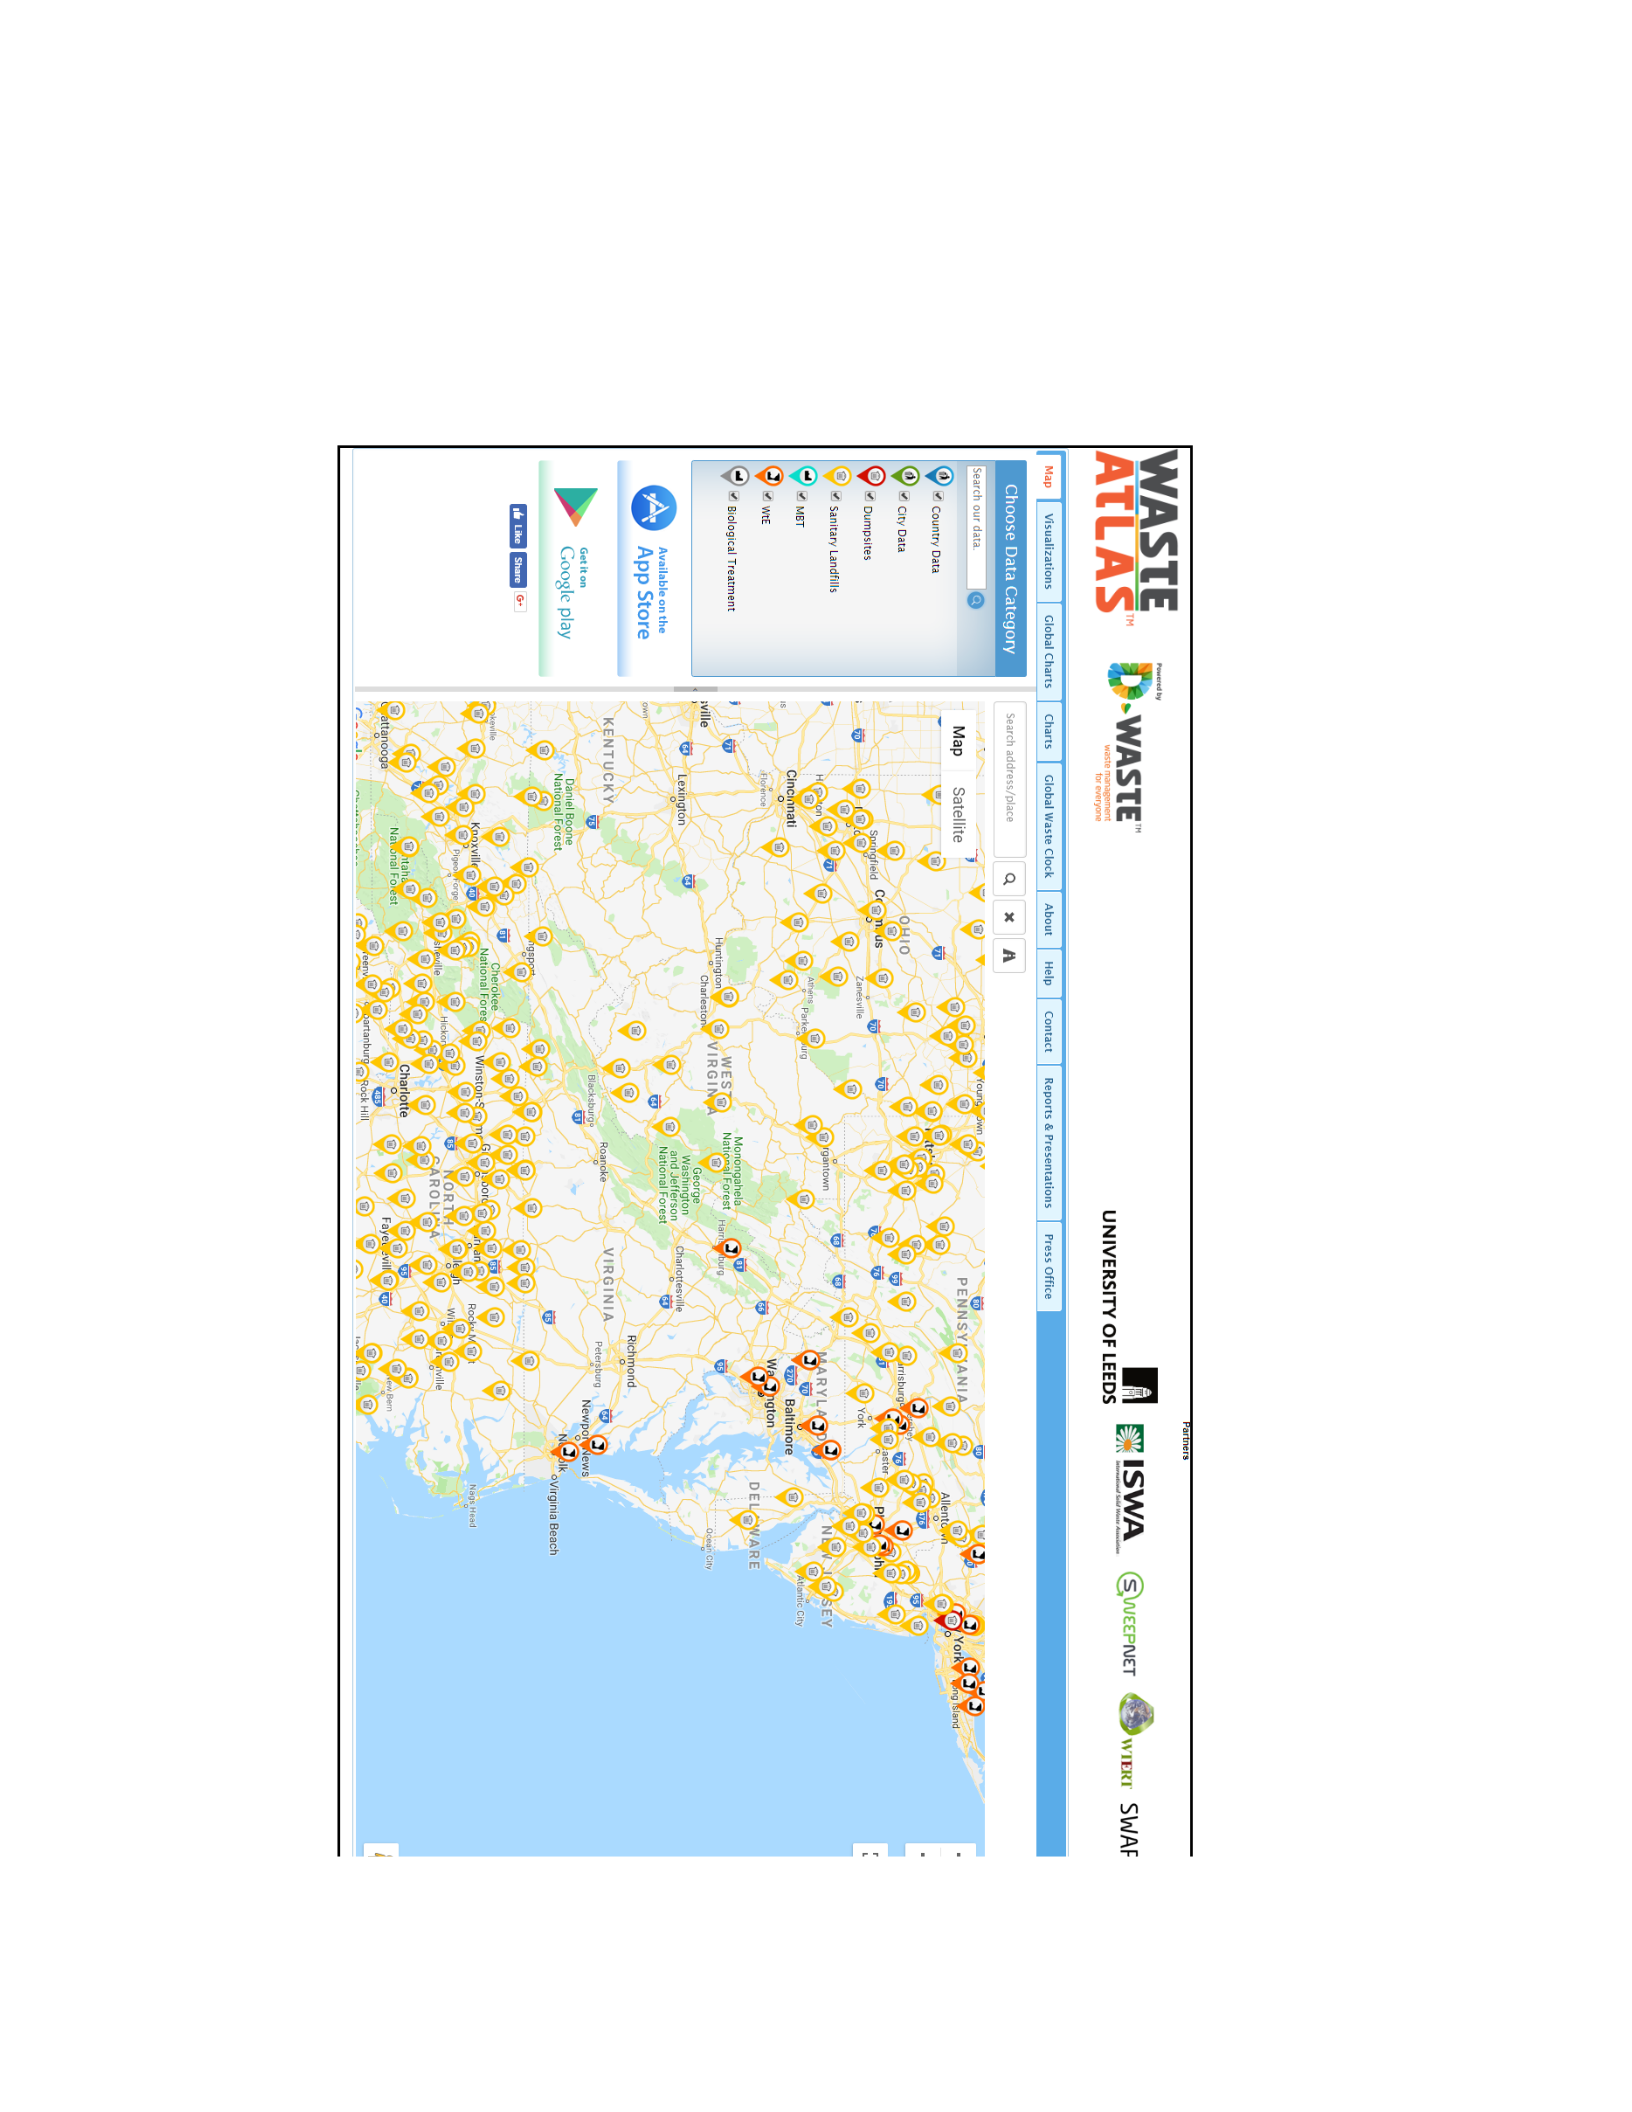
69
Figure 6.2 displays city dumpsites populated from federally mandated data reporting data for
sanitary landfills (yellow markers). Further, the Atlas draws upon many national and
international datasets of physical, demographic, social, economic, and enviro phenomenon to
provide a context for solid waste reporting.
Figure 6.2: Waste Atlas Map of Sanitary Landfills
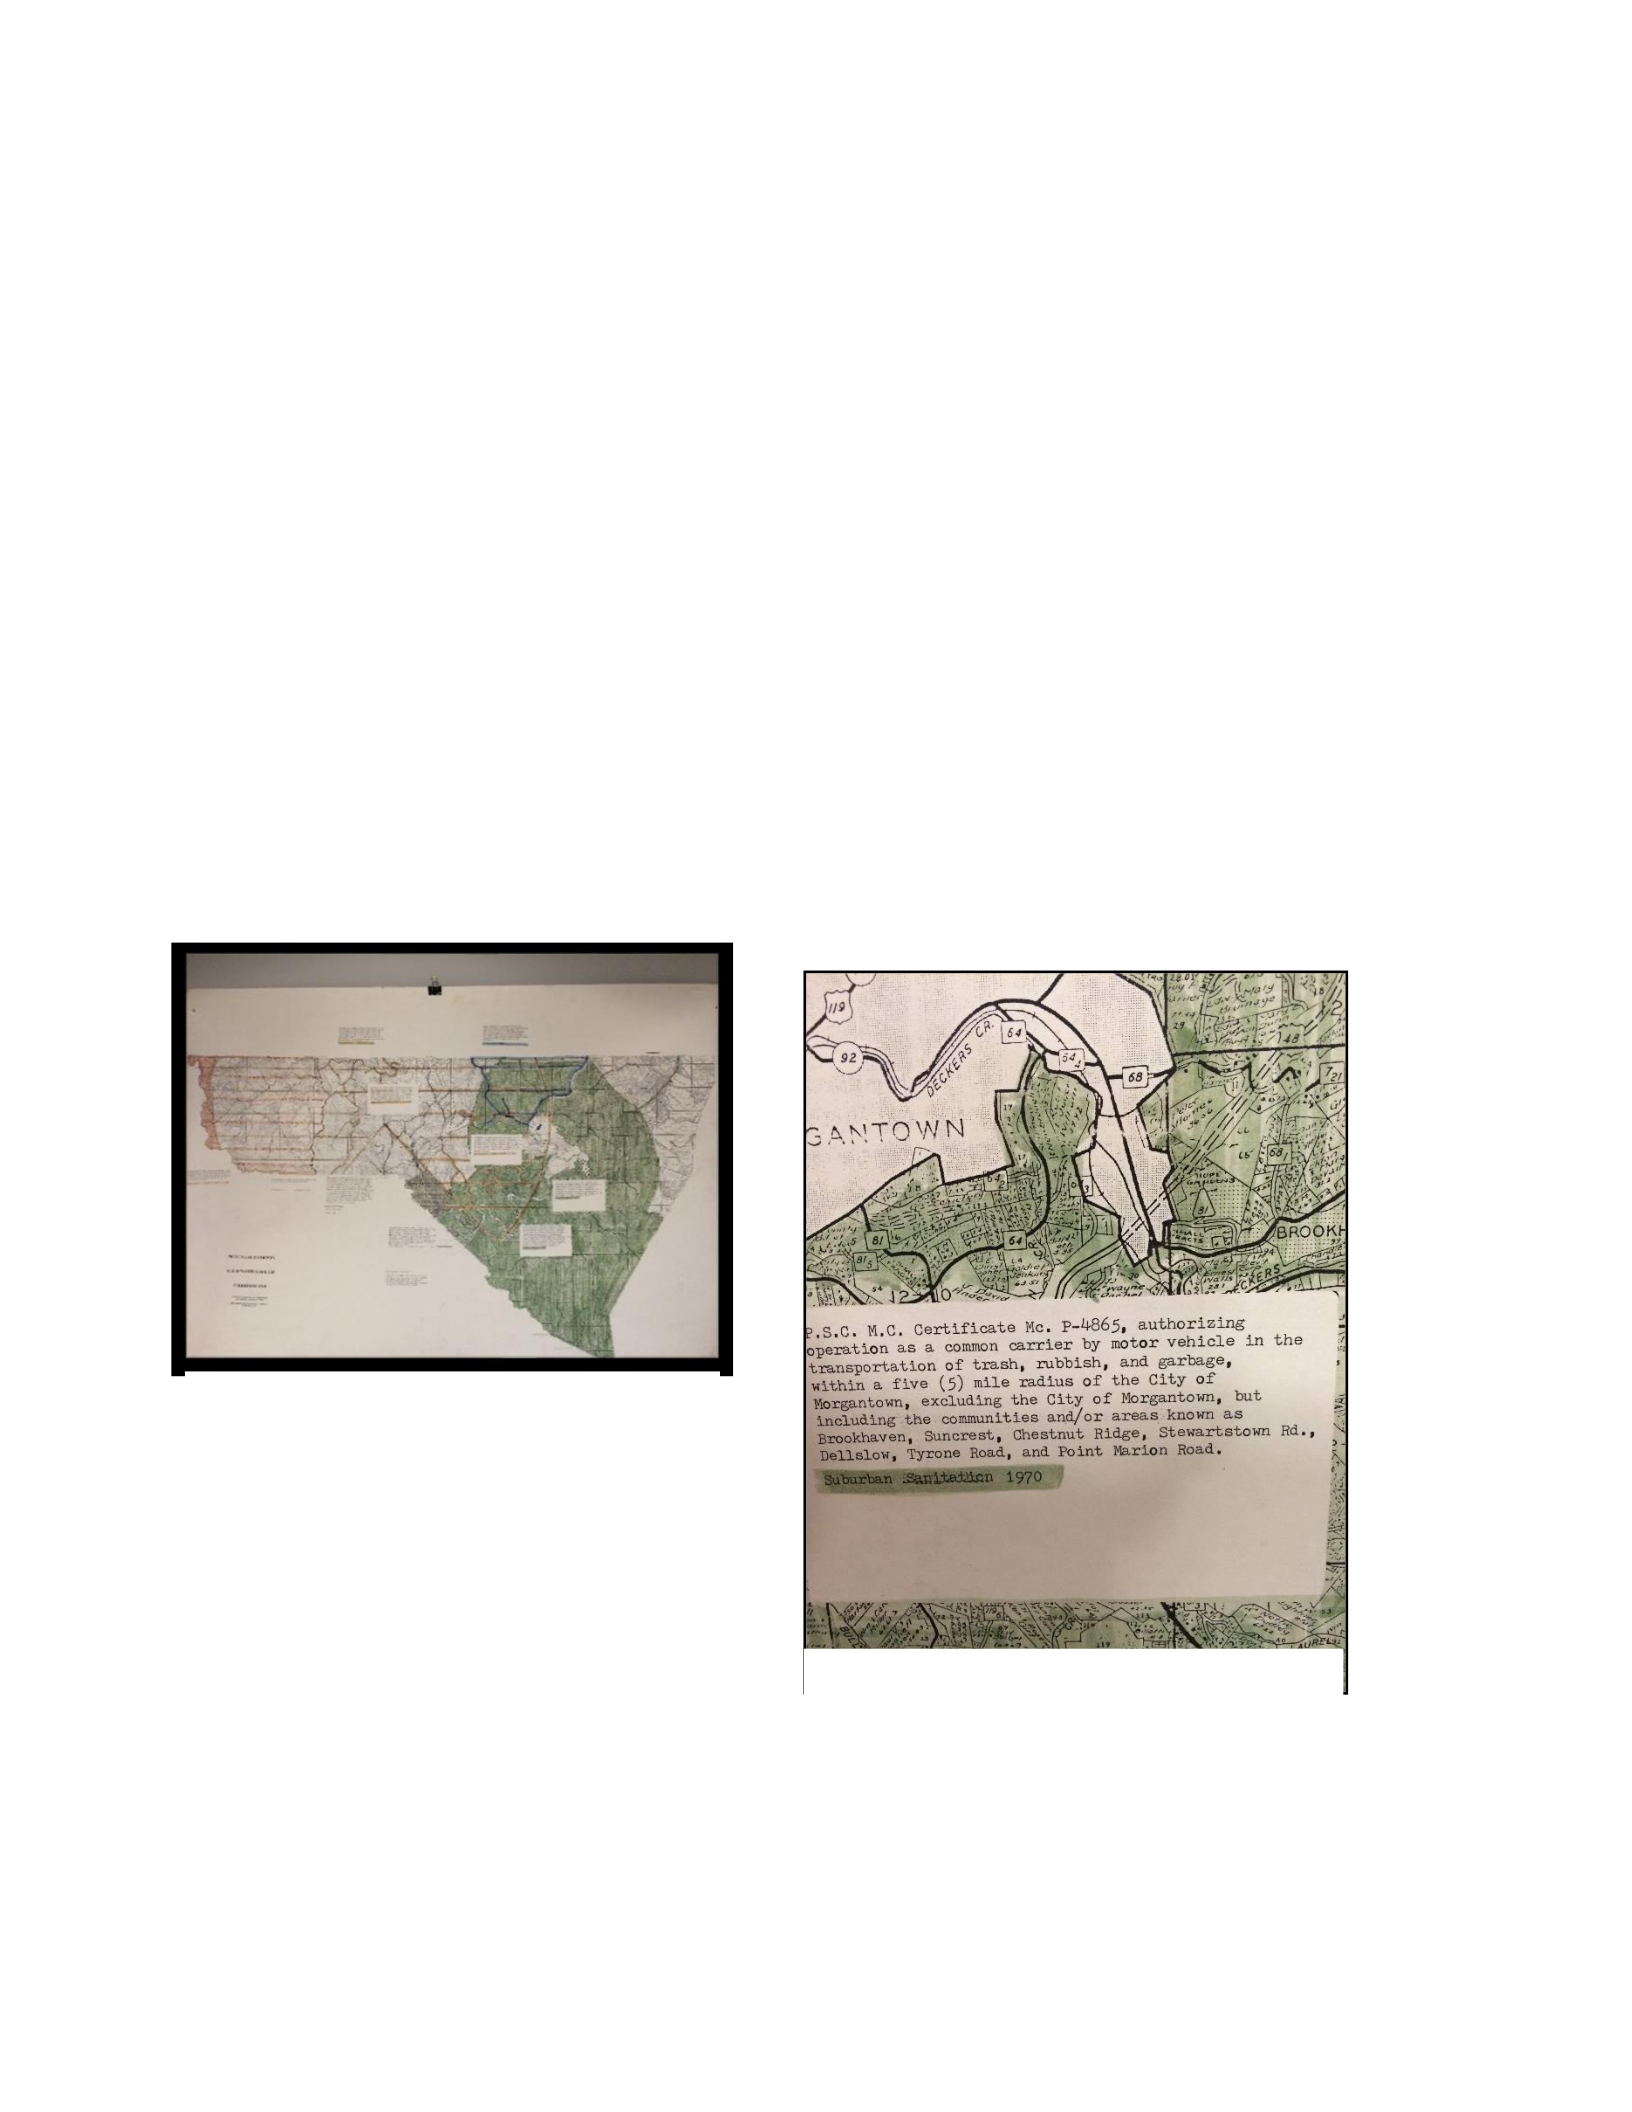
70
Hauler Maps
Hauler maps, when they can be found, root the solid waste industry to the locations from which
municipal waste is collected and to the landfills or transfer stations to which the waste is
subsequently disposed. The WVPSC is tasked with establishing hauler route tariffs that are
assigned to business, residential, and municipal solid waste hauler territories (PSC § 150-9). The
WVPSC requires no maps for tariff filing, nor are they provided by the PSC when the tariff is
approved. These route tariffs exist only in narrative form with boundary information provided
only in descriptive text terms. Figures 6.3 and 6.4 are copies of old hauler and tariff maps
created for Monongalia County, WV by a hired contractor and consist of hauler routes denoted
by color pencil with appended type written tariffs. The territories are explicitly stated as not
being to scale or accurate but are for descriptive purposes only. While seemingly bounded, the
interpretation of quadrants, radii, or even neighborhoods and businesses is largely left to the
interpretation of the hauler. Hauler and tariff maps such as these are rarely found.
Mapping these tariff descriptions, as undertaken by this author, revealed more about the map
analyst’s interpretations of territory, fuzzy boundaries, overlapping areas, and conflicting
territories than what the map in reality might appear to suggest (MacLennan and Bergeron,
Figure 6.3: Pencil map of tariffs for Monongalia
County (green)
Figure 6.3: Pencil map of tariffs for Monongalia County
(green)
Figure 6.4: Typewritten caption of a tariff

71
2013). What the author’s study indicated using participatory geography is that most hauler
territory maps and the actual area covered by each waste hauler are based on local knowledge
and exist more as mental maps maintained by the crews involved in the day-to-day process of
solid waste collection. The retirement or death of long-time workers and deteriorating paper
records can cause significant disruption to this operation. Capturing such spatial information for
ingestion into a GIS requires extensive communication between the GIS operator and the hauler
crews.
Turnkey GIS mapping initiatives
In some few instances turnkey GIS mapping has been undertaken and the topological and
analytical power of GIS has been coupled to the mapping component. In the GIS study
undertaken by this author a geodatabase schema was created capable of accommodating federal
data comprising open dump sites, landfills (open and closed), EPA registered facilities, National
Pollutant Discharge Elimination System (NPDES), along with state, and locally collected solid
waste data for a community (Figure 6.5) (MacLennan and Bergeron, 2013). In addition,
administrative units, hydrography, transportation networks, community demographics, recycling
drop-offs, and environmental features are included to provide much needed contextualization for
subsequent analysis. The study came across many of the issues previously noted about data
pertaining to the solid waste system in the form of under-reporting, incomplete waste and
dumping sites, duplication, and overlapping areas. Certain feature layers, such as recycling
drop-off locations, changed often and in some instances were not recorded at all. Waste hauler
routes and service addresses are not available in a usable spatial format.
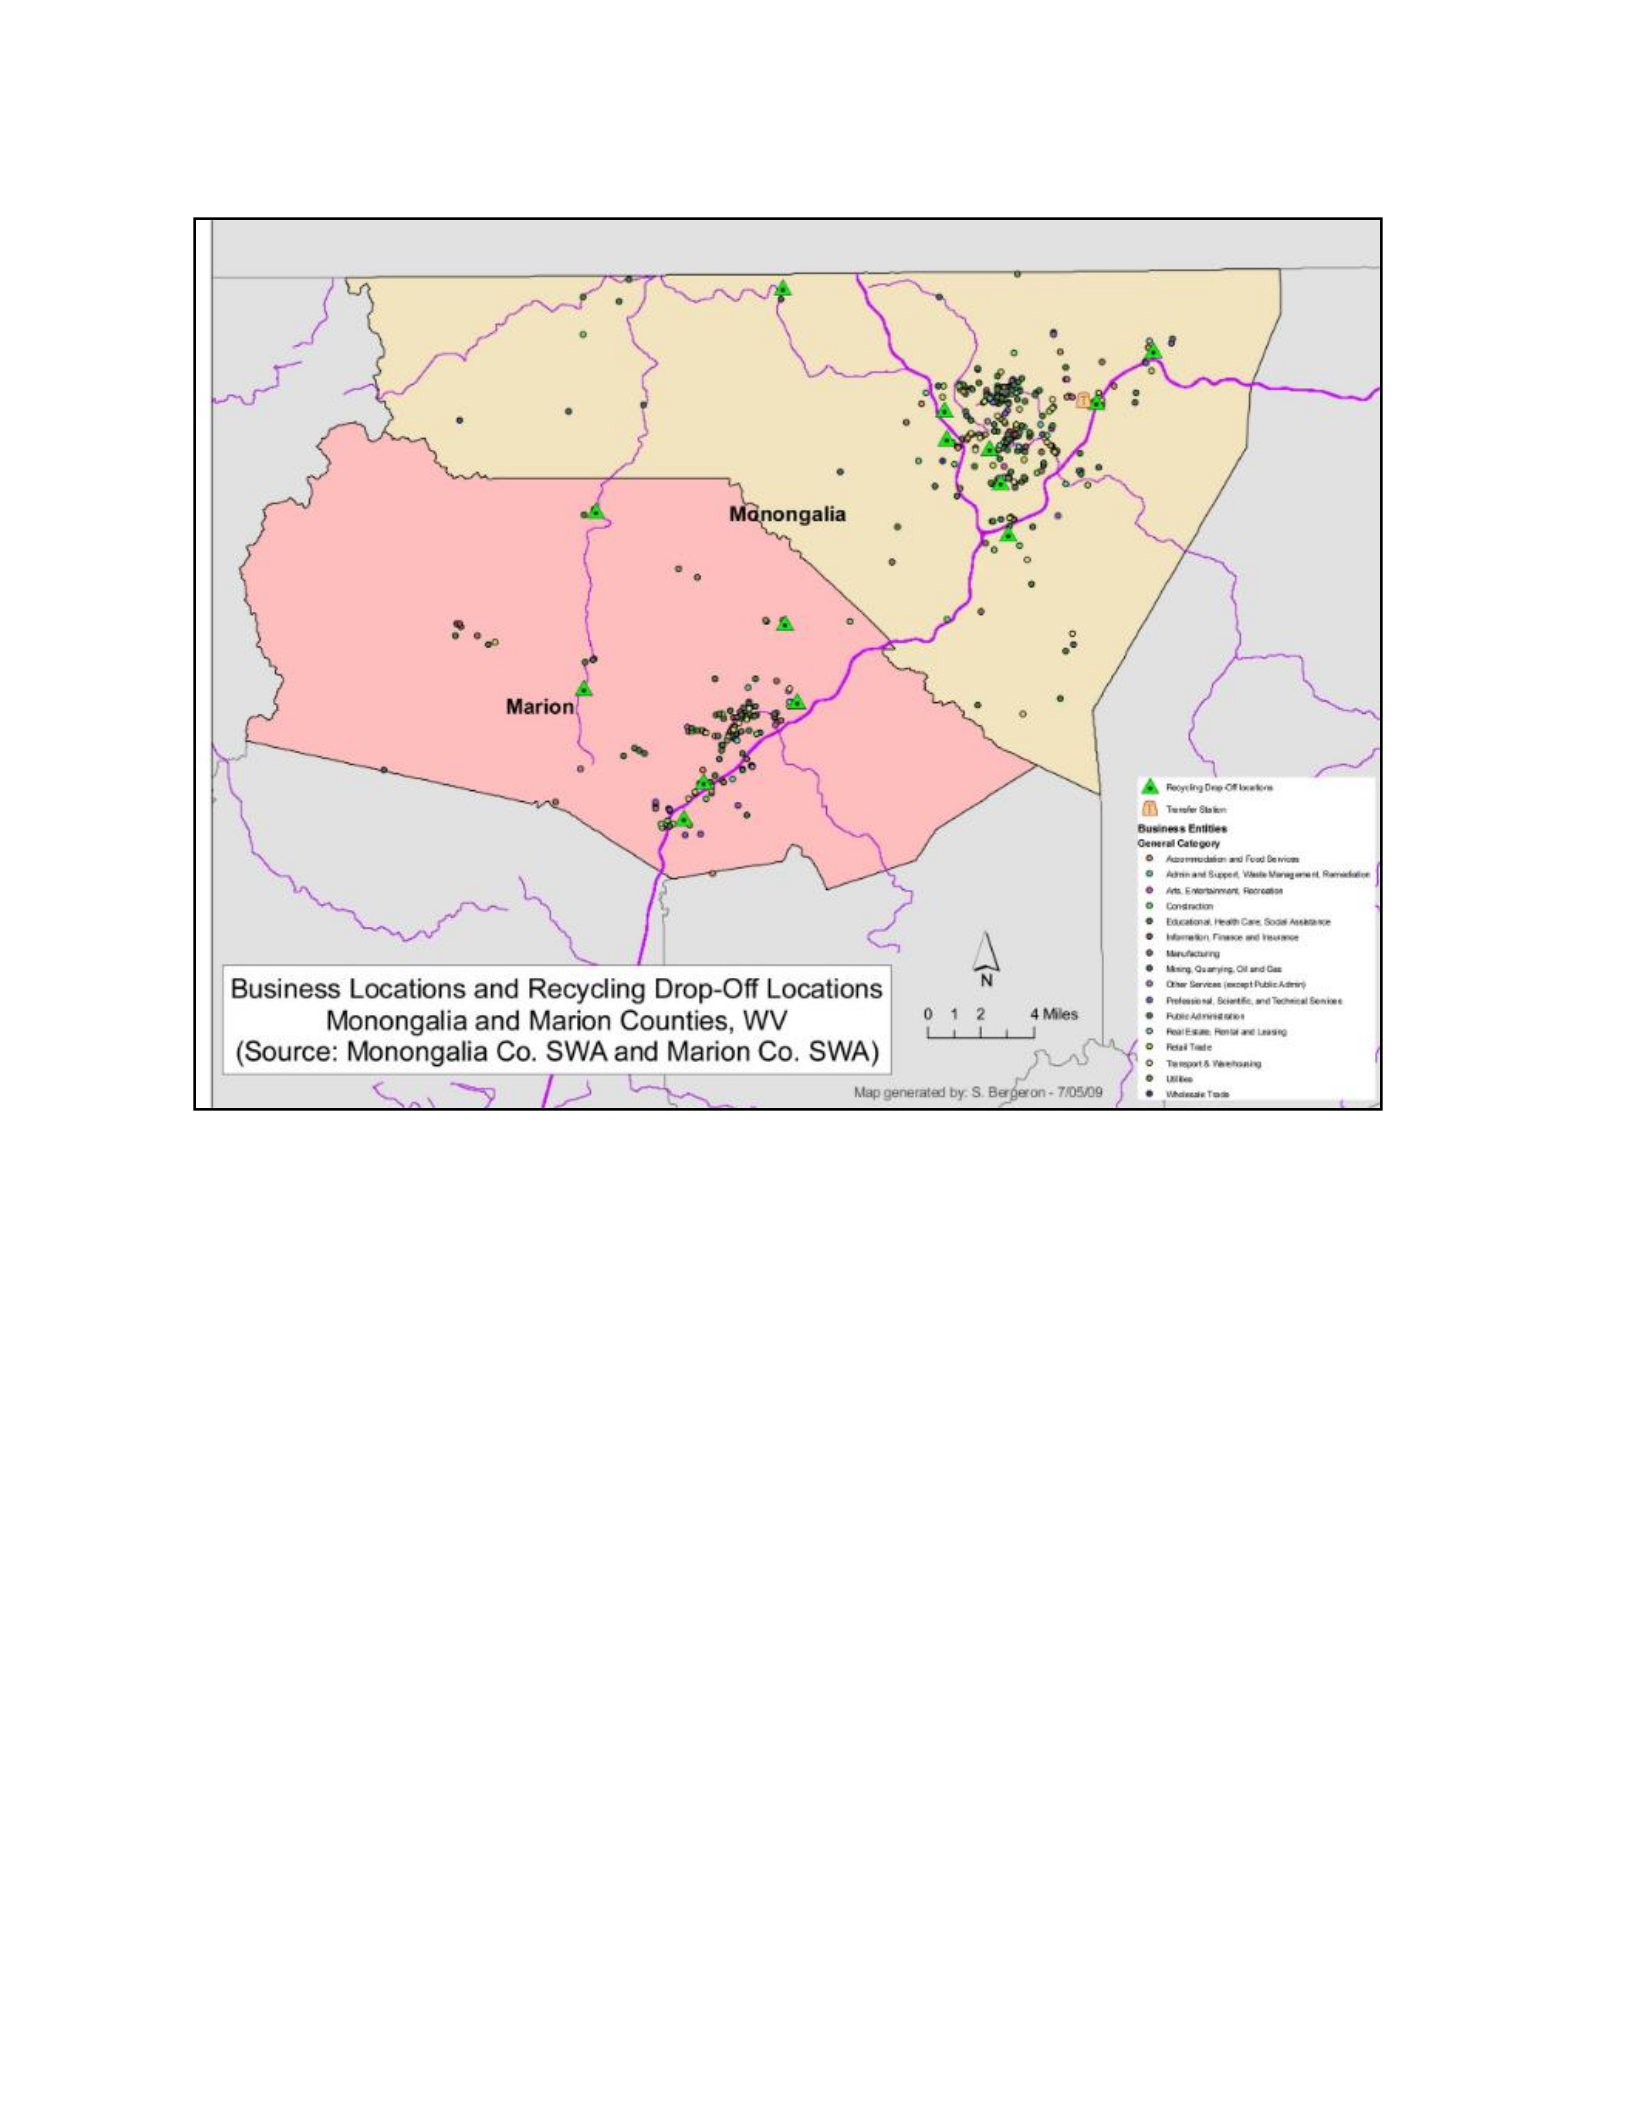
72
The importance of having transportation networks included in the GIS became very evident
when waste hauler territories and tariffs taken from textual descriptions were digitized and
ingested into the GIS. Even here the available 1:24,000 scale transportation network had to be
expanded to determine streets and roads that were unrecorded but fell within hauler territories,
along with a service address layer. Marrying WVPSC tariffs to hauler defined territories was a
challenge, especially if service address owner names were to be protected for privacy purposes.
Figure 6.5: Solid Waste Planning and Transportation: Challenges in implementing GIS in rural areas(Stiller, Maclennan,
and Bergeron, Monongalia County Solid Waste Authority.
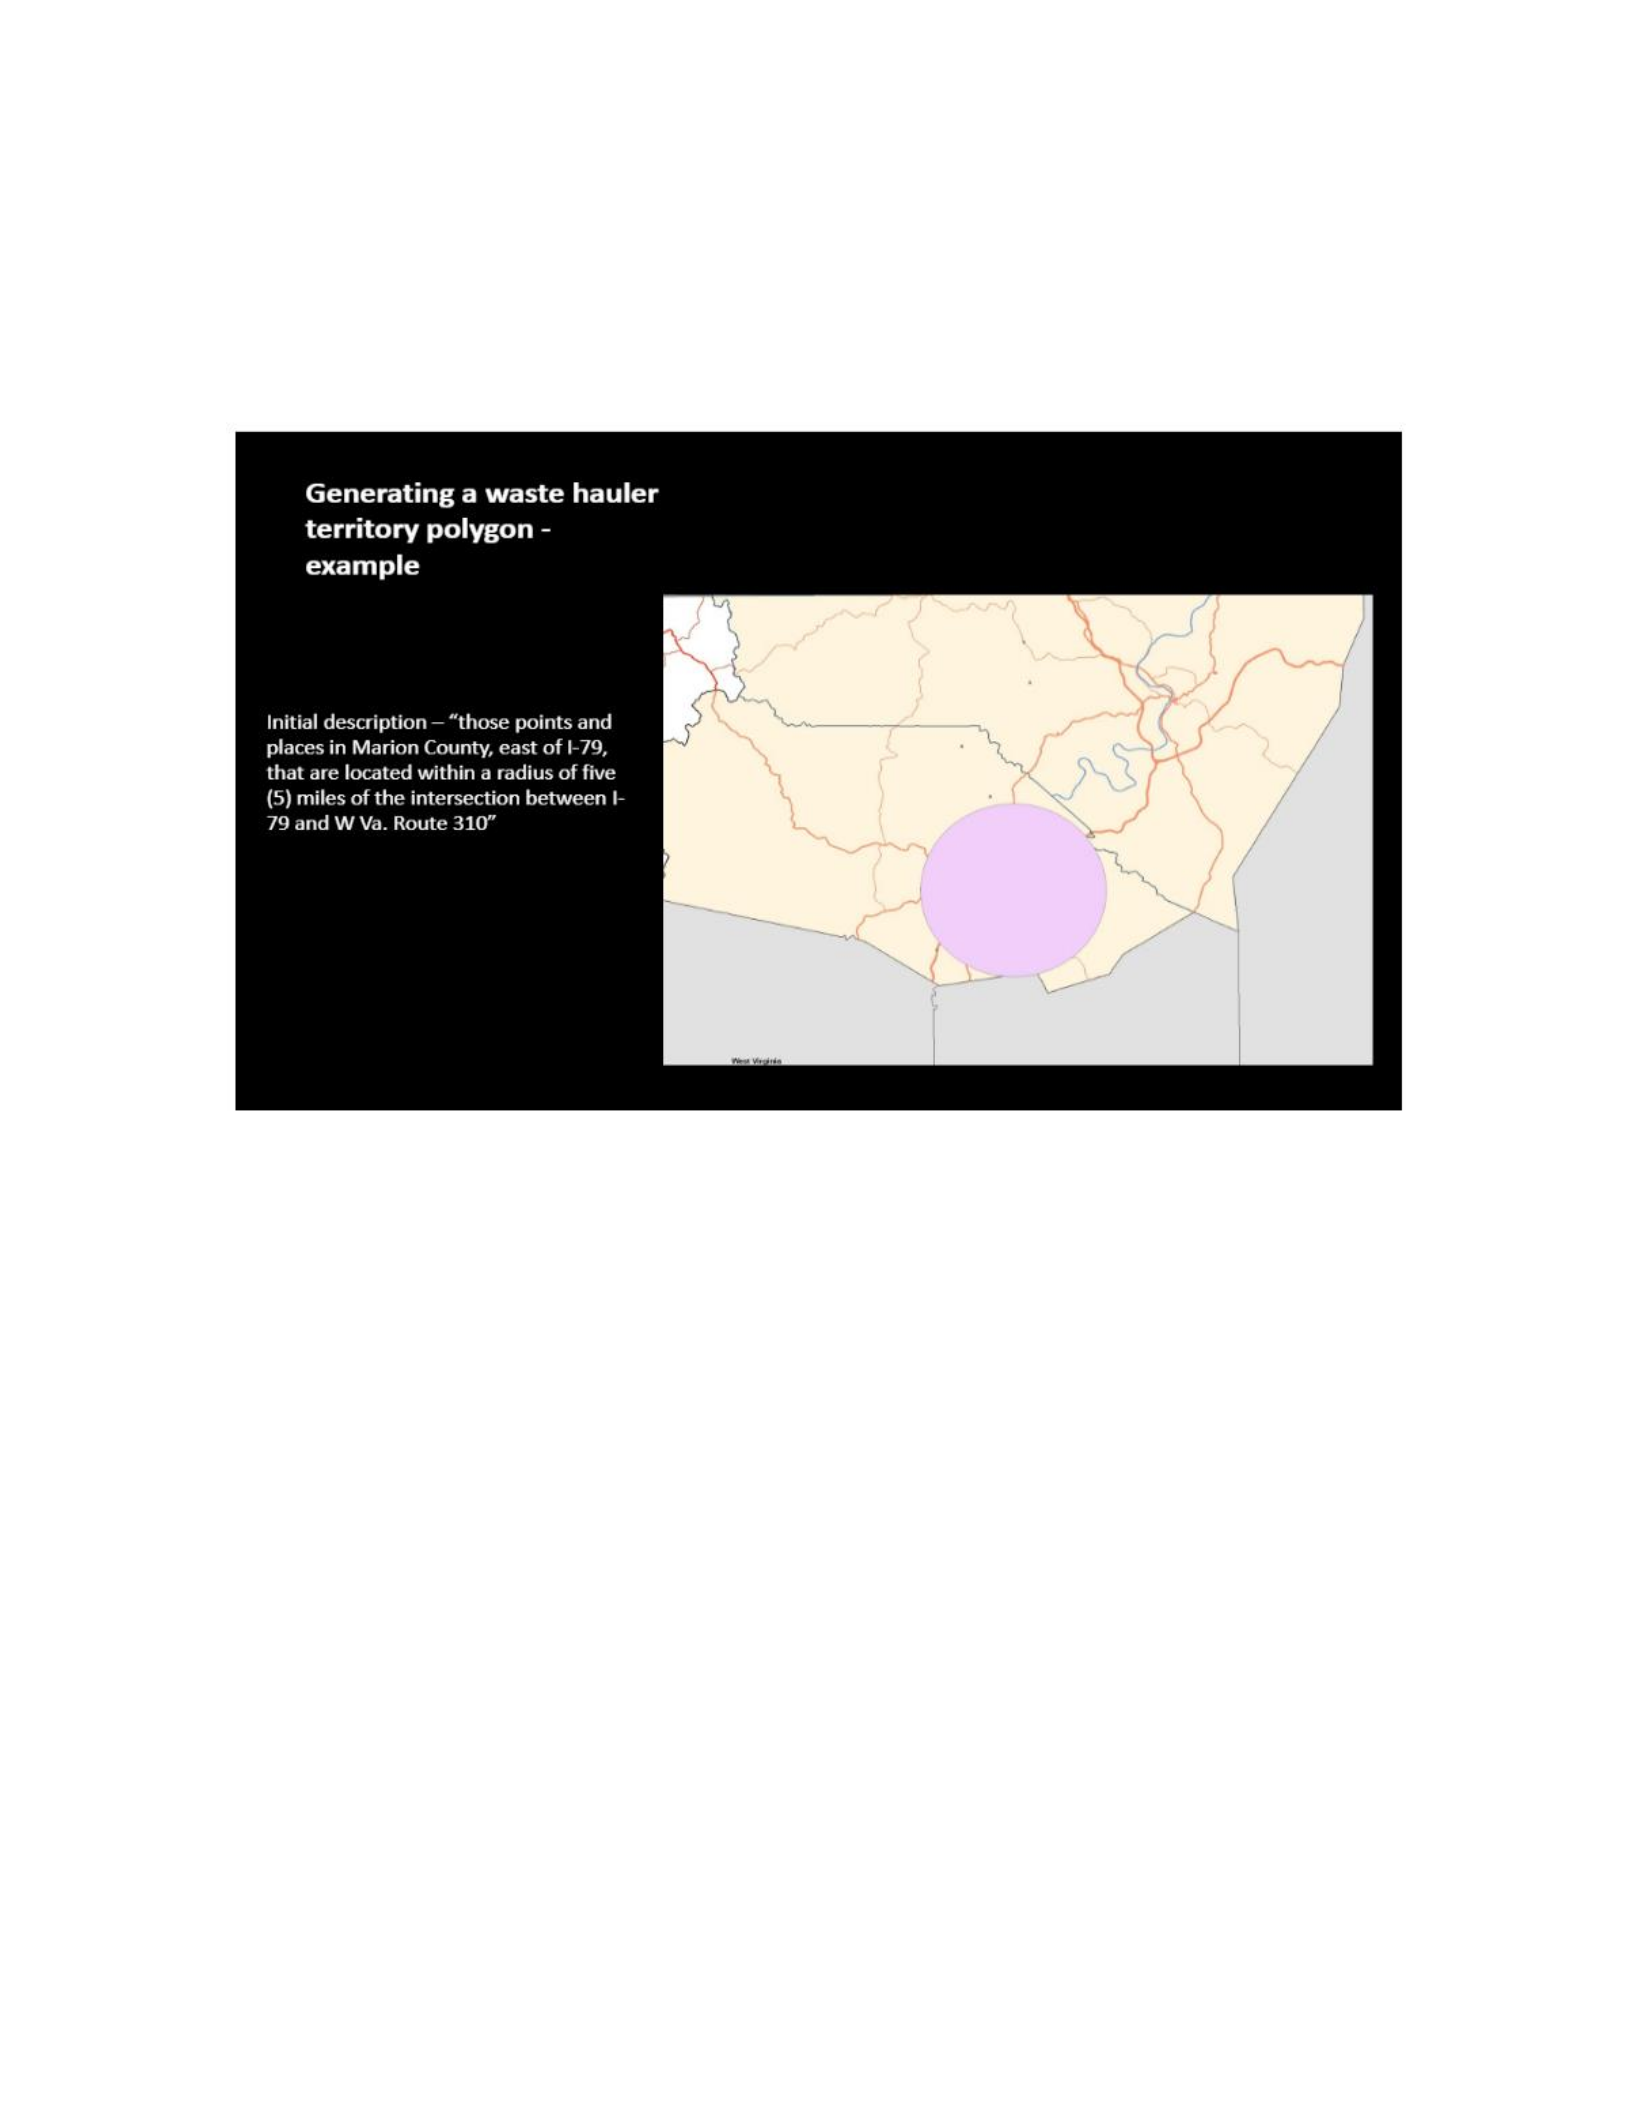
73
Figure 6.6 represents a waste hauler territory polygon produced through the turnkey system
based on the WVPSC description which states, “those points and places in Marion County, east
of I-79, that are located within a radius of five (5) miles of the intersection between I- 79 and W
Va. Route 310.” This nebulous description is then followed by exemptions that state, “excluding
the following points and places: (a) those points and places that are located to the east of Little
Creek; (b) those points and places that are located to the north of Marion County Route 76 ”.
The amended map is shown in Figure 6.7 and Figure 6.8. The actual hauler territory for the tariff
as described is not a contiguous area as assumed but in the precise details reveals a history of
spatial relationships that encompass Big P and small p policies in action (Figure 6.9). The
challenges involved in pursuing such mapping for the state, region, or United States becomes
very apparent.
Figure 6.6: Initial Tariff Description
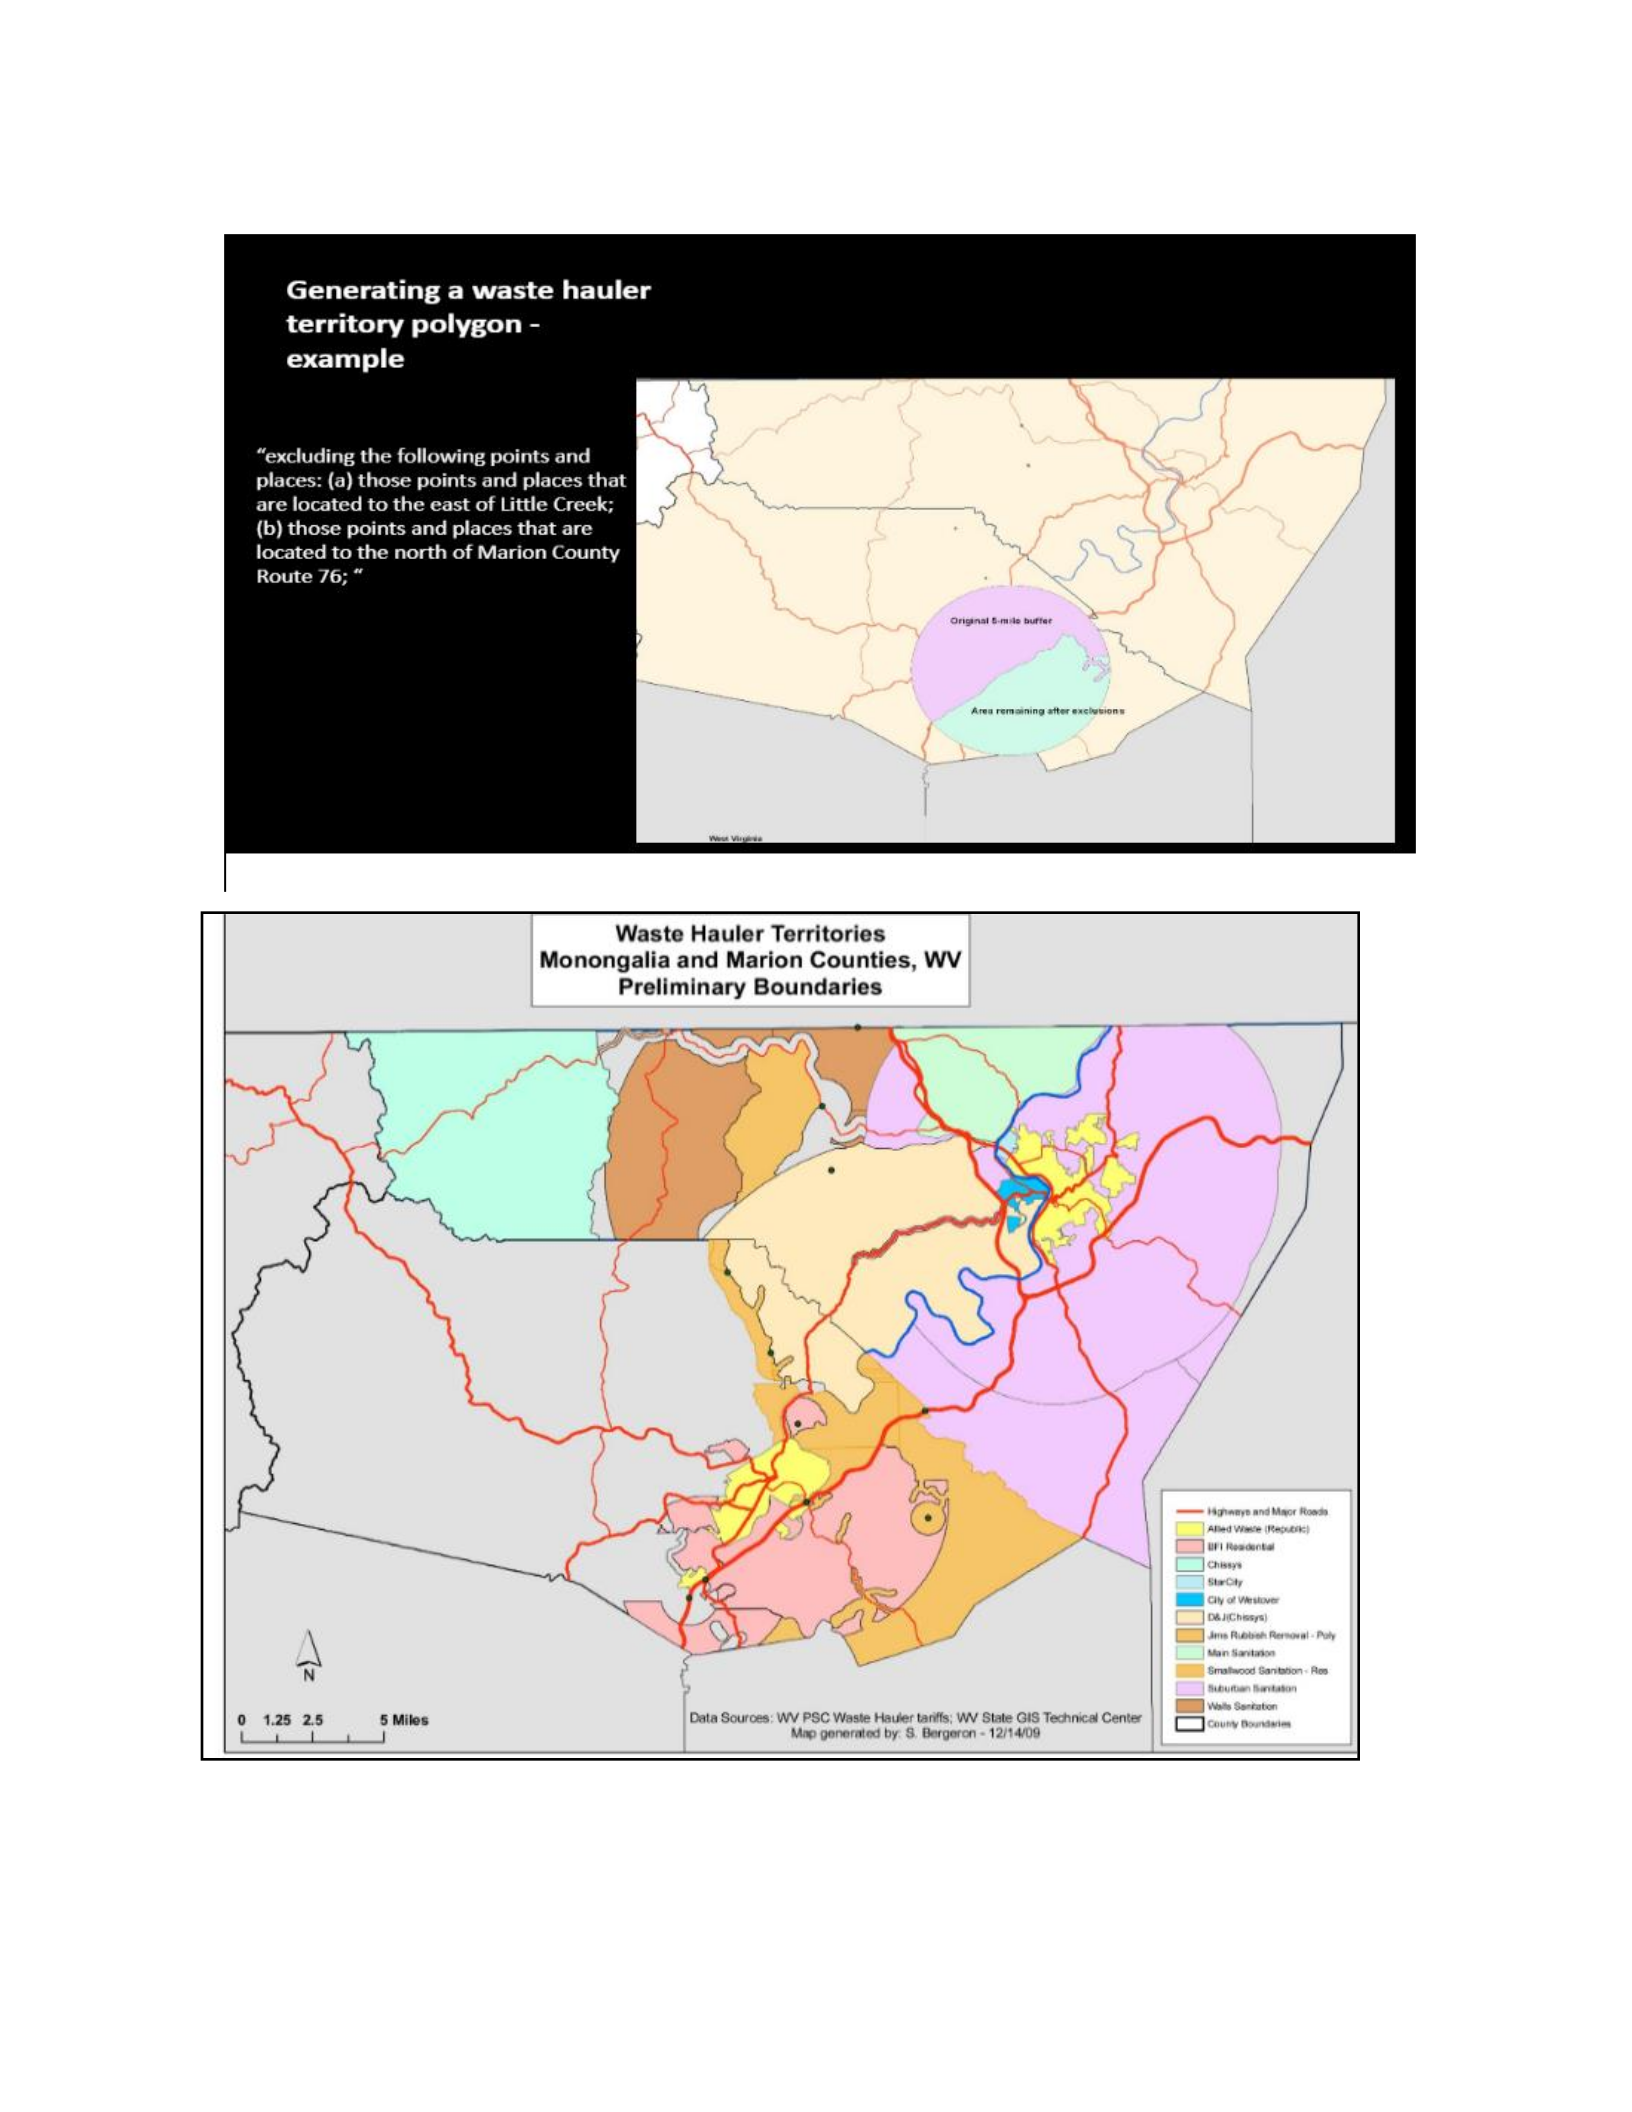
74
Figure 6.7: Exemptions to hauler tariff Source: Sue Bergeron
Figure 6.8: Final polygon after all exclusions applied
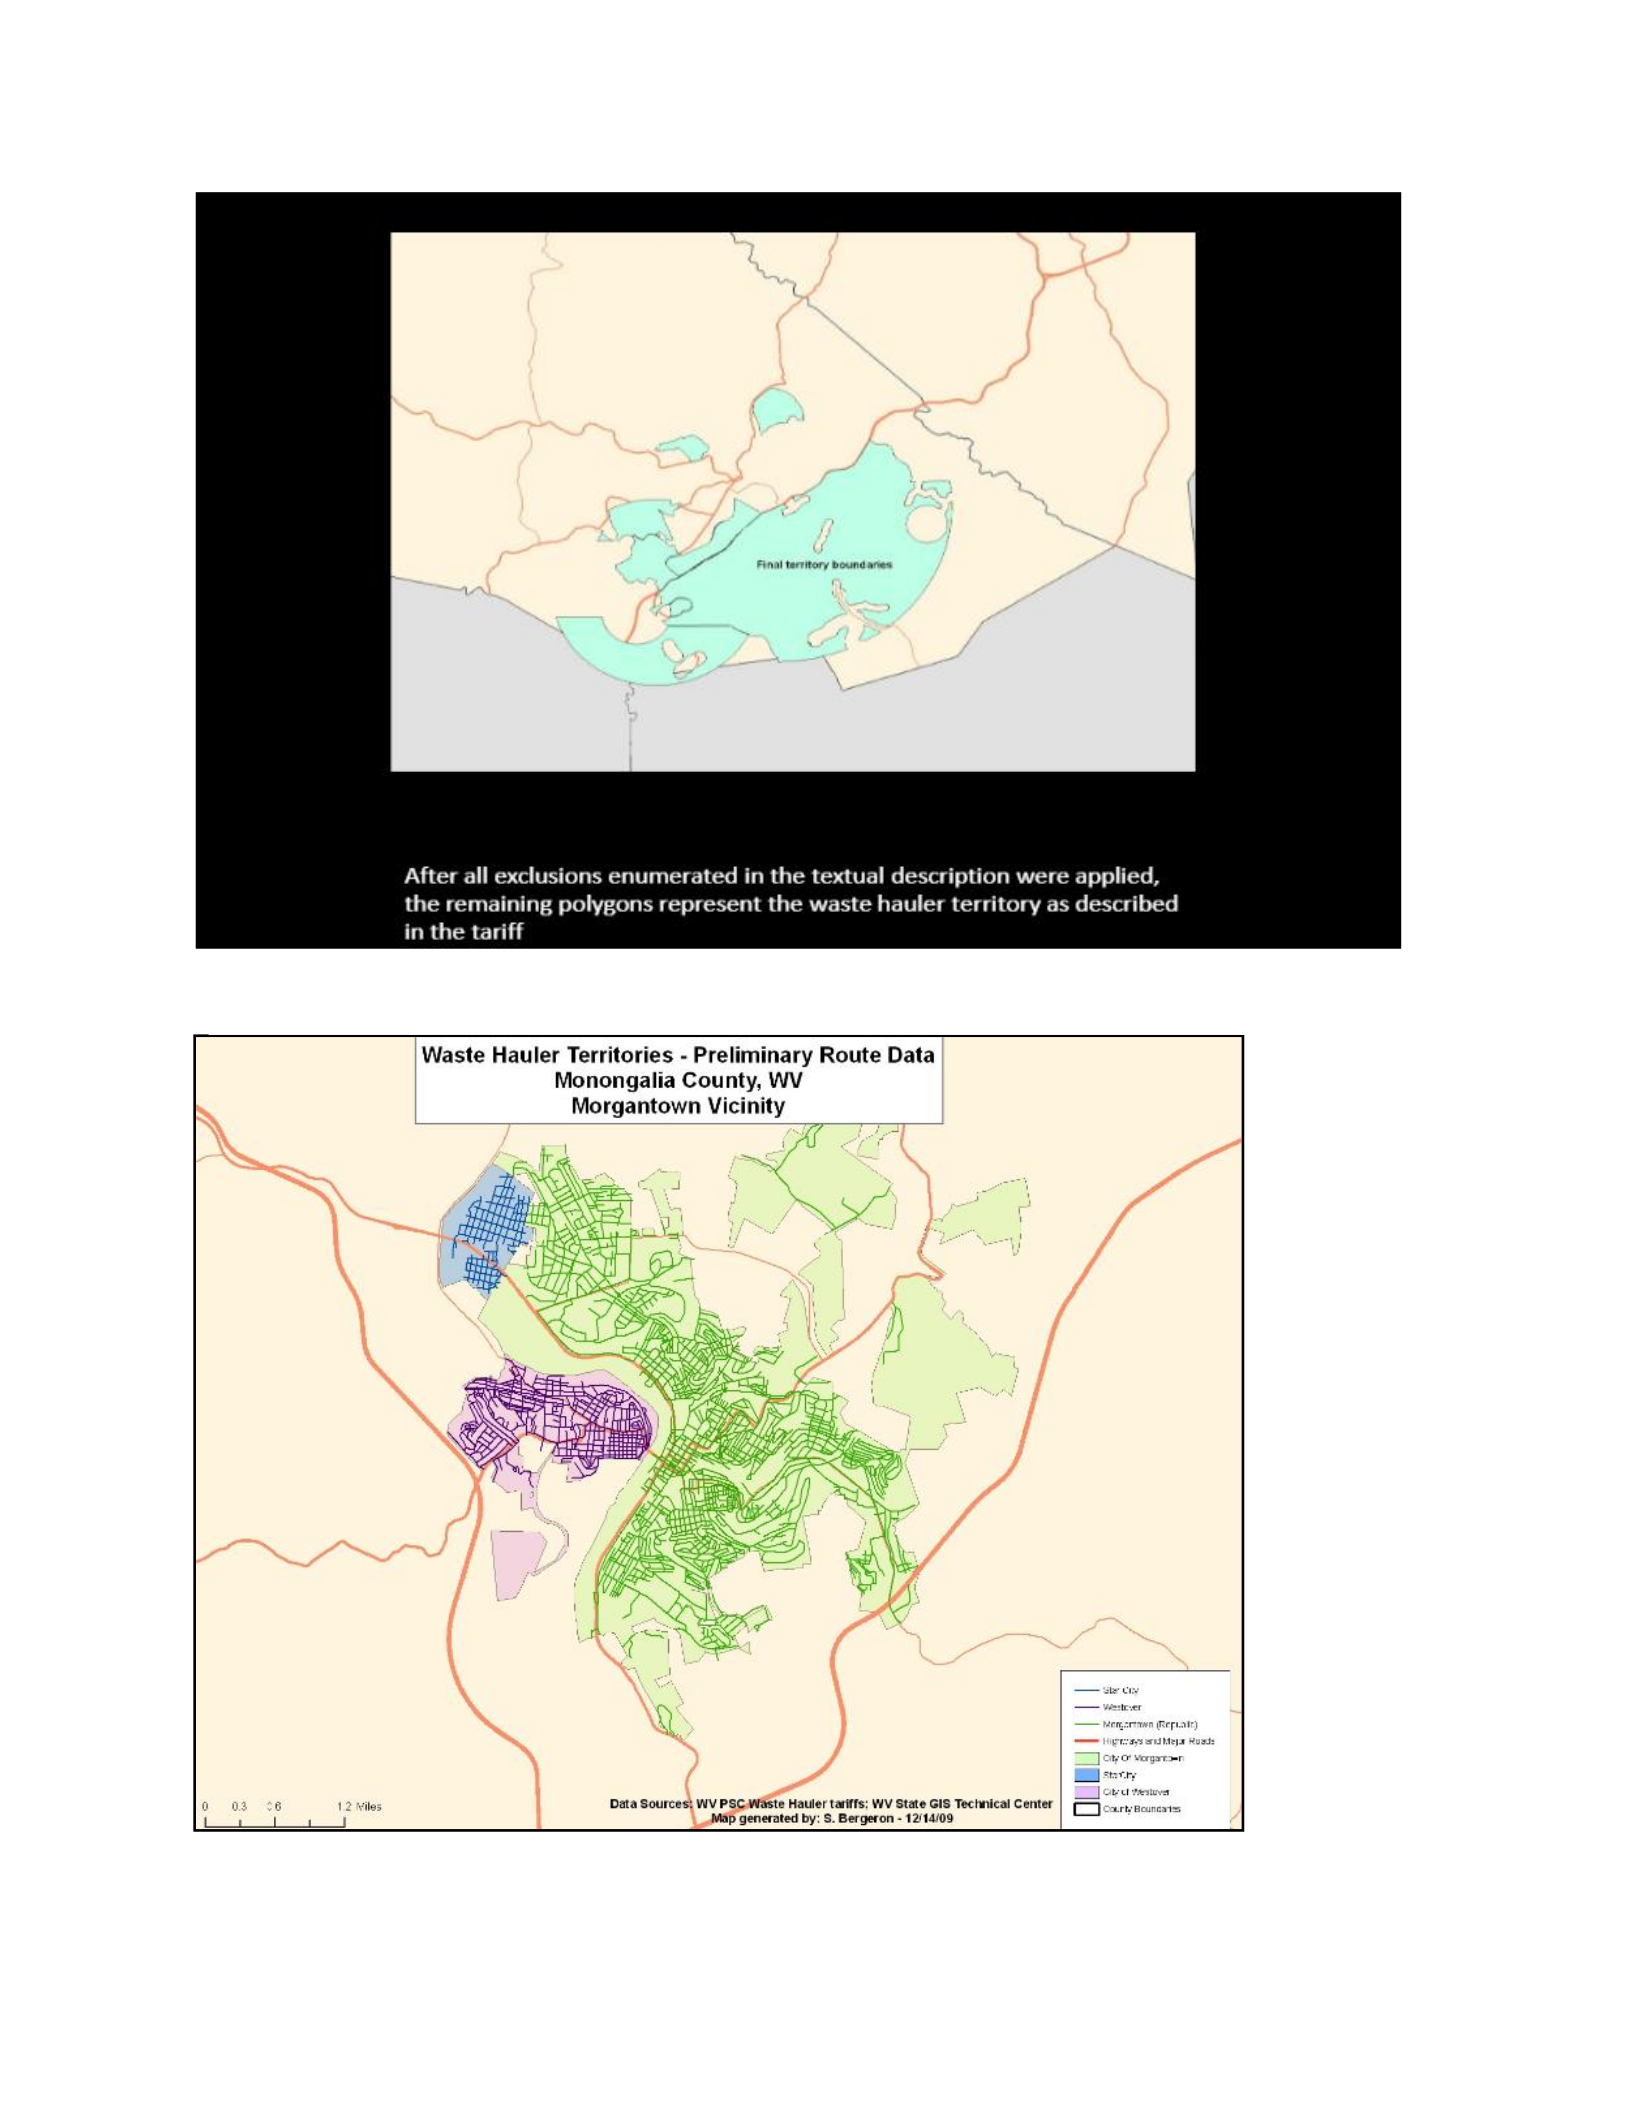
75
Figure 6.9: Complete waste hauler territory GIS layer Source: Sue Bergeron
Figure 6.10: Waste Hauler Streets
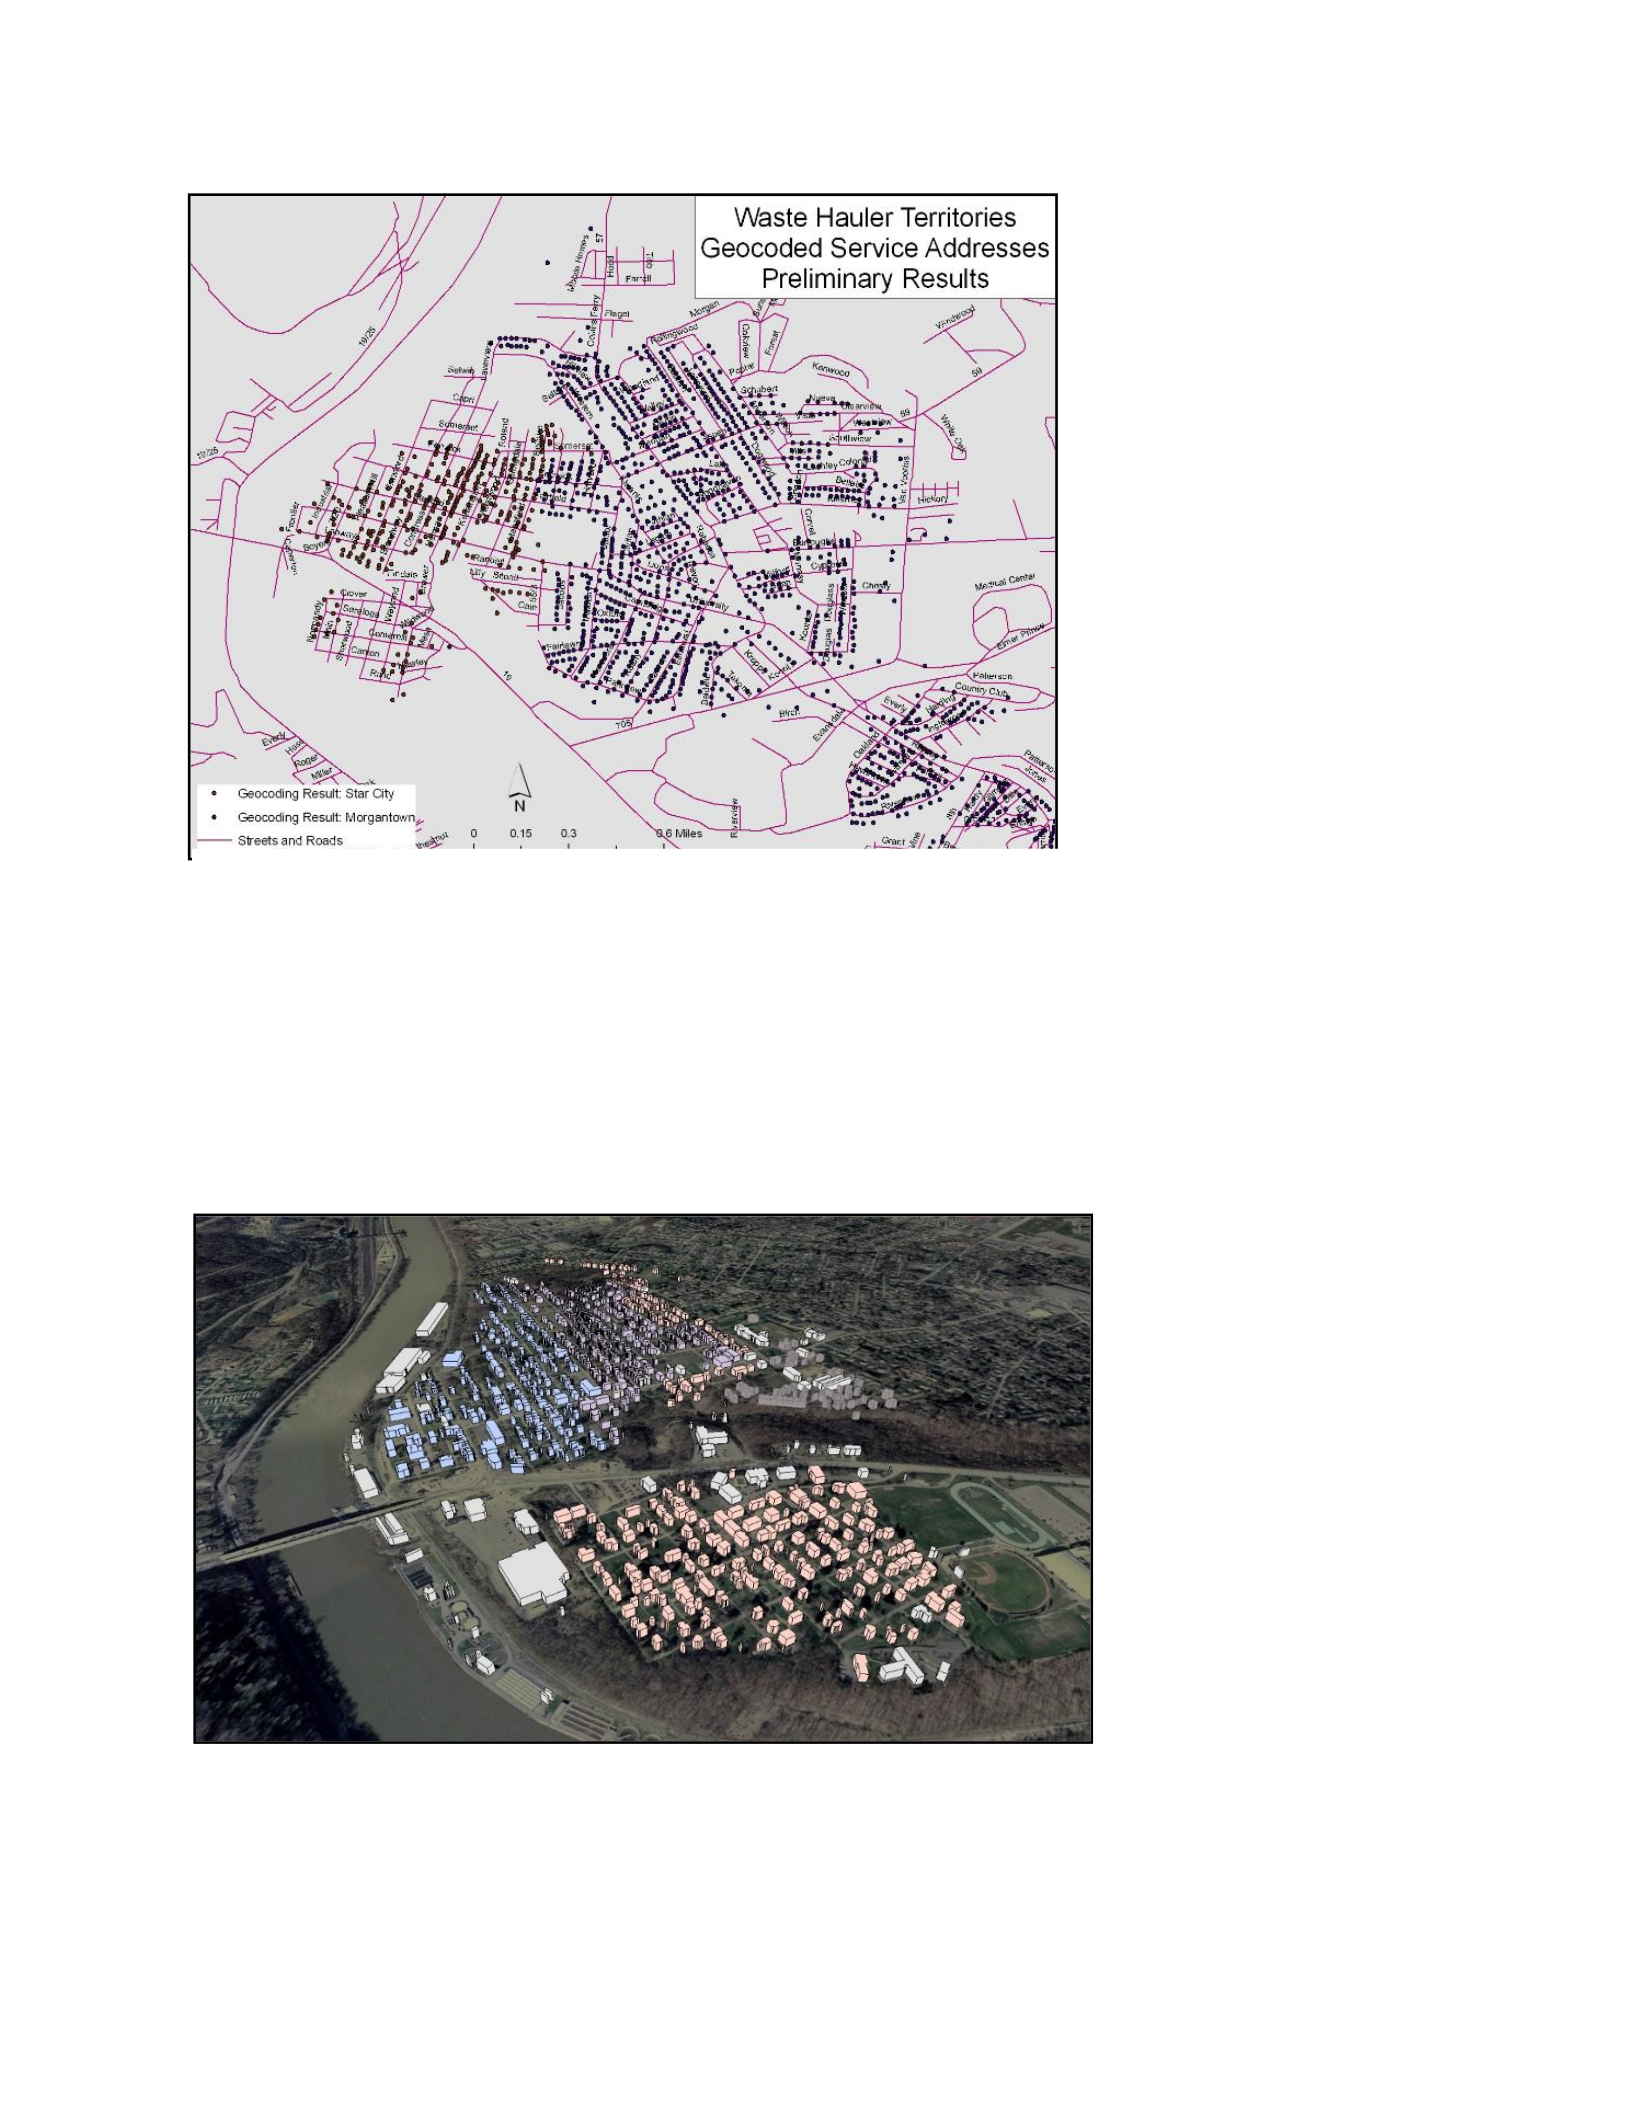
76
Not surprisingly the
turnkey waste hauler map
revealed considerable
territorial overlap and
omission and areas for
which no information is
available.
To demonstrate the power
of GIS, its analytical
capability, and its
visualization potential the author study created a 3D
geovisualization of the trash hauler routes in a pilot project for Star City, WV, using service
address data and hauler route maps (Figures 6.9, 6.10, 6.11).
Significantly for Star City, it was found that all its institutional knowledge was retained by only
one trash collector who
was approaching
retirement and was
already unable to lift
heavy items. To build
the GIS the hauler
was asked to use
different color crayon to
capture his knowledge
on a paper map of the type of pickup and the day of week. This map was then transferred into
digital form and ingested into the GIS (Figure 6.11, 6.12, 6.13). Notably, based on the 3D
Figure 6.11: Waste Hauler Geocoded
Figure 6.12: 3D representation of routes (MacLennan and Bergeron, 2014)
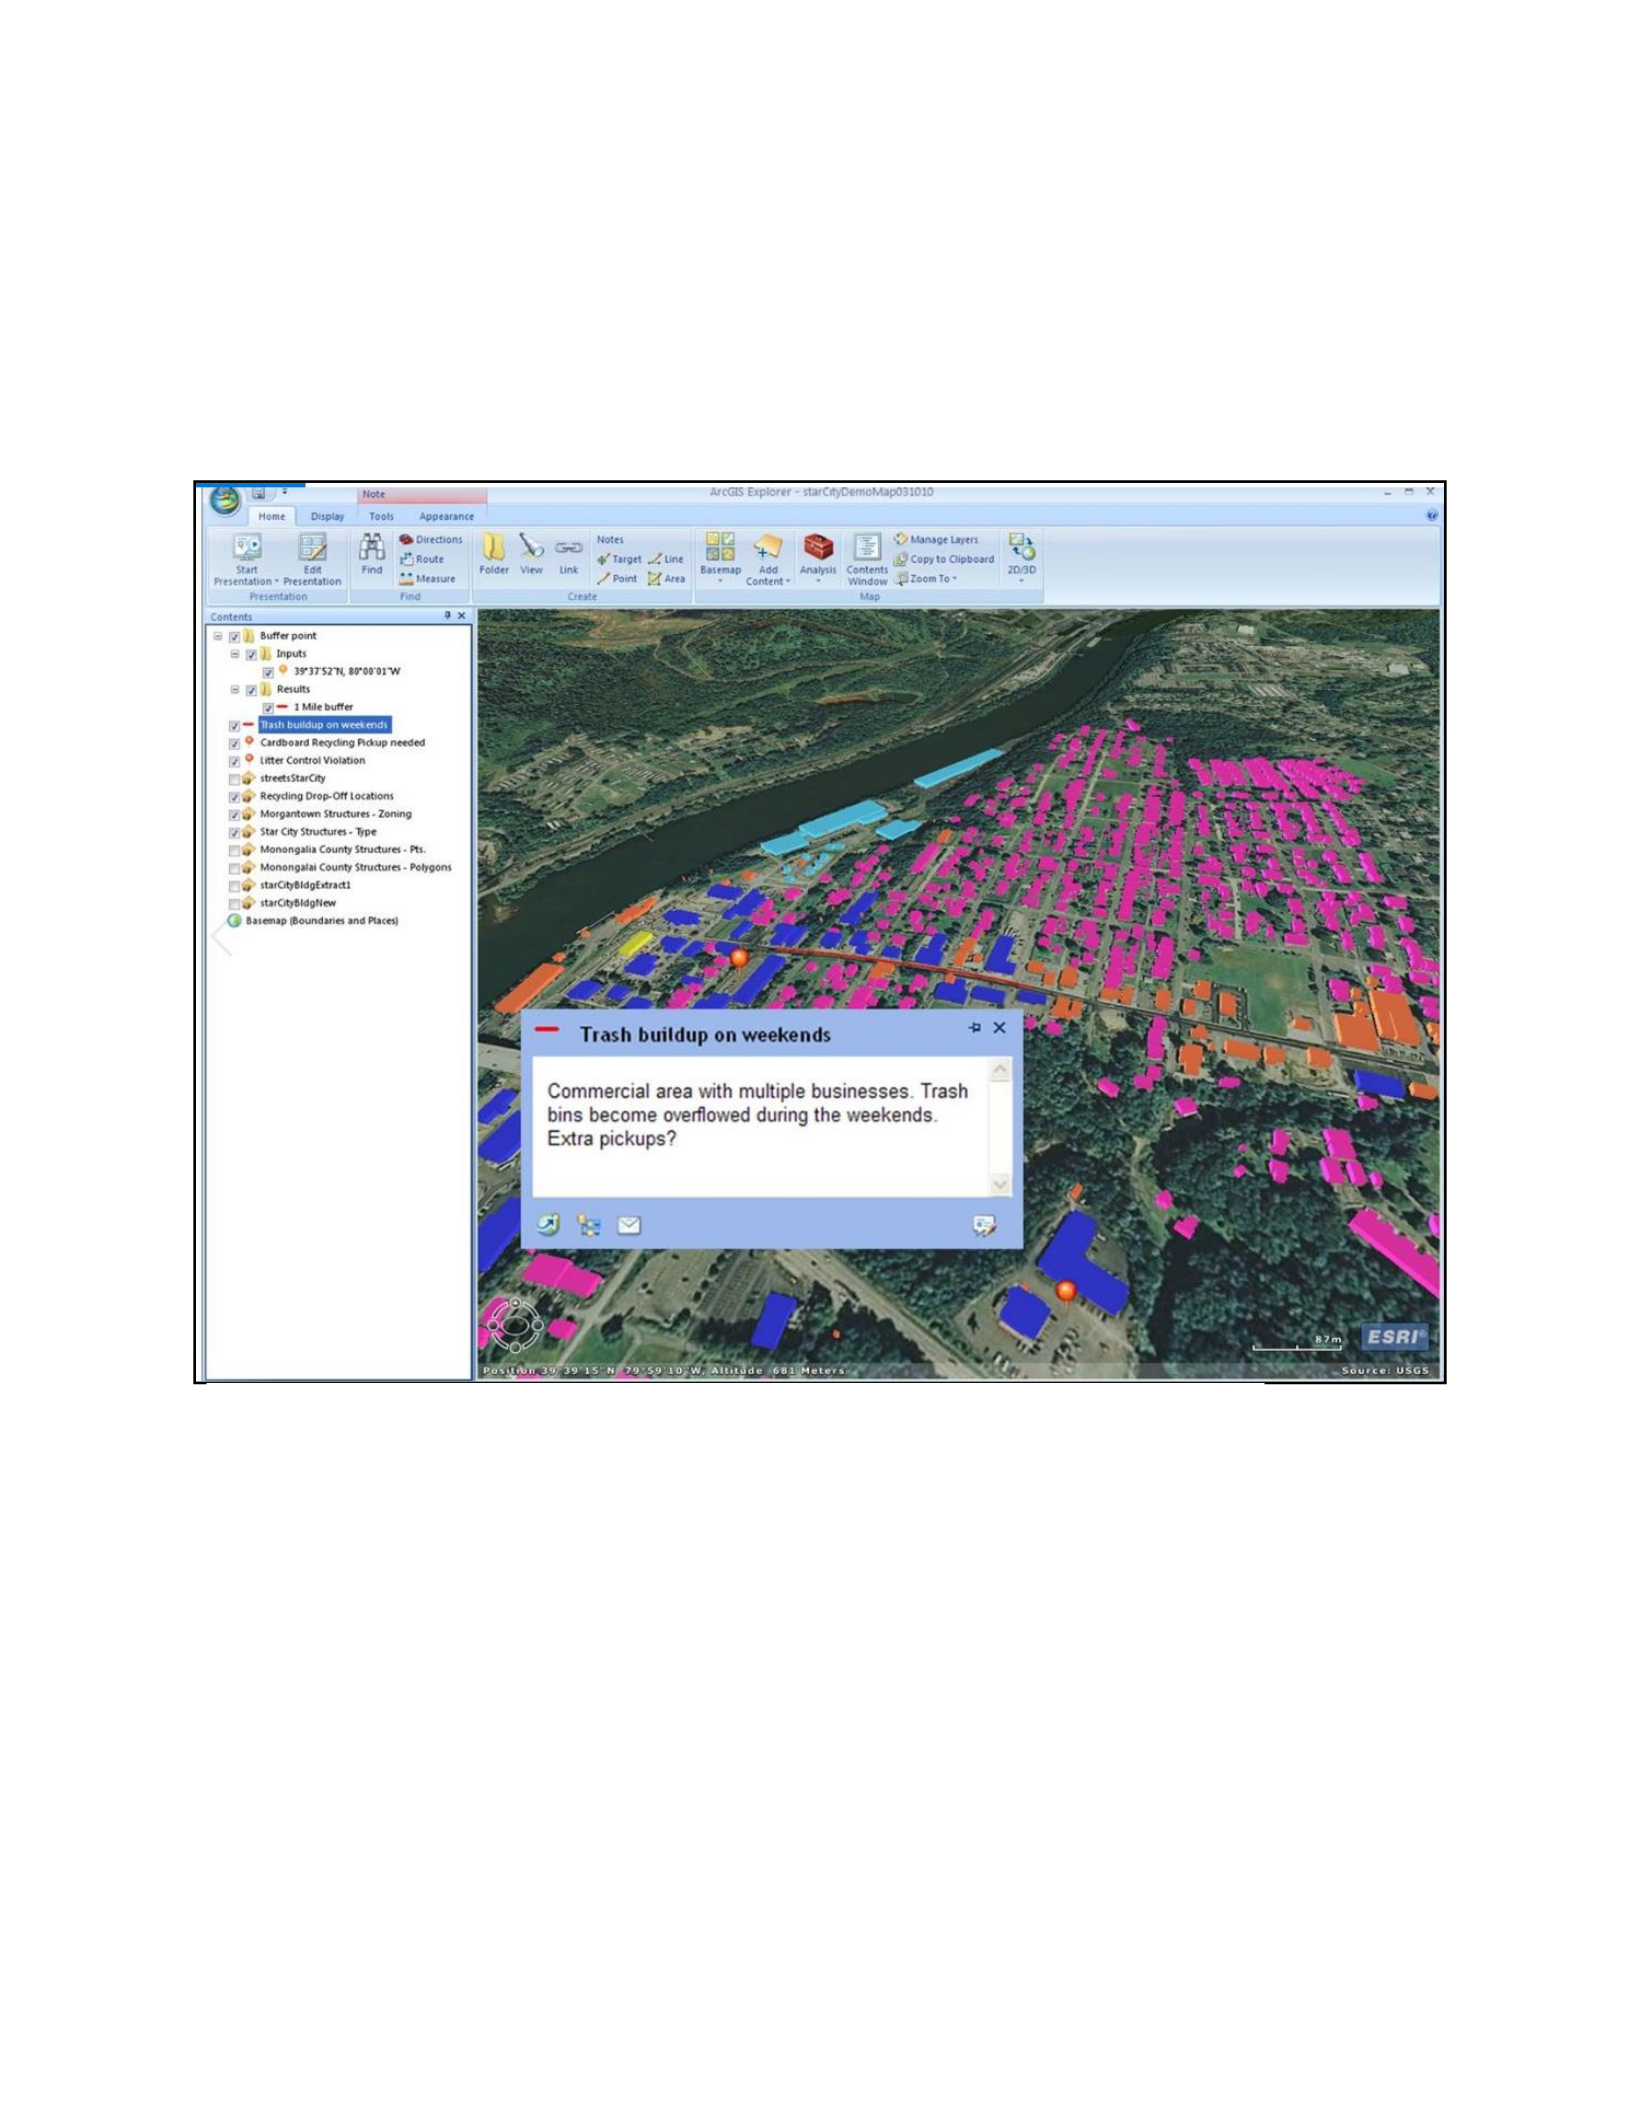
77
representation, Star City municipal officials came to several realizations including that their trash
routes were shrinking due to the slow creep into the area of other trash hauler companies hired
by the adjacent City of Morgantown and the existence of new facilities within the city vicinity
not covered by the current city hauler (Figure 6.12, 6.13).
The preceding chapter demonstrates the limited forms of mapping available for the solid waste
system in general and Monongalia County in particular, which falls short of providing a robust
system capable of handling the rules and regulations of multiple agencies across the spectrum of
waste management. This gap provides the stimulus for conceptualizing a policy-shed approach.
Figure 6.13: Shows trash pickup on weekends (MacLennan and Bergeron, 2014)

78
Chapter 7 A GIS-policy-shed approach to solid waste
policy
Given the challenges outlined above in mapping solid waste policy, alternative methods were
examined before the novel idea of using a GIS-based ‘sheds’ or ‘scapes’ was pursued. A
preliminary mind-mapping exercise was performed to identify the various policy, regulatory and
spatial components of the proposed system and to examine the relationships between them.
Mind maps are often used to define the boundaries and structure of a problem. Mind maps will
vary between individuals but are a powerful means of capturing the entirety of a system and as
an interactive tool for engaging complex geographical issues (Eppler, 2006; Lloyd et al., 2010).
In this exercise I sought to capture in diagrammatic form the many components I was seeking to
accommodate in my policy mapping – not dissimilar to a needs-analysis. Each radial line
represents a type of solid waste, who was responsible for handling it, and how that waste was
disposed (Figure 7.1). The radial lines could represent movement along hauler transportation
routes and landfills but could also include policy interaction between agencies and the WVPSC,
for example. The squares at the end of each radial line indicates termination of the dyad at a
location or outcome.
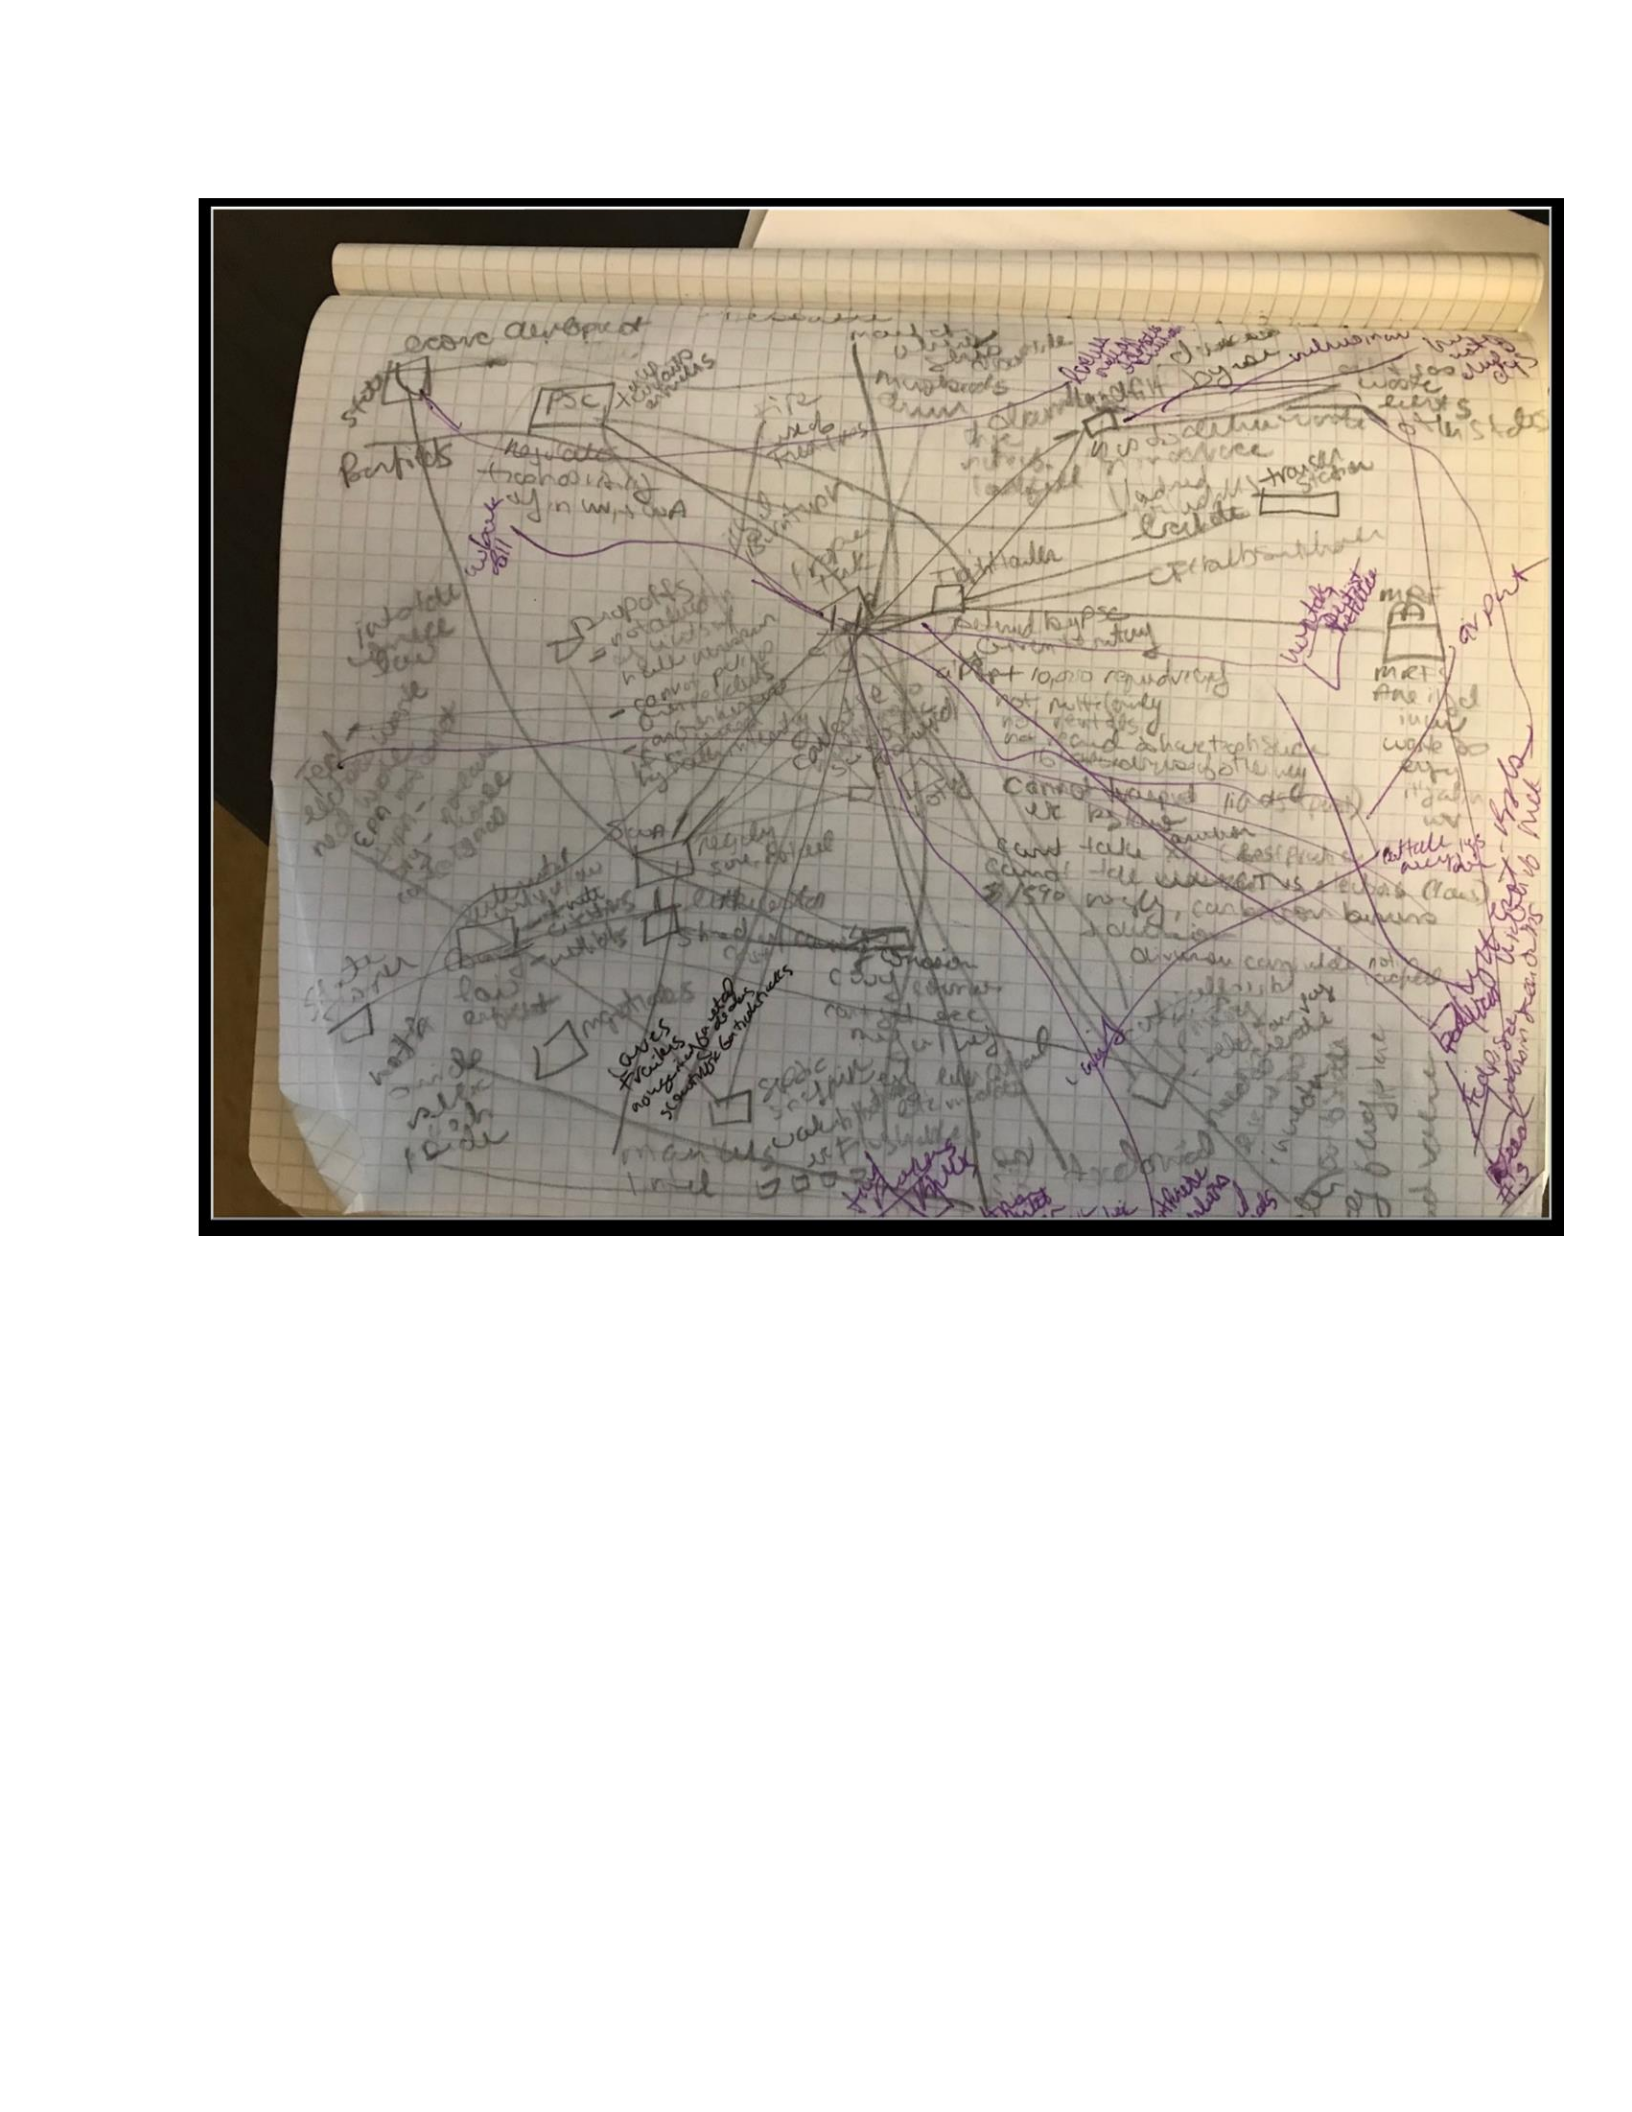
79
Figure Figure 7.1: Mind-map of the local municipal waste process in Monongalia County, West Virginia
Figure 7.2 illustrates an initial schematic representation of the solid waste disposal trash disposal
framework operating in Monongalia County, West Virginia. For household and business waste,
various disposal options are identified including disposal at transfer stations, landfills, or
recycling centers. Figure 7.3 is a more formal representation of a part of the initial sketched
mind map and shows the types of trash, means of disposal, and geographic location of waste
source and disposal destinations. Subsequently the U.S. EPA classification schema for solid
waste was incorporated though it became apparent that this pushed the useful limits of mind
mapping and the need for a formal database schema. Working with waste is like pulling a thread
that as it unravels takes one to many other places not initially considered. F or this reason the
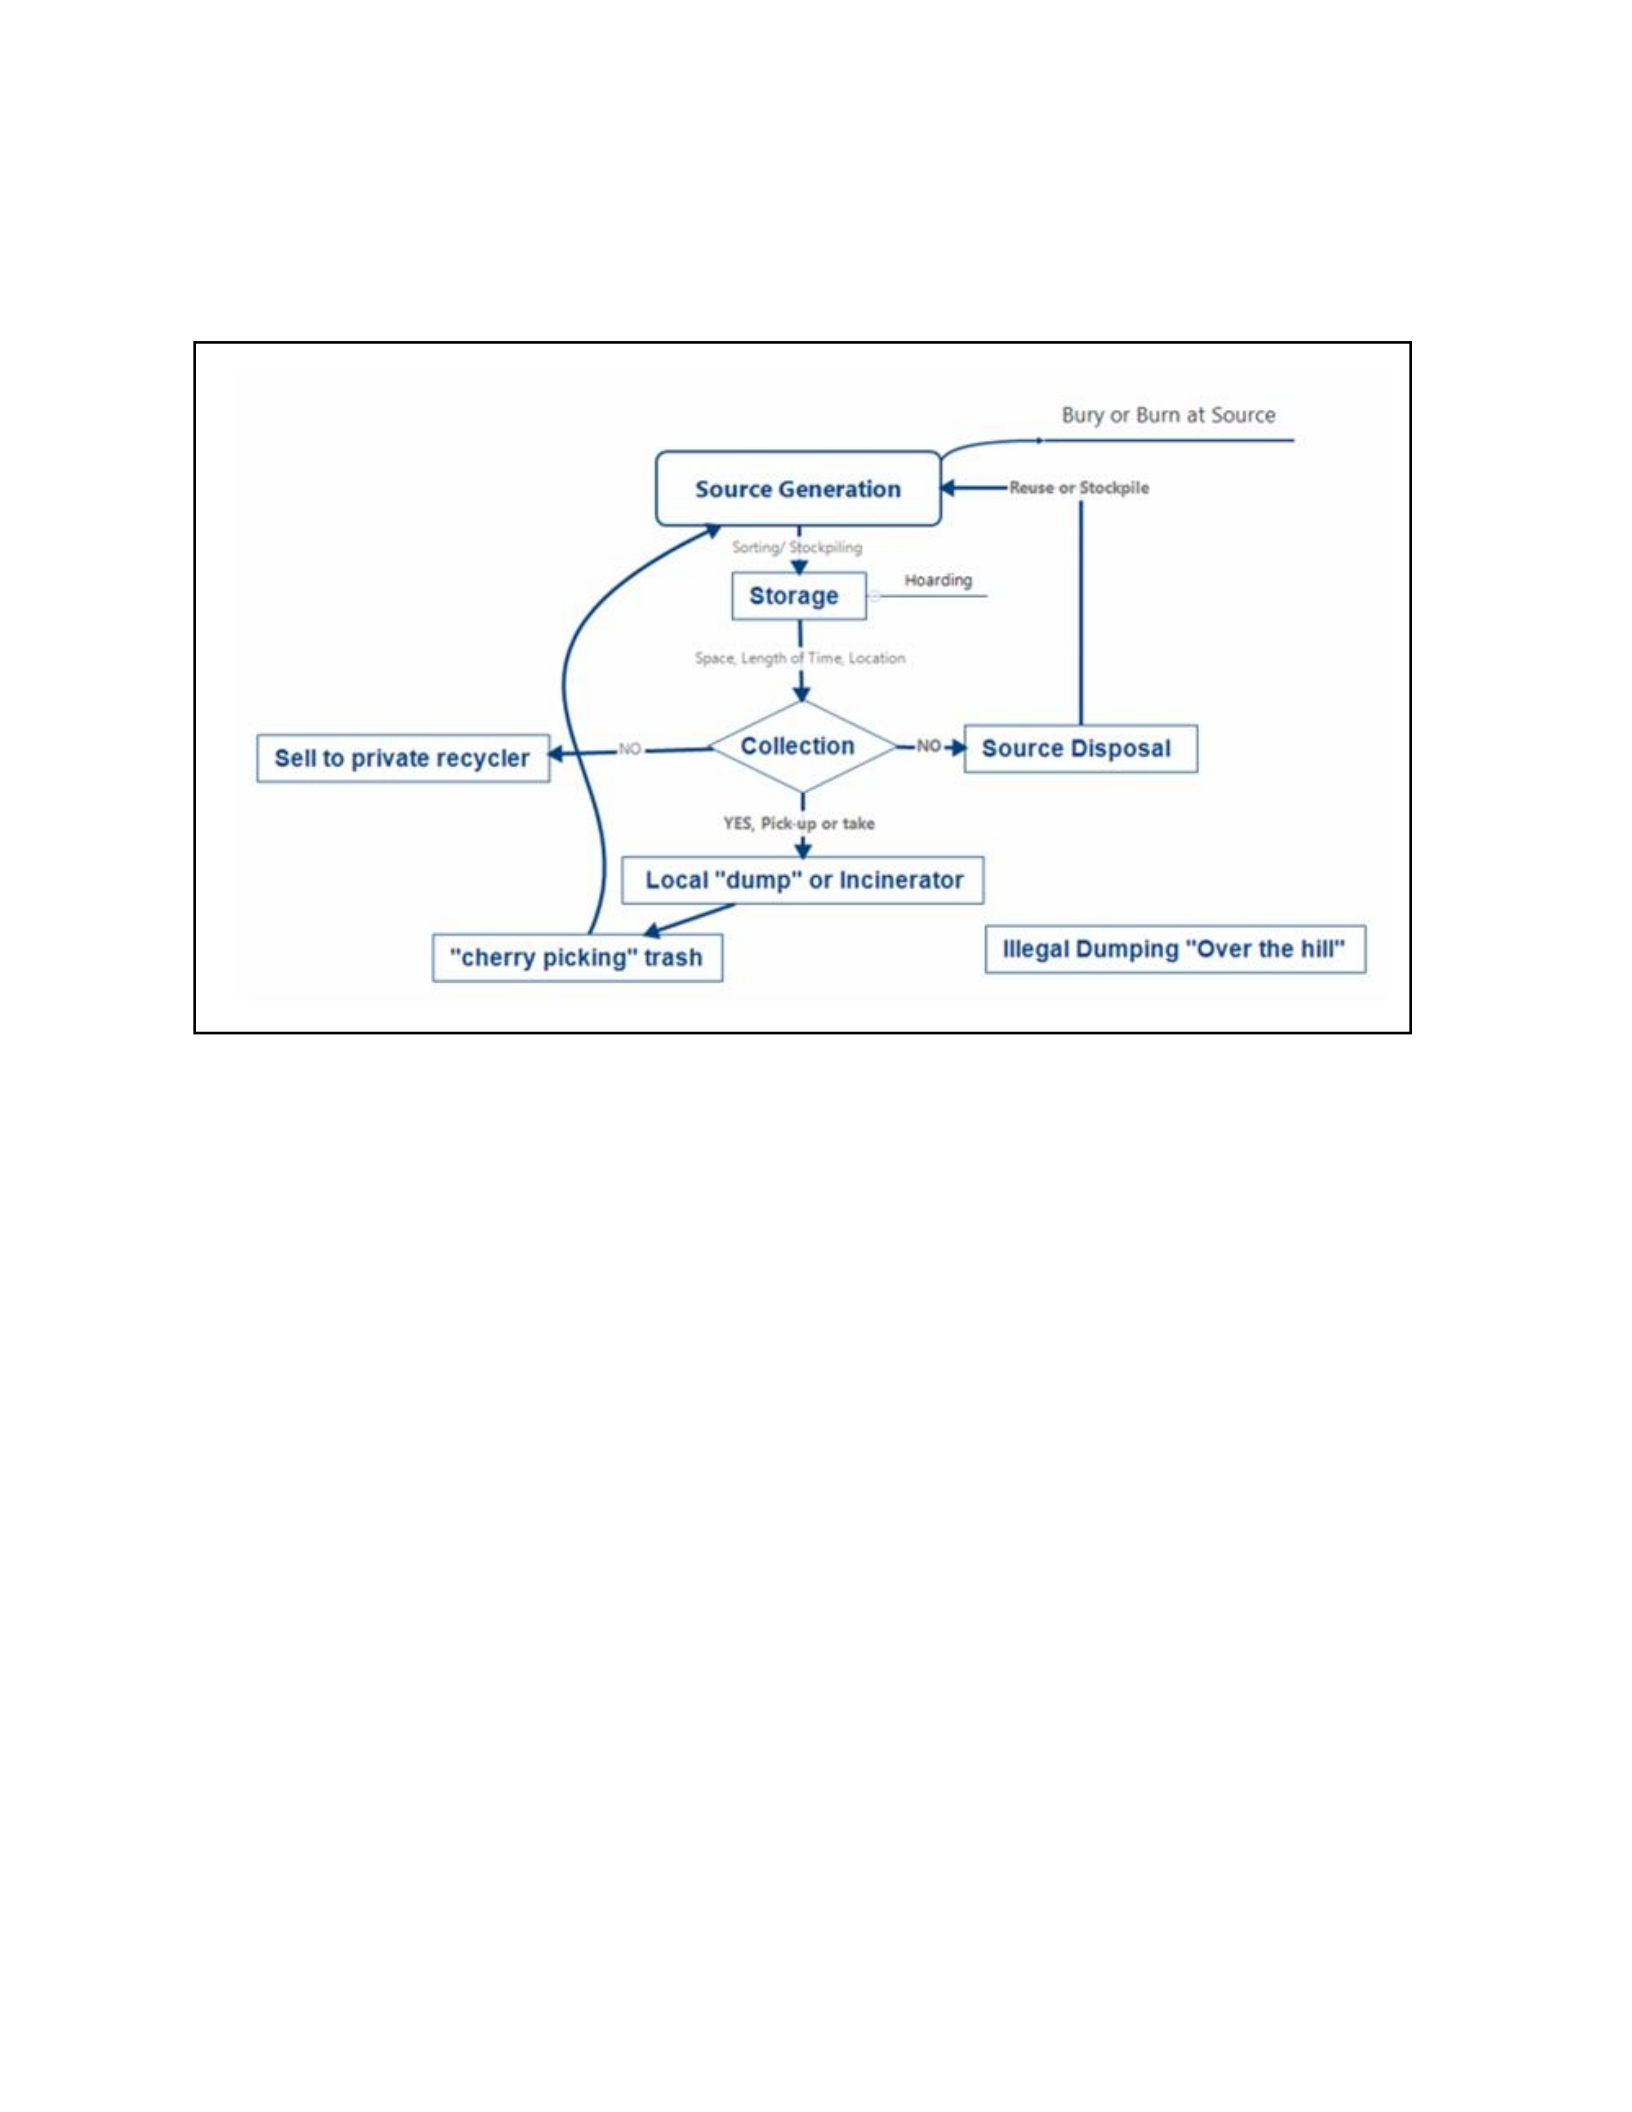
80
mind map approach was extremely helpful in in the early stages in structuring the many elements
of the solid waste system.
Figure 7.2: Diagram of waste flow
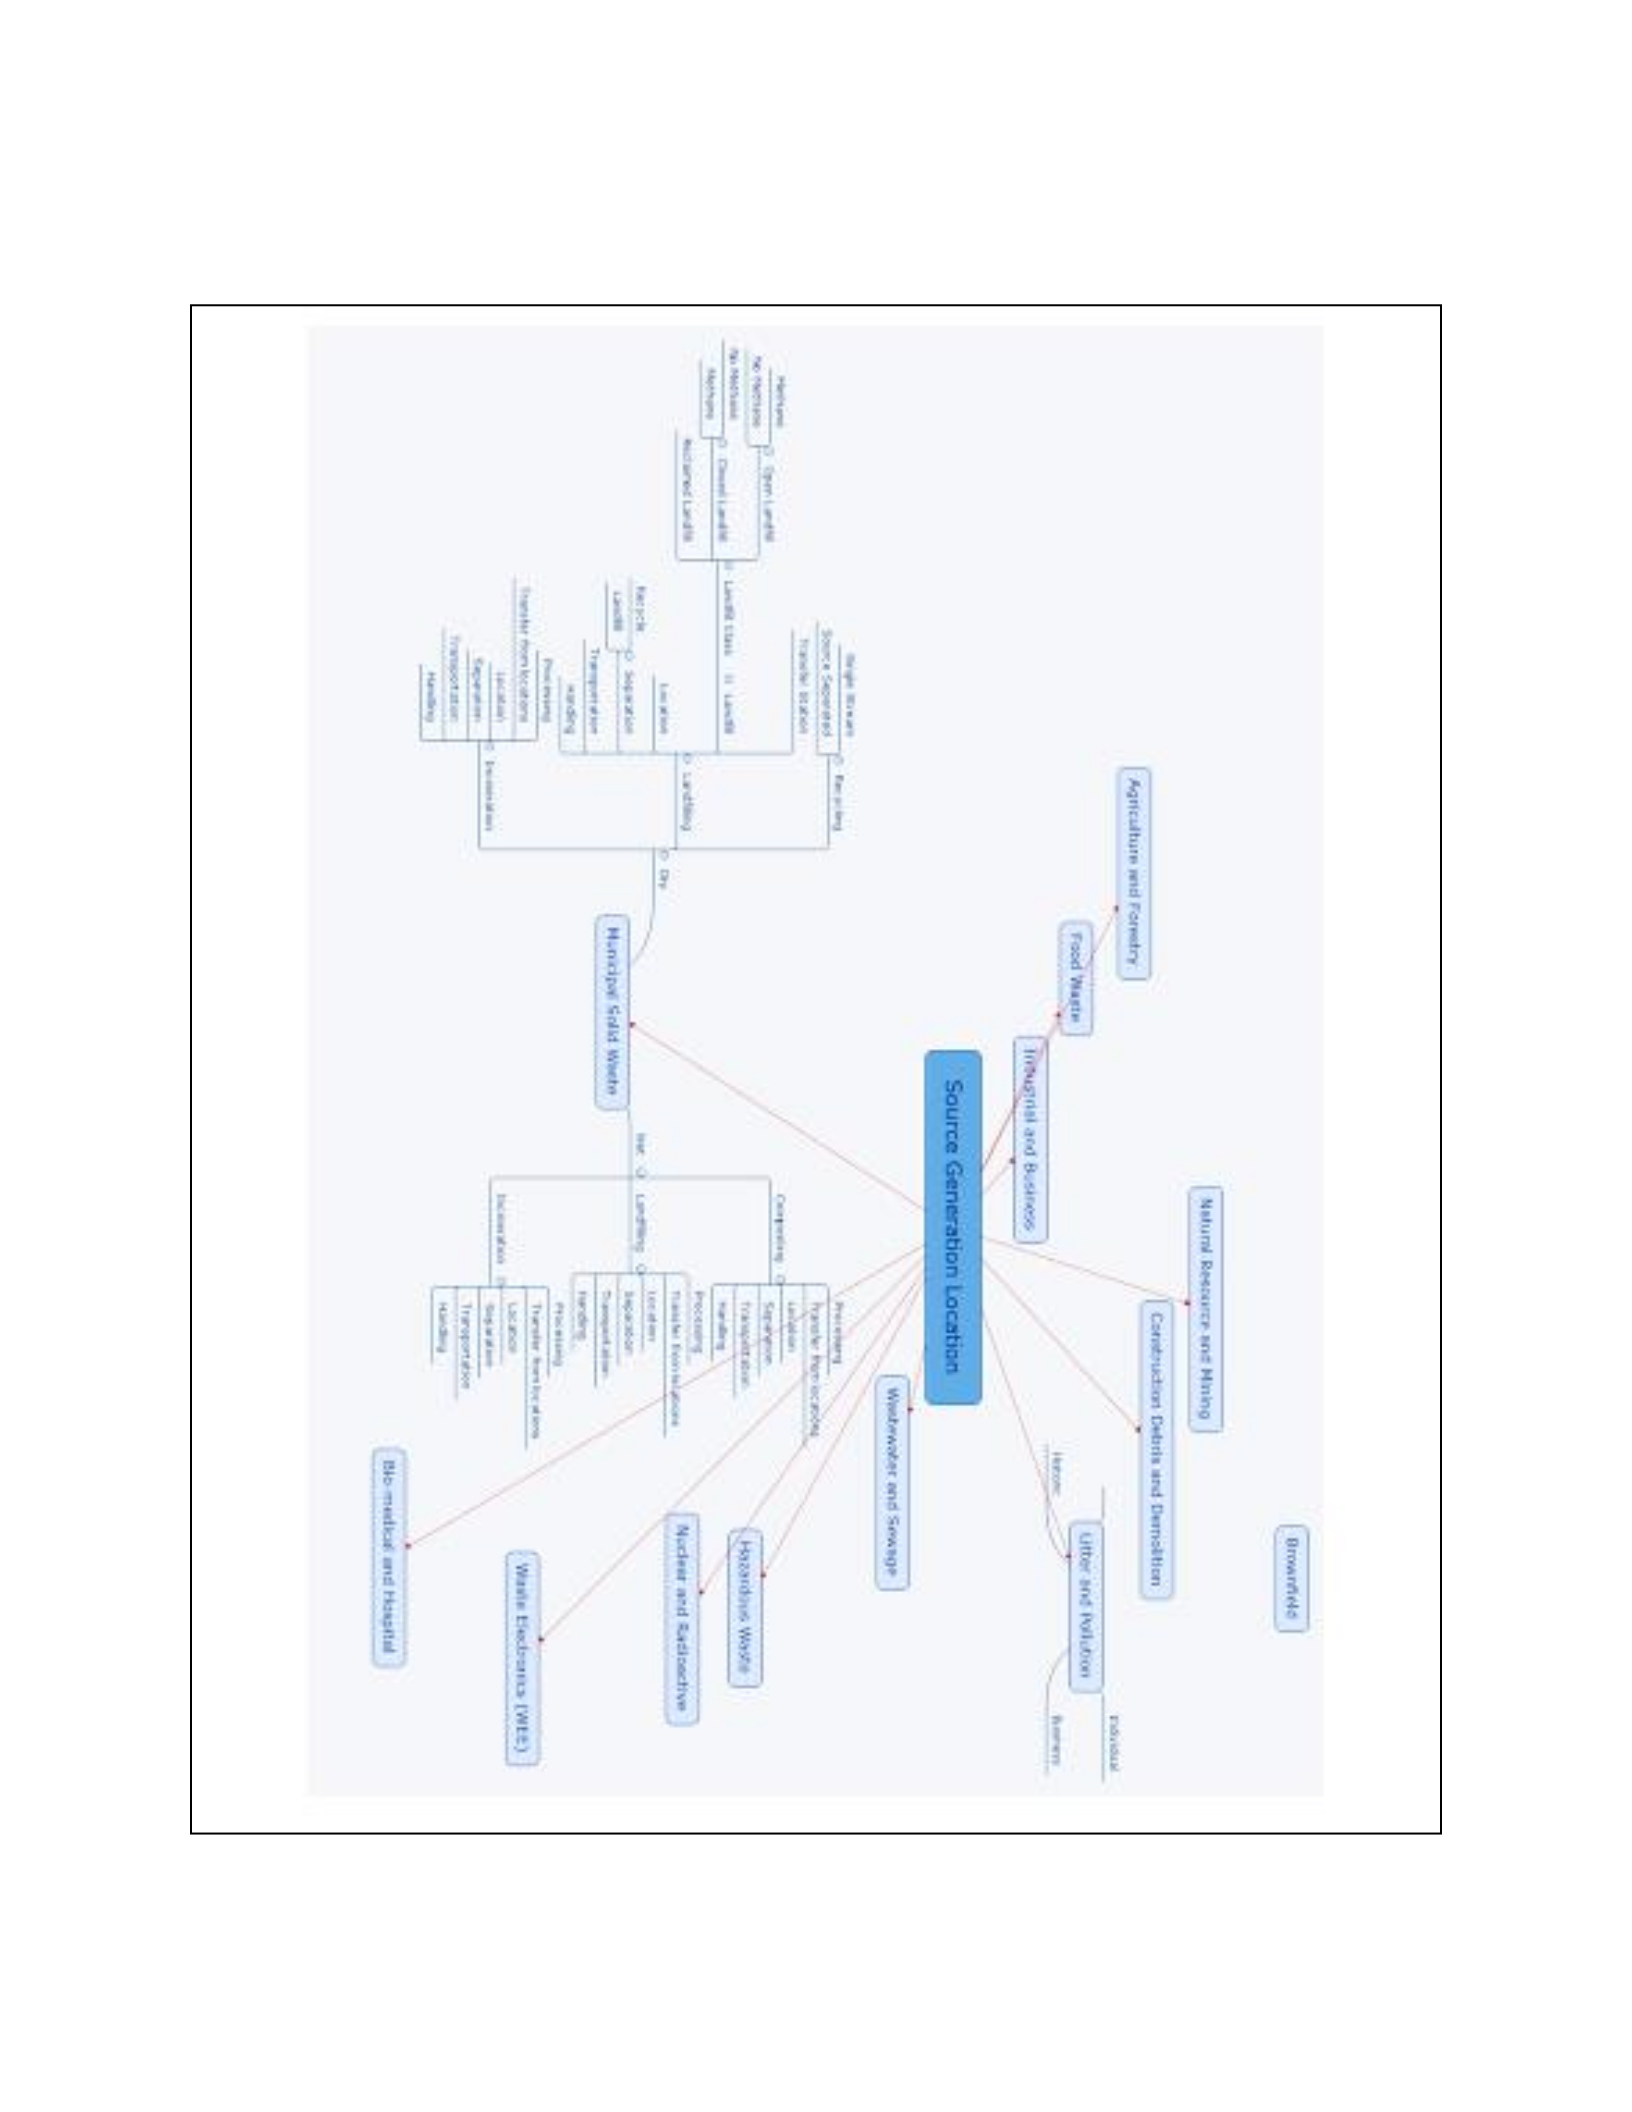
iL
se“
oe
.
.
2
-
--*
ae
an’
4
e
-
«
x
*
te
-
se
es
owre.
>
.
on
.
“=«“7«
‘
oe
Brearfide
Netura
Rescurce
aot
Mining
,
|
Conmteuctoat
Detetis
arcl
Dernottion
*
Agticaiture
peed
Poreetry
Utter
eet
Pofloban
ated
~~
.
Food
Waste
Hiiteastiel
aed
Bocas
»
|
Weelenmer
ano
Senne
mopecios
.
Mrs
Woe
a
>
in
waste:
5
ons
Nocieet
ard
Raticactive
ad
*.
’
Moncipa
Solkt
Weete
an
onhee
|
.
Waele
Cecivcrree
(WEE)
i
re
“
4
>4
Bio
wreeliod
enc
Peasiiel
81
Based on the mind mapping exercise several avenues were explored for their potential in
contributing to filling the policy-space lacuna. Heat map matrices use color-shading or color-
Figure 7.3: Source Generation Schematic

82
gradients to visualize data, whether numerical or textual. The color of each cell corresponds to
the magnitude represented in the cell and this magnitude could be the strength or porosity of a
policy relationship. Such visualizations can quickly summarize complex data sets and can be
used to identify possible structures, relationships, gaps, and other areas for exploration such as
identifying a grouping clusters of interest. The heat map matrix in Figure (7.4) was generated
based on the 2016 WV legislative session and displays solid waste and solid waste policy. A
matrix was also created for certain counties to capture basic policy areas that impact solid waste
policy based on the multiple publications and information sources of the WVSWMB (Figure
7.4). The matrix is composed of red, blue, green, and orange tuples. Red shows the existence of
policies that stand alone or have fixed boundaries such as Big P policies. When these policies are
stand-alone or fixed, they tend to relate to both bounded policies and literally bounded locations
such as prisons, military installations. Blue indicates policy areas that are fixed but have
unintentional crossover relationships with other policies. These policy areas such as air quality,
e-waste, and public health, ground water, tend to also be geographically porous. Green signifies
loose couplings between policy areas such as those arising from small p policy or best practices
while orange indicates policies and locations that are fuzzy or unclear. Some policies such as
recycling are desired but how they are done is vaguely defined and often filled in with best
practices. However, as can be seen most relationships between policy areas and their connection
to stakeholders is fuzzy or unclear. Heat map matrices can be generated for differing waste types,
places, or agency.
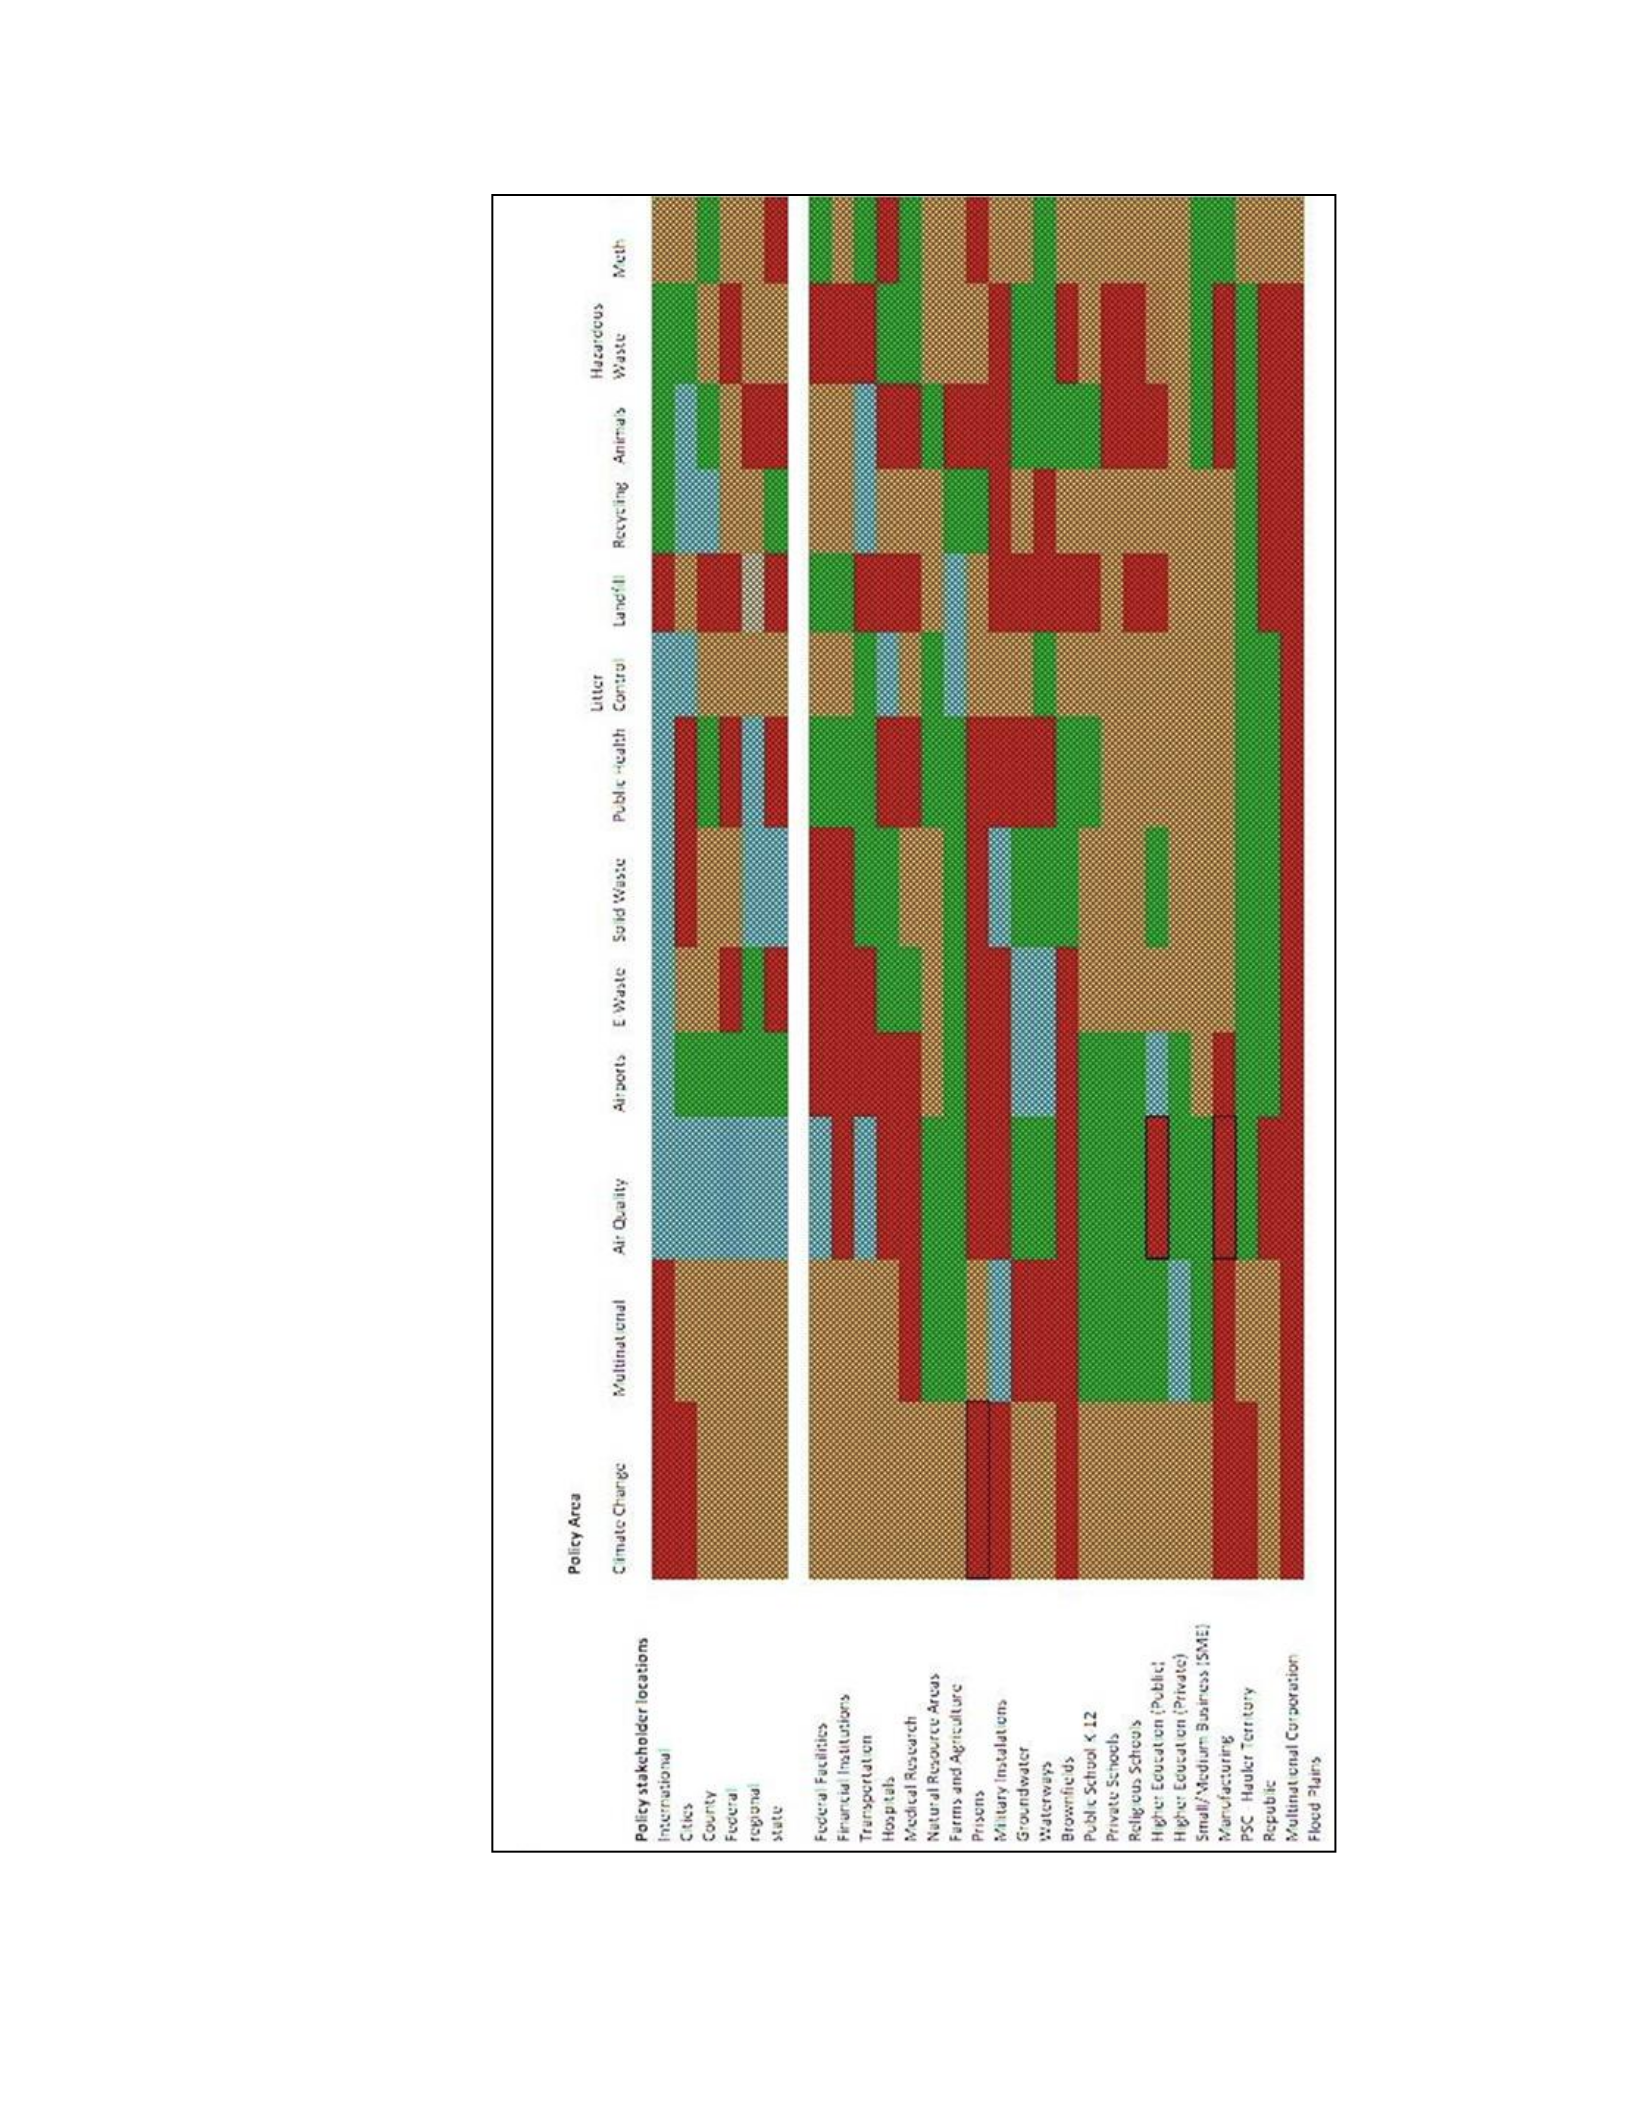
LIA
TSP
snapie2Py
{Pusu
AuprAwy
PpPuP]
anUue>
ion
yeas
Nd
SAAN
PLAS
UP
coding
AOND
any
[Pua
eUunNn
A
DAueYD
SPU
fasy
Aryod
SAP
fe
PAY
MIO}
pPUa
wUNniNyyY
miqnday
ANVIL
INP
DSd
Suanyseyquey
HWS)
SSAUSNE
Garp
fpPus
(PALS)
UANPINDZ
24a
1299%e)
UN
IPIND
UAH
SMaysS
tna
Ady
SJQOUSS
ARAL
ZT
>
JORHIS
VIKA
SPayuNeg
SARAIDIP
SNPAPUIGLH
SU
PPP
Ae)
APNEA
suastid
Suny
auay
pur
sues
SPATS
AIWNOAY
IPINIAN
IDLPASAY
[PIIPAYY
Spey
dso
UMP
VOGsuRL
SUP
INSUY
PLUM
Sonpreg
(PuADAY
ayes
puna:
PinDAS
AMINO}
s<™yD
PuOnMuML
SUORLIO!
d9P/OYrHEYS
ADO”
83
Figure 7.4: Solid Waste Policy Matrix
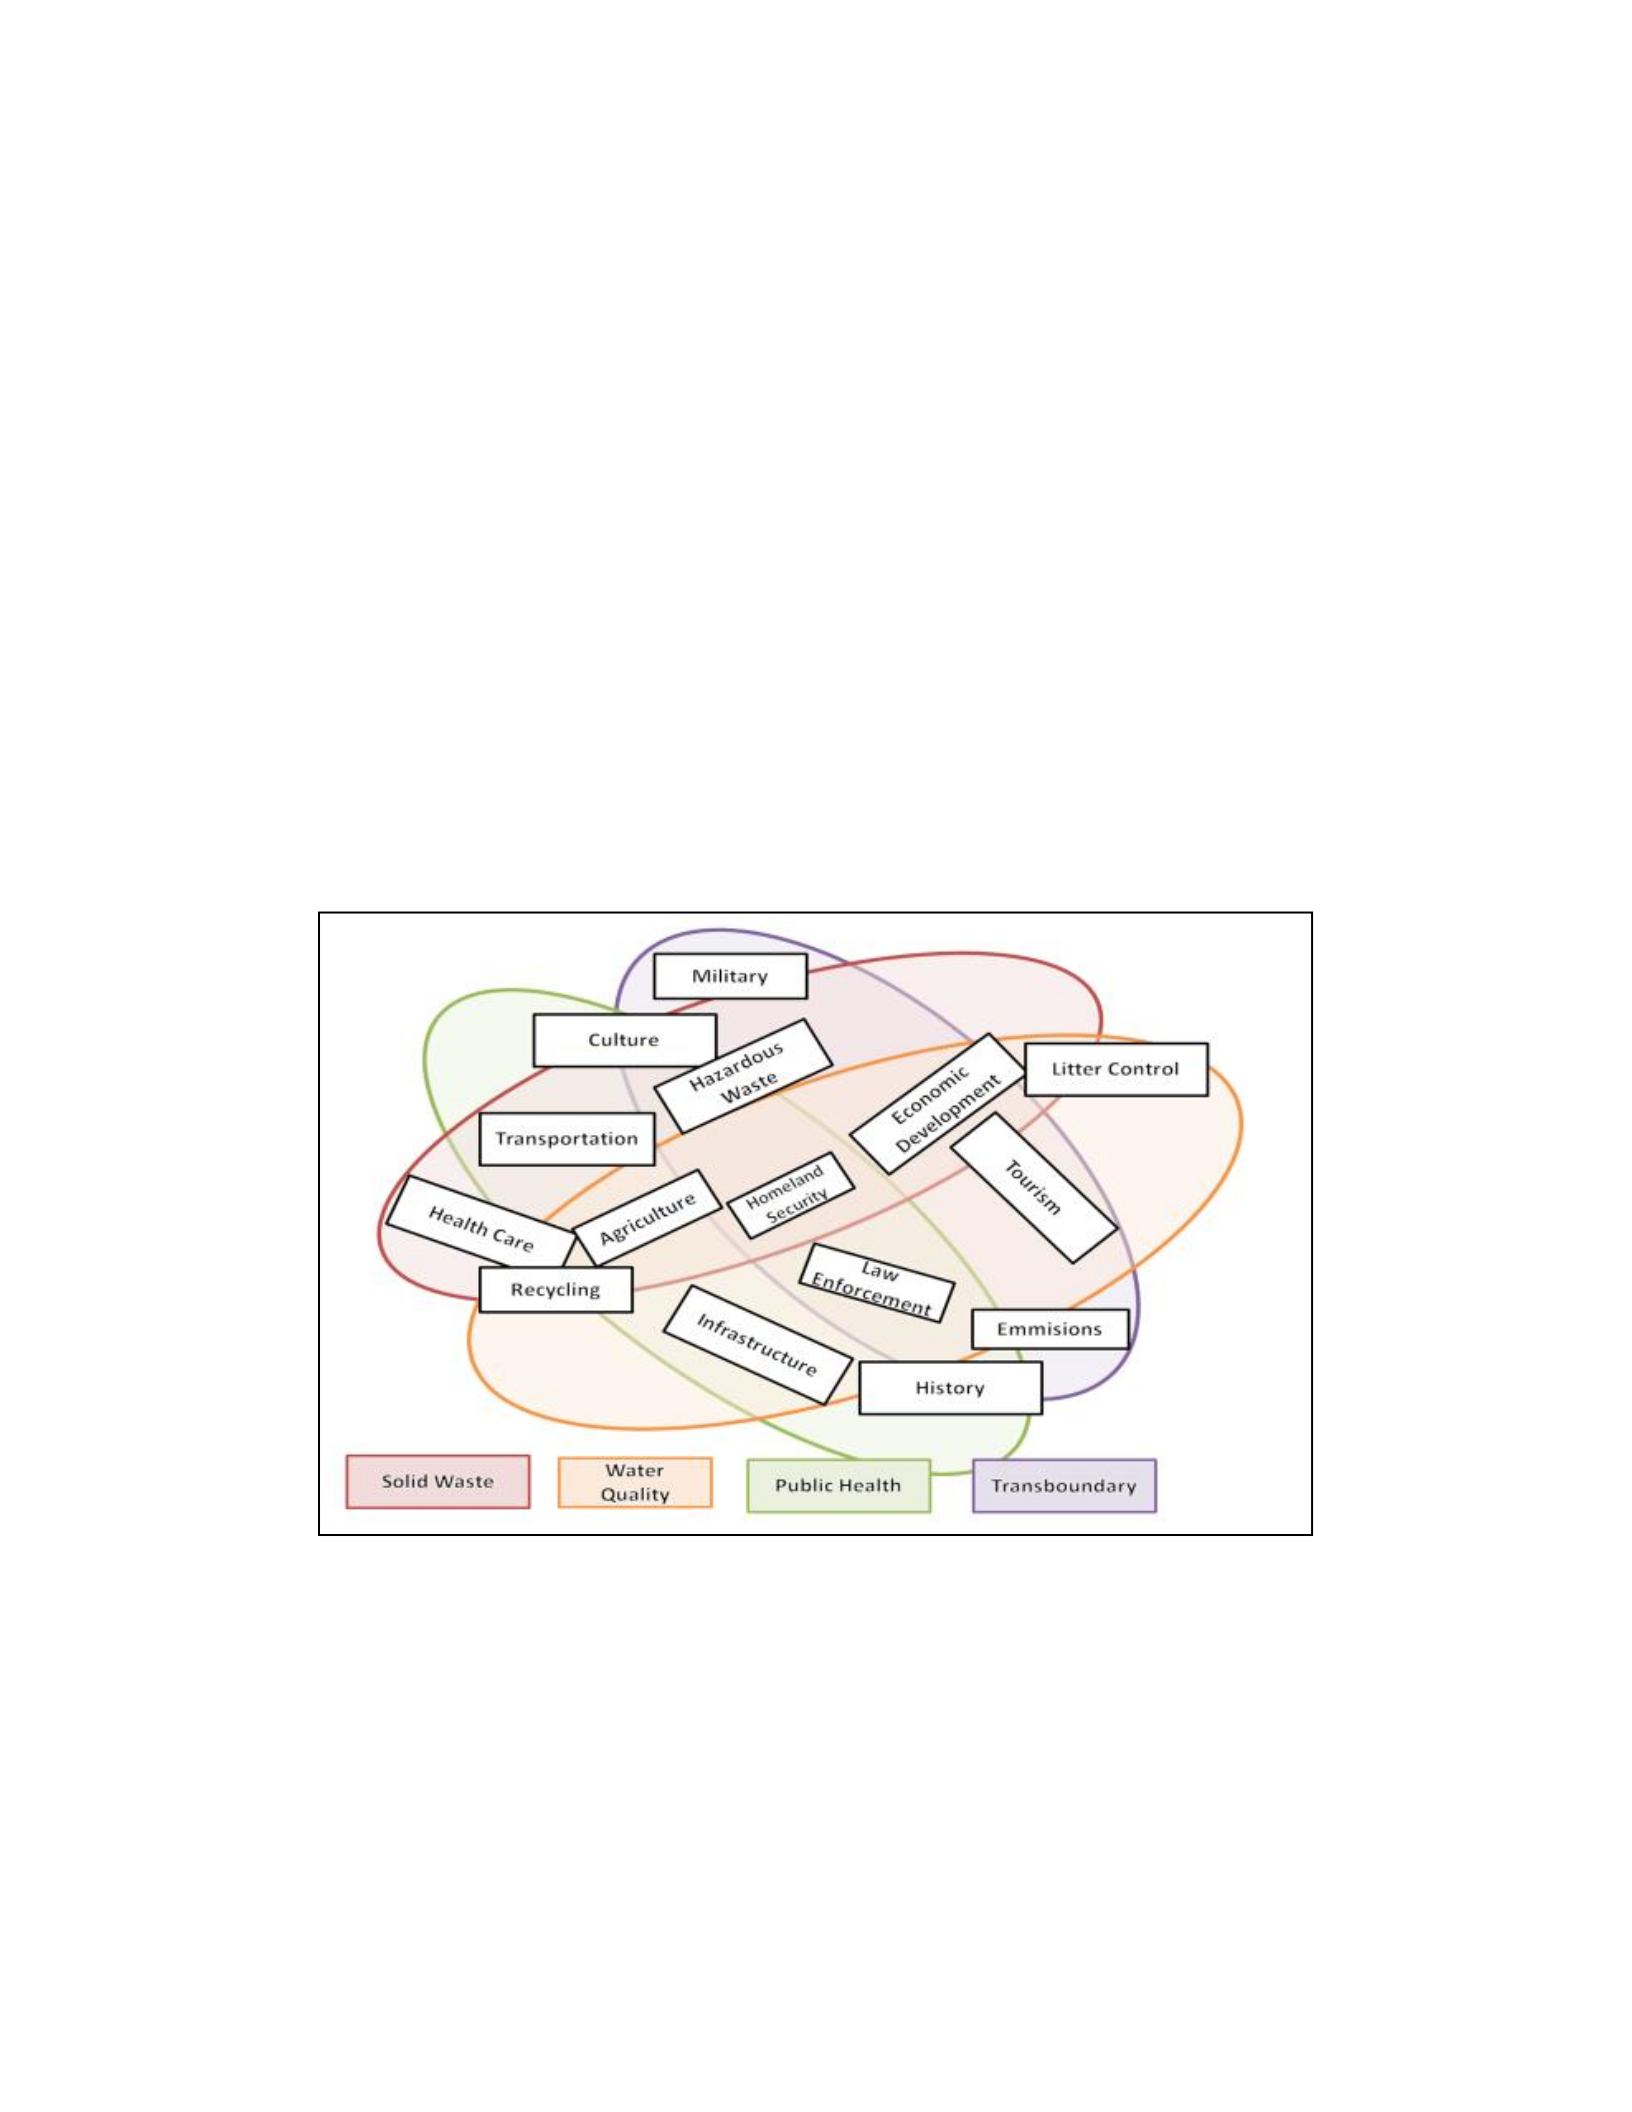
84
A heat chart can simplify complexity and highlight policies that overlap and those that appear as
outliers. However, after extensive experimentation with heat matrices the difficulty of handling
the spatial relationships and issues associated with scale, geography, or spatial relationships
could not be overcome. In many ways, a heat chart matrix is a precursor to forming a
geodatabase schema which requires deliberation as to the relationships between location,
coverage, and attribution and generating heat matrices was a valuable exercise for that reason.
Experimentation was also made with Venn diagrams to determine the interconnectivity in the
solid waste regulatory system (Figure 7.5). A Venn diagram was generated to capture the
medical waste system for Marion County, Monongalia County, and Harrison County in north
central West Virginia. One outcome of this exercise was that the Venn diagram appeared to
perform a reasonable job at visually capturing the various intersections and overlaps of waste
policy areas. However, the aspatial representation made the exercise valuable only for
identifying the primary policy components and their relationships.
Figure 7.5: Monongalia, Marion, and Harrison Counties Intersecting Policies related to Medication Disposal.
While useful, these exploratory exercises did indicate the challenges associated with developing
a system capable of recording multiple regulations for multiple spatial units that was capable of
being queried based on specific location and policy regulation. Ultimately, the concept of a GIS-
based -shed was examined. Watersheds provide a powerful metaphor for developing what I have
termed solid waste policy-sheds. As units of hydrologic classification, within defined

85
topographic areas, watersheds are critical in examining surface and shallow groundwater flow to
common outfalls (Winter, 2001). Even though watersheds may cross multiple administrative
areas, they are a primary organizing unit for water policy and water governance and are used by
USGS and EPA for water quality assessment (Figures 7.6, 7.7, 7.8) (Loë and Patterson, 2018).
Watershed boundaries can be fuzzy and multiple tiered watersheds are nested within each other
which is somewhat contrary to the spatial way the regulatory framework for solid waste operates,
nonetheless the analogy was intriguing.
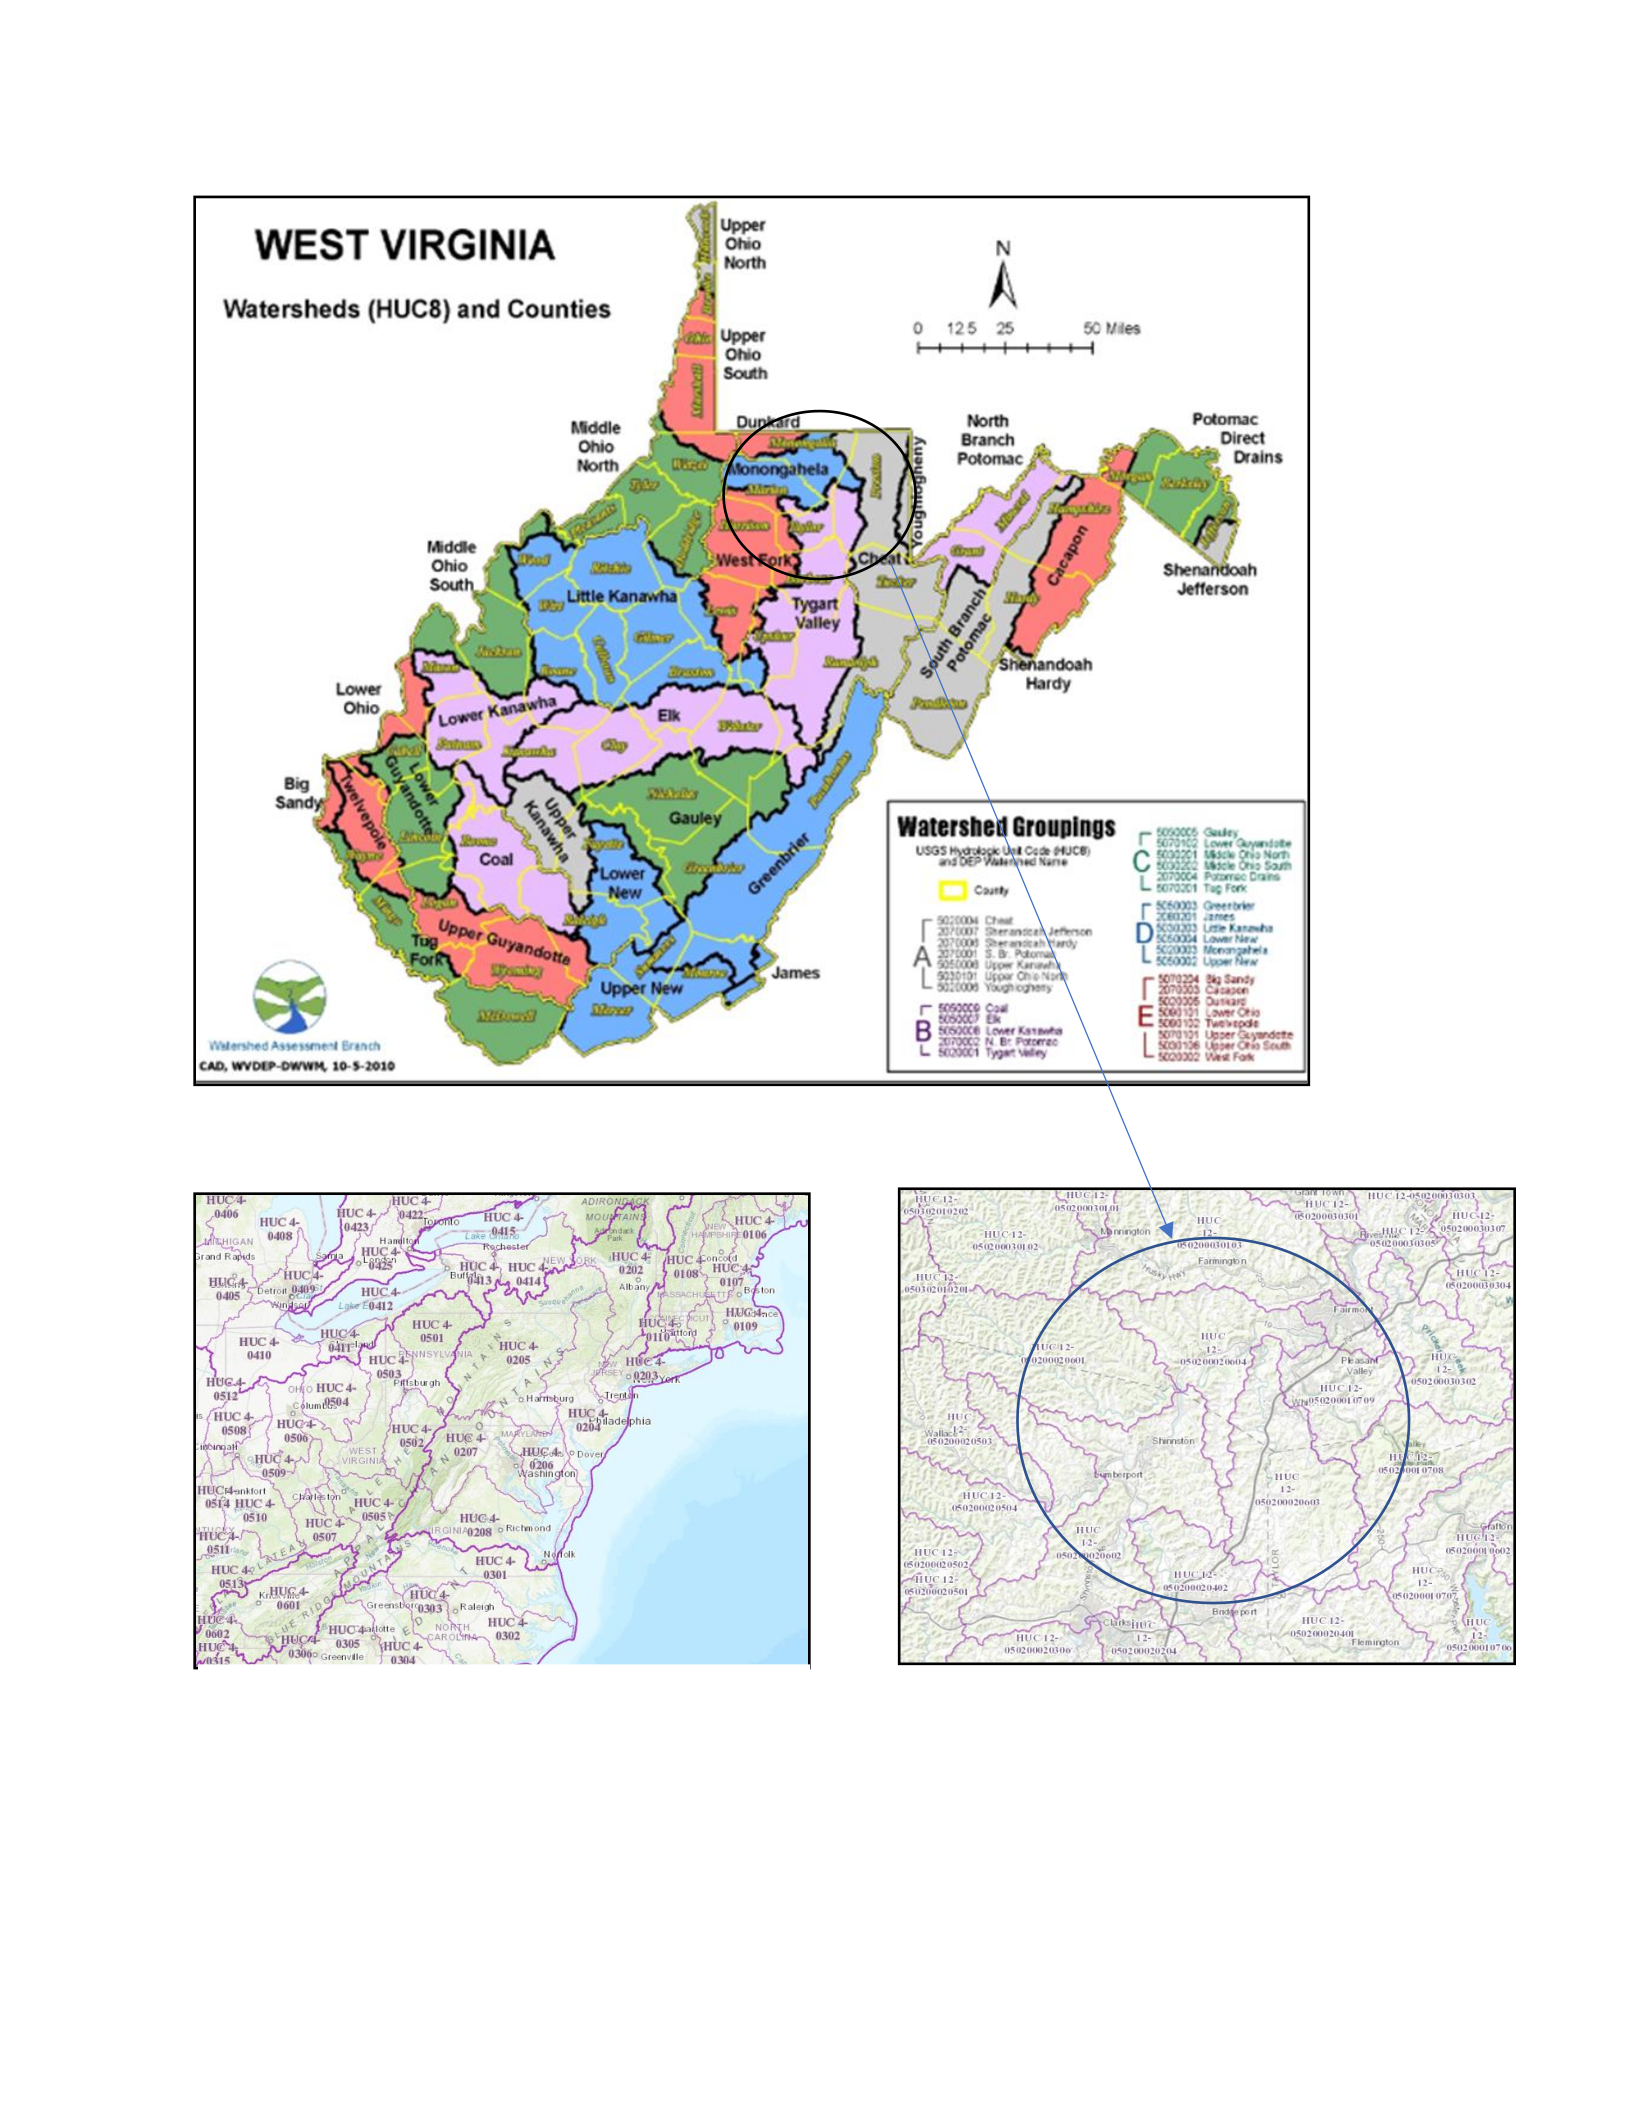
86
Figure 7.6: Watershed
Figure 7.7: East Coast Watersheds Source: ArcGIS Online
Figure 7.8: HUC 12 Counties Source: ArcGIS Online
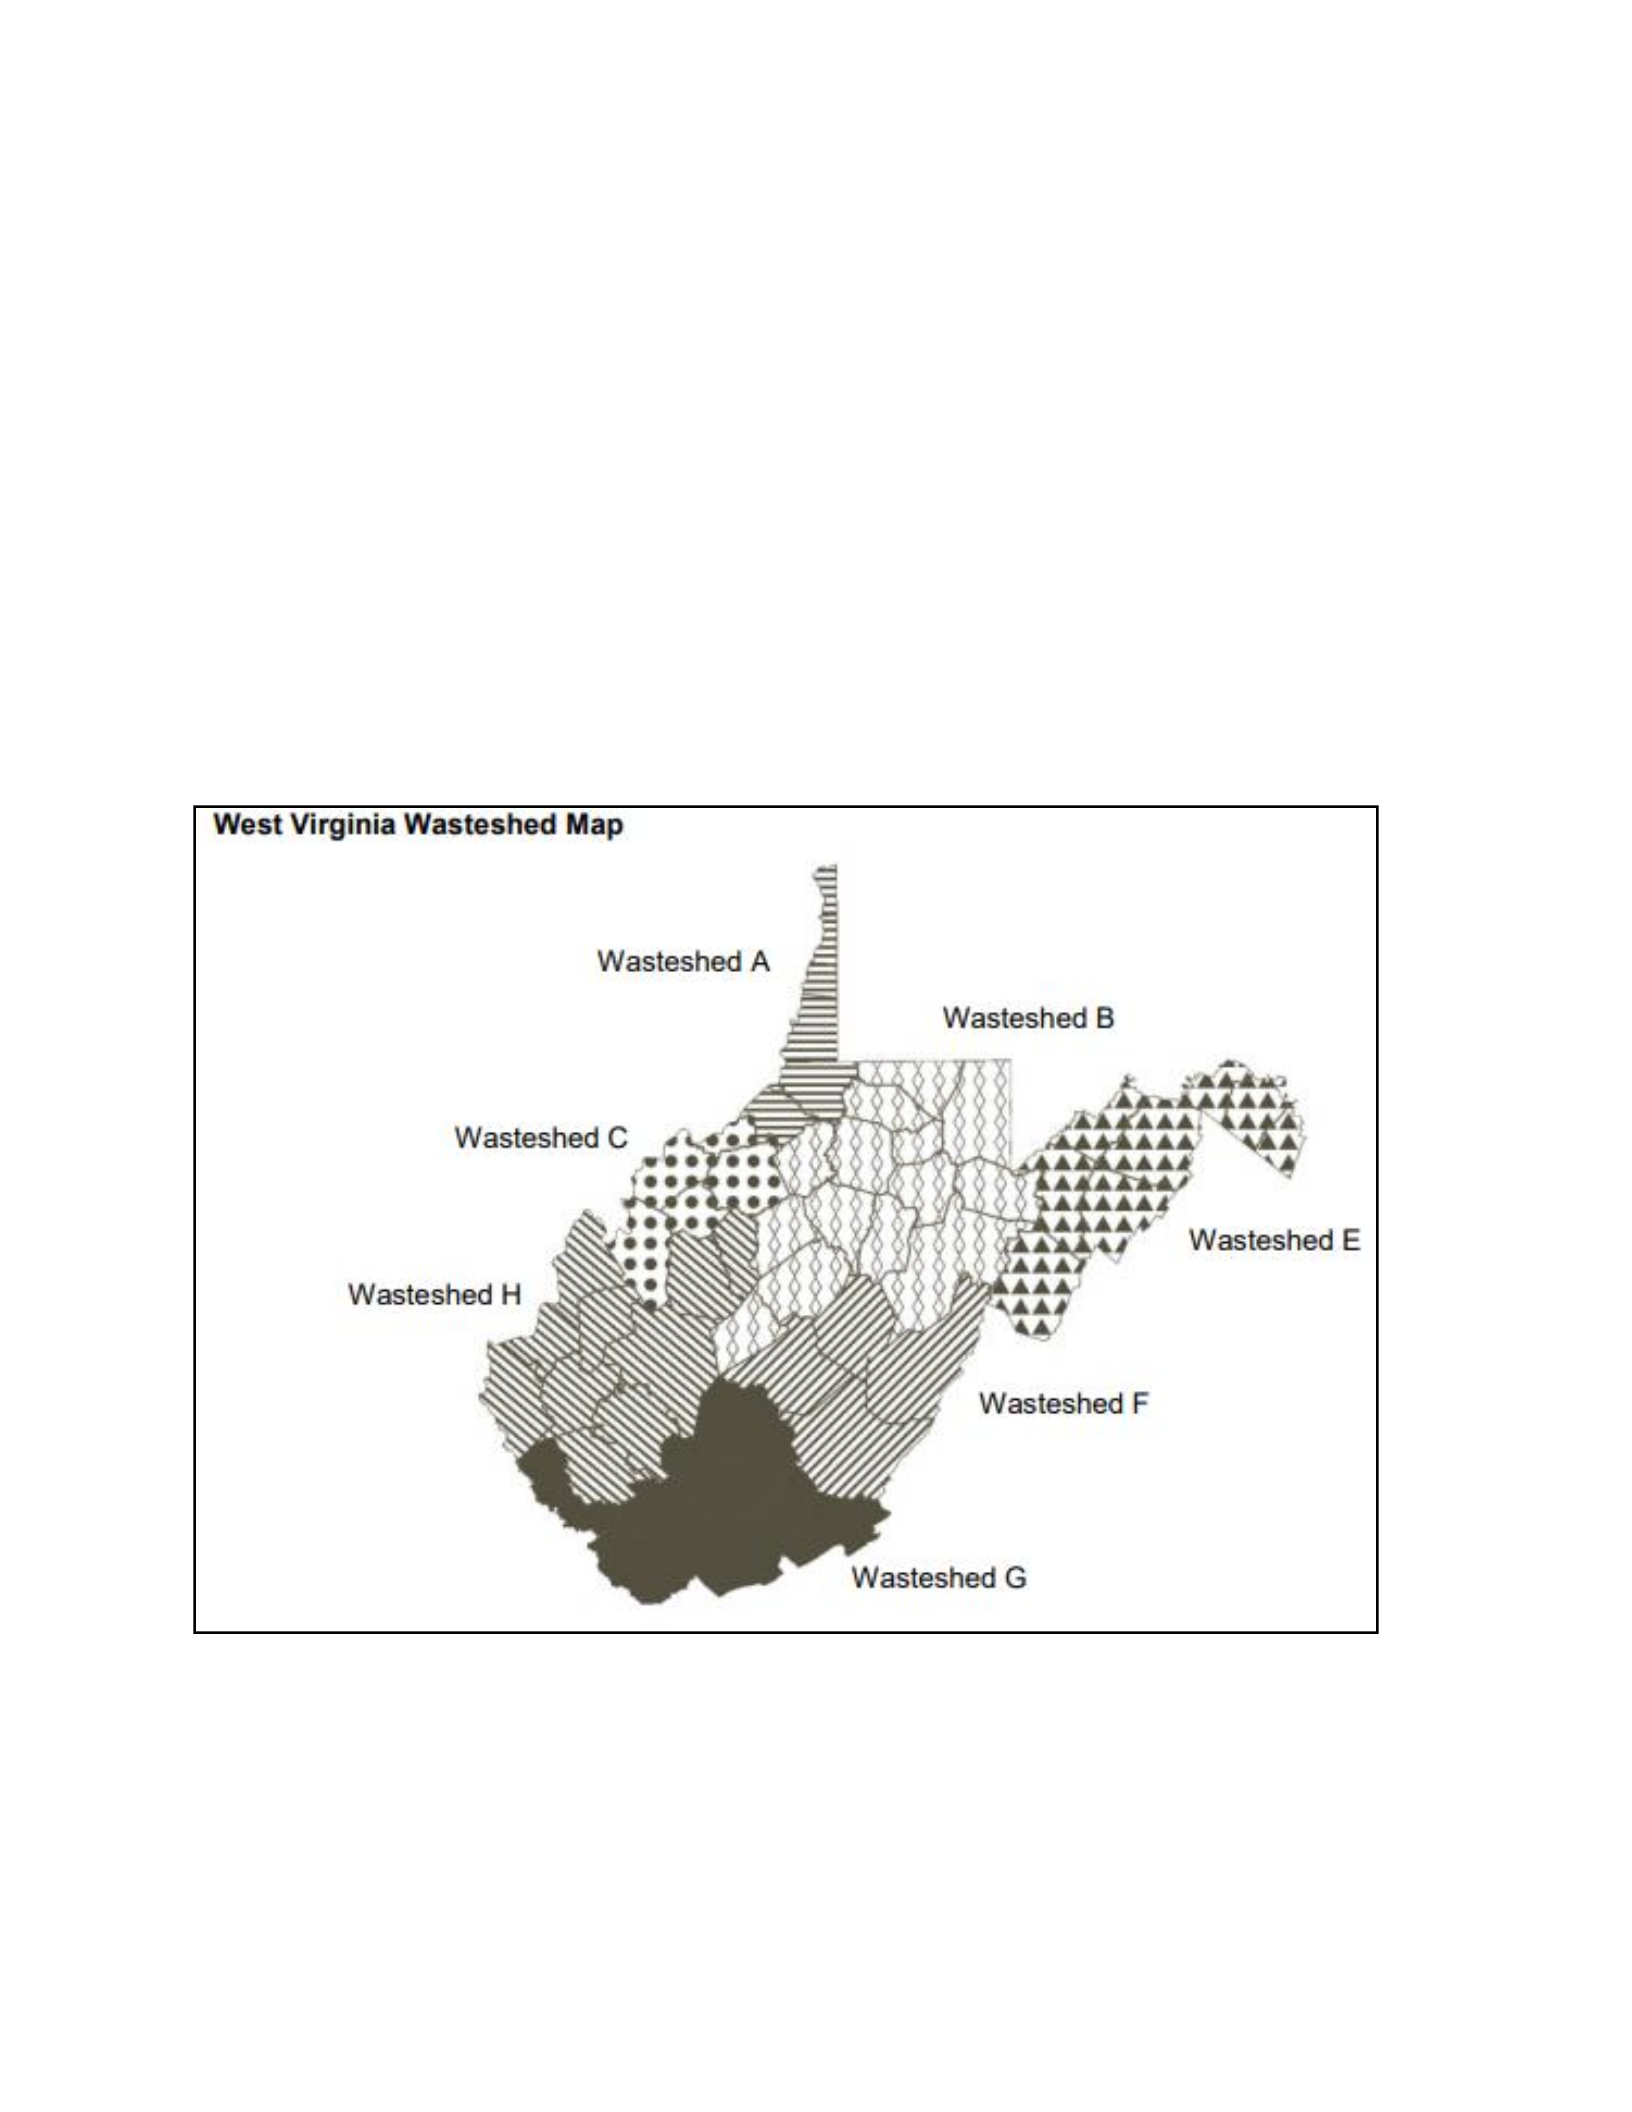
87
The concept of -sheds has been implemented beyond hydrological applications to include
viewsheds, drivesheds, and wastesheds. Viewsheds capture the visible and non-visible features
in a surrounding area and are used extensively in architecture and cultural and historical
landscapes (Higuchi, 1988). Wastesheds, as previously discussed, were implemented by the U.S.
EPA and conceived to emulate the role of watersheds but in waste management (Figure 7.9).
Wastesheds tend to be static units much as watersheds and they fail to capture the dynamism or
complexity of the solid waste environment.
Less well-known but thought-provoking are drive-sheds that measure the catchment areas of
vehicles traveling to a specific destination based on networks of roadway routes. Using GIS
such drive sheds can be based on Euclidian distance, travel time, cost, or other metrics. The
2017 solar eclipse, for example, led to the construction of a fascinating series of drivesheds
capturing the cumulative routes travelled by vehicles as people sought to locate to the closest
zone of totality (Figure 7.10). Similar examples exist for identifying transportation corridors for
mass evacuation in the event of natural or man-made disasters (Figure 7.11).
Figure 7.9: West Virginia Watersheds Map Source: WV SWMB 2019
Figure 7.9: West Virginia Watersheds Map Source: WV SWMB 2019
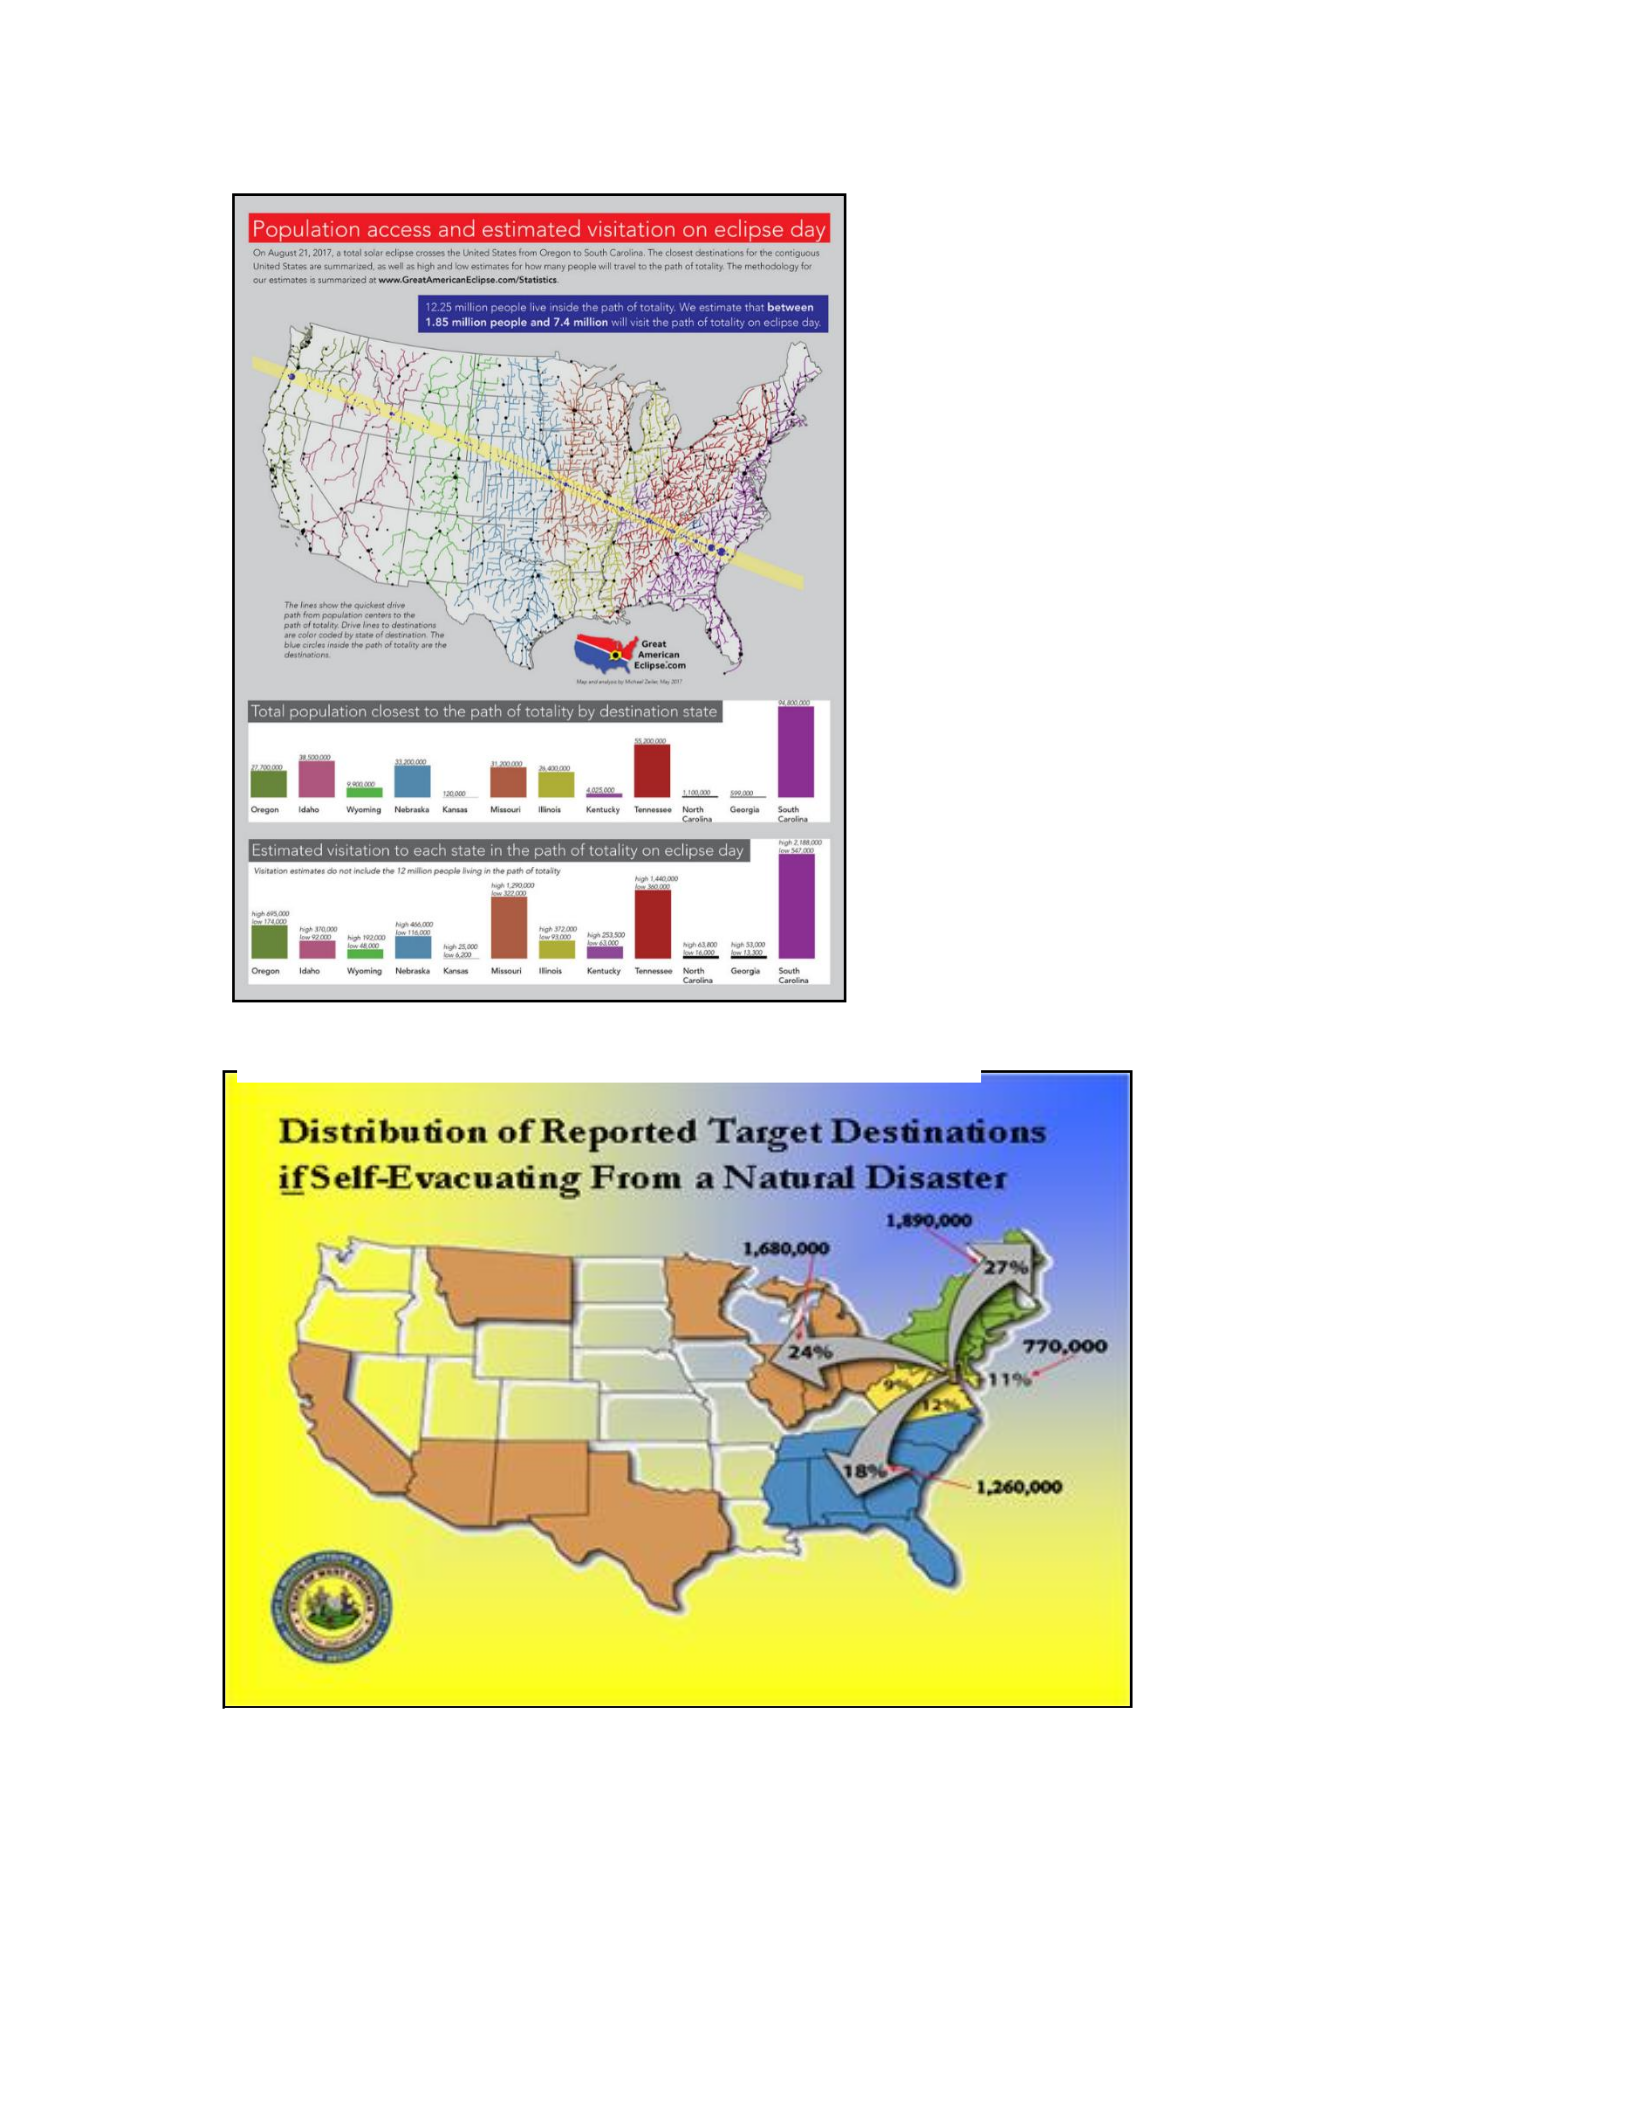
88
Figure 7.10: Drivesheds
Figure 7.11: FHWA Evacuation Driveshed through West Virginia: Barbour, Clarksburg, Grant, Greenbrier, Hampshire,
Hardy, Jefferson, Marion, Monongalia, Pendleton, Pocahontas, Preston, Randolph, Tucker, Upshur, and Randolph.

89
Policy-sheds
Based on the idea of -sheds, preliminary thought was given as to how policy-sheds might be
constructed in GIS for waste management. Although these musings were crude (Figure 7.12 and
7.13) they quickly evolved into a full-blown schema (Figure 7.14). As detailed later in this
chapter the critical elements of this approach were to be able to extract and digitize the spatial
units embedded in the written regulations, laws, rules, and code and to then codify these
regulations and assign them to the applicable areal units. This turned out to be no small task.
GIS lends itself well to this handling of spatial information. In contrast to the nested style of
watersheds, however, waste policy-sheds can occur in multiple and overlaying administrative
zones and the power of GIS to overlay these zones and to then drill through them provides a
functional and robust technique for identifying codes that apply to specified locations. The
designation of policy-sheds could thus cover the entire U.S., a state, or a county. But as will be
seen, the regulations controlling solid waste can range from individual structures, such as a
federal prison or a hospital, for which specific regulations apply, that may or may not reflect
other regulatory environments. Similarly, cities or towns or communities may have solid waste
code or practices that differ from others. West Virginia University, for example, has a different
solid waste and recycling regimes that differ from those of the administrative city of
Morgantown or the county of Monongalia in which the university is located. What will be seen
from the application of policy-sheds is that not only are there a myriad solid waste regulations
but that these regulations spatially overlap and on occasion contradict each other.
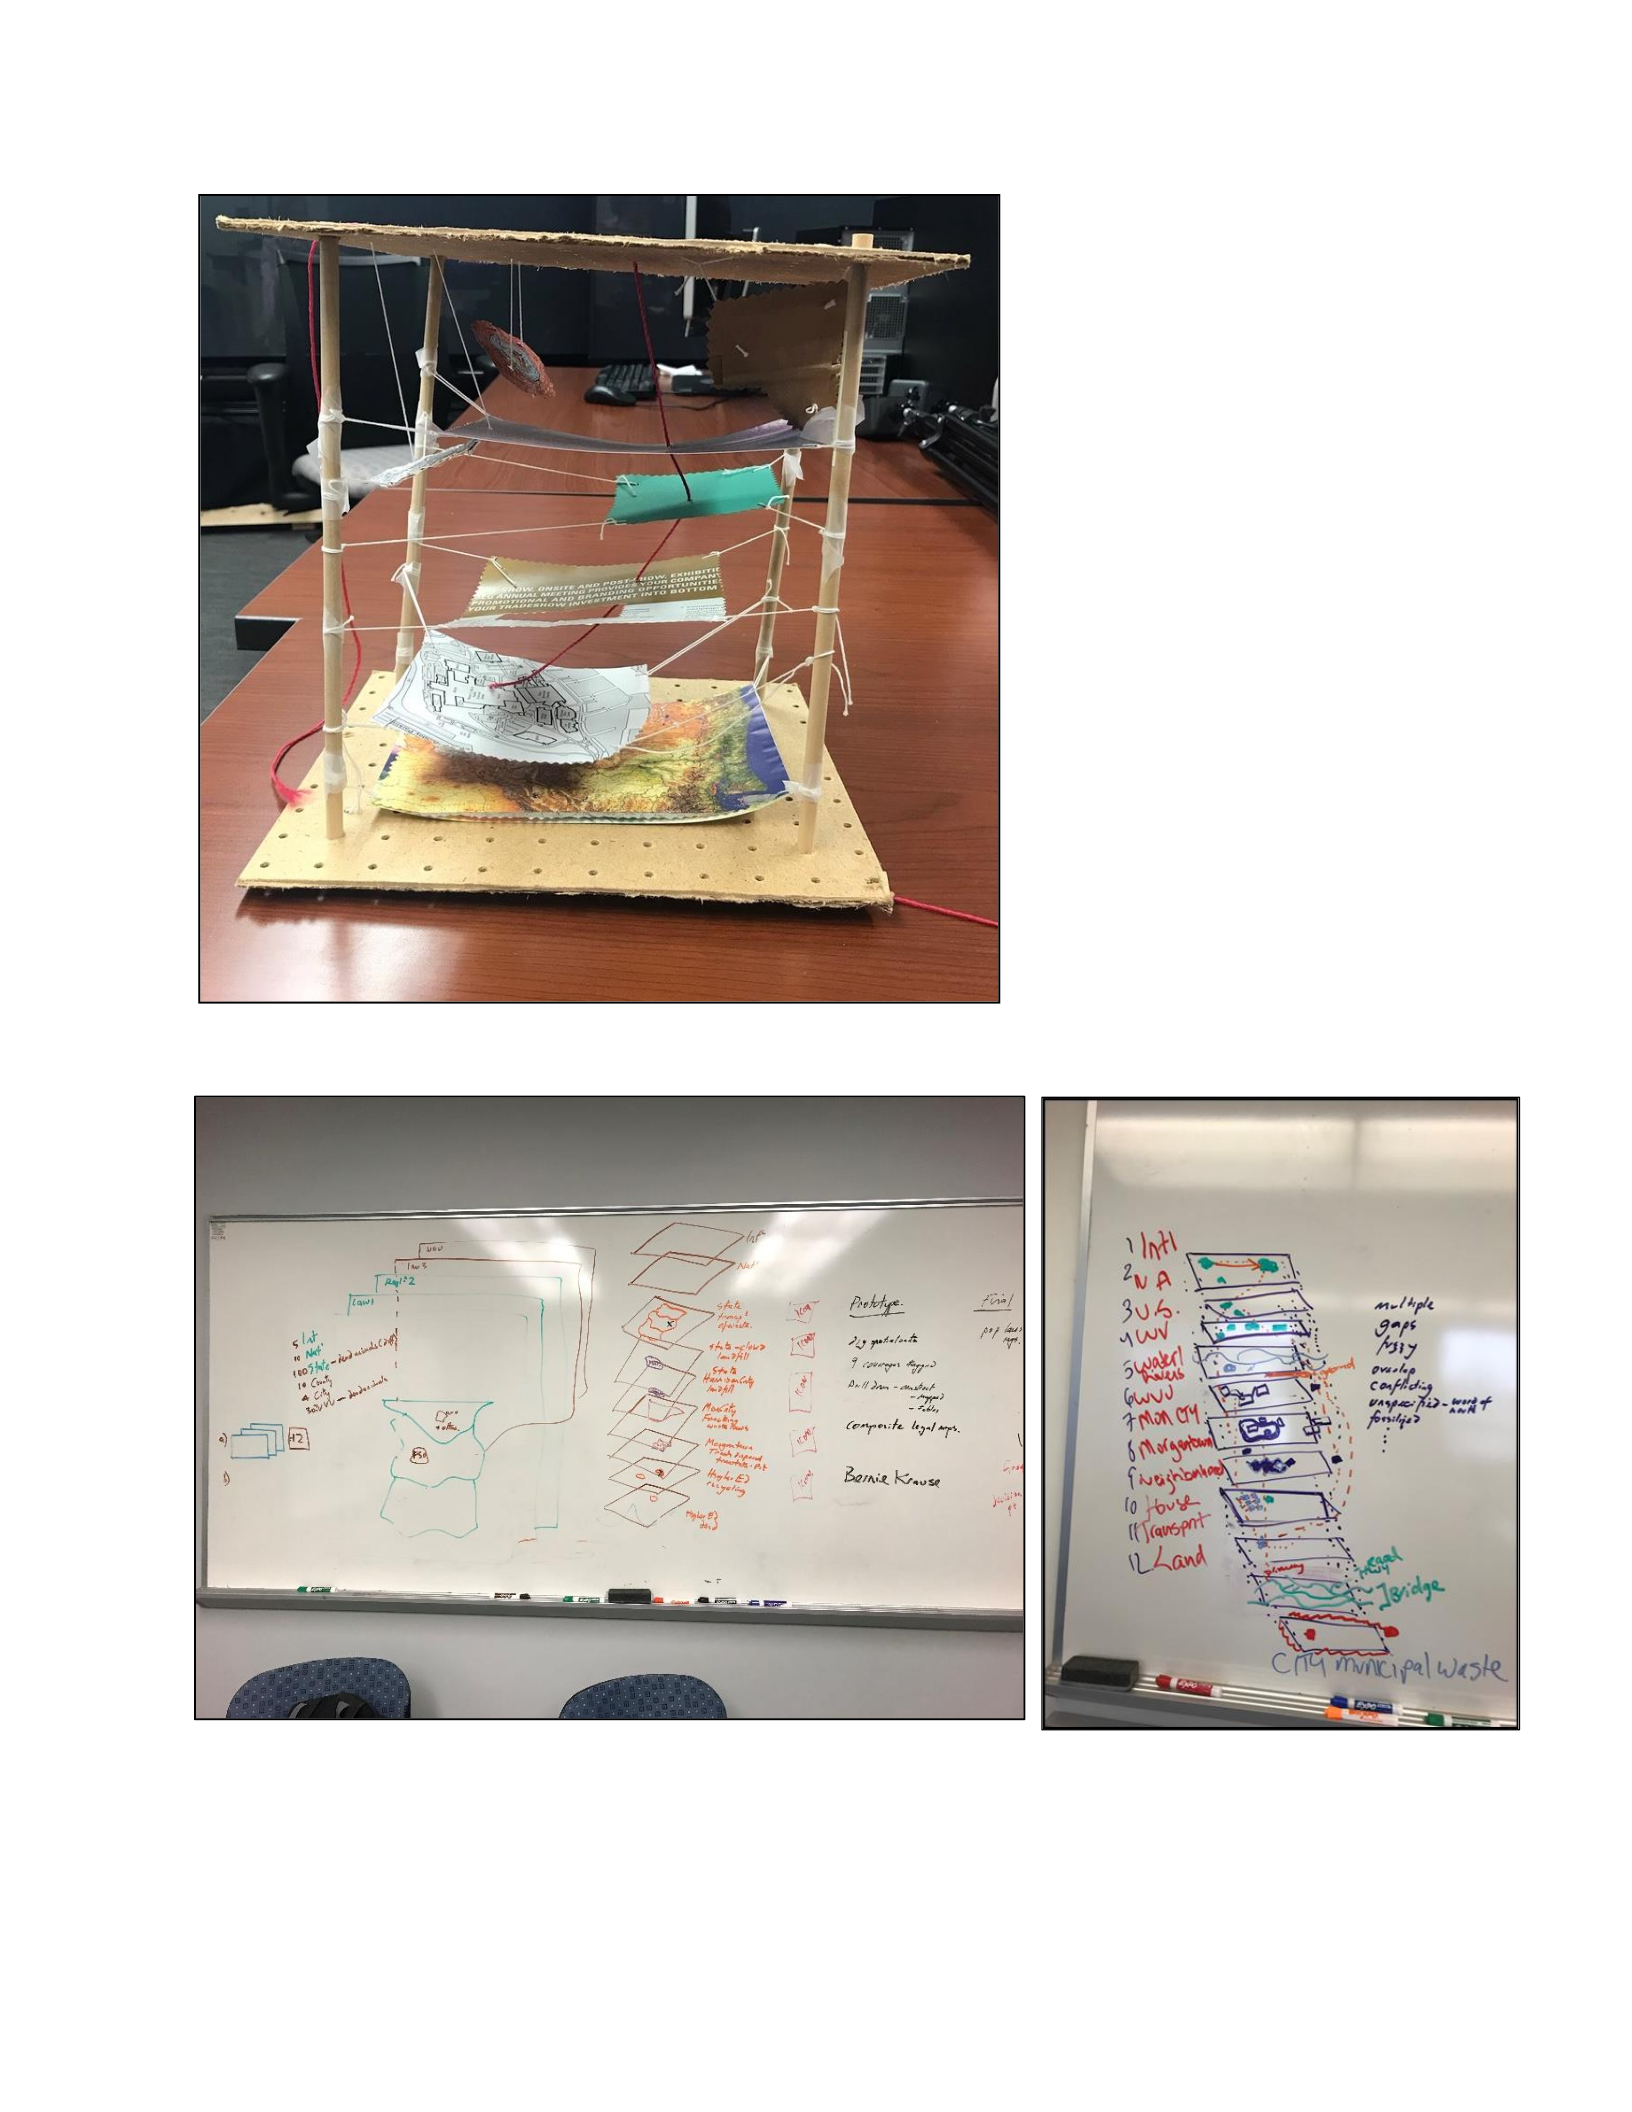
90
Figure 7.12: Multiscalar representation as a physical model
Figure 7.13 Multiscalar representation on whiteboards
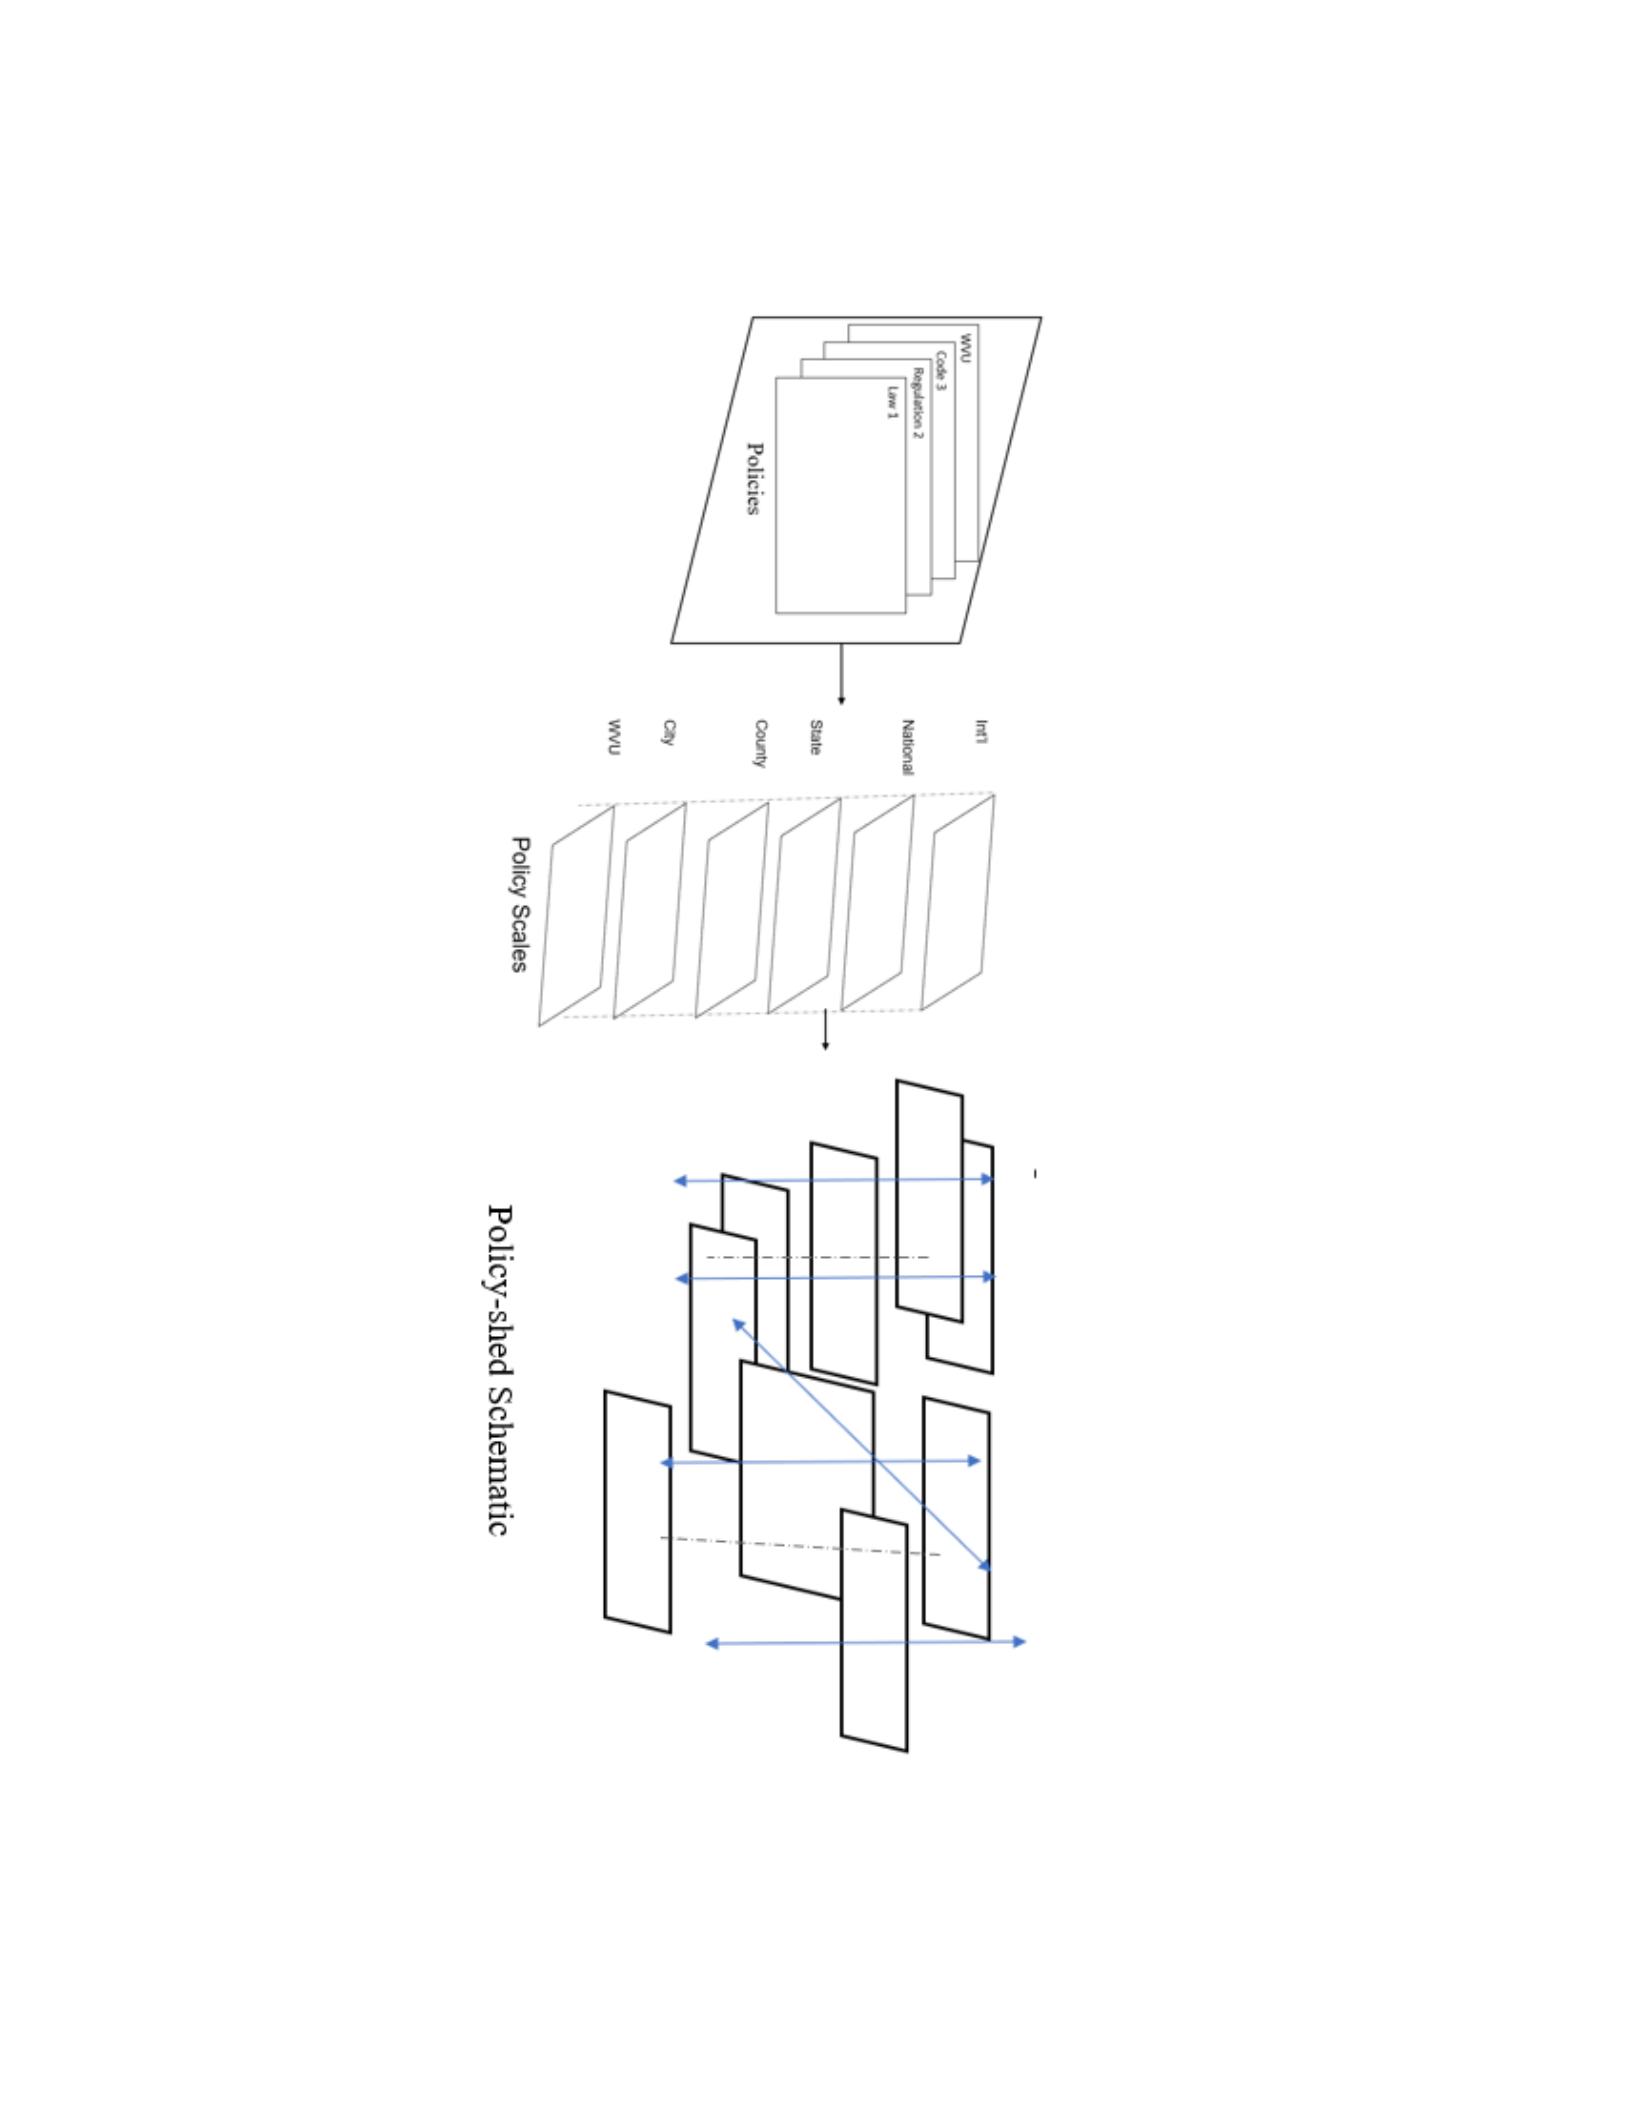
91
Figure 7.14: A Policy-shed Framework Schematic

92
Extracting regulatory code and related spatial information
As indicated, extracting the regulatory solid waste code and related spatial information from the
varying official policy documents and legal documents such as treaties and case law and placing
them into a standardized format was a formidable task. Invariably the spatial units or
jurisdictions to which the code applied was not mapped and certainly not in a digital form that
could be readily ingested into the GIS. Furthermore, the code had to be classified according to
the type of waste involved. Some of the Code of Ordinances that apply to counties and cities,
might be found in the American Legal Publishing Corporation which provides these documents
for informational purposes only (Figures 7.15 and 7.16). Each code narrative had to be reviewed
for relevant solid waste policy and for the location, and spatial extent of that policy. Waste
characterization tends to be determined by its related industry or purpose but even this can be
ambiguous. The code extraction process became a labyrinth of deep enquiry into the structure of
the code that had many blind alleys and unhelpful paths. Interpreting code narrative requires an
extensive knowledge of the policy area not least in recognizing the possible linkages to other
policies or locations. Undertaking this necessary task and aggregating, classifying, and verifying
the massive numbers of records and accounting for changing code over time was…..time
consuming. The multiplicity of differing words used to describe waste was problematic and often
common terms were used to describe very different types of waste. Similarly, some code might
refer to only one part or process in the waste system in contrast to other code. Furthermore,
ultimately the regulatory code had to be spatially allocated to the respective place or places to
which it applied, and this generated many issues associated with place names, administrative
names, and spatial units. While the process provided a deep insight into the inner administrative
workings and planning of municipalities the time and resources required to perform this work
has to be considered when evaluating the efficacy of a policy-shed approach though in reality it
also points to the absolute need to apply some standardized approach to the morass of regulations
that represents the solid waste system.
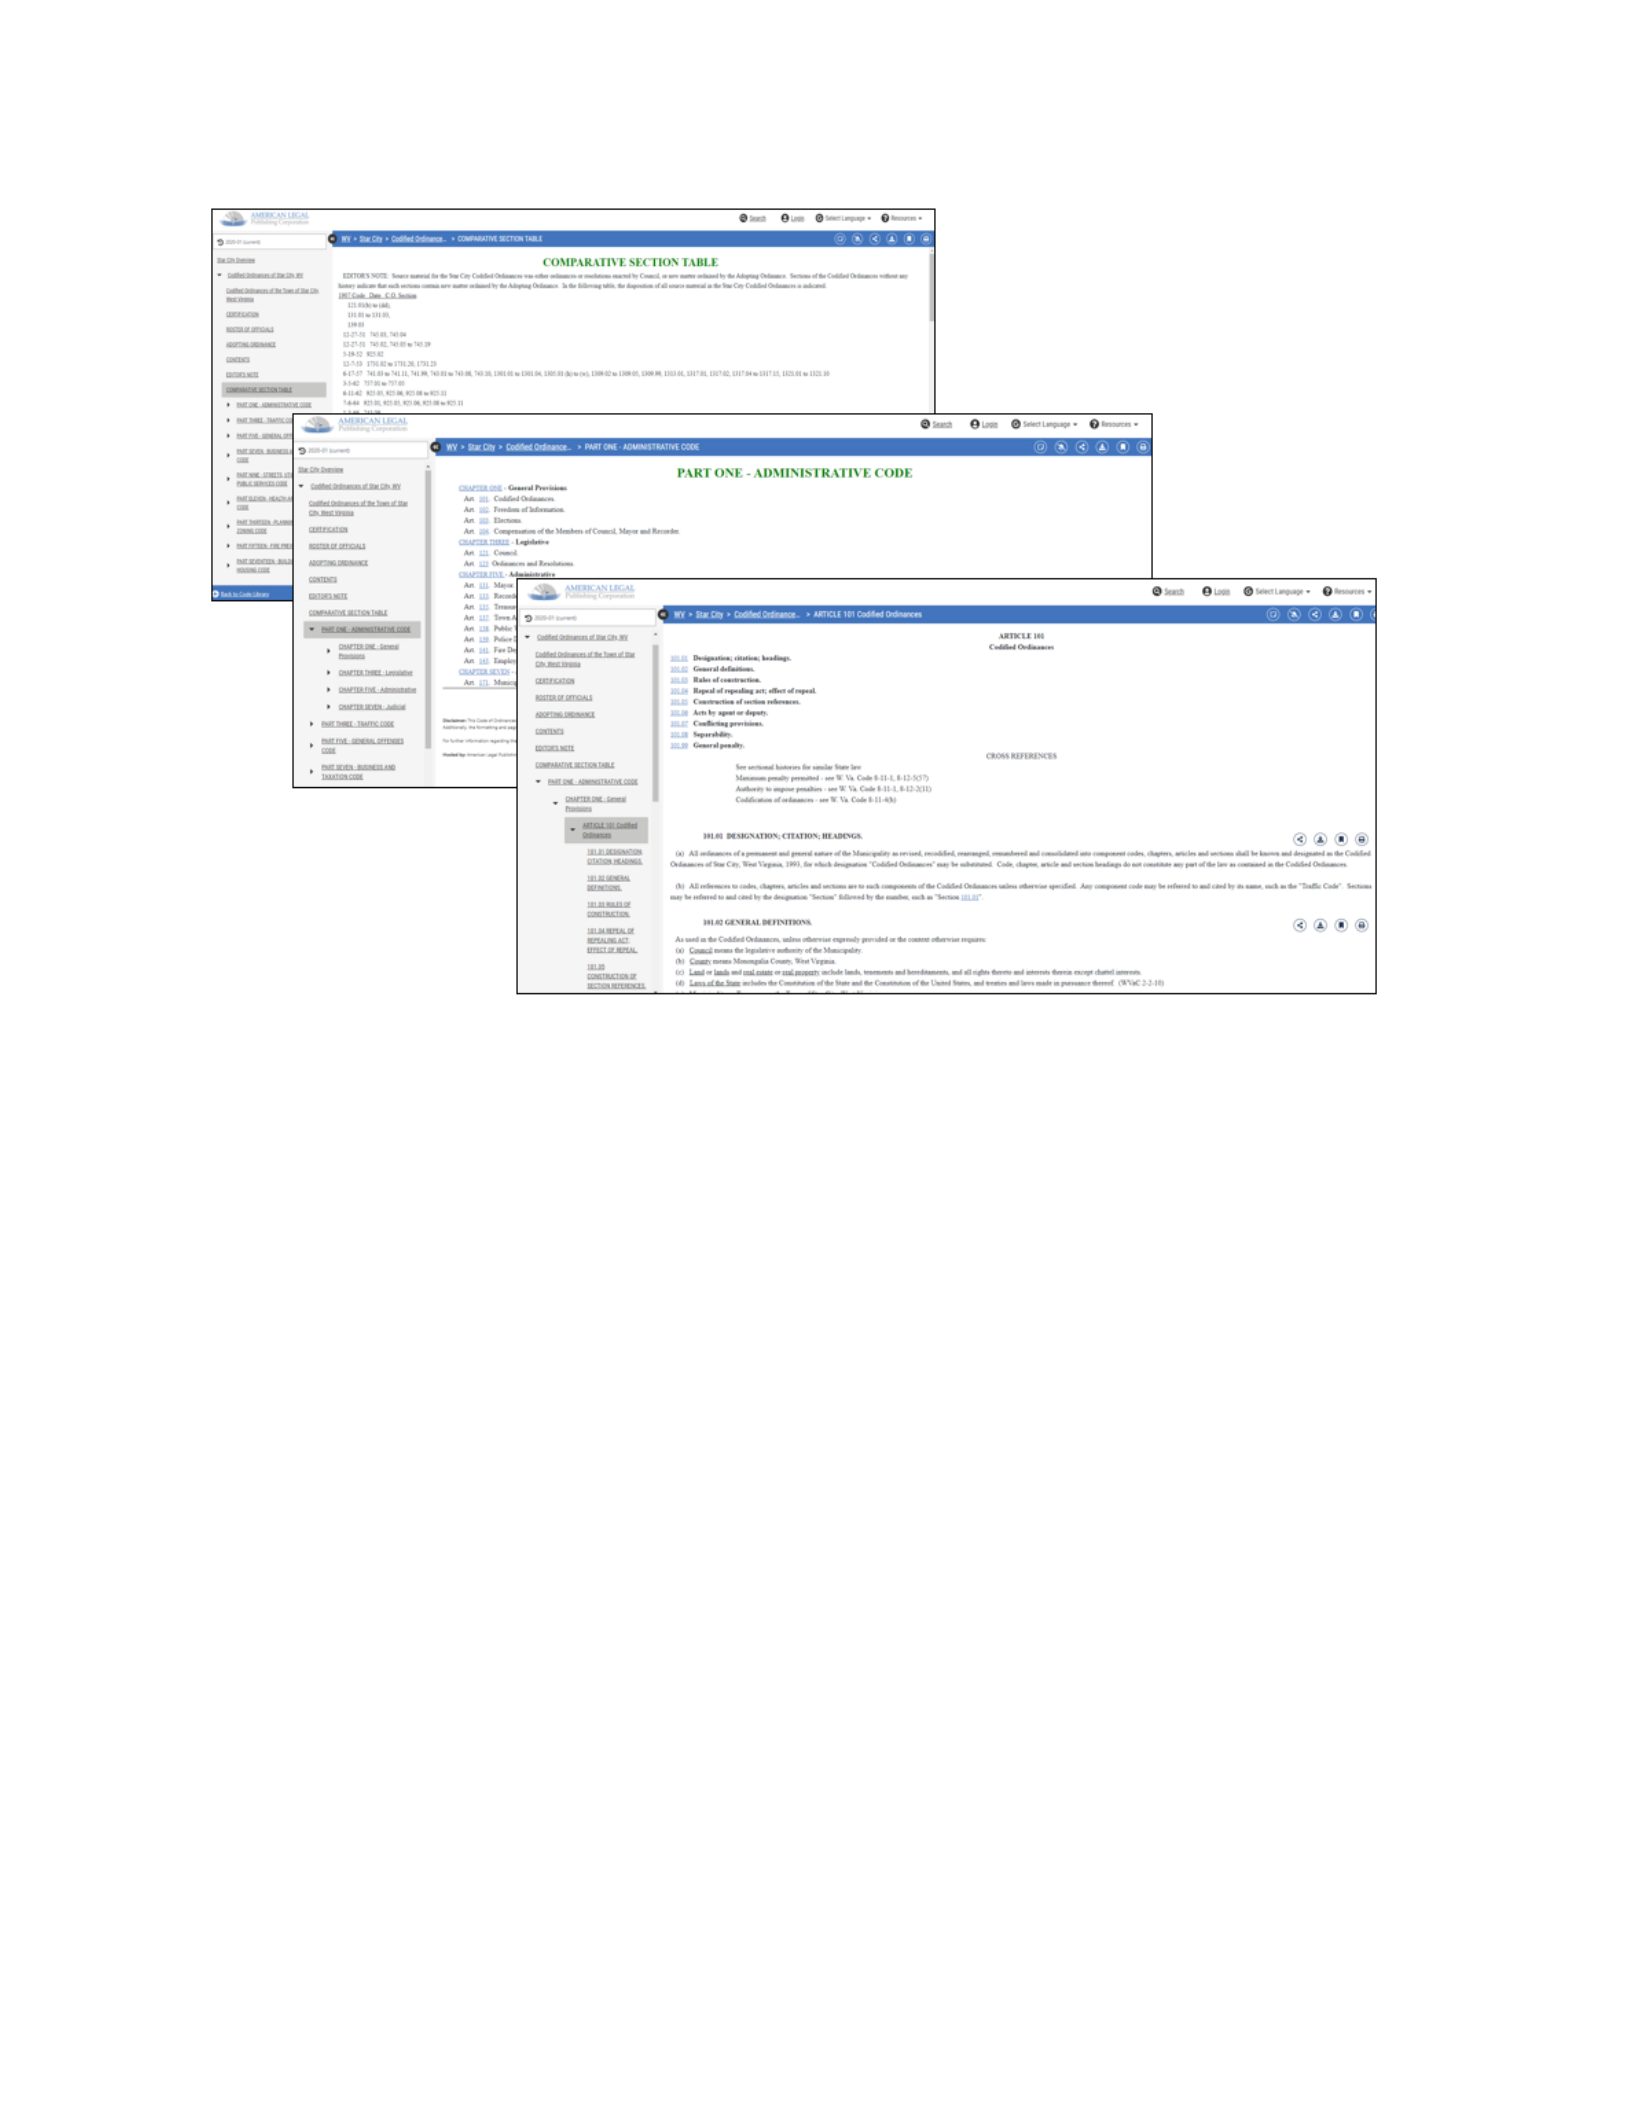
93
Figure 7.15: Example Table of Contents Codified Ordinances of the Town of Star City, West Virginia (October 1, 2020)
https://codelibrary.amlegal.com/codes/starcity/latest/starcity_wv/0-0-0-12030
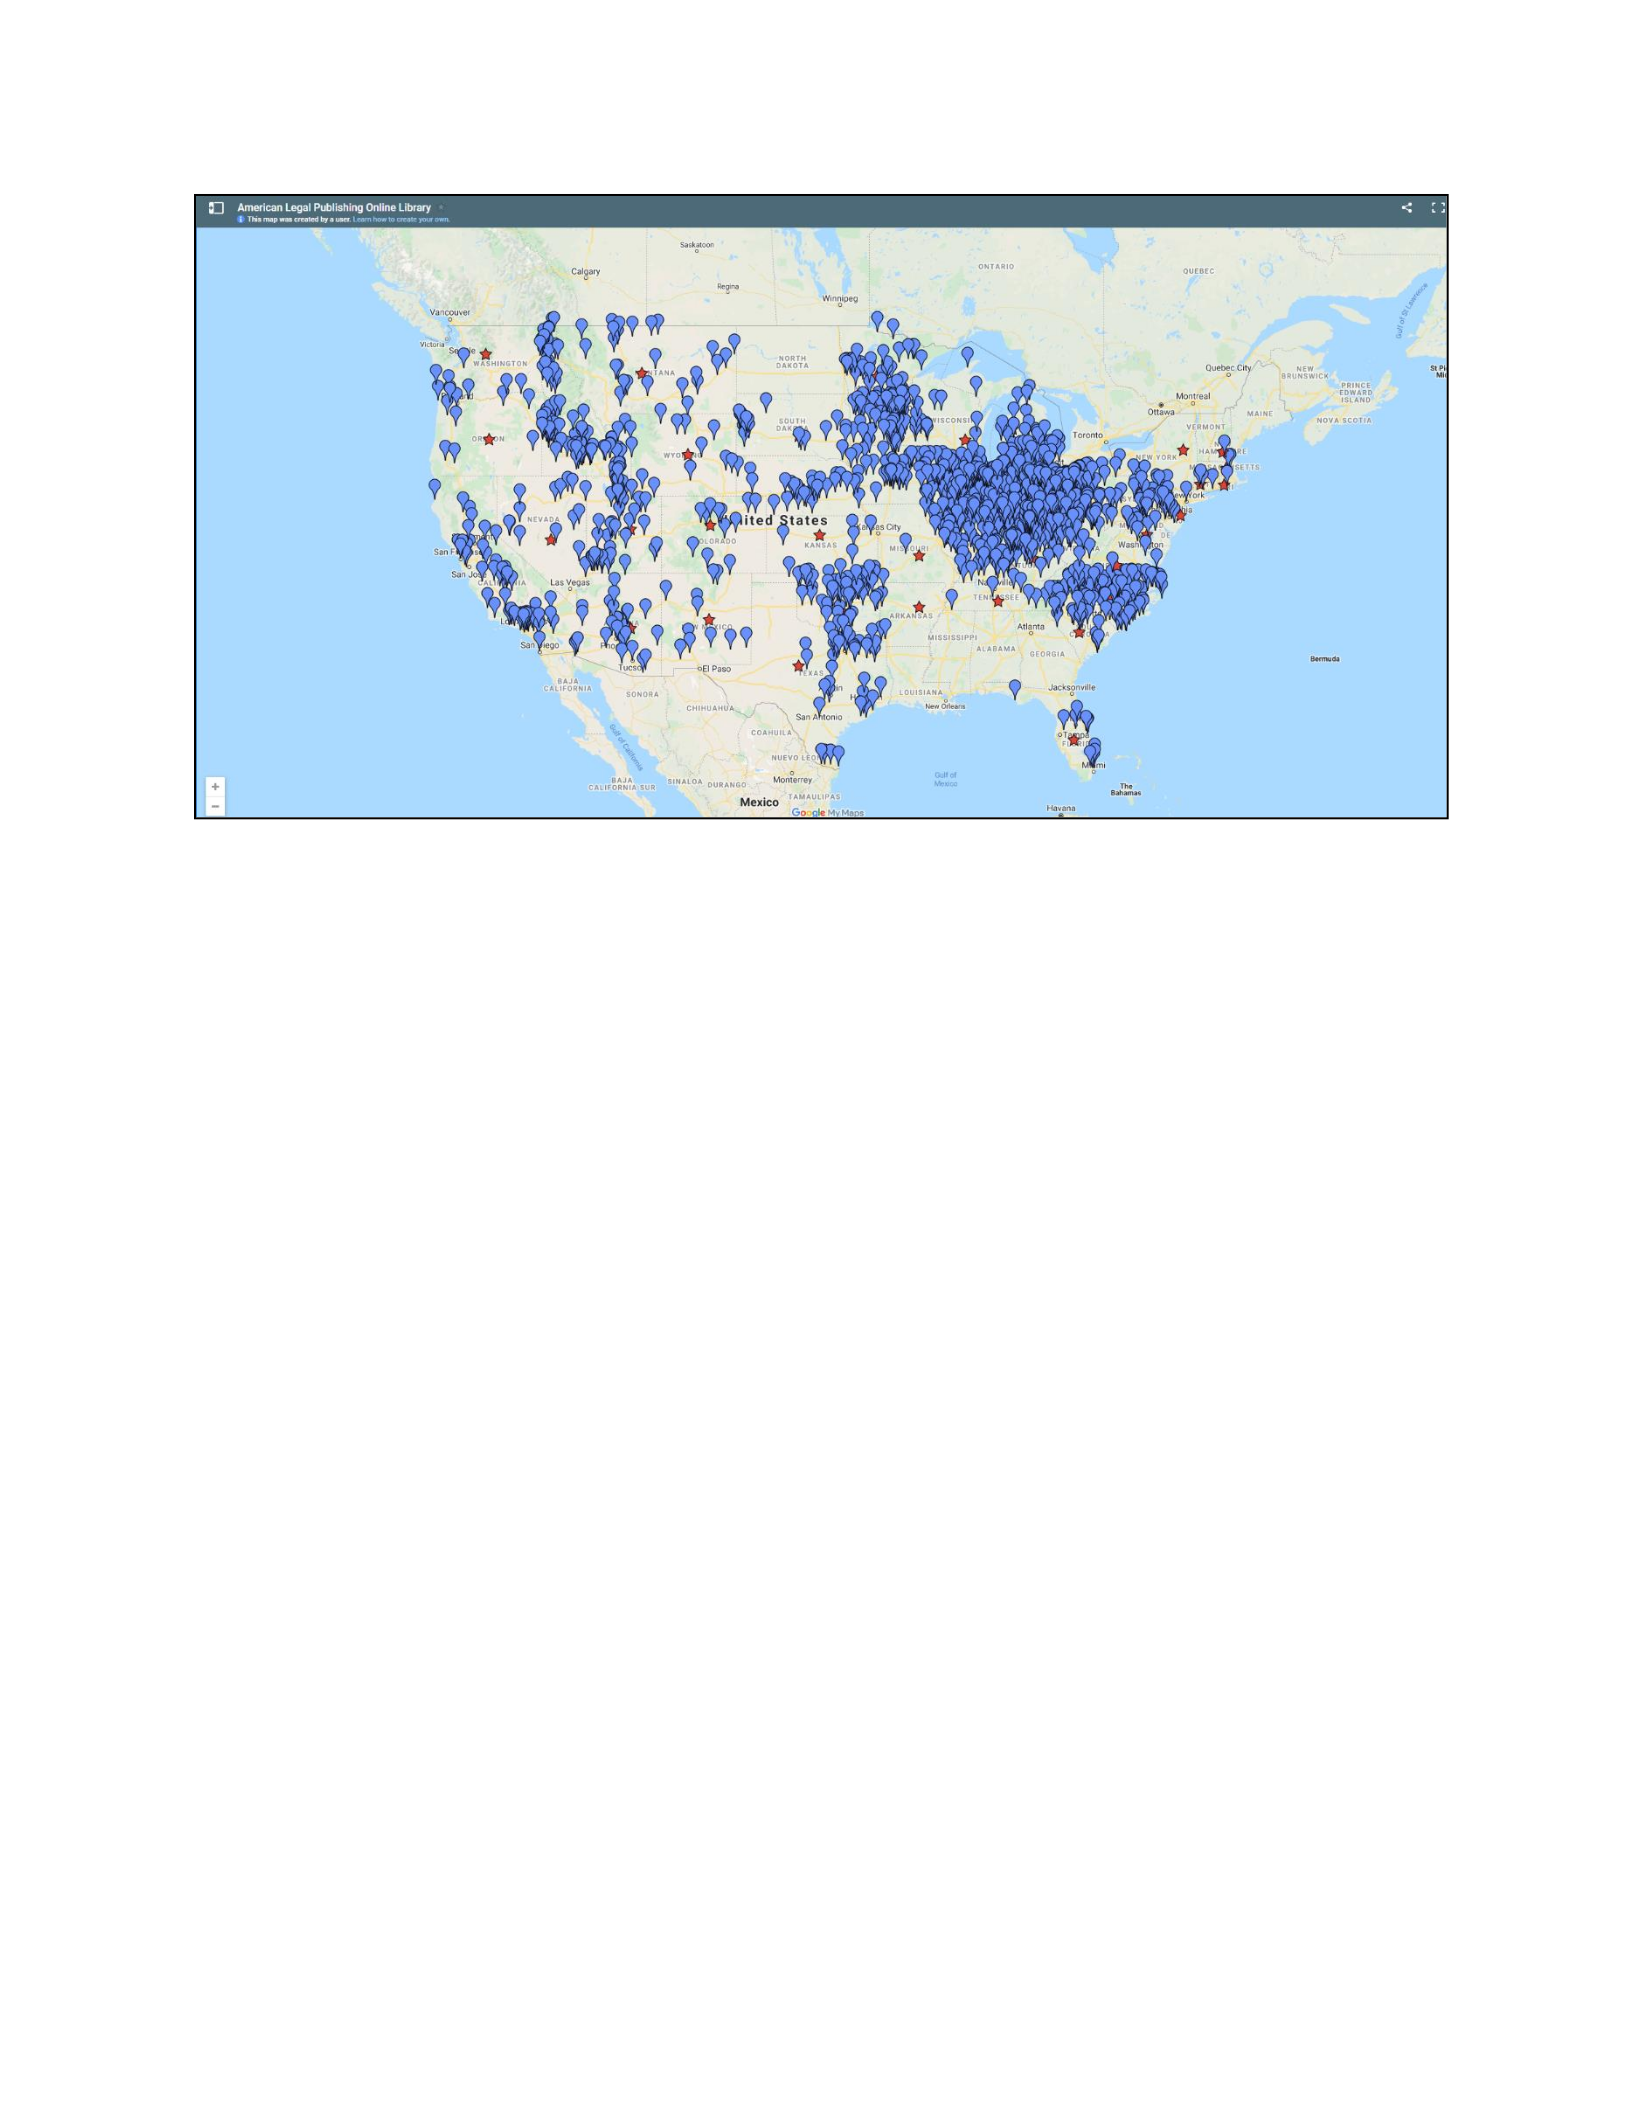
94
Figure 7.16: American Legal Publishing Online Google Map of Members
While not every state makes its codes available online, the West Virginia Code is so available.
The WVSWMB annual bill tracker of solid waste regulation changes was particularly valuable in
identifying bills related to solid waste. Nonetheless, almost a line-by-line search was necessary
to extract waste policy and jurisdictions.
WV Code Analysis
The relationships and patterns observed in the initial waste heat map matrix were further
developed into an analysis of WV code analysis. Identifying the spatial locations to which code
applied could fall into several forms (Table 7.1).

95
Policy and Spatial Locations
Stand-alone code or policy
Policy code that does not have any policy parts that are reliant
or directly intersect with other policies.
Fixed boundary code
Regulations or policy that are tied to specific fixed hard
boundaries.
Semi- Fixed boundary
A boundary intended to be fixed that has developed crossover
relationships between policy areas or boundaries
Very Loose
Couplings between policy areas and policy locations such as
those from small p policy or best practices.
Fuzzy or unclear
Policies and locations that are fuzzy or unclear because they
are integrated into other policy regulations, originate from
other policy arenas, or are held under the rubric of local
knowledge or best practices.
Table 7.1: Policy and Spatial Locations
The linking of solid waste policy to location was an iterative process, requiring an almost a line-
by-line search for international, federal, state, county, and local regulations through various
agency data, sources, organizations, in order to extract waste policy and associated jurisdictions.
The regulatory code was assigned to named places, administrative areas, and jurisdictions
identified in the code. Where possible spatial databases were used, as for example in the case of
digital county boundary files. These spatial repositories included Data.gov, the databases housed
by the WV State GIS Technical Center (Figure 7.17), and the Homeland Infrastructure
Foundation Level-Data (HIFLD) Open Data Catalog (https://hifld-
geoplatform.opendata.arcgis.com/). The latter HIFLD was surprisingly helpful because
although established in 2002 it housed geospatial information that spanned multiple levels of
96
government community infrastructure. Issues of scale and spatial accuracy, as with any spatial
data, pervade this work and a medley of best available scalar data was used.
In some instances, spatial conflicts arose largely based on the definitions used to define a
jurisdictional extent. Thus HIFLD, for example, limited the geospatial extent of WVU to the
downtown campus, while ignoring the other campuses and such are the problems of using legacy
data originally provided to meet other purposes. In instances where no spatial dataset could be
accessed then digital areal units and shapefiles had to be generated by the author.
Monongalia County, WV
County Boundaries
Selected County
UTM NAD27
County
Boundaries
1:100,000 scale
Data Source
U.S. Census Bureau Date (Created 2000)
File Format
Compressed ESRI shapefile
Data Download
https://wvgis.wvu.edu/
Description
West Virginia County Boundaries from 1990 and 2000
Census geographic areas data 1990 shapefiles were derived
by the WVGISTC from 1990 Census data. The 2000
shapefile was prepared by the Natural Resource Analysis
Center (NRAC)at West Virginia University, NRAC
downloaded and manipulated the file from ESRI. The 2000
County dataset was posted on the WVGISTC website in
September 2003.
Attribute
Information
1990 files include Federal Information Processing Standards
(FIPS) codes and 1990 Census data. The 2000 dataset has
over 35 population and household attributes and FIPS
codes.

97
Coordinate
System
Coordinate System Latitude/longitude with mapping units
in decimal degrees, (2) UTM Zone 17 or (3) UTM Zone 18
in meters, (4) State Plane North (SPN) or (5) State Plane
South (SPS) in feet. All coordinates referenced to NAD 83
datum.
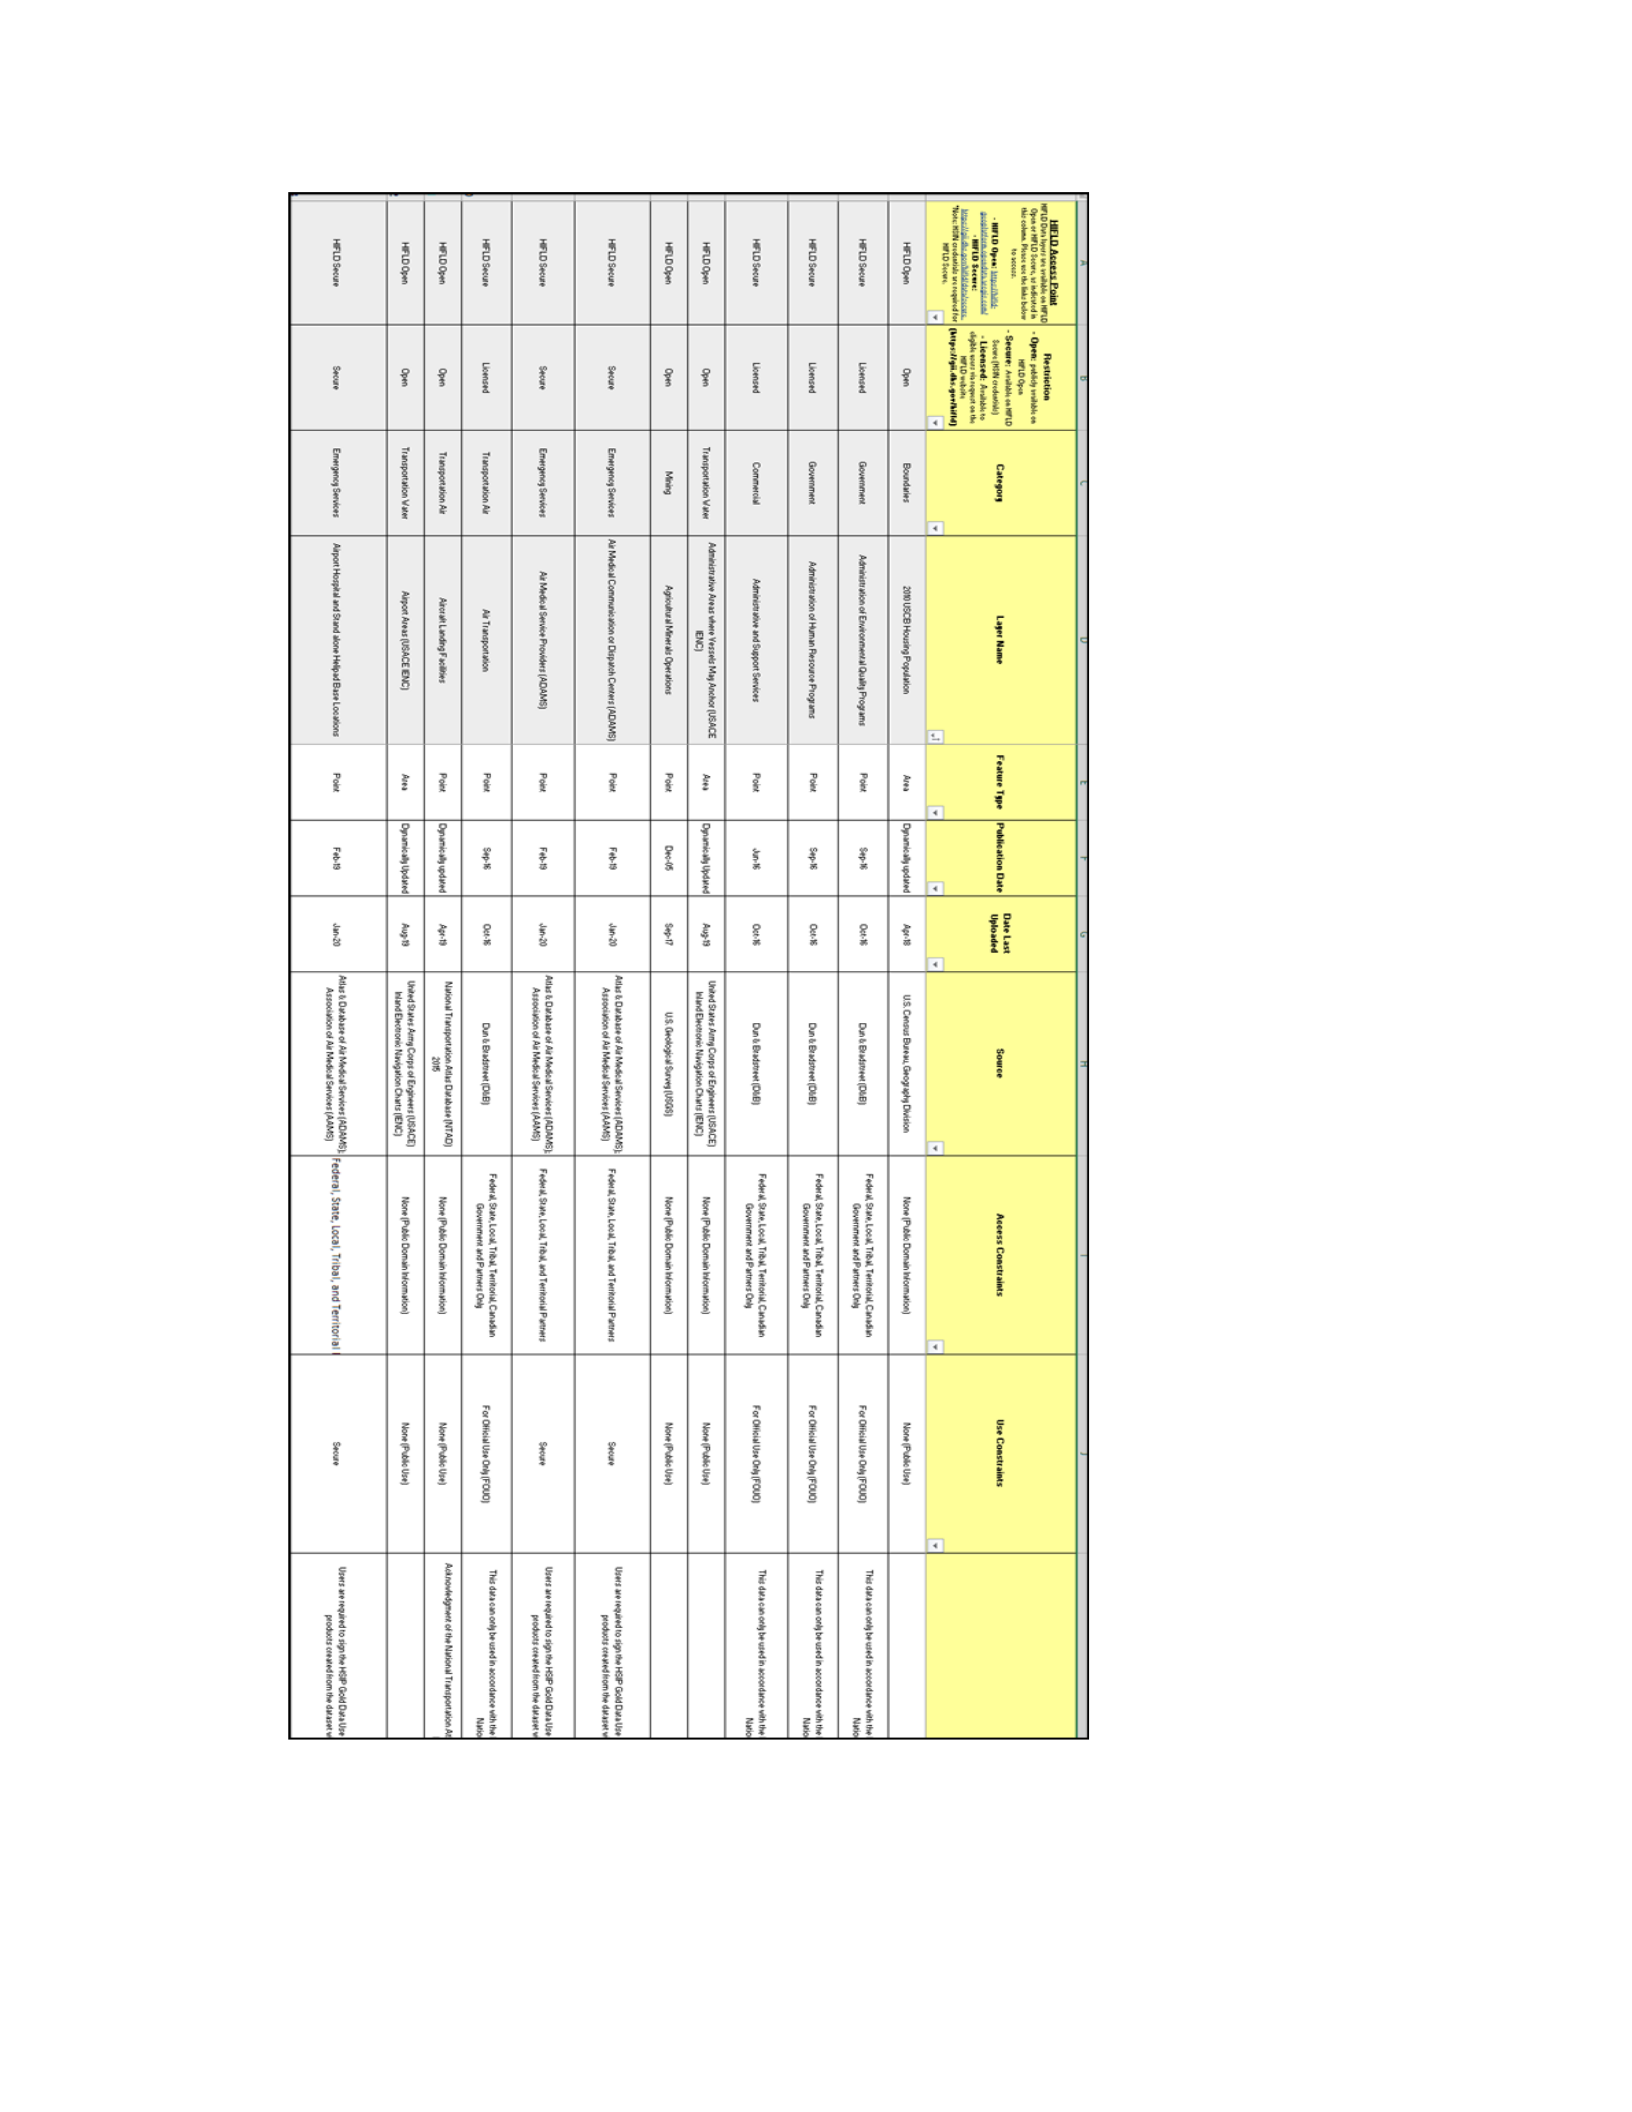
98
Figure 7.17: Examples of spatial metadata

99
Policy Narrative Audit
Location is an important part of the policy-shed concept but these spatial designations lie buried
as textual descriptions in a mass of regulatory documents. Local knowledge of the case study
area was critical to interpret and extract this information. A challenge is that policy is often not
quantifiable into tabular data. For example, when analyzing WV State code, it took considerable
geographic, waste, policy, and manufacturing knowledge to determine what in the WV State
Code was solid waste and if so how to interpret the geographic scope of the code.
The terminology used was drawn out of the entirety of the code and fell into three types of
regulatory geographic information comprising: 1. the physical manifestations of waste often
portrayed as a geographic point, 2. spatial actions which implies the movement of solid waste
across space, and finally 3. geographic location and land-use which often needed to be inferred
from the nature of a solid waste item or material or land-use. As explored by Briassouli (2019)
the human use of land resources gives rise to ‘land use’ which varies with the purposes it serves
and is in a constant state of flux. Without an associated map there are limited ways to determine
what these geographic forms and relationships imply and identifying specific boundaries,
jurisdictions, and geographies is problematic. Table 7.2, drawn from the Content Analysis of
WV State Code reveals the terms that relate to one of these three types of spatial interaction and
it was these that populated the GIS attribute table.
West Virginia State Code Solid Waste Policy and Geography Attributes
ITEM or MATERIAL
SPATIAL ACTION
LOCATION and
LAND-USE
• Accumulations
• Alternative fuel
vehicles (made
from waste by-
products)
• Ashes
• Biomass
• Accumulation
of Debris
• Accumulation
of refuse
• Alteration
• Decay
• Decides to
Destroy
• Accumulations
• Baler [Area]
• Brownfield
• Demolisher
• In [doorway,
etc. location
making it]
Unsanitary,
•

100
• Commodities
(items not yet
determined if
waste but
probably are)
• Debris
• Disposal
• Garbage
• Incinerator Ash
• Landfill Gas
• Litter
• Obsolete
Vehicles, etc.
(no longer serve
their focus or
are
incompatible)
• Recycling
• Refuse
• Residual
components
(unwanted parts
from a
cannibalized
commodity)
• Salvage
(material)
• Scrap (material)
• Solid Waste to
Fuel
• Demolish
• Demolished
• Demolition
• Destruction
• Destruction
• Disposal
• Dispose of
• Identify [items]
that are not
needed
• Identify [items]
that do not
have value
• Illegal dumping
• Incinerate
• Landfill
• Litter
• Orderly
disposal of
[item] no
longer
possessing
sufficient
administrative,
legal, or fiscal
value to
warrant further
keeping.
• Plans
destruction of
• Recycling
dangerous, or
detrimental to
public safety or
welfare
• Incinerator
[Area]
• Incinerator
Plants
• Landfill
• Open Dumps
• Recycling
Facility
• Salvage yard
• Scrapyard
• Voluntarily
Remediated Site

101
• Surplus property
(unwanted
property)
• Toxic Seepage
• Toxic Spillage
• Trash
• Unwanted
materials
• Waste Coal
• Waste Disposal
Companies
• Wastes
• Retirement of
[equipment]
• Salvage
(action)
• Scrap (action)
• Surplus
• Unlawful
disposal
• Waste Disposal
Table 7.2: Table of West Virginia State Code Solid Waste Policy and Geography Attributes
Operationalizing Attributes and Characterization
Policy and legal data are dense, extensive, and difficult to use. Therefore, the Tremper, Thomas
and Wagenaar (2009) guide and accompanying policy law template for interdisciplinary
researchers was utilized extensively. The template acts as a categorization schema to measure
and produce accurate indicators of the law. The author further adapted the template to categorize
spatiality, geography, and policy information using spatial waste characterizations based on
policy, including scale and jurisdiction characterizations table (Table 7.3) This narrowed the
somewhat unwieldy list of attributes and aggregate categories into a manageable format. Each
code narrative required review for embedded waste policy, location, and spatial extent and this
was performed through multiple depth-centric organizational structures. Interpreting the code
narrative and other sources requires a breadth of knowledge of the policy area and spatial
concepts to recognize possible linkages to other scales or policies.
Aggregating large numbers of records and verifying their status was challenging and time-
consuming because of the nature of place names, administrative names, the varying nature of
municipal codes over time, and differing interpretations of waste typology.

102
Policy: Waste Scale and Jurisdiction Characterizations
Policy ID
To be able to select individual policies and corresponding land use, a policy
ID had to be used to give each type of policy location a unique value.
Attributes
Spatial attributes that specify features
Classification Agency
Official designated classifying agency
Policy Code
Official Agency or Government Code
Cross-Cutting
Cross-cutting between policies, waste types, agencies
Policy
Each policy needed to be identifiable by its official descriptor or a
description that defined it in an easy to scan and read format. Many times
policy codes had to exist in multiple selection lines with codes specific to
the location type that drives waste type and subsequent policy, which was a
time consuming challenge.
Text Description
Text narrative also provided a place to integrate digitized and non-
cartographic records, news, practices, and spatialized often fuzzy small p
policy, such as gentlemen’s agreements, historic patterns, and best
practices.
Economic Zone
Description
Economic Zone information or data
Jurisdictional
Authority
Authority over the jurisdiction (different from agency)
NAICS
The North American Industry Classification System (NAICS) standard used
by Federal statistical agencies in classifying businesses
Name
Name the policy is commonly referred to as
Scale
The scale of policy was necessary to identify geographic scale and how that
integration of policy scale and geographic scale would be represented
through specifying jurisdictions and other types of policy areas.
Source
Source of policy information

103
Table 7.3: Waste Scale and Jurisdiction Characterizations
Creating an Overarching Proxy
Although vital to categorizing and characterizing policy, the resulting waste, scale, and
jurisdictional characterizations were still too unwieldy for this project to employ and would have
led the geodatabase and spatial relationships to grow exponentially. Accordingly, and to avoid
using a representative selection of waste types, a proxy for types of waste in a jurisdiction was
used to populate the attribute table. The usability of these categories was further addressed by
creating an annotated baseline that nested typologies which could be combined into other
categories (Table 7.4).
Title
Official title for the policy (differs from name)
Type
A way to further correlate geography, policy, and waste typology is by type
of policy or keyword related to policy, which is similar to how the initial
waste matrix looked at waste policy by It is especially helpful with fuzzy
boundaries or waste impacts such as air, but also indicates stove-piped and
unusual attributes such as airports. Further, type allowed for a place to
include historic references to type that equate to current terminology.
URL
Website URL if available
Further annotations
Any relevant information not contained above

104
Overarching Generalized Typology
General Waste
General Waste = (Municipal waste + universal waste)
Food Waste and Composting
Compost = (Compost waste + food waste)
Special Event Waste
Temporal event waste such as football games, festivals, and
recreation
Specialized Wastes
(Specialized disposal and handling waste such as electronics,
textiles)
Medical Waste
(Medical waste + sharps/needles + medications)
Recycling
Recycling = (Recycling and reuse)
Transportation
Transportation of waste
Water
Waste-related water issues
Land
Waste-related land area issues such as brownfields, ownership
Air
Waste related air issues such as emissions
Electronics
Electronic and e-waste
Industrial
Industrial and business waste
Agriculture
Agriculture and farm waste
Hazardous
All levels of classified hazardous waste including HHW
Enforcement
All levels of enforcement of waste-related issues
Recycling Commodities
Secondary market commodities
Energy
Waste related to energy and resource extraction
Table 7.4: Overarching Generalized Typology
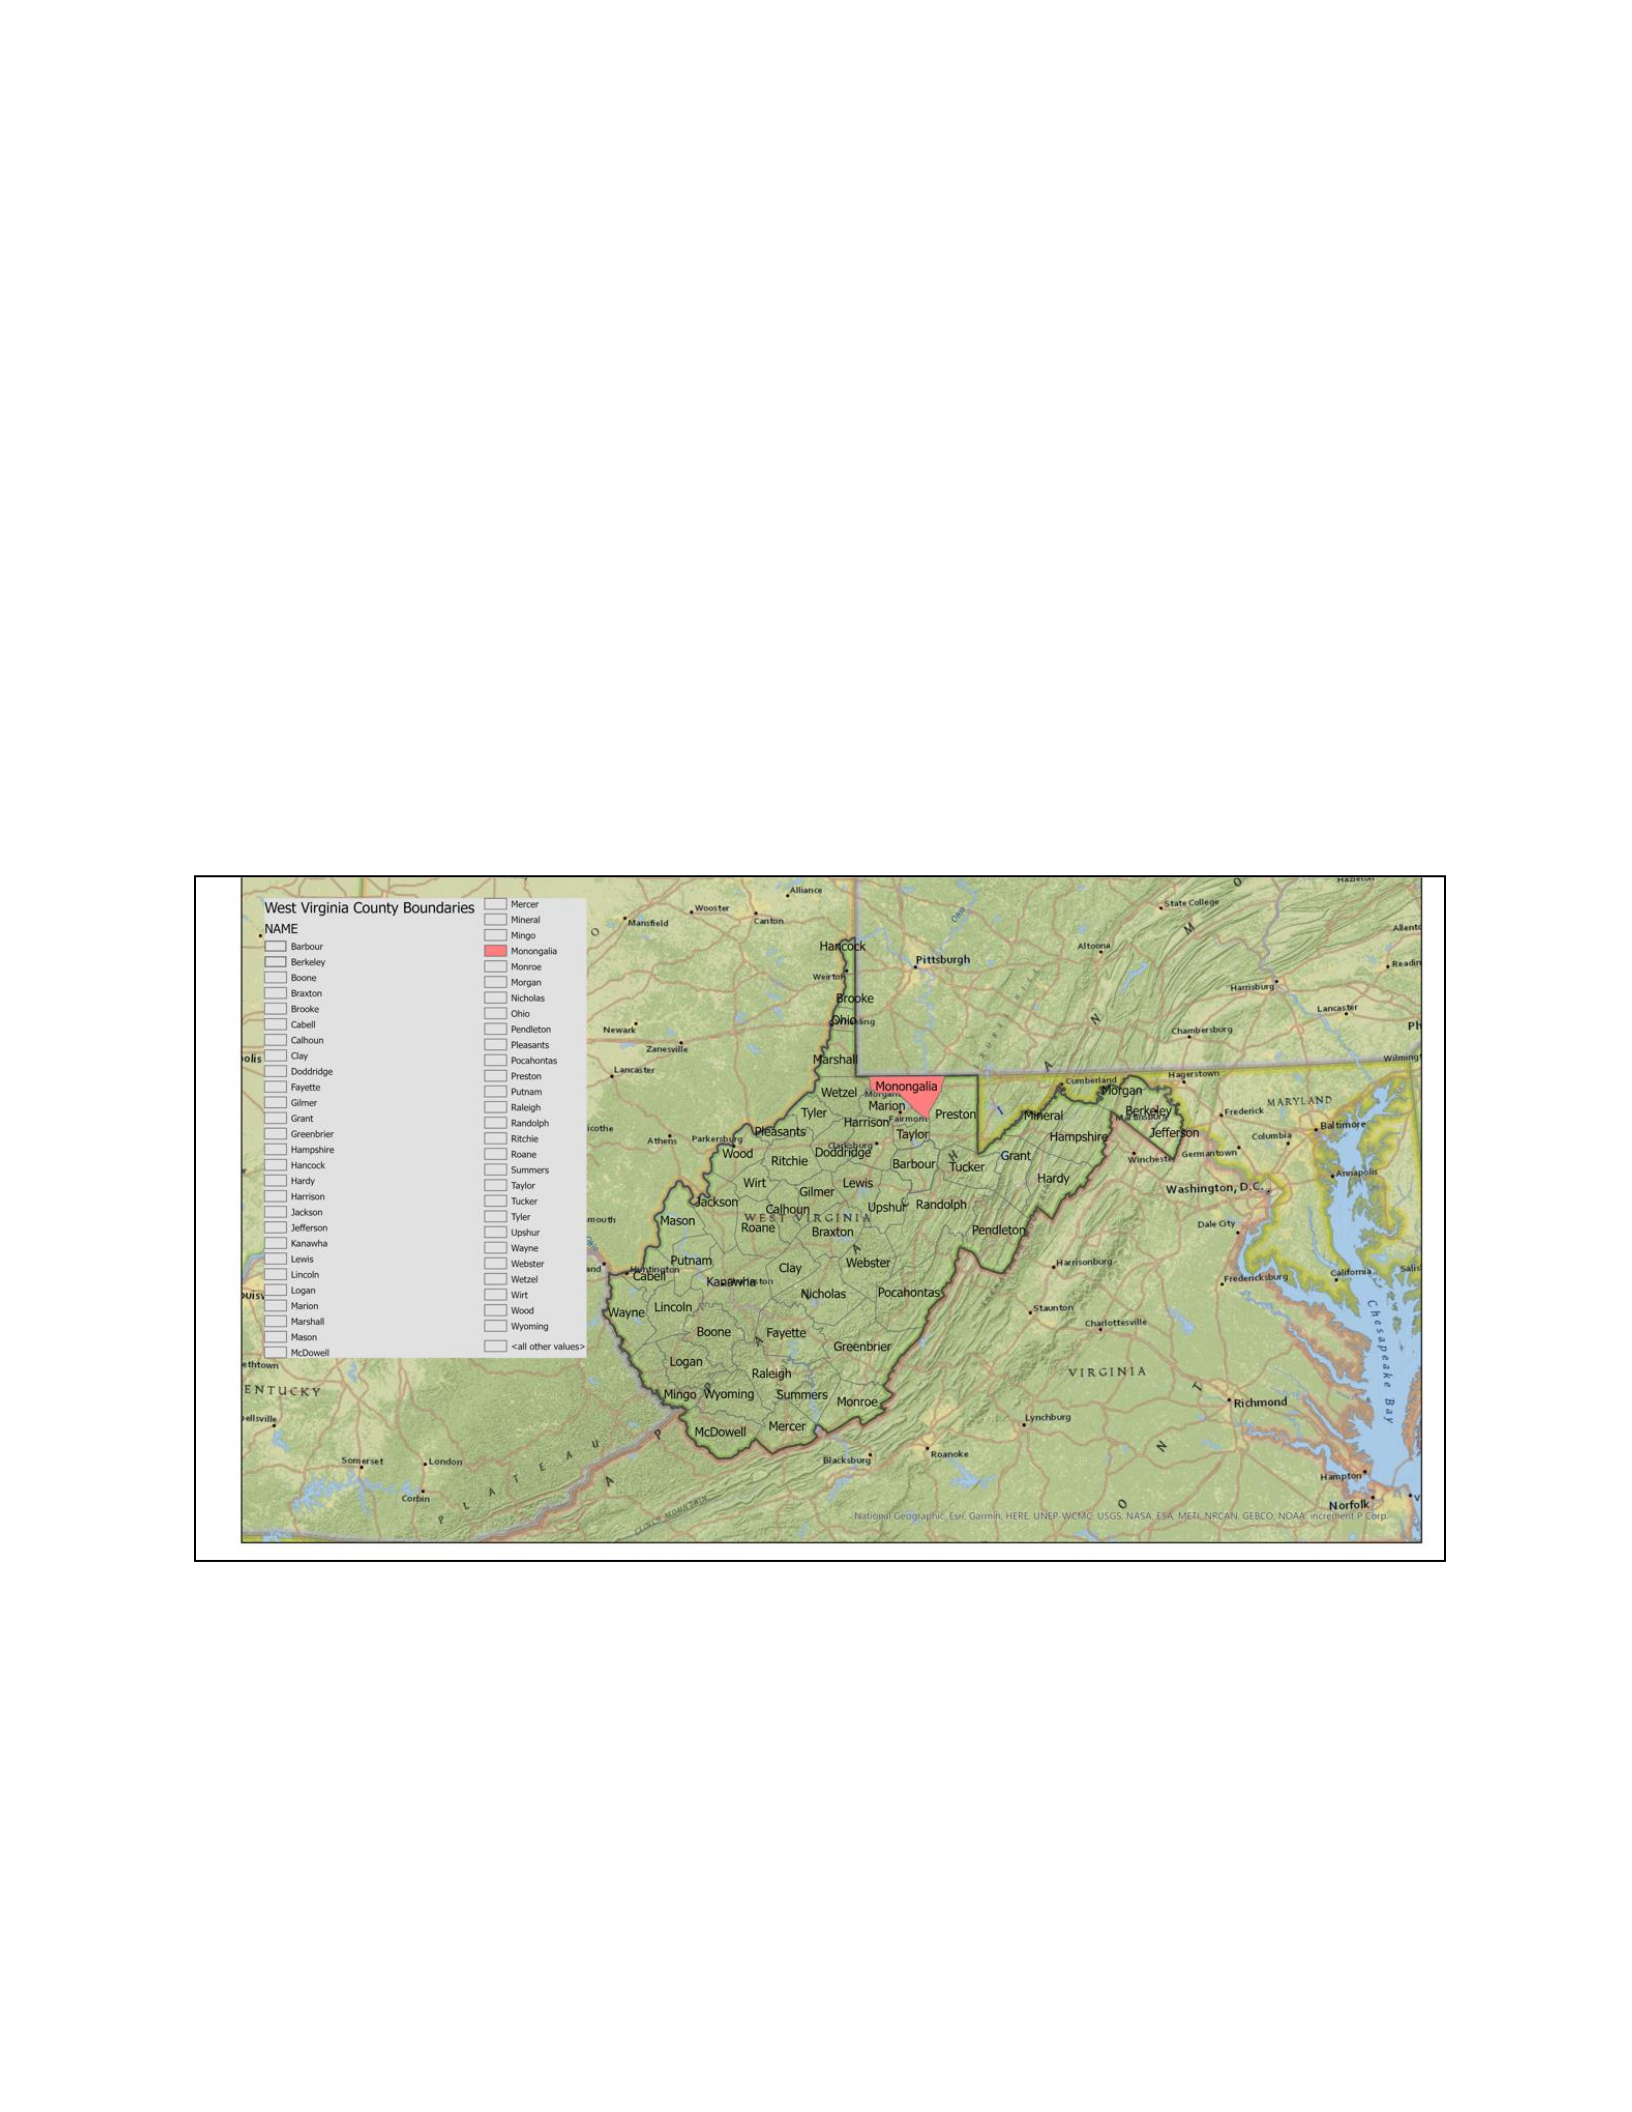
105
Chapter 8 The case study, space, and solid waste policy
To undertake an achievable demonstration, the study area for this analysis was limited to
Monongalia County, West Virginia which is the fourth most populated county in the state with a
2010 total population of 96,189 residents (Figure 8.1). Monongalia County has the usual mix of
county and municipal government but also has additional authorities in the form of a federal
prison, federal agencies, several hospital complexes, and West Virginia University among others.
The largest urban area in the county is the city of Morgantown, yet within the greater
Morgantown area there are several ‘cities’, regional authorities, and municipalities with their
own jurisdictions and solid waste history and practices. It will be seen later in this chapter that
there exist many fuzzy boundaries ‘defining’ these areas. The county thus provides a valuable
case study with which to test the policy-shed system.
Figure 8.1: Monongalia County
Jurisdictions, authorities, and boundaries
To set the scene, in West Virginia, cities such as Morgantown, with a population of over 10,000
must meet higher federal and state waste and recycling standards than required from surrounding
areas though they do have greater autonomy over their solid waste system (Figure 8.2).
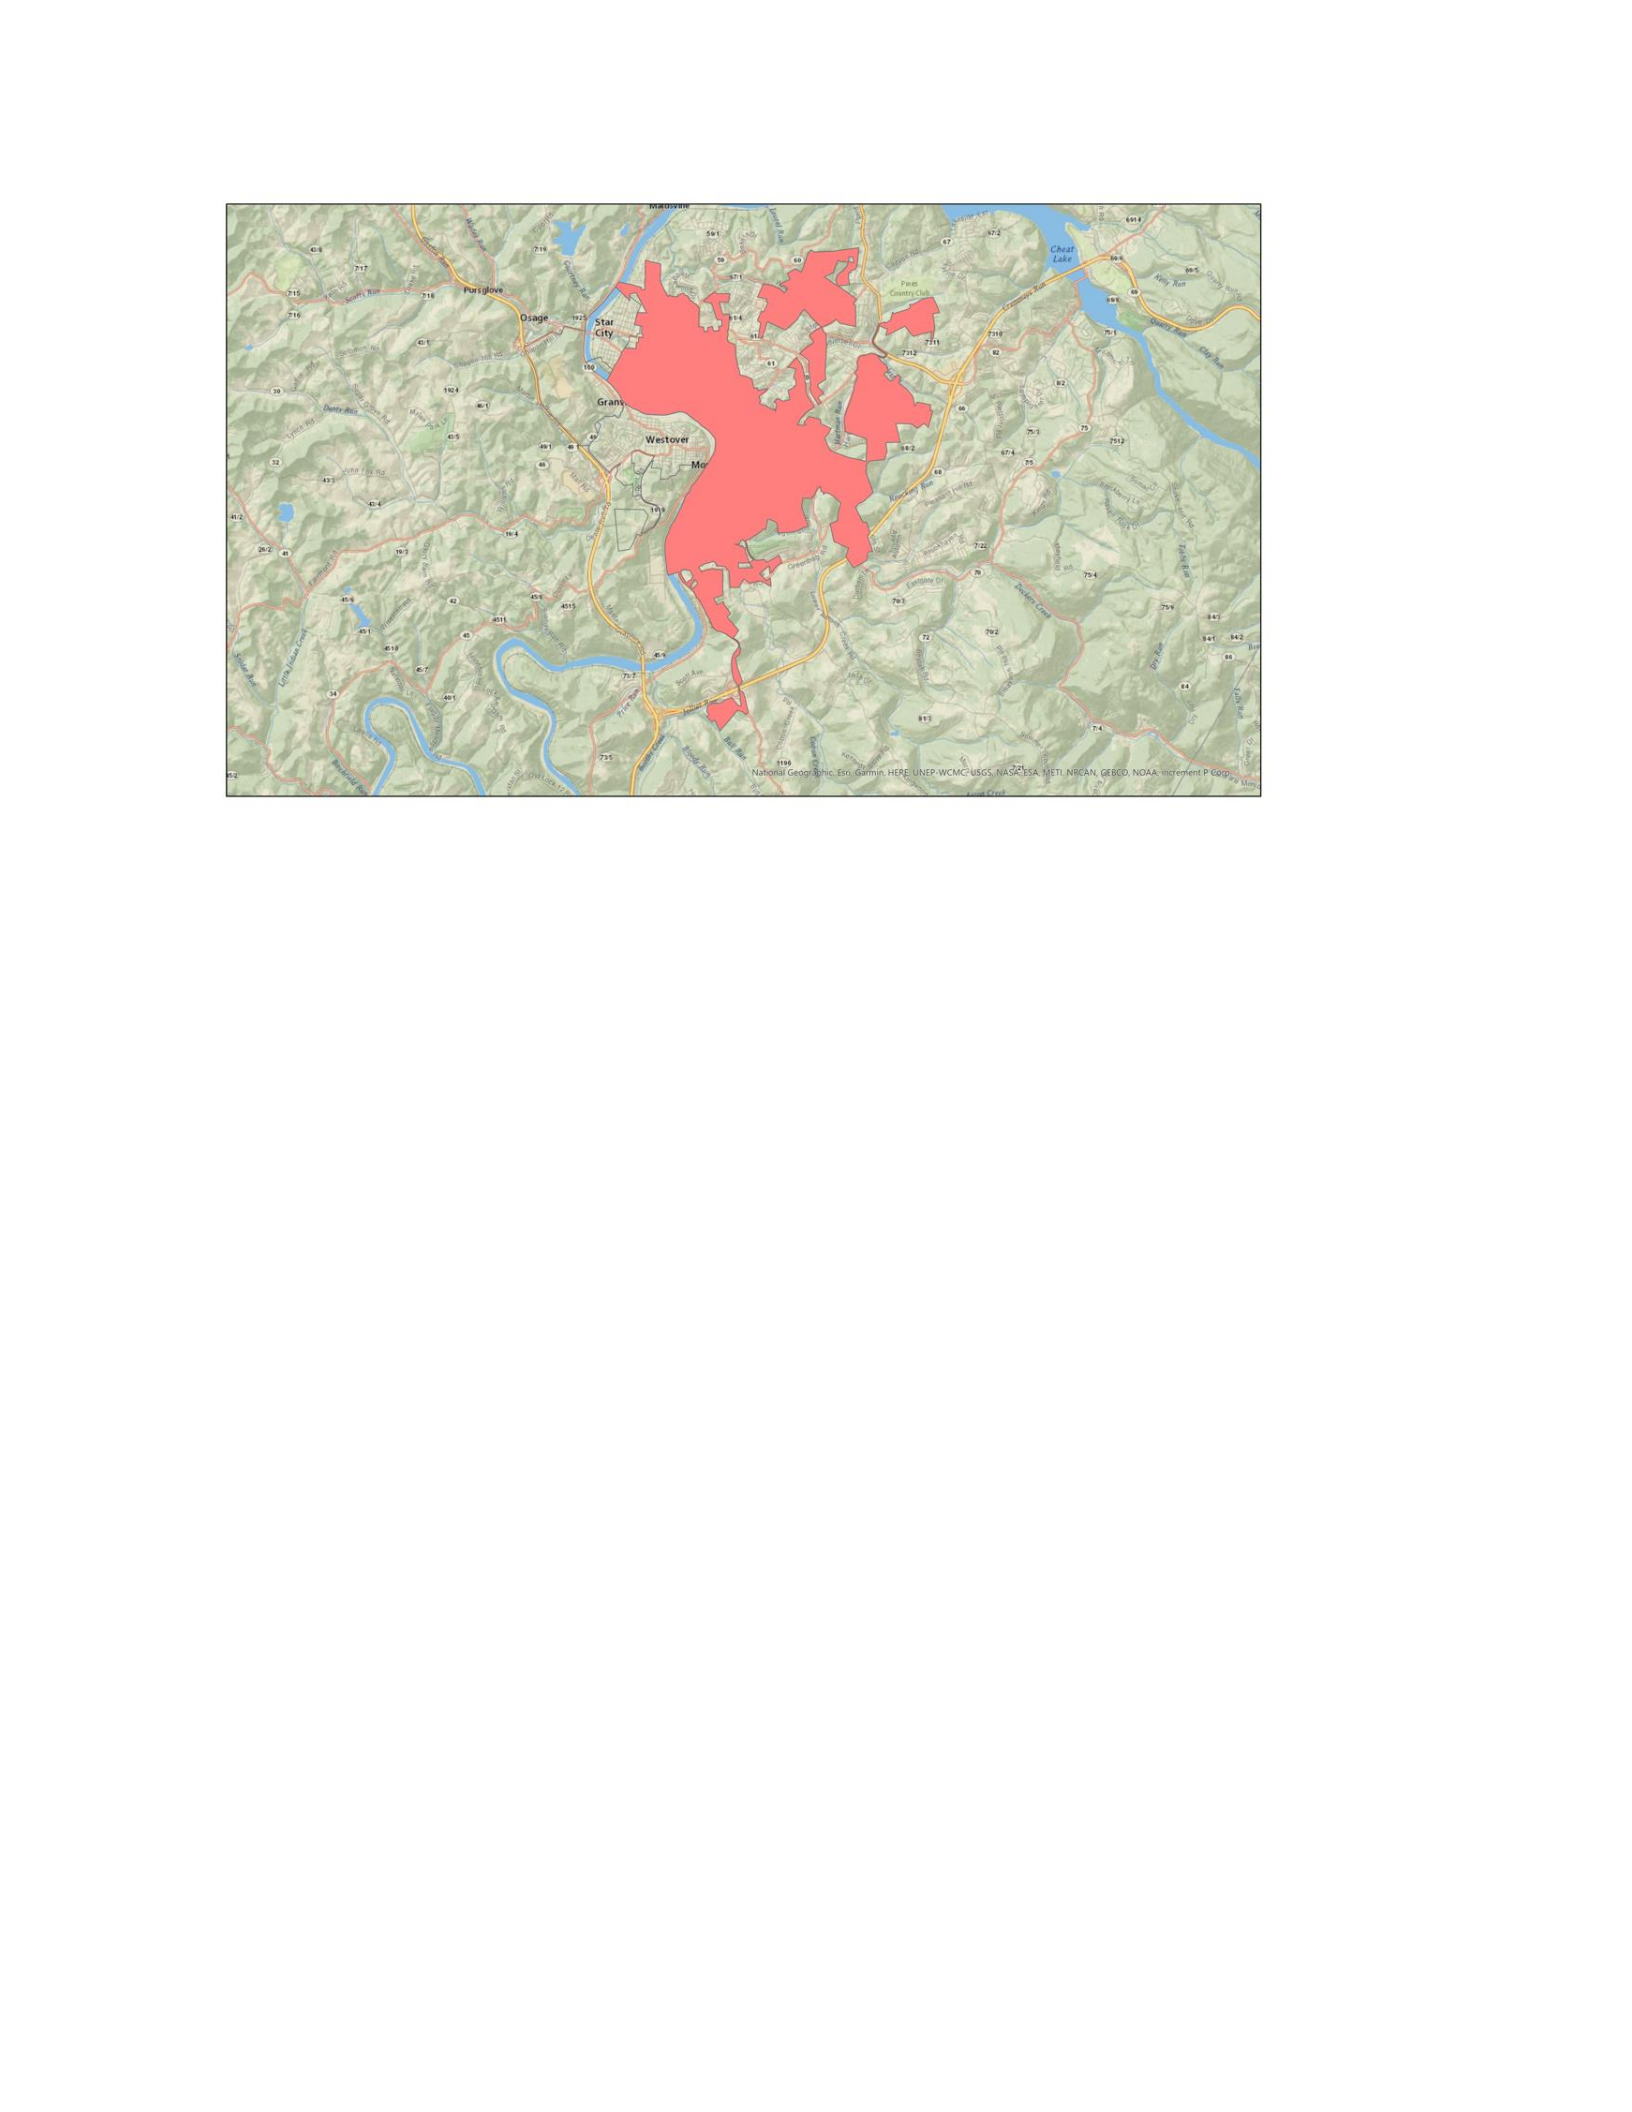
106
Figure 8.2: The City of Morgantown
For communities with less than the 10,000 threshold there is no state mandate for implementing
recycling programs so Morgantown is the only area in the county with a mandated recycling
code. Morgantown, as a city, is under-bounded and though the city limits have expanded in
recent years it is the Greater Morgantown area which prompted the US Census Bureau in 2000 to
designate Morgantown as a metropolitan area based on the multiple adjoining jurisdictional areas
which lifted the population size to over 50,000 people. A map of some of these adjoining
jurisdictions such as Star City and Westover that make up the Morgantown metropolitan area,
shows the proximity of these places to Morgantown such that there is almost no differentiation in
urban sprawl (Figure 8.3).
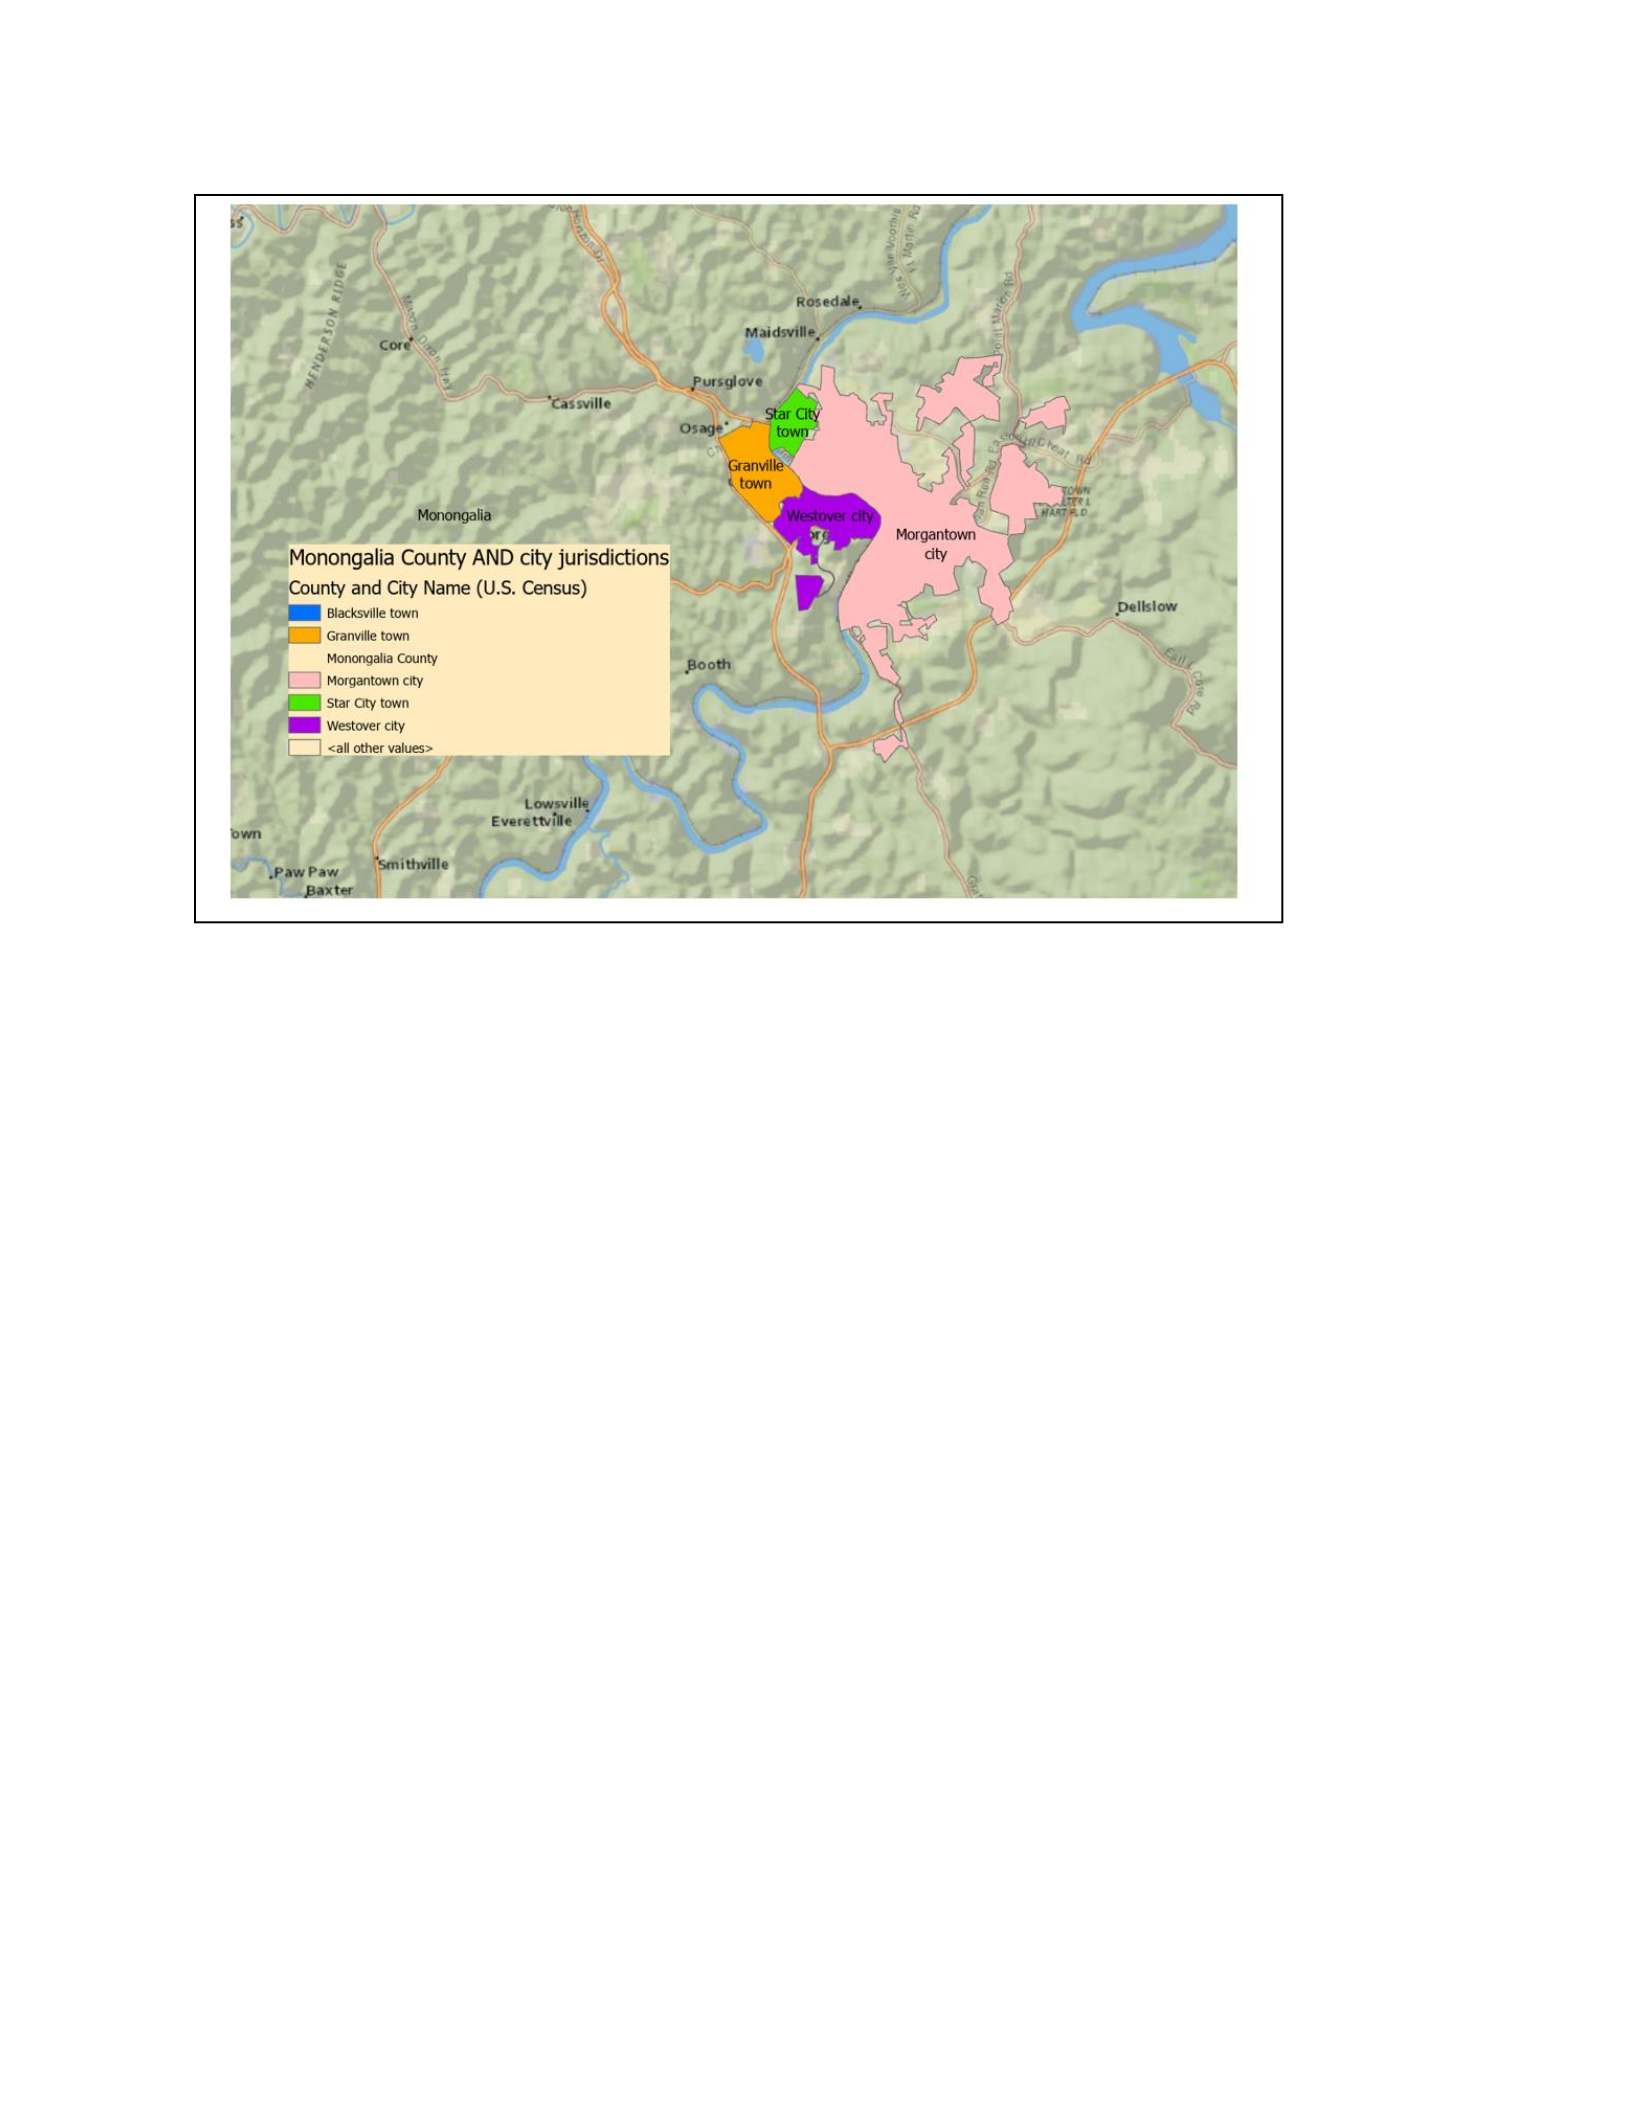
107
Figure 8.3: Multiple Jurisdictions for Greater Morgantown
Anecdotally, while these jurisdictions are known to residents, most local people would think of
the metropolitan Greater Morgantown as ‘Morgantown’ and as one continuous urban area. And
yet while the City of Morgantown must follow federal and state solid waste disposal and
recycling procedures, the immediately adjacent jurisdictions may follow their own code and
establish separate and independent waste haulage procedures, many of which date back in history
and are uncodified agreements that have been in operation for generations. Thus, multiple
regulatory codes apply even within a seemingly common urban core.
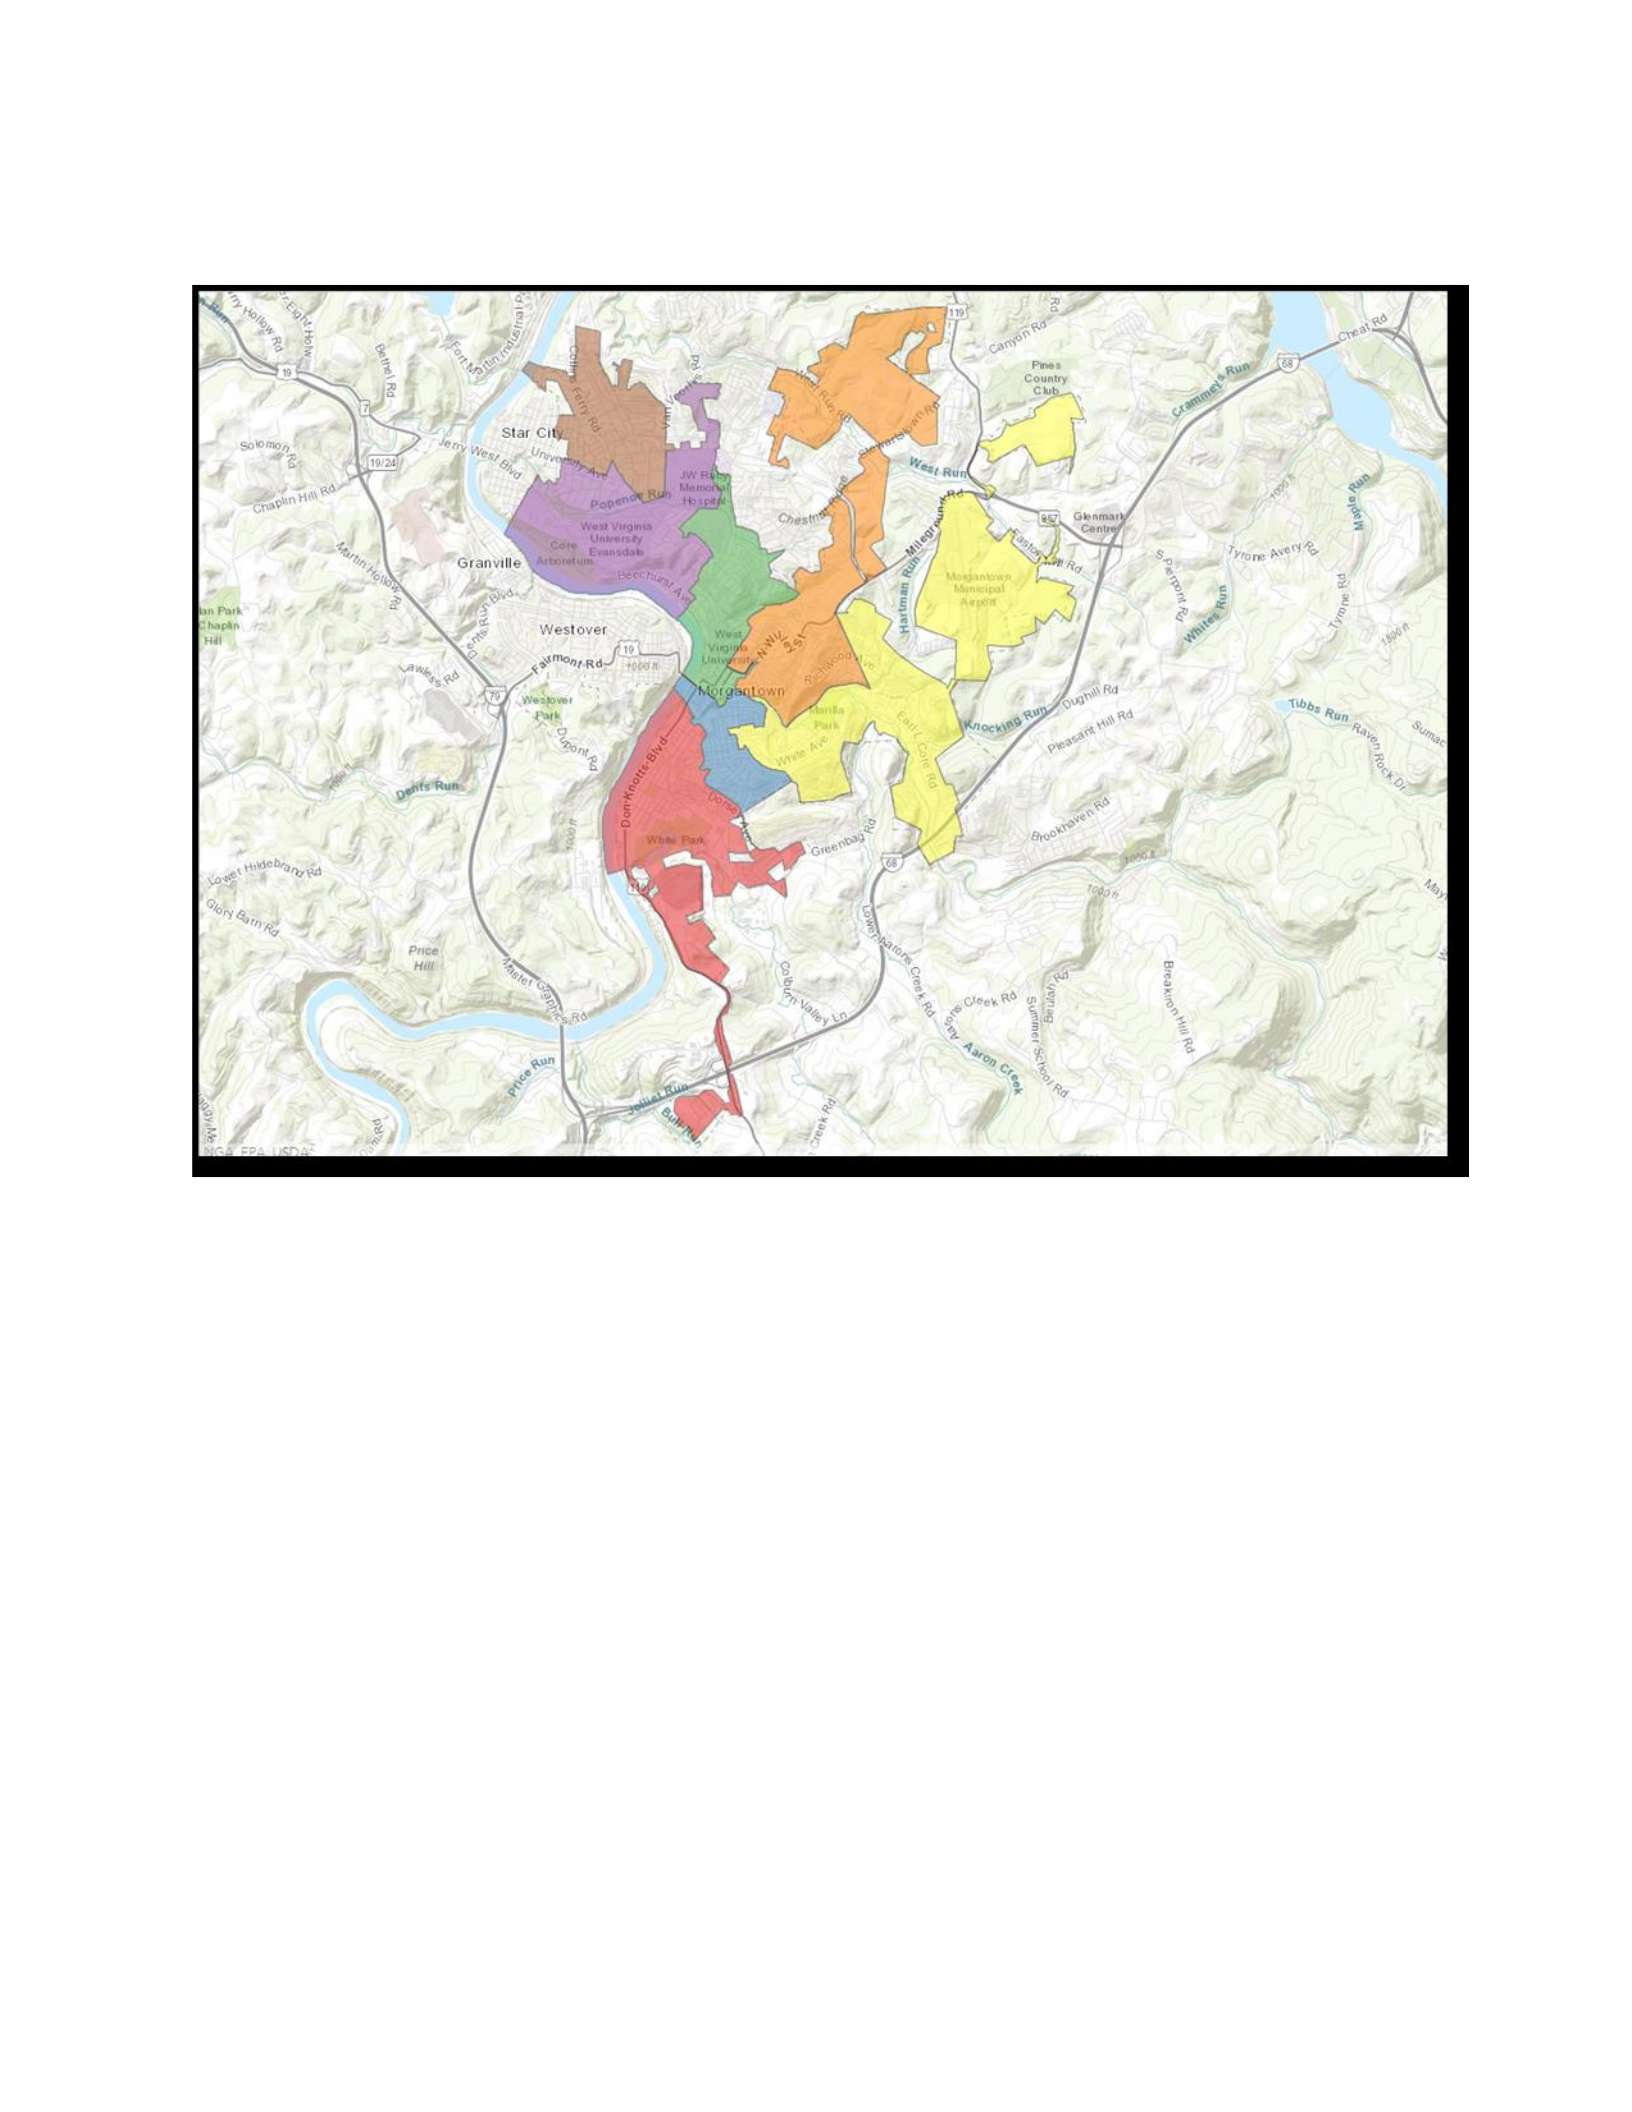
108
Figure 8.4: Ward boundaries in Morgantown Source: City of Morgantown
Further, even within the City of Morgantown, there are disagreements over the boundary
descriptions of several city wards (Figure 8.4). Nor are waste practices shared between wards.
Part reason for these disagreements and differences can be traced back to historical unwritten
agreements, the ‘gentlemen’s’ agreements, between waste haulers that often sought to overcome
the barriers arising from old state tariff territories and that some wards have differing haulers
depending on whether a structure is residential or commercial. In determining the latest ward
boundaries, city officials used physical boundaries to ensure contiguity by preserving street
connections across each ward using a form of territory analysis such that residents were not
completely severed from their wards by another ward boundary. In addition, the ward boundaries
were updated to rebalance the number of registered voters across the seven wards while seeking
to preserve existing neighborhoods. However, local community perceptions as to what
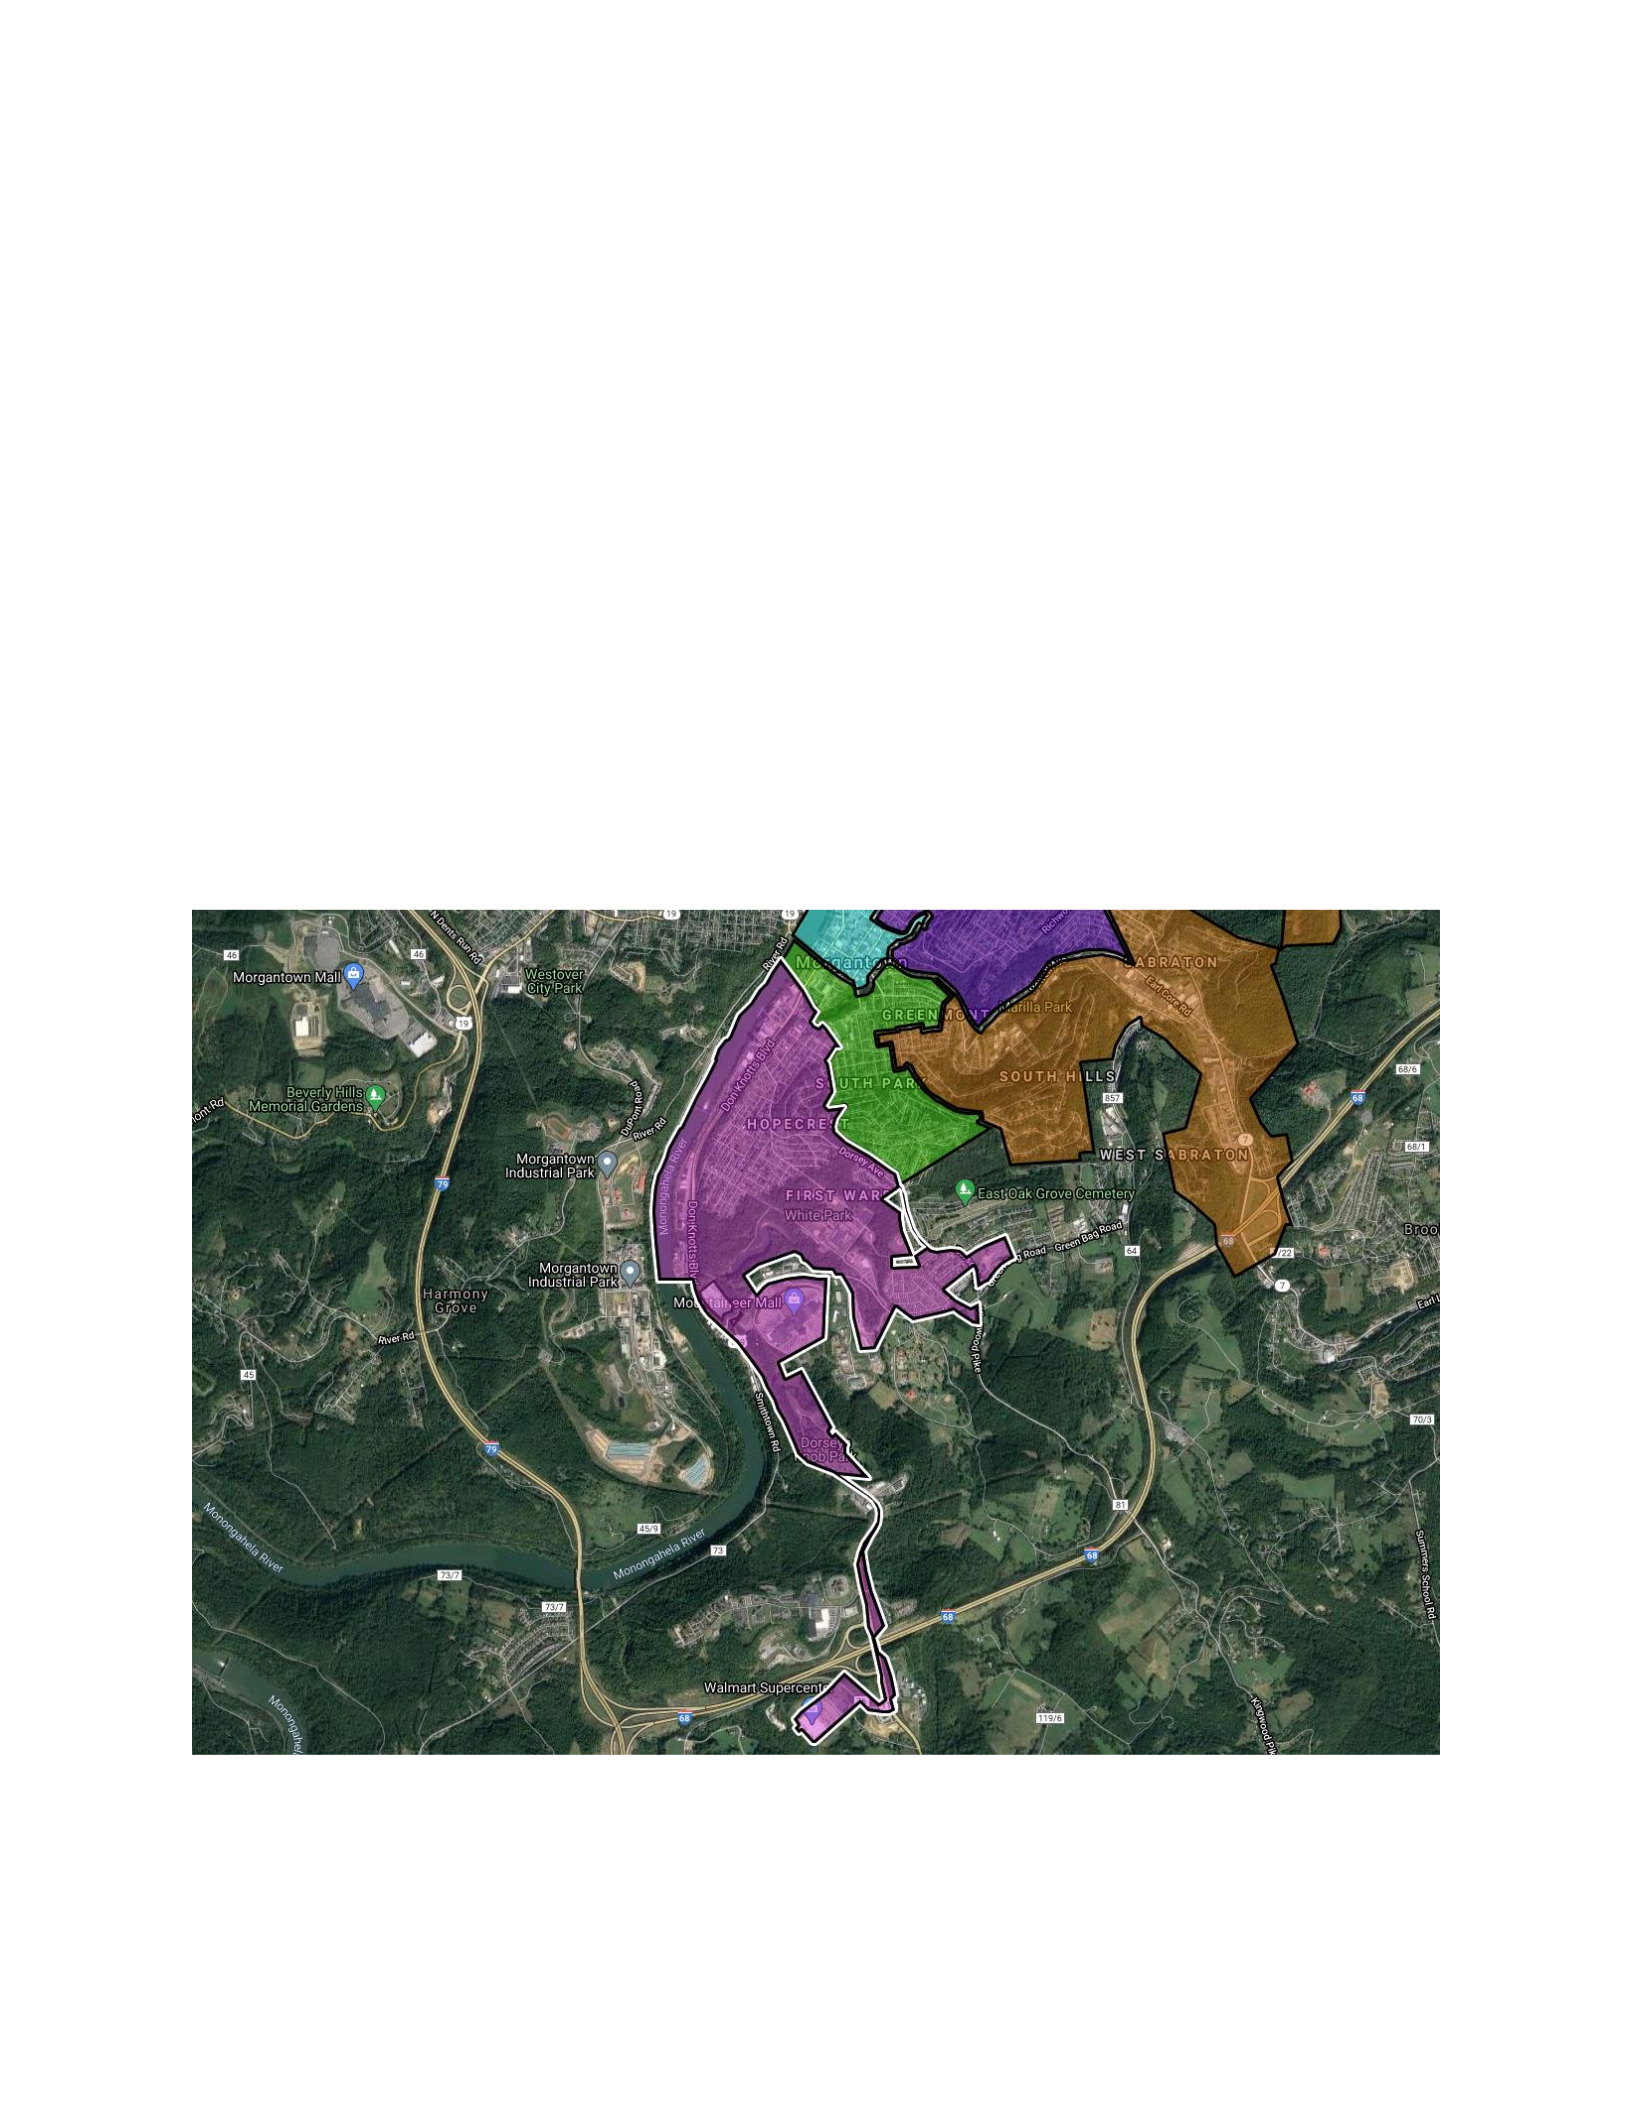
109
constitutes a neighborhood conflict with these rational designations. According to the
Morgantown GIS Ward Boundary Analysis Final Report (Davis, 2020) “Given the lack of
reliable GIS data for neighborhoods and understanding what residents consider to be their
neighborhood, this can only be evaluated through anecdotal information provided by public
comments and the Commission's input”. In seeking to redefine these neighborhoods and wards,
the legacy waste protocols and practices were placed in contention. Such legacy agreements
have profound geographical implications for the regulation of solid waste disposal.
Spatial anomalies in regulatory solid waste disposal can occur in other ways. Thus, in recent
years a second Walmart Superstore was constructed on the southern periphery of the city of
Morgantown. At the behest of the company, request was made for the complex to be
incorporated within the city boundary leading to the southern peninsular-type boundary
extension (Figure 8.5).
Figure 8.5: The southern Walmart extension
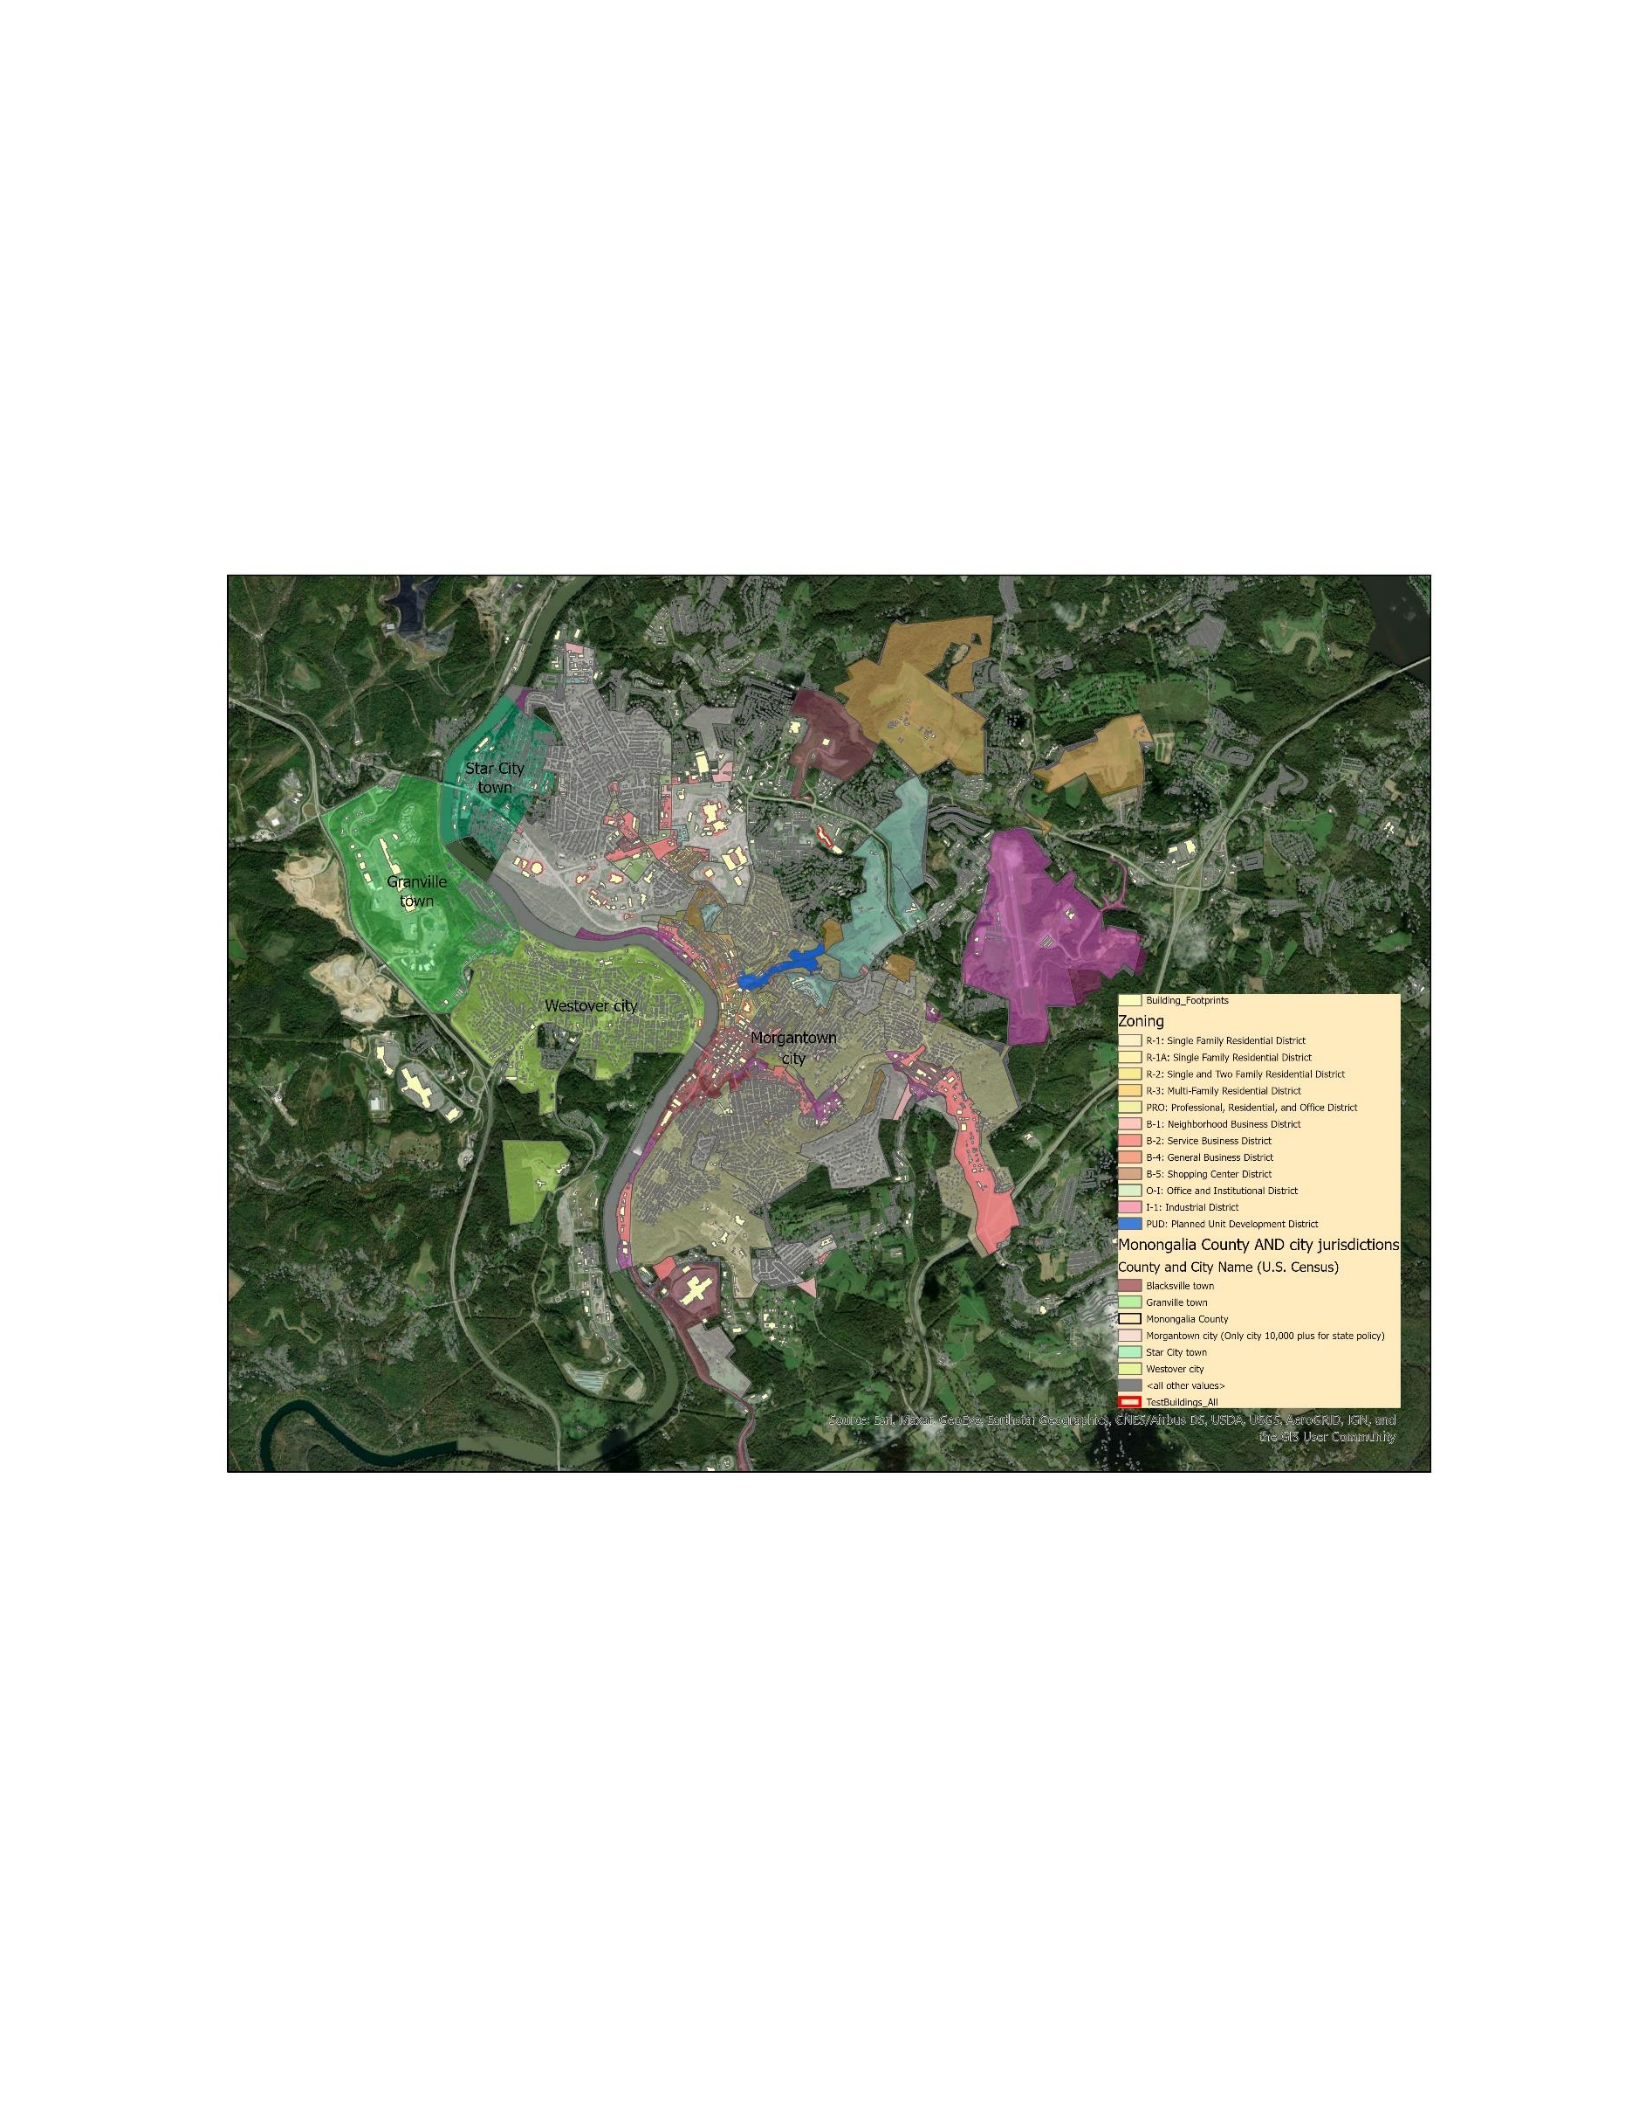
110
While Walmart is one of the largest generators of waste in the area it, along with other large box
stores, have their own strict waste and recycling procedures, that often outstrip the municipal
regulations in force.
While municipalities might have overall responsibility and authority over solid waste disposal
there exist other authorities such as planning zones and economic zones that can prescribe their
own applicable regulations over waste haulage (Figures 8.6).
Figure 8.6: City jurisdictions and zoning
The North American Industry Classification System (NAICS) is a classification of business
establishments by type of economic activity. Economic zones, for example, tend to better
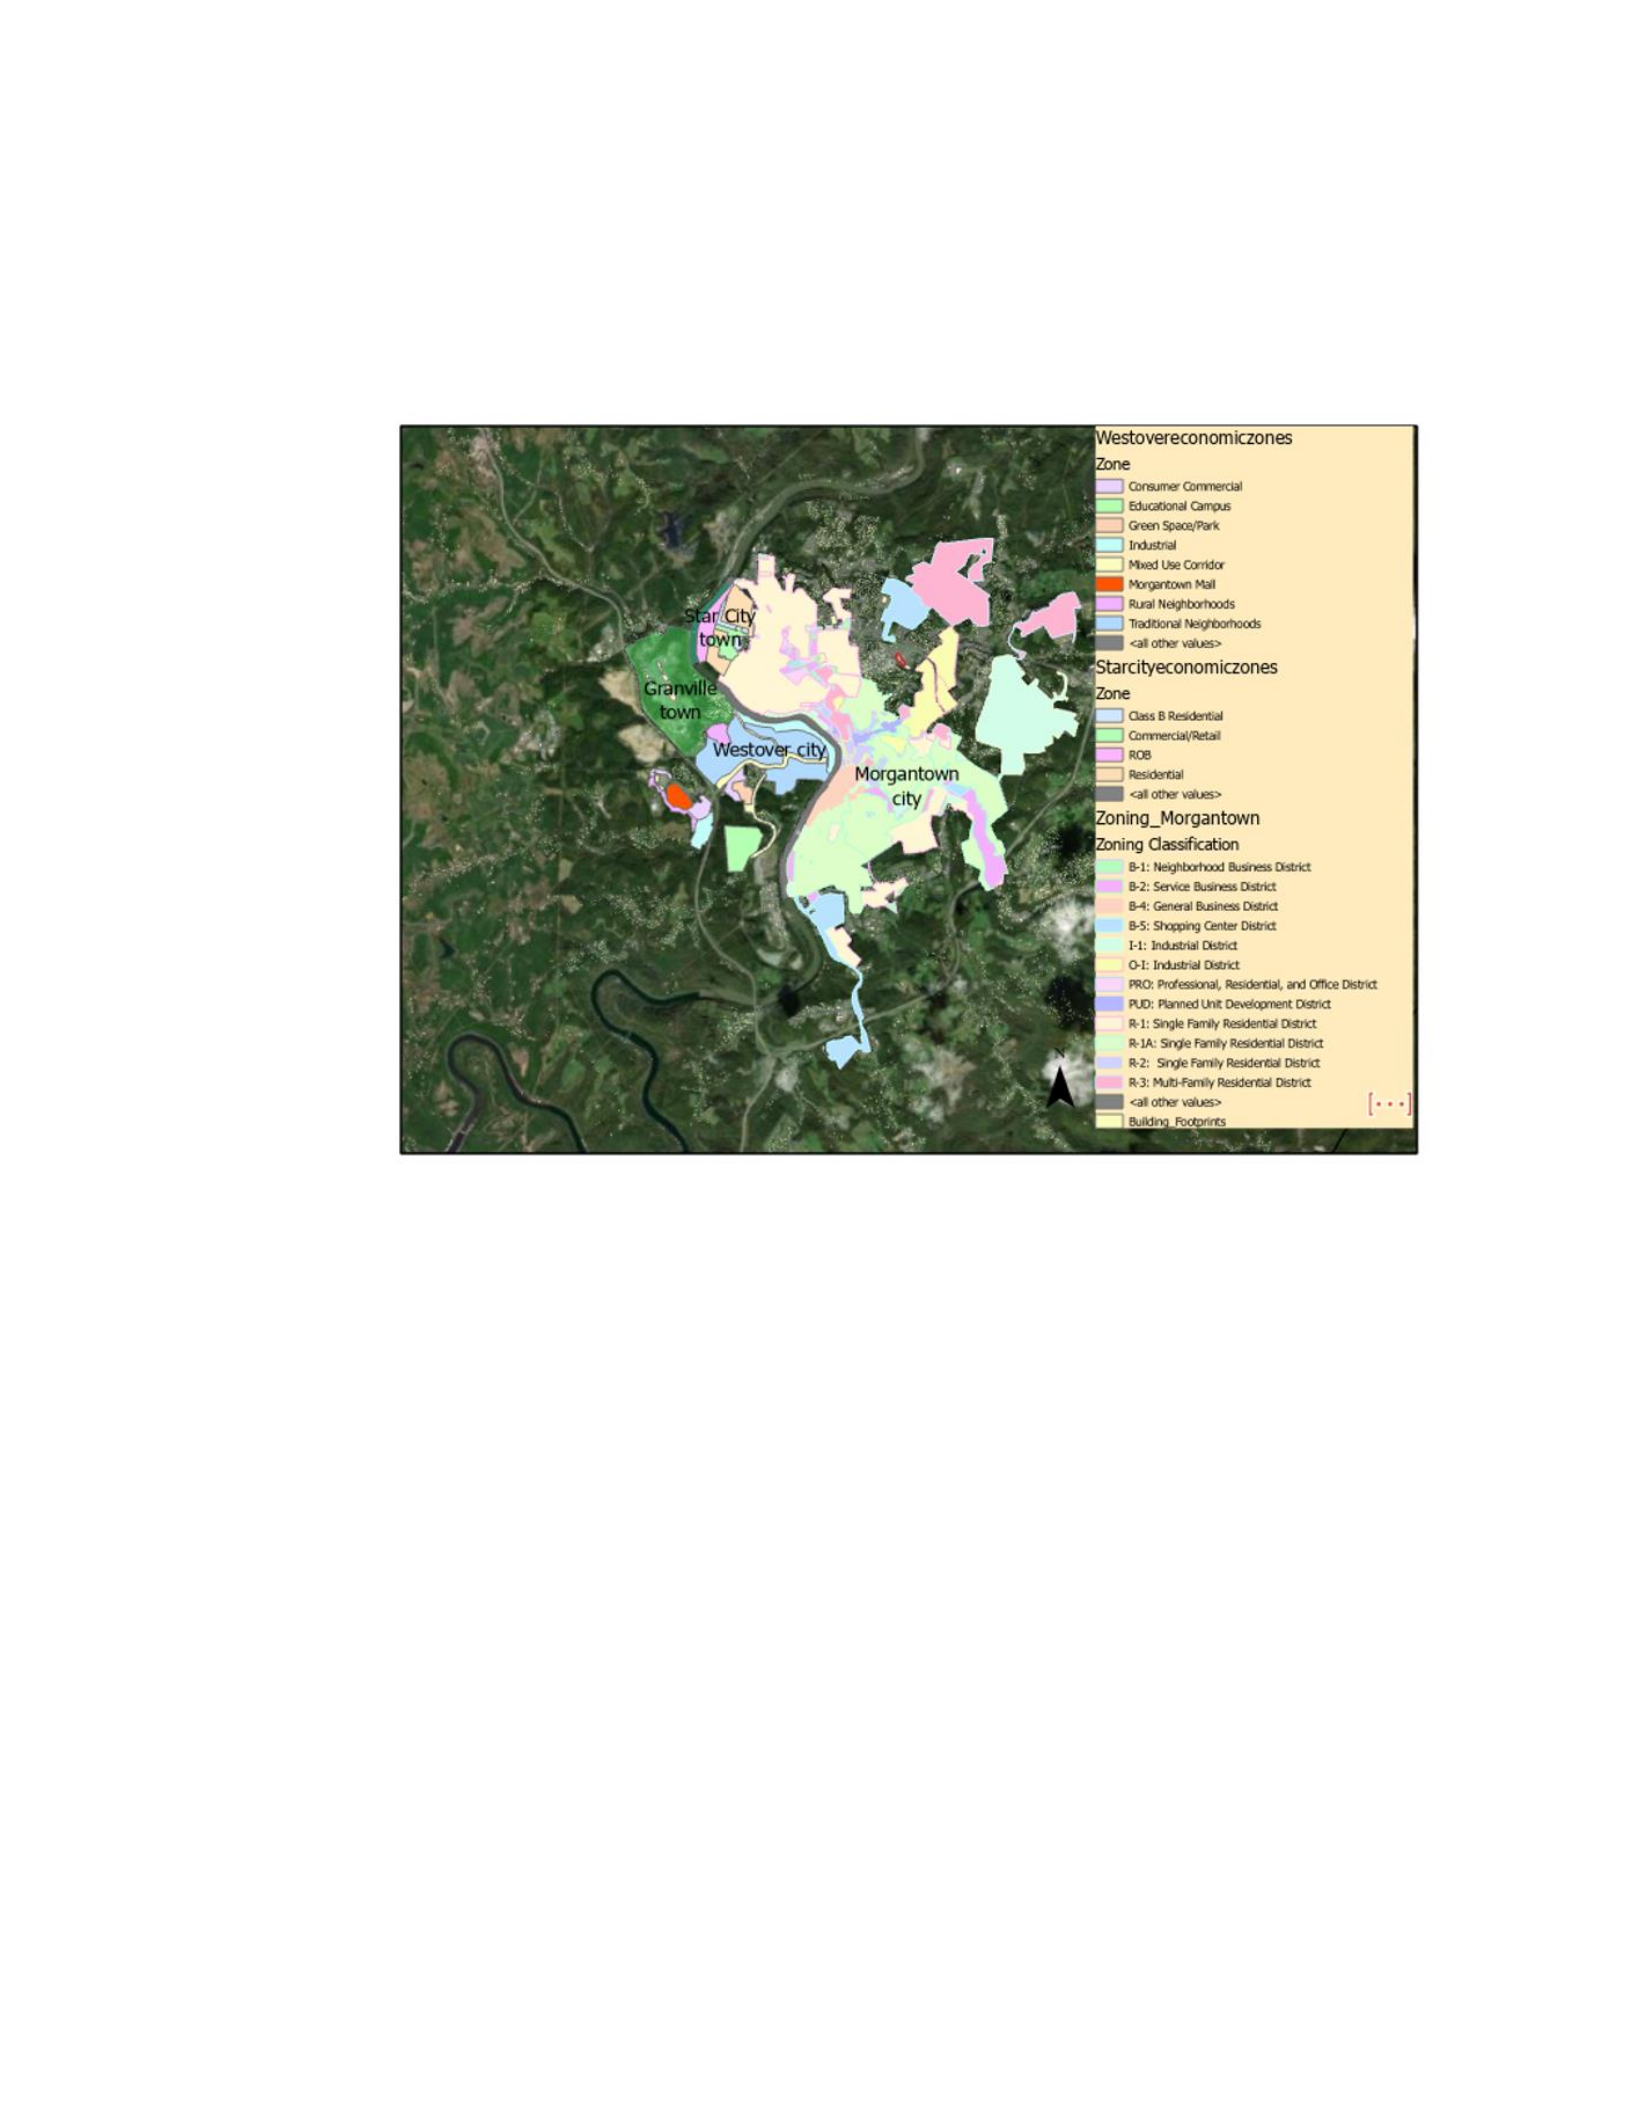
111
capture the types of waste and the related policies that apply to their disposal than do other areal
units because they are smaller areal entities (Figure 8.7 and Figure 8.8). Yet even here, the
zones may mask a variety of business practices, community practices, and small p policy
activities for which differing procedures apply.
Figure 8.7: Greater Morgantown Area Economic Zones
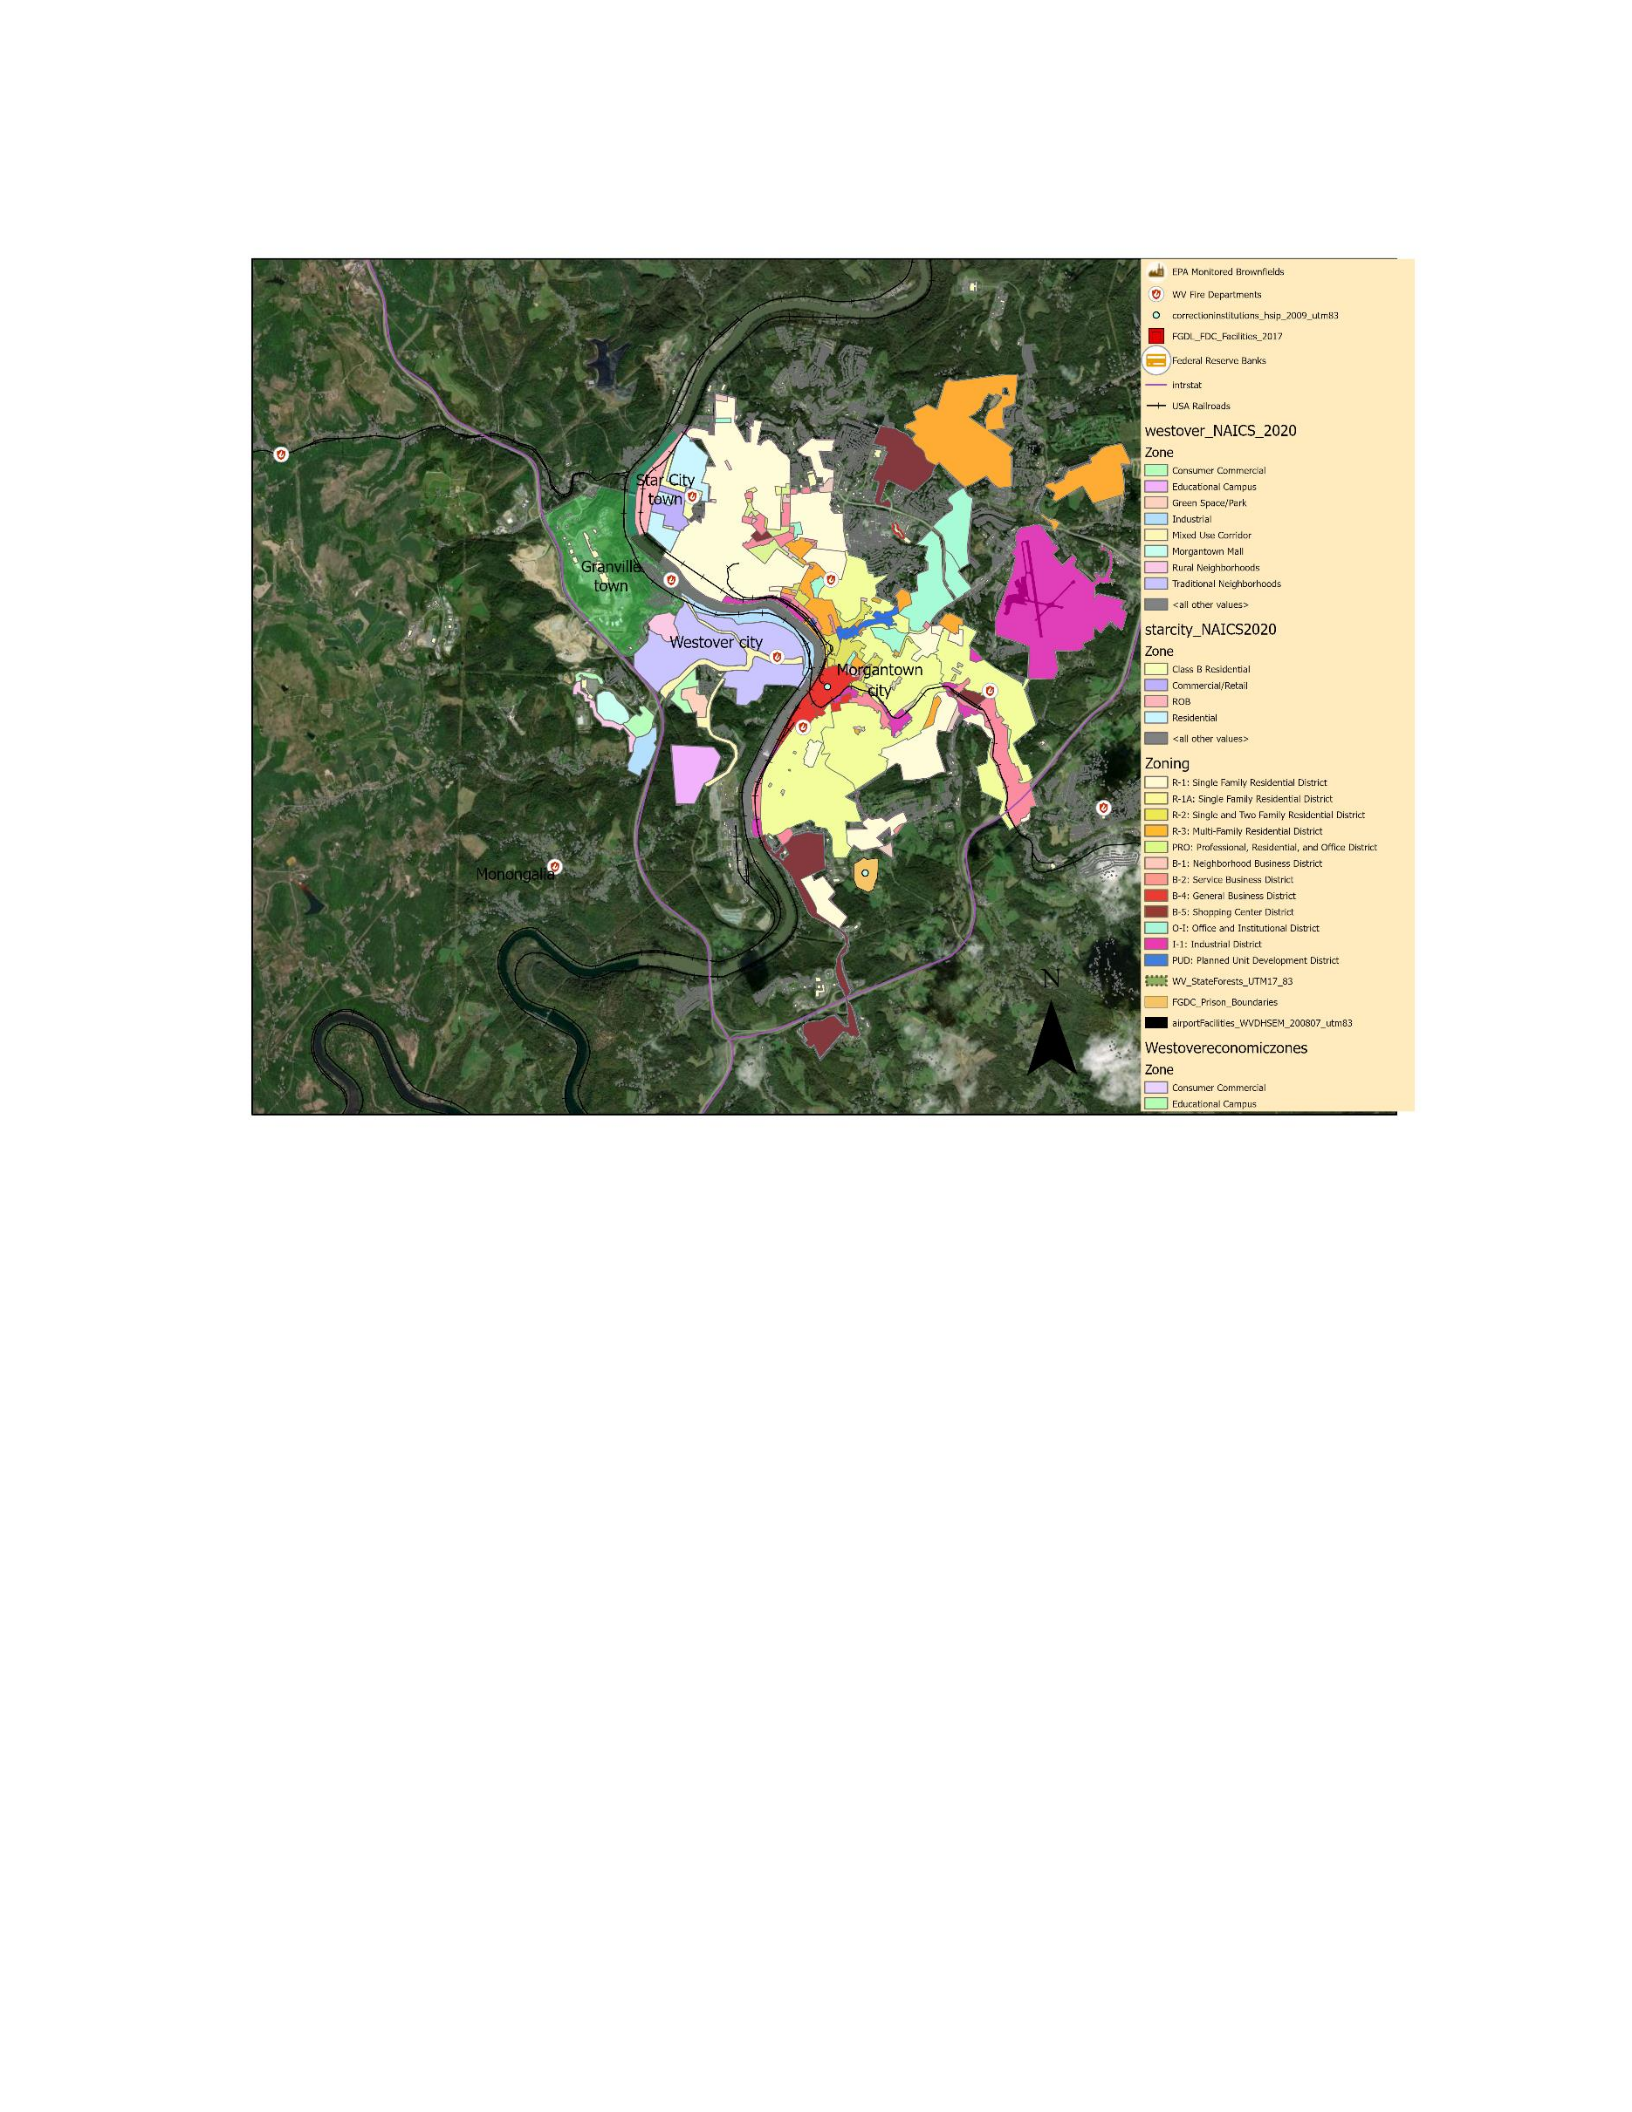
112
Figure 8.8: NAICS
Thus, differing recycling requirements may exist in the same area depending on if a structure is
residential or non-residential. Anomalies often become apparent when islands of residential
structures exist in a sea of industrial units. Not least the rising trend of young business owners
living above their businesses or industrial shops further complicates the situation. Similarly,
multifamily unit housing (MFU) which are both a home and a business might be seen as
residential and yet in a university town such as Morgantown with extensive student housing
needs, they are officially considered a business. As non-residential entities, MFUs incur a
greater number of waste collections than residential units, but since they are ineligible for
curbside recycling it is left to the property owner to provide recycling services to the tenants, and
many choose to offer no recycling at all. Thus, solid waste regulations, even for seemingly
contiguous and homogenous areas, are peppered with omissions, overlaps, and gaps in regulatory

113
policy. Here, of course, the Modifiable Areal Unit Problems and the ecological fallacy runs riot
through solid waste regulatory policy and spatial representation.
Other entities and authorities also complicate municipal waste regulations. Morgantown
Municipal Airport, for example, is an unexpected mélange of overlapping jurisdictions and
boundary designations. (Figure 8.9) Policy boundaries for the airport are fuzzy and difficult to
categorize (Figure 8.10). There is co-ownership of the airport by the city, the airport, a leased
restaurant, the county, WVU, the National Guard, the Civil Air Patrol, and the Transportation
Security Administration (TSA). It is the federal TSA, for example, who determine the placement
of trash cans to prevent possible tampering and other forms of waste disposal at the airport.
The DOE (Figure 8.11) National Energy Technology Laboratory (NETL) is a federal facility and
a large regional employer that has several sites in Monongalia County. As a federal facility
NETL implements their own solid waste policies irrespective of being within the jurisdiction of
the city of Morgantown. Similarly, with the federal low security prison located in Morgantown
(Figure 8.12)
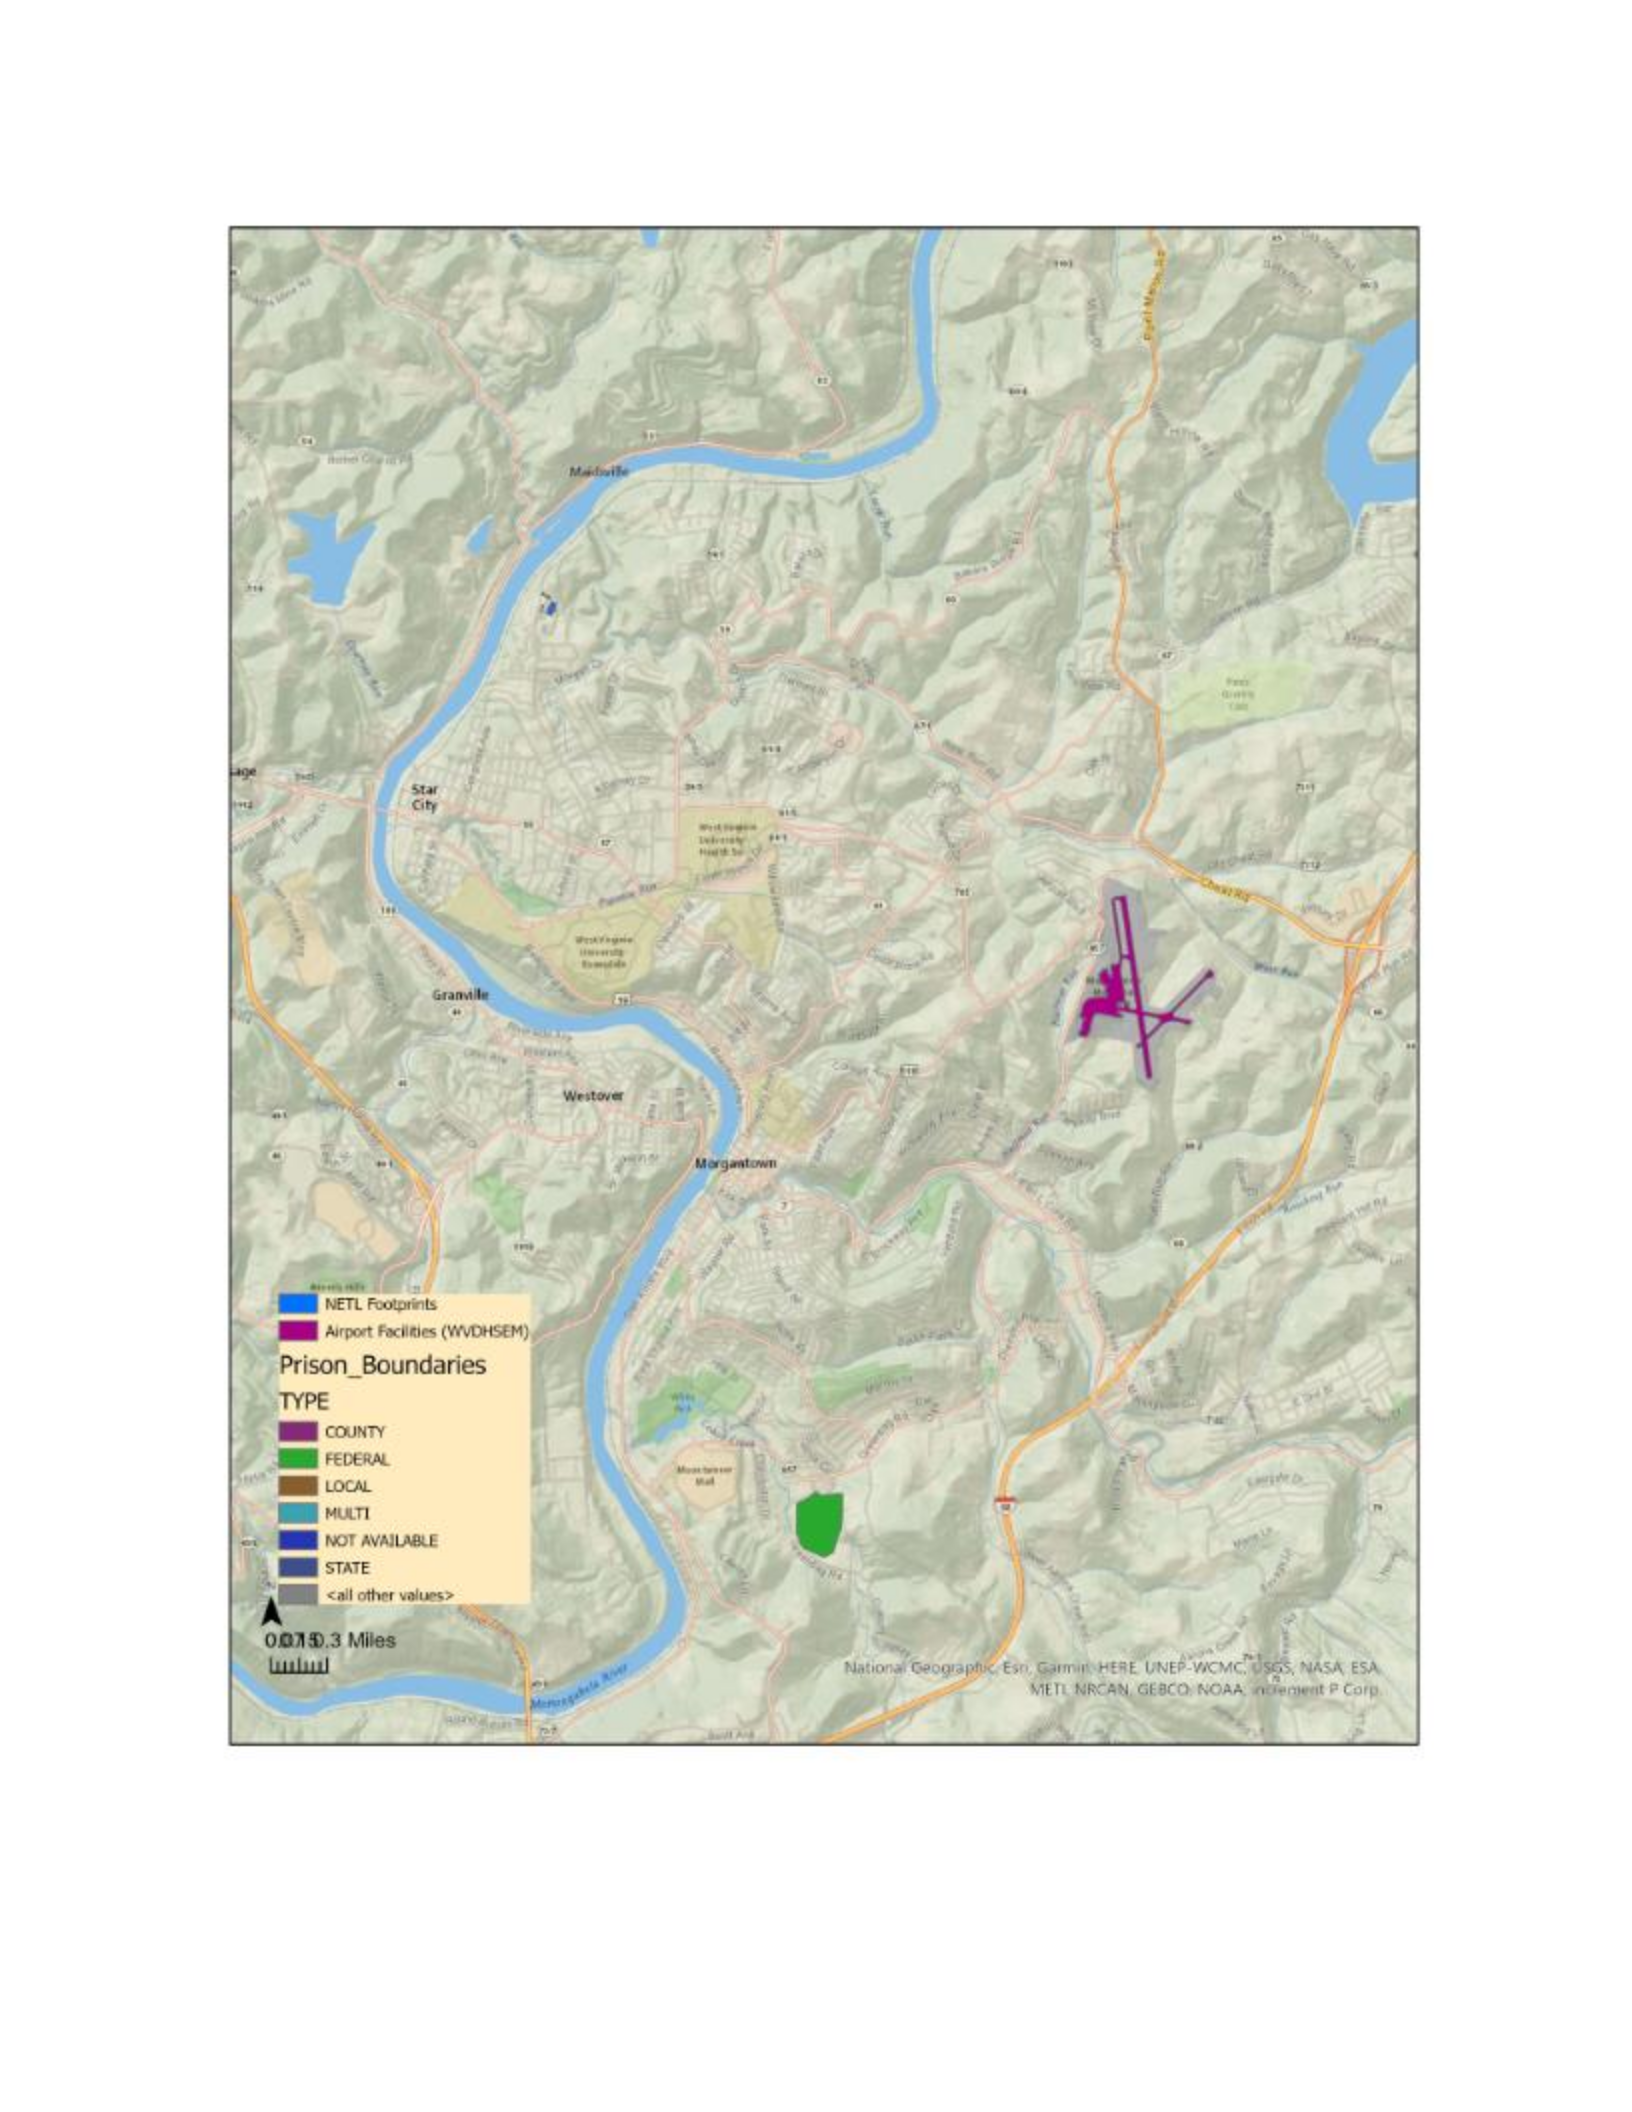
114
Figure 8.9 Example of how multiple authorities complicate municipal waste regulations
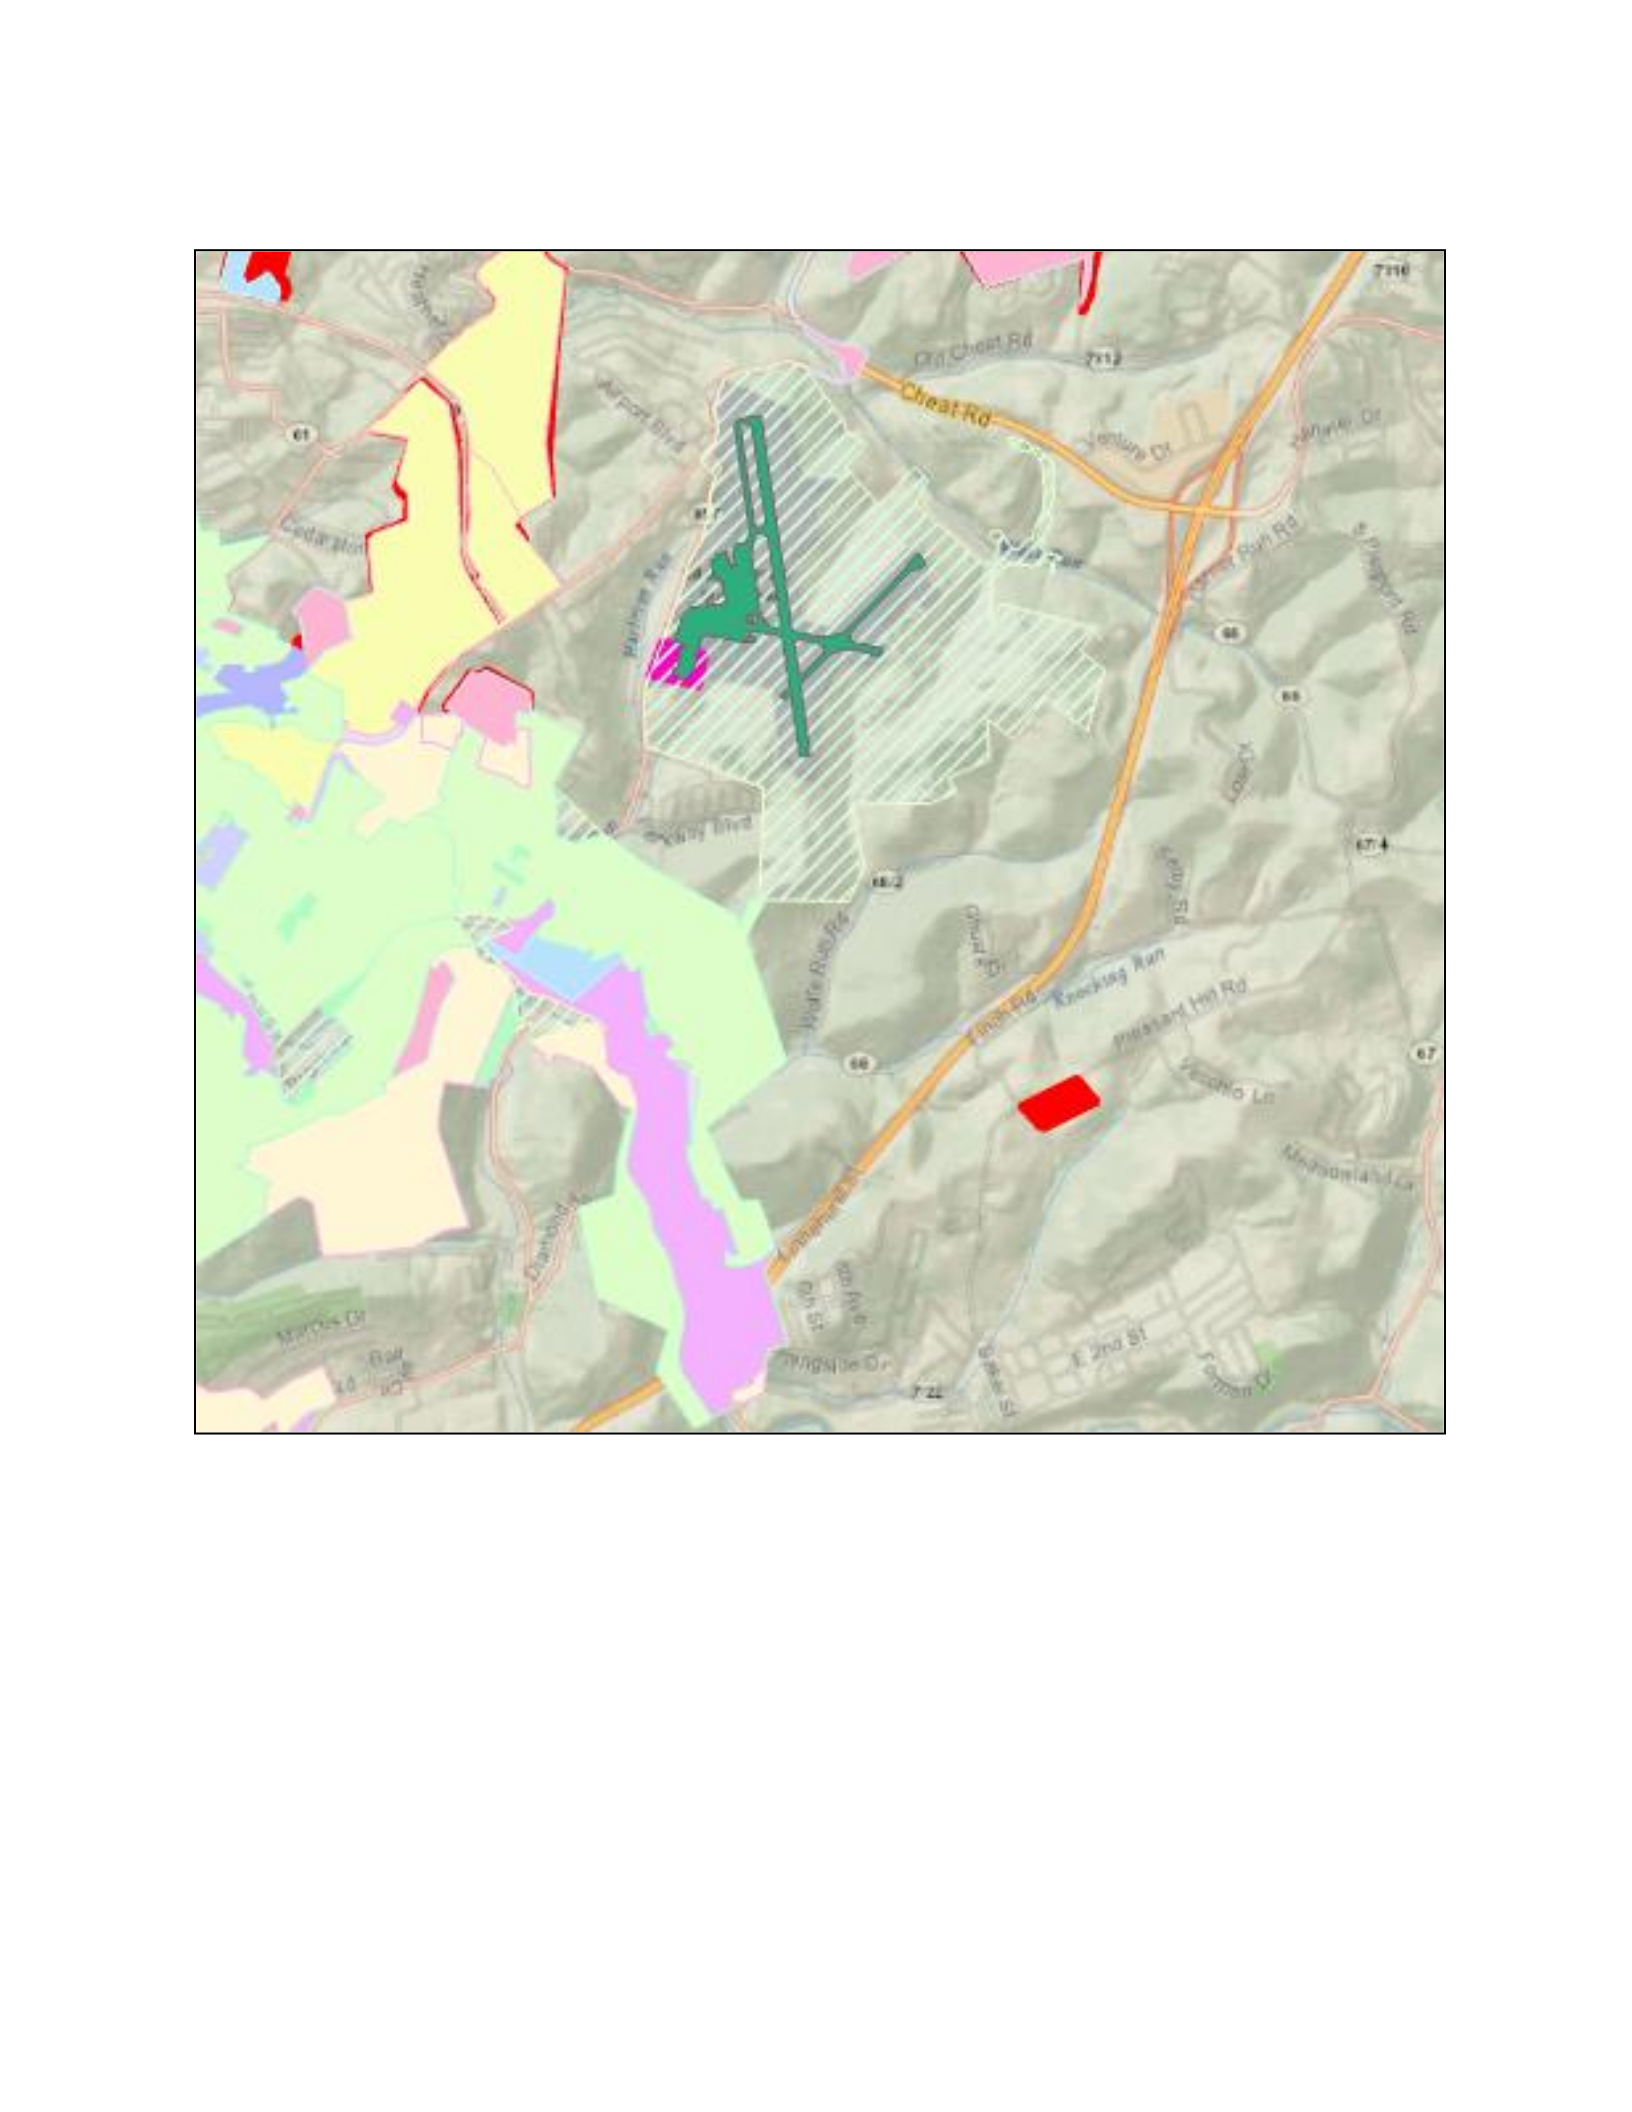
115
Figure 8.10: Morgantown Municipal Airport
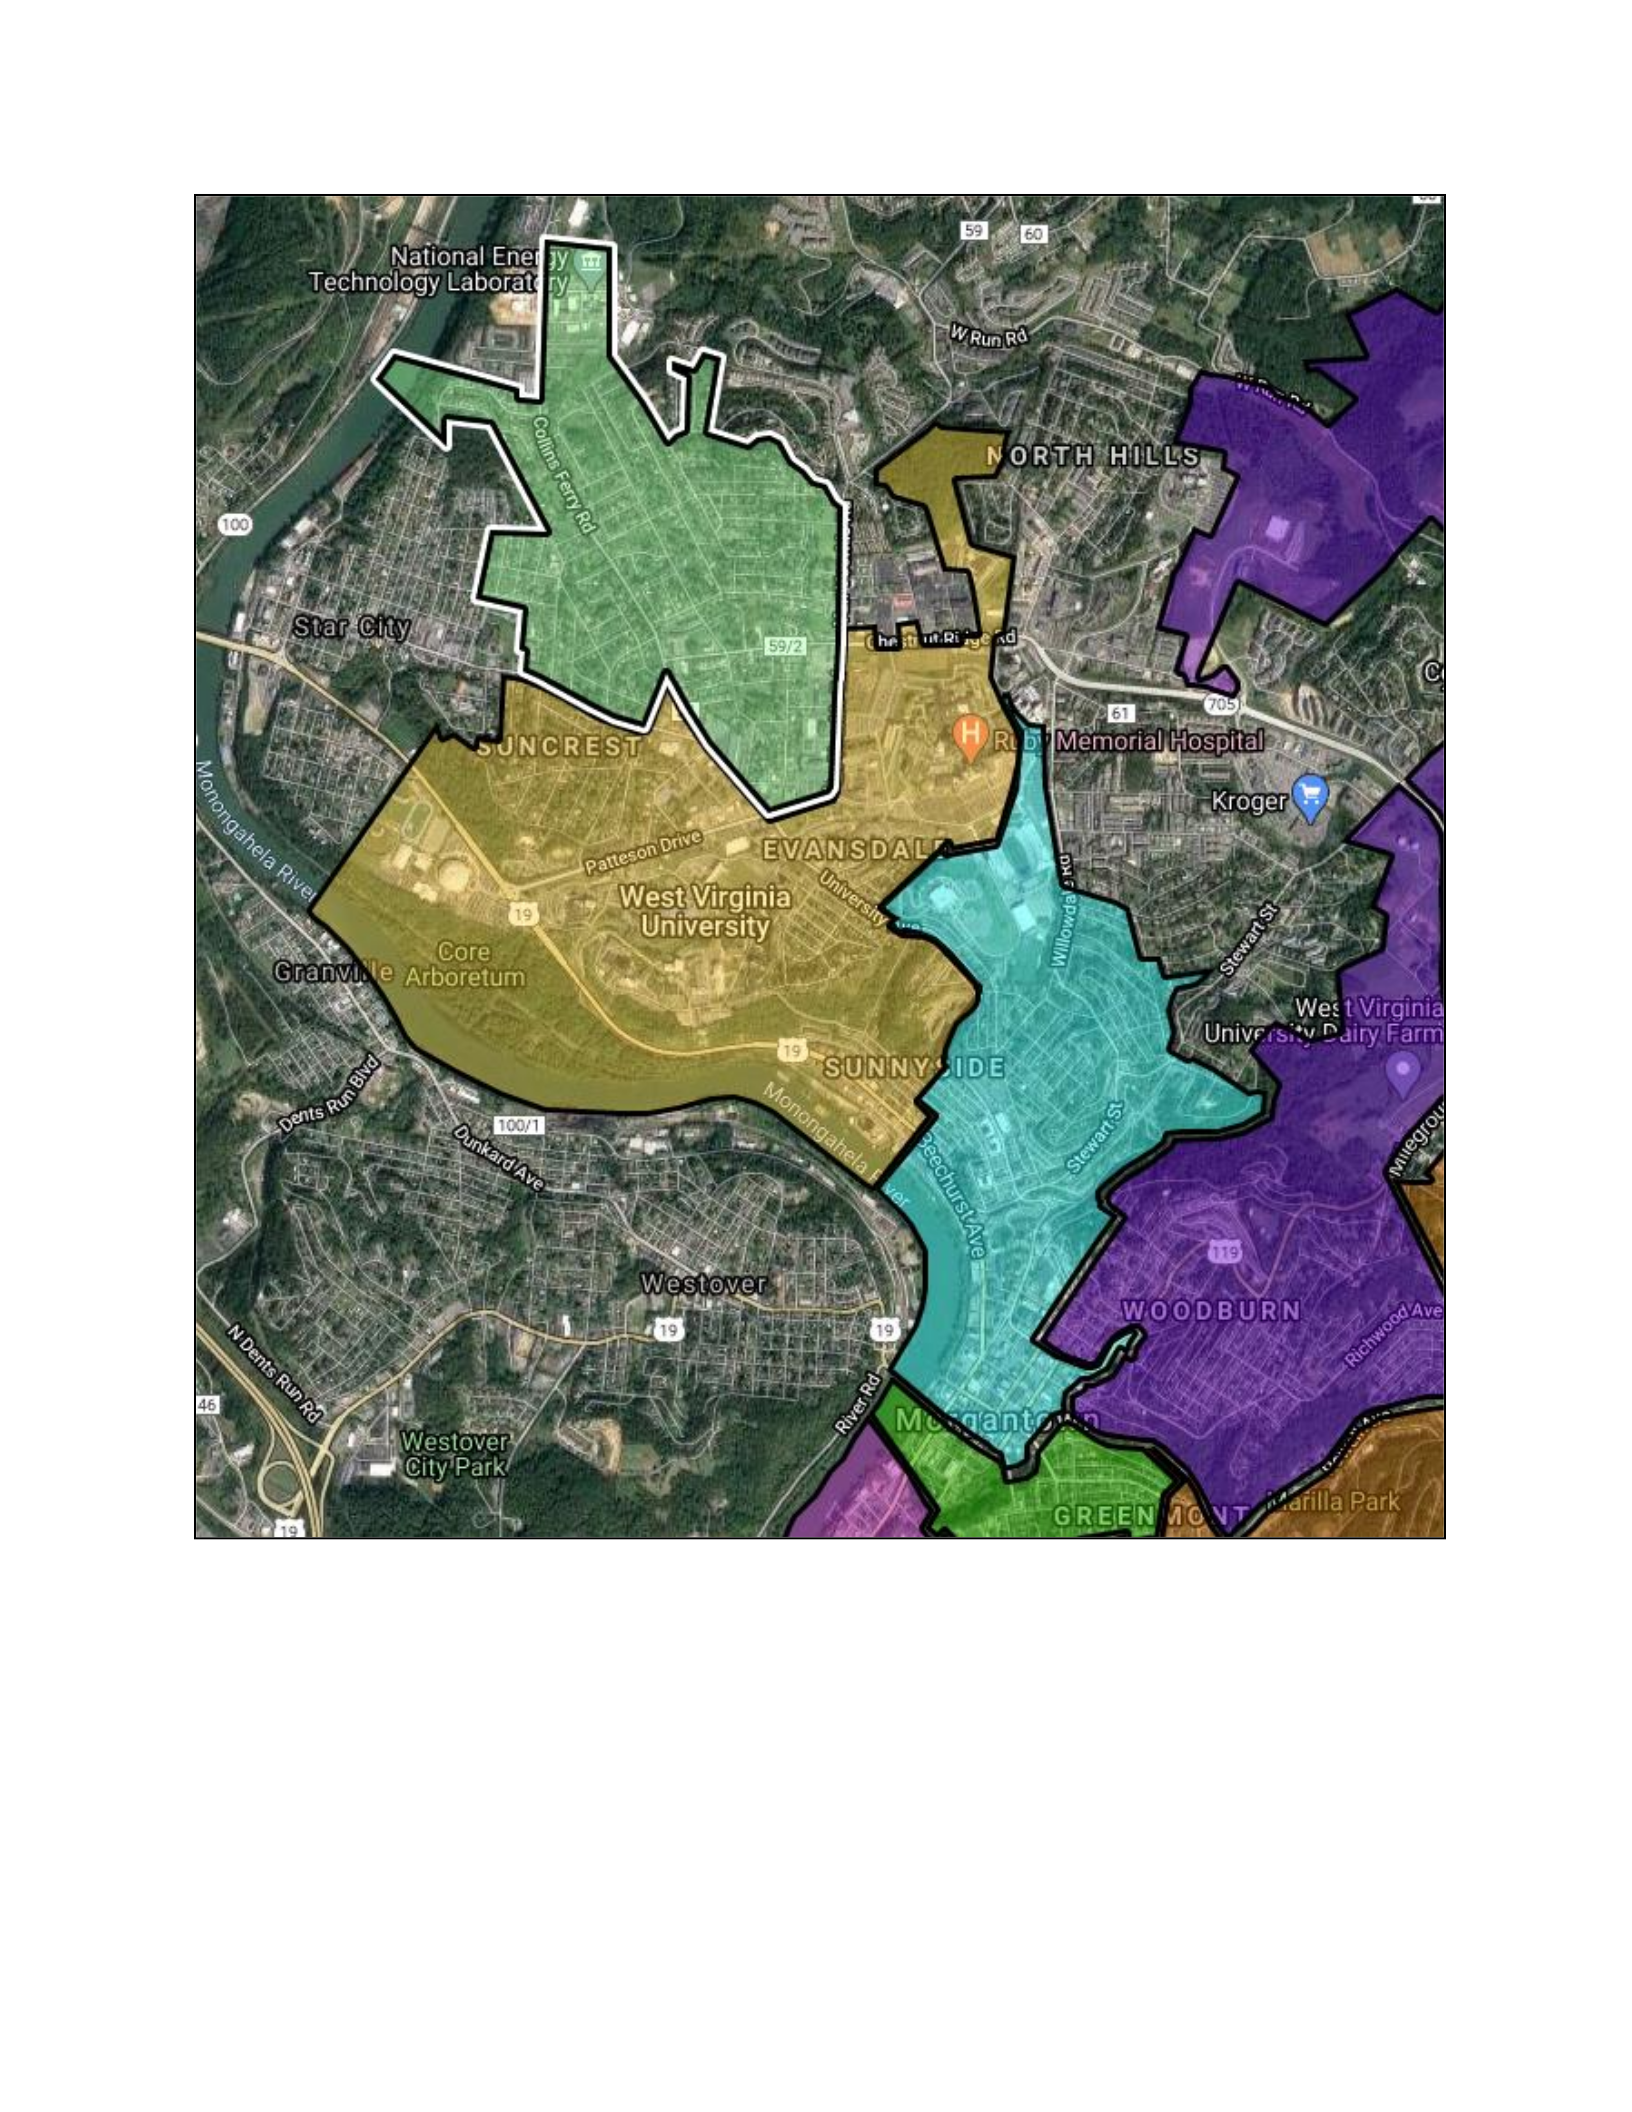
116
Figure 8.11: DOE-NETL
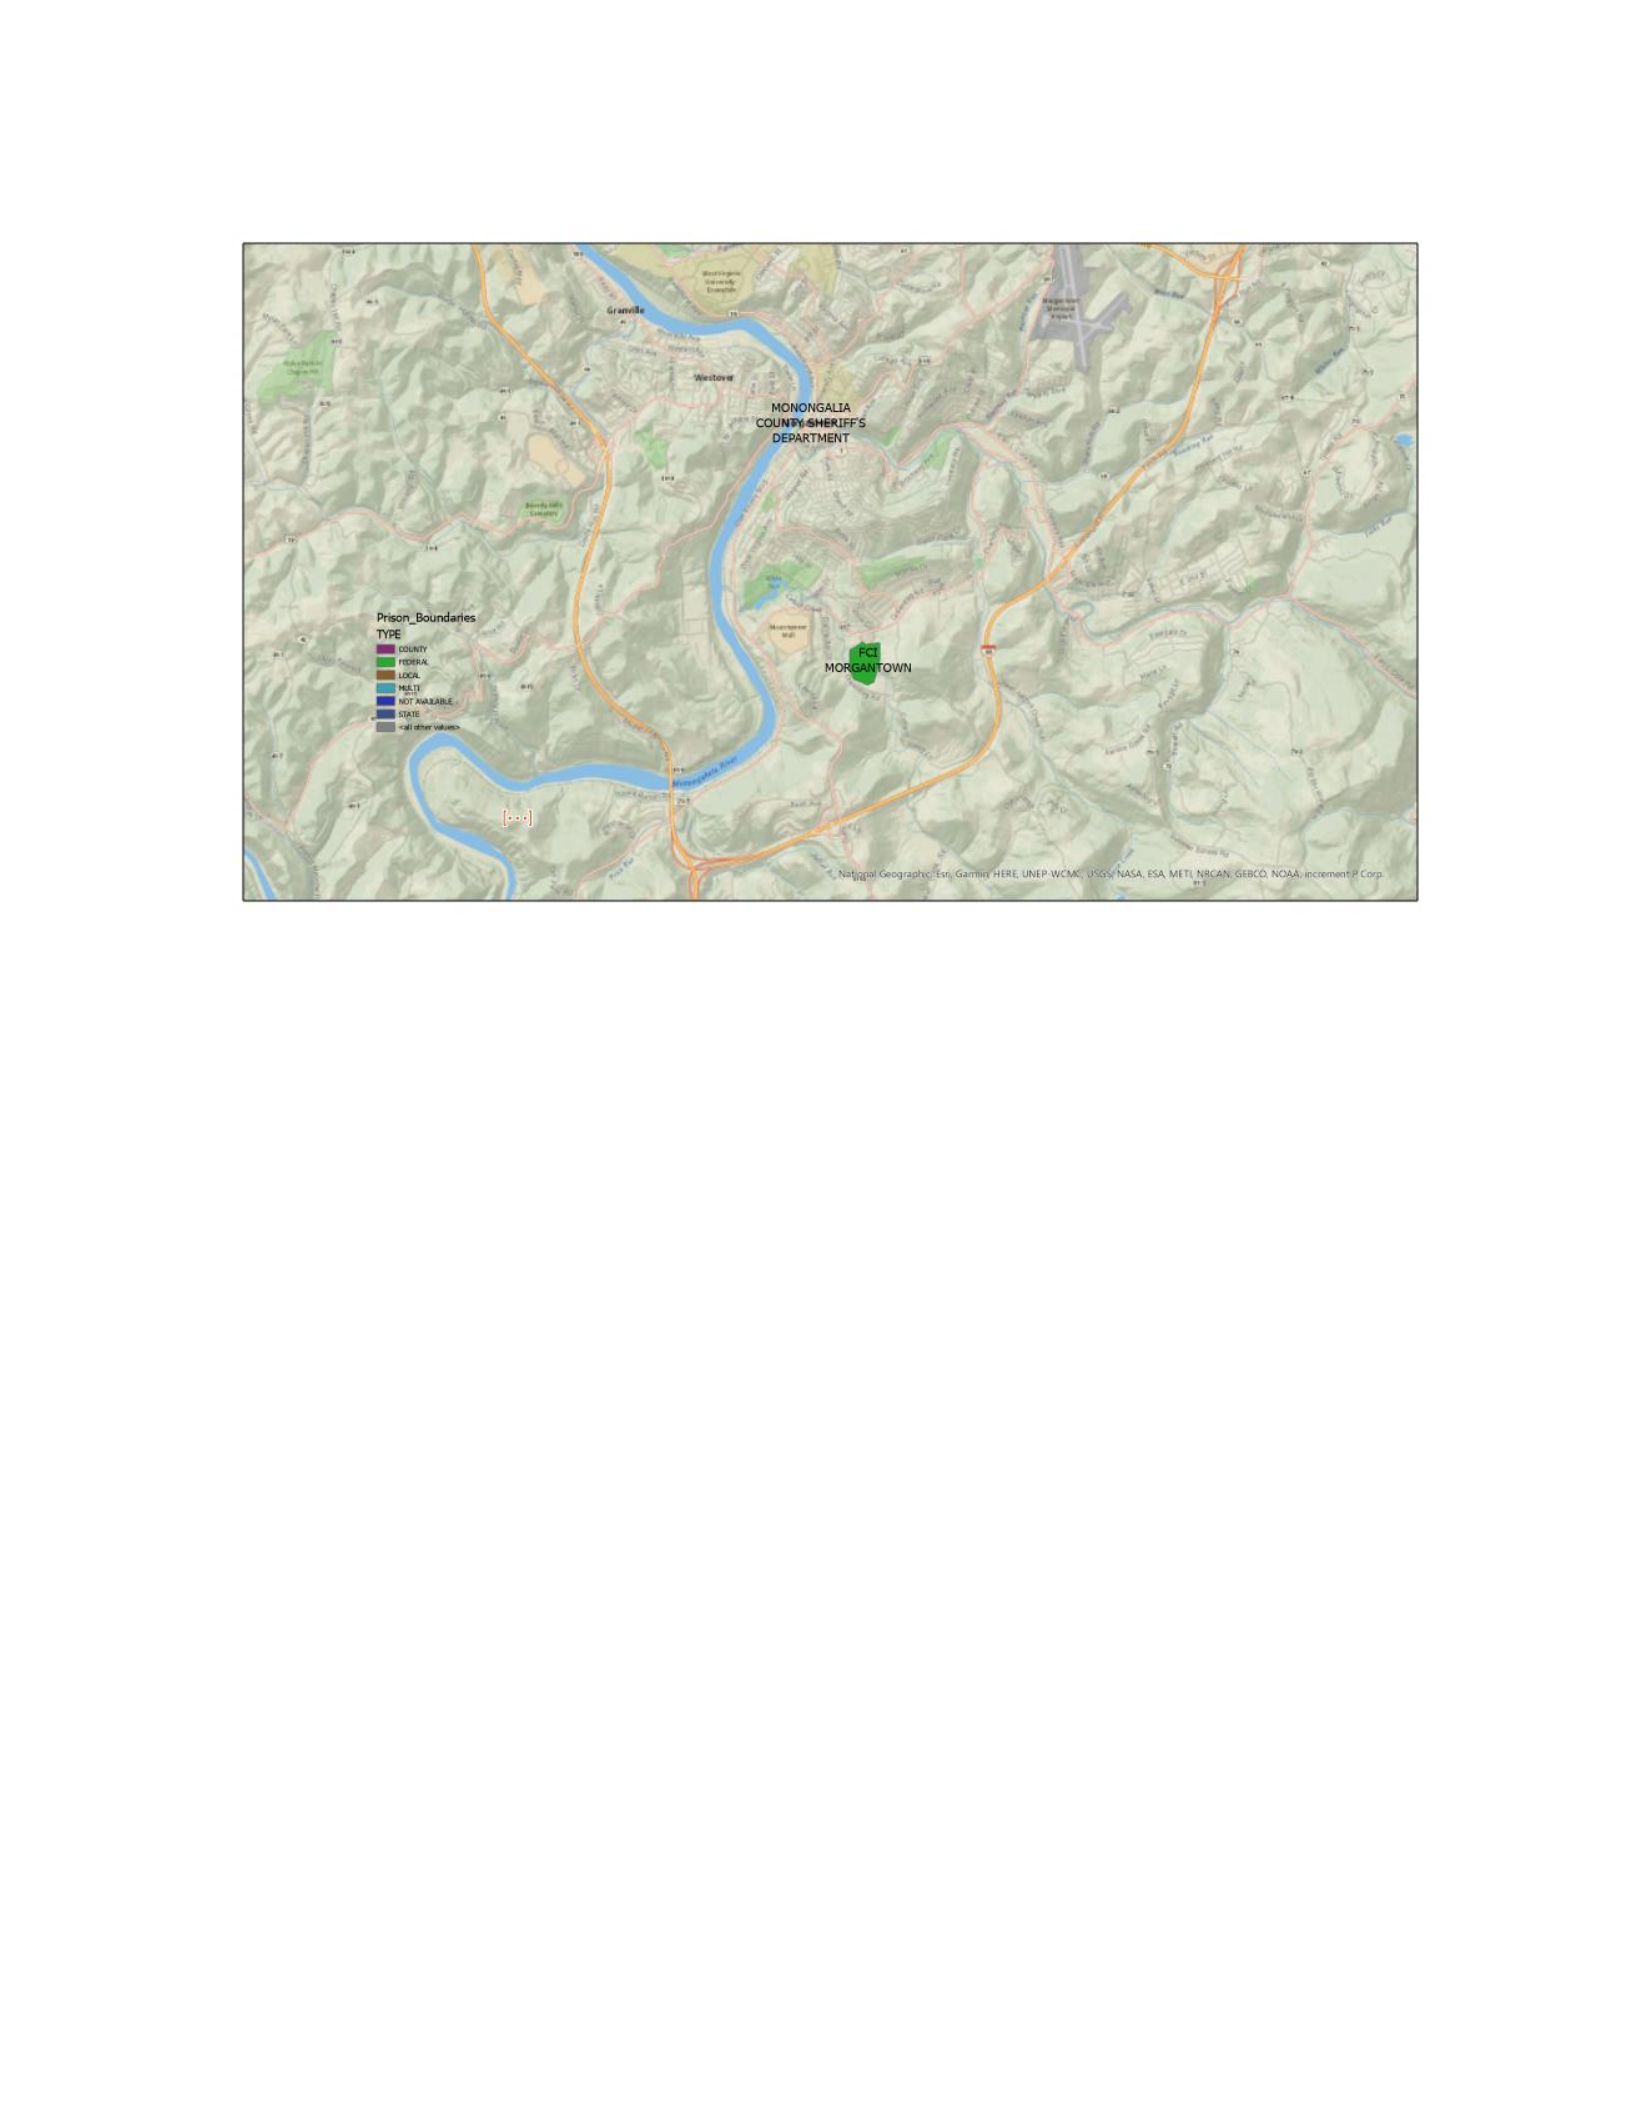
117
Figure 8.12: Federal Prisons
West Virginia University, the state’s only land grant university, is located on several campuses in
Morgantown and in terms of solid waste disposal is almost a city within a city. WVU property
extends across the Greater Morgantown area and thus impinges not only on the regulations of the
city of Morgantown but surrounding jurisdictions as well (Figure 8.13). Indeed, WVU has
outlying properties outside the county and state (Figure 8.14). As a research, teaching, and land
grant university that includes several medical hospitals, WVU must handle hundreds of waste
types, yet its procedures overlap with several surrounding jurisdictional units. The WVU Health
System, for example, has very strict medical waste procedures, many of which are federal
policies and transcend local or state policies and procedures.
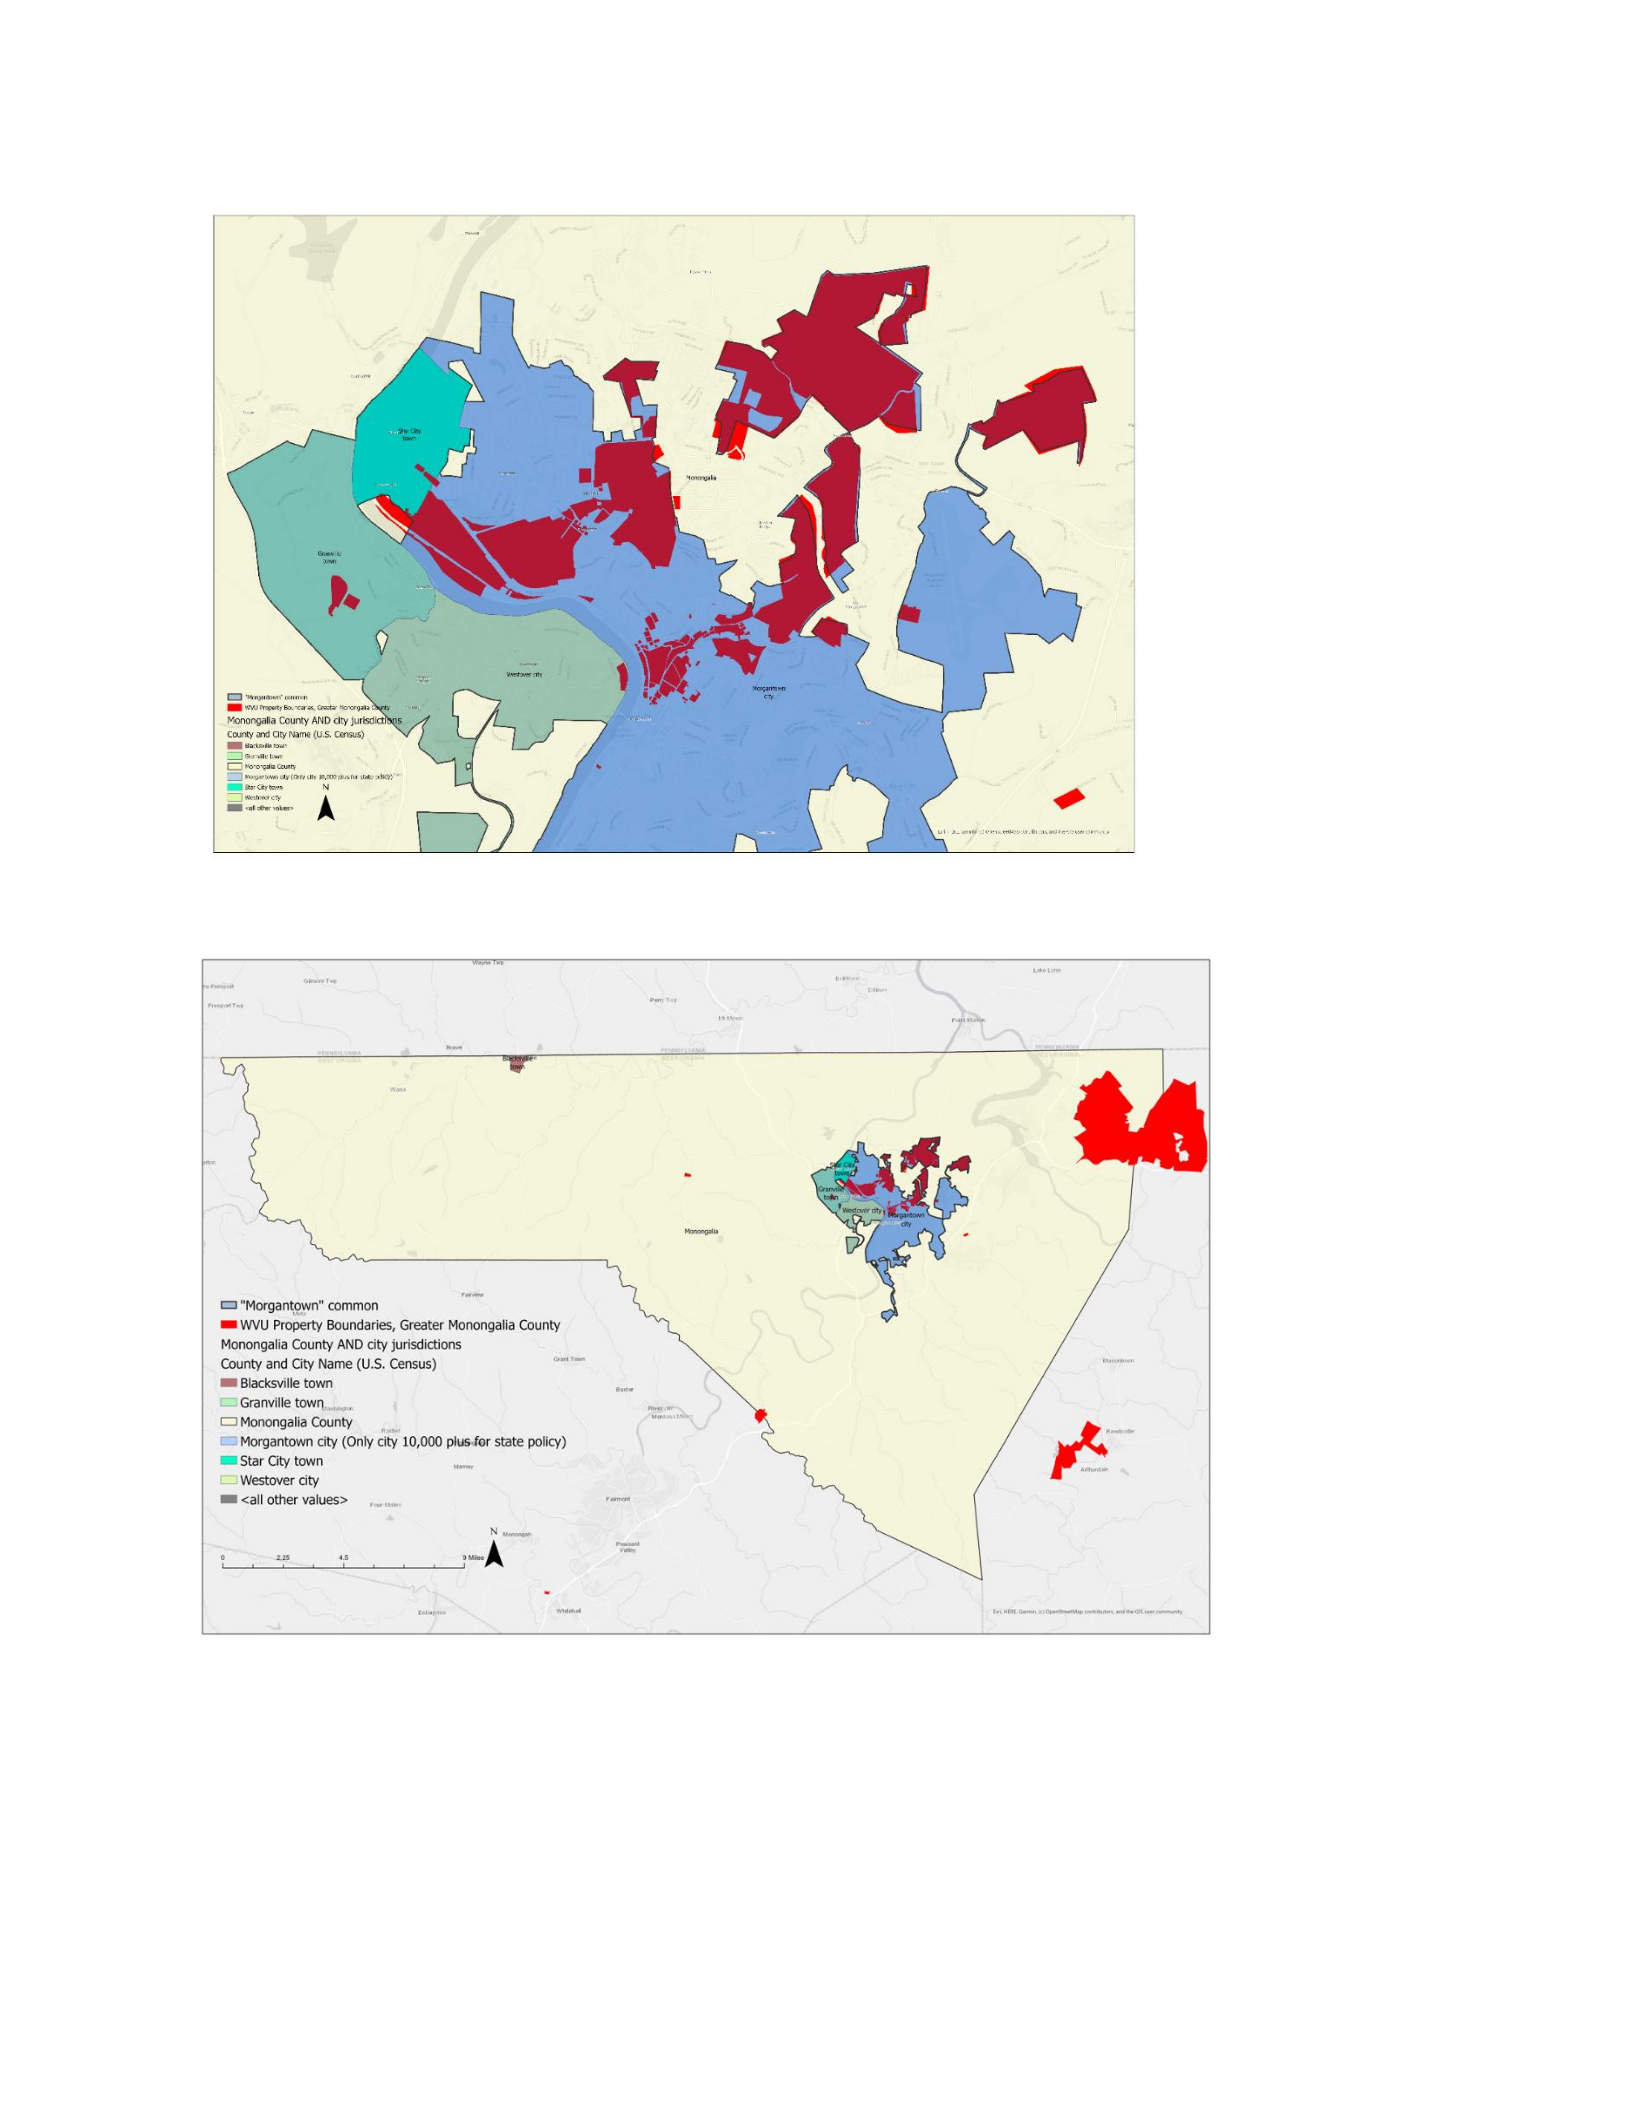
118
Figure 8.13: WVU and surrounding city jurisdictions
Figure 8.14: WVU property within and outside Monongalia County

119
Even waterways can cause policy conflicts in that differing parts of the river have different
jurisdictions. The Army Corp of Engineers (ACE), for example, has jurisdiction over the center
of the Monongahela River and the Morgantown Lock and Dam. The dam has become a
contentious issue of late for the debris released further up-river accumulates at the dam and yet
the ACE are not permitted to open the dam gates to release it downstream. Despite pressure
from townspeople and protests from the elected officials of City of Morgantown, the ACE
cannot, or will not, clean up the sizeable flotilla of debris that has accumulated. What should be
apparent by now is that once the spatial extent of solid waste policy is made explicit, the true
complexity and nature of the numerous conflicting and overlapping policy regulations becomes
abundantly clear.

120
Chapter 9 Operationalizing an interactive policy-shed
platform
To be capable of examining and overcoming the constraints of a seemingly out of control
regulatory behemoth and intricate morass of solid waste policy, and to be able to drill down
through a location to discover all the policies that apply to a particular site, an interactive policy-
shed platform was created. The problems associated with searching through the solid waste code
to identify appropriate regulatory policies was, as outlined above, a herculean task and through
necessity the tendency has been for many to default to legacy known practice, what has always
been done, or to treat solid waste policy as aspatial. These default approaches are only
functional until such times as conflict emerges. Having identified the spatial extents of each
regulatory solid waste policy for Monongalia County, it is possible through GIS to create an
operational policy-shed platform. Drilling down through even a few layers of solid waste policy
at specific locations, as in chapter eight, reveals that the challenges to implementing solid waste
policy and practices are posed not solely by the need to identify the spatial unit to which a policy
might apply, or the actual policy or practice that applies, but how to handle the multiple
overlapping or contradictory policies that apply based on the complicated nature of waste
characterization.
To create a dynamic, interactive system that allows users to interrogate and operationalize solid
waste policy several models were examined before a compelling solution that fused GIS,
dashboard technology, and the interactive brushing and linking interrogation of the geodatabase.
The ability to provide brushing and linking capability is a recent technical advance. This linking
of solid waste geography and policy attribution enabled the generation of interactive maps that
linked the thick textual narrative of policy to specific locations. This online GIS-based
interactive mapping and policy interrogation dashboard is hereafter referred to as the policy-shed
dashboard.
The architecture of the policy-shed platform and the integration of the databases to the spatial
polygons was achieved using an innovative combination of ArcGIS Pro and Application
Programming Interfaces (API). APIs are a relatively recent advance in spatial technologies and
are intermediary software that allow applications to communicate and interact with each other. It

121
was Google’s release of the Google Map API in 2005 that marked the beginning of many
software companies providing the hooks and capability for multiple software platforms to be
linked rather than be treated as in a silo. Web mapping APIs enable disparate programs and
databases to be linked and combined to create hybrid systems – as here with the policy-shed
platform. Libraries of programs, such as GOJS and JavaScript, are available that use HTML and
JavaScript to enable systems to be linked in new and powerful ways
(https://gojs.net/latest/samples/index.html). JavaScript was critical to creating the policy-shed
system and provided the means to brush and link, and for diagrams, and even photographs of
handwritten ‘gentlemen’s’ agreements to be combined with ArcGIS Pro. Multiple APIs were
used in this project.
Populating the geodatabase with applicable spatial units and policy attributes for particular waste
characteristics has been discussed previously. One lesson learned from several experimentations
with the system was the need to identify the spatial components early in the process rather than
later, and this finding required considerable knowledge of the applicable solid waste policies up
front. Identifying the available sources for creating the spatial units and digitizing analog maps
before ingestion into the GIS was resource intensive. The resources required to develop a waste
type classification and populate the attribute table was even more resource intensive. While the
initial waste matrix developed for the dissertation proposal was extensive, it ultimately fell well
short of what was required to capture the complexity of regulatory policy. The preferred
approach was in the end to make the spatial geography dominant and to then assign the policy
attributions to that geography. Based on the waste classification matrix a join was made to the
appropriate spatial unit or, oftentimes, to multiple overlapping spatial units. Establishing a
hierarchy of spatial units was unsuccessful. Because of the close connection between the types
of waste generated by businesses or residences, the types of waste produced, and the availability
of city zoning codes, the related NAICS economic zones were used as the basic building blocks
to join spatial units to policy attributes based on waste types. Tax parcel data for West Virginia,
available through the West Virginia GIS Clearinghouse, is rare to find for most states but was
invaluable in this study. Based on these tax parcels, waste type polygons were merged to create
the policy-shed. Some problems arose in the process of generating these policy-sheds that
resulted in awkward looking sheds within the selected boundary hulls and which impacted the
ability to pan and zoom across multiple policy scales and sheds. Overlapping policies and policy

122
gaps further complicated the outcome. GIS struggles to handle fuzzy, incomplete, and conflicting
data and this may be one reason why such as an attempt as this policy-shed platform has not been
attempted previously. For areas of overlapping, conflicting, or policies it was necessary to
overcome the challenge of creating multiple polygon extents by a prismic interactive
interrogation through dashboards, brushing and linking, APIs, and other extensions.
The policy-shed prototype can be found at a permanent location forthcoming. In order to view
these maps, it is necessary that Google Chrome or other extensions are up-to-date. The
interrogative nature of the interactive dashboard allows either policies to be displayed for areas
or for locations to be queried to disclose applicable policies. In the policy attribute table short,
annotated versions of the applicable solid waste policies were provided and by using point and
click and brushing maps of the associated policies and policy text itself are displayed in the
window (Figures 9.1 and 9.2). In this way, the spatial extent of specific regulatory policies can
also be displayed. Thus, query by location or locations and by specific policy or policies are
possible. Performing a point-and-click search on a bank located on Chestnut Street in
Morgantown for example, revealed that the bank is subject to federal law regarding waste
disposal and recycling.
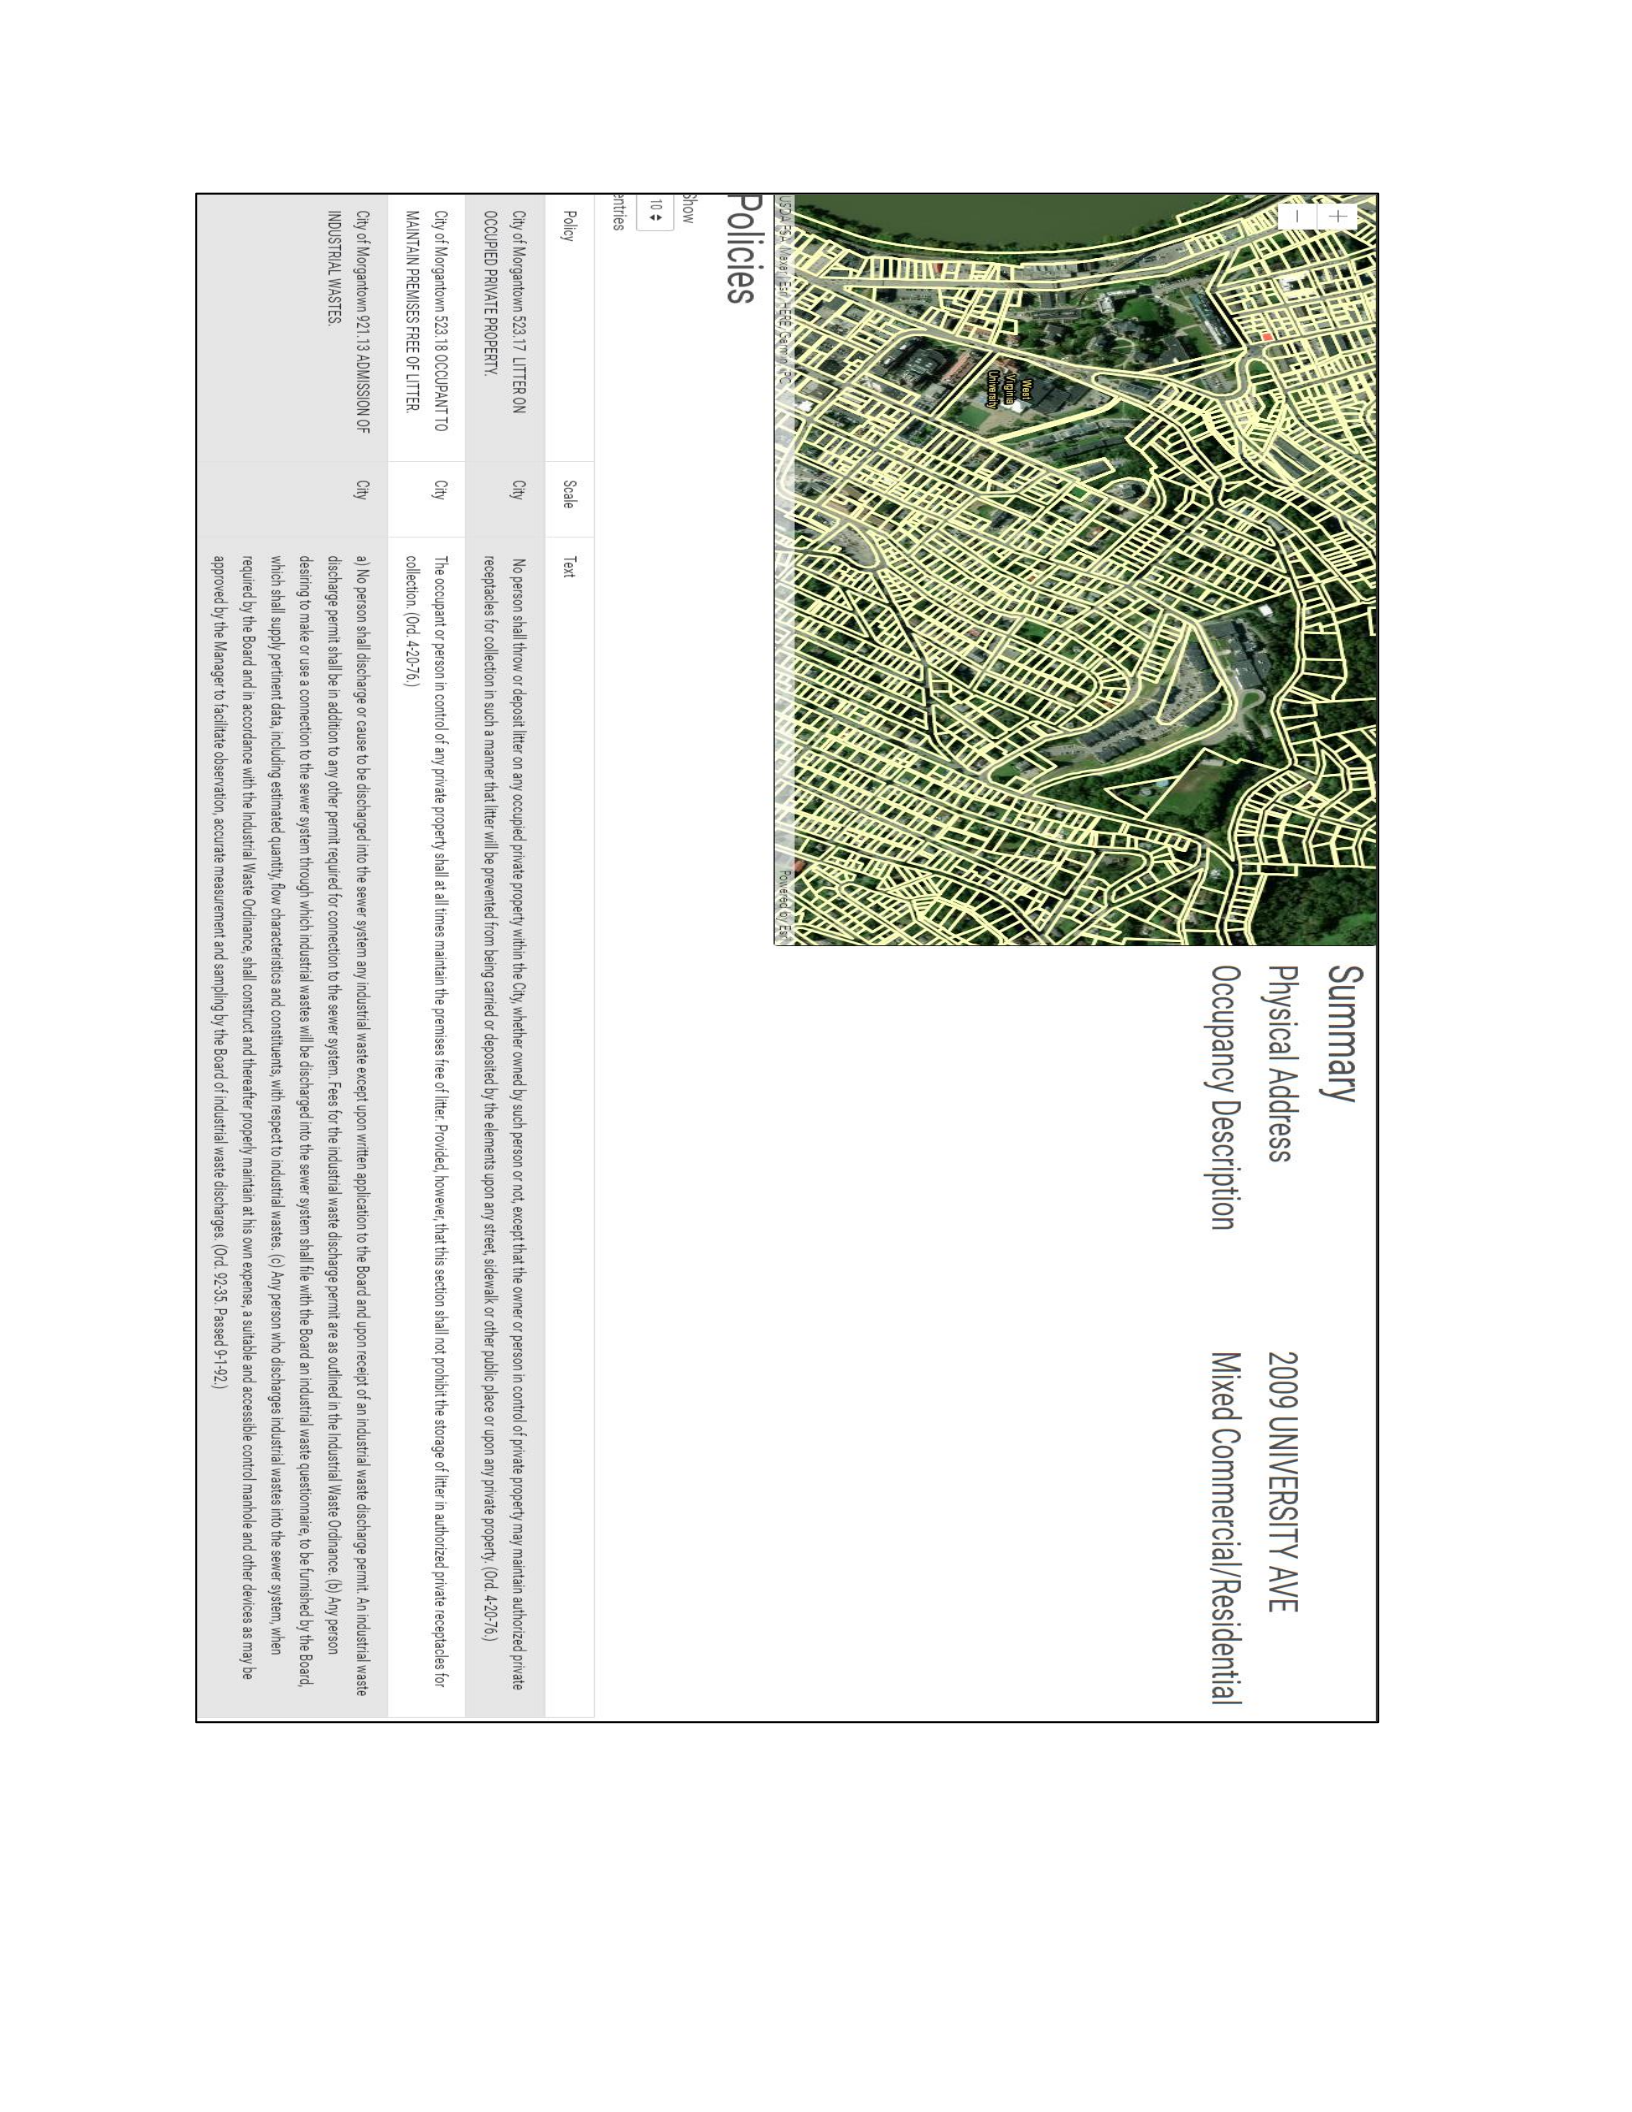
123
Figure 9.1: Policyshed image with related policies and land-use
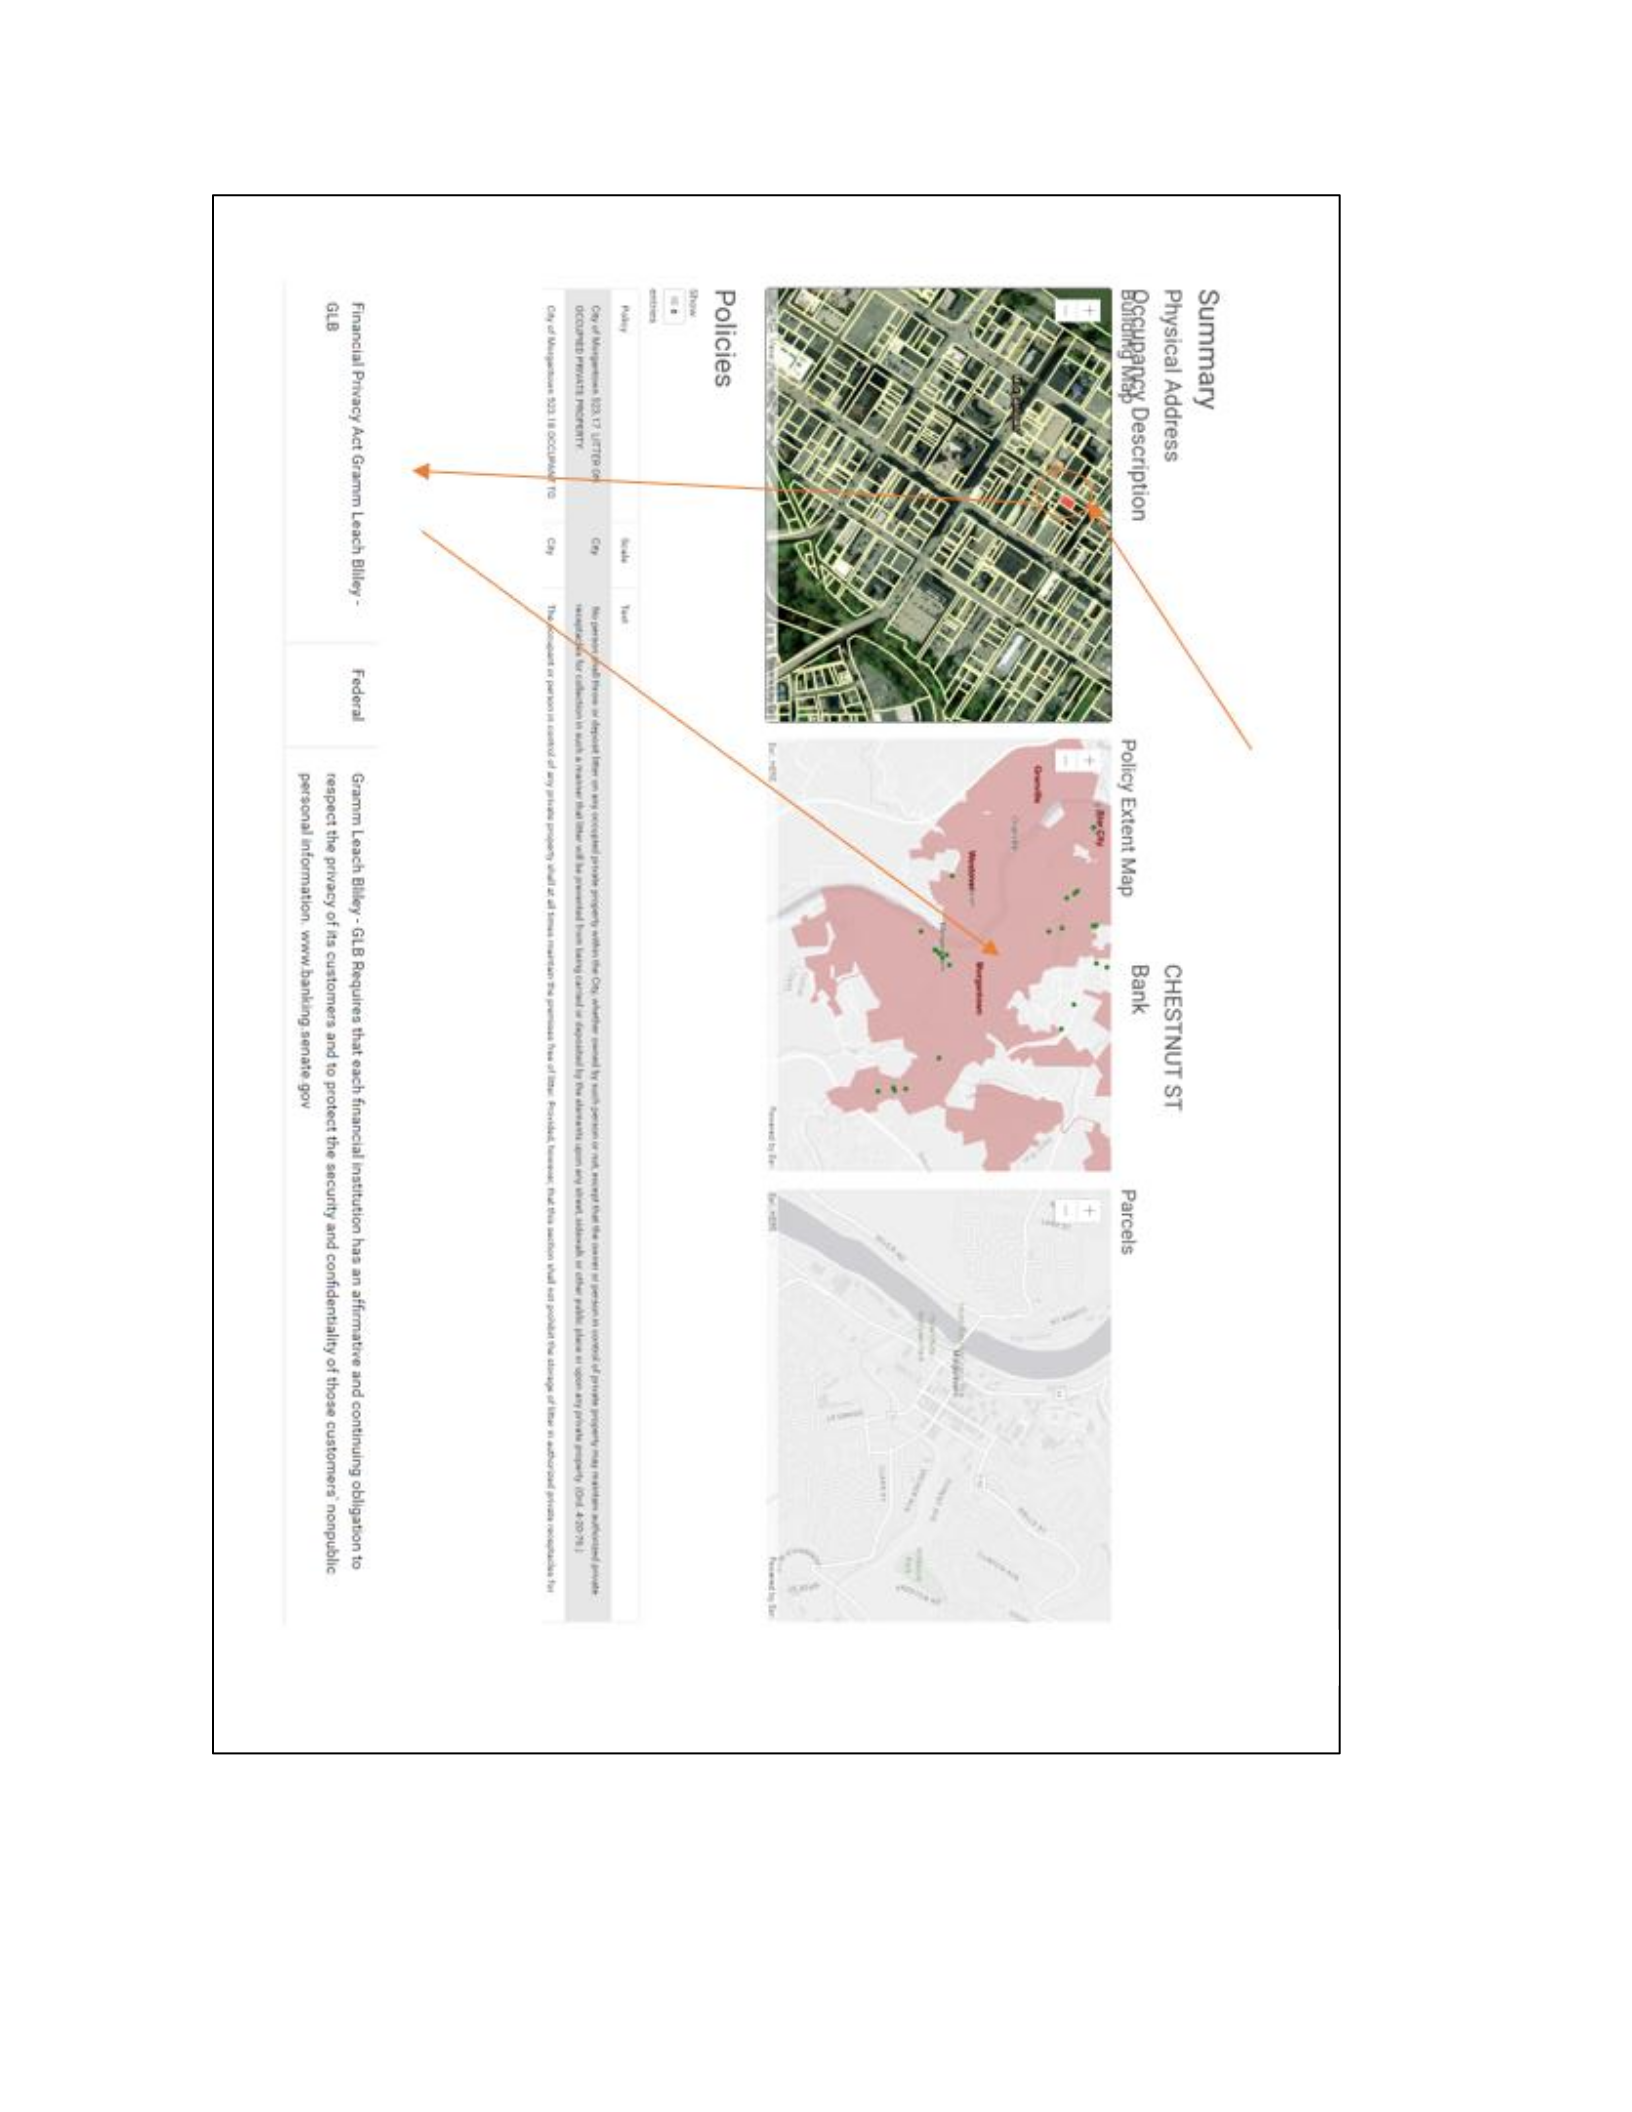
124
Figure 9.2: Brushing and linking between policies and location

125
Notably pursuing similar interrogations for the WVU Health Sciences Center and the WVU
Ruby Memorial Hospital indicates similar solid waste disposal policies as would be expected for
a medical school and a hospital, though there are differences in their solid waste disposal
policies. The teaching hospital, for example, has additional animal lab waste disposal
requirements that the hospital does not. Interestingly, the sliver of vacant residential property
between the medical complexes has differing solid waste policies and in turn. What might be
surprising is that the WVU medical complexes have solid waste policies that differ from those of
the nearby community Monongalia General Hospital (Figures 9.2, 9.3, 9.4).
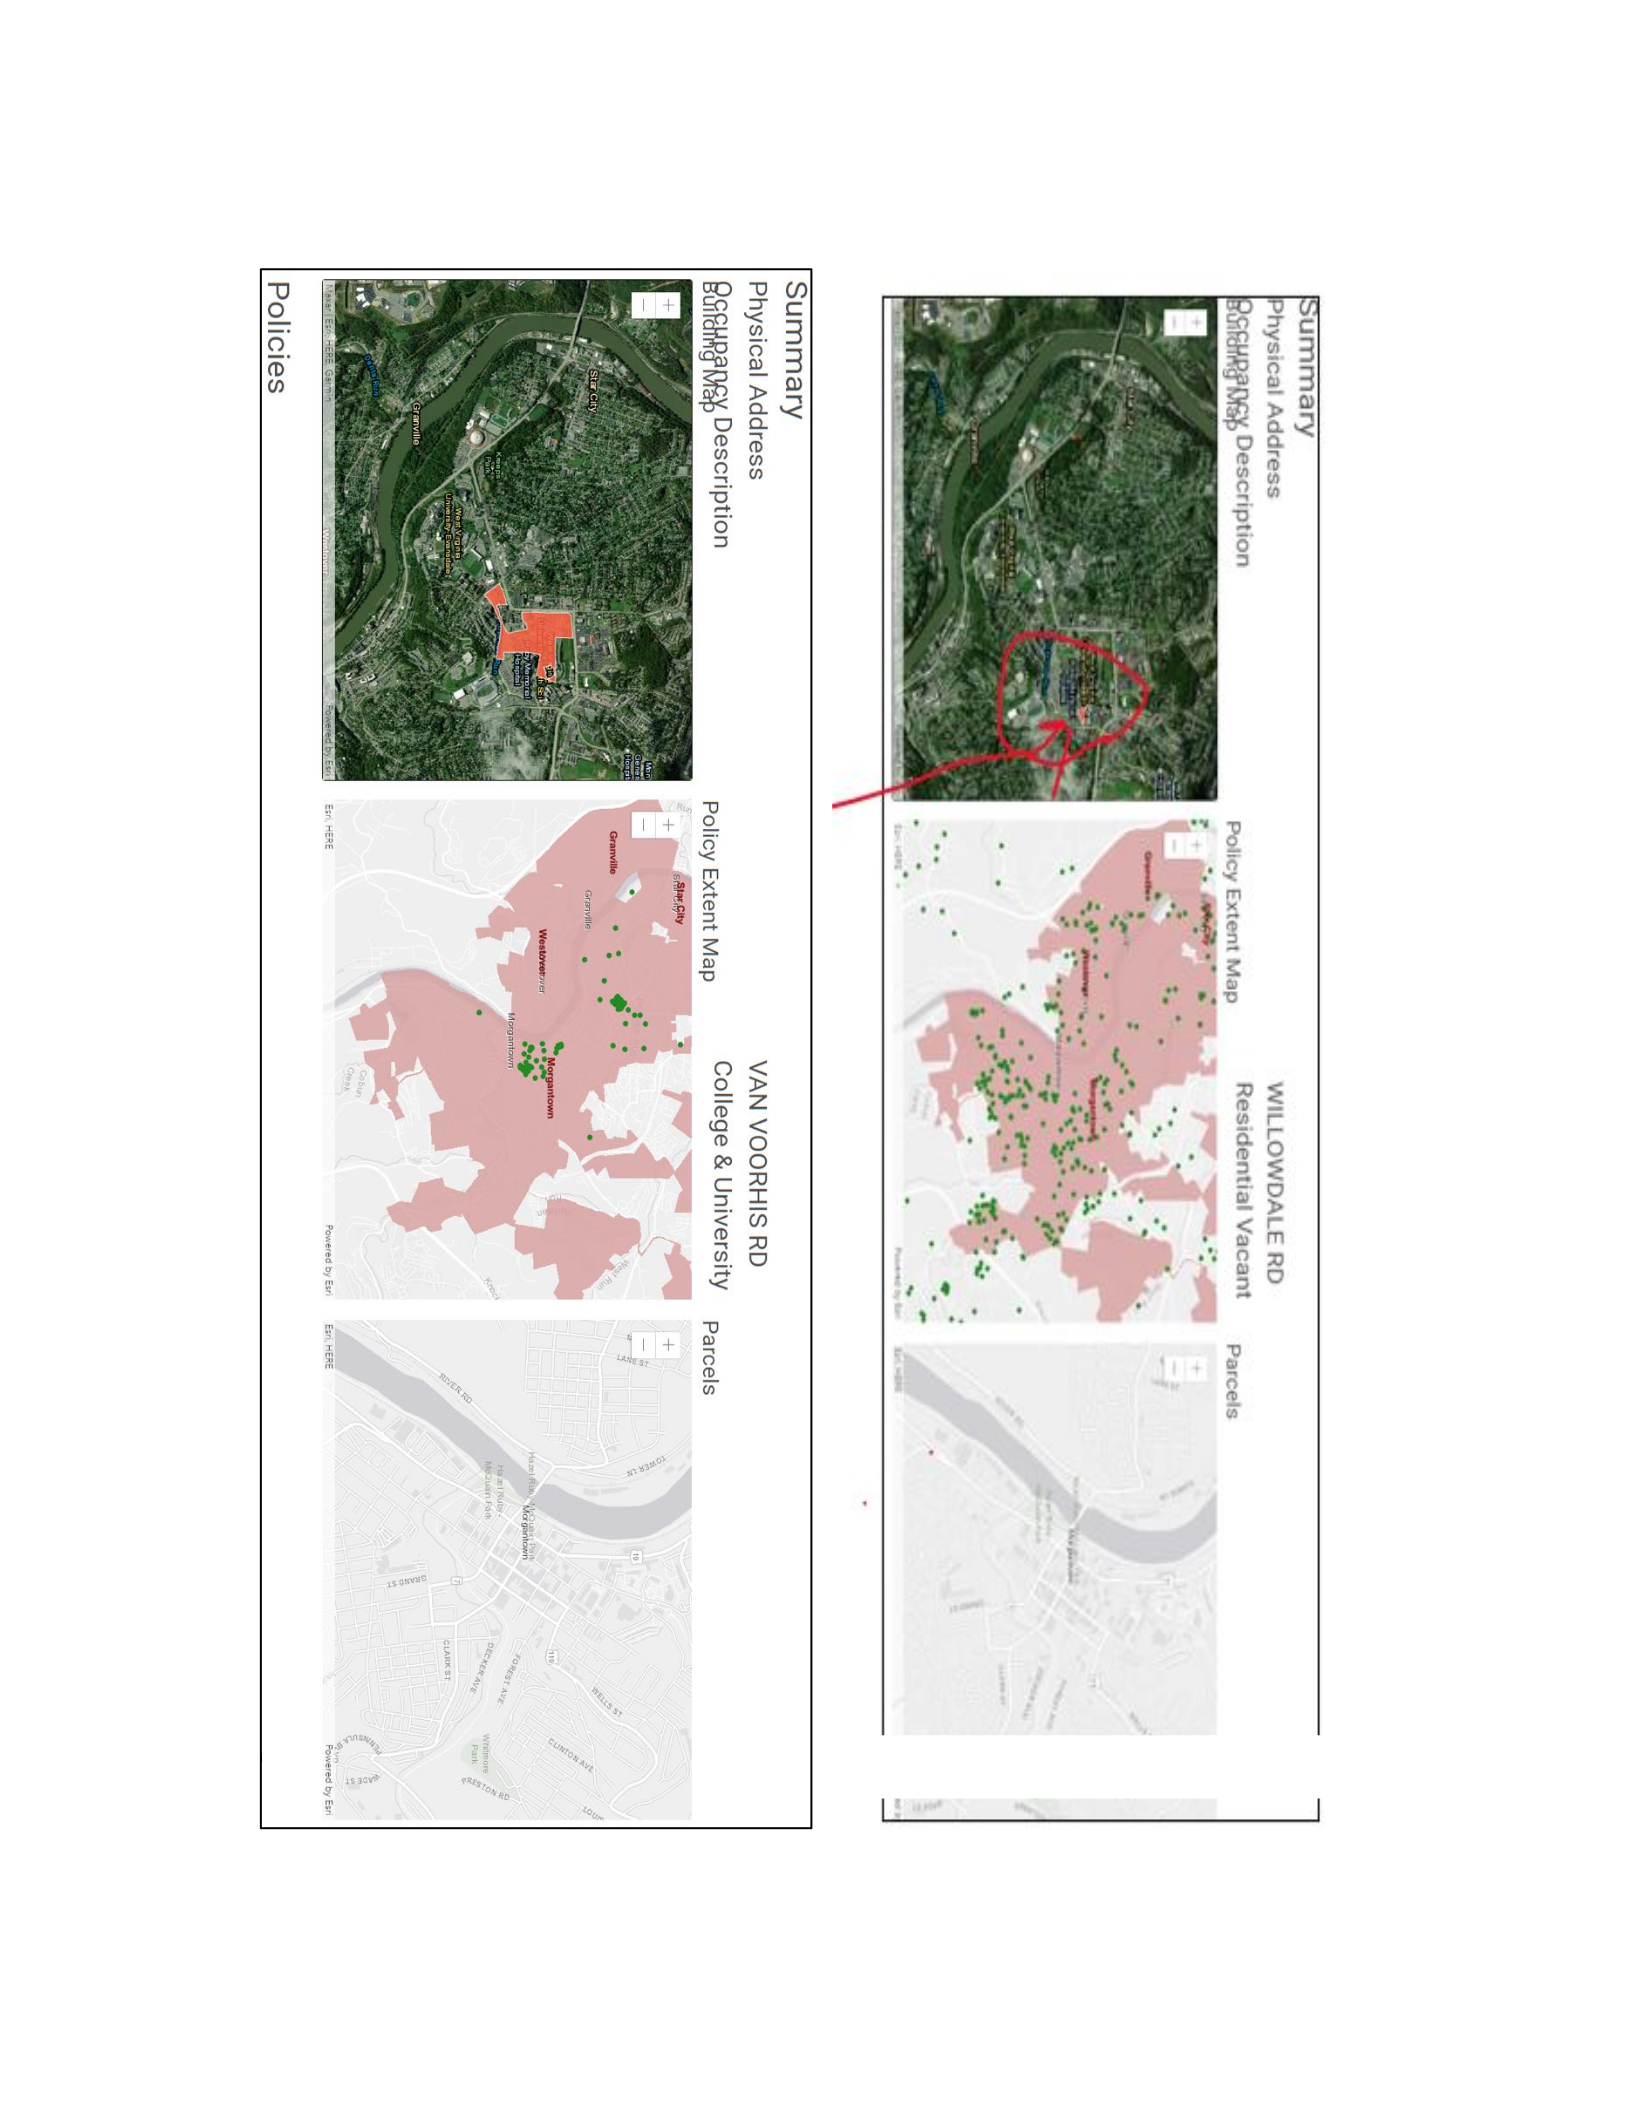
126
Figure 9.3: WVU Health Sci is College & University
Figure 9.4: Sliver of residential vacant lot up against
WV University- Health Sci and Ruby Memorial Hospital
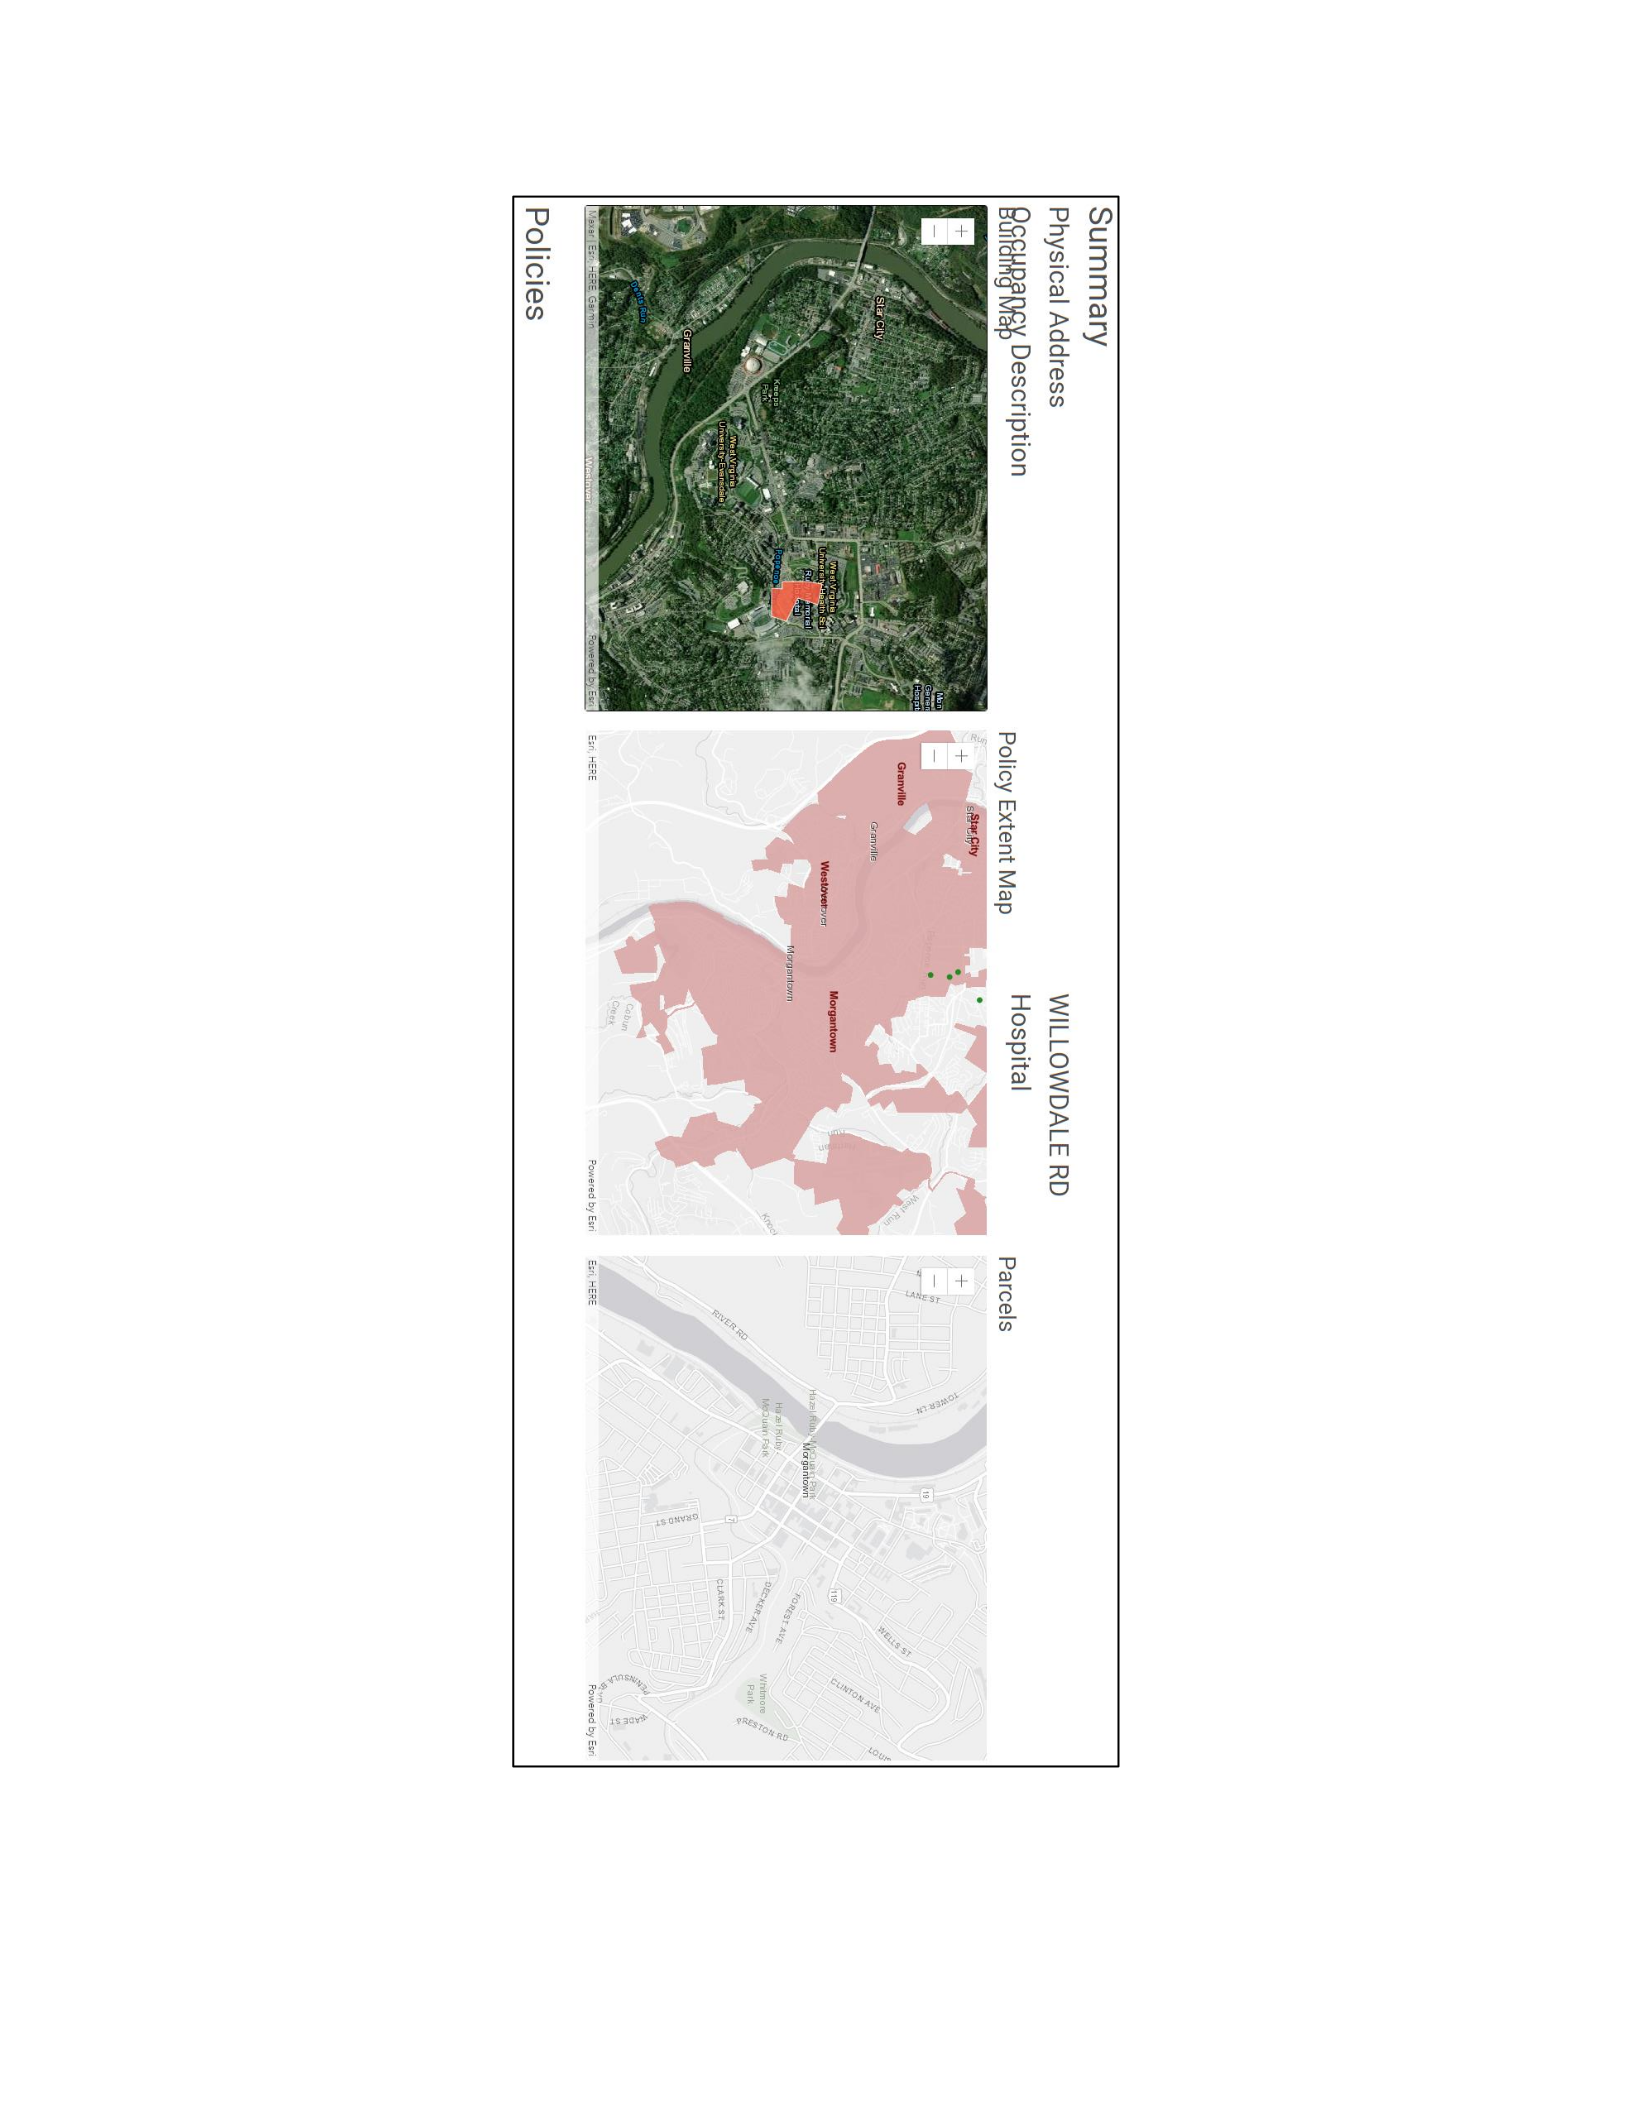
127
Figure 9.5: Ruby Memorial Hospital

128
Data analysis tools such as box and whisker plots and graphs can be dynamically linked to the
displays and policy attribute table and can be used to analyze an entire policy-shed or for
selected policies. Through this means data exploration beyond mapping and policy recall can be
utilized and policy structure and outliers can be identified and examined. Because the user can
directly manipulate multiple perspectives of the data as dynamic graphics, the user experience
and control over the platform is a major advance over what was possible before. The utility of
brushing and linking is often overlooked due to its simplicity yet the ability to dynamically link
windows and highlight and visualize spatial data is powerful and allows users to access related
data and mapping. Most policy problems and analyses are not linear, and thus visualization is a
valuable part of the platform toolbox.
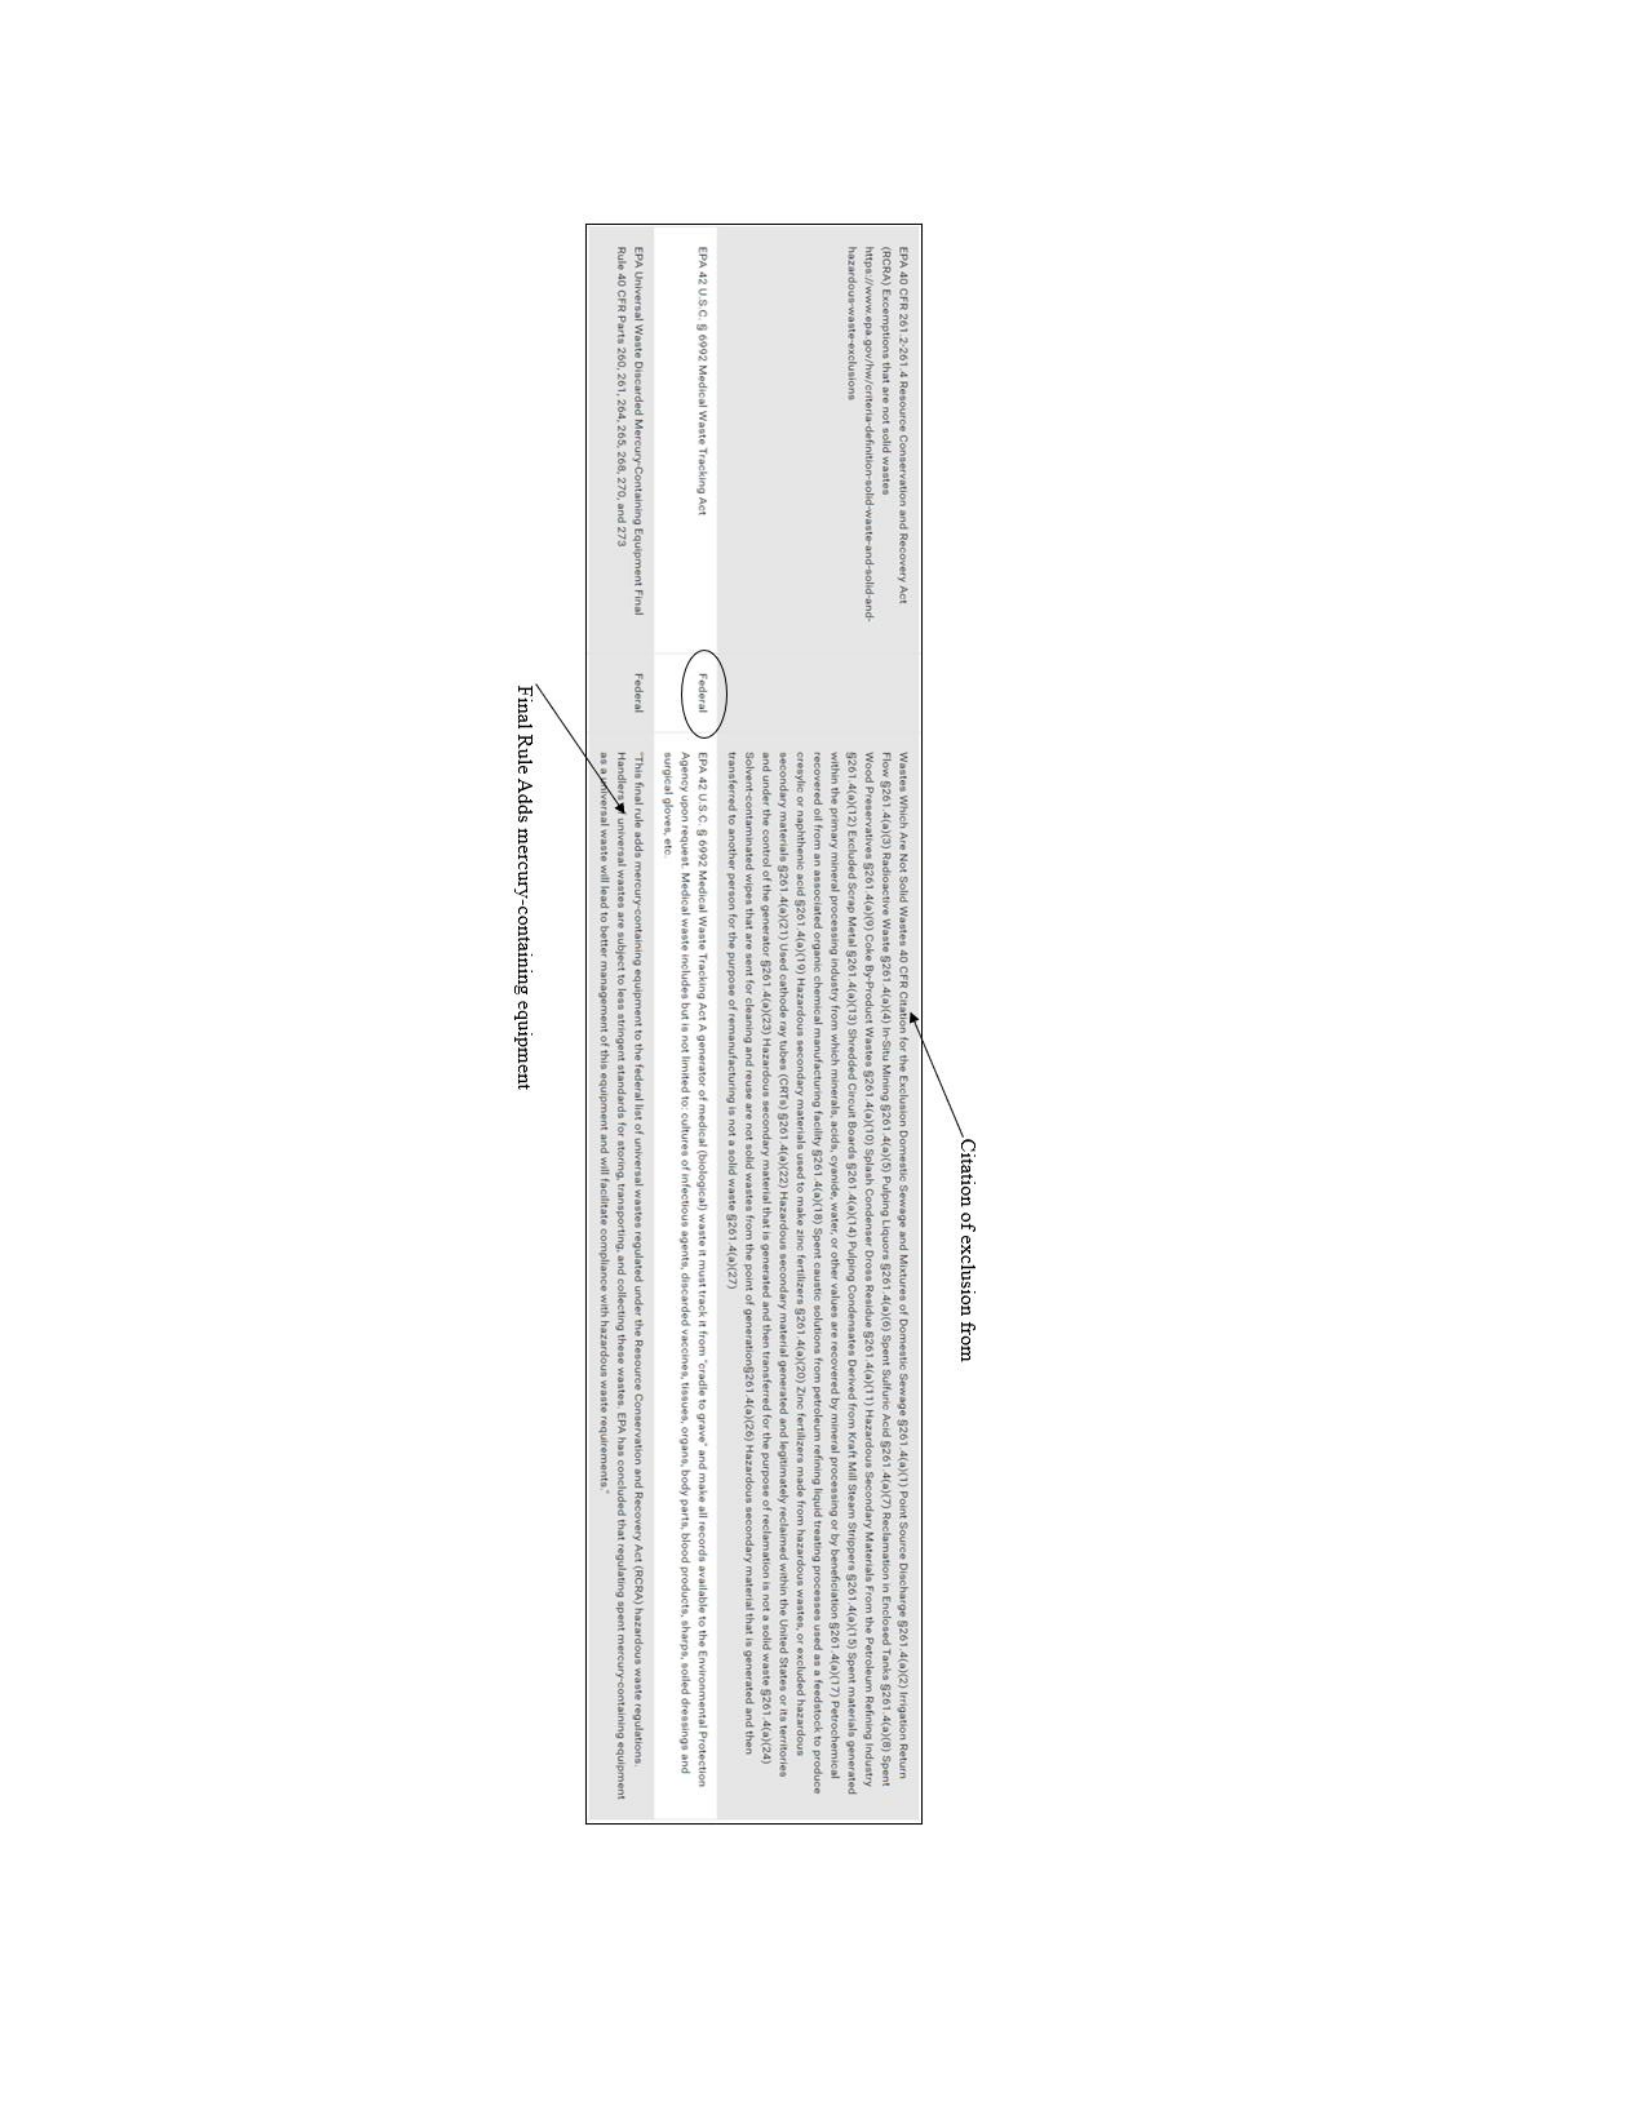
129
Figure 9.6 User Interface: Pan and Zoom shows jump Scale

130
Chapter 10 Discussion and conclusion
This study has drawn out the distinction between ‘Big P’ policy and ‘small p’ policy and it has
contextualized the antecedence of policy science studies and the seeming aspatial nature of the
policy record. Public policy, and especially small p policy, necessarily involves a spatial
component and one would assume that the discipline of geography would have been heavily
engaged in the policy process from the onset. This study has shown that this is not the case and
that the geographical perspective in public policy has been shown to be deficient if not entirely
absent. While GIS is recognized for its growing contribution and real potential in public policy
initiatives and analysis, geography nonetheless struggles to be a full participant in public policy
deliberations and is somewhat peripheralized from the field. Geography as a discipline
comprises not just methods such as GIS but spatial and placial concepts and theories unique to
the discipline and the study of terrestrial space. It is argued here that using geographical
techniques devoid of geographical concepts that underpin them is problematic. Recent calls by
the American Association for Geographers (AAG) for geographers to become involved with the
upcoming and inherently geographic 2021 redistricting process in the United States is indicative
of this peripheralization for “geographers are sorely lacking from the process at every level”
(AAG, 2021).
Despite the lack of an extensive involvement of geography in public policy, there are many very
real reasons why space is problematic in small p policy. Extracting the spatial implications and
outcomes of the laws, rules, operating procedures, and regulations embedded in legal record is
extremely challenging because of the dense textual and descriptive form in which small p policy
is recorded. Even identifying the spatial components and structures contained within such
documents is problematic. In the case study of solid waste disposal in Monongalia County, West
Virginia, local knowledge of the geographical locations mentioned in the recorded regulatory
texts was critical for tying the policy rulings to actual locations on the ground. The lack of maps
as a foundation for recording the spatial outcomes of small p policy, or other graphical spatial
representation as to the areas to which these policies apply, more than compounds the difficulty
of the situation. Furthermore, the issue of scale and accuracy, as the trash case study undertaken
here makes apparent, cannot be ignored. The increasing recognition and availability of GIS may
influence the future ability to express policy spatially in the form of maps but there remains such

131
a legacy of unmapped policy that this issue may never be comprehensively handled. As this
study has amply demonstrated, the resources required to even extract the spatial elements of
solid waste policy for just one county is considerable and this fact alone may be a fundamental
reason why no such spatial representation or spatial system exists to date. Harmonizing policy
rulings with their spatial representation is demonstrably challenging.
While the case for spatially representing policy code may seem obvious, the experience of
implementing such a course of action through the development of policysheds was enlightening.
For many of the reasons discussed above extracting the spatial information associated with the
regulation of the solid waste system for Monongalia County was a herculean effort. Initially a
multitude of regulatory sources must be identified, and the regulatory code and agreements
extracted in textual form. Subsequently these regulations had to be codified, attributed, and
ingested into a database in readiness for inclusion in ArcGIS Pro. In addition, the spatial units to
which the code is to be assigned must be generated. In reality, it was no easy task to even
identify these spatial units, or the locations associated with the code and considerable effort was
expended pursuing the locational information. Local knowledge of the geography of a place was
highly valuable when performing this task. In the case of ‘routine’ spatial units, such as
counties, census enumeration districts, or census tracts, many could be accessed through spatial
data clearinghouses or state and federal agencies and were available in spatial digital format
appropriate for incorporation within a GIS. But in many other instances, these spatial
‘containers’ had to be created and digitalized. Furthermore, as this study has demonstrated, not
all small p policy is encoded or exists in written form and much of it is retained as oral narrative
and best practice. Mapping this latter information revealed both the sheer complexity of the
solid waste system even for a relatively small county, as well as the fragility of retaining such
information for future generations. The process of undertaking the unravelling of the trash waste
industry for one small county revealed a major disconnect between a vision of what should be
and the reality of what is, or what is practically achievable, based on the resources available to
undertake such a measure, however limited in scope.
For many of the reasons listed above it is easy to see why the somewhat logical step to map
small p policy has had such limited success in public policy studies. And this is in the light on
ongoing drives to assess the success or failure of policy initiatives which invariably requires that
the ‘where’ question be addressed. Early exploratory forays into this field during the course of
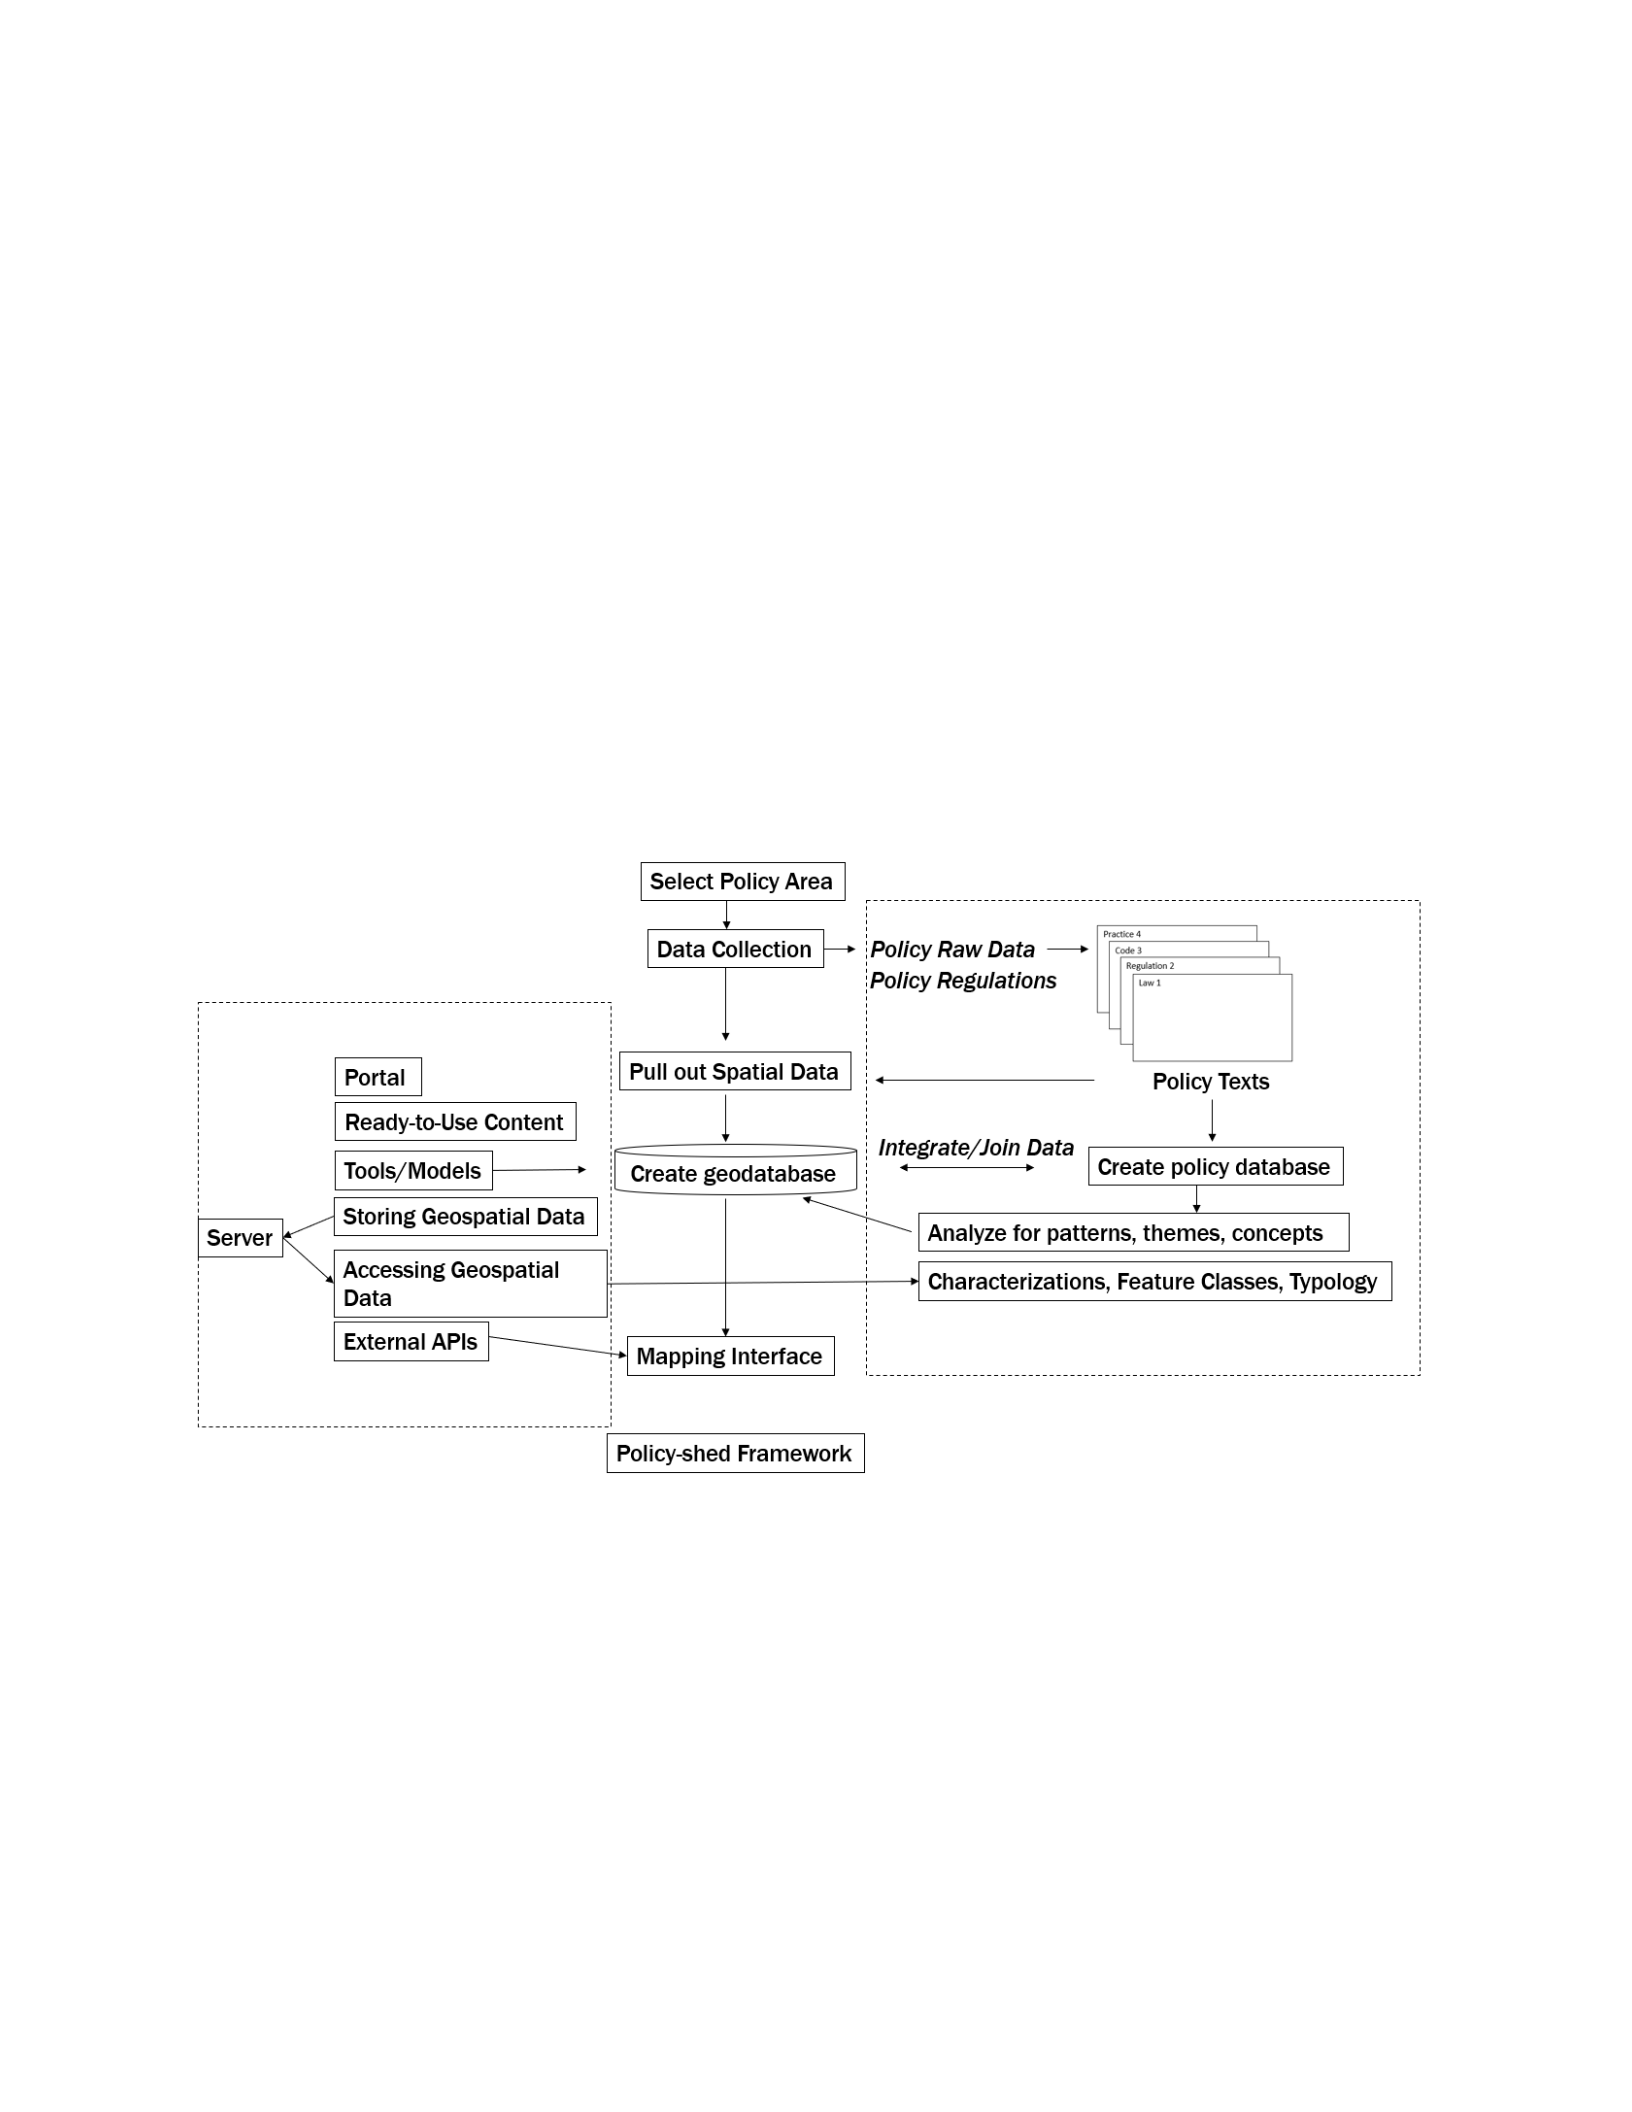
132
this research study were problematic in many ways and a GIS-based policy-shed approach was
pursued. The schematic detailed in Figure 10.1 portrays the policy-shed framework pursued in
this study. Providing such a framework demarcates a generalized pathway that might be pursued
by others though one would assume that due alteration and adaption would be necessary
contingent on the domain policy being study. The framework is composed of several component
parts dedicated to the regulatory code extraction with associated spatial and locational
characteristics. Subsequently these rules were codified and the descriptive texts were ingested
into a geodatabase along with the requisite spatial information. One important finding from this
study was the realization that beginning the process with the geography had significant
advantages in terms of efficiencies as opposed to the actual route taken which was to begin the
process by characterizing policy and the policy attributes. This is a saving in both labor and time
but also in the better encapsulation of how to proceed through the policy-shed process.
Figure 10.1: A Policy-shed Framework Flow Schematic
Subsequently, the geodatabase and GIS components were conjoined to several add-ons through
APIs which enabled the mapping interface and brushing and linking capabilities along with an
interactive dashboard. While this policy-shed conceptual model was successfully implemented
as part of this doctoral study, the system has not undergone a real-world implementation and as a
result the system has not been stress-tested to identify unknown deficiencies in the operation of
the platform. While no end-user was specifically identified it would be valuable to explore the

133
solid waste trash platform capability further for multiple counties and for alternative small policy
domains beyond solid waste. One could envisage the value of this system being to city planners,
engineers, and the legal system grappling with the day-today operation of a seemingly chaotic
and complex regime. Such extensions lie beyond the scope of this study but in addition to the
findings of this study such reflexivity would be valuable in improving and strengthening the
system. Given the ability of the system to combine and merge multiple jurisdictional and
administrative it is also intriguing to consider using the policy-shed approach to identify
meaningful and optimal administrative boundaries relevant to a whole slew of bureaucratic
procedures ranging from electoral redistricting to planning zones to economic communities.
Ultimately, the policy-shed platform was designed to help explore, understand, and contribute to
what is entailed in determining and assigning space to public policy. In doing so, the solid waste
regulatory system was examined for Monongalia County, West Virginia, and ArcGIS Online and
numerous APIs were linked to the database. Regulatory and best practice rules were extracted
from text-based documents containing solid waste code and were codified and ingested into a
database. An interactive dashboard was created that provided access to the GIS, regulatory
database, and platform functions including map display and brushing and linking capability. The
policy-shed platform enables user enabled queries of the database based on location or by
regulatory code. Maps can be produced, analytics applied, and the brushing and linking
capability provides a powerful exploratory environment for examining the solid waste regulatory
system.
An examination of the solid waste industry for Morgantown using this platform raised interesting
insights into the spatial nature of solid waste disposal. Mapping the various regulations
identified the spatial patterning of the regulatory codes but also distinct anomalies. Thus, the
mandated recycling for Morgantown can be clearly discerned because it surpassed the 10,000-
population threshold, but despite the continuous urban sprawl into adjacent areas, alternative
recycling programs were permissible to jurisdictions just outside of the Morgantown boundary.
But even then, the differential between residential and business structures created differing
recycling regimes within Morgantown and the idiosyncrasy of multiple occupancy residential
structures which were also landlord owned businesses further complicated these rules. The
effect of historical agreements concerning haulage routes permeates the rules. These agreements

134
are made more difficult to appreciate because many are based on verbal agreements and operate
according to historical practice. Other spatial anomalies exist as with the peninsula type
boundary extension to the south of Morgantown that incorporates the Super Walmart located
there and which has differing waste disposal practices. Differing solid waste protocols can also
be seen based on whether entities are federal complexes such as the National Energy Technology
Laboratory or the Federal Correctional Institution. In the case of Morgantown Municipal
Airport, multiple jurisdictions apply. Even medical facilities, such as hospitals, can reflect
differing waste protocols as demonstrated by comparing the policies JW Ruby Memorial
hospital, the WVU School of Medicine teaching hospital, and Monongalia Health Hospital. As a
result, many entities have overlapping or multiple regulatory codes that differ based on the
applicable jurisdiction or authority.
In conclusion, against the backdrop of international, national, state, and local public policy
surrounding solid waste system, the very real complexity of the spatiality and geography of the
regulatory code becomes very apparent. While public policy is under continued scrutiny to
determine its effectiveness and value, the lack of a foundational spatial base significantly
complicates the evaluation process. While the interrelationships between public policy and its
spatial extent are fraught with complexity it is suggested here that a GIS-based policy-shed
approach is one effective way to address the geographical shortcomings of small p policy
regulatory code. The seeming diminution and lack of acknowledgement of the role of space in
public policy is significant because the spatial manifestation of policy, and especially ‘small p’
policy, is either simplified to the point that it applies broadly to ‘everywhere’ and is ignored until
legal spatial conflicts emerge.

