


Exercise 1
a)
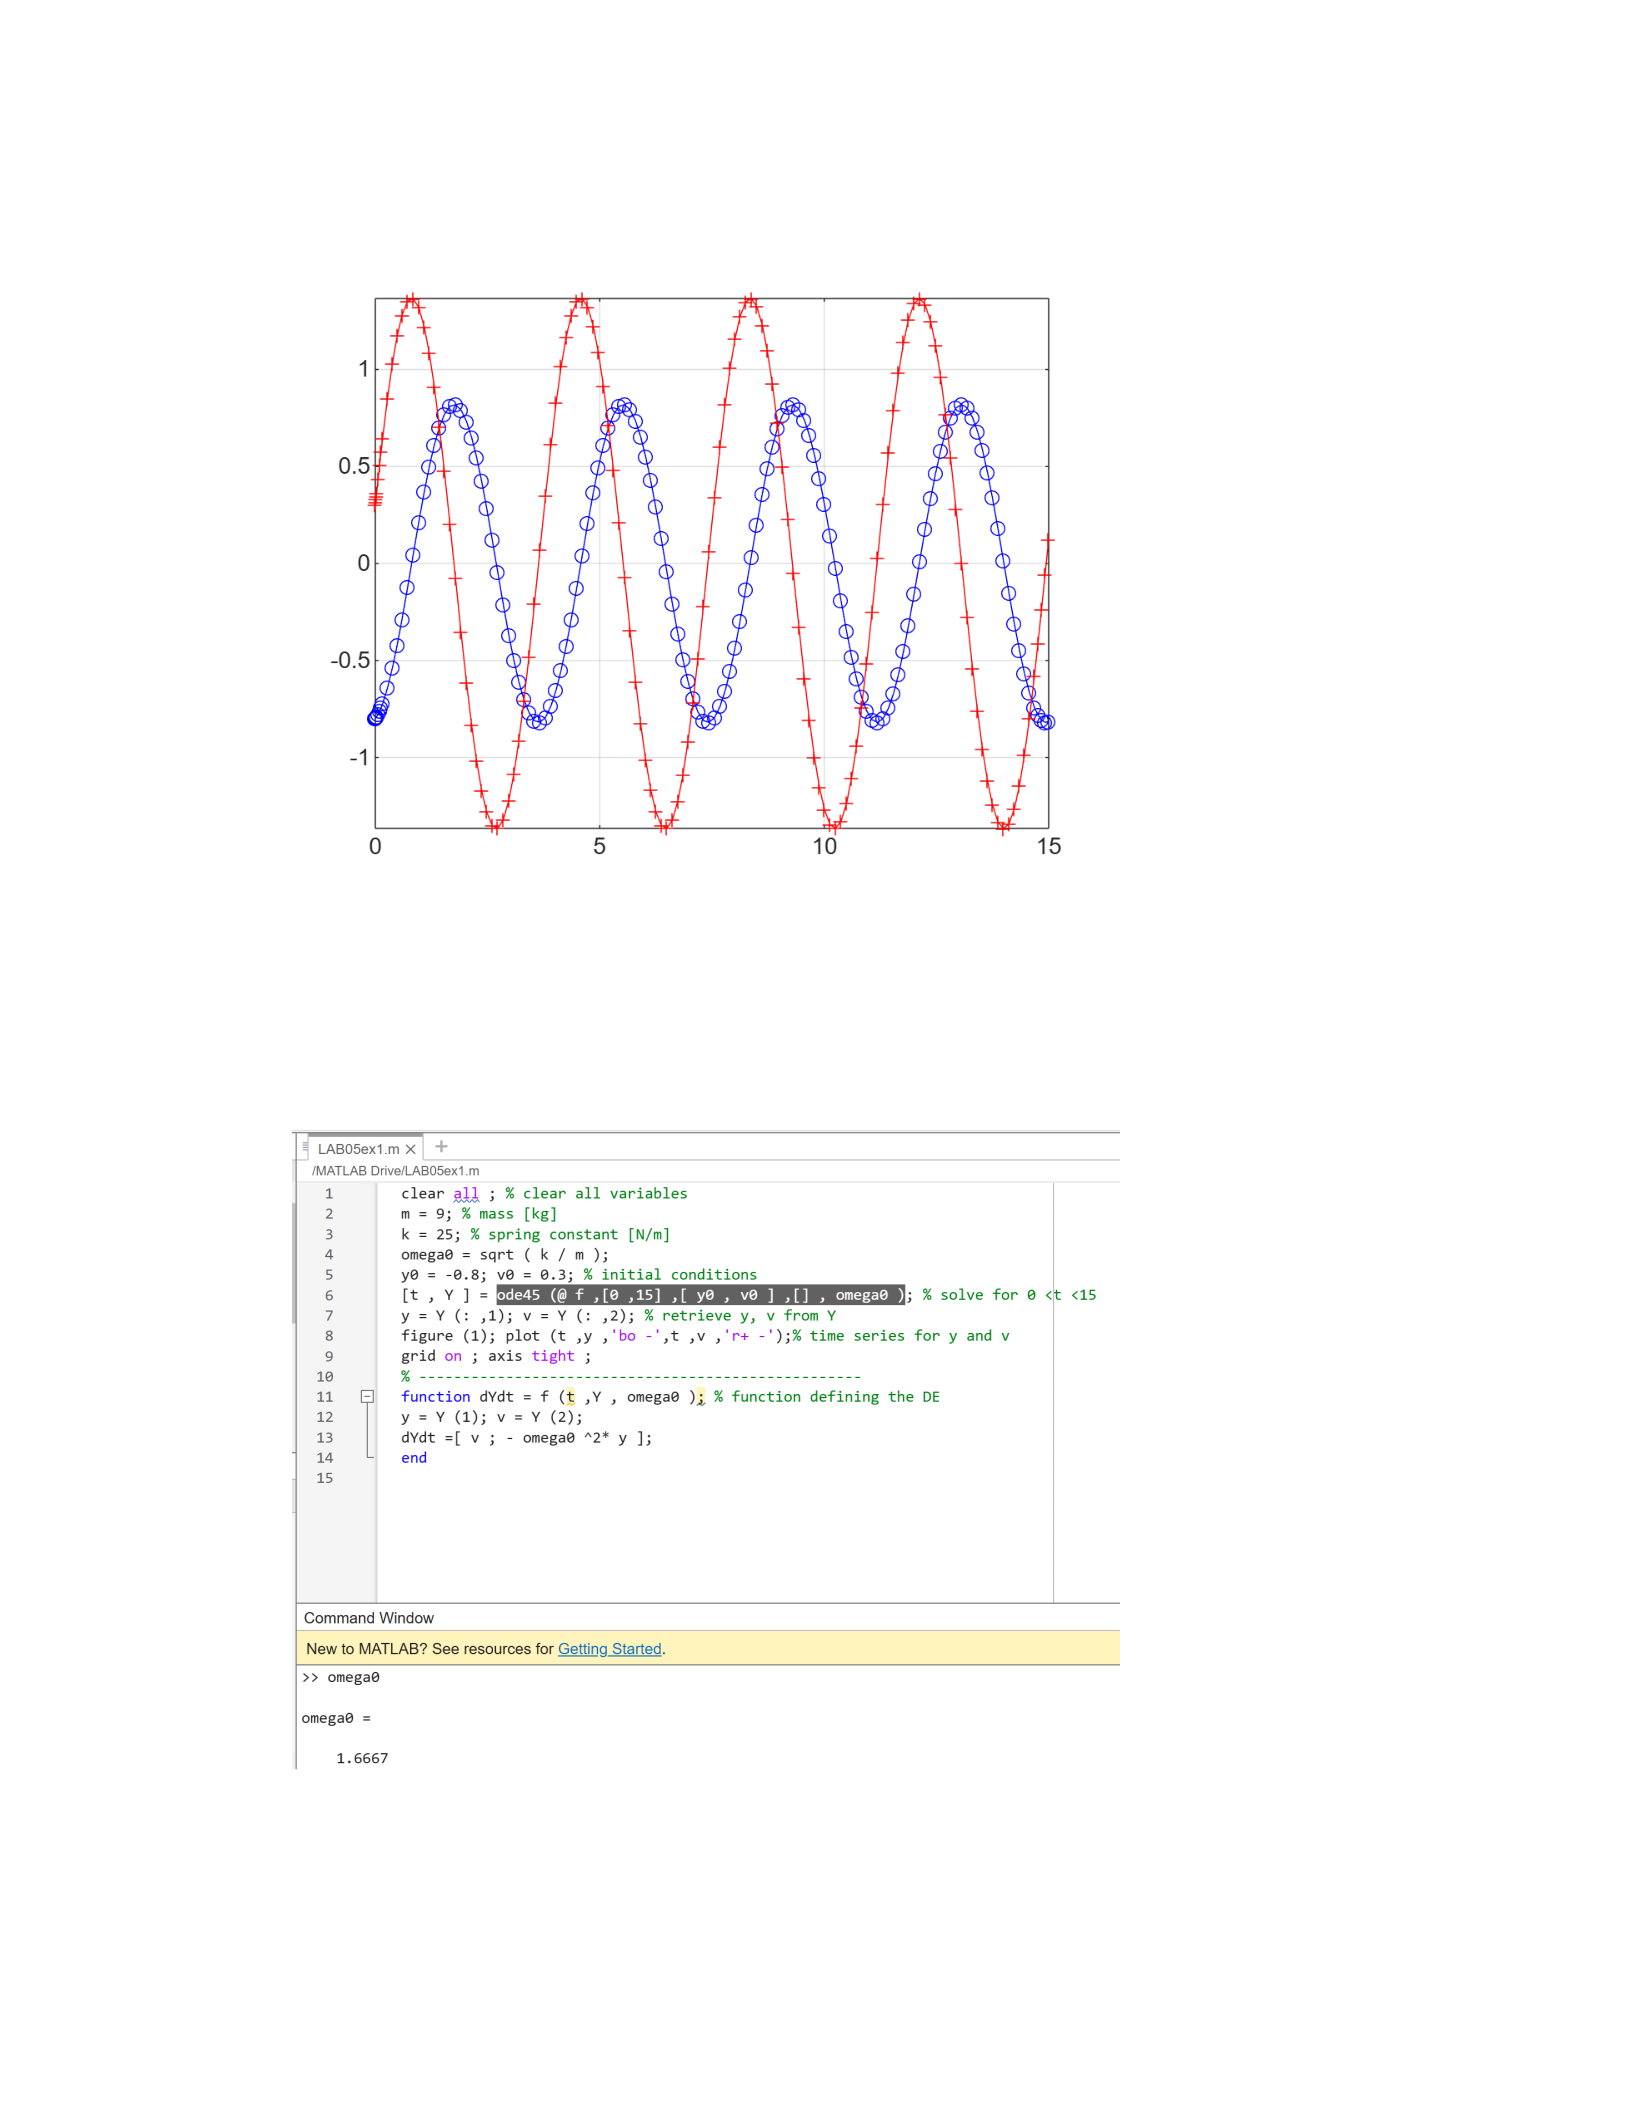
According to the script file, y0 = -0.8. This aligns with the blue graph, because the initial value is
also y=-0.8.
b) Graphically speaking, the period of the function is approximately 3.765, as the point of the first
peak is at (1.785, 0.81) and the point of the second peak is at (5.55,0.81 ). By subtracting the
x-values, we get the value 3.765.
Analytically speaking, the period can be found by using 2pi/ω0, where ω0 is equal to 1.6667.
This gives the value 3.769, which is slightly more accurate than the graphical analysis.
c) The mass will never come to rest because there is no damping in this function, meaning that it
will continue to oscillate.
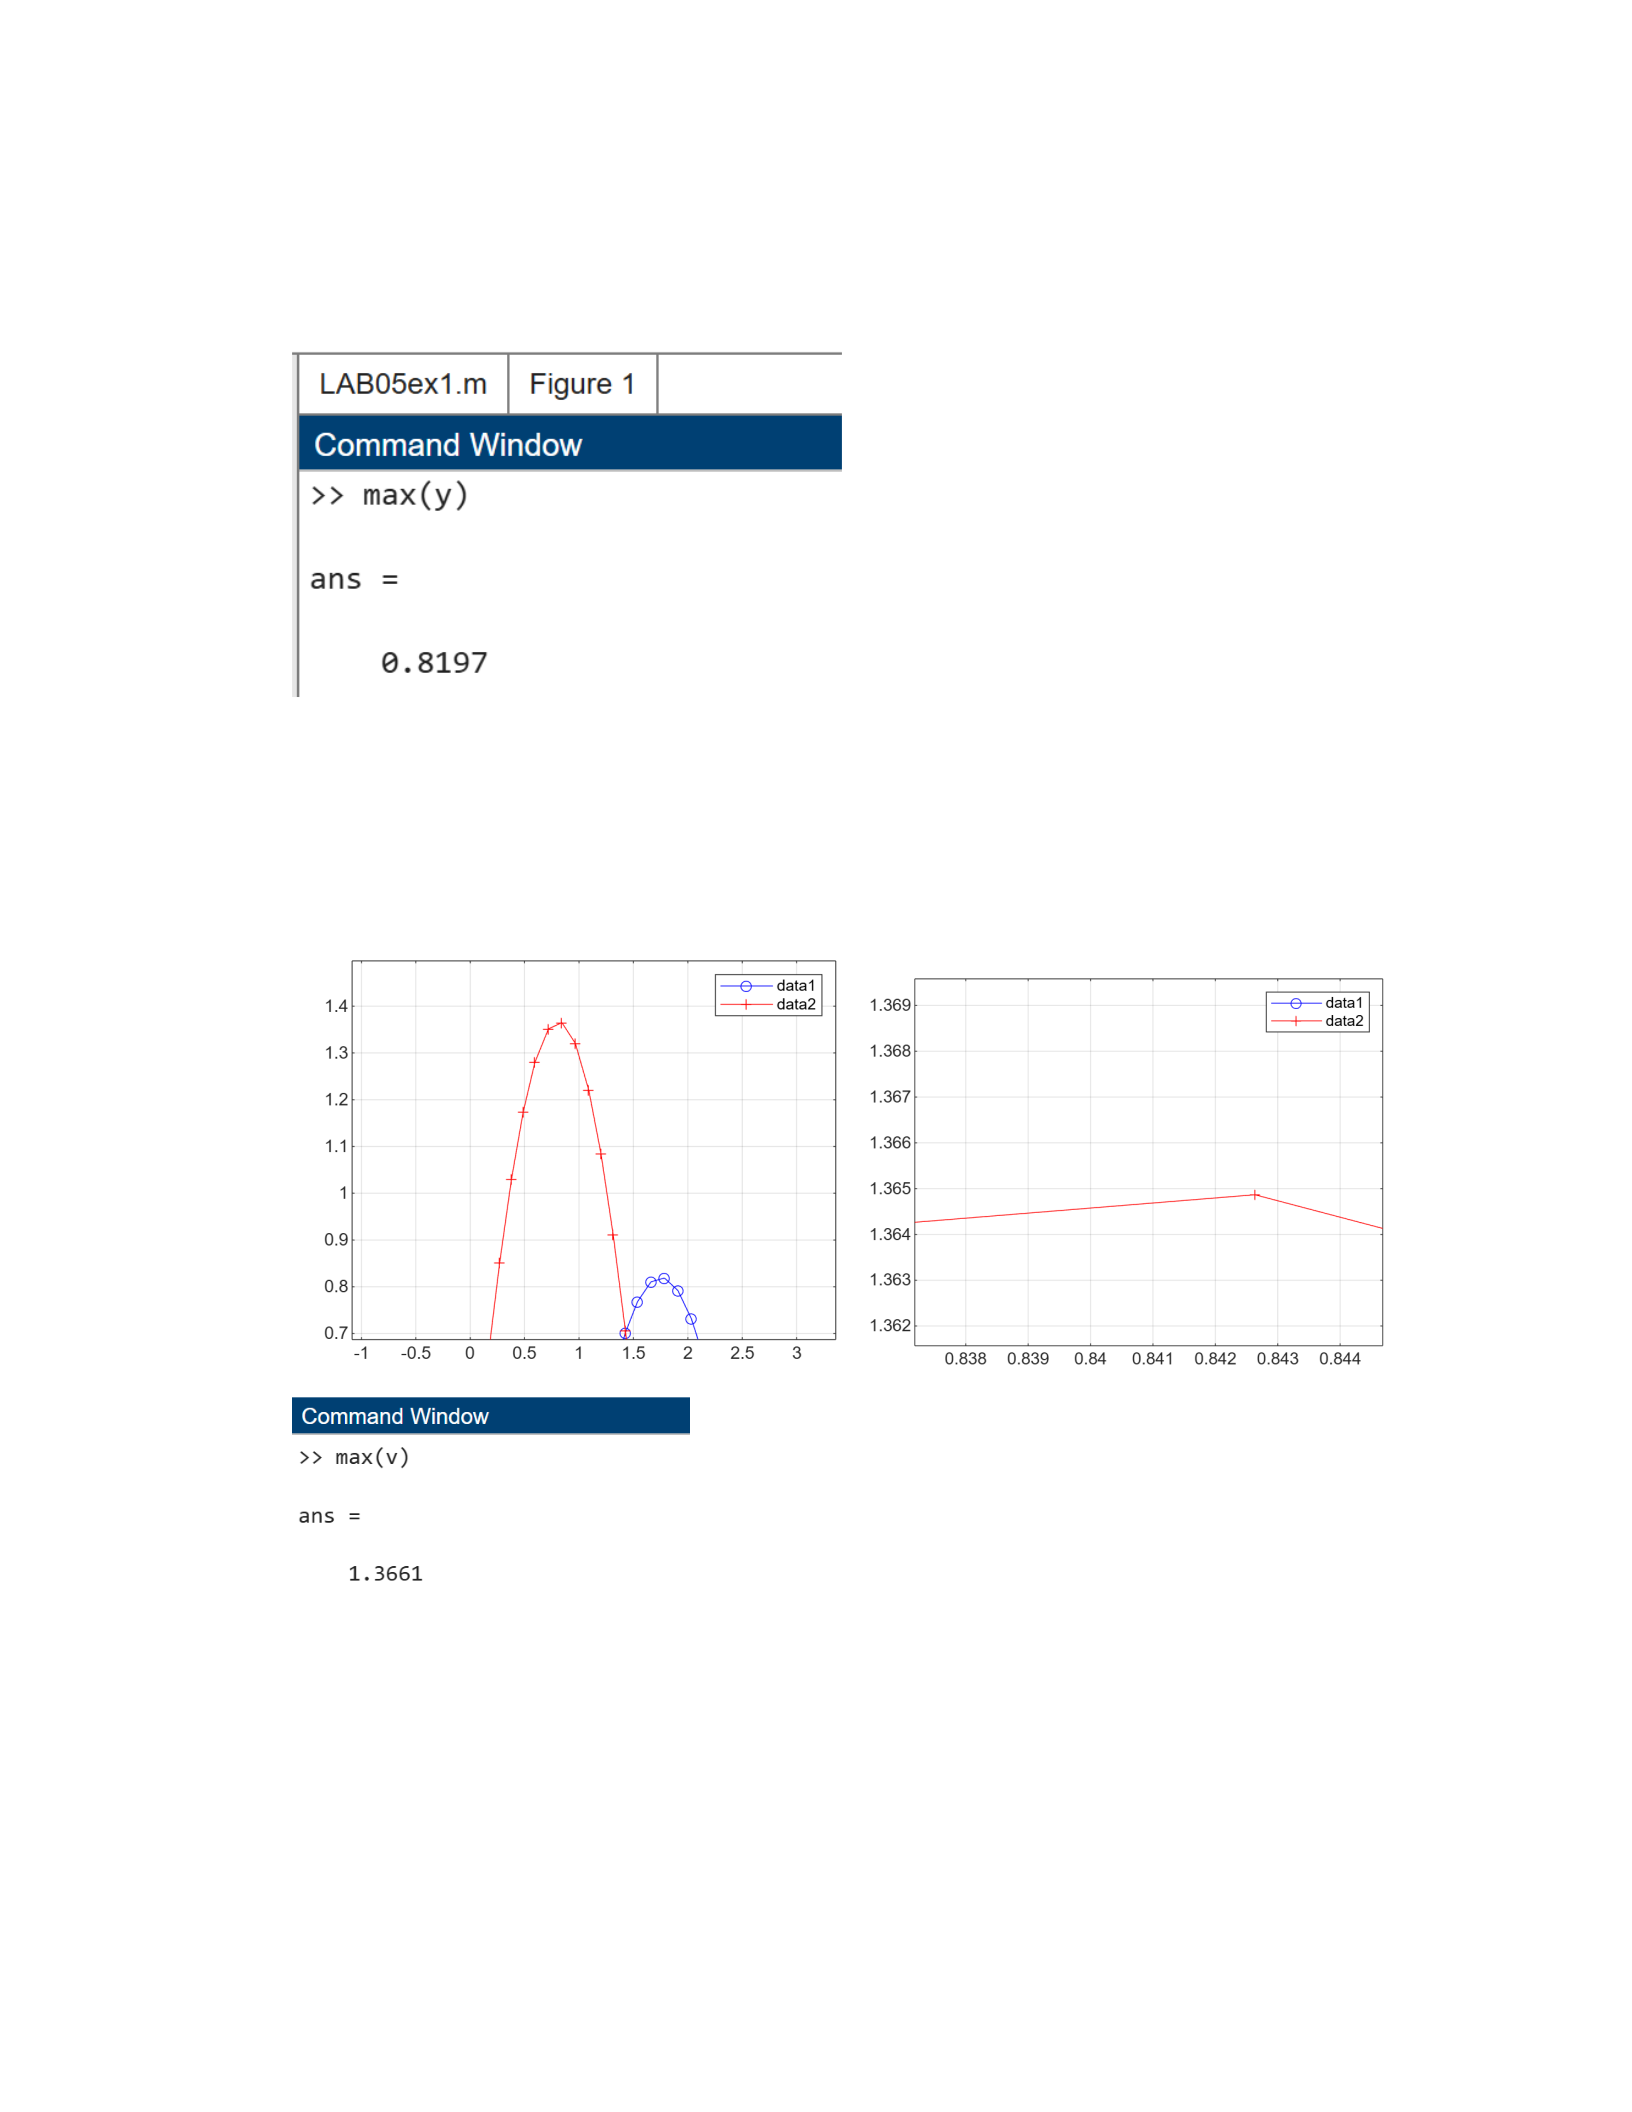
d) The amplitude can be found by using the max function because it is the measure found at the peak
of the function.
e) Using the magnifying glass feature, I found that the maximum velocity is at approximately 1.36.
This can also be confirmed by finding the maximum value of v(t). In order to find the exact
values of t at which this occurs, I created a vector with values of t and corresponding values of t.
The maximum velocity occurs at approximately t= 4.61, 8.37, and 12.13.
>> A= [t,v]
A =
0
0.3000
0.0068
0.3151
0.0136
0.3301
0.0203
0.3450
0.0271
0.3600
0.0610
0.4339
0.0949
0.5064
0.1289
0.5773
0.1628
0.6463
0.2709
0.8517
0.3790
1.0296
0.4871
1.1739
0.5952
1.2802

0.7189
1.3512
0.8426
1.3649
0.9664
1.3204
1.0901
1.2200
1.2021
1.0845
1.3140
0.9114
1.4260
0.7066
1.5380
0.4772
1.6615
0.2052
1.7851
-0.0754
1.9086
-0.3527
2.0322
-0.6152
2.1441
-0.8310
2.2560
-1.0179
2.3680
-1.1693
2.4799
-1.2801
2.6034
-1.3510
2.7270
-1.3648
2.8505
-1.3207
2.9740
-1.2207
3.0859
-1.0857
3.1979
-0.9130
3.3098
-0.7086
3.4217
-0.4795
3.5452
-0.2077
3.6687
0.0728
3.7922
0.3501
3.9158
0.6127
4.0276
0.8286
4.1395
1.0158
4.2514
1.1676
4.3633
1.2789
4.4868
1.3504
4.6103
1.3648
4.7338
1.3214
4.8573
1.2222
4.9691
1.0878
5.0810
0.9157
5.1928
0.7119
5.3046
0.4833
5.4281
0.2119
5.5516
-0.0685
5.6751
-0.3459
5.7986
-0.6087
5.9104
-0.8249
6.0221
-1.0124
6.1339
-1.1648
6.2457
-1.2769
6.3692
-1.3494
6.4926
-1.3650
6.6161
-1.3227
6.7395
-1.2246
6.8513
-1.0913
6.9630
-0.9203
7.0747
-0.7174
7.1864
-0.4897
7.3098
-0.2187
7.4333
0.0614
7.5567
0.3389
7.6801
0.6020
7.7917
0.8186
7.9034
1.0069
8.0150
1.1603
8.1266
1.2736
8.2500
1.3479
8.3734
1.3653
8.4968
1.3249
8.6202
1.2287
8.7317
1.0971
8.8432
0.9278
8.9547
0.7265
9.0662
0.5001
9.1896
0.2301
9.3129
-0.0496
9.4362
-0.3272
9.5595
-0.5910
9.6709
-0.8083
9.7823
-0.9977
9.8936
-1.1527
10.0050
-1.2681
10.1282
-1.3452
10.2515
-1.3657
10.3747
-1.3285
10.4980
-1.2354
10.6092
-1.1069
10.7203
-0.9404
10.8315
-0.7418
10.9427
-0.5177
11.0658
-0.2491
11.1890
0.0299
11.3121
0.3076
11.4353
0.5724
11.5462
0.7907
11.6571
0.9821
11.7680
1.1398
11.8790
1.2587
12.0020
1.3405
12.1250
1.3661
12.2480
1.3342
12.3710
1.2464
12.4816
1.1230
12.5922
0.9615
12.7028
0.7674
12.8133
0.5473
12.9362
0.2813
13.0590
0.0037
13.1819
-0.2741
13.3047
-0.5404
13.4151
-0.7609
13.5255
-0.9556
13.6359
-1.1179
13.7462
-1.2426
13.8689
-1.3319
13.9915
-1.3658
14.1141
-1.3426
14.2368
-1.2634
14.3482
-1.1459
14.4597
-0.9889
14.5712
-0.7978
14.6827
-0.5792
14.7620
-0.4111
14.8414
-0.2358
14.9207
-0.0564
15.0000 0.1240
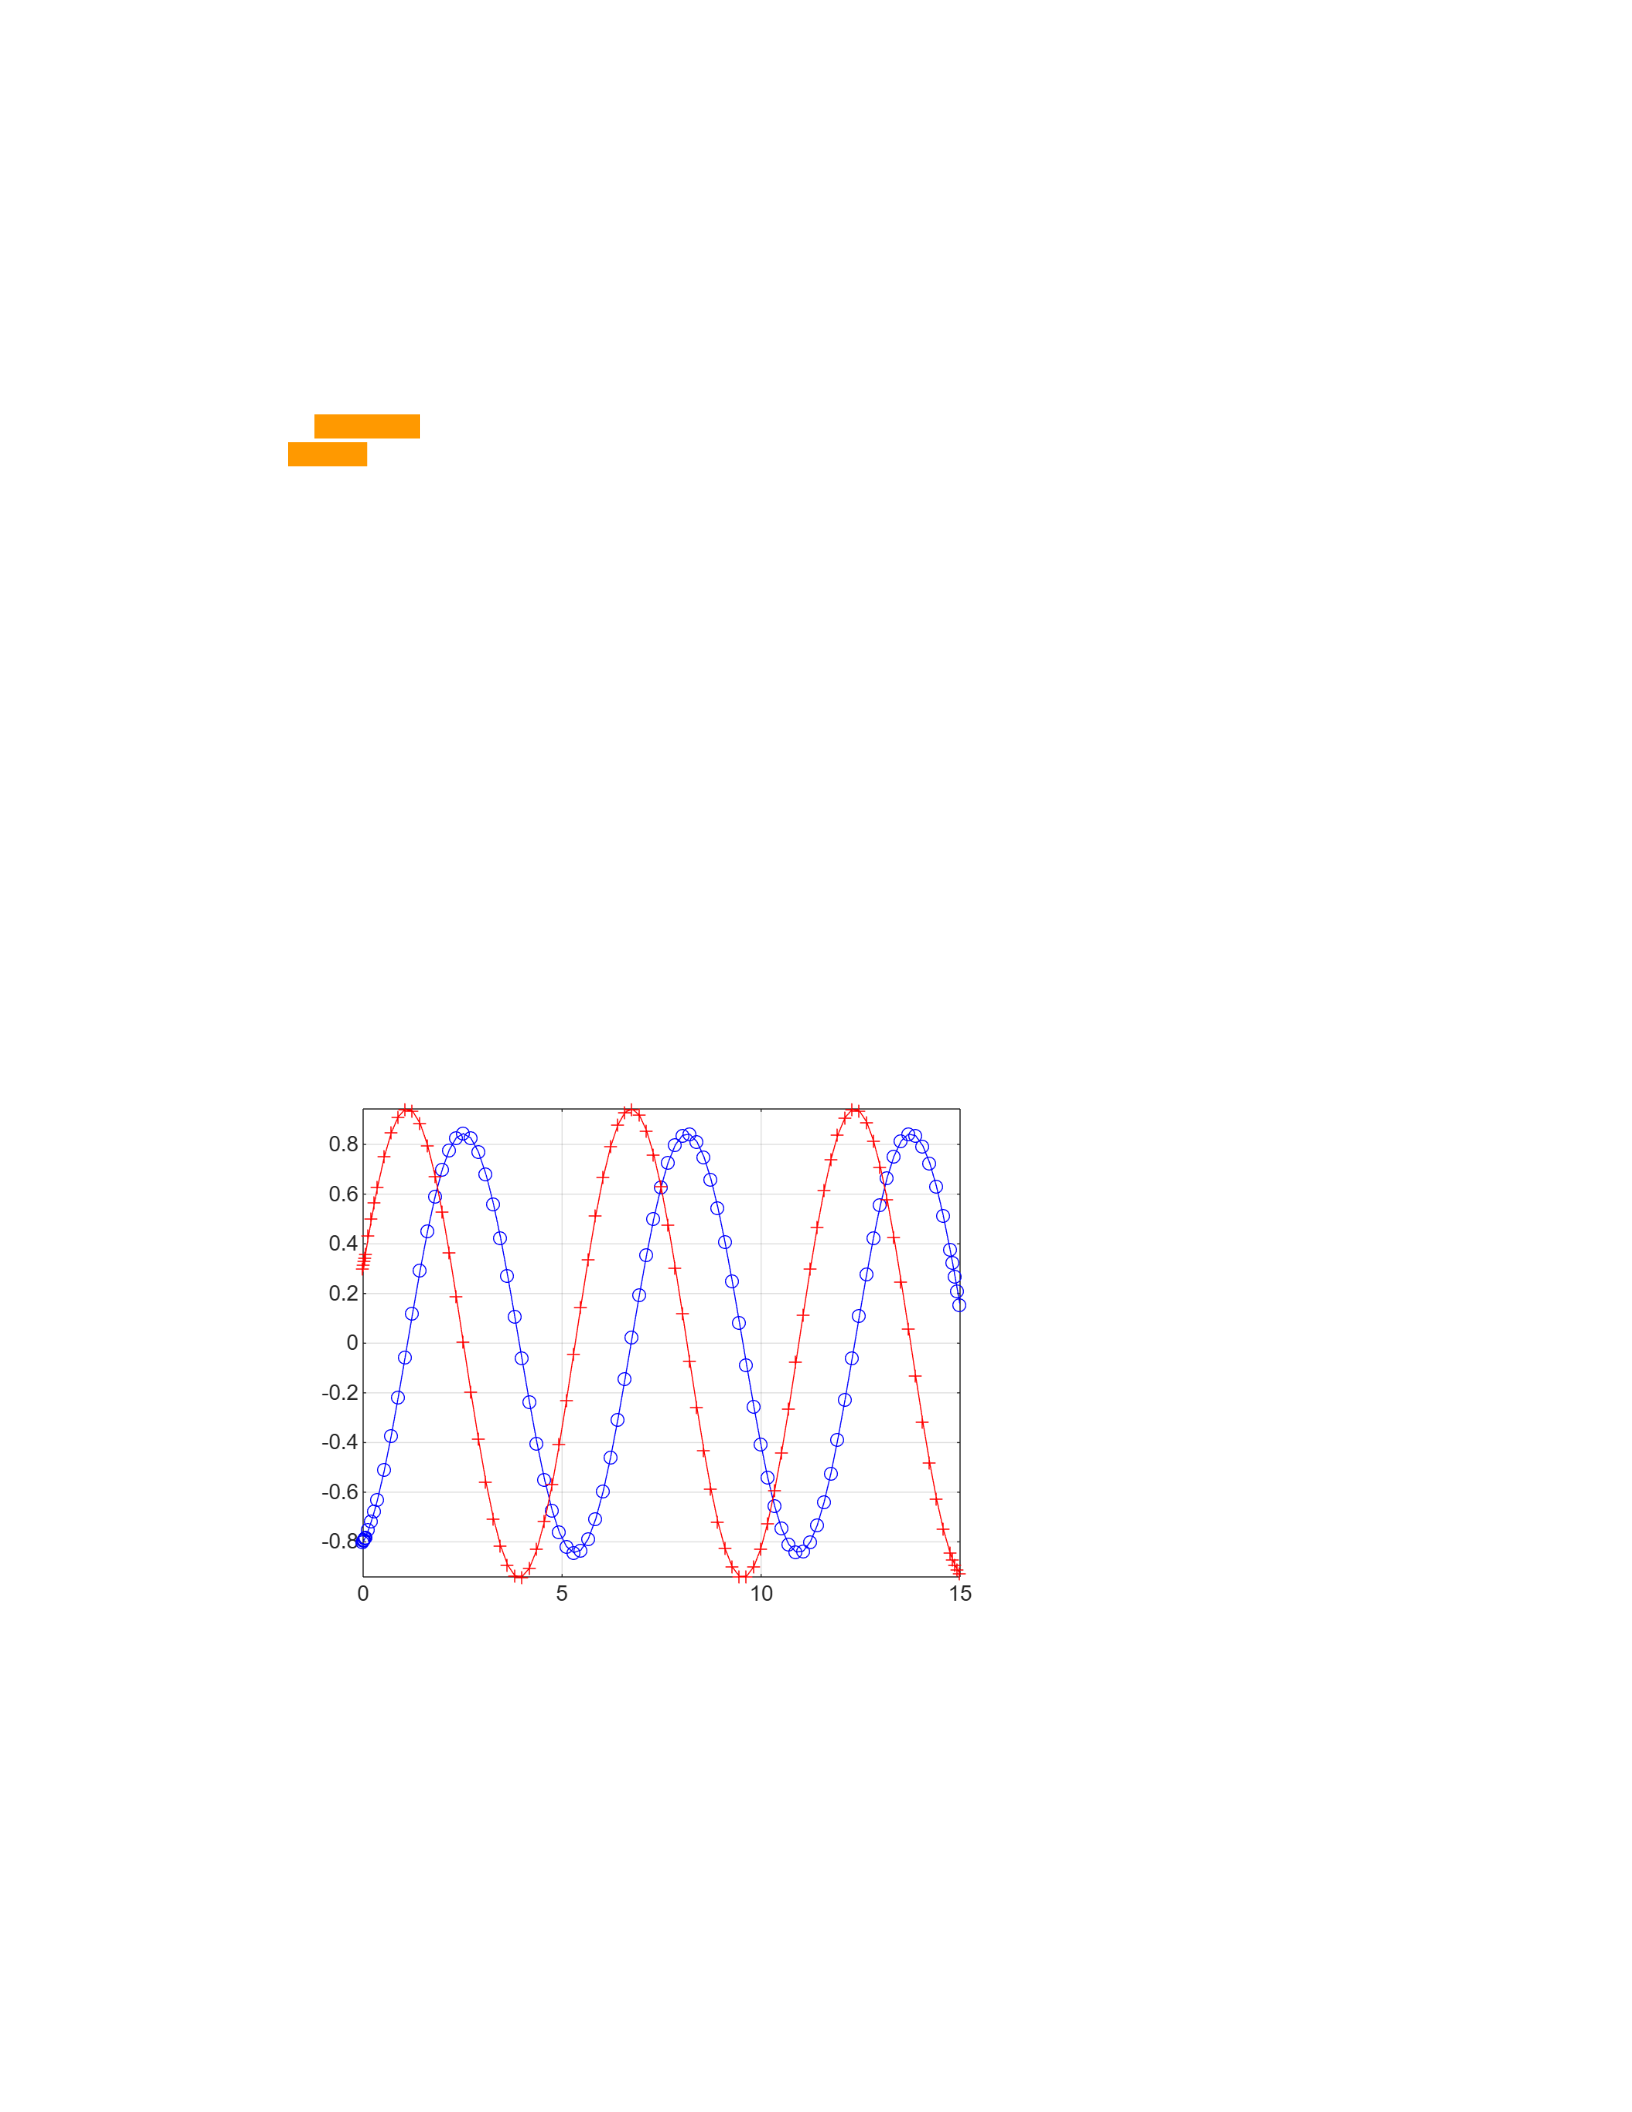
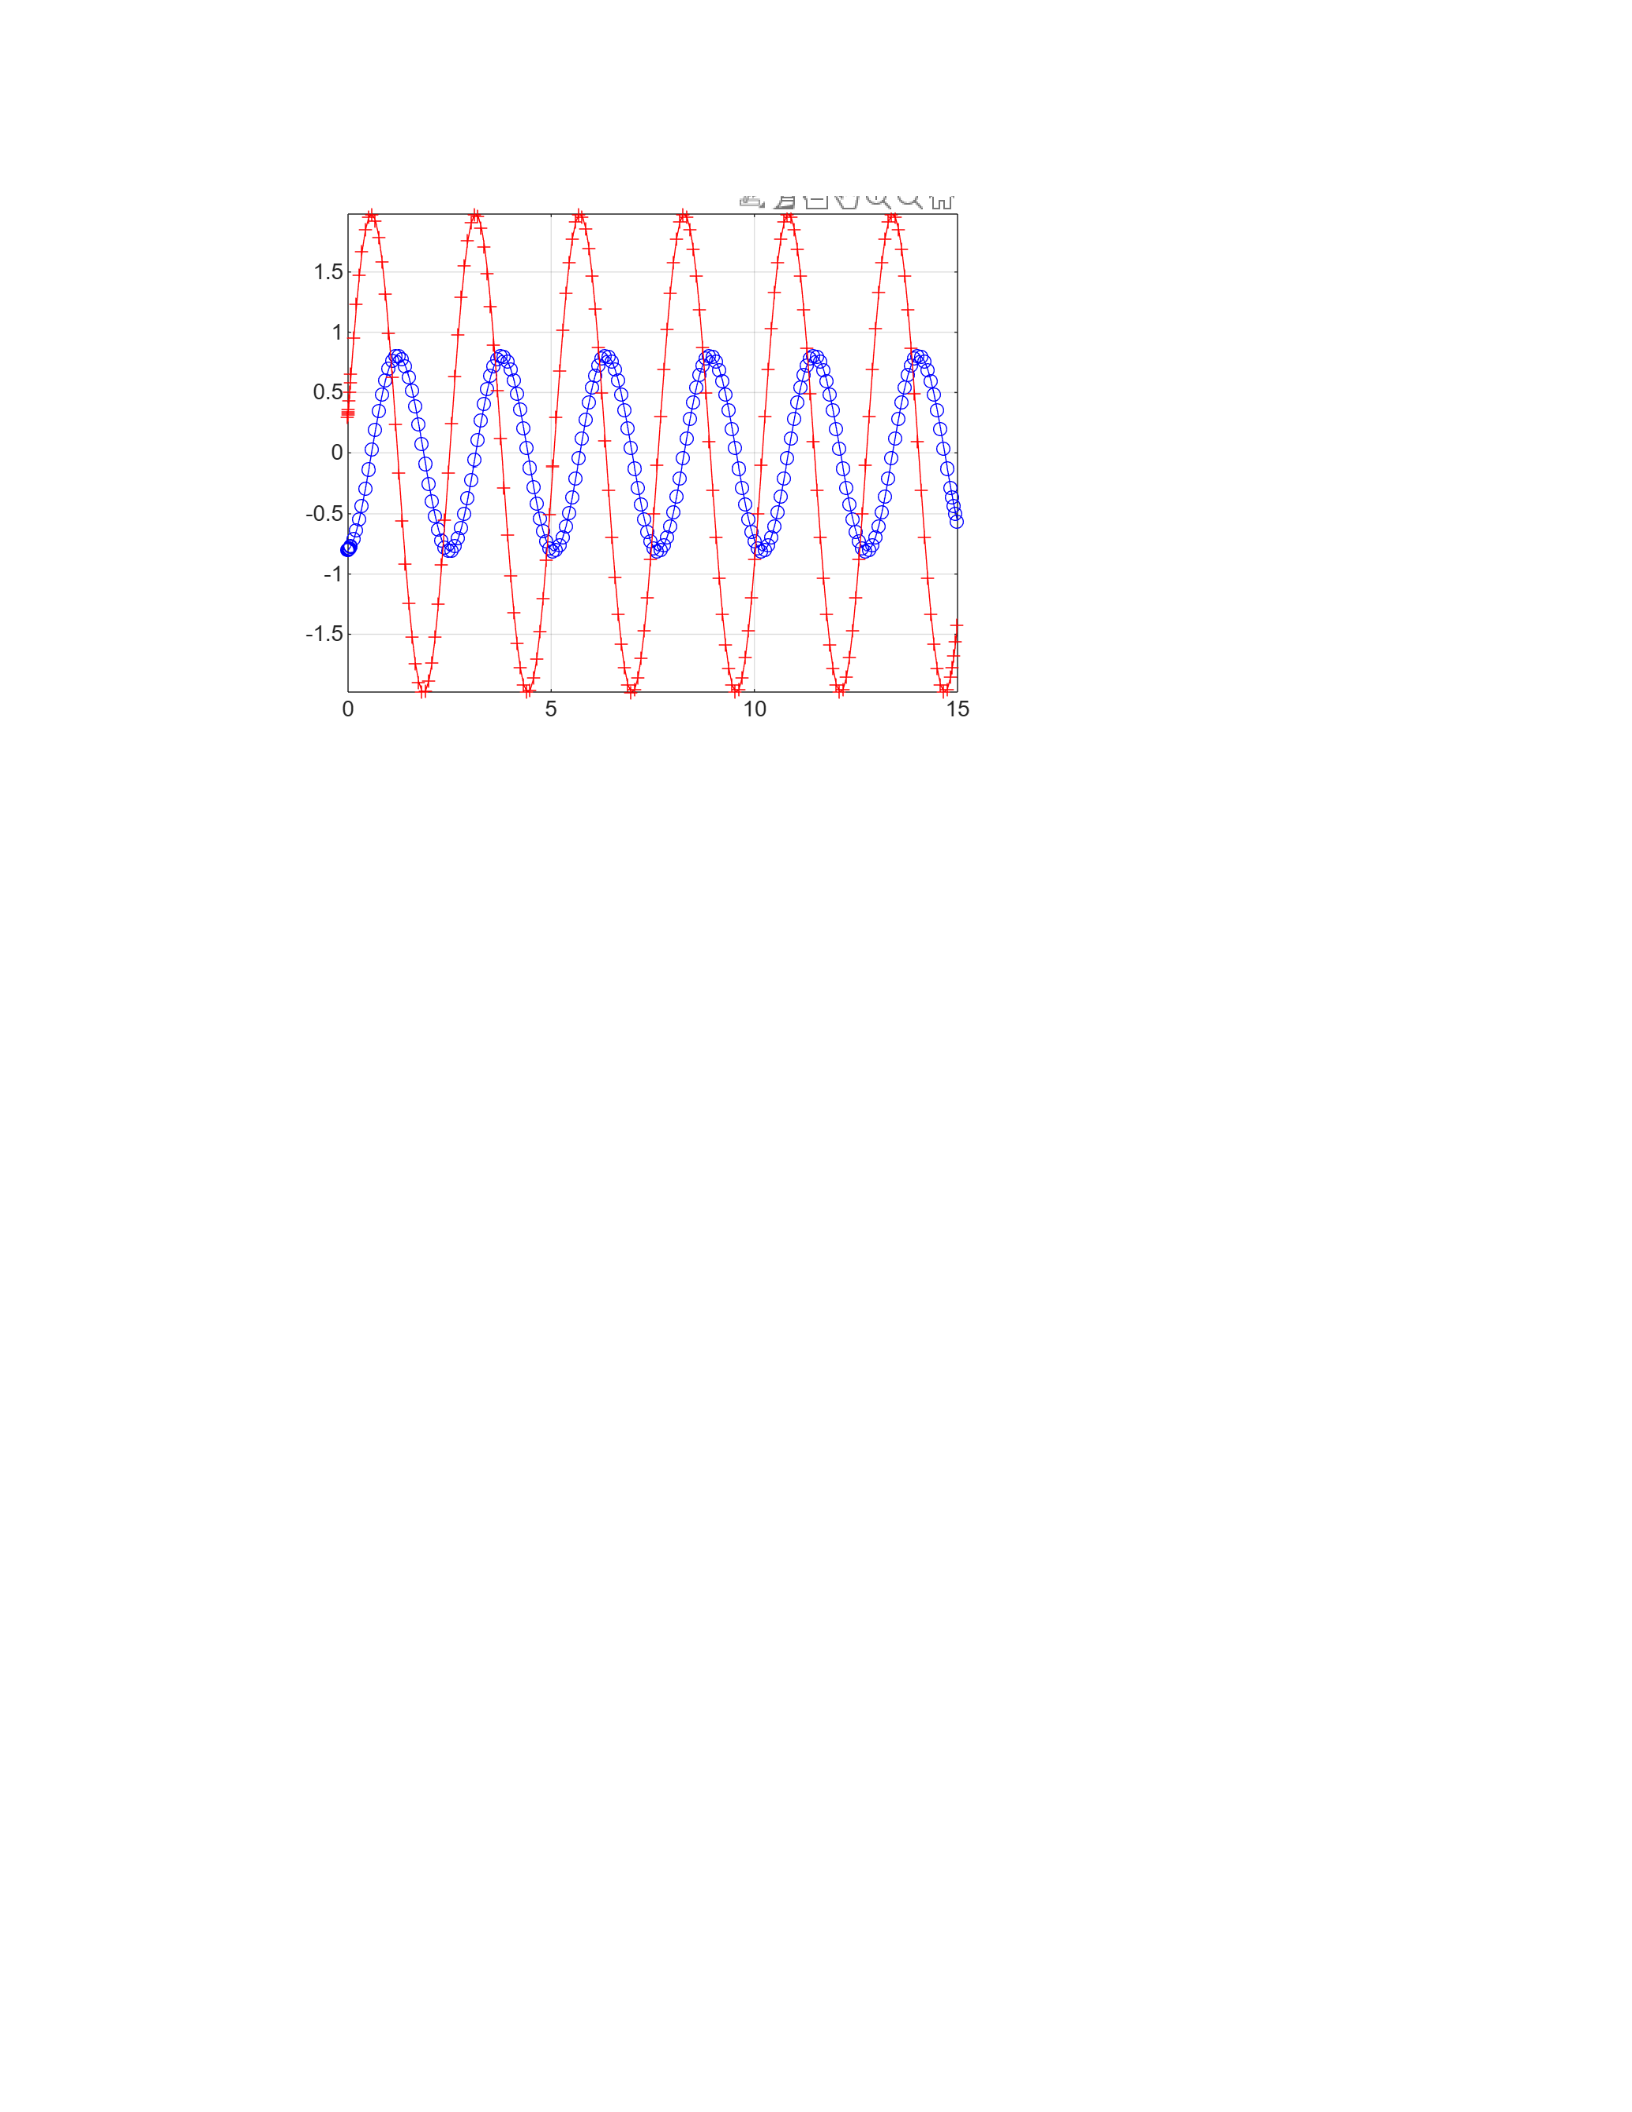
f) The frequency is equal to the square root of k/m. Using this equation, it becomes clear that a large
m value creates a smaller frequency value, meaning that the waves would be longer and more
drawn out. Meanwhile, a high k value means the opposite, creating a higher frequency value. This
means more waves, with more oscillation.
Graph for m=20, k=25:
Graph for m=9, k=54:
Exercise 2
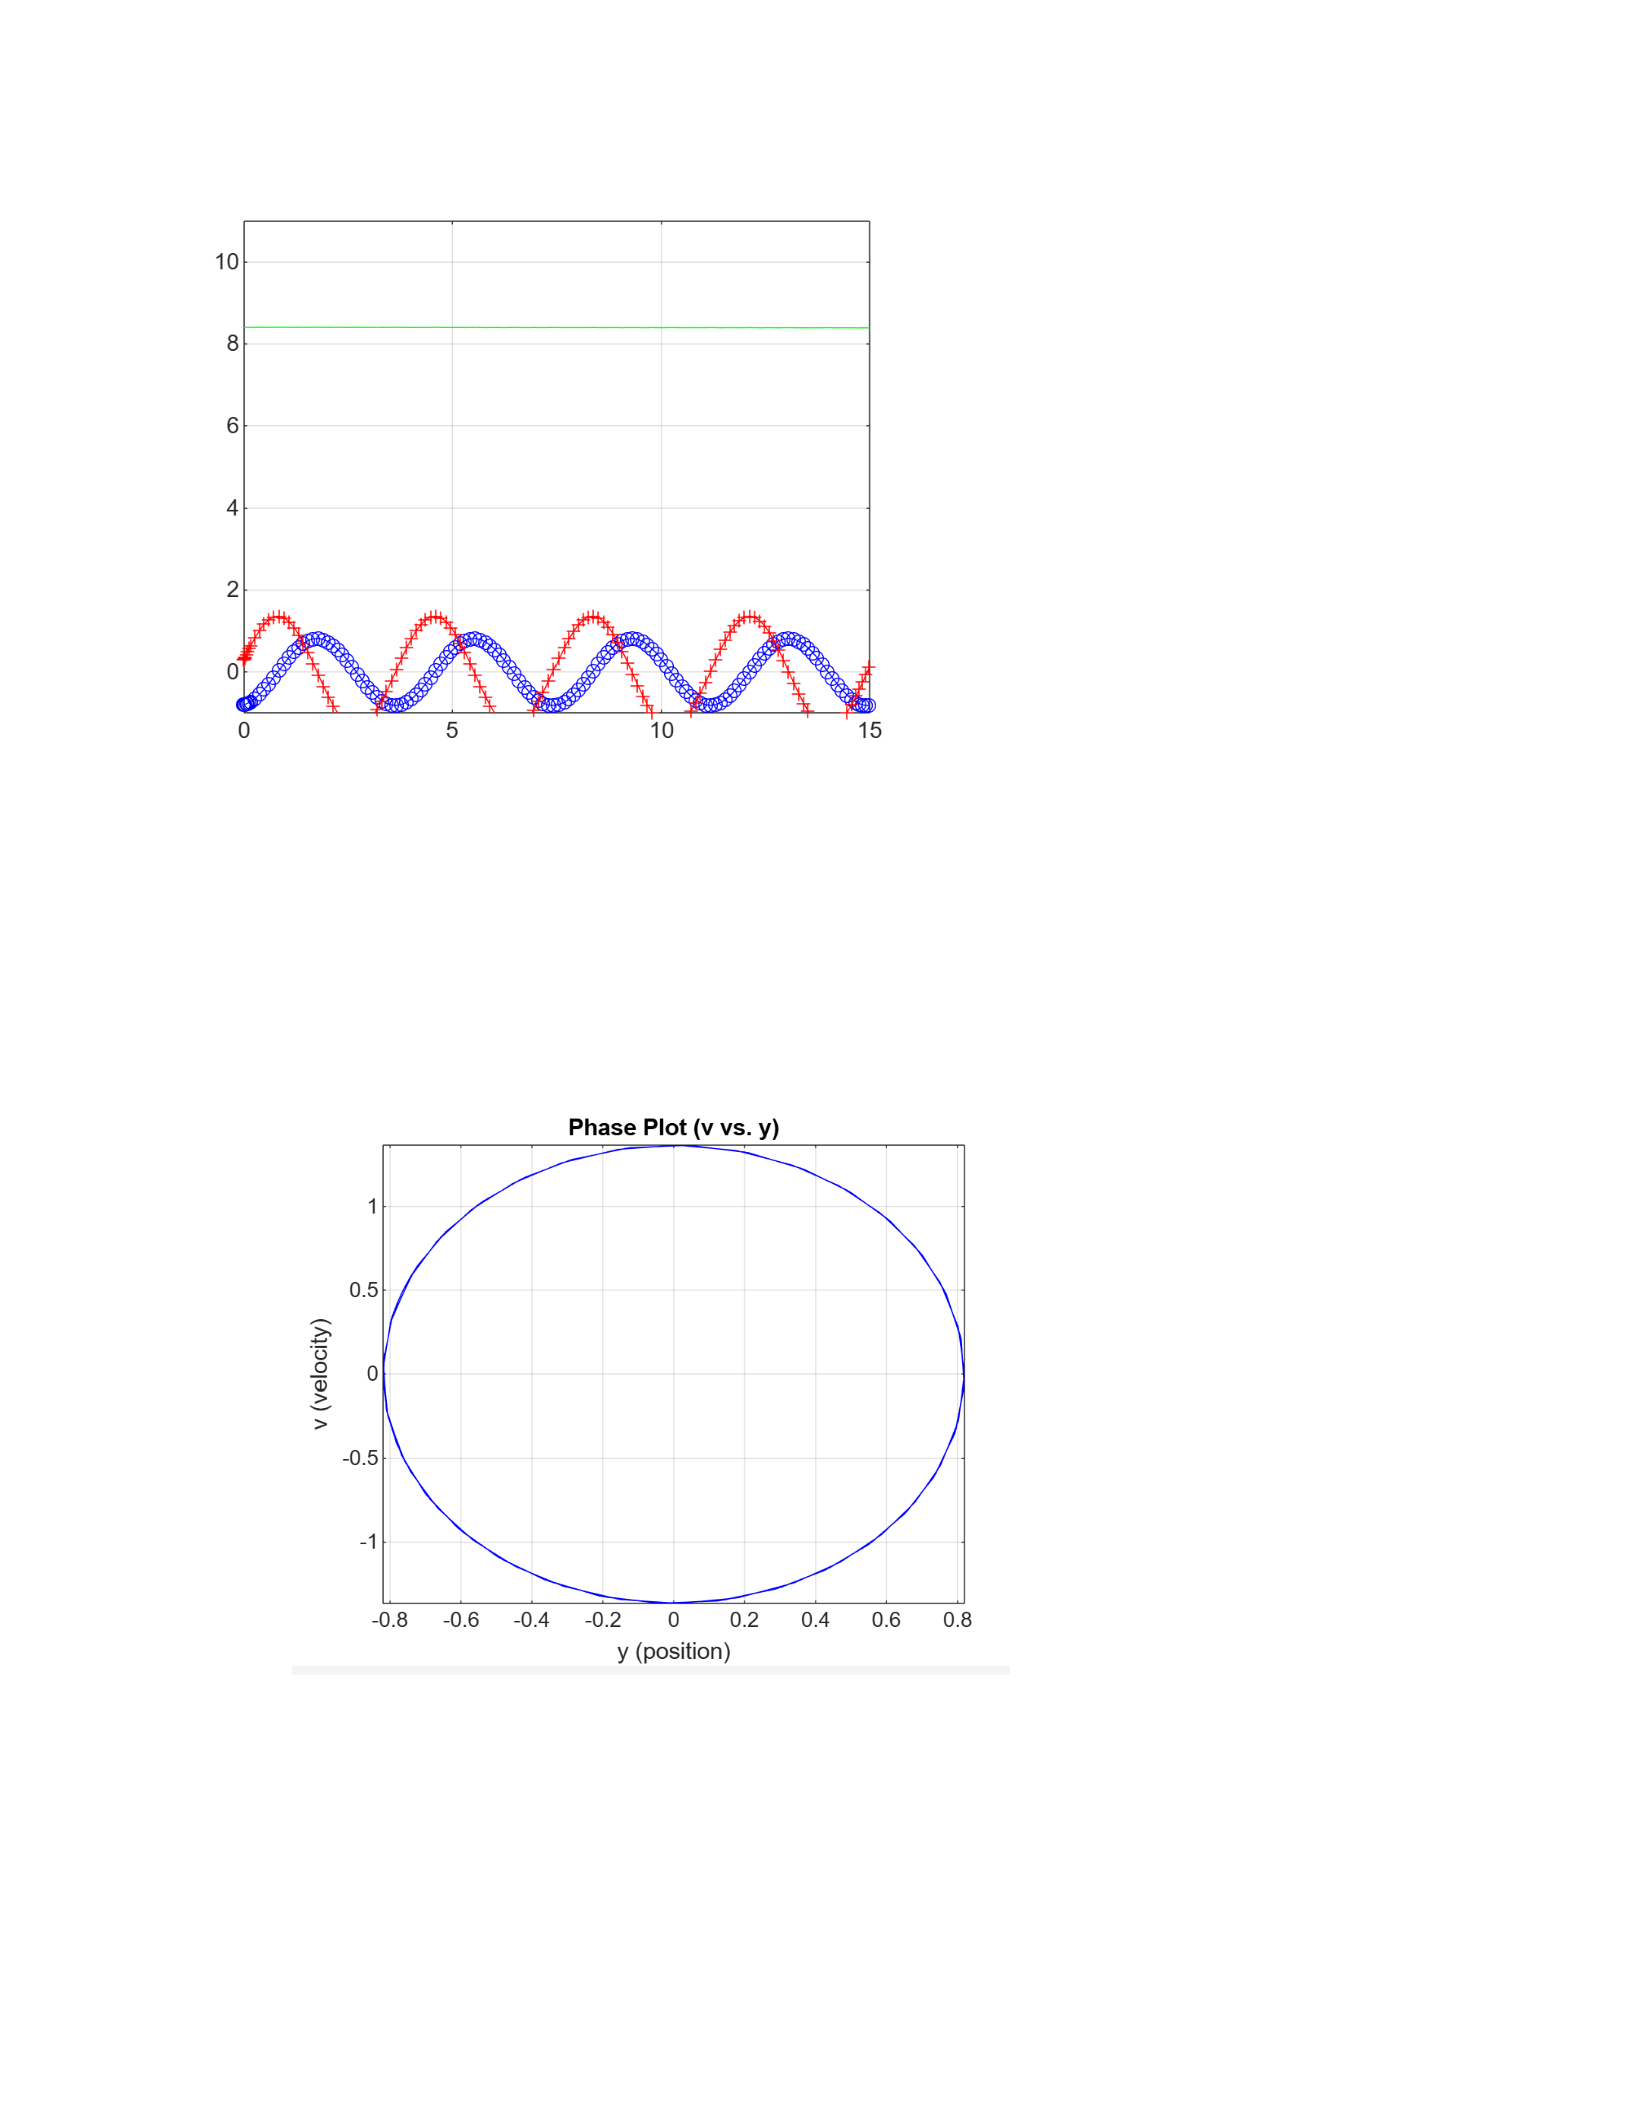
a) This shows that energy is in fact conserved, because the plot of the green line, energy, remains
constant, and its derivative is zero.
clear all ;% clear all variables
m = 9; % mass [kg]
k=25;% spring constant [N/m]
omega0 = sqrt ( k / m );
y0 = -0.8; v0 = 0.3; % initial conditions
[t , Y ] = ode45 (@ f ,[0 ,15] ,[ y0 , v0 ] ,[] , omega0 ); % solve for 0 <t
<15
y = Y (: ,1); v = Y (: ,2); % retrieve y, v from Y
E= (1/2)*m *v.^2 + (1/2)*k*y.^2;
figure (1); plot (t ,y ,'bo -',t ,v ,'r+ -',t,E,'g');% time series for y and v
grid on ; axis tight ;
ylim([-1,11]);
% ---------------------------------------------------
function dYdt = f (~ ,Y , omega0 ) % function defining the DE
y = Y (1); v = Y (2);
dYdt =[ v ; - omega0 ^2* y ];
end
b) dE/dt=0, and this can be shown by finding the derivative of E= ½ (mv^2) + ½ (ky^2).
dE/dt=(mv) dv/dt + (ky) dy/dt
F=ma and F=-ky
dE/dt = F-F=0
c) The curve never gets close to the origin, (0,0). This means that it will always be in its steady state
solution, and that the mass will never come to rest because it will oscillate indefinitely.
Exercise 3
a)
clear all ;% clear all variables
m = 9; % mass [kg]
k=25;% spring constant [N/m]
c=10;% friction coefficient [Ns/m]
omega0 = sqrt ( k / m ); p = c /(2* m );
y0 = -0.8; v0 = 0.3; % initial conditions
[t , Y ] = ode45 (@ f ,[0 ,15] ,[ y0 , v0 ] ,[] , omega0 , p ); % solve for 0
<t <15
y = Y (: ,1); v = Y (: ,2); % retrieve y, v from Y
figure (1); plot (t ,y ,'bo -',t ,v ,'r+ -');% time series for y and v
grid on ; axis tight ;
% ---------------------------------------------------
function dYdt = f (t ,Y , omega0 , p ) % function defining the DE
y = Y (1); v = Y (2);
dYdt =[ v ; -omega0^2 * y - 2 * p * v ]; % fill -in dv/dt
end
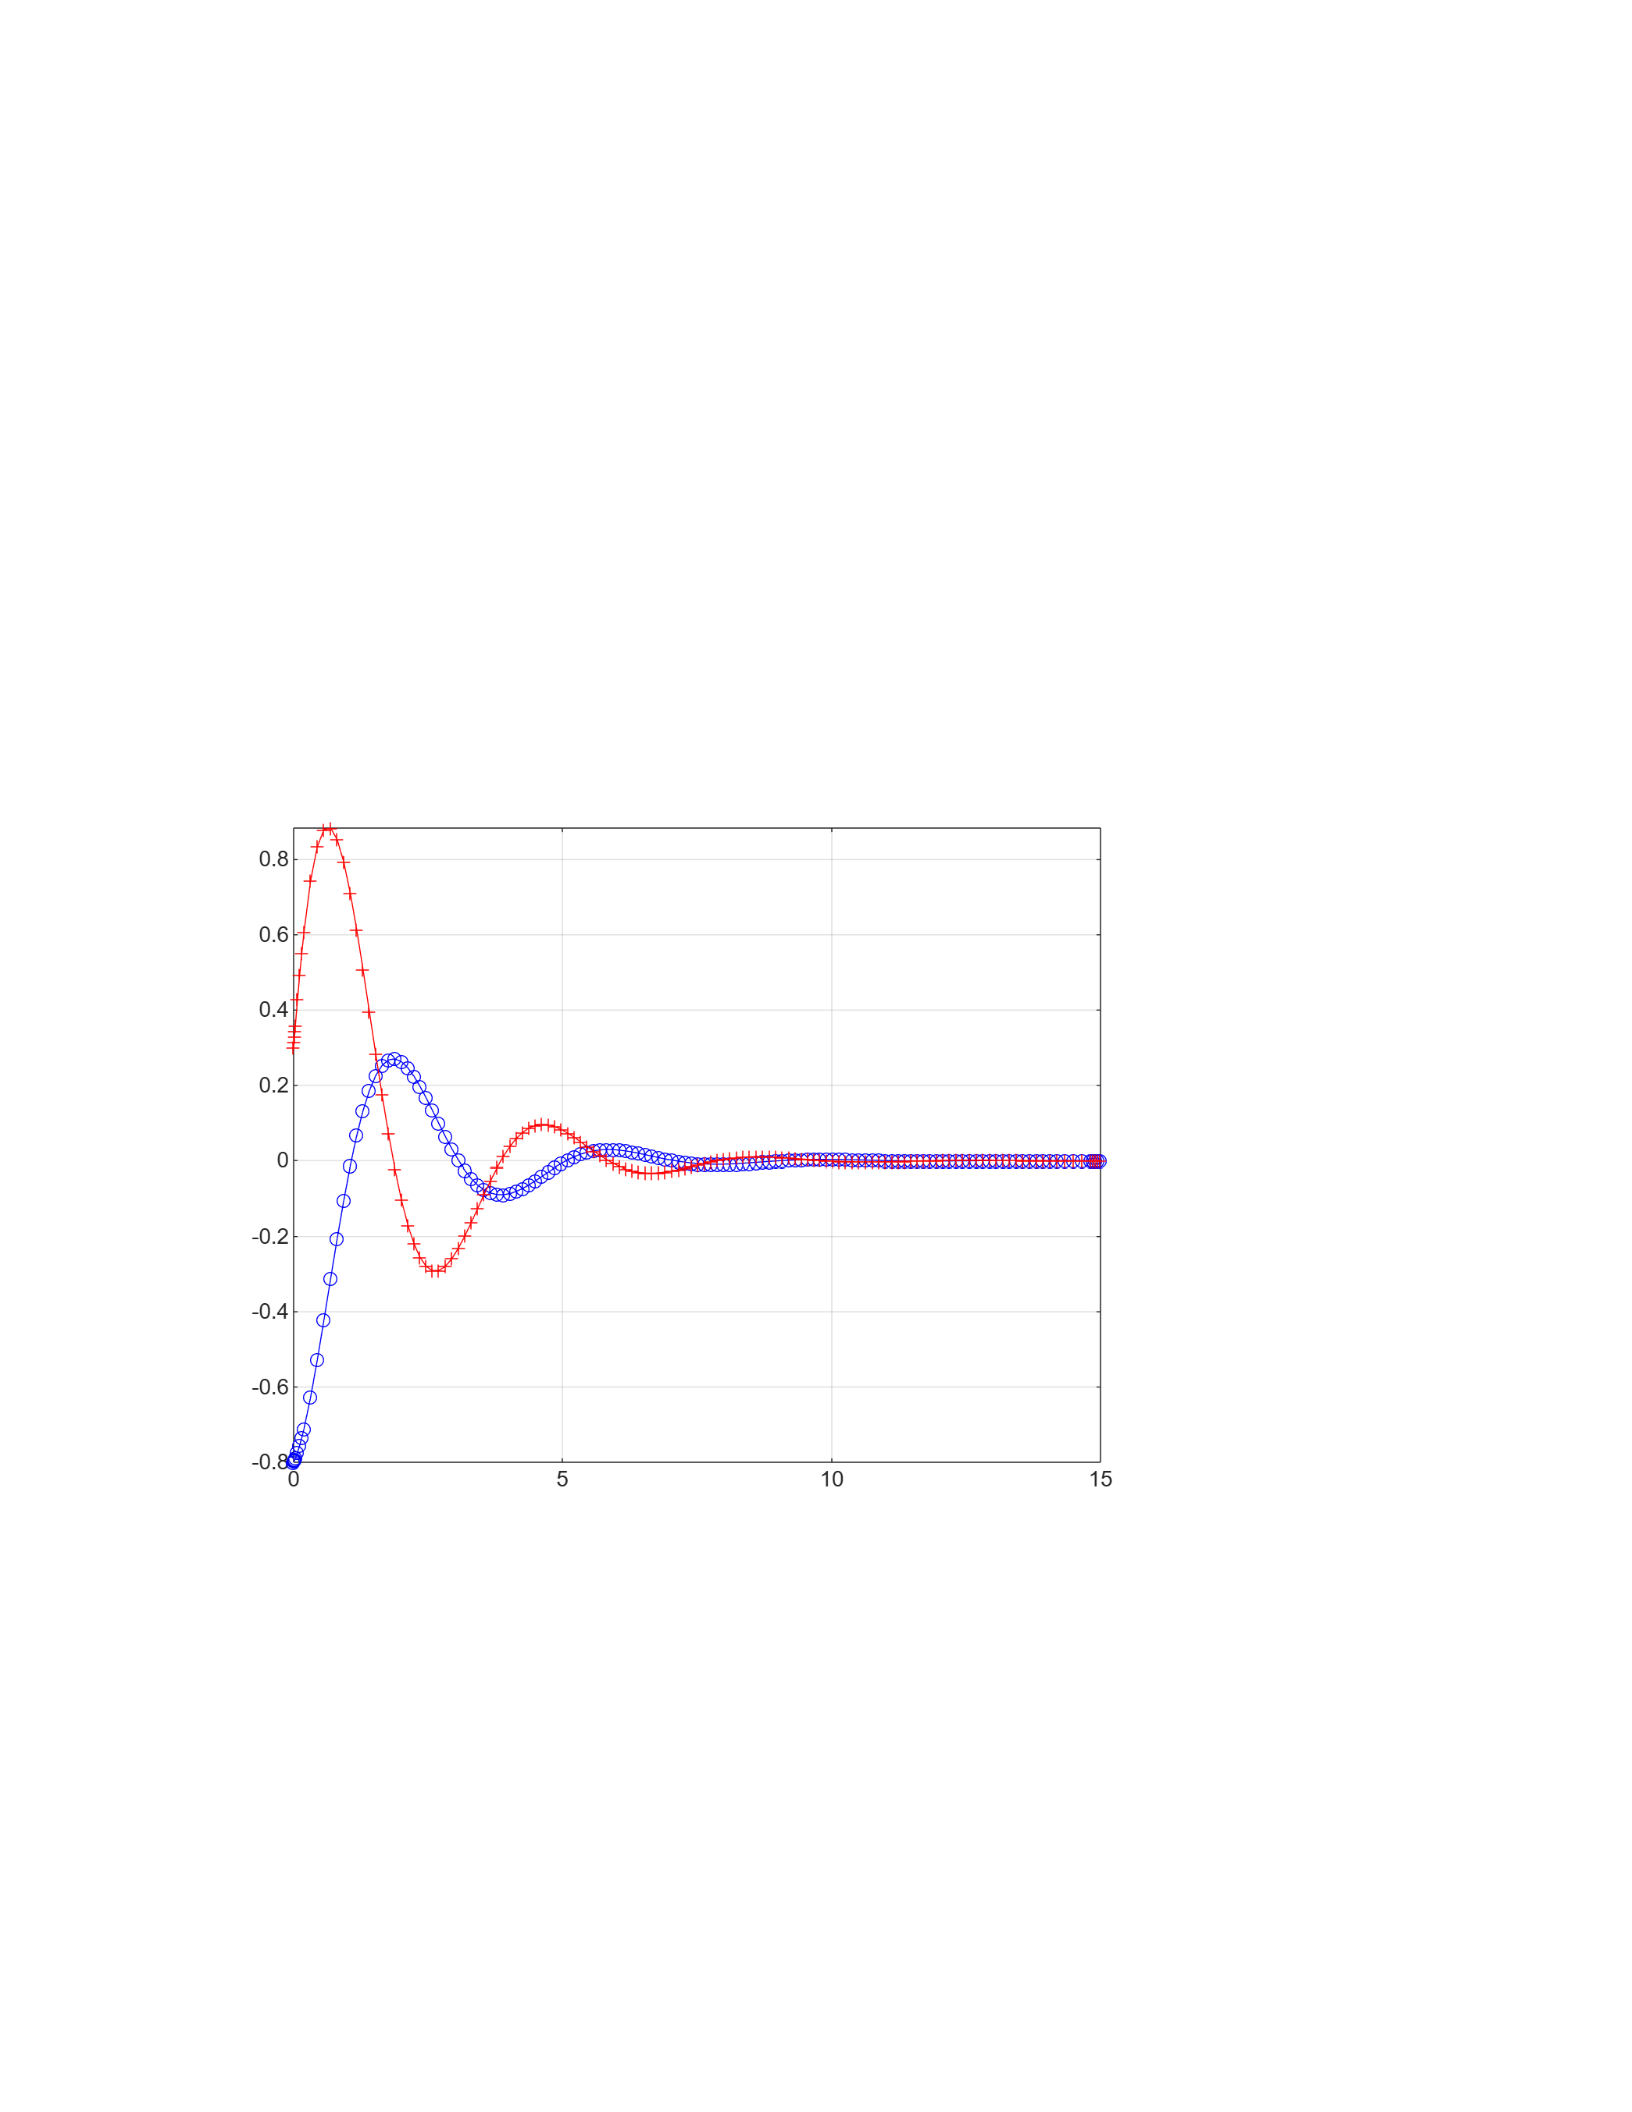
Using the loop provided, I received the value i=45. This loop essentially goes through all of the absolute
values of y and finds any place where they are less than 0.06.
b) The largest magnitude is approximately 0.884 m/s, which is attained approximately at t=0.69.
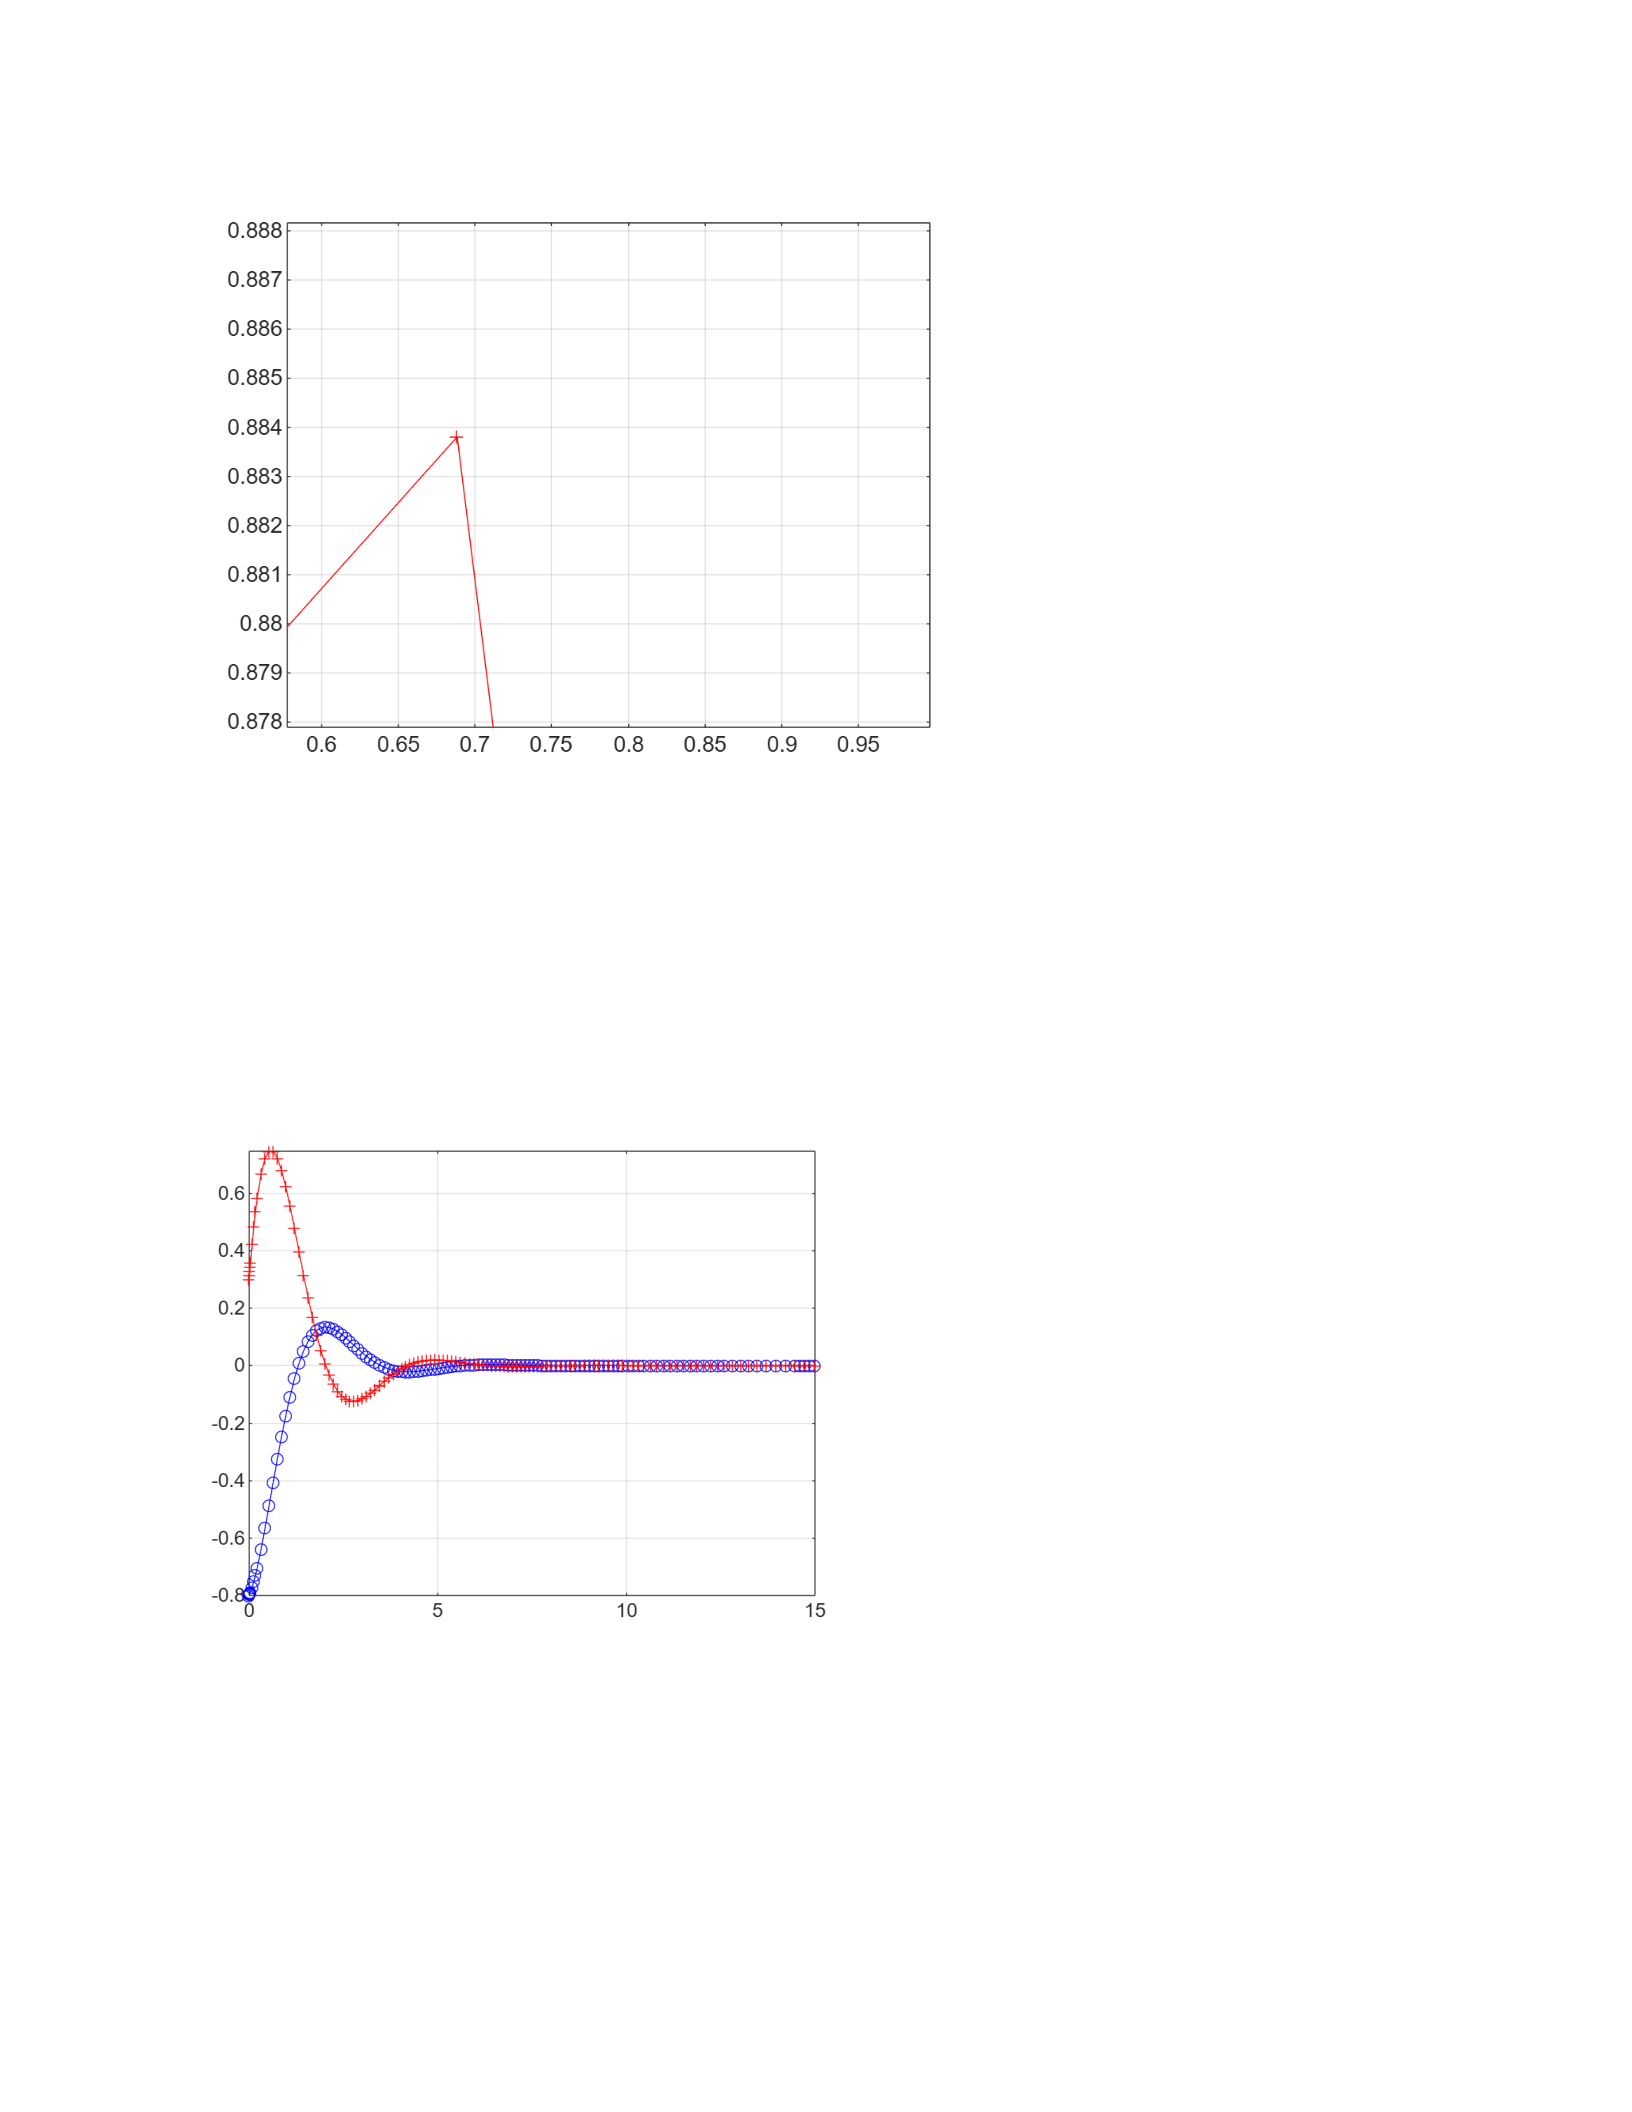
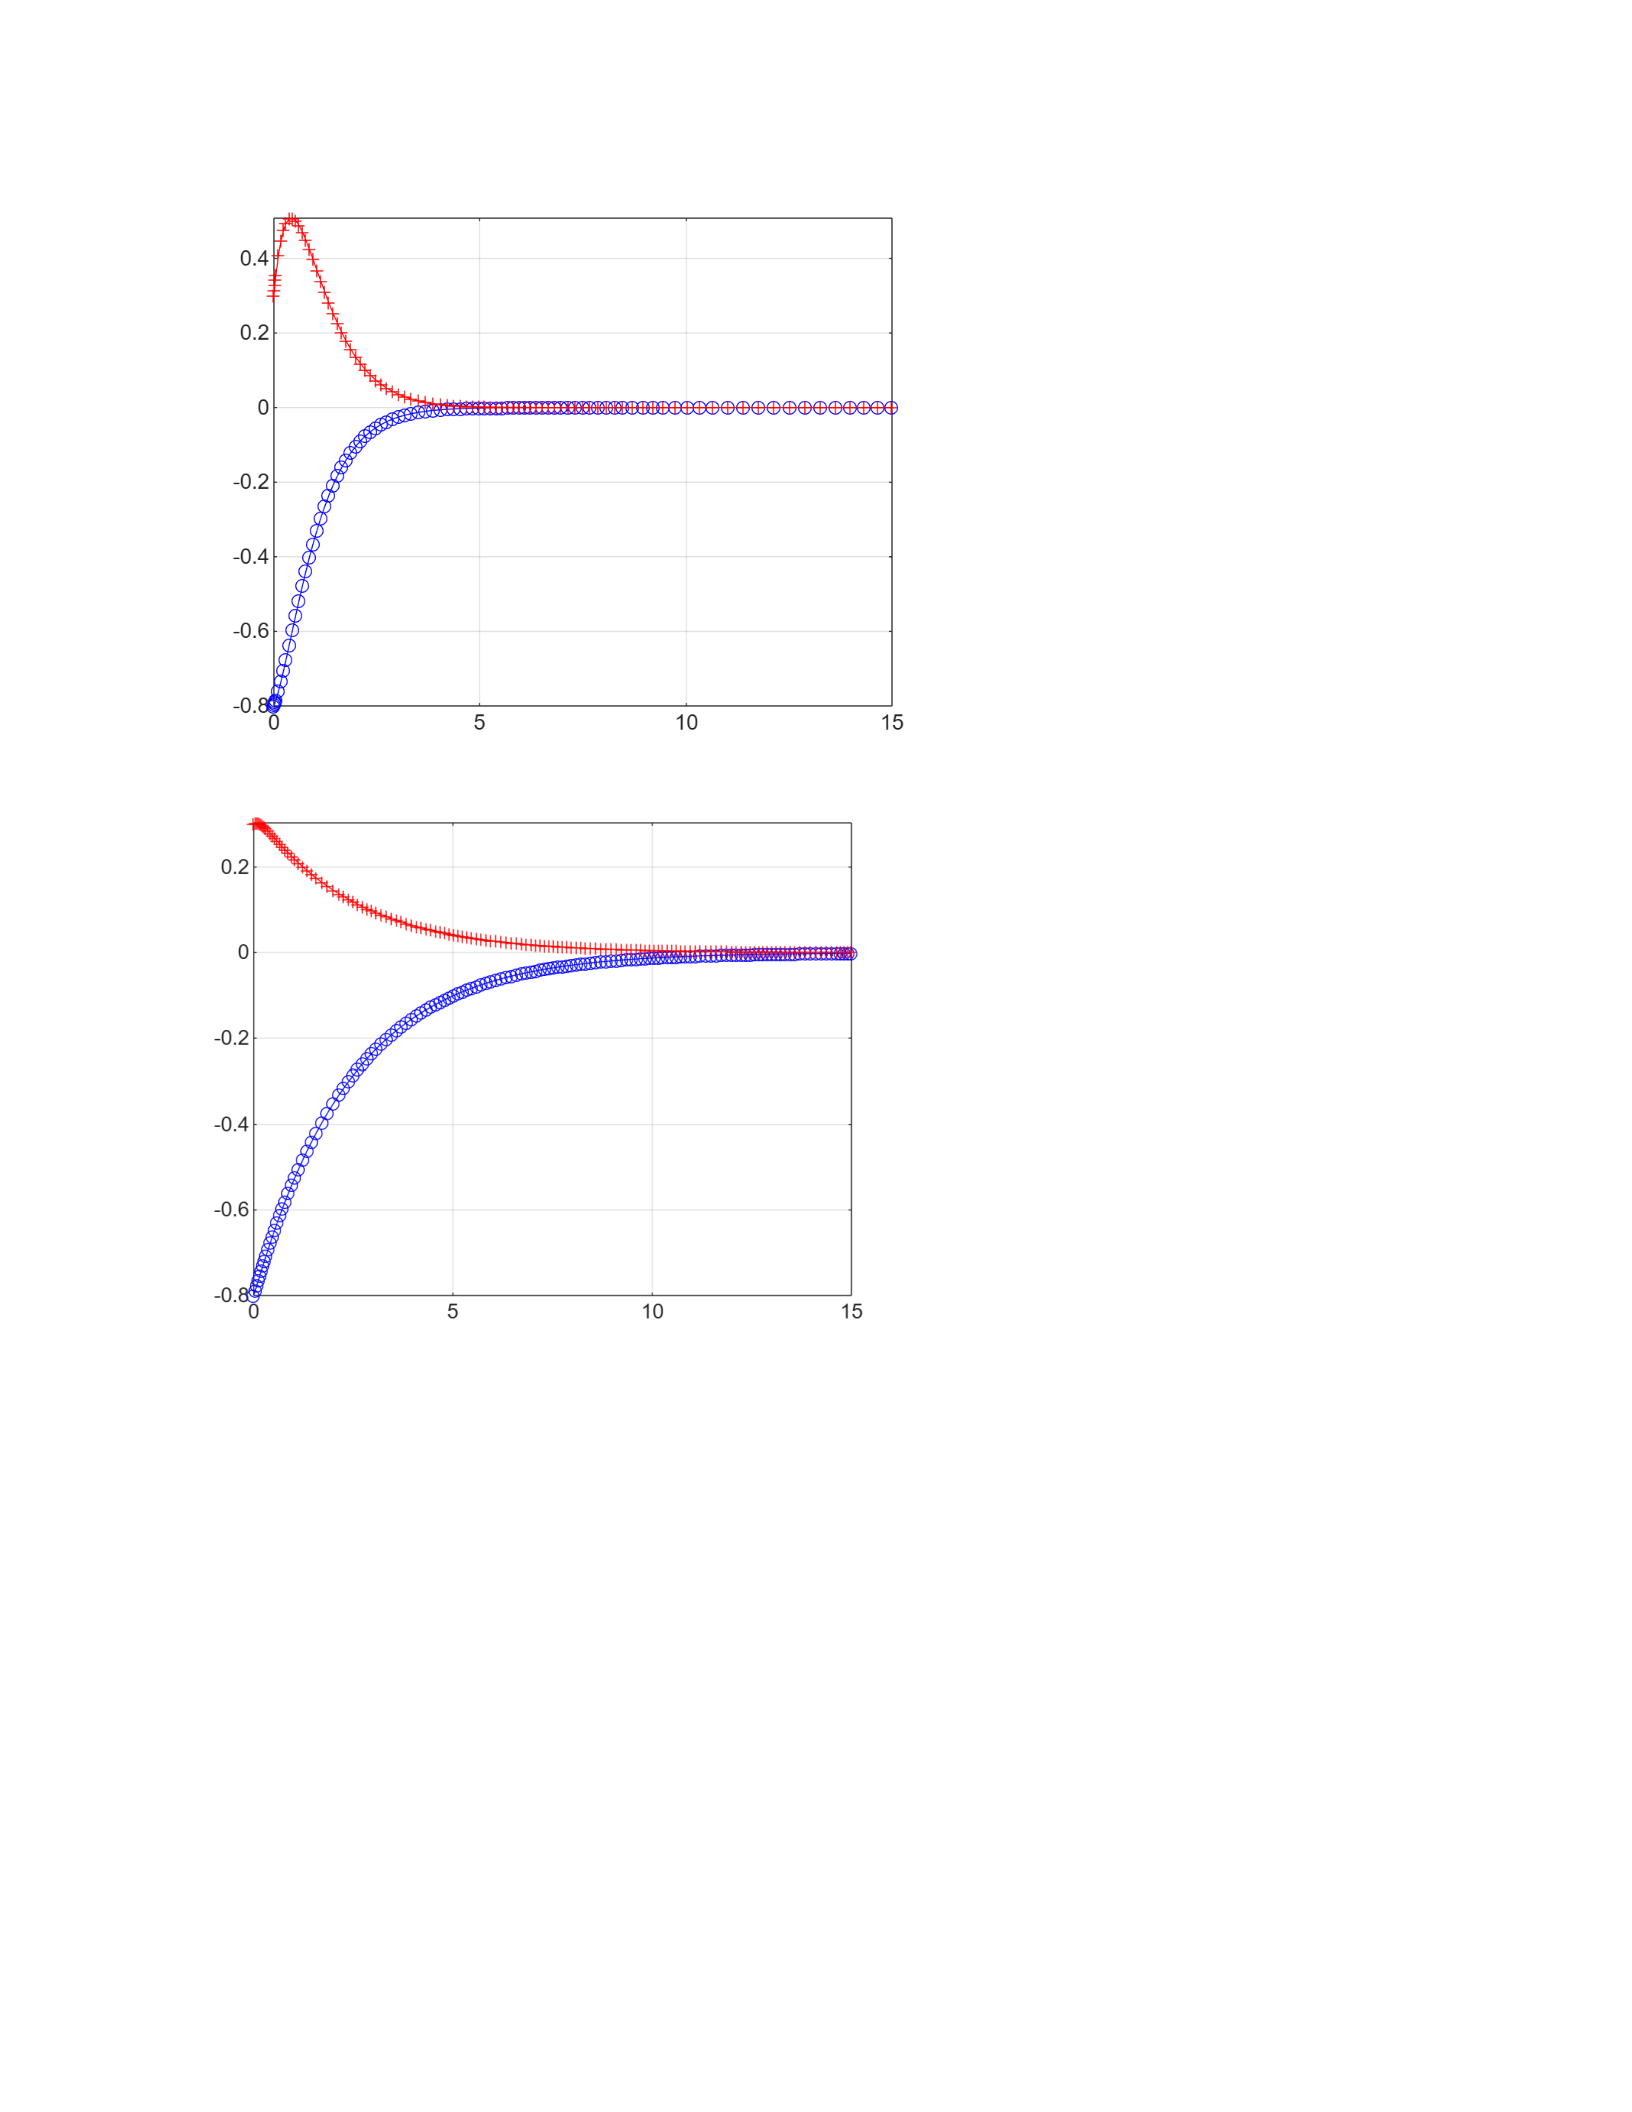
c) The value of c is equal to the damping constant. This means that the higher the value of c, the
longer the graph takes to reach equilibrium.
c=15
c=30
c=64
d) This value is equal to c=30, which is where the solution is critically damped.
This can be found using the damping equation, where my’’ +cy’ +ky=0, meaning that
9y’’+cy’+25y=0.
c^2 - 4(9)(25) =0 is when the solution is critically damped, which is what we are looking for. This
brings us to c^2=900, meaning that c=30. This is also one of the solutions shown in the previous
problem, where there is no oscillation.
Exercise 4
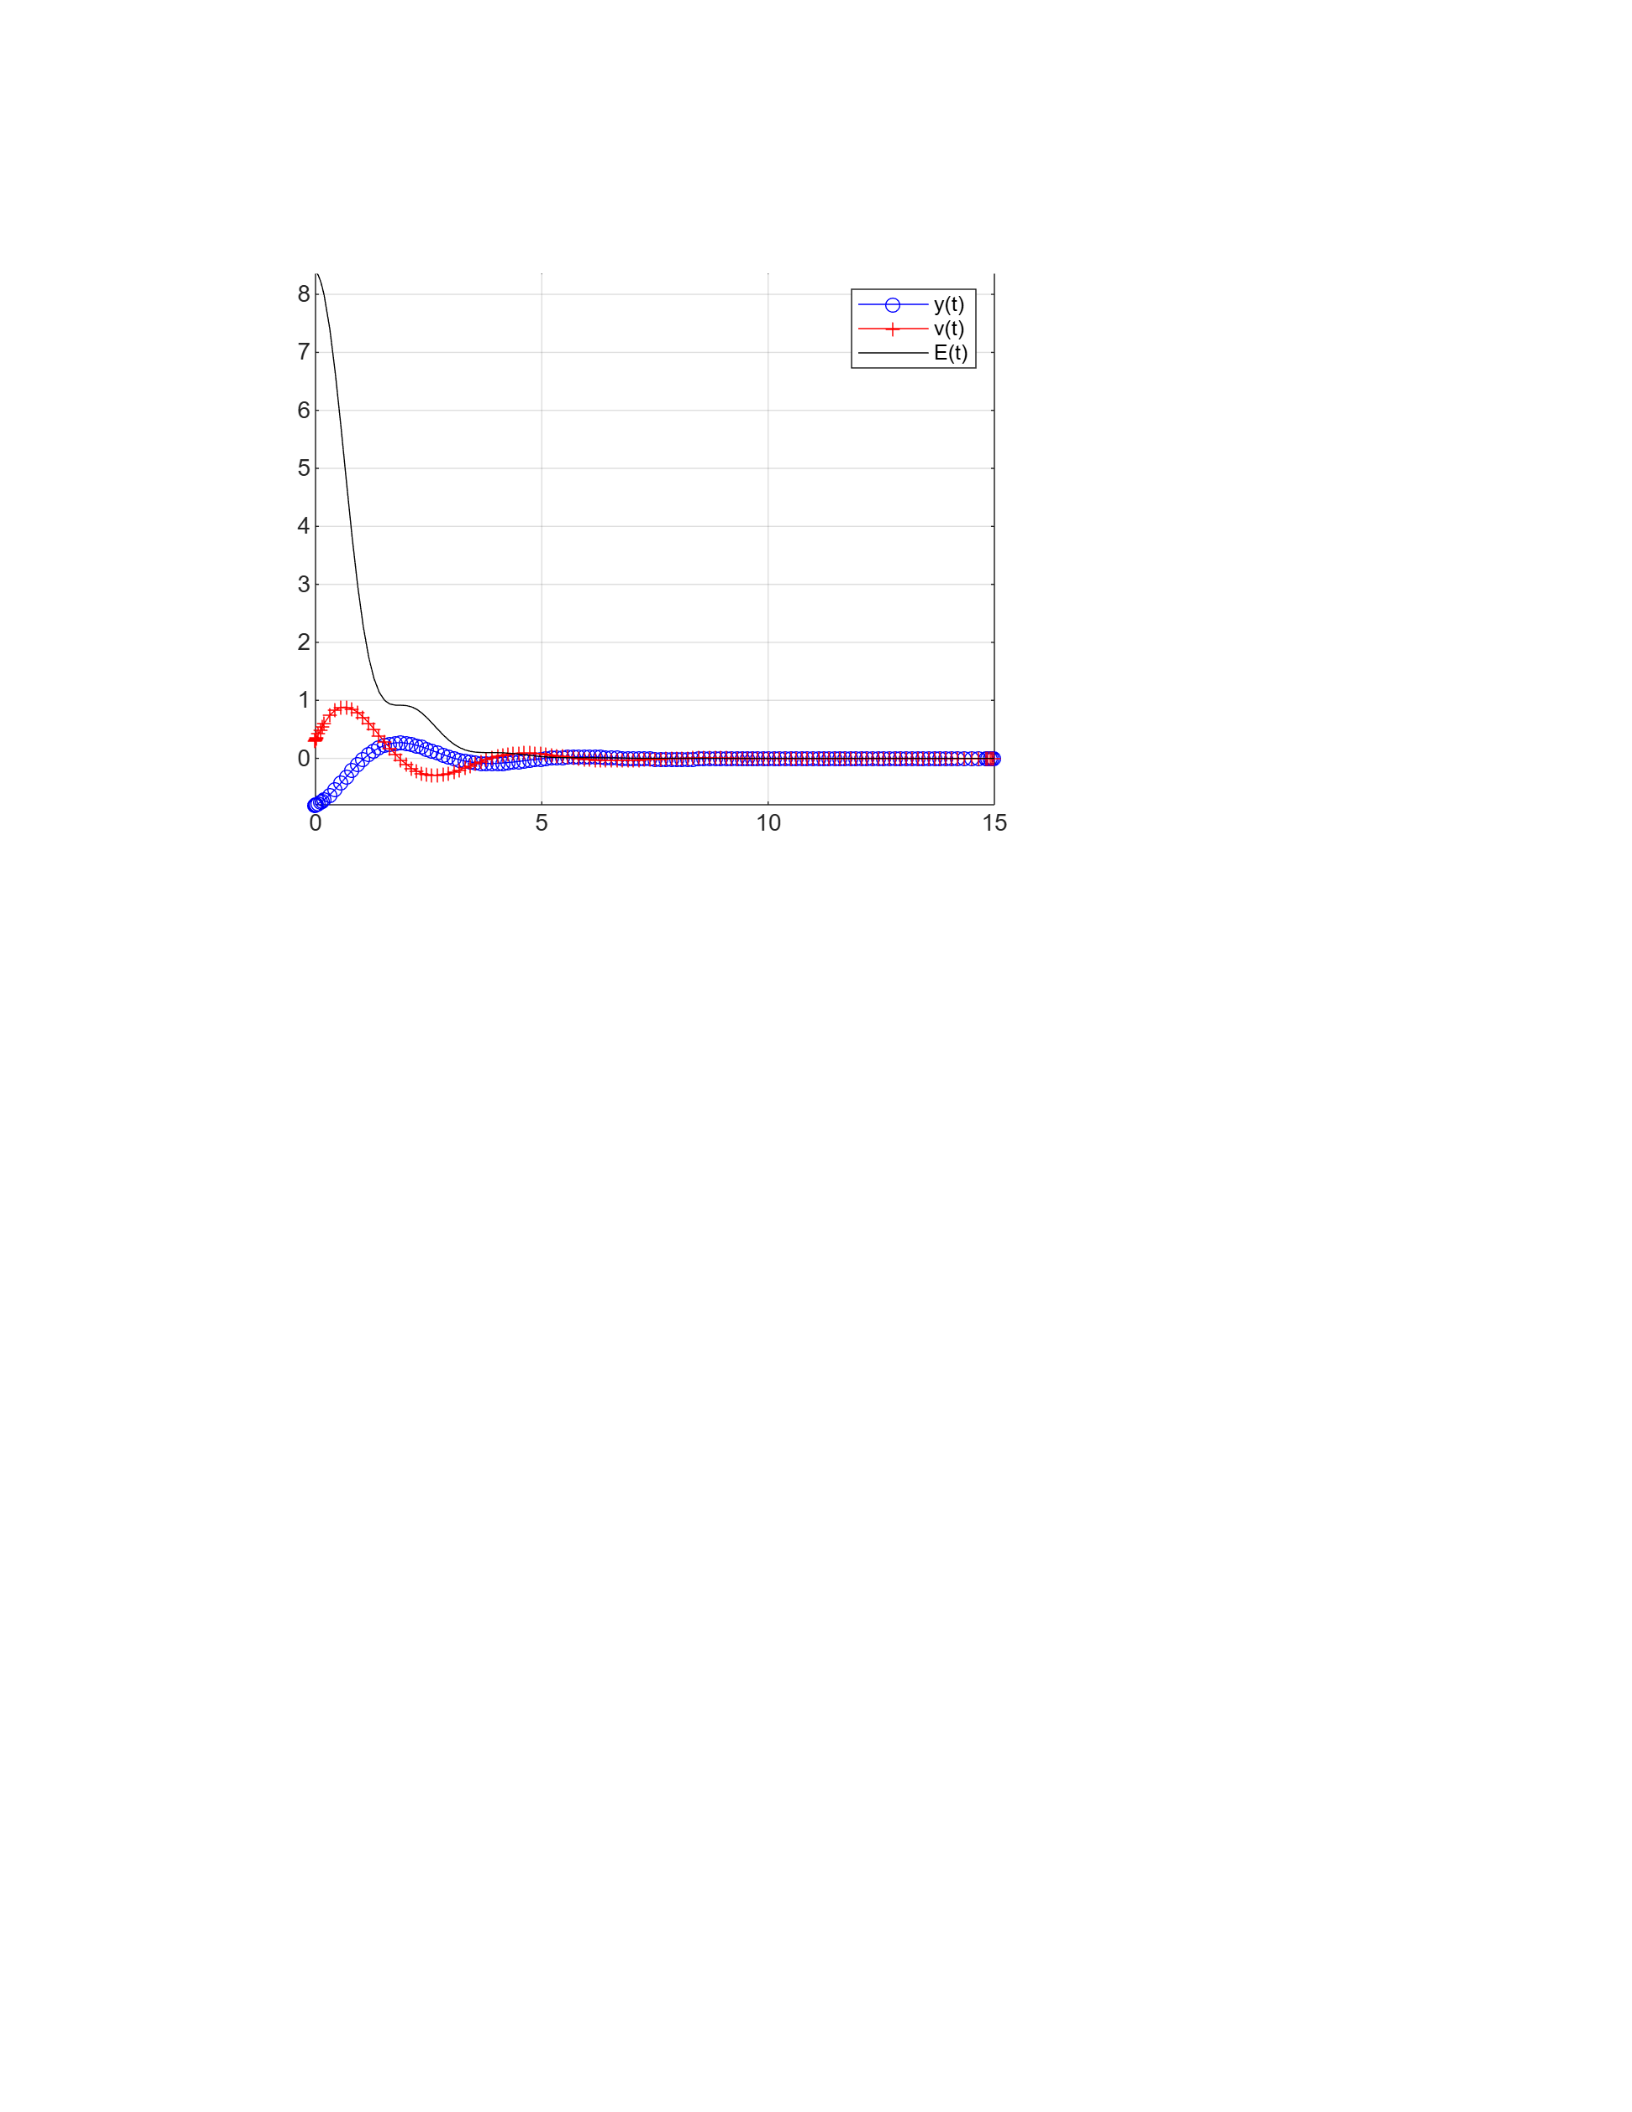
a) The energy is not conserved in this case, because it clearly starts out high but decreases to the
equilibrium level due to the effects of damping.
b) my’’+cy’+ky=0, leading us to -cy’=my’’+ky. This is also equal to m dv/dt = -cv-ky.
dE/dt = d/dt (½ mv^2 +½ ky^2). After substituting v=dy/dt, this equals dE/dt=mv dv/dt +kyv, which is
equal to dE/dt= v(m dv/dt +ky).
When both of the above equations are combined, this gives dE/dt= v (-cv-ky+ky) which is equal to
dE/dt=-cv^2. This means that the sign of c determines whether the system gains or loses energy. If c is
less than zero, the system is positive, which means that E increases over time. Meanwhile, if c is greater
than zero, the system is negative, indicating the opposite.
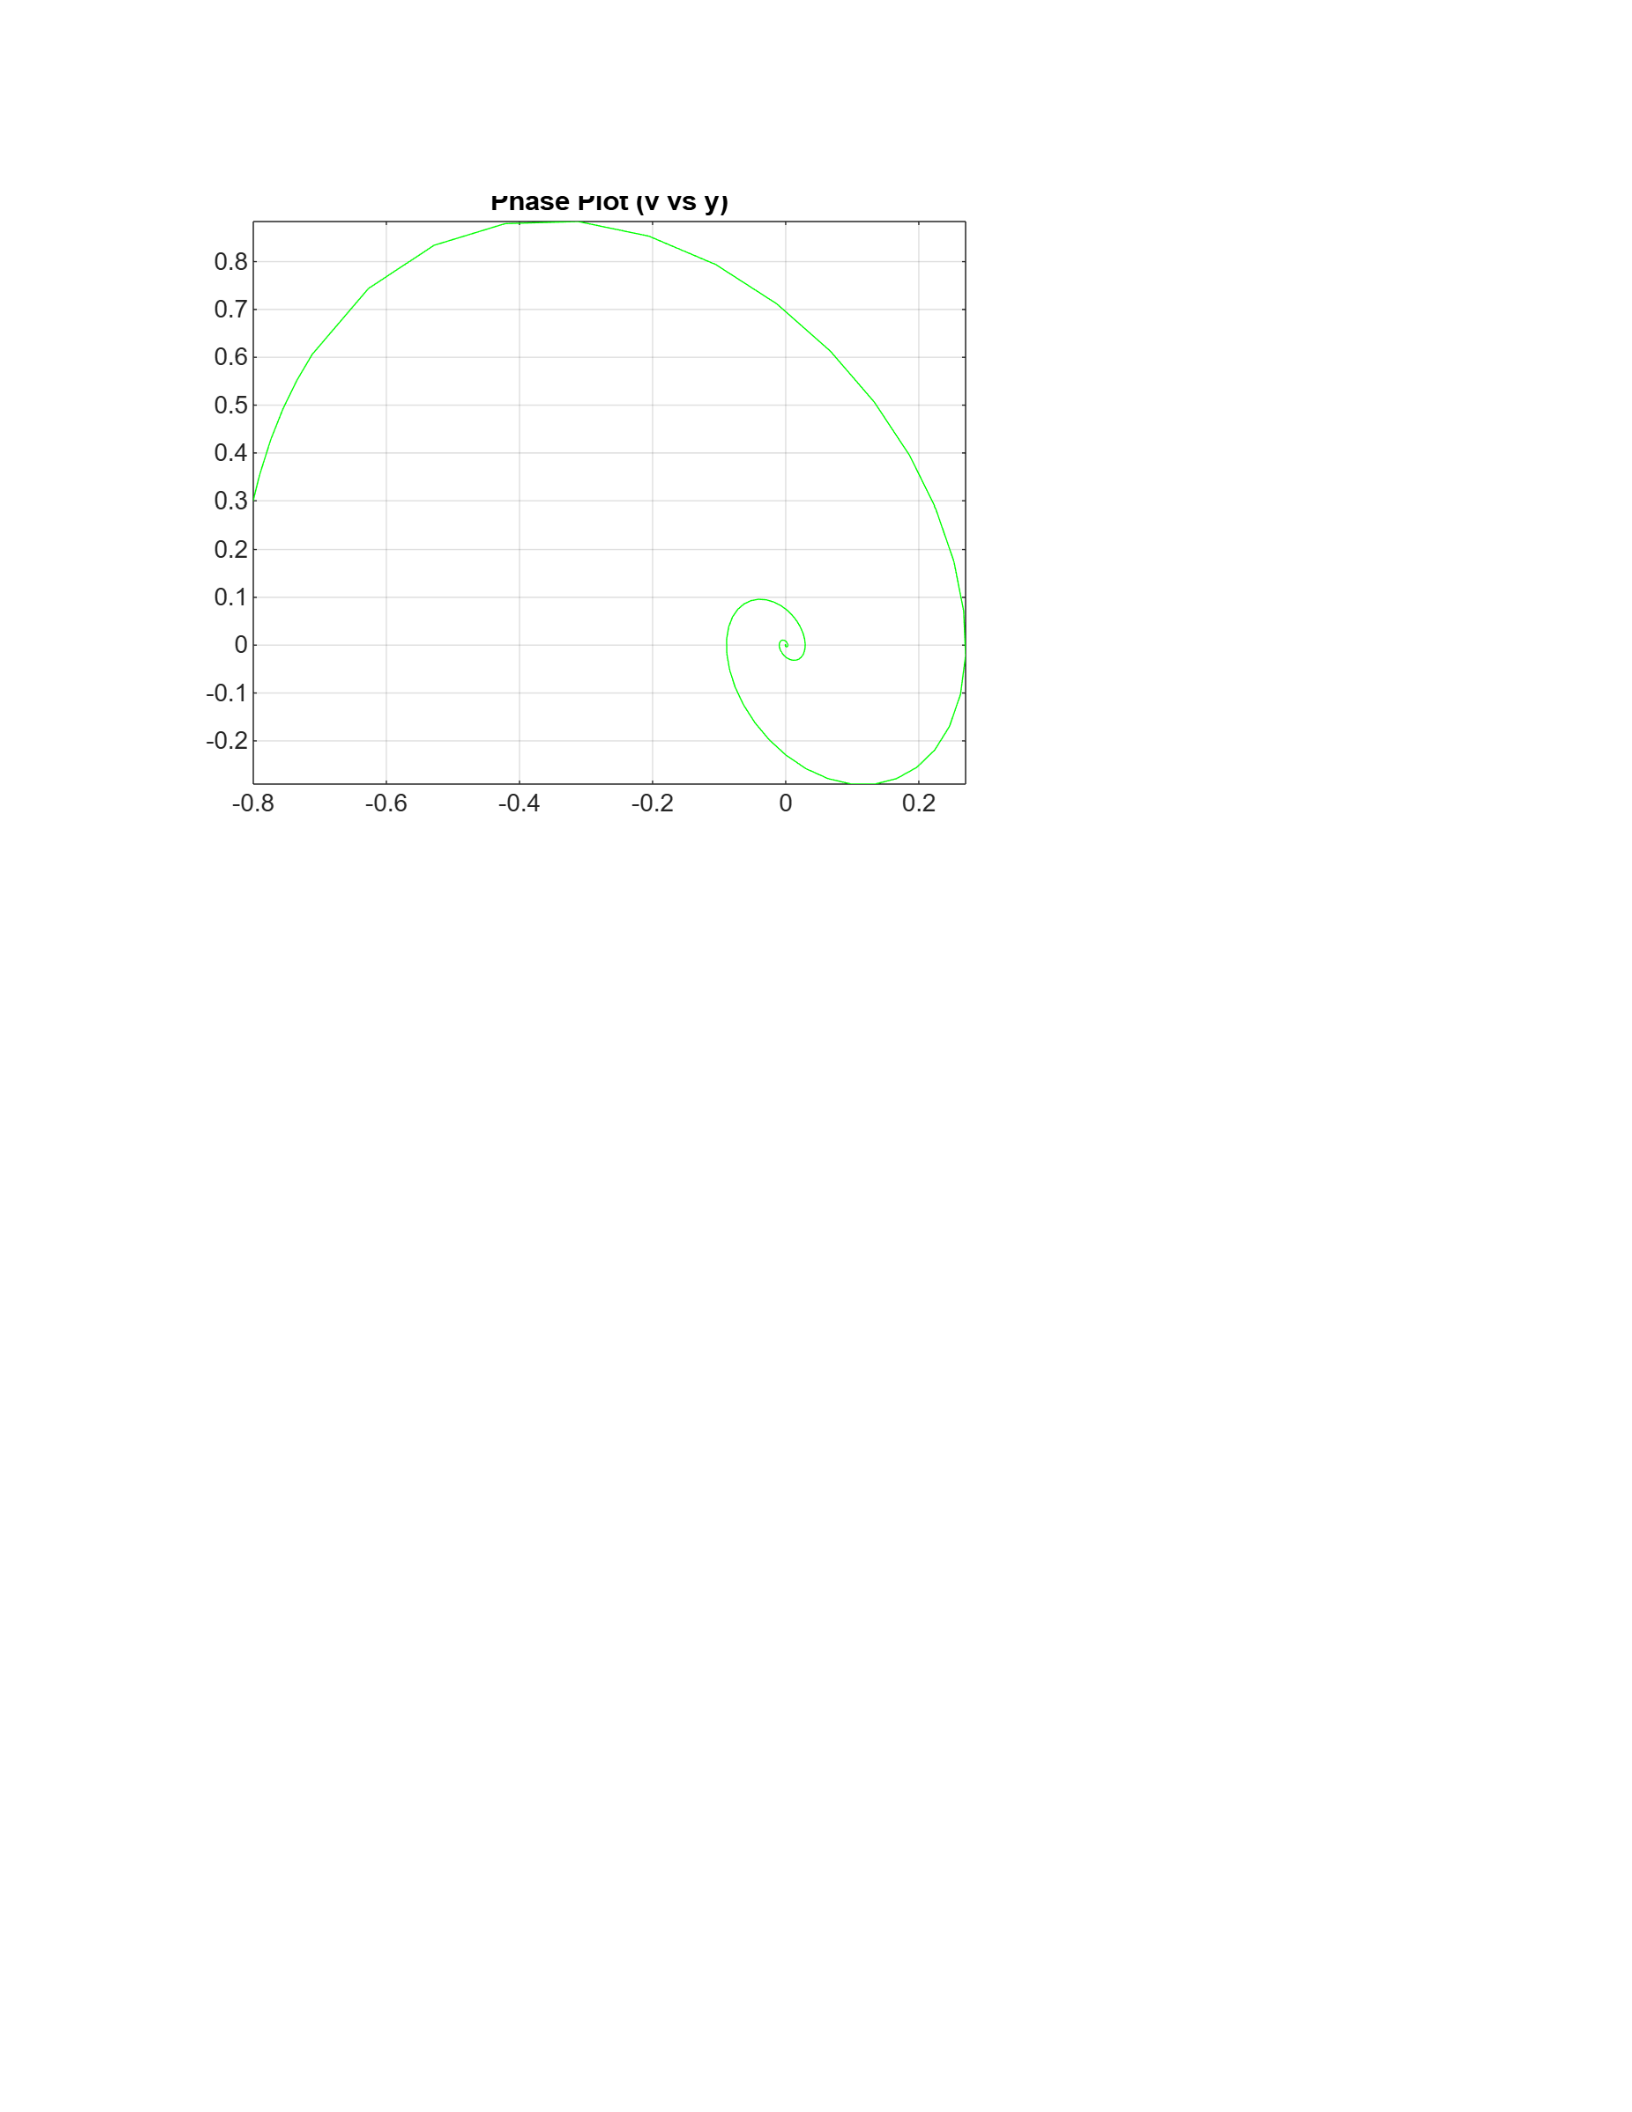
c) This graph is a sort of spiral, and does eventually reach the origin. This is because the system is
damped, meaning that it cannot continue to oscillate indefinitely and will at some point come to a
stop.
rnase
PIOT
(V
VS
y)
0.8
0.7
0.6
0.5
0.4
0.3
0.2
0.1
-0.1
-0.2
0.2

