


1
Spring 2019
Assignment Section 2.5 Population Dynamics
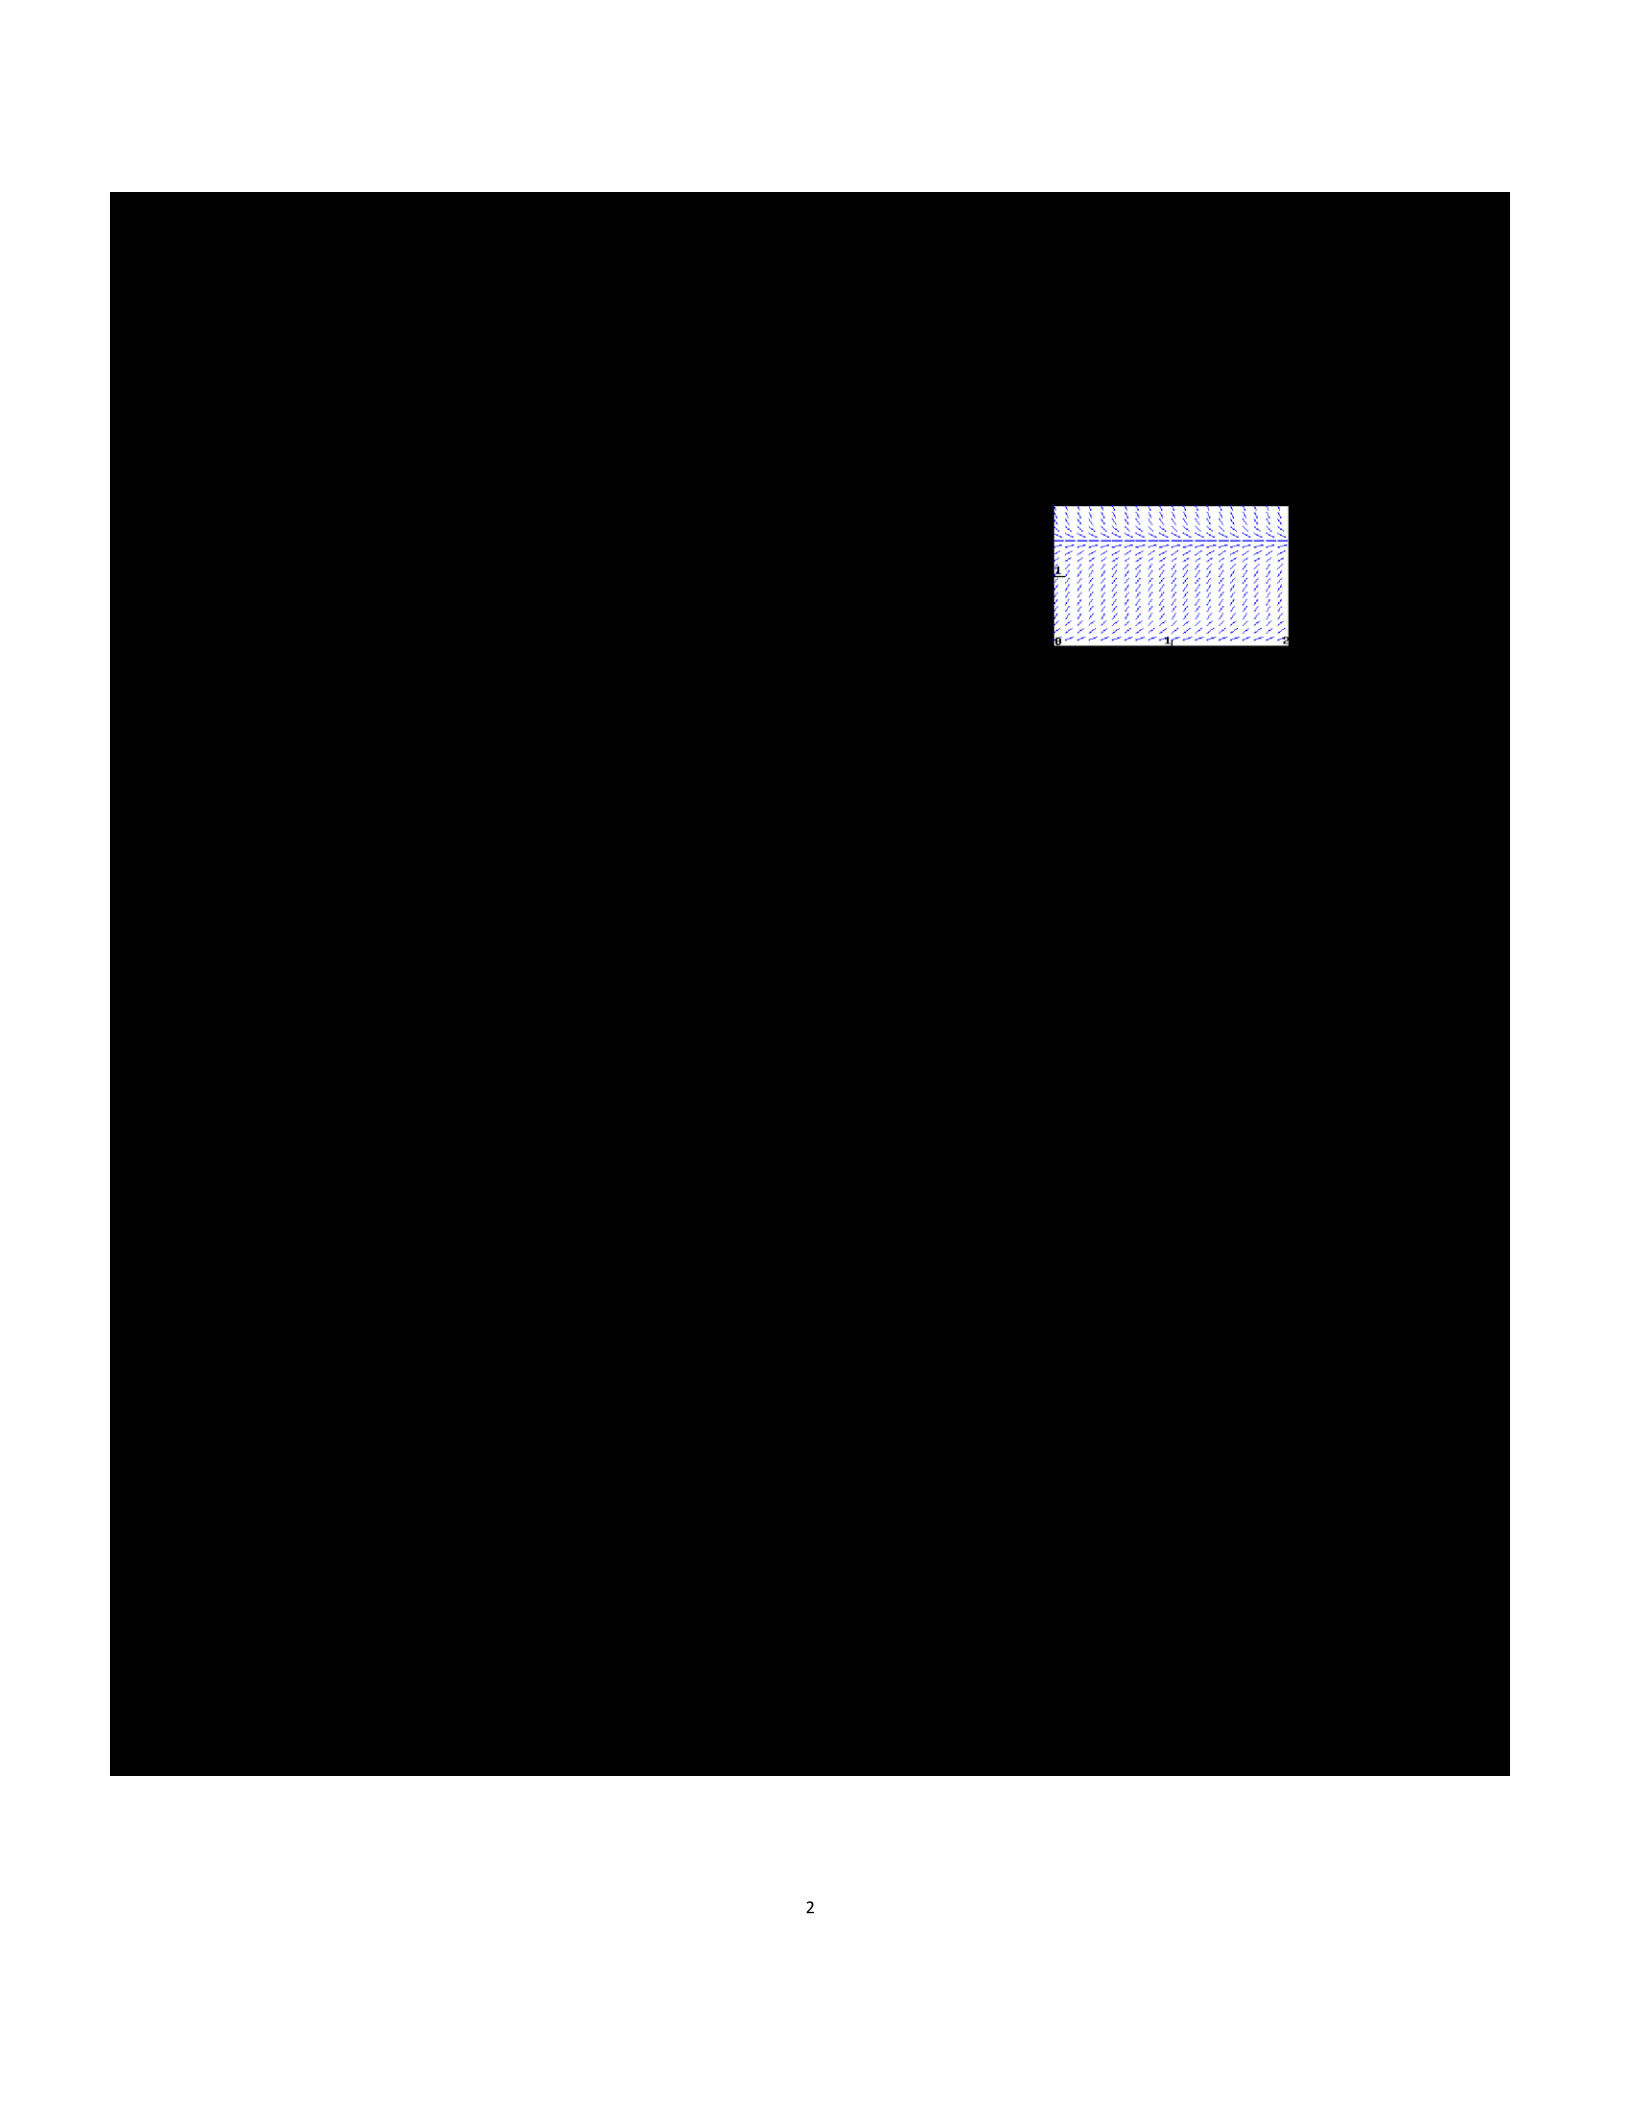
1.
(1
point)
Use
the
applet
provided
to
draw
a
phase
line
for
dy_»
O=y-16.
dx
»
A
graph
appears
here
in
the
html
version.
Answer(s)
submitted:
e
sink,-4,source,
4
(correct)
Correct
Answers:
e
sink,
-4,
source,
4
d
2.
(1
point)
Consider
the
equation
>
=(1
+y)?
(a)
Sketch
the
phase
line.
A
graph
appears
here
in
the
html
version.
(b)
What
happens
to
solutions
with
initial
conditions
y(0)
>
—1
as
t
increases?
e?
tends
to
zero
e
tends
to
equilibrium
©
grows
without
bound
e
decreases
without
bound
If
you
entered
’tends
to
equilibrium’,
what
is
the
value
of
the
equilibrium?
Enter
’NA’
if
you
chose
another
answer.
The
equi-
librium
point
is
.
(c)
Describe
the
behavior
of
solutions
with
initial
conditions
y(0)
<
—1
as
increases.
0?
tends
to
zero
e
tends
to
equilibrium
©
grows
without
bound
e
decreases
without
bound
If
you
entered
’tends
to
equilibrium’,
what
is
the
value
of
the
equilibrium?
Enter
’NA’
if
you
chose
another
answer.
The
equi-
librium
point
is
Answer(s)
submitted:
node,
-1
grows
without
bound
NA
tends
to
equilibrium
-1
(correct)
Correct
Answers:
node,
-1
grows
without
bound
NA
tends
to
equilibrium
-1
3.
(1
point)
The
slope
field
for
a
population
P
modeled
by
dP/dt
=
6P
—
4P?
is
shown
in
the
figure
below.
(a)
On
a
print-out
of
the
slope
field,
sketch
three
non-zero
solution
curves
showing
different
types
of behavior
for
the
pop-
ulation
P.
Give
an
initial
condition
that will
produce
each:
P(0)
=
__,
P(0)
=
,
and
P(0)
=____..
(b)
Is
there
a
stable
value
of
the
population?
If
so,
give
the
value;
if
not,
enter
none:
Stable
value
=
(c)
Considering
the
shape
of
solutions
for
the
population,
give
any
intervals
for
which
the
following
are
true.
If
no
such
interval
exists,
enter
none,
and
if
there
are
multiple
intervals,
give
them
as
a
list.
(Thus,
if
solutions
are
increasing
when
P
is
between
I
and
3,
enter
(1,3)
for
that
answer;
if
they
are
de-
creasing
when
P
is
between
1
and
2
or
between
3
and
4,
enter
(1,2),(3,4).
Note
that
your
answers
may
reflect
the
fact
that
P
is
a
population.)
P
is
increasing
when
is
in
P
is
decreasing
when
P
is
in
Think
about
what
these
conditions
mean
for
the
population,
and
be
sure
that
you
are
able
to
explain
that.
In
the
long-run,
what
is
the
most
likely
outcome
for
the
pop-
ulation?
Po
(Enter
infinity
if
the
population
grows
without
bound.)
Are
there
any
inflection
points
in
the
solutions
for
the
popu-
lation?
If
so,
give
them
as
a comma-separated
list
(e.g.,
1,3);
if
not,
enter
none.
Inflection
points
are
at
P=
—___
Be
sure
you
can
explain
what
the
meaning
of
the
inflection
points
is
for the
population.
(d)
Sketch
a
graph
of
dP/dt
against
P.
Use
your
graph
to
answer
the
following
questions.
When
is
dP/dt
positive?
When
P
is
in
2
TARA)
VAASaAsasnsnnkt
VAAN
AAA
AAAS
b
WANA
AAAS
YL
HAASASASASANS
4
VASSAR
4b
VASSAR
AAAS
WAsnsnnnsnrvih
3
When is dP/dt negative?
4
When P is in
(Give your answers as intervals or a list of intervals.) When
is dP/dt zero?
When P =
(If there is more than one answer, give a list of answers, e.g.,
1,2.)
When is dP/dt at a maximum? When
P =
Be sure that you can see how the shape of your graph of
dP/dt explains the shape of solution curves to the differential
equation.
Solution:
SOLUTION
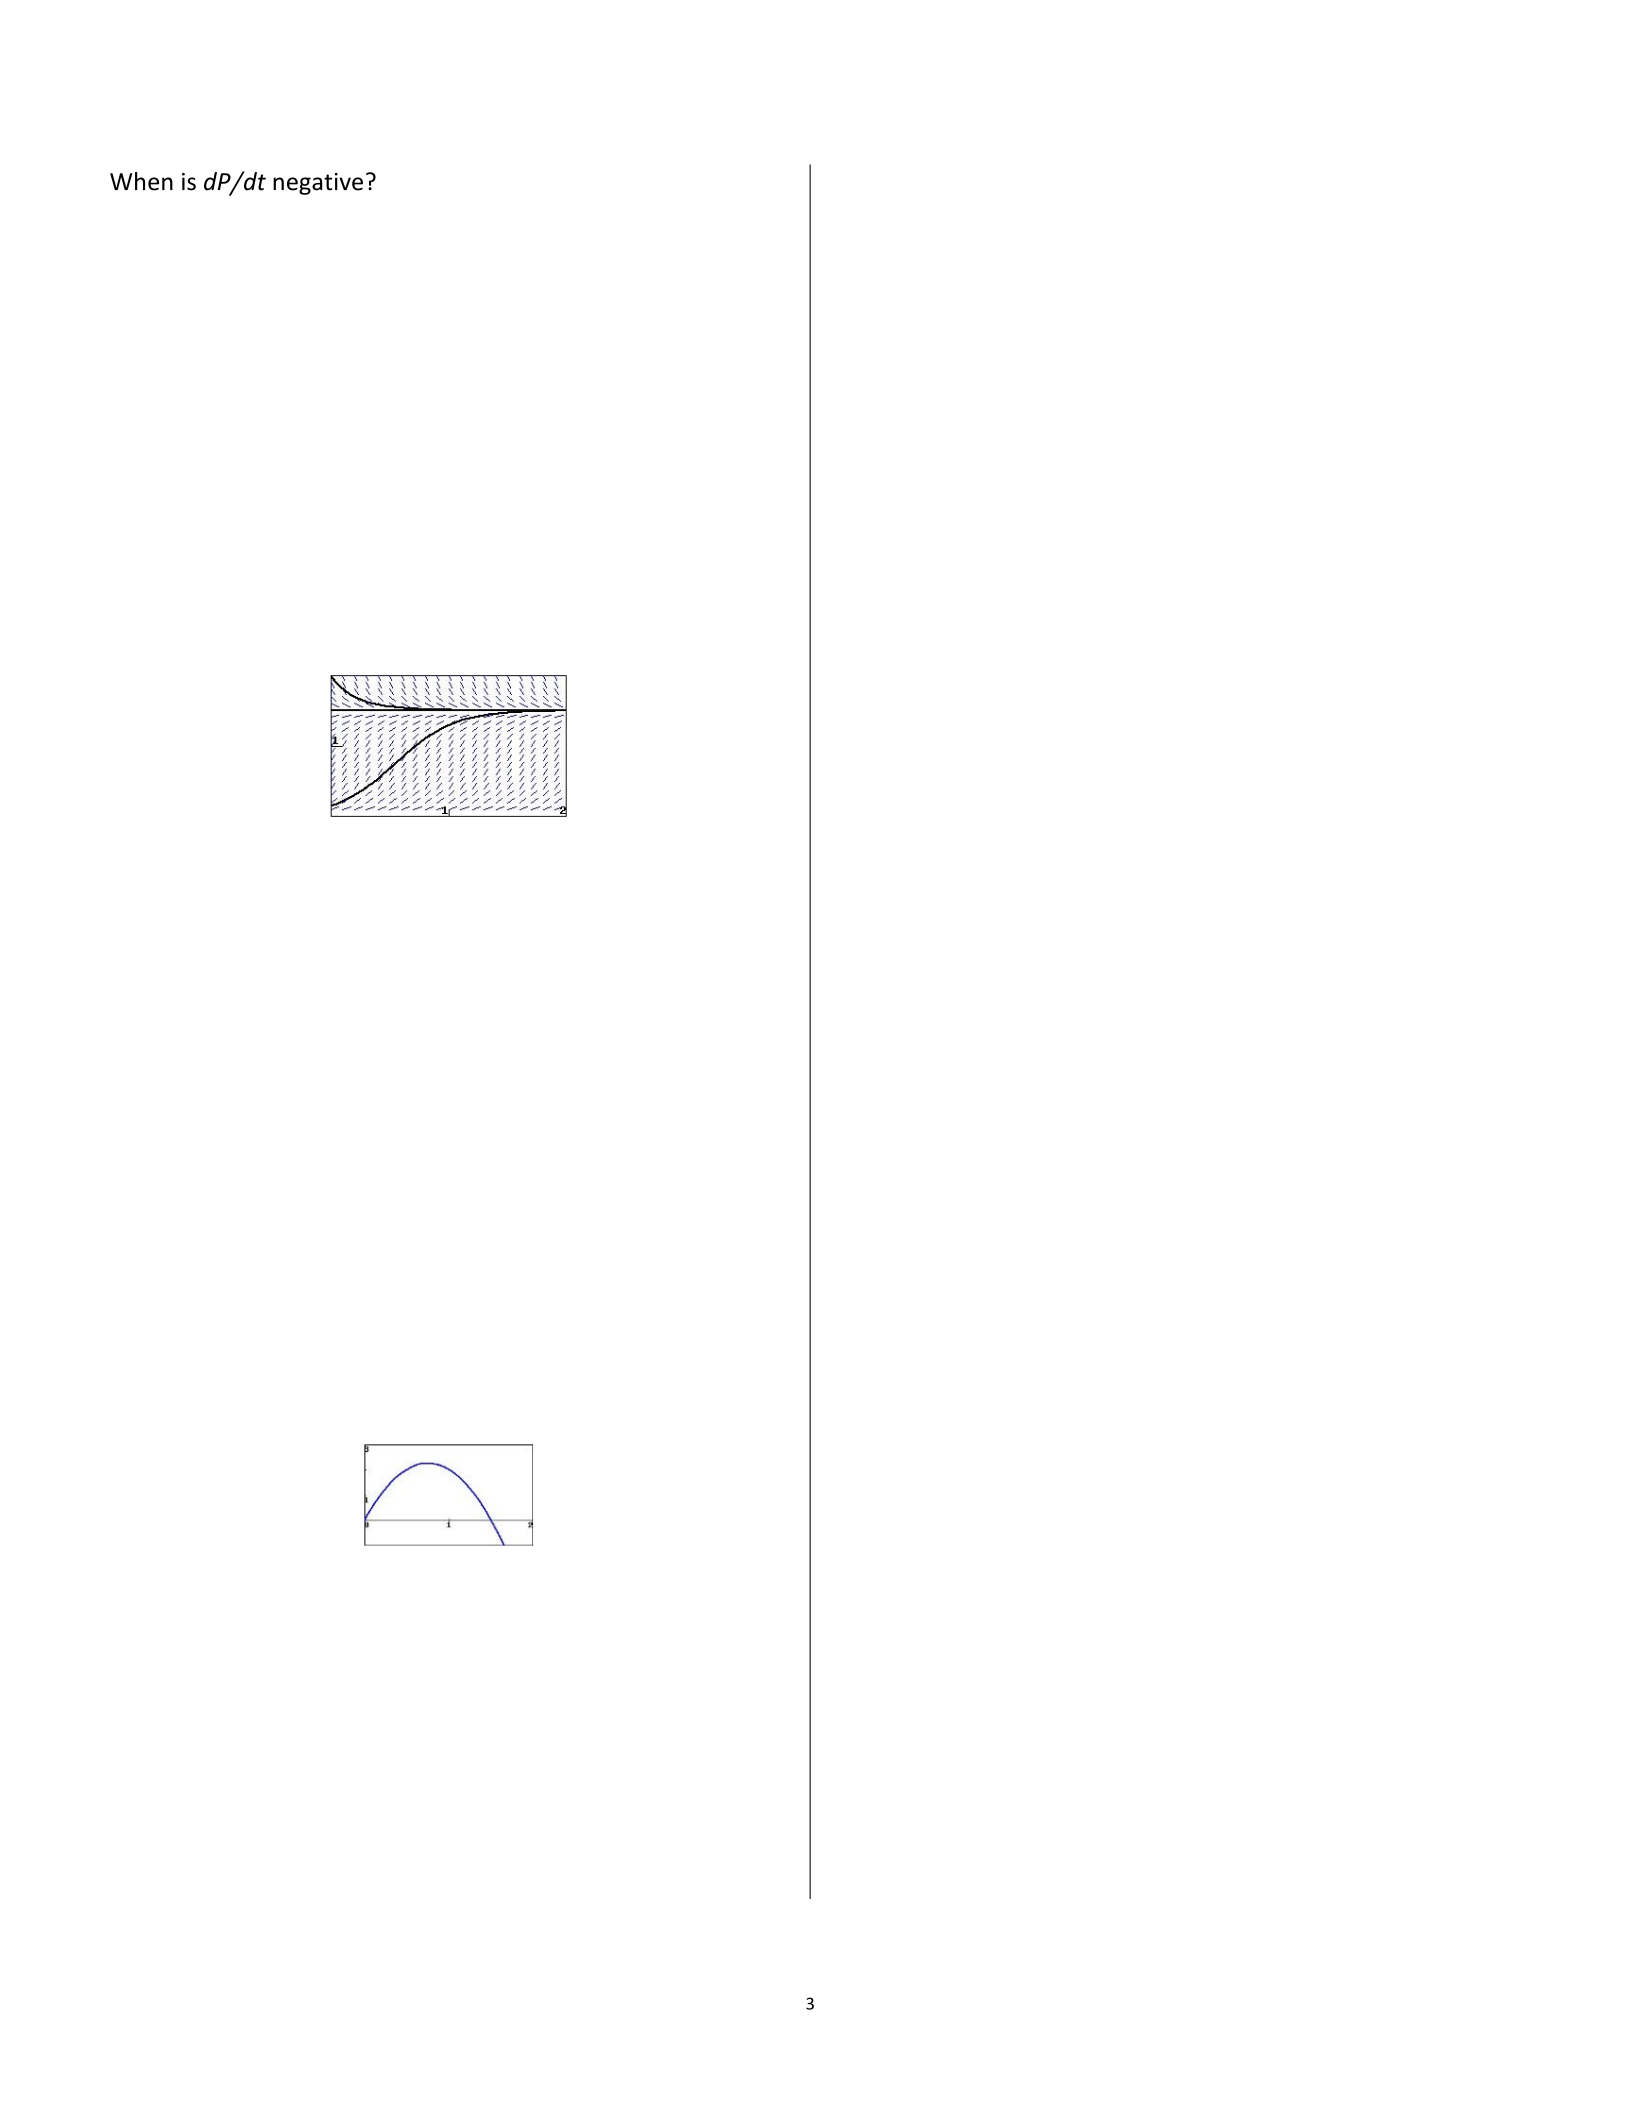
A graph of the slope field with some solutions added is
Thus we get different solution behaviors for the initial
conditions P(0)= 1.5, P(0) > 1.5, and 0 < P(0) < 1.5. The initial
condition P(0) = 0 gives the zero solution, which is an
equilibrium and has the same behavior as the initial condition
P(0)= 1.5. Note that we can also say that the behavior for initial
conditions 0 < P(0) < 0.75 is different from that for initial
conditions 0.75 ≤ P(0) < 1.5, because the former will be
sigmoidal while the latter are strictly exponential.
From the solutions graphed above, or by looking at the slope
field, we can see that the equilibrium solution P = 1.5 is stable.
The other equilibrium solution, P = 0 is unstable.
Also by looking at the solution curves, we can see that P is
increasing when 0 < P < 1.5 and decreasing when P > 1.5. In the
long run, we’re most likely to start with a non-zero population
and thus P→1.5. The solution curves with initial populations of
less than P = 0.75 have inflection points at P = 0.75. (This will
be demonstrated algebraically below.) At the inflection point,
the population is growing fastest.
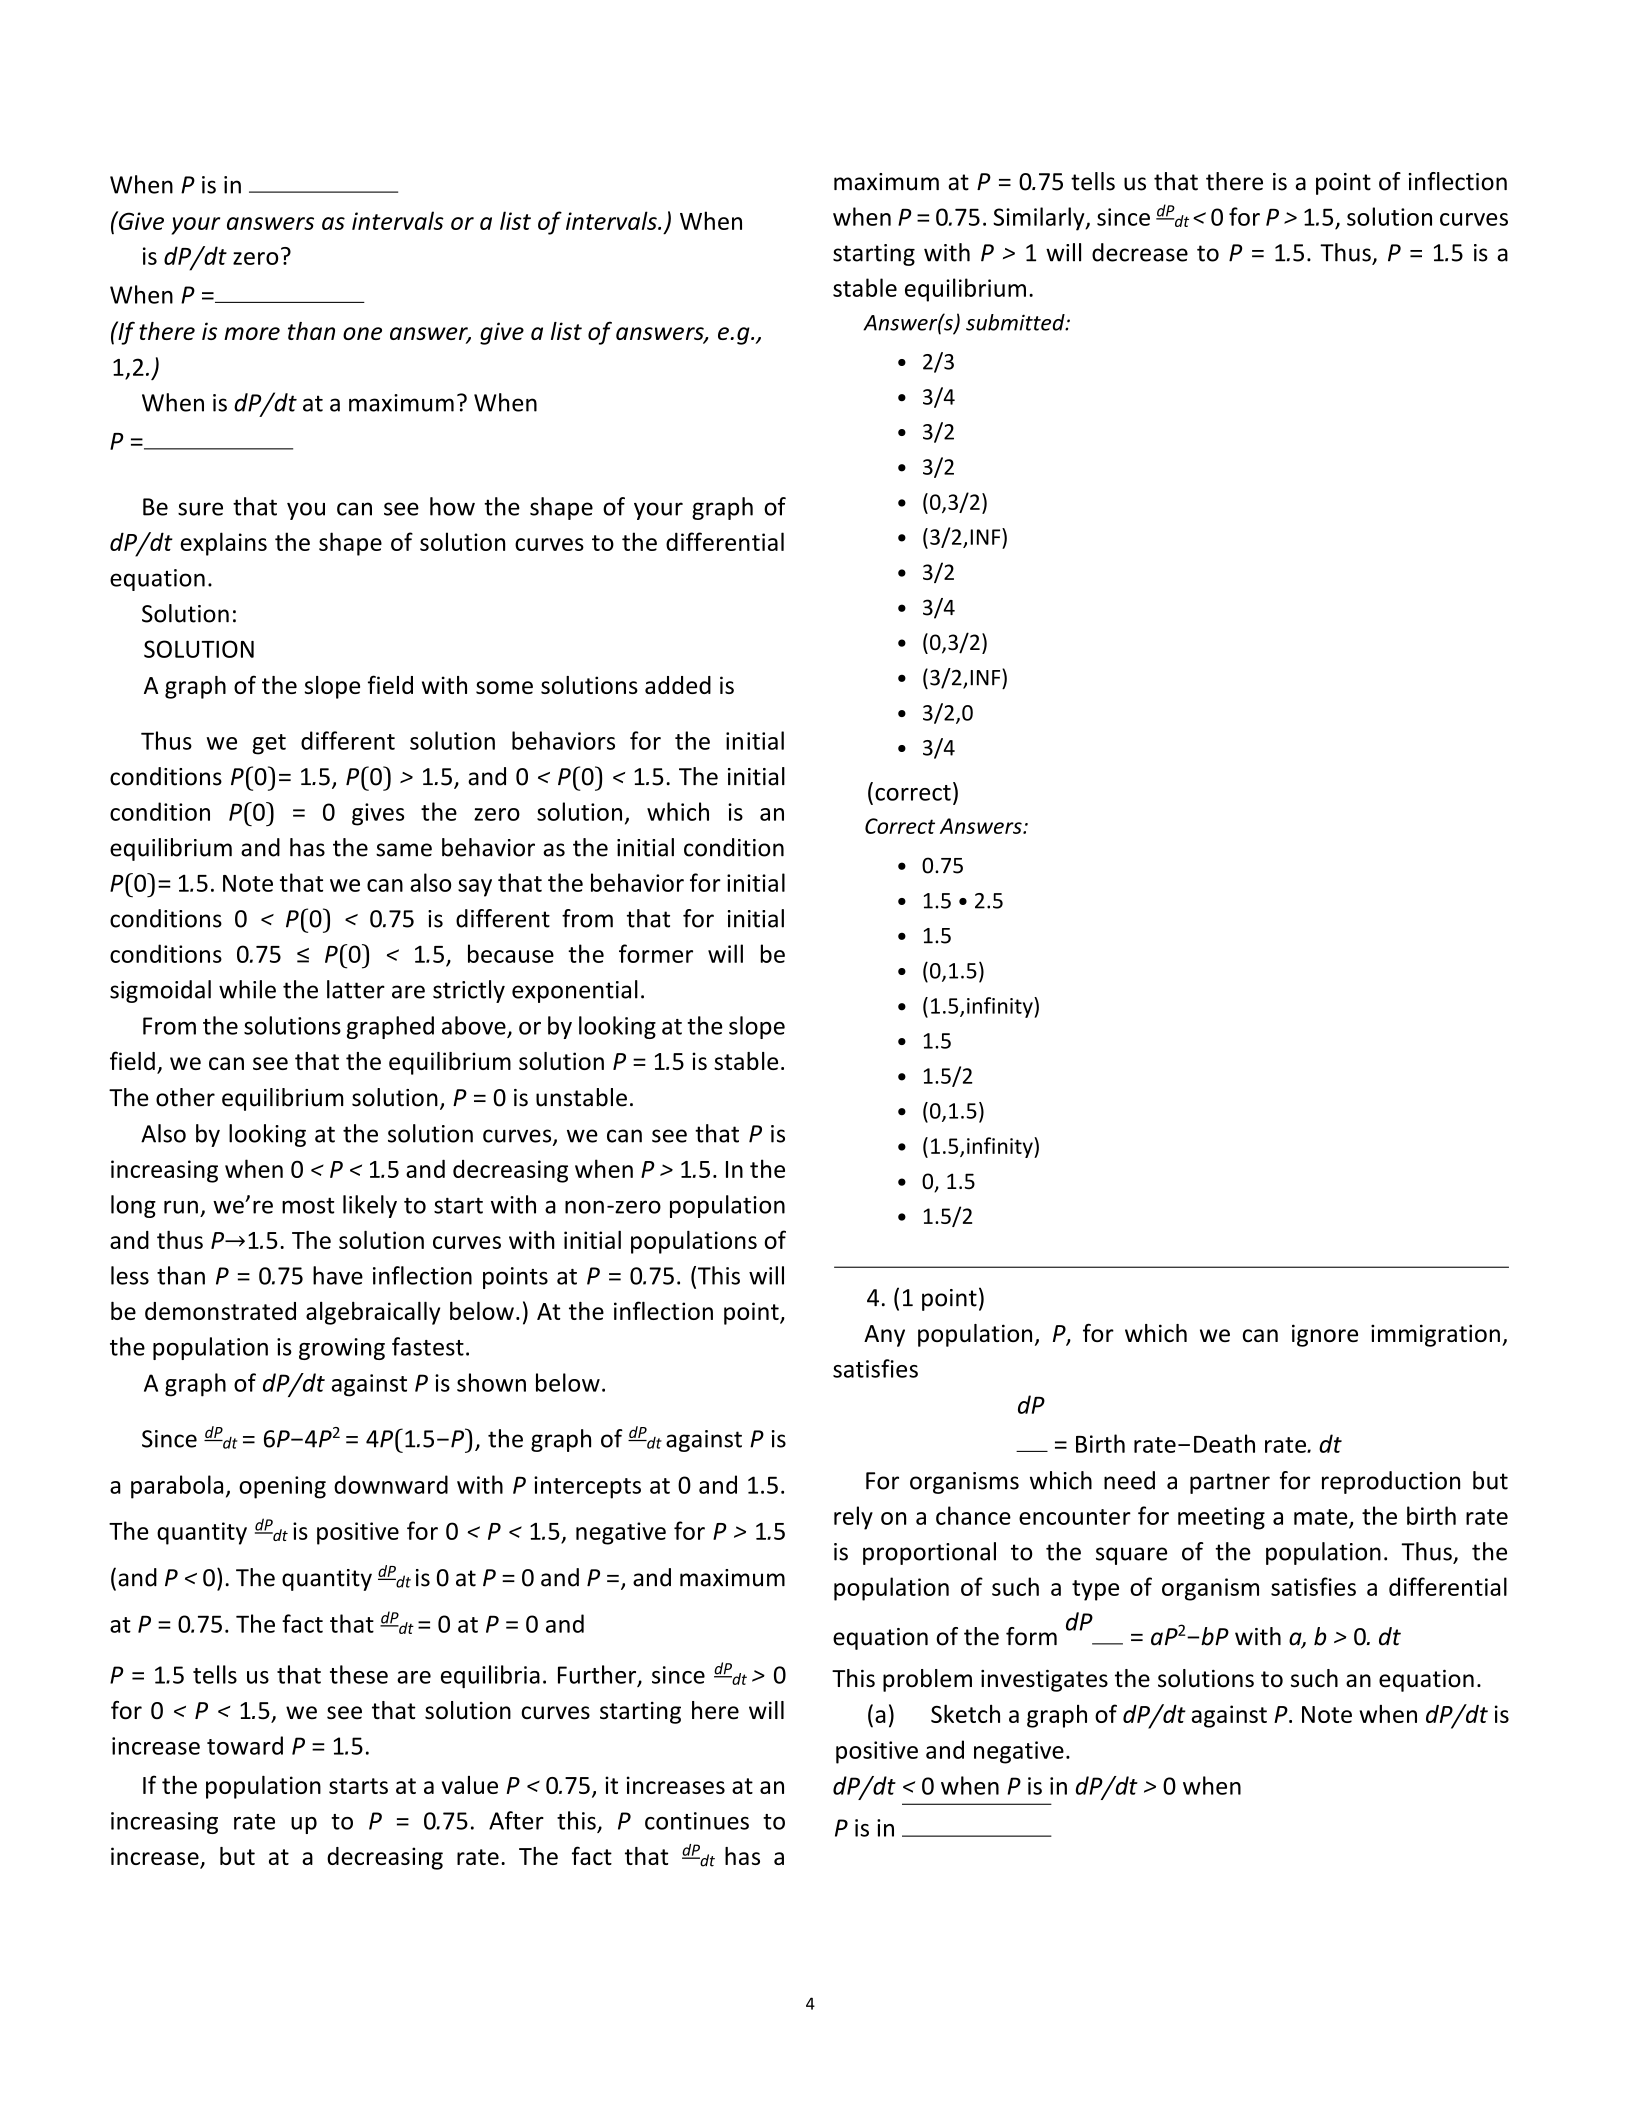
A graph of dP/dt against P is shown below.
Since dPdt = 6P−4P2 = 4P(1.5−P), the graph of dPdt against P is
a parabola, opening downward with P intercepts at 0 and 1.5.
The quantity dPdt is positive for 0 < P < 1.5, negative for P > 1.5
(and P < 0). The quantity dPdt is 0 at P = 0 and P =, and maximum
at P = 0.75. The fact that dPdt = 0 at P = 0 and
P = 1.5 tells us that these are equilibria. Further, since dPdt > 0
for 0 < P < 1.5, we see that solution curves starting here will
increase toward P = 1.5.
If the population starts at a value P < 0.75, it increases at an
increasing rate up to P = 0.75. After this, P continues to
increase, but at a decreasing rate. The fact that dPdt has a
maximum at P = 0.75 tells us that there is a point of inflection
when P = 0.75. Similarly, since dPdt < 0 for P > 1.5, solution curves
starting with P > 1 will decrease to P = 1.5. Thus, P = 1.5 is a
stable equilibrium.
Answer(s) submitted:
•2/3
•3/4
•3/2
•3/2
•(0,3/2)
•(3/2,INF)
•3/2
•3/4
•(0,3/2)
•(3/2,INF)
•3/2,0
•3/4
(correct)
Correct Answers:
•0.75
•1.5 • 2.5
•1.5
•(0,1.5)
•(1.5,infinity)
•1.5
•1.5/2
•(0,1.5)
•(1.5,infinity)
•0, 1.5
•1.5/2
4. (1 point)
Any population, P, for which we can ignore immigration,
satisfies
dP
= Birth rate−Death rate. dt
For organisms which need a partner for reproduction but
rely on a chance encounter for meeting a mate, the birth rate
is proportional to the square of the population. Thus, the
population of such a type of organism satisfies a differential
equation of the form dP = aP2−bP with a, b > 0. dt
This problem investigates the solutions to such an equation.
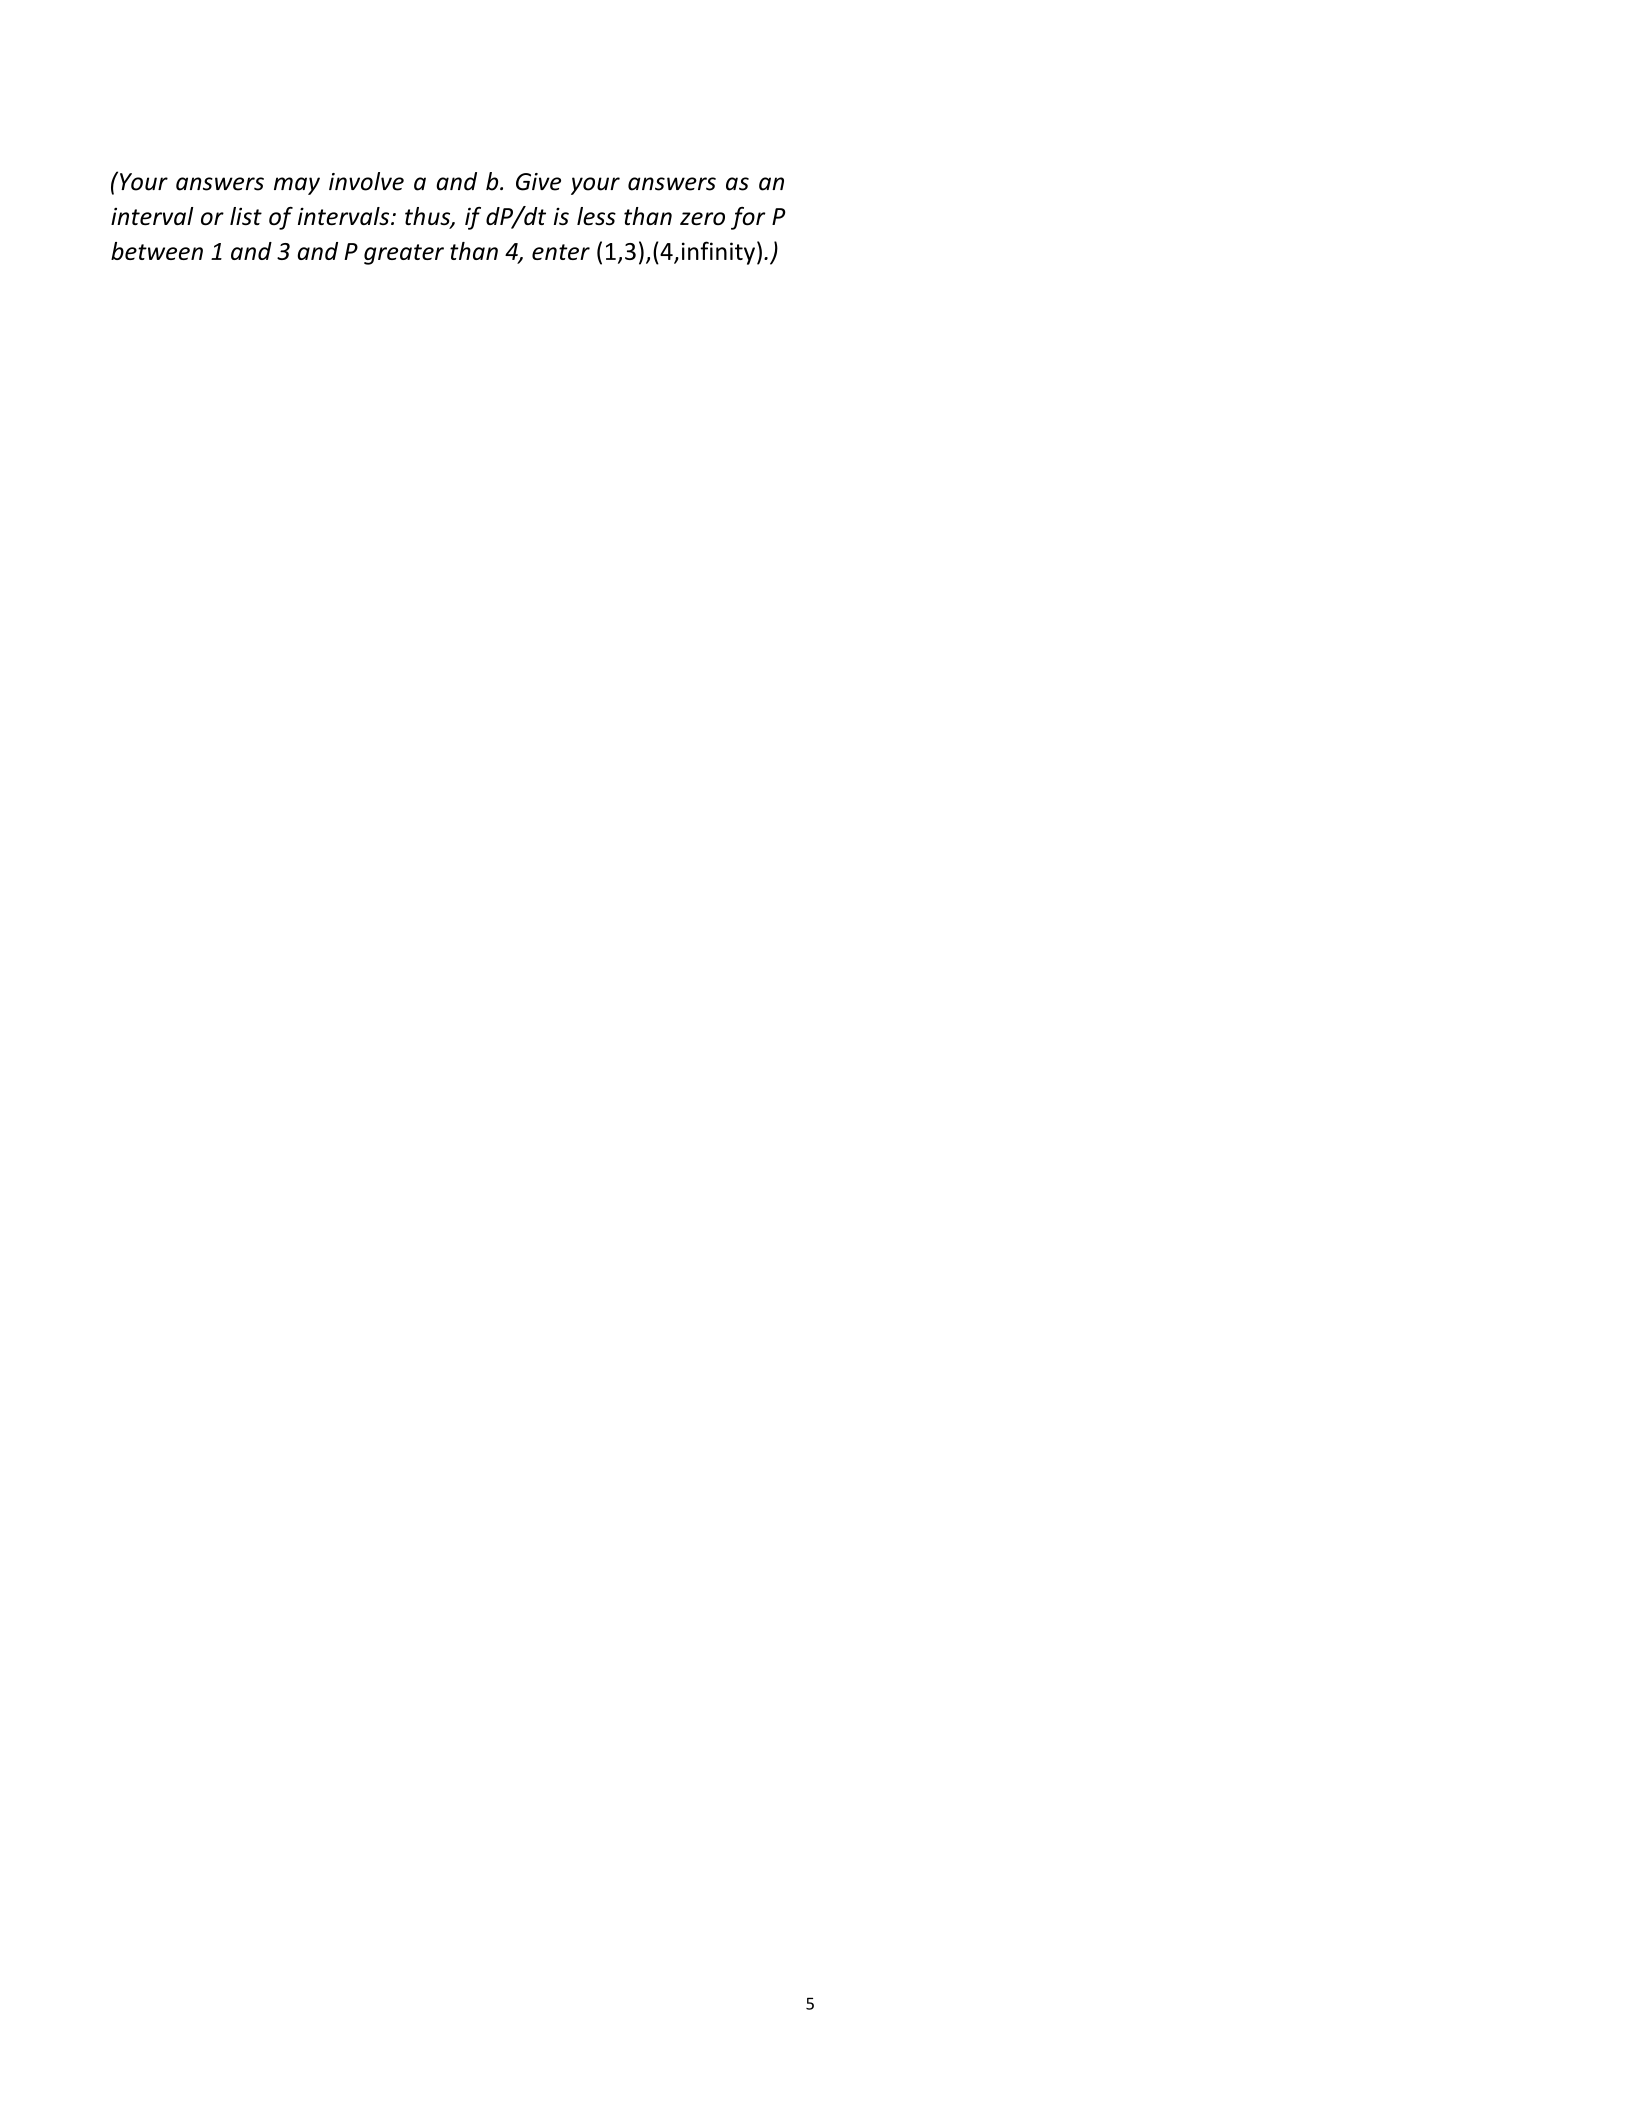
(a) Sketch a graph of dP/dt against P. Note when dP/dt is
positive and negative.
dP/dt < 0 when P is in dP/dt > 0 when
P is in
VF
Fe
Tc
pe
5
(Your answers may involve a and b. Give your answers as an
interval or list of intervals: thus, if dP/dt is less than zero for P
between 1 and 3 and P greater than 4, enter (1,3),(4,infinity).)
6
(b) Use this graph to sketch the shape of solution curves
logistic equation
=
−
,
k
k
=
(
)=
half of the carrying capacity)?
•
•
•
•
•
•
tion is given by the Gompertz function, which is a solution of
=
is the carrying capacity.
=
.
=
=
(
)=
→
(
)=
=
•
4000
•
4000
•
•
4000
•
4000
•
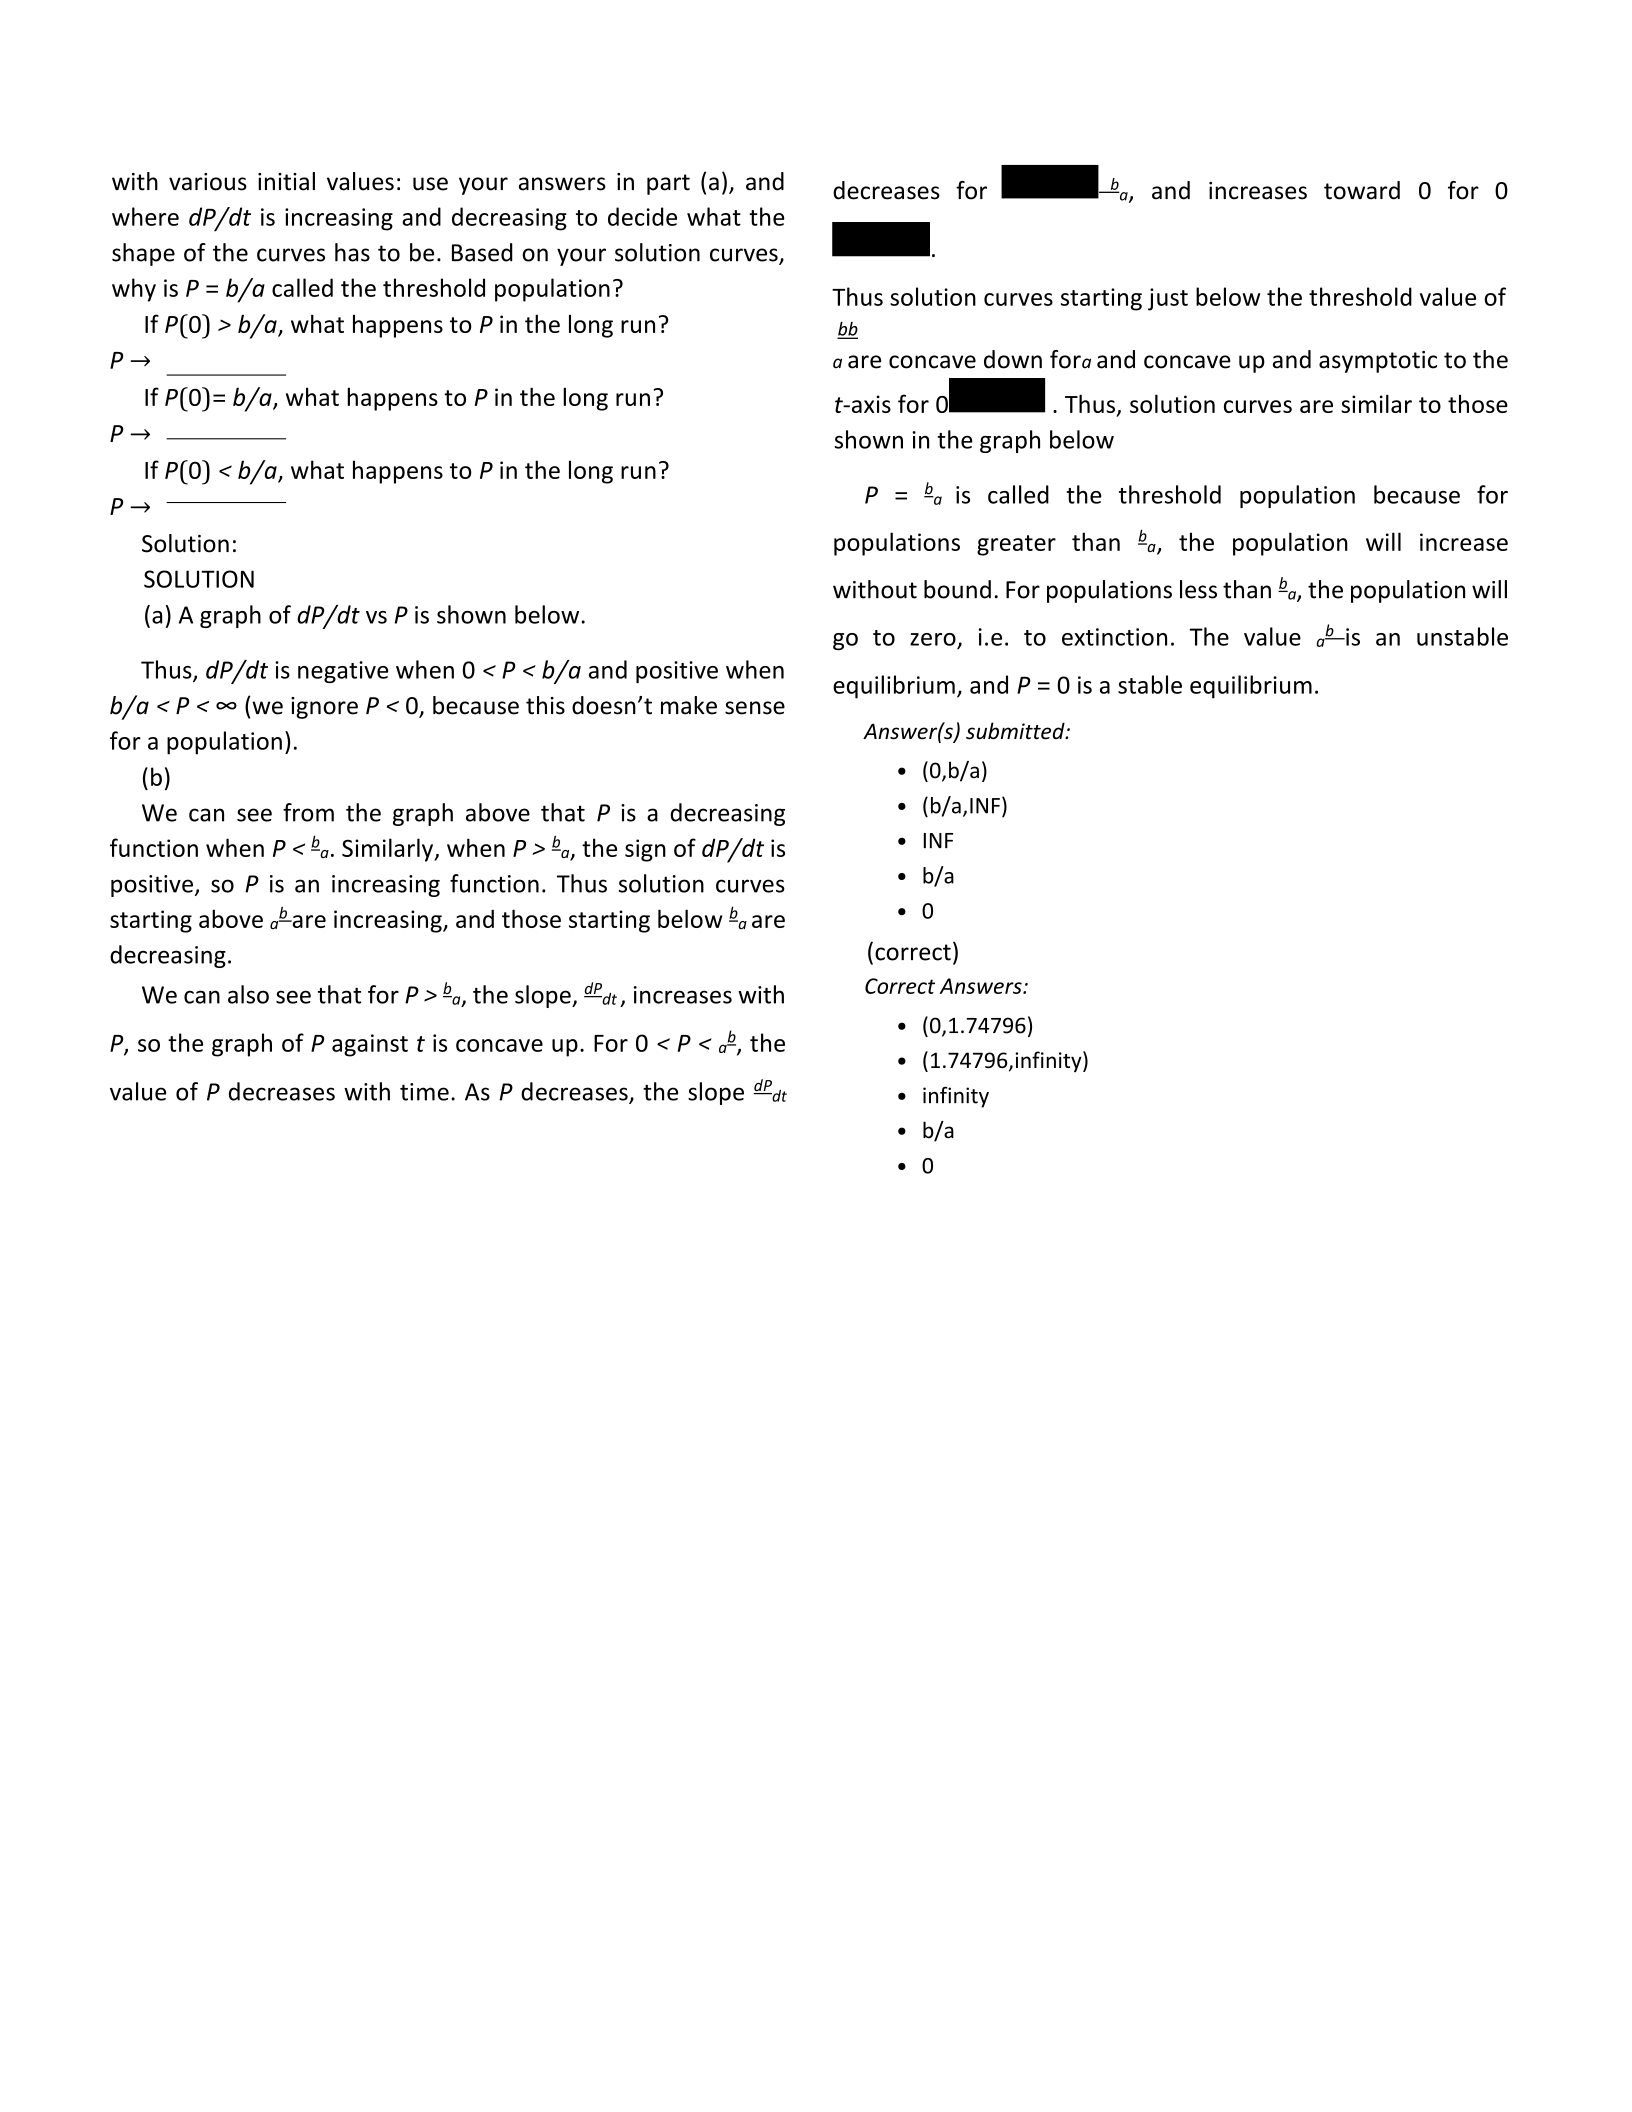
with various initial values: use your answers in part (a), and
where dP/dt is increasing and decreasing to decide what the
shape of the curves has to be. Based on your solution curves,
why is P = b/a called the threshold population?
If P(0) > b/a, what happens to P in the long run?
P →
If P(0)= b/a, what happens to P in the long run?
P →
If P(0) < b/a, what happens to P in the long run?
P →
Solution:
SOLUTION
(a) A graph of dP/dt vs P is shown below.
Thus, dP/dt is negative when 0 < P < b/a and positive when
b/a < P < ∞ (we ignore P < 0, because this doesn’t make sense
for a population).
(b)
We can see from the graph above that P is a decreasing
function when P < ba. Similarly, when P > ba, the sign of dP/dt is
positive, so P is an increasing function. Thus solution curves
starting above ab are increasing, and those starting below ba are
decreasing.
We can also see that for P > ba, the slope, dPdt , increases with
P, so the graph of P against t is concave up. For 0 < P < ab, the
value of P decreases with time. As P decreases, the slope dPdt
decreases for ba, and increases toward 0 for 0
.
Thus solution curves starting just below the threshold value of
bb
a are concave down fora and concave up and asymptotic to the
t-axis for 0 . Thus, solution curves are similar to those
shown in the graph below
P = ba is called the threshold population because for
populations greater than ba, the population will increase
without bound. For populations less than ba, the population will
go to zero, i.e. to extinction. The value ab is an unstable
equilibrium, and P = 0 is a stable equilibrium.
Answer(s) submitted:
•(0,b/a)
•(b/a,INF)
•INF
•b/a
•0
(correct)
Correct Answers:
•(0,1.74796)
•(1.74796,infinity)
•infinity
•b/a
•0
Powered by TCPDF (www.tcpdf.org)

