Lab 5
EXERCISES 1
Display function file.
type 'LAB05ex1.m'
% Run function file.
run 'LAB05ex1.m'
function LAB05ex1
m = 1; % mass [kg]
k = 4; % spring constant [N/m]
omega0 = sqrt(k/m);
y0 = 0.1; v0 = 0; % initial conditions
[t,Y] = ode45(@f,[0,10],[y0,v0],[],omega0); % solve for 0<t<10
y = Y(:,1); v = Y(:,2); % retrieve y, v from Y
figure(1); plot(t,y,'b+-',t,v,'ro-'); % time series for y and v
grid on;
%-----------------------------------------
function dYdt = f(t,Y,omega0)
y = Y(1); v = Y(2);
dYdt = [ v ; -omega0^2*y ];
1
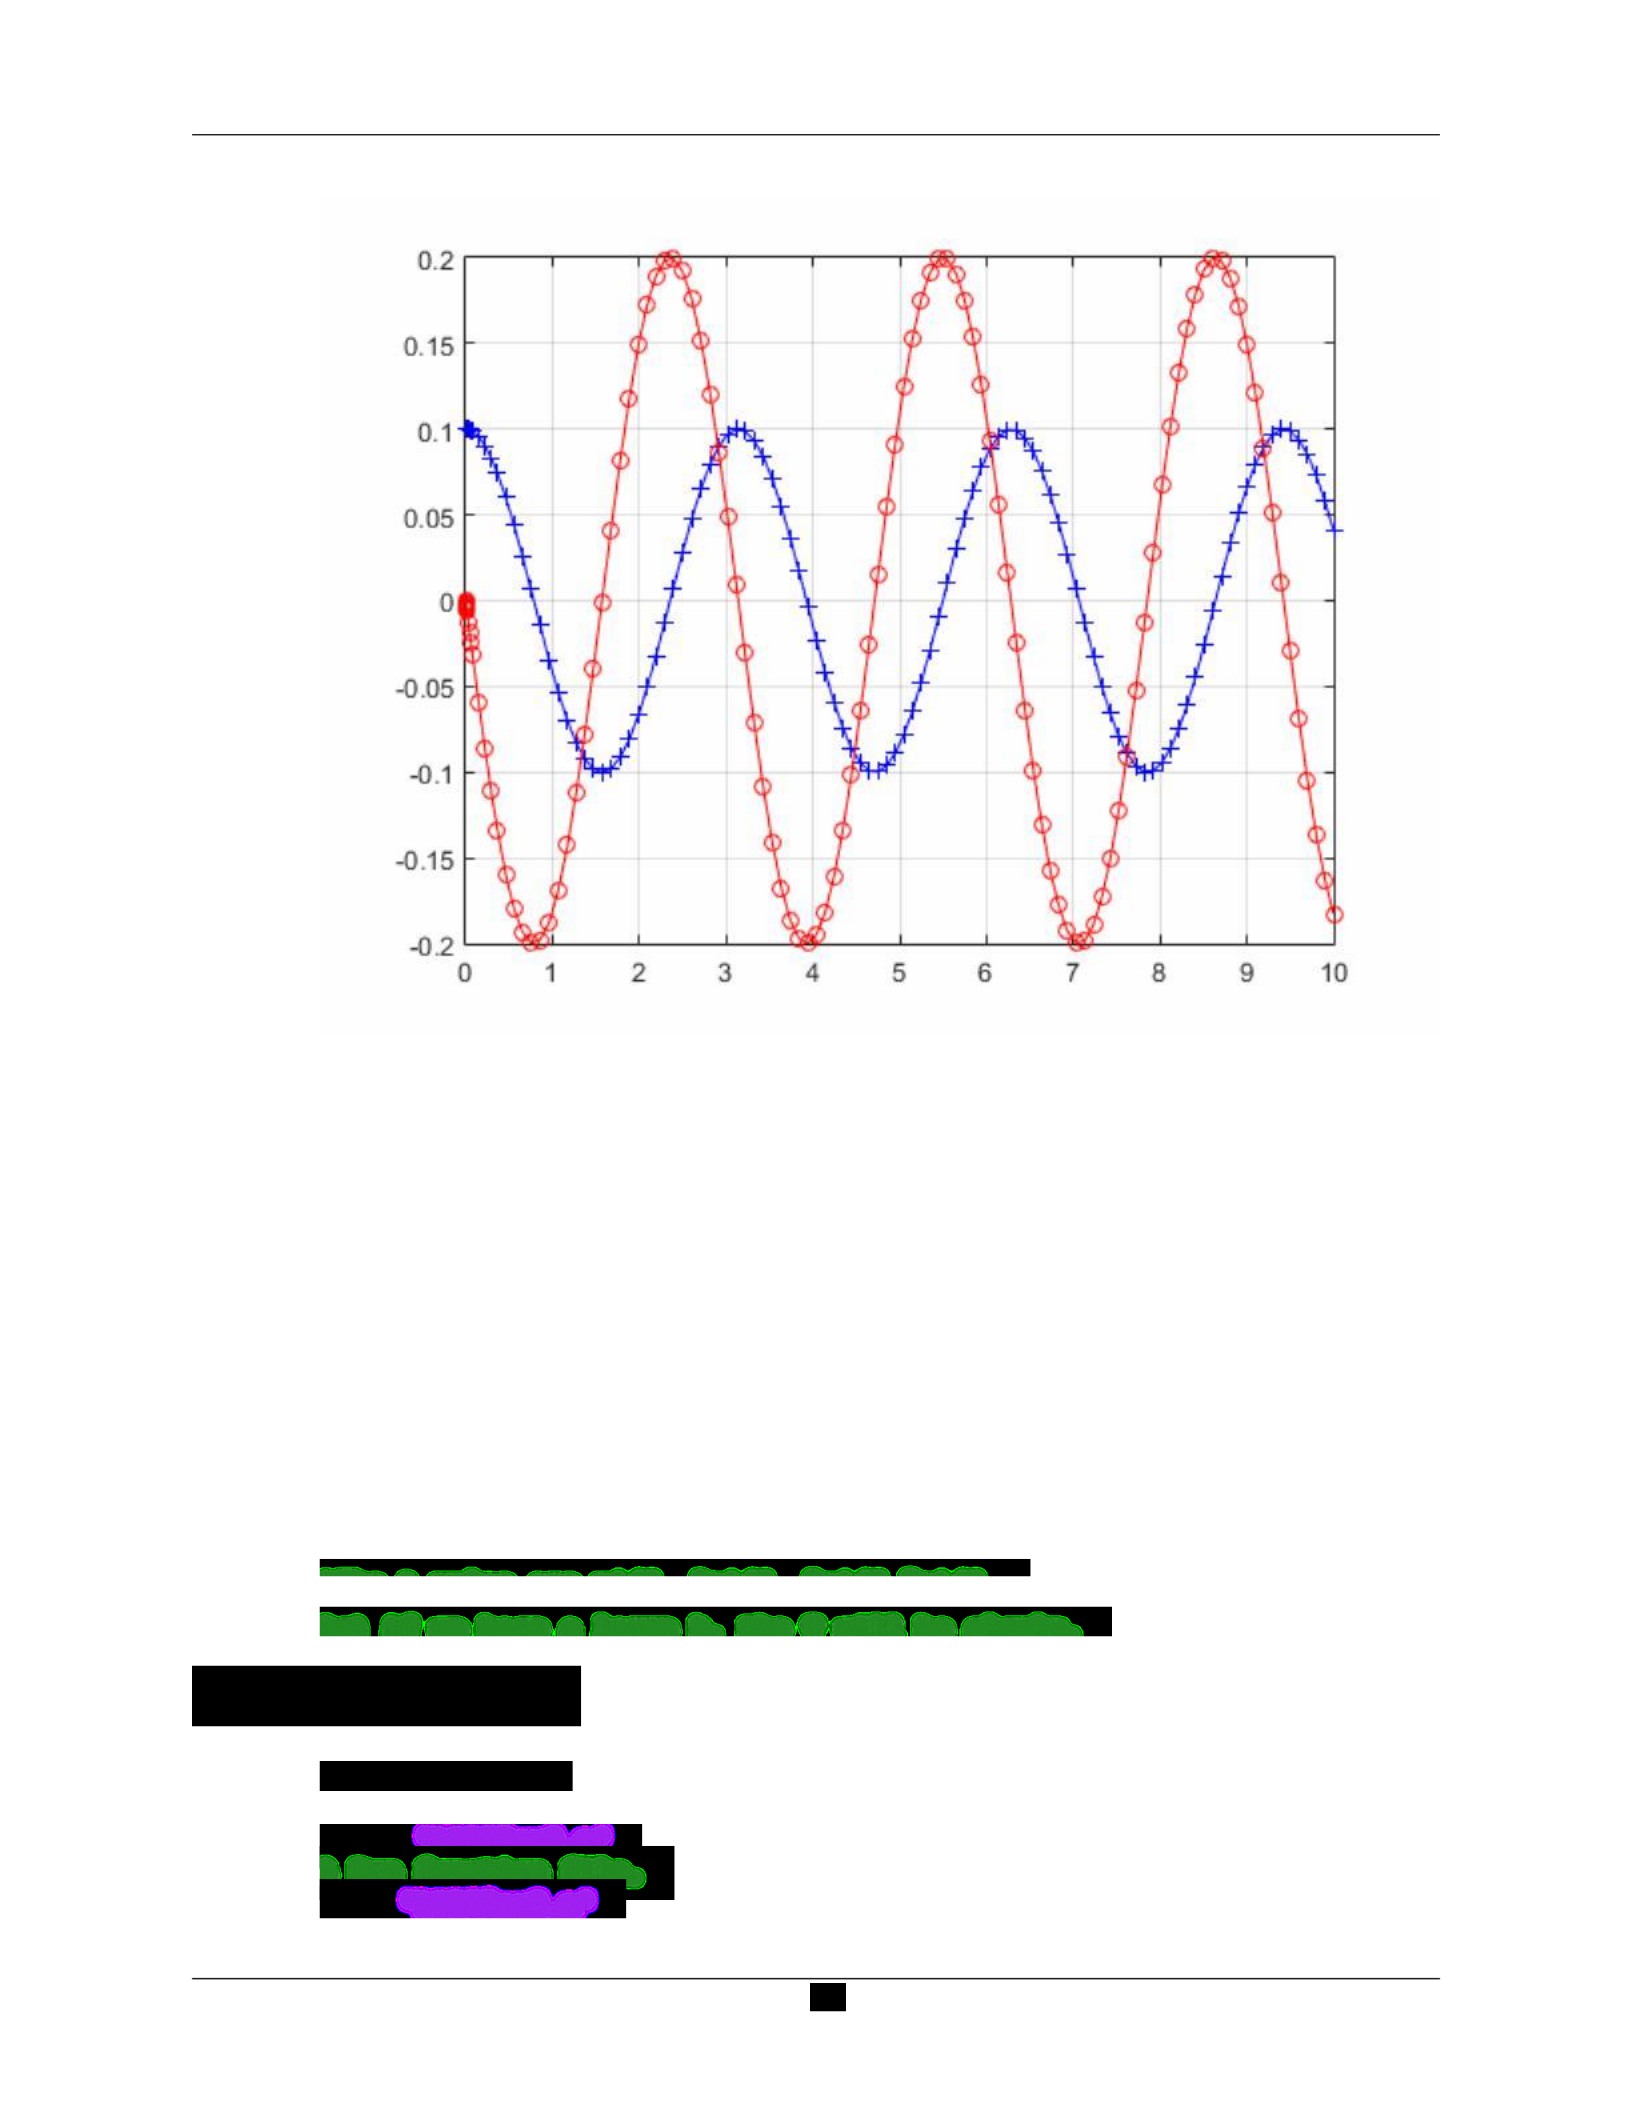
%a)(a) Which curve represents y = y(t)?
% the blue one is the y=y(t)
%b)What is the period of the motion?
%one peak 3.25, other peak 6.25 and the period will be T=2pi/w=pi
%c) what is the amplitude of the oscillation for y?
% the amplitude of the oscillation is 0.1
%d)What is the maximum velocity (in magnitude) attained by the mass,
and when is it attained?
%Make sure you give all the t values at which the velocity is maximum-
and the corresponding
%maximum value.----------------
% the maxium are 0.79, 2.235, 3.925,