


The Students’ and Instructors’ attitudes 1
CHAPTER 1
Introduction
Educational methods have become advanced and changed dramatically in the last
decade. The revolution in communication technologies specifically after the invention of
the internet, have introduced new methods of teaching. At the top of the list is distance
learning, where virtual classes and schools are established all over the world. People from
different places, cultures, races and languages who probably never meet each other, take
the same classes and learn from each other. Furthermore, they participate in producing
fantastic projects and artifacts (Rosenberg, 2001; Sherry, 1996).
In the United States, alone, thousands of educational programs have been
launched in the last few years in different schools. West Virginia University is one of the
institutions that have introduced online courses, with a variety of choices, ranging from
liberal, and science majors to Finance, Information Management, Software Engineering
and Nursing. Students or learners acquire knowledge while they work full-time. They can
do their assignments and projects from home or during their spare time.
In addition, the distance-learning paradigm provides a variety of alternatives for
students to attend classes virtually. They can communicate with the instructor, chat with
him or her and with each other or be involved in a conferencing room, as depicted by
Figure 1.1. At the same time, they can communicate through bulletin boards, e-mail, or e-
mail lists that are used to broadcast or disseminate information among groups (Keegan,
1993; Sherry, 1996).

The Students’ and Instructors’ attitudes 2
Bulletin Threaded Listserve Email
Boards Discussion
CSCW FTP
Figure 1.1. Networked learning tools.
Distance learning has many advantages over the traditional face-to-face paradigm.
However, it has drawbacks. The nature of this technology requires extra preparation and
infrastructure. Schools are very concerned about the privacy and convenience of their
students. Students should be able to access their accounts and records securely and
conveniently. Schools and colleges need to verify the identity of their students, since
students and instructors meet only virtually. Additionally, the universities and colleges
need to comply with the state and the accreditation organization requirements (Charp,
1994; Keegan, 1993; Sherry, 1996).
In the last few years, many schools around the world in general and the US in
particular, moved toward a new paradigm of delivering knowledge to learners (Duning &
others, 1993; Lai, 1999). In the last few years, universities and colleges have tended to
introduce distance learning as a main trend in their curricula. Different variations of
Web CSCW
Browsers
Email Eil ma
Attach-
ment
FTP C hat
EPSS Confer-
encing
Tickers
MOO
Communication/
Control
Information Collabo-
Knowledge ration
Coordi-
Net Program Web-Based
Conferencing Based Chat Chat
nation
Information Collabo-
Knowledge ration
Coordi-
Asynchronous
S
y
nchronous
Communication/ nation
Control
Network
Learning
Tools

The Students’ and Instructors’ attitudes 3
distance learning such as e-learning and online learning have been implemented all o
the US (Driscoll, 1998). The overall advantages of distance learning technology are
obvious to both learners and instructors. The distance-learning paradigm has also pla
a noticeable role in reducing the cost involved in delivering educational materials.
A few issues have risen because of the new trend of pedagogy. Since both le
ver
yed
arner
and ins
erent identity verification methods and protocols have been proposed and
deploy
active
or
stic or behavior is difficult to forge or replicate
(Jain, B
stems
tructor do not meet face to face, the need for a strong authentication method is
necessary to verify the identity of people especially during exams or evaluation
processes.
Diff
ed (Butler, Engert, Foster, Tuecke, Volmer & Kesselman, 2000). Biometric
systems such as fingerprint, iris scan and voice recognition seem to be the most attr
and promising for the next generation. Schools are using different types of authentication
systems, such as usernames and passwords, tokens, and smart cards. Despite the great
advantages of these methods, each has some flaws and drawbacks. Systems based on
knowledge, such as passwords could be forgotten, stolen, revealed or simply guessed.
Others that are based on possession, such as smart cards, might be forgotten, damaged
stolen (Podio 2001; Wayman, 2001a).
Using an individual’s characteri
olle & Pankanti, 1999; Podio, 2001; Wayman, 2001a). In more detail, the
technical, cultural and economic implications of using and deploying biometric sy
in distance learning were discussed and investigated through this study.

The Students’ and Instructors’ attitudes 4
Rationale of the Study
The need for a strong, but acceptable authentication method is essential. Using
traditional identification cards is not enough to verify the identity of people attending
class, taking exams, and quizzes in distance learning environments. Other alternatives
such as proctoring exams through educational centers are not appropriate; it is a very
costly process. In addition, in many cases it does not fit with the purpose of the distance
learning.
New technologies of authentication have been used and implemented in many
places such as banks, hospitals, government buildings and universities. Biometric
technology is a new, emerging technology believed to solve the problem of people
authentication. This technology is based on the authentication of individual’s identity
according to their psychological or behavioral traits. It is believed that using biometric
technology will help in solving the dilemma of identity, especially in the online paradigm
(Matyas, Riha, 2000; Wayman, 2001a).
The Purpose of the Study
Implementing biometric technology is not an easy task. Many factors should be
considered to make the system more efficient and acceptable. Throughout the review of
publications related to the implementation of biometric technology, the issue of privacy
was highly emphasized. This study investigated the social and cultural issues related to
the implementation of biometric technology as an identification method in the distance-
learning paradigm.
The study determined issues that were more critical to both instructors and
learners. It tested the acceptability of the biometric technology as an authentication

The Students’ and Instructors’ attitudes 5
method in online courses from learners’, and instructors’ points of view in the College of
Human Resources and Education at West Virginia University. It is hoped that the study
will help to improve the system performance, if it is implemented. Findings and results of
this research will help schools, instructors and learners to better understand the nature of
biometric technology, as well as help stakeholders to design and implement the biometric
authentication system with minimal side effects.
Problem Statement
Since there is little knowledge about the implementation of biometric systems as
an authentication method in distance learning courses, examining learners and
instructors’ reactions toward implementing biometric technology is very crucial. The
problem of this study was to determine the social and cultural issues related to
implementing biometrics technology. Learners have some reservations toward biometric
technology; it was therefore important to investigate the impact of implementing
biometric systems on privacy. The conflict between implementing biometric system with
religious beliefs was clarified. The health effect associated with adopting biometric
system was discussed. Instructors have their own concerns about biometric technology
that was examined closely.
Research Questions
1. How concerned are Instructors about the implementation of biometric technology as
an identification method in distance learning classes in terms of:
a. Privacy issues?
b. Religious issues?

The Students’ and Instructors’ attitudes 6
c. Health issues?
2. How concerned are Students about the implementation of biometric technology as
identification method in distance learning classes in terms of:
a. Privacy issues?
b. Religious issues?
c. Health issues?
3. What differences are there between groups (e.g., Instructors and Students, males and
females, etc.) in their responses to items regarding:
a. Privacy issues?
b. Religious issues?
c. Health issues?
Research hypotheses and Assumptions
This study was performed with the assumption that instructors are concerned
about the identity of their learners, specifically during the taking of exams and quizzes.
The study also assumed that instructors are not confident that the biometric system would
be able to authenticate accurately the identity of learners. The study assumed that
instructors believe that implementing the system might negatively affect enrollment of
learners in distance learning classes. In addition, the study assumed that students are
concerned about the implementation of the biometric system. Students are concerned
about the misuse of their biometric data, sharing their data with other agencies, saving
their data in non-secure storage, using too intrusive biometric technology and the health
implication of using some biometric technology applications. Students are concerned
about the negative stigma attached to biometric technology, since fingerprint system

The Students’ and Instructors’ attitudes 7
historically has been associated with criminal investigations; students, in educational
institutions, may not welcome using such technology.
The use of qualitative method means that the researcher will be the instrument. It is
crucial to check the researcher bias (Fraenkel & Wallen, 2002; Patton, 2002). Providing
background information about the researcher will help better understand his position
about the biometric technology in general and this researcher specifically. The researcher
received his bachelor of science in Computer Science June 1995 at King Abdul Aziz
University, Jeddah, Saudi Arabia. On December 1999, the researcher finished his
Master’s in Computer science at the University of Missouri-Rolla, Rolla, MO. The
researcher conducted some research related to biometric technology at West Virginia
University’s Computer Science department. According to his plan of study, Computer
Science is his minor. He experienced the technology personally at different places during
his traveling back and forth to his home country Saudi Arabia. As an international
student, the researcher experienced biometric technology at different federal agencies
such as, Immigration and Naturalization Services during the special registration post
September 11th ; Department of Motor and Vehicles (DMV) when he obtained a new
driving license; point of entry at the JFK airport, NY and when he applied for Visa at the
consular section of US General Consulate, Jeddah, Saudi Arabia. Therefore, the
researcher is familiar with biometric technology and its applications.
Limitations of the Study
The participants of the study were selected from the College of Human Resources and
Education at West Virginia University. There were two groups of participants. The first

The Students’ and Instructors’ attitudes 8
group was comprised of instructors. The second group included students from the college
of Human Resources and Education in the 2004 academic year.
Human Subjects Clearance
In accordance with University policy, a permission to conduct research involving human
subjects was obtained prior to collecting any research data. A copy of the approved
application is included in the appendices.

The Students’ and Instructors’ attitudes 9
CHAPTER 2
Literature Review
Biometric systems have been used and implemented widely throughout history. It
has been recorded that the Chinese used fingerprints thousands of years ago. However,
using other biometric technologies as a method of authentication is considered an
emerging field. According to Wayman (2001a), biometric system identification is based
on the authentication of living people’s identity according to their physiological or
behavioral characteristics. Figure 2.1 depicts the classifications of biometrics.
Figure 2.1. Biometric classifications (Biometrika, 2003).
Biometric System Modes and Functions
The biometric system has two main functions: verification and identification.
Verification takes place when the system tries to verify users’ identity in order to grant
them certain services or privileges. The other function is identification and is used to
determine whether a person is known to the system. This is illustrated in Figure 2.2. In
the first mode, people provide the system with some information, such as user ID or
name and their biometric identifier so that the system checks and compares their

The Students’ and Instructors’ attitudes 10
biometric identifier with the one stored in the database. If it matches, the user is granted
access. The matching process in this mode is a one-to-one comparison.
Figure 2.2. Biometric systems modes: Verification & identification (Biometrika,
2003).
On the other hand, during the identification mode users are exposed to the
biometric sensor with or without their knowledge. The system might decide whether they
are listed in the database or not. This type of matching is a one-to-many comparison,
which is very costly and slow. This type of identification has more applications in
government buildings or in high security domains. In general, every user of the system
needs first to go through the enrollment step, and then the authentication process takes
place. In some cases, the system administrator enrolls or signs up people in the system
without their consent -as in the case of monitoring criminals or terrorists (see Figure 2.3).

The Students’ and Instructors’ attitudes 11
Figure 2.3. The enrollment and authentication steps in biometric systems
Biometrika, 2003).
Biometric Systems Criteria
Physiological characteristics and behaviors must meet certain criteria before they
become candidates for an authentication system. Dr. Wayman (2001a) suggests a few
properties such as:
¾ Robustness or stability: It means that the characteristic or behavior is not subject
to change largely over time or aging.
¾ Distinctiveness or uniqueness: The chosen biometric identifier is unique for each
individual.
¾ Accessibility: This means that the subject’s biometric characteristics are easily
exposed to a sensor.
¾ Availability or universality: This means that it can be applied to all people.
¾ Acceptability: This means that users perceive the method as a non-intrusive
technology.

The Students’ and Instructors’ attitudes 12
Subsystems of Biometric Technology
The design of a biometric system consists of five subsystems (Wayman, 2001a):
o Data Collection: In this step, data is collected from users.
o Transmission: Data is computed, transmitted, and submitted to the next
subsystem either for store (in enrollment stage) or for comparison purposes (in
case of authentication).
o Signal Processing: In this subsystem, features are extracted, quality is refined
and user might be asked for another attempt if data is not clear.
o Decision: In this stage, the system will decide whether the user is accepted or
denied with error margin. The decision is not always accurate; it depends on the
accuracy threshold and the clarity of data.
o Data Storage: The template extracted from user’s data is stored, in most cases,
in central database for future matching. To ensure high security, considering
privacy issues, data templates should be irreversible, encrypted by strong
encryption (Nicols, 1999; Ratha & others, 2001). See Figure 2.4.

The Students’ and Instructors’ attitudes 13
Figure 2.4. The subsystem of the biometric technology (Wayman, 2001a).
Why Use Biometrics?
Biometric technology has many merits over other traditional systems. It helps in
authenticating people as being who they claim to be. There is no way to guess the
fingerprint of some one, for example. Tokens might be forgotten at home, stolen, or
duplicated (DigitalPersona, 2001; Maltoni , 2003). In biometrics, you do not have to
memorize a long password, or to carry a smart card with you. All that you need is to
introduce yourself to the system and expose your biological features to the sensor. In
some cases, such as in an iris scan, you only need to take a glance at a small lens. General
comparisons between the three identification systems are depicted in Table 2.1.

The Students’ and Instructors’ attitudes 14
Table 2.1
Comparison between Current Authentication Techniques
Method Examples Properties
User ID Shared
Password Many password easy to guess
What you know
PIN Forgotten
Catch Shared
Badges Can be duplicated
What you have
Keys Lost or stolen
ATM card + PIN Shared What you know and what
you have Writing the PIN on the card
Fingerprint Not possible to share
Iris Repudiation
Face Forging difficult
Something unique about
the user
Voice Print Can’t be lost or stolen
Another advantage of biometric technology is that it prevents people from
exchanging or transferring their identity. Using biometrics ensures that users will not be
able to access each other’s accounts or exchange each other’s tokens to access a building
or prove attendance. Yet, in some circumstances, biometric systems might be deceived by
using photos or a recorded voice (DigitalPersona, 2001). In this case, however, the
aliveness of users should be checked using a sensor with thermal properties to solve this
problem.

The Students’ and Instructors’ attitudes 15
The Technical Impact
Biometric systems measure the human property, which vary from time to time
due to a variety of reasons, such as aging, injury or sickness. Algorithms used in this
calculation must decide how much variation is acceptable. That is why biometric
authentication systems are not always 100% accurate. The percentage of error is divided
into two types: False Acceptance Rate (FAR) which happens when the system accepts
someone who is not legible, and is False Rejection Rate (FRR) that happens when the
system errs and rejects legitimate users (Tistarelli & others, 2002; Wayman, Jain,
Maltoni, & Maio, 2003).
The trade off between security and convenience is very clear in biometric system
authentications. Technically speaking, it is not possible to get rid of the error; yet it could
be minimized or decreased. It depends on the type of system and the implementation of
policies. If the priority of security is high, then it will be at the expense of conveniences,
as the system must require high accuracy. Therefore, a high number of FRRs will be
produced. If security is relaxed then more FARs might happen.
The type of technology used has a great impact in producing FARs and FRRs. For
example, fingerprint, iris scan, and dynamic signature have the lowest FARs at a rate of 1
in 10,000 or better. On the other hand, voice recognition, hand geometry, and facial
recognition are very poor with high FAR rate. These are more convenient to users. (See
Table 2.2)

The Students’ and Instructors’ attitudes 16
Table 2.2
The Trade Off Between Different Factors in Biometric Authentication Systems
One technical issue is constructing biometric identifiers; it is more complicated
and sophisticated compared with generating a traditional password. In the case where a
password is revealed, it is easy to revoke it or reset it. However, revoking biometric
identifiers is very difficult, if not impossible. Furthermore, the rate of FAR in most cases
is higher than the rate of revealing, hacking or stolen password (Ankari, 2001).
The Social Impact
Many studies have been conducted in the area of biometric technology and its
implications on society (Wayman, 2001b). The most comprehensive one was compiled
by The ORC International Report, a survey that was conducted in September 2001 and
August 2002 (ORC Report, 2002)
Zimmerman and others have discussed the implications of using biometrics
technology. Unfortunately, their discussions gave few details, focusing only on business
and private companies (Ankari, 2001; Zemmerman, 2002).

The Students’ and Instructors’ attitudes 17
Use of biometric technology for identification purposes raises some social
concerns. The first is whether the technology is appropriate. Few questions have been
posed about implementing biometrics in hospitals, banks and federal buildings. Many
users believe that biometric technology invades their privacy. A few decades ago, when
fingerprinting first was introduced, people resisted it. The need for such technology,
however, outweighed the public resistance. Today, people are debating whether such
technology as retinal scans, iris scans, and facial recognition are too intrusive
(Zimmermann, 2002).
The other side of the debate is about the use of data and information. People are
concerned about the handling of their data. They believe that their data may be stored
improperly or be vulnerable to attack. Some users believe that their data might be abused,
shared with other agencies or even sold. The main question is what will happen to their
biometric data and how secure will it be from other parties (ORC report, 2002)?
Some legal professionals believe that using biometrics technology is so intrusive
that it would violate the Fifth Amendment concerning the protection against self-
incrimination. Obtaining very detailed data form people, such as retinal scans and DNA
samples, may force self-incrimination (Wayman, 2001b). People are reluctant to try the
system because a criminal stigma is still attached to biometrics, specifically fingerprints.
Due to the nature of the system, its accuracy is a crucial concern for both
individuals and law enforcement agencies. The FAR rate produced by biometric systems
is very sensitive; it has a great impact socially and legally for the acceptability of the
technology (ORC Report, 2002). Figure 2.5 shows the comfort ability rating for various
biometric technologies.

The Students’ and Instructors’ attitudes 18
Figure 2.5. Different biometric technologies and their rating on comfortability
(ORC report, 2002).
The other factor is the justification of using the system. The figure below (see
Figure 2.6) indicates the acceptability of using biometrics for preventing crimes by
government and law enforcement, which may not be the same if the system is installed in
public schools, private colleges, or even deployed in local businesses (ORC Report,
2002).

The Students’ and Instructors’ attitudes 19
Figure 2.6. The acceptability of using biometrics to prevent crimes (ORC report,
2002).
The technology of biometrics is still in its infancy phase. It takes time for people
to know it, trust it, use it, accept it and then adopt it. According to Rogers (1995) in his
book “Diffusion of Innovations”, the diffusion of technology takes an S-shape before it
completes its life cycle. In the case of biometric technology, it takes time to be diffused
and adopted by both government agency and private sector.
Religious groups have their own objections toward using biometric technology.
Some religious sects believe that using facial recognition or fingerprints contradict their
theological teachings. In addition, conservatives stand on the side of the state, supporting
the implementation of rigorous identification systems. Their static and rigid doctrine

The Students’ and Instructors’ attitudes 20
might slow them down. On the other side, liberals are willing to accept this new
technology, but not at the expense of their privacy and civil liberty.
In conclusion, using biometric technology as a method of identification has
significant impact on society. However, technology advocates should balance the rights
of individuals and the safety of the society, “Installing privacy code and demonstrating
compliance with it [should] be essential to public acceptance” (Privacy and American
Business, 2002).
The Economic Impact
Biometric applications have been used widely in different fields. Businesses,
banks and big corporations were among the first innovators of this technology. According
to the ORC report (2000), the investment in biometric technology in 2007 will be five
times that of 2003 (see Figure 2.7). The cost of both hardware and software is decreasing
rapidly, for example, the cost of a fingerprint sensor is about $100 now (Zimmerman,
2002).
Discussing the implications of implementing biometric technology from
economic point of view is very wide. Due to the limitation of the study, this document
focuses only on the educational domain, such as distance learning or online. Biometric
technology has been introduced to solve the dilemma of identity at the same time, to
overcome the drawbacks of other methods such as passwords and tokens.
In contrast, with other methods biometric technology requires specific hardware
and software. It mandates specific sensors to capture the target characteristics or
behavior. Additionally, specific programs are needed to run the application. In traditional
systems, there is no need for specific application, devices or hardware.

The Students’ and Instructors’ attitudes 21
Figure 2.7. Comparative market share by technology (ORC report, 2002).
Biometrics helps in cutting the cost involved in tutoring users and provides them
with the proper passwords or tokens. However, the technical support and maintenance
costs are essential in the case of biometric applications. From an interview conducted
with Cindy Hart, extended learning administrator, one of the obstacles of implementing
biometric technology is the cost involved. Due to budget cuts, it is extremely difficult for
schools and institutions to afford installing such technology. One of the suggestions is to
raise the tuition fees to cover any future project, such as installing biometric devices
(Hart & Albalawi, 2003).
Biometric system identification methods have an excellent potential in many
areas, including distance learning. It should help users accomplish their goals easily,
securely, confidentially, and with high respect to their civil rights. In online, for example,
students will be able to access their accounts securely and privately. All over the world,
students should be able to enjoy their rights and privileges without trading their privacy
or losing their rights. Schools and institutions can impose their policy and regulations
smoothly. The accreditation agencies will be able to maintain their standards and
credentials.

The Students’ and Instructors’ attitudes 22
As a technology, biometrics has both cons and pros. It has technical, societal and
economic implications (i.e. Technological fix). It is our duty to choose the best
technology that serves our interest and achieves our objectives with less technical, social,
and economic negative affects (see Figure 2.8).
Figure 2.8. The trade-off between different factors in biometric
technology (ORC report, 2002).

The Students’ and Instructors’ attitudes 23
CHAPTER 3
Method
The purpose of this chapter is to describe and discuss the method used in this
study. The following summarizes the contents of the chapter:
1. The purpose of the study.
2. The research questions.
3. The research methodology that was used in the study.
4. Description of the instruments, and
5. The statistical procedures that were used to analyze the collected data.
The Purpose of the Study
Implementing biometric technology is not an easy task. Many factors should be
considered to make the system more efficient and acceptable. Throughout the review of
publications related to the implementation of biometric technology, the issue of privacy
was highly emphasized. This study investigated the social and cultural issues related to
the implementation of biometric technology as an identification method in the distance-
learning paradigm.
The study determined which issues are more critical to both instructors and
learners. In addition, it tested the acceptability of the biometric technology as an
authentication method in online courses from the learners’, and instructors’ points of
view in the College of Human Resources and Education at West Virginia University. It is
hoped that the study will help to improve the system performance, if it is implemented.
Findings and results of this research will help schools, instructors and learners to better

The Students’ and Instructors’ attitudes 24
understand the nature of biometric technology, as well as, help stakeholders to design and
implement the biometric authentication system with minimal side effects.
The Research Questions
1. How concerned are instructors about the implementation of biometric technology as
an identification method in distance learning classes in terms of:
a. Privacy issues?
b. Religious issues?
c. Health issues?
2. How concerned are students about the implementation of biometric technology as an
identification method in distance learning classes in terms of:
a. Privacy issues?
b. Religious issues?
c. Health issues?
3. What differences are there between groups (e.g., Instructors and Students, males and
females, etc.) in their responses to items regarding:
a. Privacy issues?
b. Religious issues?
c. Health issues?
The Research Methodology
Qualitative methods were used initially to establish the basis of the study,
followed by a quantitative analysis. Therefore, the study is qual QUAN (Morse,
1991). This means the study started with qualitative methods and then followed by
quantitative methods. This type of mixed method is called “Complementarity Design”

The Students’ and Instructors’ attitudes 25
where findings from quantitative methods are enhanced through findings from qualitative
methods (Greene & Caracelli, 1997).
The Research Procedure
Mixed methods can be used to strengthen a study. “Qualitative and quantitative
data can be fruitfully combined to elucidate complementary aspects of the same
phenomenon” (Patton, 2001). For the purposes of clarity, the outline of procedures will
be as follows:
In the beginning, during the literature review, the researcher has identified the
social and cultural factors that contribute to the adaptation of biometric systems in
educational institutions. The researcher reviewed the existing instruments such as
questionnaires that were used by others to assess the implementation of biometric
systems in other settings. Then the following research procedure phases took place:
Phase I:
1. Developed interview protocols used during interviews with specific instructors
and students.
2. Identified a sample of instructors who teach online courses, and graduate students
who take online courses.
3. Conducted interviews with the sample of Instructors and Students.
4. Analyzed interview data to refine the criteria and factors of the study, and
provided more detailed information about the implementation of the biometric
technology and its social and cultural impacts.
Phase II:

The Students’ and Instructors’ attitudes 26
1. Developed two different surveys: one for Instructors and another for Students.
The surveys were later distributed to a sample of Instructors and Students.
2. Identified a sample of instructors and graduate students for the pilot study.
3. Conducted a pilot study with the sample of instructors and students.
4. Analyzed pilot study data and refined the surveys and determined the content
validity of the instruments. The results of the pilot study were discussed in more
detail later.
5. Revised the instruments according to the result of the pilot study.
6. Identified a sample of instructors and graduate students for the surveys.
7. Administered the surveys to the selected sample.
8. Coded, analyzed and interpreted the data collected from surveys. The data
collected by questionnaires was a mixture of quantitative and categorical data.
Therefore, frequency distributions graphs were used for the quantitative data. Pie
charts have been used to display the categorical data. Measures of central
tendency and variability were calculated by calculating the mean and the standard
deviation of responses to each item that produced quantitative data. t-Tests for
independent means were applied to assess the significance of differences in
respect to each item based on group membership (e.g., Instructors and Students,
Males and Females, etc.).

The Students’ and Instructors’ attitudes
27
2. Identified Sample for
Interviews
Identified Factors in
Related Research
& Existing Surveys
Instruments
2. Identified sample for
Pilot Study
5. Revised Survey
Instruments
1. Developed Survey
Instruments
6. Identified sample for
Survey
Qualitative Results
1. Developed
Interviews Protocols.
3. Conducted Interviews
4. Analyzed Interviews
Data
8. Coded, analyzed
Surveys Data
4. Analyzed Pilot
Study Data
QUANTITATIVE Results
Comparative Analysis of
Results
3. Conducted the Pilot
Study
7. Administered Surveys
Phase
III
qual
+
QUAN
Phase
II
QUAN
Phase
I
qual
Figure 3.1. The research procedure flow chart.

The Students’ and Instructors’ attitudes 28
Phase III:
Conducted a comparative analysis to data colleted in Phase I (qual) from surveys in
phase II (QUANTITATIVE) and answered the research questions. The interviews
outcome were used to inform the results of the quantitative methods (Triangulation),
as well as to provide more detail, which explained some phenomena that emerged
(Fitzpatrick, Sanders & Worthen, 2004) (see Figure 3.1, for more details).
Phase I: The Interview
Face-to-face interviews were conducted with students and instructors at the
College of Human Resources and Education. Interviews were conducted before the
surveys were distributed to the target population. Therefore, the instruments were refined
and improved. Because the method is qualitative, the researcher tried to point the way
rather than leading the way.
During interviews, individual, semi-structured open-ended questions were used
which allowed for a direct comparison of data across participants and data sets. In
addition, the open-ended format was enough to allow participants to define the issues and
inform the researcher of their understanding (Patton, 2001). All interviews were audio
taped and transcribed. The researcher then analyzed and interpreted the results; themes
and patterns were identified. The relationship between these themes and patterns were
assessed. The researcher used different techniques such as open coding and selective
coding in order to see visual findings.
The Interview Population and Settings
According to Patton (2001), “there are no rules for sample size in qualitative
inquiry.” It depends on the purpose of the study and the limitations on time and resources

The Students’ and Instructors’ attitudes 29
(Patton, 2001). In this study, the researcher interviewed five graduate students who had
taken online courses and five faculty members who had taught or plan to teach online
courses in the College of Human Resources and Education. The interviews were
conducted, with no restrictions on any student or faculty member, including, gender, race,
age, religion or major. The interviews took places in faculty member’s offices and open
lounge areas for the students. The faculty members were chosen from several
departments within the College of Human Resources and Education. The researcher
chose at least one faculty member who is experienced in teaching online courses; at least
one faculty member who is just beginning; and at least one faculty member who never
taught online courses.
The researcher chose instructors from different departments and with a variety of
experiences. The researcher picked participants randomly when he found more than one
choice. At the same time, the researcher asked the instructors to suggest students who
could be interviewed (snowball sampling); the researcher asked the instructor to suggest
students who have good understanding of online courses -when instructors suggested
more than one student- the researcher chose participants randomly (Fraenkel & Wallen,
2002).
Students were selected from different disciplines within the College of Human
Resources and Education. The sample consisted of one student from the Technology
Education department, one student from the Special Education department and one
student from the Curriculum and Instruction department, which order ensured a cross
section of students. The courses schedule was available on the university website and in
the dean’s office.

The Students’ and Instructors’ attitudes 30
The Interview Questions
1. Please list the online courses you have taken/taught.
2. Describe the positive aspects of online courses.
3. Describe the negative aspects of online courses.
4. How was verification of student identity handled in the courses you took/taught?
5. Describe the positive aspects of the verification system you used.
6. Describe the negative aspects of the verification system you used.
7. There are several biometric systems that can be used to verify identity, as I list
them, please describe your perspective regarding their use in online classes:
fingerprints, iris scan, etc.
8. (If they do not describe these issues). Do you believe there are privacy issues
related to the use of biometric systems? Cultural issues? Religious issues? Health
issues?
9. Given the systems we have discussed, which would you prefer and why would
you prefer that system?
The Interview Validity and Reliability
Since interviewing is a qualitative method, checking its validity and the reliability
is different from traditional ones used in the questionnaire instrument. In addition, since
the qualitative part of the study does not attempt to explore relationships, internal validity
is, strictly speaking, irrelevant. Because of the dependency on the researcher as the
instrument and the interpreter of the information, the bias of the researcher is a very
common concern (Fraenkel & Wallen, 2002).

The Students’ and Instructors’ attitudes 31
Triangulation
The purpose of the triangulation was to strengthen the study findings and to
confirm the outcomes of the research by different means. In addition, “corroboration of
data through cross-checking and triangulation are two methods used …to establish
credibility” (Fitzpatrick, Sanders & Worthen, 2004).
The triangulation is employed by four different types: (1) data triangulation, the
use of a variety of data sources in a study, (2) investigator triangulation, the use of several
different researchers, (3) theory triangulation, the use of multiple perspectives to interpret
a single set of data and (4) methodological triangulation (Patton, 2001). In this research,
the last type was used; combining more than one method (qualitative and quantitative).In
this study there were two different data sources; interviews and surveys. The surveys
provided broad, but not deep information, the interviews, however, provided deep, but
those interviewees were not necessarily representative (Fitzpatrick & Others, 2004). In
addition, examining the subjectivity of the researcher and utilizing member checking for
verification ensured that the researcher was gathering reliable data. These data were used
to ensure that the survey items included questions that addressed all types of concerns
raised by interviewees.
Phase II: Conducting the Pilot Study and Administrating the Surveys
1. The Pilot Study
The researcher performed a pilot study to improve the instruments and determine
its content validity and understanding. The instruments were sent to a number of
participants chosen conveniently from graduate students and instructors in the College of
Human Resources and Education, these participants were not be part of the main study.

The Students’ and Instructors’ attitudes 32
The surveys were pre-tested to assess clarity, readability, and time for completion. For
the pre-test, the two surveys were administered to a convenience sample of both students
and faculty members who checked each item carefully, revised and suggested better
wording or phrasing.
The Pilot Study Population and Settings
The population of the pilot study was a group of graduate students and faculty
members in the College of Human Resources and Education. This population was
selected to participate in the pilot study in order to validate the instruments by checking
for their content validity. The researcher chose a convenient group of students and faculty
members to participate in the pilot study; ten students and two faculty members
participated in the pilot study. The researcher considered different criteria when he chose
the participants; for example, the researcher considered participants’ experience with
online courses, their gender and their race.
The researcher chose a graduate level course and coordinated with the instructor
to conduct the pilot study. The researcher checked courses that were available in summer
2004, coordinated with the instructors and arranged for pilot study. For the online
surveys, the researcher conducted it in the computer lab in the College of Human
Resources and Education. The researcher asked only graduate students to participate in
the study.
2. The Instruments (surveys)
An online survey was distributed as well as paper-copies of the survey. The
survey method is a useful technique for producing meaningful data and answering
research questions (Fraenkel & Wallen, 2002). While qualitative methods are useful for

The Students’ and Instructors’ attitudes 33
providing additional support, the collection and quantification of data from a survey is
more effective because it is cost-effective, time-effective and easy to analyze (Fitzpatrick
& Others, 2004).
The Survey Population and Settings
When the surveys were improved and refined, they were distributed to samples of
graduate students and faculty members in the College of Human Resources and
Education. According to the Planning Division census, there were about 1800 graduate
students and 56 faculty members in the College of Human Resources and Education. The
size of this group was 189 students and 30 faculty members. According to Fraenkel and
Wallen, there is no clear-cut way to determine the size of the sample. However, since the
study outcomes will not be generalized other than to the population of graduate students
and faculty members at the College of Human Resources and Education at West Virginia
University, this number was believed to be adequate (Fraenkel & Wallen, 2002).
In this case, the surveys were distributed purposively in graduate courses taught in
the College of Human Resources and Education. The specific purpose of the research was
–“to investigate the attitude of the students and instructors toward the implementation of
the biometric system as identification method in online course”. - Graduate students who
had taken online courses or instructors who taught online course fit best for this purpose
based on prior knowledge.
The researcher checked the course schedule and coordinated with the course
instructor to conduct the survey. The students and instructors were approached in the
class by the researcher; the researcher asked participants whether they prefer online
questionnaire or a hard copy. Based on their preference the researcher distributed the

The Students’ and Instructors’ attitudes 34
appropriate questionnaire. The researcher collected from participants the paper copies of
questionnaires; the online questionnaires results reported to the researchers account
automatically.
The Survey Validity and Reliability
Two surveys (one for faculty and one for students) were developed based on
similar studies (ORC, 2002). This survey were modified and used for this study to
address specific issues related to the dilemma of identity verification in educational
institutions. The pilot study and the interviews were used to revise the surveys and
identify the proper questions. Data gathered and analyzed during Phase I was used to add
more questions, delete irrelevant questions and adjust other questions as needed. The
researcher took into consideration issues emerging during interviews. In addition, during
the pilot study, the researcher worked closely with participants. For example, when
participants needed further explanations or details about the survey, the researcher
answered their questions. The researcher considered their comments and input regarding
the survey instruments. In addition, the researcher was able to determine the time for
completing the survey.
The validity and the reliability of the instruments were checked in different ways.
First, the content validity was checked; the clarity and readability of the questions was
tested through the pilot study. The items of the instrument covered all aspects of the
study, and complemented by the interview questions. Therefore, the content-related
evidence was checked by samples of participants during both the pilot study and the
interviews. Reliability of the test instrument is not available.

The Students’ and Instructors’ attitudes 35
Phase III: Data Analyses
Analyzing the Qualitative Data
Since mixed method is used, the researcher analyzed both data coming from the
interviews (qualitative part) and data collected by questionnaires (quantitative part). Data
collected from interviews were used to answer the research questions; themes and
patterns were identified. The relationship between these themes and patterns were
assessed. Researcher used different techniques such as open coding and selective coding
in order to see visual findings. Because the method is qualitative, the researcher tried to
point the way rather than leading the way. The researcher identified themes and patterns
while he interpreted the participants’ answers.
Analyzing the Quantitative Data
Descriptive analyses have been used to analyze the data collected by the
questionnaires, since “the major advantage of descriptive statistics is that they permit
researchers to describe the information contained in many scores with just a few indices
such as the mean or median” (Fraenkel & Wallen, 2002). The data collected by
questionnaires was a mixture of quantitative and categorical data. Therefore, frequency
distributions graphs were used for the quantitative data. In addition, a pie chart was used
to indicate the categorical responses of participants. The frequency distributions have
been compared by the user’s group membership (e.g., student or faculty member). In
addition, bar charts and tables were used to display the results. The comparisons were
made based on the responses of participants to the items under the major three issues;
privacy issues, religious issues, and health issues. Furthermore, measures of central

The Students’ and Instructors’ attitudes 36
tendency were utilized; the mean of each item was calculated. The standard deviation was
calculated to assess the variability of the data collected.
The test for statistical significances were conducted with a level of significance
α= 0.05. In this case, the researcher calculated the statistic value of significance then
compared it with the critical value obtained from standard tables. Since there were
various kinds of assumptions about the nature of the population from which the samples
are taken, the use of parametric technique was more suitable. Example of a parametric
test is t-test for independent means since we compare the mean scores of two different
groups (e.g., students and instructors). For the categorical data, t-test for proportions was
used to assess the difference in proportion of one group based on gender, for an example
see Table 3.1 and 3.2.

The Students’ and Instructors’ attitudes 37
Table 3.1
The Design Plan for the Interviews and the Surveys
Data Sources Research question Item Type Item Number Data Analyses
1. How concerned are instructors about
the implementation of biometric
technology as an identification method
in distance learning classes in terms of:
Instructors’ Interviews
and Surveys
The interviews,
Part II,
&
Part III
of the survey
1.a. Privacy issues? Likert scale
Multiple choice & Open
Ended
Items: A.1-7
Open-ended
questions
1.b. Religious issues ? Checklist
Multiple choice &
Open Ended
Items: B.1-5
Open ended
questions
1.c. Health issues? Likert scale
Multiple choice &
Open Ended
Items: C.1-3
Open ended
questions
Analyzing the transcript
of the interviews by
themes.
Descriptive for each item
in the survey; total score,
frequency polygon & Pie
charts.
2. How concerned are students about
the implementation of biometric
technology as identification method in
distance learning classes in terms of:
Students’ interviews
and survey
The interviews,
Part II,
&
Part III,
of the survey
2.a. Privacy issues? Likert scale
Multiple choice &
Open Ended
Items: A.1-7
Open-ended
questions
2.b. Religious issues? Checklist
Multiple choice &
Open Ended
Items: B.1-5
Open ended
questions
2.c. Health issues? Likert scale
Multiple choice &
Open Ended
Items: C.1-3
Open ended
questions
Analyzing the transcript
of the interviews by
themes.
Descriptive for each item
in the survey; total score,
frequency polygon & Pie
charts..
3.What differences are there between
groups according to their
memberships(groups, gender, and
biometric background) in terms of :
Instructors’,
Students’ Interviews &
Surveys
The interviews,
Part I,
Part II
&
Part III
of the survey
3.a. Privacy issues? Likert scale
Multiple choice &
Open Ended
Items: A.1-7
Open-ended
questions
3.b. Religious issues? Checklist
Multiple choice &
Open Ended
Items: B.1-5
Open ended
questions
3.c. Health issues? Likert scale
Multiple choice &
Open Ended
Items: C.1-3
Open ended
questions
Analyzing the transcript
of the interviews by
themes.
Descriptive for each item
in the survey; total score,
frequency polygon & Pie
charts.

The Students’ and Instructors’ attitudes 38
Table 3.2
The Research Matrix of Instructors and Students
Instructors’ point of view
Privacy Religious Health Others
TA1 √
TA2 √
TA3 √
TA4 √
TA5 √
TA6 √
TA7 √
TB1 √
TB2 √
TB3 √
TB4 √
TC1 √
TC2 √
TC3 √
T3.1 √
T3.2 √
T
E
A
C
H
E
R
Q
U
E
S
T
I
O
N
T3.3 √
Students’ point of view
Privacy Religious Health others
SA1 √
SA2 √
SA3 √
SA4 √
SA5 √
SA6 √
SA7 √
SB1 √
SB2 √
SB3 √
SB4 √
SC1 √
SC2 √
SC3 √
S3.1 √
S3.2 √
S
T
U
D
E
N
T
Q
U
E
S
T
I
O
N
S3.3 √

The Students’ and Instructors’ attitudes 39
CHAPTER 4
Data Analyses
The purpose of this study was to examine instructor and student attitudes toward
the use of biometric technology as an identification method in online courses. The aim of
this chapter is therefore to provide an elaborate description and analysis of the data that
was generated in this study. For purposes of clarity, this chapter was organized and
presented under each under-girding research question of this study. Since the study is
mixed method - starting with qualitative inquiry followed by quantitative method - the
analyses will begin first with the qualitative and then examine the quantitative
measurements. In the process of addressing each research question, this chapter was
organized into the three major phases:
Phase I: Qualitative data analysis for instructors and students groups.
Phase II: Quantitative data analysis including the following subsections:
1. Analyzing items related to the research question 1(RQ1):
a. Analyzing demographic data,
b. Analyzing question items related to the privacy issues,
c. Analyzing question items related to religious issues,
d. Analyzing question items related to health issues and
e. Analyzing open ended questions
2. Analyzing items related to the research question 2(RQ2):
a. Analyzing demographic data,

The Students’ and Instructors’ attitudes 40
b. Analyzing question items related to privacy issues
c. Analyzing question items related to religion issues,
d. Analyzing question items related to health issues and
e. Analyzing open ended questions
3. Data analyzing related to the research question 3(RQ3):
i. Differences between instructors and students group regarding the
three issues:
a. Privacy issues
b. Religion issues
c. Health issues
ii. Difference between male and female in the whole population
regarding the three issues:
a. Privacy issues
b. Religion issues
c. Health issues
iii. and iv : Within each group(Instructors and Students) discussing
differences between male and female regarding the three major
issues:
a. Privacy issues
b. Religious issues

The Students’ and Instructors’ attitudes 41
c. Health issues
Phase III: Comparative analysis: contrast between the results of two major data
analyses of the qualitative and quantitative methodologies.
Part I: Qualitative Data Analyses
Reviews of the Interview Procedures
Face-to-face interviews were conducted with five students and five instructors
at the College of Human Resources and Education. Interviews were conducted before the
surveys were distributed to the target population. Through this procedure, the instruments
were refined and improved.
During the interviews, individual, semi-structured open-ended questions were
used that allowed for a direct comparison of data across participants and data sets. In
addition, the open-ended format was enough to allow participants to define the issues and
inform the researcher of their understanding. All interviews were audio taped and
transcribed. The researcher then analyzed and interpreted the results; themes and patterns
were identified. The relationship between these themes and patterns were assessed.
The Interview Population and Settings
In this study, the researcher interviewed five graduate students who had taken
online courses and five faculty members who had taught or plan to teach online courses.
The interviews took places in faculty member’s offices and open lounge areas for the
students. The faculty members were chosen from several departments within the College
of Human Resources and Education. The researcher chose two faculty members who are
experienced in teaching online courses; one faculty member who is just beginning; and
one faculty member who has never taught online courses. The ethnicity of the faculty

The Students’ and Instructors’ attitudes 42
members was white/Non-Hispanic. The gender distribution was three male and two
female. The religious affiliation of all Instructors was Christianity.
The researcher chose instructors from different departments and with a variety of
experiences. One faculty member was from the Social Science Foundation department,
two faculty members were from Curriculum and Instruction and two faculty members
were from the Special Education department. The researcher picked participants
randomly when he found more than one choice. At the same time, the researcher asked
the instructors to suggest students who could be interviewed (snowball sampling); the
researcher asked the instructors to suggest students who have good understanding of
online courses -when instructors suggested more than one student- the researcher chose
participants randomly.
Interviewed students were selected from different disciplines within the College
of Human Resources and Education. The sample consisted of two students from the
Technology Education department, one student from the Special Education department,
one student from the Curriculum and Instruction department and one student from the
Pathology and Audiology department.
The race and ethnicities of the interviewees were as follows: One African
American student, two White/non-Hispanic students, one Asian student and one student
who identified herself as international. The dominating gender was female; three females
versus two males were interviewed. The religious affiliations were three Christian, one
Muslim and one Buddhist. The diversity of students’ majors, race, gender and religion
ensured a cross section of students.

The Students’ and Instructors’ attitudes 43
The Interview Questions
1. Please list the online courses you have taken/taught.
2. Describe the positive aspects of online courses.
3. Describe the negative aspects of online courses.
4. How was verification of student identity handled in the courses you took/taught?
5. Describe the positive aspects of the verification system you used.
6. Describe the negative aspects of the verification system you used.
7. There are several biometric systems that can be used to verify identity, as I list
them, please describe your perspective regarding their use in online classes:
fingerprints, iris scan, etc.
8. (If they do not describe these issues). Do you believe there are privacy issues
related to the use of biometric systems? Cultural issues? Religious issues? Health
issues?
9. Given the systems we have discussed, which would you prefer and why would
you prefer that system?
Interviews Analyses
The researcher employed a variety of techniques in analyzing the interview’s data.
Both Instructors’ and Students’ interviews were transcribed from audiotapes. Features
pertaining to reactions to the implementation of biometric technology were noted and
coded. The researcher also used comparative and contrastive frameworks in analyzing the
data. Regarding the reactions of Instructors and Students to the privacy, religious and
health issues associated with the implementation of biometric identification technology,
as well as their preference for particular biometric technologies, the researcher compared

The Students’ and Instructors’ attitudes 44
and contrasted the composite self-reports given by both Instructors and Students during
the interviews.
Findings
The research question sought to find out what instructors and students perceive as
some of the problems associated with the implementation of biometric identification
technology in the distance education marketplace. Of the few issues identified, privacy
seemed to be the preponderant concern. Other issues of concern were religion and the
potential for health problems associated with some biometric technologies.
Privacy Issues
The majority of students and instructors felt that biometric identification
technology would grossly invade their privacy. Interestingly, the researcher found that
participants’ concern with the invasion of their privacy was driven by two main factors:
• The privacy concerns were strongly related to the lack of trust between the
public institutes (state, school, etc.) and their clients. And
• The fear of the unknown “Pandora’s Box”; in this case the biometric
technology.
Through the interviews, the researcher categorized the pattern of privacy concerns
into two types:
• Students’ private information might be misused or abused by the “powers that
be”, whom some referred to as “BIG BROTHER”.
• The commercial uses of the students biometric data.
As reported by two instructors:

The Students’ and Instructors’ attitudes 45
I just don’t wanna big brother in my affairs-they’re in my affairs enough... ….oh
yeah, that is what it is, a privacy issue. For me it’s private, cultural, political, now
I know every time I go to order a book on the amazon.com, somebody knows,
somebody is sitting there figuring out ; this guy likes philosophy, history. Next,
you get on, they have already figured out what books you want. It bothers me a
little bit, but I can’t live with that kind of feeling. I am still concerned about the
BIG BROTHERISM…
In addition, all of the students whom were interviewed expressed their concern
very clearly, as one is quoted here stating:
Practically speaking, I would tend to go ahead and do it and not be concerned
(referring to having his biometric information taken and stored). But I’m
somewhat skeptical in nature and I think there is the possibility for misuse and
abuse.
One student, however, would not mind having his biometric information stored
electronically. This student, however, was concerned that his information could be
hacked by technically proficient criminals, and hence asked that every effort be made to
procure secure storage for such data before the biometric information is collected. The
student put it so aptly when he said in response to the privacy issue: “….I don’t trust this
things…if someone wants to hack my account he can unlock any door and nothing is
gonna prevent him.”
Religious Issues
Another issue explored in this study was the respondents’ perceptions about the
religious implications of the implementation of biometric identification technology in the

The Students’ and Instructors’ attitudes 46
distance-learning domain. Here, most respondents did not anticipate any direct impact of
the technology on religion. One students’ response aptly represents this majority
viewpoint: “...I don’t see any religious link.”
The majority of both instructors and students were hesitant to comments about
religious concerns. One instructor responded by saying: “I guess I don’t see any, may be I
don’t think at the levels of such, religious issues, I am not sure if that kind of
identification would provide a religious issue, I am just not sure of the issues related to
this”.
During interviews, one student reacted to the question about the religious issue
and its contradiction with biometric technology with a perplexing answer:
I think there would come a point when there would be a line that I would not
wanna crossover. As far as where that line is, I couldn’t see that line right now,
but I think that yes, there would be a line I don’t wanna cross for religious
reasons.
However, one incident relates to the topic of biometric technology and religious
issues. One instructor narrated a very interesting story, related to personal photos that
might ensue during the implementation of biometric technology. This is part of what she
said during her interview:
We used to have photos of the students we used to play on the television when
they spoke since we can’t see them and we had a student who asked not to do that
since her religion would forbid images of and of course I honor that. So, I could
see in this state there are a number of fundamentalist Christian groups where that

The Students’ and Instructors’ attitudes 47
might become an issue. Certainly, internationally, there might be some groups for
whom this might become an issue.
Health Issues
Another interesting finding gleaned from student and professor responses was the
potential health implications of biometric identification technology. Most people did not
find any severe and adverse health problems associated with the technology, although
there were a few mild concerns about possible health hazards. One student was very
concerned about the potential health implications, and this is what he had to say:
I would definitely be concerned about iris scan, because I believe eye could be
damaged by whatever kind of light , just like X-ray have been found to be harmful
in certain doses…I would be hesitant to try because of the potential risks
involved.
Health was not an issue within the Instructor group. Some of the interviewees
were in doubt about the health implication. They thought that the side effects of the
technology would take time to appear. One teacher was quoted as saying:
Well, I guess they are probably the opportunities for that; there is no question
about it. I’ve been in this building since it opened up and it’s full of asbestos and I
hear by the rumors that they will close it the next year to completely get it all out
of here, but I’ve been here for 36 years, yeah it’s probably had an impact on my
health.

The Students’ and Instructors’ attitudes 48
Socio-cultural Issues
Some issues emerged during the interviews related to the socio-cultural and moral
implications of the implementation of biometric identification technology. Most
respondents were unclear as to whether or not they believed there was a direct socio-
cultural impact. However, some respondents did give vague responses as exemplified by
one student’s comment: “…again I suspect it could happen. Absolutely, I don’t know
how it would be misused, but certainly it is a possibility”.
The biometric identifications could be exploited by the state authority as a potent
tool for racial profiling, especially within the African American community. This is what
one African-American student expressed during interview. Listen to the student’s
comments:
You know I come from the African American community and coming from such
community….I mean such things can be used to guess you; I mean you just never
know. So, I think that it can’t be used as a gift because we come from this
disenfranchised group. There were certain racist parts of our culture where people
could possibly use something like that. I don’t wanna use this technology. I just
know it’s a Pandora’s Box.
In another incident, one student questioned the morality of using such technology.
During the interview, the student expressed a strong aversion for technology, and not just
because of its privacy, religious, or health implications. It is evident that this student has
an issue with the perceived unbridled wave of scientific and technological advancement:
This whole advancement and technology we have, we want this entire surge and
boom, I don’t like it because like I said it’s a Pandora’s Box it seems like we keep

The Students’ and Instructors’ attitudes 49
pushing the limit, we wanna create robots at some time, we wanna create things
that can identify people, we want artificial intelligence, well where does this stop.
You want to replicate human. You want them to be human. I just have a problem
with it. It is not just a religious issue; it is the personal thing that I have a problem
with.
Part II: Quantitative Data Analysis
The findings of this study were analyzed and presented in a format that addresses
each study question. Data was coded for computer handling and analyzed using the
Statistical Package for Social Sciences (SPSS) version 11.0 software. Before any analysis
was done, raw data was keyed into the online questionnaires and later exported to SPSS
(version 11.0) software for analyses. (Norusis, 1999; Foster, 1998)
To answer the research questions, this study utilized descriptive statistics that
included: (1) measures of central tendency such as mean, mode and median, (2)
frequencies, (3) standard deviations and (4) percentages.
Review of the Problem Statement
The primary goal of this study was to examine Instructors’ and Students’ attitude
toward the use of biometric technology in online courses. The research problem
addressed in this study was therefore to explore the social and cultural issues related to
the implementation of biometric technology in online courses.
Review of Research Questions
There were three major research questions used in this study. The six research
questions included:

The Students’ and Instructors’ attitudes 50
1. How concerned are instructors about the implementation of biometric technology
as an identification method in distance learning classes in terms of:
a. Privacy issues?
b. Religious issues?
c. Health issues?
2. How concerned are students about the implementation of biometric technology as
an identification method in distance learning classes in terms of:
a. Privacy issues?
b. Religious issues?
c. Health issues?
3. What differences are there between groups (e.g., instructors and students, males
and females, etc.) in their responses to items regarding:
a. Privacy issues?
b. Religious issues?
c. Health issues?
1. Analyses of Data Related to the Research First Question (RQ1) “Instructors Group”
Demographic Data
The population of this study involved Instructors from various departments of the
College of Human Resources and Education at the West Virginia University (n=30). A
survey instrument was used to collect data from the study participants. Demographic data
that was collected included the following informational elements: (1) the academic
position of the respondent, (2) respondents’ department (3) respondents’ gender, (4)
respondents’ race or ethnicity, (5) respondents’ religious orientation or persuasion, (6)

The Students’ and Instructors’ attitudes 51
respondents’ knowledge about biometric technology and (7) respondents’ experience
with different type of biometric identification technology.
The demographic data were collected and analyzed to obtain profiles of the
respondents and to verify the faculty members being studied. In addition, demographic
data helped to identify and define the characteristics of the survey respondents, see Table
4.1.
Table 4.1
Summary of Instructors’ Demographic Data
27 27 30 30 25
3 3 0 0 5
11.59 7.15 1.50 4.97 3.08
12.00 7.00 1.50 5.00 3.00
13 11 1a5 3
2.291 3.516 .509 .183 .640
5.251 12.362 .259 .033 .410
Valid
Missing
N
Mean
Median
Mode
Std. Deviation
Variance
1.) Position
2.)
Department: 3.) Gender:
4.) Ethnicity
/ Race:
5.) Religion:
Multiple modes exist. The smallest value is shown
a.
This section provides a brief summary of the characteristics of the respondents
that participated in this study. First-demographic item on the survey asked for the
academic position of the participants. Out of 30 faculty members who participated in the
study, 1(3.3%) was a visiting instructor, 2(6.7%) were visiting assistant professors,
5(16.6%) were assistant professors, 17(23.3%) were associate professor, 11(36.7%) were
professor, 1(3.3%) was a professor emeritus and 3(10.0%) did not identify their academic
positions. See Figure 4.1 for more details.

The Students’ and Instructors’ attitudes 52
Professor Emeritus
Professor
Associate Professor
Assistant Professor
Visiting Assistant P
Visiting Instructor
Frequency
12
10
8
6
4
2
0
1
11
7
5
2
1
Figure 4.1. The academic position of instructors.
Second characteristic is the name of the department where the respondent is
working. Out of the 30 Instructors who completed and submitted the survey, 6(20%)
were from Speech Pathology and Audiology, 4(13.3%) were from Curriculum and
Instruction, 4(13.3%) were from Educational Psychology, 3(10.0%) were from Reading,
3(10.0%) were from Special Education, 3(10.0%) did not identify their department, 2
(6.7%) were from Counseling Psychology, 2(6.7%) were from Educational Leadership,
2(6.7%) were from Technology Education and 1(3.3%) was from Rehabilitation
Counseling. Figure 4.2 shows the distribution of instructors at different departments.

The Students’ and Instructors’ attitudes 53
Technology Education
Speech Pathology & A
Special Education
Rehabilitation Couns
Reading
Educational Psycholo
Educational Leadersh
Curriculum & Instruc
Counseling Psycholog
Frequency
7
6
5
4
3
2
1
0
2
6
3
1
3
4
2
4
2
Figure 4.2. The department distribution of all instructors.
Third-demographic item on the survey asked respondents to indicate their gender.
The gender composition was divided evenly between male and female. Out of the 30
survey respondents, 15 respondents (50.0%) were female and 15 respondents (50.0%)
were male. This demographic data is presented in Figure 4.3.

The Students’ and Instructors’ attitudes 54
FemaleMale
Frequency
16
14
12
10
8
6
4
2
0
1515
Figure 4.3. Instructors’ gender distribution.
Forth-demographic item on the survey asked respondents to indicate their race or
ethnicity. Out of the survey respondents, a majority 29 respondents (96.7%) were Non-
Hispanic Whites while only 1 respondent (3.3%) was of Native American/American
Indian descent. This demographic data is presented in Figure 4.4.
White/non-HispanicNative American / Am
Frequency
40
30
20
10
0
29
Figure 4.4. Instructors’ Race/Ethnicity distributions.

The Students’ and Instructors’ attitudes 55
Fifth-demographic item asked respondents to indicate their religious persuasion or
affiliation. Of the survey returned, 21 respondents (70.0%) were Christian, 2 respondent
(6.7%) were Buddhist, 2(6.7%) were Jewish, and 5(16.7%) did not indicate their religion.
This demographic data is presented in Figure 4.5.
JewishChristianBuddhist
Frequency
30
20
10
02
21
2
Figure 4.5. Instructors’ religion distributions.
Sixth-demographic item asked respondents to indicate if they knew what
biometric technology was. Of the survey returned, 24 respondents (80.0%) indicated they
knew what biometric technology was while 6 respondents (20.0%) indicated they did not
know what biometric technology was. This demographic data is presented in Figure 4.6.

The Students’ and Instructors’ attitudes 56
6.00 / 20.0%
24.00 / 80.0%
No
Yes
Figure 4.6. Instructors’ knowledge about biometric technology.
Seventh-demographic item asked participants to check all that apply from a list of
six places where they had used biometric technology. Of the 30 participants who
responded to the survey only 6(20.0%) respondents checked this question. Table 4.2
summarizes these findings.
Table 4.2
The Instructors’ Experiences with Biometric Technology at Different Places
8. Have you ever used it in (Check all that apply).
Response Percent Response Total
School
0% 0
Airport
17% 1
Bank
17% 1
ATM
0% 0
Hospital
17% 1
Federal Building
17% 1
Other
50% 3
Question Responses
6
Skipped
24

The Students’ and Instructors’ attitudes 57
For more details about each location in their frequency tables, check tables at
appendix A (Tables A.7 through Tables A.13).
The type of technology that was used by participants is summarized in Table 4.3.
It indicates that fingerprint is the highest technology experienced by the study participant.
Out of 6 participants, 4(57.0%), used fingerprint. Followed by voice recognition
2(29.0%), then facial and voice recognition 1(14.0%), and finally iris scan signature
dynamic, and hand geometry which had never been experienced by any participants. The
Table 4.3 below shows this statistics.
Table 4.3
Instructors’ Experiences with Different Types of Biometric Technology
9. What Type of Technology did you use (check all that apply):
Response Percent Response Total
Fingerprint
57% 4
Iris scan
0% 0
Facial
recognition
14% 1
Hand geometry
0% 0
Voice
recognition
29% 2
Signature
dynamic
0% 0
Others
0% 0
Question Responses
7
Skipped
23
Privacy Issues
The participants responded to two sets of questions. The first set of questions was
made up of six questions. Each question was ranked 1-5, with 1= being very concerned; 2

The Students’ and Instructors’ attitudes 58
=being somewhat concerned; 3=being not very concerned; 4=being not concerned and
5=being I don’t know. The second set of questions were rating questions item that sought
to find out the respondent’s perception of the level of intrusiveness of six biometric
technologies. For more details, see Tables 4.4 and 4.5.
Table 4.4
Summary of Instructors’ Responses to Items Related to Privacy Issues questions
30 30 30 30 30 30
0 0 0 0 0 0
2.67 1.43 1.30 2.30 2.50 3.23
3.00 1.00 1.00 2.00 2.00 3.00
2 1 1 2 2 3
1.124 .774 .535 1.119 1.009 1.165
1.264 .599 .286 1.252 1.017 1.357
Valid
Missing
N
Mean
Median
Mode
Std. Deviation
Variance
10.1) How
concerned are
you about
having
students’
biometric data
collected?
10.2) How
concerned are
you about
having
students’
biometric data
stored in
non-secure
storage?
10.3) How
concerned are
you about
having
students’
biometric data
used by third
party?
10.4) How
concerned are
you about
having
students’
biometric data
misused by
WVU?
10.5) How
concerned are
you about the
invasion of
students’
privacy by
WVU, when
biometric
technology is
implemente
d?
10.6) How
concerned are
you about the
negative
stigma
attached to
the use of
biometric
technology?

The Students’ and Instructors’ attitudes 59
Table 4.5
The Summary of Findings of the First Set of Questions Related to Privacy Issues
10. A. The privacy issues
Very
Concerned Somewhat
concerned Not very
Concerned Not
Concerned I don’t
know Response
Total
How concerned
are you about
having students’
biometric data
collected?
5 (17%) 9 (30%) 8 (27%) 7 (23%) 1 (3%) 30
How concerned
are you about
having students’
biometric data
stored in non-
secure storage?
21 (70%) 6 (20%) 2 (7%) 1 (3%) 0 (0%) 30
How concerned
are you about
having students’
biometric data
used by third
party?
22 (73%) 7 (23%) 1 (3%) 0 (0%) 0 (0%) 30
How concerned
are you about
having students’
biometric data
misused by
WVU?
8 (27%) 11 (37%) 6 (20%) 4 (13%) 1 (3%) 30
How concerned
are you about
the invasion of
students’ privacy
by WVU, when
biometric
technology is
implemented?
4 (13%) 13 (43%) 8 (27%) 4 (13%) 1 (3%) 30
How concerned
are you about
the negative
stigma attached
to the use of
biometric
technology?
2 (7%) 6 (20%) 10 (33%) 7 (23%) 5 (17%) 30
Question Responses
30
Skipped
0

The Students’ and Instructors’ attitudes 60
The first privacy question asked respondents to indicate how concerned they were
about having student biometric data collected. Of the 30 participants who responded to
this question, 9(30%) indicated they were ‘somewhat concerned’, 8(27%) indicated they
were ‘not very concerned’, 7(23%) indicated they were ‘not concerned’, 5(17%)
indicated they were ‘very concerned’ and 1(3%) indicated ‘I don’t know’. See Figure 4.7
for more details.
I don’t know
Not Concerned
Not very Concerned
Somewhat concerned
Very Concerned
Frequency
10
8
6
4
2
0
1
7
8
9
5
Figure 4.7. Instructors’ responses to first question of the privacy issue.
‘How concerned are you about having students’ biometric data stored in non-
secure storage’, was the second privacy question. Of the 30 respondents, 21(70%)
indicated they were ‘very concerned’, 6(20%) indicated that they were ‘somewhat
concerned’ and 1(3%) was ‘not concerned’. See Figure 4.8 for more details.

The Students’ and Instructors’ attitudes 61
Not Concerned
Not very Concerned
Somewhat concerned
Very Concerned
Frequency
30
20
10
02
6
21
Figure 4.8. Instructors’ responses to second question of the privacy issues.
The third privacy question asked respondents to indicate how concerned they
were about having students’ biometric data used by third party. Of the 30 respondents,
22(73%) indicated they were ‘very concerned’, 9(23%) indicated they were ‘somewhat
concerned’ and 1(3%) was ‘not very concerned’. See Figure 4.9 for more details.
Not very Concerned
Somewhat concerned
Very Concerned
Frequency
30
20
10
0
7
22
Figure 4.9. Instructors’ responses to third question of the privacy issues.
How concerned are you about having students’ biometric data misused by WVU
was the forth privacy question. Of the 30 respondents, 11(37%) indicated they were

The Students’ and Instructors’ attitudes 62
‘somewhat concerned’, 8(27%) indicated they were ‘very concerned’, 6(20%) indicated
they were ‘not very concerned’, 4(13%) indicated they were ‘not concerned’ and 1(3%)
said ‘I don’t know’. See Figure 4.10 for more details.
I don’t know
Not Concerned
Not very Concerned
Somewhat concerned
Very Concerned
Frequency
12
10
8
6
4
2
0
1
4
6
11
8
Figure 4.10. Instructors’ responses to fourth question of the privacy issues.
The fifth privacy question asked respondents to indicate how concerned they
would be about the invasion of students’ privacy when WVU implements biometric
technology. Of the 30 respondents, 13(43%) indicated they would be ‘somewhat
concerned’, 8(27%) indicated they would not ‘not very concerned’, 4(13%) indicated
they would be ‘concerned and 1(3%) indicated ‘I don’t know. See Figure 4.11 for more
details.

The Students’ and Instructors’ attitudes 63
I don’t know
Not Concerned
Not very Concerned
Somewhat concerned
Very Concerned
Frequency
14
12
10
8
6
4
2
01
4
8
13
4
Figure 4.11. Instructors’ responses to fifth question of the privacy issue.
‘How concerned are you about the negative stigma attached to the use of
biometric technology’ was the sixth privacy question. Of the 30 respondents, 10(33%)
indicated they were not ‘very concerned’, 7(23%) indicated they were ‘not concerned’,
6(20%) indicated they were ‘somewhat concerned’, 5(17%) indicated ‘I don’t know’ and
2(7%) indicated they ‘very concerned’. See Figure 4.12 for more details.
I don’t know
Not Concerned
Not very Concerned
Somewhat concerned
Very Concerned
Frequency
12
10
8
6
4
2
0
5
7
10
6
2
Figure 4.12. Instructors’ responses to sixth question of the privacy issues.

The Students’ and Instructors’ attitudes 64
Privacy Concerns of Each Ranked Biometric Technology (Low Medium High)
The second set of privacy question asked respondents to individually rank six
biometric technologies: ‘fingerprint’ ‘iris scan’, ‘facial recognition’, ‘hand geometry’,
‘voice recognition’ and ‘signature dynamic’, according to their level of intrusiveness,
ranging from ‘low’, ‘medium’, ‘high’ to ‘I don’t know’. According to the Instructors’
responses with regard to technology intrusiveness, Signature dynamic was considered the
lowest while Iris scan was ranked the highest. Tables 4.6 and 4.7 summarize these
findings.
Table 4.6
Summary of Instructors’ Responses to Different Biometric Technologies According to
their Intrusiveness
30 30 30 30 30 30
0 0 0 0 0 0
2.00 2.37 2.10 2.23 2.17 1.90
2.00 3.00 2.00 2.00 2.00 2.00
1 3 1 2 2 2
.983 1.066 .960 1.073 .874 .995
.966 1.137 .921 1.151 .764 .990
Valid
Missing
N
Mean
Median
Mode
Std. Deviation
Variance
11.1)
Fingerprint
11.2) Iris
scans
11.3) Facial
recognition
11.4) Hand
geometry
11.5) Voice
recognition
11.6)
Signature
dynamic

The Students’ and Instructors’ attitudes 65
Table 4.7
The Instructors Ranking of Different Biometric Technologies According to their
Intrusiveness
11. Rank each technology according to their intrusiveness
Low Medium High I don’t know Response Total
Fingerprint 12 (40%) 8 (27%) 8 (27%) 2 (7%) 30
Iris scans
“eye scan” 9 (30%) 5 (17%) 12 (40%) 4 (13%) 30
Facial
recognition 10 (33%) 9 (30%) 9 (30%) 2 (7%) 30
Hand
geometry 8 (27%) 13 (43%) 3 (10%) 6 (20%) 30
Voice
recognition 6 (20%) 16 (53%) 5 (17%) 3 (10%) 30
Signature
dynamic 12 (40%) 13 (43%) 1 (3%) 4 (13%) 30
Question Responses
30
Skipped 0
Fingerprint was ranked as follows. Of the 30 respondents, 12(40%) ranked it as
‘low’, 8(27%) ranked it as ‘medium’, another 8(27%) ranked it as ‘high’ and 2(7%)
indicated ‘I don’t know’.
Iris scan was ranked as follows. Of the 30 respondents, 9(30%) ranked it as
‘high’, 5(16.7%) ranked it as ‘low’, 12(40.0%) ranked it as ‘medium’ and 4(13.3%)
indicated ‘I don’t know’.
Facial recognition was ranked as follows. Of the 30 respondents, 10(33.3%)
ranked it as ‘low’, 9(30.0%) ranked it as ‘medium’, another 9(30.0%) ranked it as ‘high’
and 2(6.7%) indicated ‘I don’t know’.

The Students’ and Instructors’ attitudes 66
Hand geometry was ranked as follows. Of the 30 respondents, 8(26.7%) ranked it
as ‘medium’, 13(43.3%) ranked it as ‘low’, 6(20%) indicated ‘I don’t know’ and 3(10%)
ranked it as ‘high’.
Voice recognition was ranked as follows. Of the 30 respondents, 16(53.3%)
ranked it as ‘medium’, 6(20.0%) ranked it as ‘low’, 5(16.7%) ranked it as ‘high’ and
3(10.0%) indicated ‘I don’t know’.
Signature dynamic was ranked as follows. Of the 30 respondents, 13(43.3%)
ranked it as ‘medium’, 12(40.0%) ranked it as ‘low’, 4(13.3%) indicated ‘I don’t know’
and 1(3.3%) ranked it as ‘high’
For more details, see appendix A, Tables A20 through A.25 and Figures A.1
through A.6.
Religious Issues
The study addressed this issue by asking participants two major questions. The
first question addressed the appropriateness of implementing biometric technologies as an
identification method for online classes. The Table 4.8 summarizes these findings.

The Students’ and Instructors’ attitudes 67
Table 4.8
Summary of Instructors’ Responses to Items Related to Religious Issues
30 29
0 1
3.00 2.00
3.00 2.00
5 2
1.576 .267
2.483 .071
Valid
Missing
N
Mean
Median
Mode
Std. Deviation
Variance
12.) In terms
of religious
conflicts, how
appropriate
do you think
the
implementing
of the
biometric
systems in
the WVU are?
(as described
in the
scenario
above)
13.) Do you
think the
implementatio
n of biometric
technology at
WVU
contradicts
your religious
beliefs?
13.)
The survey offered five choices: ‘Very appropriate’, ‘Somewhat appropriate’,
‘Not appropriate’, ‘Not very appropriate’ and ‘I don’t know’. Out of 30 participants,
6(20.0%) responded with ‘Very appropriate’, 8(26.7%) responded with ‘Somewhat
appropriate’, 6(20.0%) responded with ‘Not appropriate’, none of the participants
answered with ‘Not very appropriate’ but 10(30.3%) responded to this question with ‘I
don’t know’. See Tables 4.9 and 4.10.for more details.

The Students’ and Instructors’ attitudes 68
Table 4.9
Summary of Instructors’ Responses to First Question Related to Religious Issues
12.
In terms of religious conflicts, how appropriate do you think the implementing of the
biometric systems in the WVU are?
Response Percent Response Total
Very appropriate
20% 6
Somewhat
appropriate
27% 8
Not appropriate
20% 6
Not very
appropriate
0% 0
I don’t know
33% 10
Question Responses
30
Skipped
0
The second question about the religious issues asked participants if implementing
biometric technologies contradicted their beliefs. Out of 30 participants, only one
participant skipped this question. 27(93%) of the participants said ‘No’, 1(3.0%) said
‘Yes’ and 1(3.0%) said ‘I don’t know’. See Table 4.10 for more details.
Table 4.10
Summery of Instructors’ Responses to Second Question Related to Religious Issues
13.
Do you think the implementation of biometric technology at WVU contradicts
your religious beliefs?
Response Percent Response
Total
Yes
3% 1
No
93% 27
I don't
know
3% 1
Question Responses
29
Skipped
1

The Students’ and Instructors’ attitudes 69
Part of the previous question asked respondents to rank each technology
according to its religious concerns. Since only two of the 30 participants have some
religious concerns about the implementation of biometric technology in online classes,
only these two participants responded to this question. For more details, see Appendix A
(Tables A.26, Table A.27 through Tables A.32 and Figures A.7 through Figures A.13).
Health Issues
The third factor investigated by this study related to the health issues of the
implementation of biometric technology in online classes. The participants responded to
three sets of questions.
The first health question asked respondents how concerned they would be when
biometric technology was introduced. Responses ranged from 1-5. 1= being very
concerned; 2 =being somewhat concerned; 3=being not very concerned; 4=being not
concerned and 5=being I don’t know.
Of the 30 participants who responded to this question, 1(3%) indicated they did not
know whether they would be concerned. Most of the participants 14(47.0%) said that they
were “Not concerned”, 10(33%) “Not very concerned”, 5(17%) somewhat concerned and
none of the participants said he/she was “very concerned”. See Table 4.11.for more
details.

The Students’ and Instructors’ attitudes 70
Table 4.11
Summary of Instructors’ Responses to First Question of Health Issues
16.
When biometric technology is implemented, how concerned are you about the
health risk which might be rendered:
Response
Percent Response
Total
Very concerned
0% 0
Somewhat
concerned
17% 5
Not very
concerned
33% 10
Not concerned
47% 14
I don’t know
3% 1
Question Responses
30
Skipped
0
Health Concerns of Each Ranked Biometric Technology (Low Medium High)
The second health question asked respondents to individually rank six biometric
technologies: ‘fingerprint’ ‘iris scan’, ‘facial recognition’, ‘hand geometry’, ‘voice
recognition’ and ‘signature dynamic’, according to their (the respondents’) level of health
concern, ranging from ‘low’, ‘medium’, ‘high’ to ‘don’t know’. According to the
Instructors’ responses concerning technology health, Fingerprint was considered the
lowest and Iris scan ranked the highest. Table 4.12 summarizes the instructors’ responses
to different technologies from the health point of view.

The Students’ and Instructors’ attitudes 71
Table 4.12
Summary of Biometric Technologies and its Rank by Instructors According to its Health
Concerns
17.
Rank each technology according to your health concerns:
Low Medium High I don’t know Response Total
Fingerprint 25 (83%) 2 (7%) 0 (0%) 3 (10%) 30
Iris scans 13 (43%) 10 (33%) 2 (7%) 5 (17%) 30
Facial recognition 22 (73%) 5 (17%) 0 (0%) 3 (10%) 30
Hand geometry 22 (73%) 3 (10%) 0 (0%) 5 (17%) 30
Voice recognition 23 (77%) 4 (13%) 0 (0%) 3 (10%) 30
Signature dynamic 22 (73%) 2 (7%) 0 (0%) 6 (20%) 30
Question Responses
30
Skipped
0
Fingerprint was ranked as follows. Of the 30 respondents, 25(83%) ranked it as
‘low’, three (10%) indicated ‘I don’t know’ and two (7%) ranked it as ‘medium’.
Iris scan was ranked as follows. Of the 30 respondents, 13(42%) ranked it as ‘low’,
10(33%) ranked it as ‘medium’, two (7%) ranked it as high and five (17%) indicated ‘I
don’t know’.
Facial recognition was ranked as follows. Of the 30 respondents, 22(73%) ranked
it as ‘low’, five (17%) ranked it as ‘medium’ and three (10%) indicated ‘I don’t know’.
Hand geometry was ranked as follows. Of the 30 respondents, 22(73%) ranked it
as ‘low’, 5(17%) indicated ‘I don’t know’ and 3(10%) ranked it as ‘medium’.
Voice recognition was ranked as follows. Of the 30 respondents, 23(77%) ranked
it as ‘low’, 4(13%) ranked it as ‘medium’ and 3(10%) indicated ‘I don’t know.’
Signature dynamic was ranked as follows. Of the 30 respondents, 22(73%) ranked
it as ‘low, 6(20%) indicated ‘I don’t know’ and 2(7%) ranked it as ‘medium’.

The Students’ and Instructors’ attitudes 72
For more details, see appendix A, Tables A40 through A.46 and Figures A.14
through A.21.
Health Concerns of Each Rated Biometric Technology (Comfortability)
The third health question asked respondents to rate (in terms of health concerns)
their level of Comfortability toward the use of these biometric technologies: ‘fingerprint’
‘iris scan’, ‘facial recognition’, ‘hand geometry’, ‘voice recognition’, and ‘signature
dynamic’, ranging from 1=being ‘very comfortable’, 2=being ‘somewhat comfortable’,
3=being ‘not very comfortable’, 4=being ‘not comfortable’ and 5=being ‘I don’t know’.
According to the Instructors’ responses concerning technology comfortability, Fingerprint
was considered the best and Iris scan ranked the lowest. See Table 4.13 and 4.14 for more
details.
Table 4.13
Summary of Instructors’ Responses to Different Technologies According to its Level of
Comfortability
30 30 30 30 30 30
0 0 0 0 0 0
1.70 2.37 1.77 2.17 1.93 1.87
1.00 2.00 1.00 1.00 1.00 1.00
1 1 1 1 1 1
1.264 1.377 1.305 1.599 1.388 1.456
1.597 1.895 1.702 2.557 1.926 2.120
Valid
Missing
N
Mean
Median
Mode
Std. Deviation
Variance
18.1)
Fingerprint 18.2) Iris scan
18.3) Facial
recognition
18.4)Hand
geometry
18.5) Voice
recognition
18.6)
Signature
dynamic

The Students’ and Instructors’ attitudes 73
Table 4.14
Summary of Instructors’ Responses to Different Biometric Technologies According to its
Level of Comfortability
18. In terms of health concerns, please rate your comfortability toward the use of these five
biometric technologies
Very
comfortable Somewhat
comfortable Not very
Comfortable Not
Comfortable I don’t
know Response
Total
Fingerprint 21 (70%) 3 (10%) 2 (7%) 2 (7%) 2 (7%) 30
Iris scan 11 (37%) 7 (23%) 5 (17%) 4 (13%) 3 (10%) 30
Facial recognition 19 (63%) 6 (20%) 1 (3%) 1 (3%) 3 (10%) 30
Hand geometry 17 (57%) 4 (13%) 1 (3%) 3 (10%) 5 (17%) 30
Voice recognition 18 (60%) 4 (13%) 3 (10%) 2 (7%) 3 (10%) 30
Signature
dynamic 20 (67%) 3 (10%) 2 (7%) 1 (3%) 4 (13%) 30
Question Responses
30
Skipped
0
Fingerprint was rated as follows. Of the 30 respondents, 21(70%) indicated they
were very comfortable, 3(10%) indicated they were somewhat comfortable, 2(7%)
indicated they were not very comfortable, another 2(7%) indicated they were not
comfortable; yet another 2(7%) indicted I don’t know.
Iris Scan was rated as follows. Of the 30 respondents, 11(37%) indicated they were
very comfortable, 7(23%) indicated they were somewhat comfortable, 5(17%) indicated
they not very comfortable, 4(13%) indicated they not comfortable and 3(10%) indicated I
don’t know.
Facial recognition was rated as follows. Of the 30 respondents, 19(63%) indicted
they were very comfortable, 6(20%) indicated they were somewhat comfortable, 3(10%)
indicated I don’t know, 1(3%) was not very comfortable and another 1(3%) was not
comfortable.

The Students’ and Instructors’ attitudes 74
Hand geometry was rated as follows. O f the 30 respondents, 17(57%) indicated
they were very comfortable, 5(17%) indicated I don’t know, 4(13%) indicated they were
somewhat comfortable, 3(10%) indicated they were not comfortable and 1(3%) indicated
not comfortable.
Voice recognition was rated as follows. Of the 30 respondents, 18(60%) indicated
they were very comfortable, 4(13%) indicated they were somewhat comfortable, 3(10%)
indicated they were not very comfortable, another 3(10%) indicated I don’t know and
2(7%) indicated not comfortable.
Signature dynamic was rated as follows. Of the 30 respondents, 20(67%) indicted
they were very comfortable, 4(13%) indicated I don’t know, 3(10%) indicated they were
somewhat comfortable, 2(7%) indicated they were not very comfortable and 1(3%)
indicated not very comfortable.
For more details, see appendix A, Tables A47 through A.52 and Figures A.21
through A.26.
Open-ended Questions
The purpose of this section was to give participants the chance to provide more
details and information about the implementation of biometric technology as an
identification method in online classes. The research comprises three questions. These
questions and participants’ responses will be discussed in the next following section.
1. Do you have any comments or suggestions regarding the use of biometric technology
as an authentication method in online or distance learning classes?
Out of 30 instructors who participated in the survey, 17 answered the first
question of the Open-ended section. The participants suggested few items. Most of them

The Students’ and Instructors’ attitudes 75
did not welcome the technology and viewed it as “overkill”, too intrusive, not needed, not
necessary, not feasible or not practical. Another group believed that it is important to
adopt this technology but was concerned about the ethical issue. They suggested adopting
the least possible obtrusive technology. Finally, a few participants went into more detail
and suggested ‘fingerprint’ as the best method among all biometric technologies.
2. Do you have any concerns or reservations, not mentioned in the survey, about the
implementation of biometric technology in online course at WVU?
In answering this question only half of the participants decided to comment. Their
comments and concern approached three main issues. The first issue addressed the
technical aspects of implementing biometric technology: Is biometric technology a
practical and reliable innovation? The second issue covered the ethical and moral aspects
of implementing biometric technology at educational institutes. The concluding issue
identified the cost involved in the implementation and adopting of biometric technology.
3. In your opinion, how can WVU improve the implementation of biometric technology?
Sixteen out-of thirty participants responded to this above question. Instructors
suggested little to improve the adaptation of any technology, in general, and biometric
technology in specific. First, they suggested that the schools should share their decisions
with the students; make sure all parties understood why the technology was being
implemented; and that sufficient measures had been taken to ensure confidentiality. Some
instructors suggested that schools should create forums to discuss the implications and
long-term consequences of biometric technology before such a decision is made. Second,
if schools decided to adopt a technology, then they should take every measure to keep
biometric data confidential and secured. Some of the instructors emphasized the

The Students’ and Instructors’ attitudes 76
importance of training people and personnel to maximize the benefits and minimize the
side effects of biometric technology.
2. Analyses of Data Related to the Research Second Question (RQ2) “Students Group”
Demographic Data
The population of this study involved graduate students in various departments of
the College of Human Resources and Education at the West Virginia University (n=189).
A survey instrument was used to collect data from the study participants. Demographic
data that was collected includes the following informational elements: (1) major of the
respondent, (2) respondents’ gender, (3) respondent’s age, (4) respondents’ race or
ethnicity, (5) respondents’ religious orientation or persuasion, (6) respondents’
knowledge about biometric technology and (7) respondents’ experience with different
type of biometric identification technology. This demographic data was collected and
analyzed to obtain profiles of the respondents and to verify the students being studied. In
addition, demographic data helped to identify and define the characteristics of the survey
respondents. See table 4.15 for more details.

The Students’ and Instructors’ attitudes 77
Table 4.15
Summary of Students’ Demographic Data
189 189 189 183 177
0 0 0 6 12
7.79 1.69 3.58 4.83 3.03
9.00 2.00 3.00 5.00 3.00
10 2 2 5 3
3.594 .462 1.571 .710 .686
12.920 .214 2.468 .504 .471
Valid
Missing
N
Mean
Median
Mode
Std. Deviation
Variance
1.) Major: 2.) Gender: 3.) Age:
4.) Ethnicity
/ Race:
5.) Religion:
This section provides a brief summary of the characteristics of the respondents
that participated in this study. First-demographic item on the survey asked for the name
the department in that the respondent was a graduate student. Out of the 189 students who
completed and submitted the survey, 12 (6.3%) were from Speech Pathology and
Audiology, 33 (17.5%) were from Curriculum and Instruction, 6 (3.2%) were from
Educational Psychology 15 (7.9%) were from Reading, 41 (21.7%) were from Special
education, 16 (8.5%) did not identify their department(s), 8 (4.2%) were from Counseling
Psychology, 9 (4.8%) were from Educational Leadership, 17 (9%) were from Technology
Education, 13 (6.9%) were from Elementary Education, 17 (9%) were from Secondary
Education and 2 (1.1%) were from Counseling. These demographic data are presented in
Figure 4.13 below.

The Students’ and Instructors’ attitudes 78
Other
Technology Educatio
n
Speech Pathology & A
Special Education
Secondary Education
Reading
Elementary Education
Educational Psycholo
Educational Leadersh
Curriculum & Instruc
Counseling Psycholog
Counseling
Frequency
50
40
30
20
10
0
16
17
12
41
17
15
13
6
9
33
8
Figure 4.13. Students’ majors.
Second-demographic item on the survey asked respondents to indicate their
gender. The gender composition was predominately female. Out of the 189 survey
respondents, 131 respondents (69.3%) were female and 58 respondents (30.7%) were
male. This demographic data is presented in Figure 4.14 below.
FemaleMale
Frequency
140
120
100
80
60
40
20
0
131
58

The Students’ and Instructors’ attitudes 79
Figure 4.14. Students’ gender distributions.
Third-demographic item on the survey asked respondents to indicate their age.
The item was later divided into six groups. According to the survey, no participant was
under 21 years old, 68 (36.0%) of the respondents were in the group 21-25 years old, 42
(22.2%) were between 26 and 30, 22 (11.6%) were 31 and 35, 15 (7.9%) were between
36 and 40 and 42 (22.2%) were above age 41. This demographic data is presented in
Figure 4.15.
41 - above36 - 4031 - 3526 – 3021 – 25
Frequency
80
60
40
20
0
42
15
22
42
68
Figure 4.15. Students’ age distributions
Forth-demographic item on the survey asked respondents to indicate their race or
ethnicity. Out of the survey respondents, a majority 172 respondents (91.0%) were Non-
Hispanic Whites while only 1 respondent (0.5%) was of Native American/American
Indian descent, 3 respondents (1.6%) were of African American descent, 4 respondents
(2.1%) were of Asian/Pacific descent, 3 respondents (1.6%) were of Hispanic descent and

The Students’ and Instructors’ attitudes 80
6 respondents (3.2%) identified themselves as other. This demographic data is presented
in Figure 4.16.
White/non-Hispanic
Native American / Am
Hispanic
Asian/ Pacific Islan
African American
Frequency
200
100
0
172
Figure 4.16. Students’ ethnicity/ race distributions
Fifth-demographic item asked respondents to indicate their religious persuasion or
affiliation. Of the surveys returned, 161 respondents (85.2%) were Christian, 7
respondents (3.7%) were Atheist, 5 respondents (2.6%) were Muslim, 1 respondent
(0.5%) was Buddhist, 1 respondent (0.5%) was Hindu, 2 respondents (1.1%) were Jewish
and 12 (6.3%) did not indicate their religion. This demographic data is presented in
Figure 4.17 below.

The Students’ and Instructors’ attitudes 81
MuslimJew ishHinduChris tianBuddhistAtheist
Frequency
200
100
0
161
Figure 4.17. Students’ religions distributions
Sixth-demographic item asked respondents to indicate if they knew what
biometric technology was. Of the survey returned, 121 respondents (64%) indicated that
they knew what biometric technology was while 68 respondents (36%) indicated that
they did not know what biometric technology was. This demographic data is presented in
Figure 4.18 below.
36.0%
64.0%
No
Yes
Figure 4.18. students’ background about biometric technologies.

The Students’ and Instructors’ attitudes 82
Seventh-demographic item asked participants to check all that apply from a list of
six places where they had used biometric technology. Of the 189 participants who
responded to the survey, only 76 (40.2%) respondents checked this question. See Table
4.16 for more details.
Table 4.16
Students’ Responses to Question about Using Biometric Technology at Different
Locations
7. Have you ever used it in (Check all that apply):
Response
Percent Response
Total
School
33% 25
Airport
12% 9
Bank
33% 25
ATM
14% 11
Hospital
9% 7
Federal Building
14% 11
Other
38% 29
Question Responses
76
Skipped
113
For more details about each item and their frequency tables, see Appendix B.
(Tables B.6-B.7 & B.13).
The following table (Table 4.17) summarizes the types of technologies previously
used by student participants. It indicates that fingerprint is the highest technology
experienced by the study participant. Out of 76 participants 66 of them (75%) used
fingerprint, followed by signature dynamic 21 (24%), then facial and voice recognition
11 (12%), hand geometry 10 (11%) and iris scan 5(6%). Finally, of the other technology,

The Students’ and Instructors’ attitudes 83
which was not mentioned in the survey, one respondent made up (1%) of the total
responses.
Table 4.17
Students’ Responses to Question about Different Types of Biometric Technologies
8. What Type of Technology did you use (check all that apply):
Response
Percent Response Total
Fingerprint
75% 66
Iris scan
6% 5
Facial recognition
12% 11
Hand geometry
11% 10
Voice recognition
12% 11
Signature dynamic
24% 21
Other
1% 1
Question Responses
88
Skipped
101
Privacy Issues
The participants responded to two sets of questions. The first set of questions was
made up of six question items. Each question was ranked 1-5 with 1= being very
concerned; 2 =being somewhat concerned; 3=being not very concerned; 4=being not
concerned and 5=being I don’t know. See Table 5.48 for more details. The second
question was a one-question item, which sough to find out the respondent’s perception of
the level of intrusiveness of six biometric technologies. See Tables 4.18 and 4.19 for
more details.

The Students’ and Instructors’ attitudes 84
Table 4.18
Summary of Students’ Responses to Items Related to Privacy Issues
9.) How
concerned are
you about
9.1 having
your biometric
data
collected?
9.2) your
biometric data
stored in non-
secure
storage?
9.3) your
biometric
data used
by third
party?
9.4) your
biometric data
misused by
WVU?
9.5) invasion of
your privacy by
WVU, when
biometric
technology is
implemented?
9.6) the negative
stigma attached
to the use of
biometric
technology?
N Valid 189 189 189 189 189 189
Missin
g 0 0 0 0 0 0
Mean 2.50 1.58 1.62 1.89 1.96 2.46
Median 2.00 1.00 1.00 2.00 2.00 2.00
Mode 2 1 1 1 1 2
Std. Deviation 1.055 .984 .957 1.086 1.046 1.141
Variance 1.113 .968 .917 1.180 1.094 1.303

The Students’ and Instructors’ attitudes 85
Table 4.19
Findings Summary of the First Set of Questions Related to Privacy Issues
9. A. The privacy issues
Very
Concerned Somewhat
concerned Not very
Concerned Not
Concerned I don’t
know Response
Total
How concerned are
you about having
your biometric data
collected?
31 (16%) 76 (40%) 46 (24%) 29 (15%) 7 (4%) 189
How concerned are
you about having
your biometric data
stored in non-
secure storage?
122 (65%) 44 (23%) 8 (4%) 10 (5%) 5 (3%) 189
How concerned are
you about having
your biometric data
used by third party?
113 (60%) 51 (27%) 13 (7%) 7 (4%) 5 (3%) 189
How concerned are
you about having
your biometric data
misused by WVU?
91 (48%) 52 (28%) 27 (14%) 13 (7%) 6 (3%) 189
How concerned are
you about the
invasion of your
privacy by WVU,
when biometric
technology is
implemented?
80 (42%) 60 (32%) 30 (16%) 15 (8%) 4 (2%) 189
How concerned are
you about the
negative stigma
attached to the use
of biometric
technology?
42 (22%) 65 (34%) 45 (24%) 27 (14%) 10 (5%) 189
Question Responses
189
Skipped
0
The first privacy question asked respondents to indicate how concerned they were
about having student biometric data collected. Of the 189 participants who responded to
this question, 31(16.4%) indicated they were ‘Very concerned’, 76(40.2%) indicated they

The Students’ and Instructors’ attitudes 86
were ‘Somewhat concerned’, 46(24.3%) indicated they were ‘Not very concerned’,
29(15.3%) indicated they were ‘Not concerned’ and 7(3.7%) indicated ‘I don’t know’.
See Figure 4.19 for more details.
I don’t know
Not Concerned
Not very Concerned
Somewhat Concerned
Very Concerned
Percent
50
40
30
20
10
0
4
15
24
40
16
Figure 4.19. Students’ concerns about data collections.
‘How concerned are you about having students’ biometric data stored in non-
secure storage’, was the second privacy question. Of the 189 respondents, 122(64.6%)
indicated they were ‘very concerned’, 44(23.3%) indicated that they were ‘somewhat
concerned’, 8(4.2%) indicated they were ‘Not very concerned’, 10(5.3%) indicated they
were ‘Not concerned’ and 5(2.6%) responded by ‘I don’t know’. See Figure 4.20 for
more details.

The Students’ and Instructors’ attitudes 87
I don’t know
Not Concerned
Not very Concerned
Somewhat Concerned
Very Concerned
Percent
70
60
50
40
30
20
10
0
5
4
23
65
Figure 4.20. Students’ concerns about storing data in non-secure storage.
The third privacy question asked respondents to indicate how concerned they
were about having students’ biometric data used by third party. Of the 189 respondents,
113(59.8%) indicated they were ‘very concerned’, 51(27.0%) indicated that they were
‘somewhat concerned’, 13(6.9%) indicated they were ‘Not very concerned’, 7(3.7%)
indicated they were ‘Not concerned’ and 5(2.6%) responded by ‘I don’t know’. See
Figure 4.21 for more details.
I don’t know
Not Concerned
Not very Concerned
Somewhat Concerned
Very Concerned
Percent
70
60
50
40
30
20
10
0
4
7
27
60
Figure 4.21. Students’ concerns about using data by third party.

The Students’ and Instructors’ attitudes 88
‘How concerned are you about having students’ biometric data misused by WVU
was the forth privacy question. Of the 189 respondents, 91(48.1%) indicated they were
‘very concerned’, 52(27.5%) indicated that they were ‘somewhat concerned’, 27(14.3%)
indicated they were ‘Not very concerned’, 6(3.2%) indicated they were ‘Not concerned’
and 6(3.2%) responded by ‘I don’t know’. See Figure 4.22 for more details.
I don’t know
Not Concerned
Not very Concerned
Somewhat Concerned
Very Concerned
Percent
60
50
40
30
20
10
0
3
7
14
28
48
Figure 4.22. Students’ concerns about misusing data by WVU.
The fifth privacy question asked respondents to indicate how concerned they
would be about the invasion of students’ privacy when WVU implements biometric
technology. Of the 189 respondents, 80(42.3%) indicated they were ‘very concerned’,
60(31.7%) indicated that they were ‘somewhat concerned’, 30(15.9%) indicated they
were ‘Not very concerned’, 15(7.9%) indicated they were ‘Not concerned’ and 4(2.1%)
responded by ‘I don’t know’. See Figure 4.23 for more details.
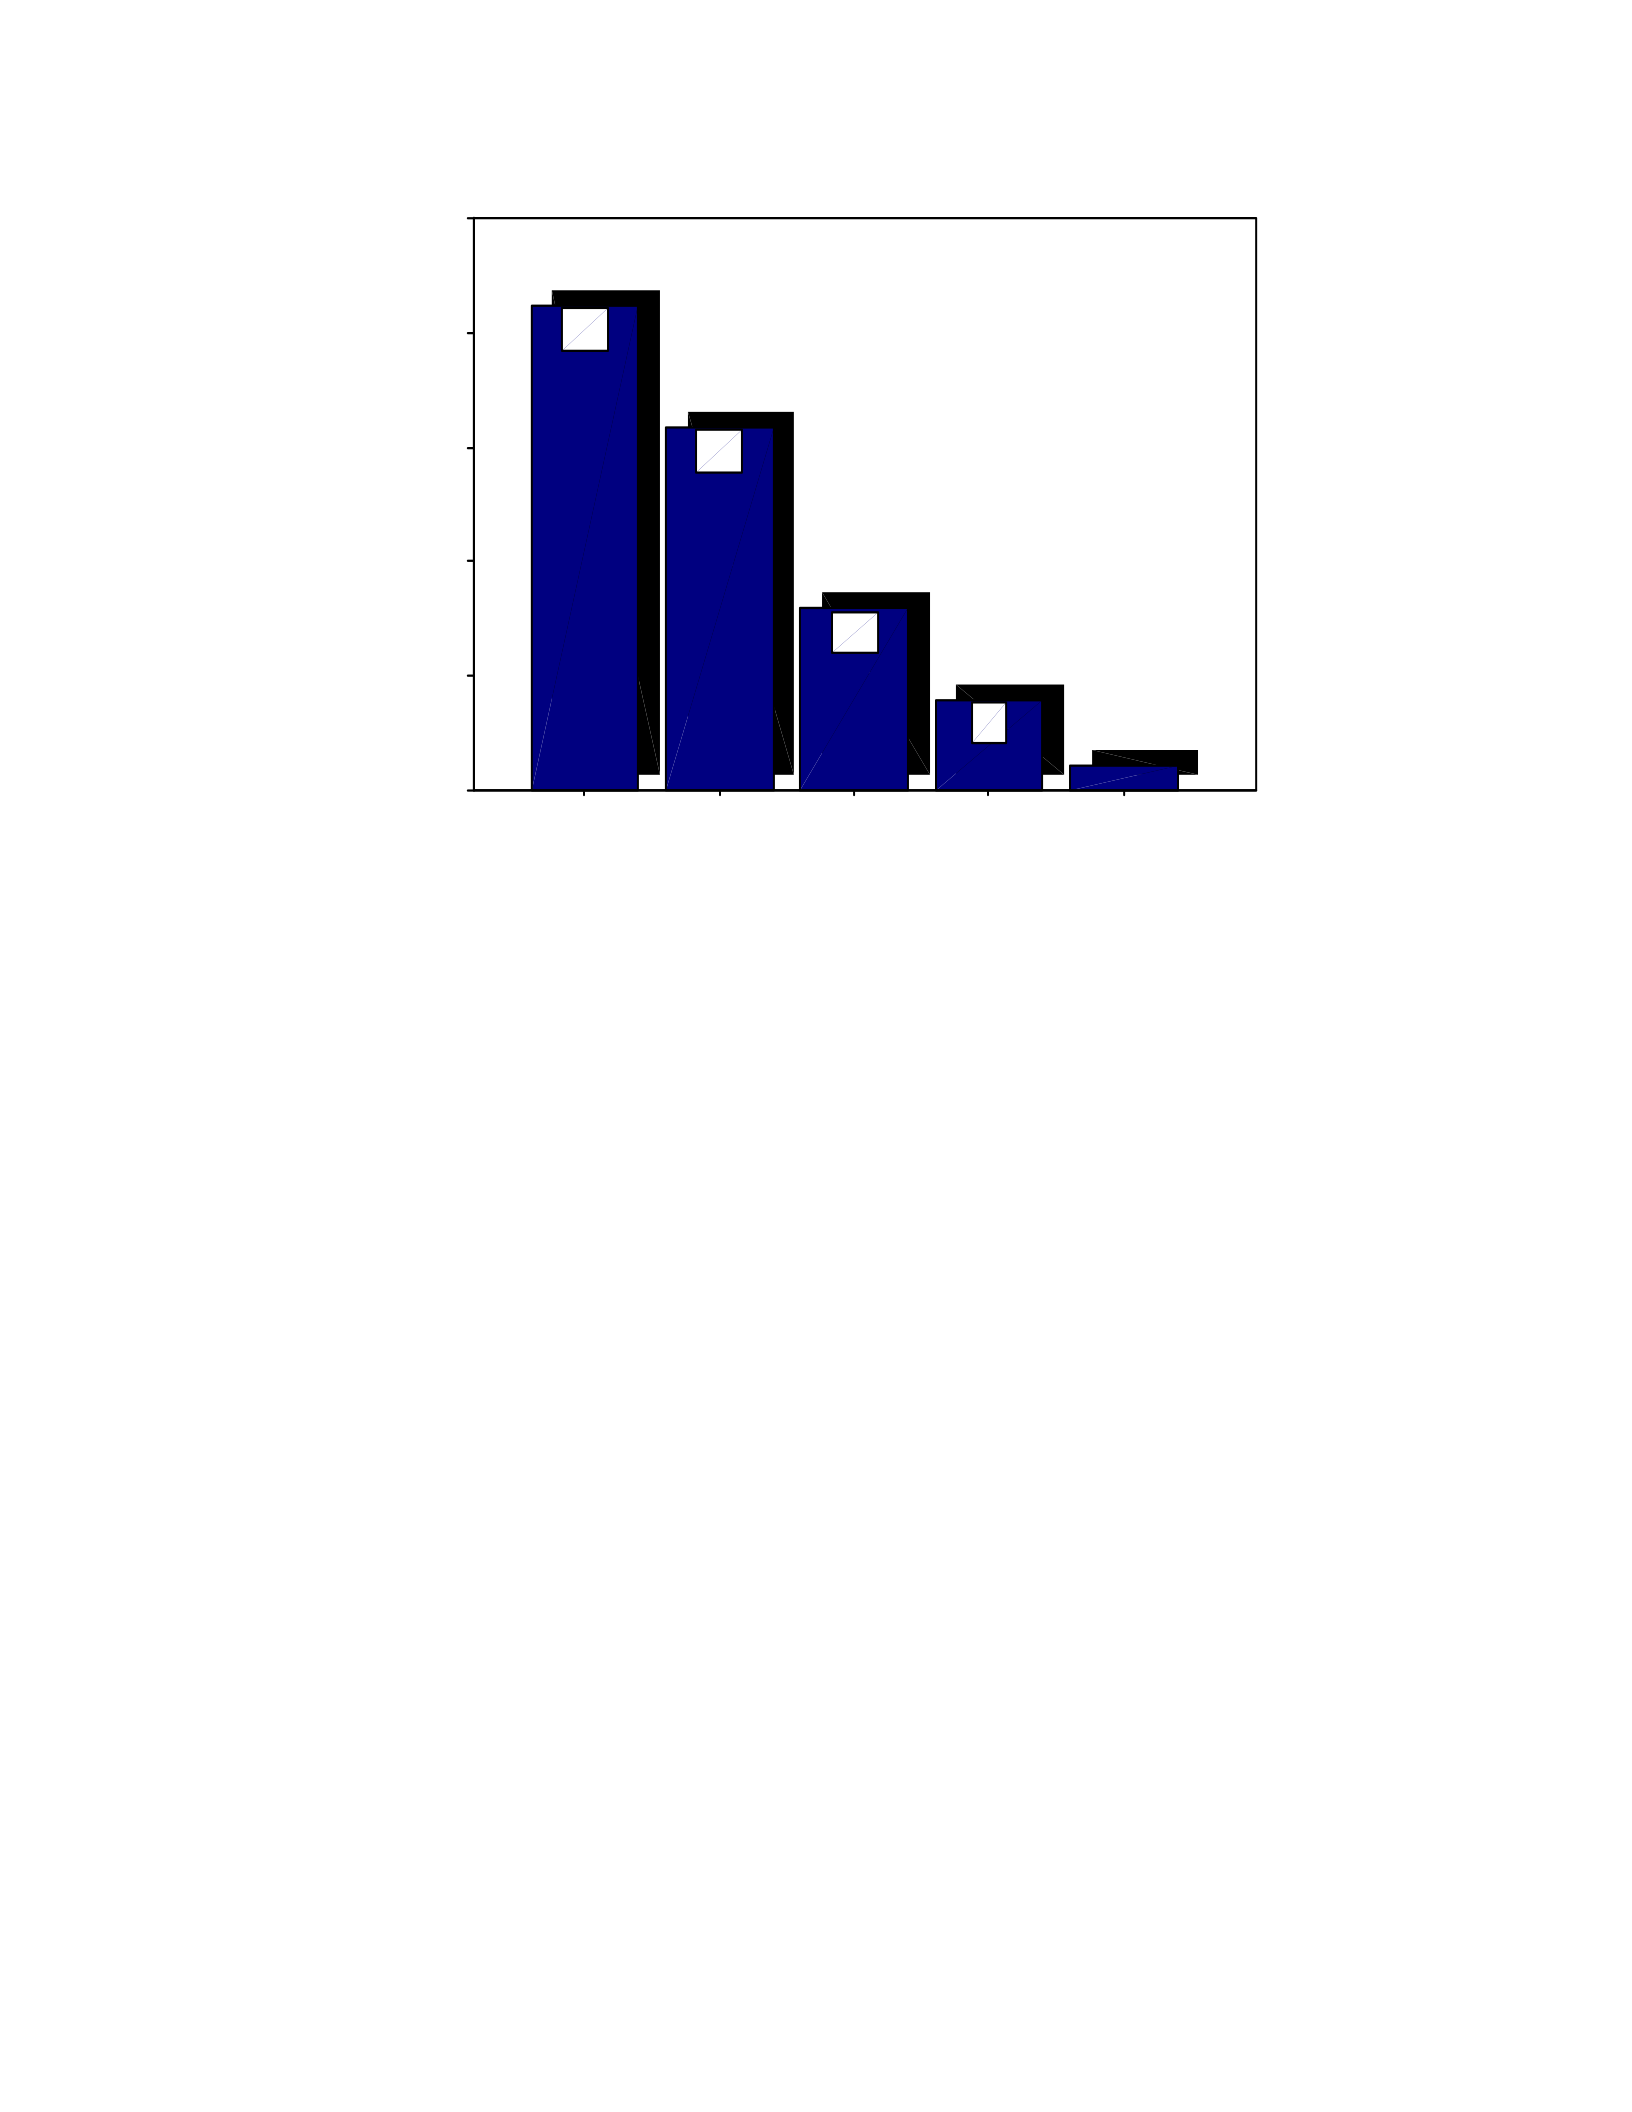
The Students’ and Instructors’ attitudes 89
I don’t know
Not Concerned
Not very Concerned
Somewhat Concerned
Very Concerned
Percent
50
40
30
20
10
0
8
16
32
42
Figure 4.23. Students’ concerns about invasion of privacy.
‘How concerned are you about the negative stigma attached to the use of
biometric technology’ was the sixth privacy question. Of the 189 respondents, 42(22.2%)
indicated they were ‘very concerned’, 65(34.4%) indicated that they were ‘somewhat
concerned’, 45(23.8%) indicated they were ‘Not very concerned’, 72(14.3%) indicated
they were ‘Not concerned’ and 10(5.3%) responded by ‘I don’t know’. These findings are
reported in Figure 4.24 for more details.

The Students’ and Instructors’ attitudes 90
I don’t know
Not Concerned
Not very Concerned
Somewhat Concerned
Very Concerned
Percent
40
30
20
10
0
5
14
24
34
22
Figure 4.24. Students’ concerns about negative stigma.
Privacy Concerns of Each Ranked Biometric Technology (Low Medium High)
The second set of privacy questions asked respondents to individually rank six
biometric technologies: ‘fingerprint’ ‘iris scan’, ‘facial recognition’, ‘hand geometry’,
‘voice recognition’ and ‘signature dynamic’, according to its level of intrusiveness,
ranging from ‘low’, ‘medium’, ‘high’ to ‘don’t know’. According to the Students’
responses concerning technology intrusiveness, ‘Signature dynamic’ was considered the
lowest while ‘Iris scan’ ranked the highest. The tables below (Tables 4.20 and 4.21)
summarize the findings related to the second question followed by a detailed discussion
about each technology.

The Students’ and Instructors’ attitudes 91
Table 4.20
Students’ Responses to Different Biometric Technologies
189 189 189 189 189 189
0 0 0 0 0 0
2.04 2.51 2.30 2.14 2.15 2.03
2.00 3.00 2.00 2.00 2.00 2.00
1 3 2 2 2 1
.975 .796 .873 .947 .893 .948
.951 .634 .763 .896 .797 .898
Valid
Missing
N
Mean
Median
Mode
Std. Deviation
Variance
10.1) Rank
each
technology
according to
their
intrusiveness
- Fingerprint
10.2) Rank
each
technology
according to
their
intrusiveness
- Iris scans
"eye scan"
10.3) Rank
each
technology
according to
their
intrusiveness
- Facial
recognition
10.4) Rank
each
technology
according to
their
intrusiveness
- Hand
geometry
10.5) Rank
each
technology
according to
their
intrusiveness
- Voice
recognition
10.6) Rank
each
technology
according to
their
intrusiveness
- Signature
dynamic
Table 4.21
Findings Summary of Second Set of Questions Related to the Privacy Issues
10. Rank each technology according to their intrusiveness
Low Medium High I don’t know Response Total
Fingerprint 74 (39%) 46 (24%) 57 (30%) 12 (6%) 189
Iris scans 21 (11%) 65 (34%) 88 (47%) 15 (8%) 189
Facial recognition 38 (20%) 71 (38%) 66 (35%) 14 (7%) 189
Hand geometry 56 (30%) 68 (36%) 48 (25%) 17 (9%) 189
Voice recognition 51 (27%) 71 (38%) 55 (29%) 12 (6%) 189
Signature dynamic 68 (36%) 62 (33%) 45 (24%) 14 (7%) 189
Question Responses
189
Skipped
0
Fingerprint was ranked as follows. Of the 189 respondents, 74(39.2%) ranked it as
‘low’, 46(24.3%) ranked it as ‘medium’, 57(30.2%) ranked it as ‘high’ and 12(6.3%)
indicated ‘I don’t know’.

The Students’ and Instructors’ attitudes 92
Iris scan was ranked as follows. Of the 189 respondents, 88(46.6%) ranked it as
‘high’, 21(11.1%) ranked it as ‘low’, 65(34.4%) ranked it as ‘medium’ and 15(7.9%)
indicated ‘I don’t know’.
Facial recognition was ranked as follows. Of the 189 respondents, 38(20.1%)
ranked it as ‘low’, 71(37.6%) ranked it as ‘medium’, 66(34.9%) ranked it as ‘high’ and
14(7.4%) indicated ‘I don’t know’.
Hand geometry was ranked as follows. Of the 189 respondents, 68(36.0%) ranked
it as ‘medium’, 56(29.6%) ranked it as ‘low’, 17(9.0%) indicated ‘I don’t know’ and
48(25.4%) ranked it as ‘high’.
Voice recognition was ranked as follows. Of the 189 respondents, 71(37.6%)
ranked it as ‘medium’, 51(27.0%) ranked it as ‘low’, 55(29.1%) ranked it as ‘high’ and
12(6.3%) indicated ‘I don’t know’.
Signature dynamic was ranked as follows. Of the 189 respondents, 62(32.8%)
ranked it as ‘medium’, 68(36.0%) ranked it as ‘low’, 14(7.4%) indicated ‘I don’t know’
and 45(23.8%) ranked it as ‘high’. Table 4.73 and Figure 4.54 summarize these findings.
For more details, see appendix B, Tables B.20 through B.25 and Figures B.1
through B.6.
Religious Issues
The study addressed this issue by asking participants two major questions (see Table 4.22
for more details). The first question was about the appropriateness of implementing
biometric technologies as an identification method for online classes.

The Students’ and Instructors’ attitudes 93
Table 4.22
Summary of Students’ Responses to Items Related to Religious Issues
189 189
0 0
3.33 2.13
3.00 2.00
5 2
1.451 .482
2.105 .232
Valid
Missing
N
Mean
Median
Mode
Std. Deviation
Variance
11.) In terms
of religious
conflicts, how
appropriate
do you think of
implementing
the biometric
systems as
described in
the scenario
below?
12.) Do you
think the
implementatio
n of biometric
technology at
WVU
contradicts
your religious
beliefs?
There were five choices: ‘Very appropriate’, ‘Somewhat appropriate’, ‘Not
appropriate’, ‘Not very appropriate’ and ‘I don’t know’. Out of 189 participants 17(9.0%)
responded with ‘Very appropriate’, 56(29.6%) responded with ‘Somewhat appropriate’,
34(18.0%) responded with ‘Not appropriate’, 12(6.3) answered with ‘Not very
appropriate’ and 70(37.0%) responded to this question with ‘I don’t know’. For more
details, see Table 4.23.

The Students’ and Instructors’ attitudes 94
Table 4.23
Findings Summary of First Question
11.
In terms of religious conflicts, how appropriate do you think of implementing the
biometric systems as described in the scenario below?
Response
Percent Response
Total
Very appropriate
9% 17
Somewhat
appropriate
30% 56
Not appropriate
18% 34
Not very
appropriate
6% 12
I don’t know
37% 70
Question Responses
189
Skipped
0
The second question related to the religious issue directly asked participants
whether or not implementing biometric technologies contradicted their beliefs. Out of
189 participants 142(75.1%) of the participants said ‘No’, 11(5.80%) said ‘Yes’ and
36(19.0%) said ‘I don’t know’. See Table 4.24 for more details.
Table 4.24
Findings Summary Related to Second Question of Religious Issues.
12.
Do you think the implementation of biometric technology at WVU contradicts your
religious beliefs?
Response Percent Response Total
Yes
6% 11
No
75% 142
I don't know
19% 36
Question Responses
189
Skipped
0

The Students’ and Instructors’ attitudes 95
Religious concerns of each ranked biometric technology (Low Medium High)
Part of the previous question asked to rank each technology according to its
religious concerns. Since only 41 of 189(21.69%) participants have some religious
concerns about the implementation of biometric technology in online classes, 15
participants responded to this question. The table below (Table 4.25) indicates the
frequencies and percentages of each technology and its rank. According to the Students’
responses in regard to technology religious concerns, ‘Fingerprint’ was considered the
lowest while ‘Iris scan’ was ranked the highest.
Table 4.25
Summary of Students’ Ranking Different Biometric Technology According to their
Religious Concerns
14.
If biometric technology conflicts with your religious beliefs, please rank each
technology according to your religious concerns:
Low Medium High I don’t know Response Total
Fingerprint 23 (56%) 2 (5%) 4 (10%) 12 (29%) 41
Iris scans 16 (39%) 3 (7%) 10 (24%) 12 (29%) 41
Facial recognition 18 (44%) 5 (12%) 6 (15%) 12 (29%) 41
Hand geometry 18 (44%) 5 (12%) 7 (17%) 11 (27%) 41
Voice recognition 18 (45%) 8 (20%) 2 (5%) 12 (30%) 40
Signature dynamic 20 (49%) 5 (12%) 4 (10%) 12 (29%) 41
Question Responses
41
Skipped
148
The following tables indicate the rank of each technology according to its
perceived religious interference. Out of 41 participants 23(12.2%) ranked fingerprint as
‘Low’, 2(1.1%) said it is ‘Medium’, 4(2.1%) responded by ‘High’ and finally 12(6.3%)
said they do not know.

The Students’ and Instructors’ attitudes 96
For Iris scan technology, only 41 participated in the ranking process. Out of 41
participants 16(8.5%) ranked iris scan as ‘Low’, 3(1.6%) said it is ‘Medium’, 10(5.3%)
responded by ‘High’ and finally 12(6.3%) said they do not know.
In facial recognition, 41 participated in the ranking process. Out of 41 participants
18(9.5%) ranked facial recognition as ‘Low’, 5(2.6%) said it is ‘Medium’, 6(3.2%)
responded by ‘High’ and finally 12(6.3%) said they do not know.
For hand geometry, 41 participated in the ranking process. Out of 41 participants
18(9.5%) ranked hand geometry as ‘Low’, 5(2.6%) said it is ‘Medium’, 7(3.7%)
responded by ‘High’ and finally, 11(5.8%) said they do not know.
For voice recognition, 41 participated in the ranking process. Out of 41
participants 18(9.5%) ranked voice recognition as ‘Low’, 8(4.2%) said it is ‘Medium’,
2(1.2%) responded by ‘High’ and finally, 12(6.3%) said they do not know.
Finally, for dynamic signature, 41 participated in the ranking process. Out of 41
participants 20(10.62%) ranked fingerprint as ‘Low’, 5(2.6%) said it is ‘Medium’,
4(2.1%) responded by ‘High’ and finally, 12(6.3%) said they do not know.
For more details, see appendix B, Tables B.26 through B.31 and Figures B.7
through B.12.
Health Issues
The third factor that investigated in this study addresses the health issues related
to the implementation of biometric technology in online classes. The participants
responded to three sets of questions.
The first health question asked respondents how concerned they would be when
biometric technology is introduced. Responses ranged from 1-5. 1= being very concerned;

The Students’ and Instructors’ attitudes 97
2 =being somewhat concerned; 3=being not very concerned; 4=being not concerned, and
5=being I don’t know.
Of the 189 participants who responded to this question, 21(11.1%) indicated they
did not know whether they would be concerned. The highest group of the participants
67(35.4%) said that they were “Somewhat concerned”, 55(29.1%) were “Not very
concerned”, 31(16.4%) were Not concerned and 15(7.9%) of the participants said he/she
was “Very concerned”. See Table 4.26 for more details.
Table 4.26
It shows a Summary of Students’ Responses to First Question of Health Issues
15.
When biometric technology is implemented, how concerned are you about the
health risk which might be rendered:
Response Percent Response Total
Very concerned
8% 15
Somewhat concerned
35% 67
Not very concerned
29% 55
Not concerned
16% 31
I don’t know
11% 21
Question Responses
189
Skipped
0
Health concerns of each ranked biometric technology (Low Medium High)
The second health question asked respondents to individually rank six biometric
technologies: ‘fingerprint’ ‘iris scan’, ‘facial recognition’, ‘hand geometry’, ‘voice
recognition’ and ‘signature dynamic’, according to their (the respondents’) level of health
concern, ranging from ‘low’, ‘medium’, ‘high’ to ‘don’t know’. According to the
Students’ responses in regard to technology health ranks, ‘Signature dynamic’ was

The Students’ and Instructors’ attitudes 98
considered the lowest while ‘Iris scan’ was ranked the highest. See Table 4.27 for more
details.
Table 4.27
The Following Table Summarizes the Ranking of Different Biometric Technologies
According to their Health Concerns
16. Rank each technology according to your health concerns:
Low Medium High I don’t know Response Total
Fingerprint 131 (69%) 32 (17%) 9 (5%) 17 (9%) 189
Iris scans 51 (27%) 55 (29%) 62 (33%) 21 (11%) 189
Facial recognition 94 (50%) 43 (23%) 30 (16%) 22 (12%) 189
Hand geometry 105 (56%) 43 (23%) 17 (9%) 24 (13%) 189
Voice recognition 124 (66%) 36 (19%) 10 (5%) 19 (10%) 189
Signature dynamic 135 (71%) 29 (15%) 5 (3%) 20 (11%) 189
Question Responses 189
Skipped 0
Fingerprint ranked as follows. Of the 189 respondents, 131(69.3%) ranked it as
‘low’, 32(16.9%) ranked it ‘Medium’, 9(4.8%) ranked it ‘High’ and 17(9.0%) indicated ‘I
don’t know’.
Iris scan ranked as follows. Of the 189 respondents, 51(27.0%) ranked it as ‘Low’,
55(29.1%) ranked it as ‘Medium’, 62(32.8%) ranked it as ‘High’ and 21(11.1%) indicated
‘I don’t know’.
Facial recognition ranked as follows. Of the 189 respondents, 94(49.7%) ranked it
as ‘Low’, 43(22.8%) ranked it as ‘Medium’, 30(15.9%) ranked it as ‘High’ and 22(11.6%)
indicated ‘I don’t know’.

The Students’ and Instructors’ attitudes 99
Hand geometry ranked as follows. Of the 189 respondents, 105(55.6%) ranked it
as ‘Low’, 43(22.8%) ranked it as ‘Medium’, 17(9.0%) ranked it as ‘High’ and 24(12.7%)
indicated ‘I don’t know’.
Voice recognition ranked as follows. Of the 189 respondents, 124(65.6%) ranked it
as ‘Low’, 36(19.0%) ranked it as ‘Medium’, 10(5.3%) ranked it as ‘High’ and 19(10.1%)
indicated ‘I don’t know’.
Signature dynamic ranked as follows. Of the 189 respondents, 135(71.4%) ranked
it as ‘Low’, 29(15.3%) ranked it as ‘Medium’, 5(2.6%) ranked it as ‘High’ and 20(10.6%)
indicated ‘I don’t know’.
For more details, see appendix B, Tables B.32 through B.37 and Figures B.13
through B.18.
Health Concerns of Each Rated Biometric Technology (Comfortability)
The third health question asked respondents to rate (in terms of health concerns)
their level of Comfortability toward the use of these biometric technology: ‘fingerprint’
‘iris scan’, ‘facial recognition’, ‘hand geometry’, ‘voice recognition’, and ‘signature
dynamic’, ranging from 1=being ‘very comfortable’, 2=being ‘somewhat comfortable’,
3=being ‘not very comfortable’, 4=being ‘not comfortable’ and 5=being ‘I don’t know’.
According to Students’ responses in regard to technology Comfortability, ‘Fingerprint’
was considered the best while ‘Iris scan’ ranked the worst. See Table 4.28 and 4.29 for
more details.

The Students’ and Instructors’ attitudes 100
Table 4.28
The Summary of Different Biometric Technologies and its Ranking According to
Comfortability
189 189 189 189 189 189
0 0 0 0 0 0
1.84 2.89 2.57 2.36 2.25 2.07
2.00 3.00 2.00 2.00 2.00 2.00
1 3 2 2 2 1
1.065 1.185 1.234 1.271 1.220 1.192
1.134 1.404 1.523 1.615 1.488 1.420
Valid
Missing
N
Mean
Median
Mode
Std. Deviation
Variance
Fingerprint Iris scan
Facial
recognition
Hand
geometry
Voice
recognition
Signature
dynamic
Table 4.29
Students’ Response Summary to Different Biometric Technologies from Health
Perspective
17. In terms of health concerns, please rate your comfortability toward the
use of these five biometric technologies
Very
comfortable Somewhat
comfortable Not very
Comfortable Not
Comfortable I don’t
know Response
Total
Fingerprint 90 (48%) 65 (34%) 16 (8%) 10 (5%) 8 (4%) 189
Iris scan 28 (15%) 44 (23%) 52 (28%) 50 (26%) 15 (8%) 189
Facial
recognition 43 (23%) 56 (30%) 45 (24%) 29 (15%) 16 (8%) 189
Hand
geometry 52 (28%) 74 (39%) 27 (14%) 15 (8%) 21
(11%) 189
Voice
recognition 61 (32%) 64 (34%) 35 (19%) 13 (7%) 16 (8%) 189
Signature
dynamic 73 (39%) 68 (36%) 24 (13%) 9 (5%) 15 (8%) 189
Question Responses
189
Skipped
0
Fingerprint rated as follows. Of the 189 respondents, 90(47.6%) indicated they
were ‘Very comfortable’, 65(34.4%) indicated they were ‘Somewhat comfortable’,

The Students’ and Instructors’ attitudes 101
16(8.5%) indicated they were ‘Not very comfortable’, 10(5.3%) indicated they were ‘Not
comfortable; yet another 8(4.2%) indicted ‘I don’t know’.
Iris scan rated as follows. Of the 189 respondents, 28(14.8%) indicated they were
‘Very comfortable’, 44(23.3%) indicated they were ‘Somewhat comfortable’, 52(27.5%)
indicated they were ‘Not very comfortable’, 50(26.5%) indicated they were ‘Not
comfortable; yet another 15(7.9%) indicted ‘I don’t know’.
Facial recognition rated as follows. Of the 189 respondents, 43(22.8%) indicated
they were ‘Very comfortable’, 56(29.6%) indicated they were ‘Somewhat comfortable’,
45(23.8%) indicated they were ‘Not very comfortable’, 29(15.3%) indicated they were
‘Not comfortable; yet another 16(8.5%) indicted ‘I don’t know’.
Hand geometry rated as follows. Of the 189 respondents, 52(27.5%) indicated they
were ‘Very comfortable’, 74(39.2%) indicated they were ‘Somewhat comfortable’,
27(14.3%) indicated they were ‘Not very comfortable’, 15(7.9%) indicated they were ‘Not
comfortable; yet another 21(11.1%) indicted ‘I don’t know’.
Voice recognition rated as follows. Of the 189 respondents, 61(32.3%) indicated
they were ‘Very comfortable’, 64(33.9%) indicated they were ‘Somewhat comfortable’,
35(18.5%) indicated they were ‘Not very comfortable’, 13(6.9%) indicated they were ‘Not
comfortable’; yet another 16(8.5%) indicted ‘I don’t know’.
Signature dynamic rated as follows. Of the 189 respondents, 73(38.6%) indicated
they were ‘Very comfortable’, 68(36.0%) indicated they were ‘Somewhat comfortable’,
24(12.7%) indicated they were ‘Not very comfortable’, 9(4.8%) indicated they were ‘Not
comfortable’; yet another 15(7.9%) indicted ‘I don’t know’.

The Students’ and Instructors’ attitudes 102
For more details, see appendix B, Tables B.38 through B.48 and Figures B.19
through B.24.
Open-ended Questions
The purpose of this section was to give participants a chance to provide more
detailed information about their attitude toward the implementation of biometric
technology as an identification method for online classes. The research was comprised of
three questions. The participants’ responses will be discussed in the following section.
1. Do you have any comments or suggestions regarding the use of biometric technology
as an authentication method in online or distance learning classes?
Out of 189 students who participated in the survey, 82 students answered the first
question of the open-ended section. Some students showed great interest in this
technology. They pointed to the crucial need for reliable technology that might help in
distance learning classes. Some of them were very excited to see the outcome of this
study. Some participants, however, expressed concern about this study. Students’
suggestions and comments categorized into three main classifications.
First classification: students concerns related to the invasion of students privacy.
These students were concerned about the “BIG BROTHERSIM”. Therefore, they
suggested many ways to encrypt data; store it in a safe place; and prohibit its being sold
to any outside party. Biometric data must be used solely for the individual student’s good.
The second classification examined the feasibility and reliability of biometric
technology; students questioned the validity of the biometric technology. They expressed
concern about the convenience of the technology with one student referring to biometric

The Students’ and Instructors’ attitudes 103
technology as “Hostile technology”. The students challenged the ability of biometric
technology to ensure that students will not be able to deteriorate it.
The third classification addressed the cost issue. Most of the students expressed
concern about the cost involved in the process of implementing biometric technology. In
addition, they expressed concern about the increase of tuition fees as a direct outcome.
As an alternative, students suggested a few items that might solve the problem of
identity or serve to better implement biometric technology. One student suggested that
the school could implement an "Honor Code" that is signed by each student claiming that
they have not received any help. This Honor code would be similar to what the service
academies currently use (USNA, ARMY, USAF, and USCG).
More than one student suggested that schools should list any risk related to
technology prior to adopting it; this will build trust between schools and their students. In
order to protect students’ biometric data, group of students suggested that schools should
destroy biometric data as soon as they have completed the distance classes. In addition,
they have suggested the use of signature dynamic; since it is less intrusive compared with
other biometric technologies. Moreover, students thought that schools should also have a
wide range of biometric processes to cater to the unique religious and health needs of
certain students.
2. Do you have any concerns or reservations, not mentioned in the survey, about the
implementation of biometric technology in online course at WVU?
In answering this question, 68 of the participants decided to comment. Their
comments and concern were redundant and repetitive of issues discussed in the survey.
Some students, however, anticipated a drop in the online classes due to a rise in costs.

The Students’ and Instructors’ attitudes 104
One student commented on this question by saying that, “This technology introduces the
concept of “BIG BROTHER” in educational institutes”. A few students commented that
it is more suitable to install biometric technology in locations such stadiums and
recreational centers.
3. In your opinion, how can WVU improve the implementation of biometric technology?
Regarding this question, 66 out of 189 participants responded. Some participants
deem that it is important to combine more that one technology. Some participants
suggested that the school offer several methods of biometric identification, so that
students can pick the technology they are the most comfortable with. The university
should also have an alternative for those with religious or other objections, “and make the
alternative very well known”. Some participants suggested more information and public
awareness before implementing such technology, by educating students as to the reasons
why it is being implemented, at least several months before it is used. Newspaper,
television, instructors, etc could do this. One student suggested that schools have to
ensure that people who handle biometric data have stringent guidelines, and keep
government and other institutions from obtaining the information. This information
would have to be in stored in a highly secure environment by implementing very hard
policies.
3. Analyses of Data Related to the Research Third Question (RQ3)
Comparing Males and Females Instructors and Students
3.1 The difference between Students and Instructors groups in their attitude toward the
implementation of biometric technology in regard to:

The Students’ and Instructors’ attitudes 105
Privacy issues.
An independent-samples t-test was performed to determine if there was a
significant difference between the mean average of privacy concerns between instructors
and students groups. In this question the t-statistic was not significant at the critical alpha
level α = 0.05, (t = 1.356; df = 104; p=.178). Therefore, the researcher concluded that
there was no significant difference between instructors and students.
Religious issues.
An independent-samples t-test was performed to determine if there was a
significant difference between the mean average of religious concerns between
instructors and students groups. In this question the t-statistic was not significant at the
critical alpha level α = 0.05, (t = -1.851; df = 76; p=.068). Therefore, the researcher
concluded that there was no significant difference between instructors and students.
Health issues.
An independent-samples t-test was performed to determine if there was a
significant difference between the mean average of health concerns between instructors
and students groups. In this question the t-statistic was significant at the critical alpha
level α = 0.05, (t = 3.218; df = 108; p=.002). Therefore, the researcher concluded that
there was a significant difference between instructors and students in regard to their
concerns about health issues. For more details, see Tables 4.30 and Figure 4.25.

The Students’ and Instructors’ attitudes 106
Table 4.30
Comparison between Students and Instructors Groups Regarding Health Issues
Group Statistics
29 3.31 .761 .141
81 2.72 .884 .098
Groups
instructors
students
15.) When biometric
technology is
implemented, how
concerned are you about
the health risk which
might be rendered:
NMean Std. Deviation
Std. Error
Mean
Independent Samples Test
.789 .377 3.218 108 .002 .59 .185 .228 .960
3.454 56.932 .001 .59 .172 .250 .939
Equal varian
c
assumed
Equal varian
c
not assumed
15.) When biometri
c
technology is
implemented, how
concerned are you
a
the health risk whic
h
might be rendered:
FSig.
Levene's Test for
quality of Variance
s
tdf
S
ig. (2-tailed
)
Mean
Difference
Std. Error
Difference Lower Upper
95% Confidence
Interval of the
Difference
t-test for Equality of Means

The Students’ and Instructors’ attitudes 107
studentsinstructors
Count
40
30
20
10
0
Health issue
Very Concerned
Somewhat Concerned
Not very Concerned
Not Concerned
I don’t know
12
17
14
30
10
28
56
Figure 4.25. Instructors and students responses to question regarding the Health issues.
3.2 The difference between Male and Female in the surveyed population in their attitude
toward the implementation of biometric technology in regard to:
Privacy issues.
An independent-samples t-test was performed to determine if there was a
significant difference between the mean average of privacy concerns between male and
female in the survey population. In this question the t-statistic was not significant at the
critical alpha level α = 0.05, (t = 1.470; df = 195; p=.108). Therefore, the researcher
concluded that there was no significant difference between male and female regarding the
privacy issue in the surveyed population.

The Students’ and Instructors’ attitudes 108
Religious issues.
An independent-samples t-test was performed to determine if there was a
significant difference between the mean average of religious concerns between male and
female in the survey population. In this question the t-statistic was significant at the
critical alpha level α = 0.05, (t = -2.393; df = 137; p=.018). Therefore, the researcher
concluded that there was a significant difference between male and female regarding
religious concerns.
Table 4.31
The Summary Case for First Question Related to Religious Issues
Group Statistics
56 2.09 .900 .120
83 2.43 .784 .086
2.) Gender:
Male
Female
11.) In terms of
religious conflicts, how
appropriate do you
think of implementing
the biometric systems
as described in the
scenario below?
NMean Std. Deviation
Std. Error
Mean
Independent Samples Test
.210 .647 -2.393 137 .018 -.34 .144 -.629 -.060
-2.329 106.918 .022 -.34 .148 -.638 -.051
Equal varianc
e
assumed
Equal varianc
e
not assumed
11.) In terms of
religious conflicts,
h
appropriate do you
think of implementi
the biometric syste
as described in th
e
scenario below?
FSig.
Levene's Test for
E
quality of Variance
s
tdf
S
ig. (2-tailed
)
Mean
Difference
Std. Error
Difference Lower Upper
95% Confidence
Interval of the
Difference
t-test for Equality of Means

The Students’ and Instructors’ attitudes 109
FemaleMale
Count
40
30
20
10
0
Very appropriate
Somewhat appropriate
Not appropriate
Not very appropriate
66
33
7
35
29
9
14
Figure 4.26. Males and females responses to question regarding the religious issues.
Health issues.
An independent-samples t-test was performed to determine if there was a
significant difference between the mean average of health concern between male and
female in the surveyed population. In this question the t-statistic was not significant at the
critical alpha level α = 0.05, (t = .864; df = 195; p=.389). Therefore, the researcher
concluded that there was no significant difference between male and female regarding
health issues in the survey population.

The Students’ and Instructors’ attitudes 110
Instructors’ Group
3.3 The differences between Male and Female within Instructors group in regard to:
Privacy issues.
An independent-samples t-test was performed to determine if there was a
significant difference between the mean average of privacy concerns between male and
female at instructors group. In this question the t-statistic was not significant at the
critical alpha level α = 0.05, (t = -1.636; df = 22; p=.116). Therefore, the researcher
concluded that there was no significant difference between males and females.
Religious issues.
An independent-samples t-test was performed to determine if there was a
significant difference between the mean average of religious concerns between male and
female in instructors group. The t-statistic was not significant at the critical alpha level
α= 0.05, (t = -1.826; df = 18; p=.085). Therefore, the researcher concluded that there was
no significant difference between males and females.
Health issues
An independent-samples t-test was performed to determine if there was a
significant difference between the mean average of health concerns between male and
female in instructors group. The t-statistic was not significant at the critical alpha level
α= 0.05, (t = -1.862; df = 27; p=.073). Therefore, the researcher concluded that there was
no significant difference between males and females.

The Students’ and Instructors’ attitudes 111
Students’ Group
3.4 The differences between Male and Female within Students group in regard to:
Privacy issues.
An independent-samples t-test was performed to determine if there was a
significant difference between the mean average of privacy concerns between male and
female in students group. In this question the t-statistic was not significant at the critical
alpha level α = 0.05, (t = 1.925; df = 171; p=.056). Therefore, the researcher concluded
that there was no significant difference between males and females.
Religious issues.
An independent-samples t-test was performed to determine if there was a
significant difference between the mean average of religious concerns between male and
female in instructors group. The t-statistic was not significant at the critical alpha level
α= 0.05, (t = -1.614; df = 117; p=.109). Therefore, the researcher failed to reject the null
hypothesis and concluded that there was no significant difference between males and
females.
Health issues.
An independent-samples t-test was performed to determine if there was a
significant differences between the mean average concerns between male and female in
instructors group. The t-statistic was not significant at the critical alpha level α = 0.05,
(t= 1.037; df = 166; p=.301). Therefore, the researcher concluded that there was no
significant difference between males and females.

The Students’ and Instructors’ attitudes 112
Phase III: Comparative Analysis:
In this section, a comparative analysis between both methods qualitative and
quantitative took place. Since the research is a complementary qualitative,
QUANTITATIVE method, analysis of the interviews were discussed in the beginning of
this chapter. Here both analyses were contrasted, compared and integrated. The
discussion is based on the three main research questions.
1. How concerned are instructors about the implementation of biometric technology as
an identification method in distance learning classes in terms of:
a. Privacy issues?
b. Religious issues?
c. Health issues?
2. How concerned are students about the implementation of biometric technology as
identification method in distance learning classes in terms of:
a. Privacy issues?
b. Religious issues?
c. Health issues?
3. What differences are there between groups (e.g., instructors and students, males and
females, social and cultural backgrounds) in their responses to items regarding:
a. Privacy issues?
b. Religious issues?
c. Health issues?

The Students’ and Instructors’ attitudes 113
The attitude of instructors and students toward the implementation of biometric
technology as an identification method for online classes was very clear from the
perspective of privacy and health. Instructors for example, expressed their thoughts and
concerns that implementing such systems might contribute to the invasion of student
privacy. On the other hand, students were very nervous, and afraid, that such biometric
systems might exemplify BIGBROTER in their schools.
The quantitative data collected through surveys confirmed that fear. In answering
set of questions rating their privacy such as 1=‘Very Concerned’, 2=’Somewhat
Concerned’, 3=’Not Very Concerned’, 4= ‘Not Concerned’ and 5= ‘I don’t know’. Both
instructors and students were considered “Somewhat Concerned”, the Mean for
instructors is 2.11, and 1.90 for students. Only 6 instructors out of 30 and 107 students
out of 189 who decided to respond to any question with ‘I don’t know’, which not
counted in calculating the Mean of the privacy issue.
In the next issue, “The Religion issue”, as it was discussed in the interviews
analysis, instructors and students were not sure about the implication of biometric
technology on people’s beliefs. The majority of people who interviewed did not express
any type of concern related to religious issue. On the other hand, the return of surveys
were evident that people is not concerned from religious point of view about
implementing biometric technology and religious beliefs. For example, 20 out of 30
(66.66%) of Instructors answered the question which related to the appropriateness of
using biometric technology from religious point of view. On the other side, few students
answered the same question, only 30(68%) responded with Mean 2.4.

The Students’ and Instructors’ attitudes 114
In answering second question related to religious concerns: “Do you think the
implementation of biometric technology at WVU contradicts your religious beliefs?” 29
out of 30 (97%) of the Instructors said ‘No’ and 142 out of 153 (92.81%) who answered
the question said ‘No’.
The last issue is the health concerns. The interviews analyses indicate that
Instructors have no health concerns about implementing biometric technology. Students,
however, were not sure about the health implication of biometric technology. They did
not express their feeling clearly. Comparing this result with surveys results which
indicate that Instructors responded to health question with Mean = 3.31 where 3 is ‘Not
Concerned’. Students, however, answered the health question with Mean= 2.72.
The third question of the research (RQ3) was to compare between groups;
Instructors and Students, Male and female, in the surveyed population or within each
group. The research question 3.1-A,B and C were to compare between Instructors and
Students groups in their response to questions related to the three major issues privacy,
religious and health issues. An independent-samples t-test was performed to determine if
there was a significant difference between the mean of privacy concerns between
Instructors and students groups (RQ3.1-a). The t-statistic was not significant at the
critical alpha level α = 0.05, (t = 1.356; df = 104; p=.178). Therefore, the researcher
failed to reject the null hypothesis and concluded that there was no significant difference
between Instructors and Students’ responses about the privacy concerns.
Regarding the religious issue (RQ3.1-b), an independent-samples t-test was
performed to determine if there was a significant difference between the mean average of
religious concerns between Instructors and students groups. The t-statistic was not

The Students’ and Instructors’ attitudes 115
significant at the critical alpha level α = 0.05, (t = -1.851; df = 76; p=.068). Therefore, the
researcher failed to reject the null hypothesis and concluded that there was no significant
difference between Instructors and Students about the religious concerns.
Regarding the health issue (RQ3.1-c), an independent-samples t-test was
performed to determine if there was a significant difference between the mean average of
health concerns between Instructors and students groups. The t-statistic was significant at
the critical alpha level α = 0.05, (t = 3.218; df = 108; p=.002). Therefore, the researcher
succeeded to reject the null hypothesis and thus concluded that there was a significant
difference between Instructors and Students in regard to their concerns about health
issues.
The research question 3.2-A, B and C were to compare between Male and Female
in the surveyed population in their responses to questions related to three major issues
privacy, religious and health issues. The regarding the privacy issue (RQ3.2-a), an
independent-samples t-test was performed to determine if there was a significant
difference between the mean average of privacy concerns between male and female in the
survey population. The t-statistic was not significant at the critical alpha level α = 0.05,
(t= 1.470; df = 195; p=.108). Therefore, the researcher failed to reject the null hypothesis
and concluded that there was no significant difference between male and female
regarding the privacy issue in the surveyed population.
The regarding the religious issues (RQ3.2-b), an independent-samples t-test was
performed to determine if there was a significant difference between the mean average of
religious concerns between male and female in the survey population. The t-statistic was
significant at the critical alpha level α = 0.05, (t = -2.393; df = 137; p=.018). Therefore,

The Students’ and Instructors’ attitudes 116
the researcher succeeded to reject the null hypothesis and thus concluded that there was a
significant difference between male and female regarding religious concerns.
The regarding the health issues (RQ3.2-c), an independent-samples t-test was
performed to determine if there was a significant difference between the mean average of
health concern between male and female in the surveyed population. The t-statistic was
not significant at the critical alpha level α = 0.05, (t = .864; df = 195; p=.389). Therefore,
the researcher failed to reject the null hypothesis and thus concluded that there was no
significant difference between male and female regarding health issues in the survey
population.
The research question 3.3-A, B and C were to compare between Male and female
within Instructors group, in their responses to questions related to privacy, religious and
health issues. Regarding the research question (RQ3.3-a), an independent-samples t-test
was performed to determine if there was a significant difference between the mean
average of privacy concerns between male and female in Instructors group. The t-statistic
was not significant at the critical alpha level α = 0.05, (t = -1.636; df = 22; p=.116).
Therefore, the researcher failed to reject the null hypothesis and concluded that there was
no significant difference between males and females.
Regarding the research question (RQ3.3-b), an independent-samples t-test was
performed to determine if there was a significant difference between the mean average of
religious concerns between male and female in Instructors group. The t-statistic was not
significant at the critical alpha level α = 0.05, (t = -1.826; df = 18; p=.085). Therefore, the
researcher failed to reject the null hypothesis and concluded that there was no significant
difference between males and females.

The Students’ and Instructors’ attitudes 117
Regarding the research question (RQ3.3-c), an independent-samples t-test was
performed to determine if there was a significant difference between the mean average of
health concerns between male and female in Instructors group. The t-statistic was not
significant at the critical alpha level α = 0.05, (t = -1.862; df = 27; p=.073). Therefore, the
researcher failed to reject the null hypothesis and concluded that there was no significant
difference between males and females regarding the health issues.
The research question 3.4-A, B and C were to compare between Male and female
within Students’ group, in their responses to questions related to privacy, religious and
health issues. Regarding the researcher question (3.4-a), an independent-samples t-test
was performed to determine if there was a significant difference between the mean
average of privacy concerns between male and female in students group. The t-statistic
was not significant at the critical alpha level α = 0.05, (t = 1.925; df = 171; p=.056).
Therefore, the researcher failed to reject the null hypothesis and concluded that there was
no significant difference between males and females concerning the privacy issue.
Regarding the researcher question (3.4-b), an independent-samples t-test was
performed to determine if there was a significant difference between the mean average of
religious concerns between male and female in Instructors group. The t-statistic was not
significant at the critical alpha level α = 0.05, (t = -1.614; df = 117; p=.109). Therefore,
the researcher failed to reject the null hypothesis and concluded that there was no
significant difference between males and females.
Regarding the researcher question (3.4-c), an independent-samples t-test was
performed to determine if there was a significant difference between the mean average
concerns between male and female in Instructors group. The t-statistic was not significant

The Students’ and Instructors’ attitudes 118
at the critical alpha level α = 0.05, (t = 1.037; df = 166; p=.301). Therefore, the
researcher failed to reject the null hypothesis and concluded that there was no significant
difference between males and females concerning the health issues.

The Students’ and Instructors’ attitudes 119
CHAPTER 5
Research Findings
Summary of the Research Design, Discussions, Implications and Recommendations
This chapter includes four brief sections. These sections are intended to provide the
following information: (1) a summary of the research design and findings, (2) a
discussion of the results, (3) implications of the study, and (4) recommendations for
future research.
Summary of the Research Design
The purpose of this study was to examine Instructors and Students’ attitudes
toward using biometric technology as an identification method in online courses. The
study was designed to determine which issues are more critical to both Instructors and
learners in the College of Human Resources and Education at West Virginia University,
as well as to test the acceptability of biometric technology as an authentication method in
online courses from both points of view. Findings and results of this research will help
schools, Instructors and learners better understand the nature of biometric technology, as
well as, help stakeholders to design and implement the biometric authentication system
with minimal side effects.
Qualitative methods were used initially to establish the basis of this study,
followed by a quantitative instrument. This quantitative method makes up the main part
of the study. For the purpose of clarity, the outlines of procedures are listed below. The
researcher has previously identified social and cultural factors that contribute to the
adaptation of biometric systems in educational institutions. Furthermore, the existing

The Students’ and Instructors’ attitudes 120
instruments such as questionnaires that were used by others to assess the implementation
of biometric systems in other settings were reviewed.
Review of Research Questions and results
The following are the main findings of this study. They are presented below based
on the three research questions that were being investigated in this study. To address these
questions, the researcher used a mixed method. Detailed interviews were conducted with
five Instructors and five Students at the College of Human Resources and Education. The
analyses of the interviews are provided in CHAPTER 4.
There were three major research questions used in this study. These were further
divided into three sub-questions. These three research questions included the following:
1. How concerned are instructors about the implementation of biometric technology as
an identification method in distance learning classes in terms of:
a. Privacy issues?
b. Religious issues?
c. Health issues?
2. How concerned are students about the implementation of biometric technology as an
identification method in distance learning classes in terms of:
a. Privacy issues?
b. Religious issues?
c. Health issues?
3. What differences are there between groups (e.g., Instructors and Students, Males and
Females, etc.) in their responses to items regarding:
a. Privacy issues?

The Students’ and Instructors’ attitudes 121
b. Religious issues?
c. Health issues?
Research Question 1-A (RQ1a) sought to find out how concerned Instructors are
about the Privacy issues related to the implementation of biometric technology in online
classes. The outcomes of interviews indicated that there were privacy concerns among
Instructors about implementing biometric technology in online classes. The surveys, in
addition, confirmed the same results.
The next item was related to the religious issues, Research Question 1-B (RQ1b)
was about Instructors’ religious concerns related to the implementation of biometric
technology in online classes. Interviews indicated that Instructors were not sure about the
implication of biometric technology on people’s beliefs. The majority of people who
interviewed did not express any type of concern related to religious issue. On the other
hand, the returns of surveys were evident that people are not concerned about biometric
technology when religion is the factor.
Research Question 1-C (RQ1c) was about the health implications related to the
implementation of biometric technology from Instructors perspectives. According to
interviews, Instructors did not express their opinion clearly. Surveys, on the other hand,
concluded that Instructors did not have any concern toward biometric when health risk is
considered.
Research Question 2-A (RQ2a) sought to find out how concerned Students are
about the Privacy issues related to the implementation of biometric technology in online
classes. The outcomes of interviews indicated that there were privacy concerns among

The Students’ and Instructors’ attitudes 122
Students about implementing biometric technology in online classes. The surveys,
confirmed the same result.
The next item was related to the religious issues, Research Question 2-B (RQ2b)
was about Students’ religious concerns related to the implementation of biometric
technology in online classes. Interviews indicated that Students did not express a clear
concern regarding the contradiction between biometric technology and their beliefs. On
the other hand, the returns of surveys were evident that people are not concerned about
biometric technology when religion is the factor.
Research Question 2-C (RQ2c) was about the health implications related to the
implementation of biometric technology from students perspectives. According to
interviews, Students were concerned about the health risk related to biometric technology,
particularly the Iris scan. Surveys, on the other hand, confirmed that Students were
‘Somewhat Concerned’ toward biometric technology when health risk is considered.
The third question of the research (RQ3) was to compare between different
groups; The t-test for independent samples employed to measure the differences between
Instructors and Students groups and their concerns toward implementing biometric
technology from privacy, religious and health point of views (RQ3.1-A,B and C). The
researcher concluded that there was no significant difference between Instructors and
Students group except in their responses to the questions related to the health issues.
Additionally, the t-test for independent samples employed to measure the
differences between Male and Female in the surveyed population and their concerns
toward implementing biometric technology from privacy, religious and health point of
views (RQ3.2-A,B and C). The researcher concluded that there was no significant

The Students’ and Instructors’ attitudes 123
difference between Male and Female in the surveyed population except in their responses
to the questions related to the religious issues.
Furthermore, the t-test for independent samples employed to measure the
differences between Male and Female at Instructors’ group and their concerns toward
implementing biometric technology from privacy, religious and health point of
views(RQ3.3-A,B and C). The researcher concluded that there was no significant
difference between Male and Female in Instructors’ group in their response to the survey
questions.
Finally, the t-test for independent samples employed to measure the differences
between Male and Female at Students’ group and their concerns toward implementing
biometric technology from privacy, religious and health point of views (RQ3.4-A,B and
C). The researcher concluded that there was no significant difference between Male and
Female in Students’ group in their response to the survey questions.

The Students’ and Instructors’ attitudes 124
Table 5.1
Summary of the study findings
Privacy issues Religious issue Health issues
Research Question 1
Instructors
Interviews:
Instructors were
concerned.
Surveys:
It confirmed the
same results.
Interviews:
Instructors did
not express any
type of concern.
Surveys:
Instructors were
not concerned.
Interviews:
Instructors did
not express
their opinion
clearly.
Surveys:
Instructors
were not
concerned.
Research Question 2
Students
Interviews:
Students were
concerned.
Surveys:
It confirmed the
same result.
Interviews:
Students did not
express a clear
concern.
Surveys:
Students were
not concerned.
Interviews:
Students were
concerned.
Surveys:
Students were
‘Somewhat
Concerned’.
Instructors
3.1
differences
at the
surveyed
Population Students
There was no
significant
difference.
There was no
significant
difference.
There was a
significant
difference.
Male
3.2
differences
Surveyed
Population Female
There was no
significant
difference.
There was a
significant
difference.
There was no
significant
difference.
Male
3.3
Within
Instructors’
Group Female
There was no
significant
difference.
There was no
significant
difference.
There was no
significant
difference.
Male
Research Question 3
3.4
Within
Students’
Group Female
There was no
significant
difference.
There was no
significant
difference.
There was no
significant
difference.

The Students’ and Instructors’ attitudes 125
Discussions
In general, privacy was a concern for both instructors and students. The notion of
invasion of privacy, the intrusiveness of the technology and the Big brother-issue was
highly emphasized during the study. Other people in other researches and studies
expressed the same concerns. The literature review pointed out that people questioned the
appropriateness of biometric technology (Wayman, 2001b). Many users believed that
biometric technology invades their privacy. A few decades ago, when fingerprinting was
first introduced, people resisted it (Ankari, 2001; Zimmerman, 2002). Wayman warned
users about the ethical issues related to the use of biometric technology (Wayman,
2001b). During the interviews, students questioned the ethics and morality of using
biometric technology in educational institutes.
As far as religious issues are considered, the research did not find any strong
evidence of contradiction between biometric technology and religious beliefs. In some
other studies, religious sects believed that using facial recognition or fingerprints
contradict their theological teachings (ORC report, 2002), but this concern was largely
unsupported by this study. However, it bares mention that one instructor recalled an
incident of a student’s refusal to allow her photo be taken because of religious reasons.
Concerning health hazards Zimmermann stated, “People are debating whether
such technology as retinal scans, iris scans, and facial recognition are too intrusive”
(Zimmermann, 2002). This concern held true for Students but not for Instructors. For
example, the study showed that the highest intrusiveness is iris scan.
The third research question was about comparison between different groups;
Students and Instructors; Males and Females. The outcome of the research was not a

The Students’ and Instructors’ attitudes 126
surprise. Students and Instructors had no significant differences between them concerning
the privacy issues. It was a surprise that there was not was not a real concern for both
groups regarding religious issues. Students and Instructors did not see a direct correlation
between using biometric technology and religious beliefs. However, religious affiliation
of participants was not diverse; (85% of Students and 70% of Instructors were Christian).
Health issues, however, were important to students but not for instructors. One
possible justification for this difference is that students will be subjected directly to the
use of biometric technology more than will instructors.
Implications
As Rogers mentions in his book “Diffusion of Innovation”, the consequences of
innovation come afterward, following the adoption of the innovation. In the case of
biometric technology, consequences are desirable versus undesirable, direct versus
indirect and anticipated versus unanticipated (Rogers, 1995).
Some of the consequences are good (desirable), some are not good (undesirable).
As Rogers mentioned in one of his generalizations “undesirable, indirect and
unanticipated consequences come together, in the other hand, desirable, direct and
anticipated consequences come together”.
This study assessed implementing biometric technology at virtual classes in
educational institutions. The following is a summary of the implications:

The Students’ and Instructors’ attitudes 127
The desirable, direct and anticipated consequences of implementing biometric technology
are as follows:
• First, conduct a needs assessment before implementing biometric technology,
followed by a public awareness campaign. For example, one instructor was
quoted saying: “I would suggest serious consideration of the NEED for this before
any attempts to implement are completed”. Another instructor pointed to the need
for more information about the technology: “More education on exactly what it is
and why it is needed”.
• Biometric technology may not be able to authenticate an individual’s identity
accurately in all cases. For example, one student was concerned about the
technical aspect of the technology; he was quoted as saying, “I am concerned that
the technology is not adequate, that identification errors may occur”. Therefore,
combining biometric technology with a traditional system (hybrid technology)
will improve its efficiency (Wayman & others, 2003).
• There are varieties of choices among biometric technologies such as fingerprint,
iris scan, signature dynamic, etc. This enables institutions to choose the
technology that fits them best. The participants reacted differently to different
biometric technologies. They showed more acceptances to signature dynamic over
iris scan. In other studies, some technologies were accepted and adopted
differently due to their nature and accuracy (Tistarelli & others, 2002).
• Biometric technology gives more prestige to institutions. This is especially
important during the accreditation processes. Some students and instructors were
excited to see the technology implemented in their school. One student expressed

The Students’ and Instructors’ attitudes 128
his feeling saying, “I think it can be a powerful tool in order to make DL
[Distance Learning] classes more reliable, regarding attendance and
participation”. Another student thought that the school should adopt new
technology other than traditional systems. He was quoted saying, “It would
definitely replace the usernames and login passwords, which might increase
security”.
• Biometric technology provides more privacy, security, confidentiality and
integrity to users’ data as compared to traditional methods of identification, yet it
has its own drawbacks.
The undesirable, indirect and unanticipated consequences associated with biometric
technology are:
• Cost involved in implementing, maintaining and adopting biometric technology
might place an unwanted financial burden on students within the institution. For
example, one instructor posed this question: “Will the cost and inconvenience be
worth it?” In addition, one student was quoted saying:
I think the concept is a great idea, but I think the cost outweighs the
benefits. Not a lot of students take online courses, and it is just as easy for
them to be identified via an ID number just as on campus courses.
Also, one instructor emphasized the implication of cost involved in this process.
The instructor was quoted saying:
I have a concern about the cost-benefit ratio for the university and for
students. I would think it would be expensive for WVU to install on
campus, without any proof that cheating by surrogates is a major problem.

The Students’ and Instructors’ attitudes 129
For students taking courses on their home or work computers, installing
the hardware and software to transmit the data to campus are likely to be a
significant additional expense that could be incurred for a single course.
In contrast, with other methods, biometric technology requires specific hardware
and software. It mandates specific sensors to capture target characteristics or
behavior. Additionally, there is a need for specific programs to run the
applications. In traditional systems, there is no need for specific application,
devices or hardware (Hart & Albalawi, 2003; ORC, 2000).
• The health hazards associated with certain biometric technologies are uncertain;
however, there still exist concerns within those who use the technology. The study
suggests signature dynamic as a biometric technology with less health
implications. This research suggests it wise to avoid technology associated with
the possibility (either perceived or real) of high health risk. The study indicated
that iris scan was perceived as the worst.
• Implementing biometric technology might drive people away from online classes
due to their intrusive nature and cost. One student expressed this concern by
saying “This technology will impact the number of classes I will not take on-line
due to rise in costs”.
• When adopting biometric technology, it is essential to put in place very clear and
hard policies to protect the collected biometric data; data collected must not be
shared with other parties. Stating rules and policies, by itself, is a sophisticated
process; it might generate some conflicts within local, state or federal
constitutions. The failure to provide these policies, however, might result in

The Students’ and Instructors’ attitudes 130
catastrophic implications (Wayman, 2001b). Participants were very concerned
about the potential abuse of their biometric data. Supporting this contention, other
studies (Ankari, 2001), speculated the disastrous consequences of revealing
biometric data.
Recommendations and Future Studies
The outcomes of this research indicate that it is important to conduct deep
research in the area of biometric technologies and its implications on societies. Since this
research was limited to the graduate students and instructors of the College of Human
Resources and Education, future studies might be conducted with a mixed method with
more participants from different groups such as students, instructors, staff, administration
and technicians. It will be helpful to investigate the logistical and technical aspect of the
implication of implementing biometric technology on educational institutes. Deep
interviews and comprehensive document analysis combined with detailed surveys will be
a great technique to uncover unknown reasons behind the resistance to adopting
biometric technology.
Such long-term broad research should be conducted at different colleges and
schools in order to bring more diversity in terms of race, gender, religious affiliations and
experiences. In addition, it is recommended to focus on privacy issues; since most of this
study’s participants emphasized its importance during interviews and in their responses to
surveys questions.

