


Introduction Stakeholder Perceptions of Security Policies
1.1 Overview
Over the past few years, mainstream IS Security literature has identified ‘security policy
compliance’ as an area of concern. The majority of the security breaches occur due to violations of
established security controls by employees within organizations. Poor compliance with security
policies mostly occurs because of 1) lack of awareness and proper understanding of the meaning
of the security policies, 2) and the mismatch between organization’s rules and individual’s norms
(i.e. values). In fact, employees in the same organization may have different understanding and
perceptions regarding organization security policies, which can be seen obviously in their behavior
(i.e. the conflict between policies and actions) (Vaast, 2007; Albrecthsen and Hovden, 2009). Also,
employee norms can be affected by security incidents that an organization may face.
There is no doubt that the agreement between individuals’ norms and organization security rules
affect the security of an organization. Most IS literature considers factors that directly or indirectly
cause the violation of security policies. They studied the extrinsic and intrinsic factors that affect
compliance with security policies. These factors include, but are not limited to, selfefficacy (Herath
and Rao, 2009b; Rhee et al., 2009); perceived effectiveness (Herath and Rao
(2009a); perceived value congruence (Son, 2011); sanctions (Bulgurcu et al., 2010); rewards
(Boss et al., 2009; Bulgurcu et al., 2010; Stanton et al., 2005); and normative beliefs (Herath and
Rao, 2009; Bulgurcu et al., 2010). Indeed, few studies touch on how norms influence employee
intention to comply with security policies. That is, they consider only the link between norms and
security policies. However, IS literature tends to ignore how individuals’ norms in respect to
security policy change following a security breach, which reflects the conflict between norms and
security rules.
In this thesis, we argue that occurrence of security breach cause changes to individuals’ values in
light of security policy of the organization. These changes in the values can be reflected on the

compliance of individuals’ norms with security rules and standards, which in turn reflected on
individuals’ behavior within the organization. Organizations need to ensure the compliance of
security policy with values of their employees. Thus, they can mitigate or eliminate violations of
organizational security. However, it is difficult to find a standard method that organizations can
use to ensure the agreement between security rules and individuals’ norms.
Using the Repertory Grid technique based on the Personal Construct Theory, we examine how a
security breach shapes individual values concerning security policy of an organization. In order to
conduct the argument, we propose an assessment mechanism that helps the organization to assess
individuals’ values regarding security policy. Based on that assessment, the organization can
develop an appropriate mechanism to ensure compliance of individuals’ norms with security rules,
and to ensure effectiveness, efficiency, and efficacy of the security policy.
The rest of this chapter is organized as follows. Section 1.2 presents the overall aim, contribution,
and scope of this dissertation besides research questions. Section 1.3 provides definitions to some
of the related concepts. Section 1.4 outlines the structure of this dissertation.
1.2 Nature and Scope of the Research
The main objective of this research is to understand how individuals perceive information security
policy and how their perceptions change in response to the occurrence of security breaches. Also,
this study aims to identify the relationship between individuals’ norms and values, and security
rules and policy. Thus, organizations can ensure that they have the required level of compliance of
individual norms with security rules and standards. This research aims to address the following
research questions:
• How does security policy shape an individual’s values in the first place?

• How does security breach change an individual’s values?
• What is the relationship between security policy and individual values?
• How could assessment of norm and rule compliance help in creating better policy?
This research contributes to research and practice. For research, the Repertory Grid technique,
which is grounded on the Personal Construct Theory, is widely used in the field of psychology
besides other disciplines. However, this methodology is new to the field of Information Systems.
Using this methodology helps to study human values and perceptions more deeply. Currently, most
research in the field of information systems focuses heavily on technical and organizational issues.
Applying Repertory Grid technique can be a motivation to consider the human aspects more in the
research. For practice, organizations can use Repertory Grids to investigate and understand
employees’ values and to examine how their norms differ in response to some incidents. This
research uses a combination of Repertory Grid technique and Action Design
Research to develop a mechanism that organizations can use to sync norms and rules.
This research falls under the behavioral Information Security research. Specifically, it focuses on
studying individual’s norms and how it relates to organization’s rules. That is, it investigates the
compliance of norms with security rules (i.e. norm-rule compliance).
1.3 Key Terms
This section provides definitions for some key terms that form a basis for the concept of “normrule
compliance” in the organization. The arguments of this dissertation are rooted in these concepts.
1.3.1 Information Systems Security (InfoSec)
There are many definitions information systems security (or information security) that are
available in the literature. Pipkin (2000) defines information security as “the process of protecting
the intellectual property of an organization.” Anderson (2003) defines information security as “a
well-informed sense of assurance that information risks and controls are in balance.” On the other

hand, Venter and Eloff (2003) defines information security as “the protection of information and
minimizes the risk of exposing information to unauthorized
parties.”
Threats to the information systems could be either internal to the organization or external; could
be caused by human actions or non-human (environmental) incidents. Regardless of the source of
threats, violations may be either intentional or unintentional (Loch et al., 1992). Information
systems security focuses on securing formal and informal systems besides technical system. Any
contention between these three systems may disrupt information security in an organization. A
formal system encompasses information systems and information security. An informal system is
“the natural means to augment the formal system” (Dhillon, 2007; p .4). The technical system is
computerized parts of the formal system (Dhillon, 2007). Thus, information security is more than
the security of technical aspect; it also concerns social and organizational aspects of information
systems (Dhillon and Torkzadeh, 2006).
However, information security goes beyond ensuring that information systems are not damaged,
stolen or destroyed. Instead, information security focuses on protecting information systems from
any incident that may threaten information confidentiality, integrity, availability, privacy,
authentication, identification, authorization, and accountability. Information security involves
management of information security and security of the computer, data, and network. A security
policy represents the overlap between information security management, computer and data
security, and network security (Dhillon and Torkzadeh, 2006).
1.3.2 Information Systems Security Policy
A policy is organizational rules and guidelines that guide behaviors within the organization. Thus,
information security policy is a set of instructions and rules that are developed by the management
to guide employees in the organization to an appropriate behavior about the usage of information
systems to guarantee their security (Dhillon, 1997). There are three main categories of the policy

within the context of information security: enterprise information security policy; issue-specific
security policies; and system-specific policies (Whitman and
Mattord, 2013). Enterprise information security policy is created within the context of strategic IT
plan and forms the key for information security within the organization. Issue-specific security
policies provide rules that guide the usage of specific technology. System-specific policies govern
the configuration and usage of certain aspects of technology. These policies may be technical,
managerial, or both (Dhillon, 1997).
Information security policy is a key aspect in ensuring information security (Von Solms, 2001). It
is the first step to secure the organizations against internal and external incidents that may disrupt
its information security (Whitman et al., 2001). Security policy should direct employees within the
organization to the proper means for managing information security and reaching desired
consequences (Stahl et al., 2012). Security policy is critical to information security; it can be
considered as a platform for overall security program practices within an organization (von Solms
and von Solms, 2004b). It helps in ensuring the integrity, availability, and confidentiality of
information (Straub, 1990).
Information security policies should be informed by the current practices of the organization.
However, most organizations use pre-defined international standards as a basis for defining
organizational practices. The content and form of the security policy are two elements related to
security policy effectiveness (Goel and Chengalur-Smith, 2010). However, most organizations pay
more attention to the content of the security policy. The literature related to the policy content
suggests using pre-defined security policies and standards (Janczewski, 2000). On the other hand,
Goel and Chengalur-Smith (2010) propose three dimensions for the format of security policy that
must be considered to ensure effectiveness. These dimensions are breadth (i.e. coverage of the
policy); clarity (i.e. policy should be written in a language that is easily understood by technical
and non-technical users); and brevity (i.e. policy is short and to the point) (Goel and Chengalur-
Smith, 2010).

1.3.3 Values and Norms
Individual’s values are a system of “learned beliefs” related to favored things, behaviors and/or a
final existential state (Horley, 2012). Scheibe (1970) emphasizes that values involve “what is
wanted, what is best, what is desirable or preferable, what ought to be done” (Scheibe, 1970; p.
42). That is, an individual always uses her or his values as standards to assess objects, people, and
opinions. Thus, values can be considered as the core of the people.
According to Kelly (1955), values are the core constructs that “govern a person’s maintenance
process” and provide meaning for personal identity by providing information about who a person
is and what kind of people she or he represents. By having this self-knowledge, a person can
interact socially and then protect her/his existence. Kelly (1955) differentiates between values,
which are core constructs, and the beliefs, which are peripheral constructs. That is, values are
different from people’s beliefs.
Values are bipolar; they need opposites to make sense. People evaluate events and/or situations
around them based on their “bipolar” values (Kelly, 1955). For example, values such as big and
tall do not make sense without their opposites, small and short. Many researchers (Kelly, 1955;
Fishben and Ajzen, 1975) have emphasized that values should be described as bipolar constructs
to have a meaning.
In the field of information systems, there is a growing interest in investigating the way people think
and how they perceive information systems and technology they create and use. Some researchers
agree that understanding expectations, perceptions, values, and beliefs of individuals can ensure
getting more successful results of information systems (Tan and Hunter, 2002).
On the other hand, individual norms (also called subjective norms) reflect how an individual
perceive social pressures and opinions of “referent” people, and how she or he behave based on

that perception (Mathieson, 1991). That is, individual norms explain the perception of an individual
regarding what is important concerning a certain behavior (Ifinedo, 2012). Ifinedo
(2012) defines individual norms as “normative stimuli, beliefs, and motivations to comply with a
particular act, which is largely informed by consultation or observation of the behaviors of others”
(Ifinedo, 2012). Individual norms are affected by what is perceived as common norms in the
environment, which in turn affect or motivate individual’s behavior (Johnston and Warkentin,
2010). Therefore, Individuals within an organization tend to comply with information security of
their organization when they observe that individuals around them are complying with these
security policies (Ifinedo, 2012). Indeed, norms are criteria that are involved in the concept of
human values. That is, norms are guidelines that are established in advance and represent an
individual’s values (Hayden et al., 2007; Björkdahl, 2002; Rallapalli et al., 2000).
Various information security literature emphasizes that individual norms have a strong effect on
individual’s intention to comply with the security policy (Venkatesh et al., 2003; Herath and Rao,
2009; Bulgurcu et al., 2010).
1.3.4 Systems Security Engineering-Capability Maturity Model (SSE-CMM)
The SSE-CMM is a model that focuses on implementing security in the systems. This model is
derived from the Capability Maturity Model (CMM) that is developed to help organizations to
evolve from an ad hoc state to a highly organized and effective state. SSE-CMM has been
recognized as an ISO standard, which focuses on security. The main purpose of developing
SSECMM is to ensure and improve system security and develop trusted products. However,
SSECMM integrates security engineering with the other engineering disciplines (Carnegie-
Mellon, 2003).
The security engineering field has different principles and frameworks to assess security
engineering; however, these frameworks are not comprehensive. SSE-CMM provides a

comprehensive framework that can be used to evaluate the maturity levels for organizations
security and identify improvements to security engineering practices. SSE-CMM is used to
improve the security engineering practices and advance the quality and availability of secure,
reliable products and security engineering services (Carnegie-Mellon, 2003).
The SSE-CMM encompasses two dimensions: domain and capability. The domain dimension
involves the “base practices” that describe security engineering. The capability dimension includes
“generic practices” which suggest process management capability and should be achieved as part
of performing base practices. The SSE-CMM comprises 129 base practices that offer context and
support for the Systems Security Engineering. 61 base practices cover main areas of security
engineering. 68 base practices deal with the project and organization domains (Carnegie-Mellon,
2003).
Generic practices are applied to deal with the process management, process measurement, and
process institutionalization, as well as to define the capability of an organization. Generic practices
are grouped into five “Capability Levels” that ordered according to the maturity level. Thus,
generic practices that are placed on the top of the capability dimension imply higher levels of
process capability. Each capability level has one or more general practices. The SSE-CMM five
capability levels are as follow (Carnegie-Mellon, 2003):
• Level 1: Performed Informally
This level focuses on performing a process that combines the base practices. That is, base practices
are performed. This level can be described by the statement “you have to do it before you can
manage it” (Carnegie-Mellon, 2003).
• Level 2: Planned and Tracked
This level concentrates on issues related to the project-level definition, planning, and performance.
This level can be described by the statement “understand what's happening on the project before
defining organization-wide processes” (Carnegie-Mellon, 2003).
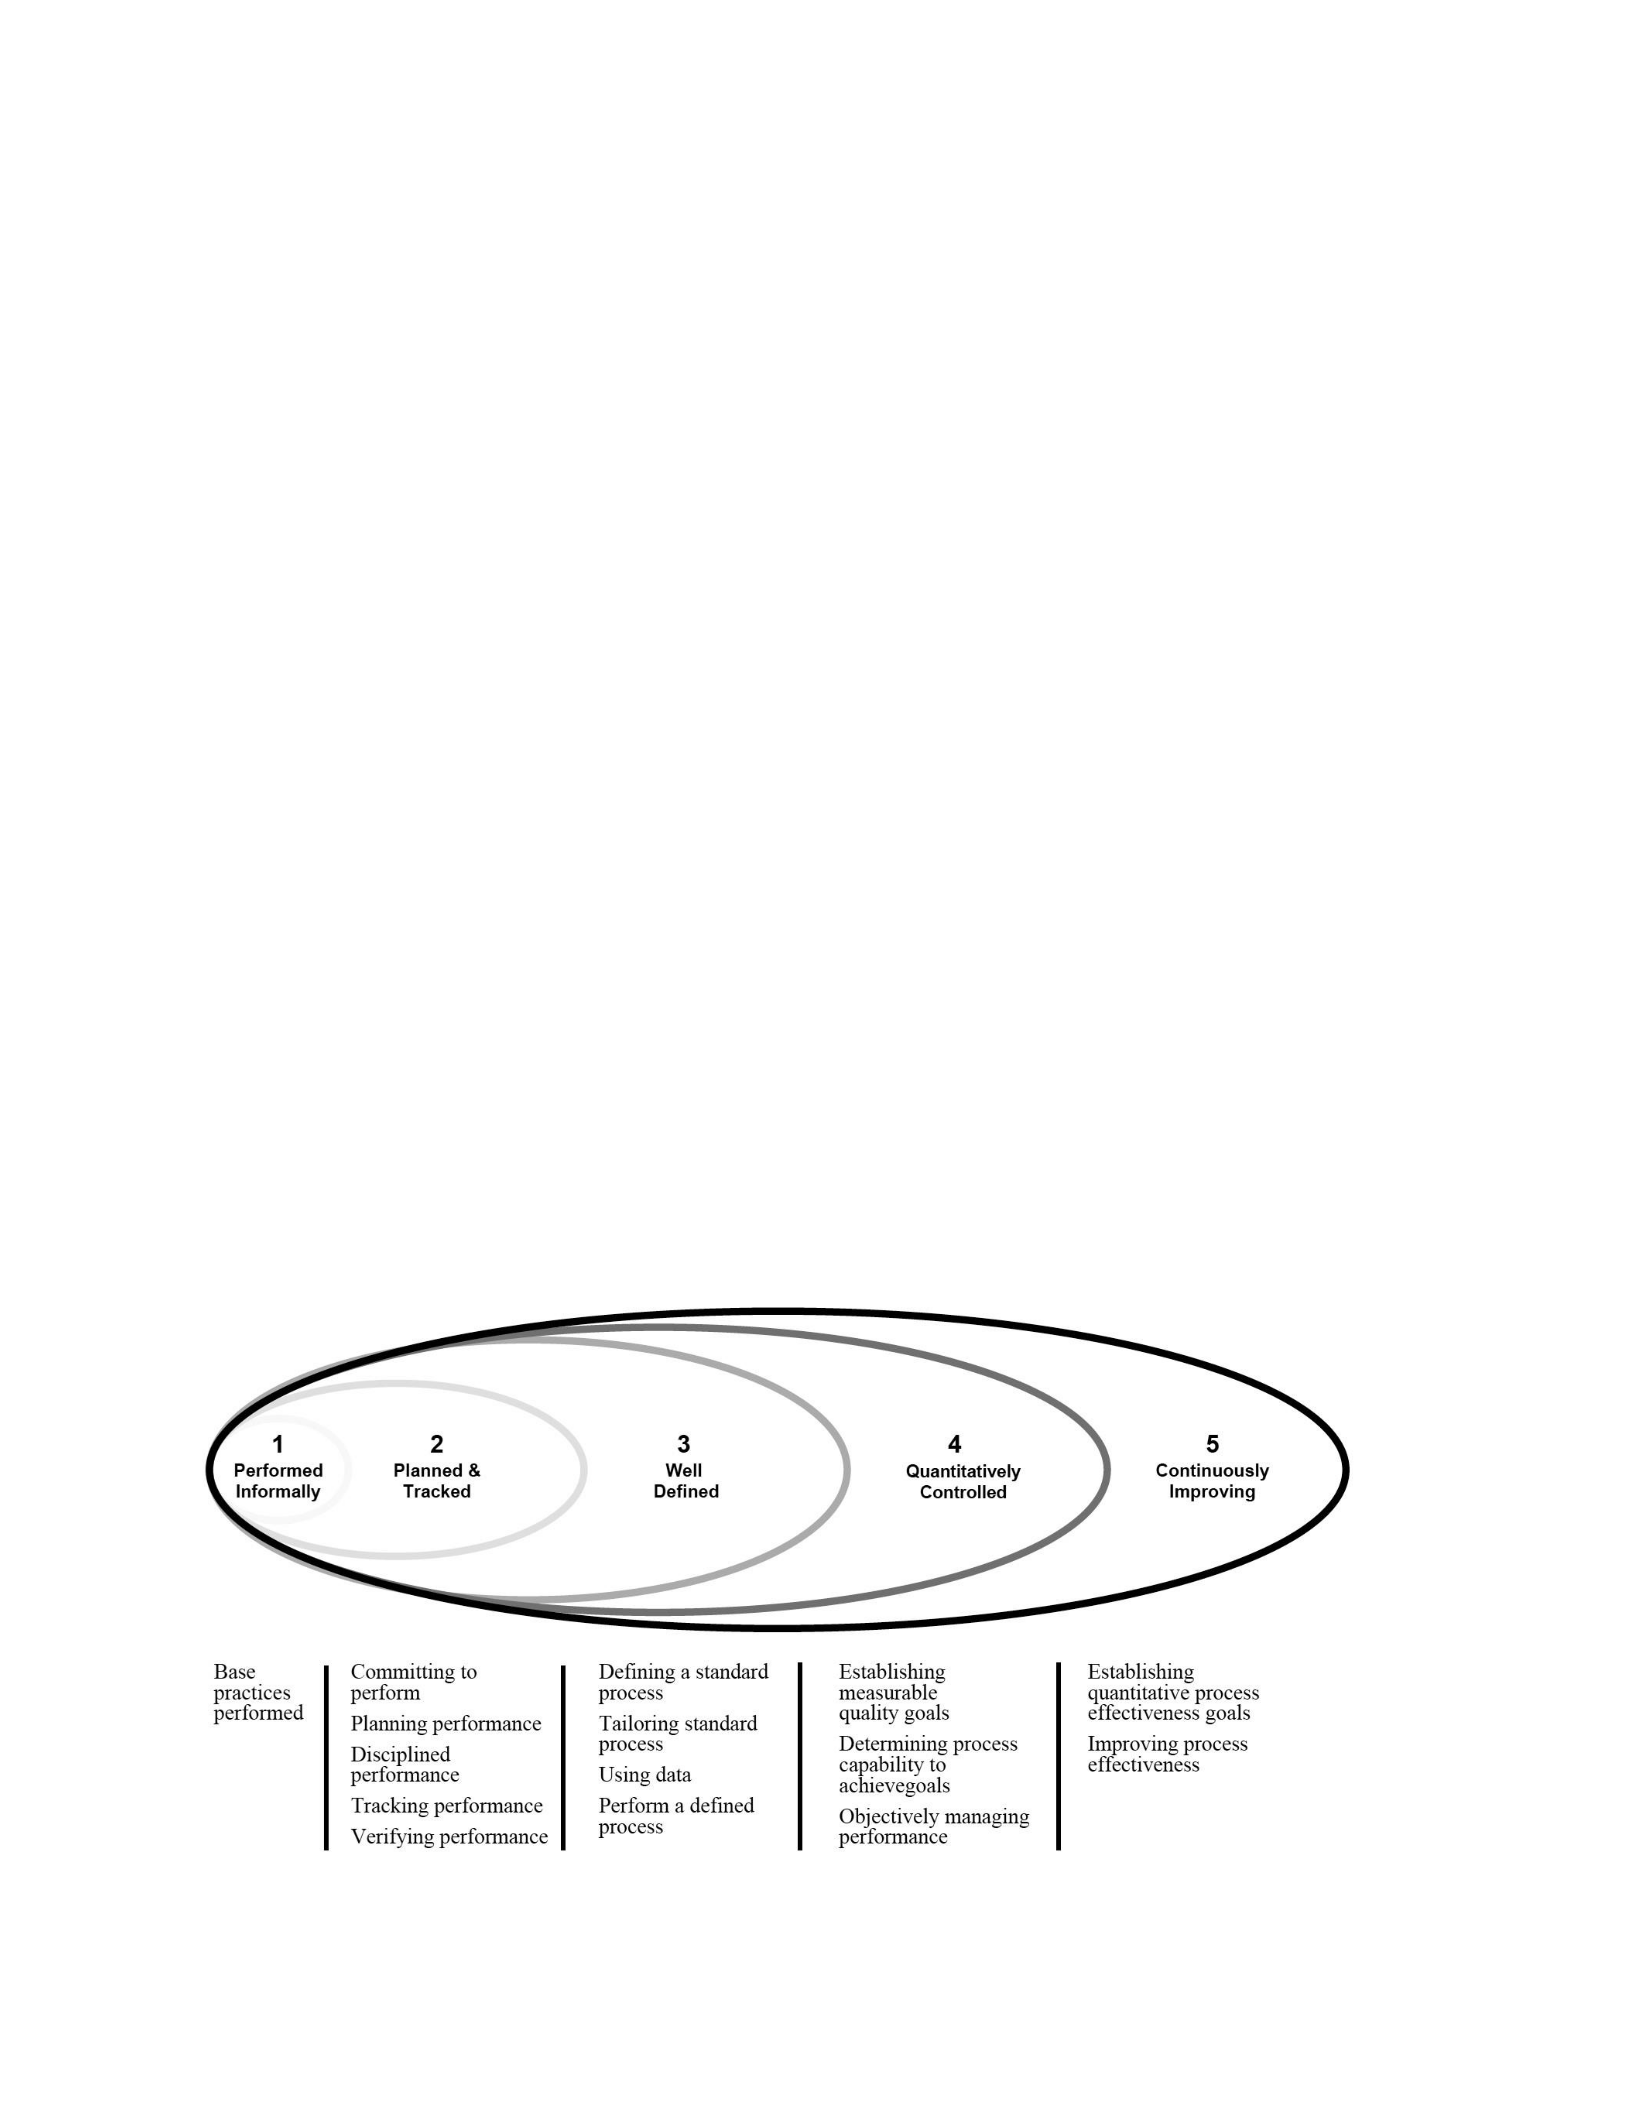
• Level 3: Well Defined
This level focuses on achieving controlled tailoring from organizational defined processes. This
level can be described by the statement “use the best of what you've learned from your projects to
create organization-wide processes” (Carnegie-Mellon, 2003).
• Level 4: Quantitatively Controlled
This level concentrates on linking measurements to the business objectives. At this level,
measurements and data use are not organization-wide. This level can be described by the
statements “you can't measure it until you know what ‘it’ is,” and “managing with measurement is
only meaningful when you are measuring the right things” (Carnegie-Mellon, 2003).
• Level 5: Continuously Improving
This level focuses on gaining leverage from improvements to the management practice. Then,
emphasizes the cultural moves that will aid in sustaining the gains. This level can be described by
the statement, “a culture of continuous improvement requires a foundation of sound management
practice, defined processes, and measurable goals” (Carnegie-Mellon, 2003).
Figure 1.1 shows SSE-CMM levels.
Figure 1.1: Systems Security Engineering-Capability Maturity Model (from Carnegie-Mellon (2003)).

1.4 Structure of the Dissertation
This section introduces the structure of this study and how it is organized. This dissertation is
organized into seven chapters. Chapter 1 presents an overview of the research topic and problem,
research questions, and the contributions and scope of this research. Chapter 2 reviews selected
literature related to this research topic. Chapter 3 provides an overview of the research theory and
methodology. It presents the Personal Constructs Theory (PCP) that underlies our methodology
(RepGrid). Also, it explains the Repertory Grids (RepGrid) technique and the different alternatives
that fall under RepGrid technique. Chapter 3 is concluded by explaining the design of this
dissertation. Chapter 4 describes the first stage of the research design. This chapter explains the
research process of collecting and analyzing data before the occurrence of a security breach.
Chapter 5 explains the second stage of the research design. This chapter describes the research
process of collecting and analyzing data after the occurrence of a security breach.
Chapter 6 discusses the findings and synthesizes key issues of this study. Chapter 8 concludes this
research by reviewing the results, discussing research implications, explaining research
limitations, and providing future research opportunities.

Chapter 2: Literature Review
2.1 Introduction
There is a mismatch between expected employee behavior regarding information security policy
and their actual behavior (Bulgurcu et al., 2010), which may expose the organization to various
security problems. Lack of consistency between expected behaviors and actual behaviors is mostly
due to the misunderstanding of the security policy and/or a mismatch between people’s norms and
security rules and standards. The divergence between the individual’s norm and security rule poses
a critical challenge for the information systems security within organizations.
One of the common themes emerging in the information systems security field is the mismatch
found amongst various individuals in an organization regarding how they perceive information
security (Johnston and Hale, 2009). Another common theme emerging in the information systems
security field is the compliance with the security policy. Various information systems literature
investigates the factors that affect the motivation and intention to comply with security policy.
More specifically, many of those studies examine the relationship between values (or norms) and

compliance with the security policy (e.g. Myyry et al., 2009; Bulgurcu et al., 2010; Herath and
Rao, 2009). Another common theme is related to the development and
implementation of an effective security policy to ensure the security of an organization (e.g. Smith
et al., 2010; Goel and Chengalur-Smith, 2010; Siponen and Iivari, 2006). Indeed, there is a lack of
the literature that focuses on the consistency between individual’s norms and security rules and
standards, and how an understanding of this relationship can affect the success of the
implementation of information security in the organization.
This chapter reviews previous literature related to the topic of “norm-rule” compliance. It focuses
mainly on the behavioral security literature. More specifically, this chapter reviews studies that are
related to rule aspect and normative aspect of security literature. We reviewed top journals of the
information systems and information systems security fields. This research study is informed by
three bodies of literature: individual values and how they influence the compliance and intention
to comply (section 2.2); security policy and how it is created and implemented (section 2.3); and
the relationship between values and security policy (section 2.4). Section 2.5 discusses the gap in
the literature addressed in this research. Section 2.6 concludes this chapter.
2.2 Values and Compliance
This section discusses the literature that is focusing on individual’s values and compliance with
security policy. Since norms are criteria that represent values (Hayden et al., 2007; Björkdahl,
2002; Rallapalli et al., 2000), literature focusing on norms and compliance is also considered.
There is various literature in the field of information systems security that focus on investigating
the relationship between individual’s values and the compliance with security policy. Some
researchers have used different terminologies to represent values such as rationalities, norms,
perceptions and cognitions. In some context, such terminologies are used to represent values, while
in other cases they are used to represent a part of the value. On the other hand, some of these studies
examine how values affect the individual intention to comply with the security policy. Other

research studies how values can be linked to compliance behavior. Thus, this section includes two
subsections. The first subsection discusses the relationship between values and intention to comply
with security policy. The second section discusses the relationship between values and compliance
behavior.
2.2.1 Values and Intention to comply
Chatterjee et al. (2015) identify factors that contribute to the unethical use of IT and how these
factors interrelate. The result of this study suggests that an individual’s ethical beliefs, besides
economic, social, and technological aspects are the factors related to the unethical use of IT.
Chatterjee et al. (2015) argue that these factors should be combined into a group of “focal
constructs” and relations. On the other hand, individual’s ethical beliefs and perceptions of the
reward have a strong relationship with attitude toward the unethical use of IT. Also, intention to
unethical use of IT is derived by individual’s attitude toward unethical use, individual’s norms,
behavioral control, past behavior and overall gain. Chatterjee et al. (2015) emphasize that the moral
intensity and non-traceability that technology provides and punishment severity are the
consequences of the unethical use of IT (Chatterjee et al., 2015).
Hu et al. (2012) argue that understanding the way organization, people, and technology influence
the information security is one of the main challenges of the information systems security. Various
evidences show that many security breaches are caused by insiders. Hu et al. (2012) emphasize the
need to investigate why insiders do not comply with the security policy and how organizations can
manage behaviors of the insiders.
This study aims to understand compliance behavior of the insiders taking in consideration
organizational motivations and insiders’ cognitions, which may be affected by management and
organizational culture. Hu et al. (2012) emphasize that insiders’ attitude toward compliance,

insiders’ norms, and perceived governance of compliance are directly and indirectly affected by
top management involvement in information security actions.
Additionally, top management involvement in information security actions affects organizational
culture, which affects insiders’ attitudes towards compliance and perceived governance of
compliance with information security policies. Furthermore, this study concludes that an insider’s
cognitive beliefs regarding compliance with security policies moderate the relationship between
top management involvement and organizational culture from one side and insiders’ intentions to
comply from the other side (Hu et al., 2012). This study stresses the important role of top
management in information security management and illustrates how top management and
organizational culture can shape insiders’ attitudes, norms and perceived control over compliance.
A study by Warkentin et al. (2011) argues that organizations tend to develop and perform formal
SETA programs, monitor compliance with security policies, and create an environment which
motivates individuals to comply with the policies. Also, the informal learning that individuals gain
from their social environment can affect their behavior and intention to comply with the policies.
Warkentin et al. (2011) propose certain factors that affect individual’s compliance with privacy
policies. The findings of this study show that the informal learning is affected by social conditions
such as cues from outsiders, comprising a situational support, verbal inducement, and long
experience. The informal learning affects individual’s intention to comply with the policies, which
is affected directly by compliance efficacy and indirectly by the external cues.
Most information security studies focus on studying “intentional” engagement in violation
behaviors. However, some individuals unintentionally become involved in some violation behavior
(Guo et al., 2011). Guo et al. (2011) offer a non-malicious security violation (NMSV) model to
study non-malicious behavioral intentions. The finding of this study suggests that the intention to
involve in non-malicious violation behavior is derived by the advantage for job performance,
perceived security risk, normative outcomes (or workgroup norms), and selfidentity outcomes (or

perceived identity match). This study highlights that the objectives of job performance and
perceptions of security risk help in determining attitudes toward non-malicious security violation.
Also, workgroup norms and perceived identity match have a direct effect on an individual’s
attitudes and behavioral intentions. On the other hand, perceived security risk is found to be an
important driver for the behavioral decision. That is, when individuals perceive security risk is
high, they are less likely to involve in non-malicious violation behaviors (Guo et al., 2011). Guo
et al. (2011) emphasize the importance of aligning security goals with business objectives,
acquiring security measures buy-in, and developing a culture of secure behavior at the
organizations.
Anderson and Agarwal (2010) examine the phenomenon of conscientious cybercitizens through
conducting two studies. Conscientious cybercitizens are defined as “individuals who are motivated
to take the necessary precautions under their direct control to secure their computer and the Internet
in a home setting” (Anderson and Agarwal, 2010; p. 613). The goal of these two studies is to study
the security behavior of users of home computers. The first study develops a model of the
conscientious cybercitizen. The second study studies how the antecedents of intentions to perform
security-related behavior can be affected by message cues. Anderson and Agarwal (2010)
emphasize that normative beliefs do not have a significant influence on the intention to perform a
security-related behavior in the context of home-users. This finding is important to consider when
designing effective marketing messages that can motivate security behavior of home users. Indeed,
this study examines how qualities of messages can affect user’s attitude toward security-related
behavior in addition to the subjective and descriptive norm. The finding of this study shows that
intention to accomplish security-related behavior is affected by a set of cognitive, social, and
psychological factors. Message cues can affect individual’s norm (subjective and descriptive),
which in turn affects intentions to perform security-related behaviors. In some instances, messages
that are framed in a positive way can increase perceived subjective norms that are related to a
security behavior.

Siponen and Vance (2010) introduce a theoretical model that shows the influence of neutralization
techniques on the compliance behavior. It describes how security in the organization is related to
the employees’ behavior. Siponen and Vance (2010) define neutralization techniques as
“rationalizations, which allow [individuals] to minimize the perceived harm of their policy
violations” (p. 488). This study shows that neutralization techniques are more effective than
deterrence mechanisms in decreasing the violations of security policy. Individuals use
neutralization techniques in order to determine their compliance behavior. The findings of this
study highlight that neutralization is an important driver for intention to violate information
security policies. Indeed, Siponen and Vance (2010) emphasize that intention to violate security
policy is not a direct representative of compliance behavior. Instead, intention indicates the
motivation to comply or not comply that exists just before acting the behavior. According to
Siponen and Vance (2010), neutralization mainly influences the tendency to violate security policy.
Also, formal and informal sanctions do not predict intention to violate security policy.
Bulgurcu et al. (2010) propose that rationality-based factors affect individuals’ compliance
behavior. This study emphasizes that attitude toward compliance, normative beliefs and
selfefficacy have a critical effect on compliance intention. Bulgurcu et al. (2010) define normative
beliefs as how an individual perceives social pressure that results from behavioral anticipations of
main referents such as administrators and managers. The study emphasizes that outcome beliefs
influence beliefs related to the evaluation of consequences, which in turn influence an attitude
toward compliance. Bulgurcu et al. (2010) define outcome beliefs as believing that specific events
will come as a logical outcome of doing (or not doing) a specific compliance action. Bulgurcu et
al. (2010) point out that information security awareness has a positive impact on attitudes toward
compliance and outcome beliefs. Also, perceptions regarding consequences of compliance, which
affect intention to comply, are derived from awareness of information security policies.
D’Arcy et al. (2009) use an extended version of the general deterrence theory (GDT) model to
show how organizations can decrease IS misuse that can be acted by insiders. This study

emphasizes that security countermeasures (i.e. security rules, SETA programs and computer
monitoring) can be used as tools to affect individual’s perceptions regarding the consequences of
information systems misuse. That is, when security rules, SETA programs, and computer
monitoring are available in place, the cases of IS misuse will decrease significantly. Furthermore,
the findings of this research emphasize that an individual’s awareness of these security
countermeasures affects their perceptions regarding sanctions, which helps in decreasing intention
to misuse IS. This study suggests that perceived severity of sanctions has more influence in
decreasing misuse of IS (D’Arcy et al., 2009).
Herath and Rao (2009) created an “Integrated Protection Motivation and Deterrence” model to
study how organizational commitment can influence individual’s intention to comply with security
policies. They argue that threat appraisal and coping appraisal form the attitude toward applying
the security technology and practices. Individuals tend to appraise security issues and apply
security technologies and practices to deal with these security issues (Herath and Rao, 2009).
Herath and Rao (2009) point out that threat appraisal is linked to the perceptions of an individual’s
feelings regarding intimidating somebody based on an assessment of fear appeal components. On
the other hand, the coping appraisal assesses response efficacy, response cost, and self-efficacy.
Herath and Rao (2009), also investigated how environmental factors like deterrence, facilitating
conditions, and social norms can affect compliance intention. The result of this study suggests that
individual’s attitude towards security policies, which govern the individual’s intention to comply,
is derived by how they perceive the breaches’ severity, response efficacy, self-efficacy, and
response costs. Self-efficacy is a significant factor that influences policy compliance intentions. It
can be enhanced through the availability of resources within the organization. On the other hand,
Herath and Rao (2009) emphasize that individual’s intention to comply with the policy has a strong
relationship with organizational commitment and social influence. Organizations need to ensure
that employees understand security policy and tailor precautions in order to employ security policy
more effectively. Herath and Rao (2009) highlight that individuals can have a positive attitude

toward the security policies when they perceive how their adherence to security policy may
influence their organization positively.
2.2.2 Values and Compliance Behavior
Tsohou et al. (2015) investigate how cognitive and cultural biases can form perceptions and
behaviors of information security through developing a conceptual framework to assess and
analyze this relation. The study argues that cognitive and cultural biases influence the reception
and processing of information and security awareness. Security and safety awareness programs
tend to manage threats through affecting people’s behavior. Thus, Tsohou et al. (2015) recognize
and examine security-related biases and how such biases can affect the shaping of risk perceptions
and security behavior. Certainly, this research study tends to illustrate the cognitive processes as
an antecedent of information security compliance.
Tsohou et al. (2015) point out that availability of heuristic has an important effect on risk
perceptions, which in turn affect the compliance behavior. Additionally, compliance intention can
be affected by the effect bias. Individuals may share some sensitive information with peers since
they hold feelings of appreciation, while knowing the risk of such behavior. On the other hand, the
anchoring and confirmation bias complicate the change of people’s attitudes because people tend
to underestimate evidence that opposes their views. Also, optimism influences evaluation of the
likelihood to experience penalties of noncompliance (Tsohou et al., 2015). The study concludes
with ten recommendations. First, organizations need to identify and consider cultural biases and
risk misunderstanding when evaluating the process of dividing target groups. Second,
organizations need to consider cultural groups and risk misunderstanding when selecting strategies
for communication. Third, organizations need to indicate and address biases while showing budget
of the awareness program and presenting management results. Fourth, risk biases should be
handled when explaining the budget of the awareness program. Fifth, to cope and control affect

biases, security awareness material need to use affirmative stimuli and incidences. Sixth,
individuals usually depend on the first part of the information they receive. This issue should be
considered when planning security practices. Seventh, to prevent reduced perceived costs, experts
need to focus on applying sanctions directly in case of non-compliance with security policy.
Eighth, experts also need to motivate individuals to inquire their work practices continuously.
Ninth, security practices should be linked to easy to memorized and realistic stories. Tenth,
workshops and mockups can be used as a tool to involve individuals to security risks and threats.
D'Arcy et al. (2014) examined how security-related stress, which occurs because of the frequent
enhancements to information security policies, is associated with violation of information security
policy. They created a model of information security policy violation, which suggests that security-
related stress drives individuals to involve in emotion-focused coping, which represented in moral
separation from security policy violations. That is, the complex, uncertain and excessive security-
related activates have a negative impact on security compliance behavior. Such activities can create
security-related stress, which in turn increase “moral disengagement” that causes non-compliance
to security policies (D'Arcy et al., 2014).
Vance et al. (2014) investigate the effectiveness of warning messages and why individuals do
ignore such warnings in order to understand individual’s perceptions and behaviors regarding
security risks. They argue that Electroencephalography (EEG), which measure individual’s neural
responses to feedbacks, can be used to predict individual’s behavior. The results of this study show
that electroencephalography measures expect the behavior in different conditions. Thus,
electroencephalography measures are a strong predictor of individual’s behavior regarding
information security. Vance et al. (2014) emphasize that an individual usually tends to disregard
warning messages except when she or he feels she or he is exposed to an attack and will lose
something valuable. Also, the tendency of individuals to ignore security warning is higher before
the occurrence of security incidents. Individuals disregard warning messages because it is hard to
understand, unclear and brief (Vance et al., 2014). Here, Vance et al. (2014) measure the

effectiveness of warning messages in motivating individuals to conform to intended behavior
through investigating how individuals perceive these warning messages.
Willison and Warkentin (2013), in their research commentary, argue that the research should focus
on the security policy violation and the antecedents of intention to violate and deterrence of the
violation. Also, they emphasize that the research should focus on phenomena that temporally go
before these acts. That is, they stress the importance of investigating the thought processes of
expected criminals.
The way the context of the organization can affect the thought processes of the criminals before
deterrence. Indeed, Willison and Warkentin (2013) suppose there is a correlation between thought
processes and organizational context, which in turn may affect the efficacy of deterrence
protections.
Chen et al. (2012) introduce a model that investigates the associations between coercive control,
remunerative control, and certainty of control. This study aims to examine the relationship between
punitive enforcement, rewarding enforcement and enforcement certainty on the one side and
security compliance on the other side. Also, it examines how punitive and rewarding enforcement
in combination influence security compliance. Chen et al. (2012) highlight that punitive and
rewarding besides certainty of control have a significant influence on compliance behavior. This
study emphasizes that reward enforcement could be employed in the organizations where
punishment does not prevent security violation. Also, this study emphasizes the importance of
educating and training the employees to increase their awareness and motivation to comply with
the security policies. An individual’s awareness of security policies and rules may affect his or her
intentions, attitudes, and behaviors regarding security (Chen et al., 2012).
Myyry et al. (2009) develop a theoretical model that describes the relationship between moral
reasoning and values on one hand, and compliance (or noncompliance) with information security
policy on the other hand. They define moral reasoning as “the process in which an individual

applies moral principles to determine a course of action” (p. 127). Their model has been developed
based on two psychological theories: the Theory of Cognitive Moral Development and the Theory
of Motivational Types of Values. The Theory of Cognitive Moral Development states that the moral
reasoning has three levels: the pre-conventional, conventional and postconventional moral
reasoning (Kohlberg, 1984). Myyry et al. (2009) study the relationship of each of these levels with
compliance behavior. According to the Theory of Motivational Types of Values, the value has two
types: openness to change versus conservation and selftranscendence versus self-enhancement
(Schwartz, 1992). The Myyry et al. (2009) study considers the relationship between openness to
change versus conservation on one hand and compliance behavior on the other hand.
This study pays more attention to the motivational factors that cause behavior change. The result
of this study indicates that moral reasoning and values can describe individual’s commitment to
security policies and rules. Moreover, Myyry et al. (2009) emphasize that pre-conventional and
conventional moral reasoning and openness to change have a strong relationship with compliance
behavior study concludes that pre-conventional moral reasoning has a positive effect on
compliance behavior, whereas openness to change and conventional moral reasoning have a
negative effect on compliance behavior.
Boss et al. (2009) develop a model that describes “information security precaution-taking”
behavior. This model identifies the factors that influence the perception of “mandatoriness,” which
in turn can influence compliance behavior. Boss et al. (2009) define mandatoriness as “the degree
to which individuals perceive that compliance with existing security policies and procedures is
compulsory or expected by organizational management” (p. 152). This study emphasizes that
specifying security policies and behavior evaluation are critical drivers for compliance behavior
through increasing the feeling of mandatoriness of the policy. Also, the perception of
mandatoriness helps in encouraging people to take security precautions.

Siponen and Iivari (2006) developed a theoretical model that illustrates how various normative
theories can influence the “success” of information security policies. They argue that some of the
business opportunities may force individuals to violate security policies. The model helps in
dealing with such situation through employing normative theories. That is, this model provides
guidance to understand under which conditions information security policies can be violated.
Normative theories can be used mainly to evaluate and guide individual’s action and behavior
(Siponen and Iivari, 2006).
Normative theories involve two central functions: assessing people’s action and direct individual’s
behavior (Siponen and Iivari, 2006). These two functions are grounded on a normative logic that
is usually being used to judge whether an act is good or bad. Indeed, making such judgment is a
significant challenge since the current information security world becomes more unpredictable
than before. Siponen and Iivari (2006) emphasize that security managers must ensure that
employees in the organization have the required knowledge capability that helps them to deal with
situations in which business objectives contradict security policies.
2.3 Security Policy
This section discusses the literature that focuses on security policy development and
implementation. Security rules and standards represent security policy. Thus, the literature
focusing on developing and implementing security rules and/or standards is also considered.
Many research studies in the field of information systems security have provided suggestions for
ways to develop, design and implement the security policy. They provide different models and
frameworks, in addition to different guidelines that can ensure the effectiveness of the security
policy. In this section, the literature is divided into two groups. The first group focuses on the
literature that concern about the design and development of the security policy. The second group
discusses the literature that focuses on the implementation of the security policy.

2.3.1 Security Policy Design and Development
Goel and Chengalur-Smith (2010) reviewed the policy literature and provided three measures that
can be used to measure the effectiveness of the security policy and the way it is written. The three
measures are breadth, which measures whether the policy is comprehensive or not; clarity, which
measures whether the policy is easy to read and understand; and brevity. Goel and Chengalur-
Smith (2010) argue that there is a lack of measures and standards that can be used to ensure the
effectiveness of the security policy. Thus, they develop frameworks to evaluate the three measures.
Goel and Chengalur-Smith (2010) emphasize that using these measures to characterize policies
will aid in facilitating the examination of the relationship between policy form and policy
effectiveness. This study validates these measures through examining user
perceptions.
Spears and Barki (2010) investigated the effect of user’s involvement in information system
security development and on the implementation of the security controls. They argue that user
involvement in developing information systems affect the success of the system. Thus, they
examine user’s involvement in the context of information system security.
User involvement can increase individual’s awareness, increase alignment between security risk
management and business, and enhance the development of security controls, which in turn
advances the control performance (Spears and Barki, 2010). Moreover, Spears and Barki (2010)
emphasize that when providing necessary business knowledge to users, they can be a critical
resource for information security. This study concludes user involvement contributes to
information system security development and implementation. Also, user involvement can be
employed to govern perceptions of users regarding the significance and meaning of information
security (Spears and Barki, 2010).
Knapp et al. (2009) emphasize the importance of the scholarly involvement in the area of
information security policies. Their study emphasizes that the information security policy aimed

to maintain the confidentiality, integrity and availability of the information resources. Knapp et al.
(2009) propose an “information security policy process” model that shows a novel, comprehensive
security policy process. This model is developed based on a group of correlated policy management
processes or categories that can be implemented in an iterated rotation. The processes of managing
the information security policy include four categories: the policy review process, which involves
evaluating policies to ensure continuous applicability; the risk assessment process, which involves
measuring and assessing business risk; the policy development process, which involves forming,
sustaining, and changing security policy of the organization; and policy approval. The Knapp et al.
(2009) model takes into consideration the effect of business governance in addition to external and
internal impacts. Additionally, this model focuses on the training and awareness of the policy.
2.3.2 Security Policy Implementation
Smith et al. (2010) argue that employing “de jure standards” is highly important for implementing
and certifying the security of organizations. According to Smith et al. (2010), information security
implementation frequently leads to problems and difficulties related to power associations,
politics, and resistance, usually because of an organization’s norms or culture. Thus, this study
examines governmental information security through studying power associations during the
process of information security adoption and accreditation taking in consideration that all
government organizations must obey the de jure ISS standard. Smith et al. (2010) also claim that
factors including lack of resource, lack of input from management input, and commitment can
result in resistance to security policy and standard compliance. Thus, this issue should also be
considered during the process of information security adoption and
accreditation.
Siponen and Iivari (2006) point out that unpredictable situations force organizations to make quick
decisions without preparation. They claim that normative theories can explain the way such cases

can be solved. This study offers six design theories (i.e. the conservativedeontological, liberal-
intuitive, prima-facie, virtue, utilitarian, and universalizability normative theories) and proposes a
theoretical model that can be used to illustrate how normative theories can affect the success of
security policies and standards. These theories can be used to direct the application of security
policies.
This study concludes that the conservative-deontological theory may be appropriate in the case of
rule-oriented or steady business organizations. For organizations that are not rule-oriented and
those with unstable business, this study recommends employing the prima-facie, virtue, utilitarian,
or universalizability design theory. The proposed framework provides insight into which security
policies should be supported by anticipated benefits, virtuous activities, and contentment. Thus,
that can aid organizations in designing and implementing effective security policies and standards.
Karyda et al. (2005) claim that there is a lack of work in the literature concentrating on issues
related to the application and effectiveness of security policy. Security policy implementation is
not a direct task and relies on several factors. Thus, this study focuses on designing, implementing
and adopting security policies within two different contexts. It proposes a theoretical framework
to understand and investigate the interaction between processes associated with the application of
an organization’s security policy. Karyda et al. (2005) adopted the theory of contextualism to
investigate the effect of a specific context on managing the security. This study emphasizes the
availability of the association between application of security practices and the environment,
illuminating the importance of considering how contextual aspects can influence the success of
information security adoption and implementation.

2.4 Values and Security Policy
This section discusses the literature that focuses on the relationship between security policy and
individual values. That is, it considers the literature that focuses on the relationship between norms
and security rules and standards.
Some of the research studies within the information systems security discipline point out the
relationship between people’s values and security policy. Therefore, this section concerns about
research studies that explore the relationship between security policy and individual’s values.
Hedström et al. (2011) propose “value-based compliance” model to examine the conflict between
information security policies and the information use practice. This study aims to explore
individuals’ compliance with security policies and security practices as part of individuals’ daily
practices. It provides a different viewpoint of information security management through taking into
consideration the different rationalities of stakeholders. The proposed model recognizes the
divergence in the values within the organization where different rationalities are utilized in the
daily activities. That is, the conflict in the values could be reflected in the individuals’ behavior.
Hedström et al. (2011) argue that the traditional compliance model that is a control-based is less
effective for the implementation of information security compliance than the value-based model.
Security behaviors with respect to security policies are expressed in term of values that are
associated with individuals’ jobs. Hedström et al. (2011) argue that the control-based compliance
model tends to enforce policies to guarantee appropriate information security. However, security
should be considered as “the most important value enacted by users in their daily work” (p.374).
Hsu (2009) applies the “frames analysis” concept to examine how financial institution employees
understand information security certification (i.e. BS 7799 Part 2), which in turn affects their
behaviors. This study highlights that the implementation of the certification is strongly affected by
the management expectations. Indeed, individuals may perceive the security requirements based
on their operating perspective. Thus, the inconsistency between the managers’ perceptions and the
perceptions of the certification group and employees reflect that the concept of information

security management may not be completely involved in the daily work practices. Thus, more
attention should be paid to investigate the incongruence between the managers’ perceptions and
the perceptions of the certification group, and try to align these perceptions to have more effective
security in the organization (Hsu, 2009).
Albrecthsen and Hovdena (2009) emphasize that people within an organization have different
rationalities, so they practice information system security in different ways. This divergent in
rationalities may reveal the disagreement between security policy and practice. Indeed, this study
examines the concept of “digital divide” in the context of information system security. It
investigates the divergent in the information security opinions, beliefs and experiences between
employees in an organization, and how that divergent will be reflected in the decisions regarding
risks. Therefore, Albrecthsen and Hovdena (2009) study the way employees perceive their role in
comparison to the way they view the role of the others. Also, it studies the way they view the
measures of organizational security. Albrecthsen and Hovdena (2009) conclude that a digital divide
is available between managers and users, which is reflected on how they view and practice
information security. Users usually are seen as a threat to the information security, while they
consider themselves as an unexploited asset for security. The divergent in understanding the others
view has resulted from the lack of collaboration between users and managers. Consequently,
security managers mostly base their practices on not realistic suppositions, which lead to
misalignment between management and user’s daily work.
Vaast (2007) explores how people from different communities perceive information systems
security via a social representations perspective. He argues that social representations perspective
plays a critical role in understanding information security that is embedded in the social context of
the organization. The information security can be understood by members of different communities
who represent information security and its work practices in various ways based on their previous
knowledge. That is, people from different community may have different interpretations to the
information security. Therefore, Vaast (2007) emphasizes the importance of considering the

context of work practices to interpret information security problems. He also highlights the
importance of customizing security and awareness programs to consider people from different
communities who may hold different knowledge regarding different security issues. People within
the organization held different personal values. That difference is reflected in the people’s
behaviors in response to different security issues (Vaast, 2007).
2.5 Discussion
To sum up, various information systems security research focuses on the compliance issue. They
focus on the antecedents of compliance (and non-compliance) with the information security policy.
Scholars consider individual values (or norms) as one of the main drivers for the compliance
intention and behavior.
Many research study how individual’s values affect compliance or intention to comply with
security rules and standards (e.g. Myyry et al., 2009; Bulgurcu et al., 2010; Herath and Rao, 2009).
These studies consider values as a significant antecedent to compliance intention and behavior.
However, to our knowledge, there is a lack of the research studies that investigate how information
security policy shape people’s values in the first place, and how these values can change in response
to the occurrence of a security breach. Also, these studies do not show how these values can be
used to shape or re-shape the information security policy. Some studies make a call to involve users
(or non-security professionals) in the process of designing and developing information systems
security to develop sync between users values and security policy (Hu et al., 2012; Spears and
Barki, 2010). However, they do not provide any mechanism that shows in which way users can
involve in developing or enhancing the security policy to ensure compliance of norms with security
rules. On the other hand, there is very limited literature that focuses on ensuring the effectiveness,
efficiency, and efficacy of the security policy.

This research aims to identify how security policy can shape individual’s perceptions and how
these perceptions change in light of security incidents. It points out the importance of considering
the relationship between the security rules of the organization and the norms of the employees
within that organization. Indeed, it is difficult to develop a methodology or mechanism that can
ensure the sync between norms and rules and can fit all organizations and contexts. Thus, in this
research, we try to fill this gap by introducing a RepGrid security assessment mechanism. This
assessment mechanism allows organizations to assess the maturity of the organization security
through reactively understand individuals’ norms and perceptions regarding security rules to
ensure compliance of norms with the rules and the effectiveness, efficiency, and efficacy of the
security policy.
2.6 Conclusion
This chapter classifies and identifies opportunities for further research in the normative- and
compliance-related security literature. Three bodies of literature inform this research study:
individual’s values and how they influence the compliance intention and behavior; security policy
development and implementation; and norm-rule compliance. This literature review reveals the
shortage in fully examining the mutual relationship between people’s norms and security rules and
standards, and how they influence the shaping of each other. There are some attempts to highlight
the relationship between norms and rules; however, these studies focus mainly on the norms and
rules and pay less attention to the nature and the influence of this relationship.
Thus, this study provides new research directions in examining information systems security in
relation to normative beliefs and security policies and rules. There is a call in the information
system security literature to involve users in the designing and developing information systems
security in order to ensure the sync between user values and security policy (Hu et al., 2012; Spears
and Barki, 2010). However, it is difficult to develop a methodology that can create sync between
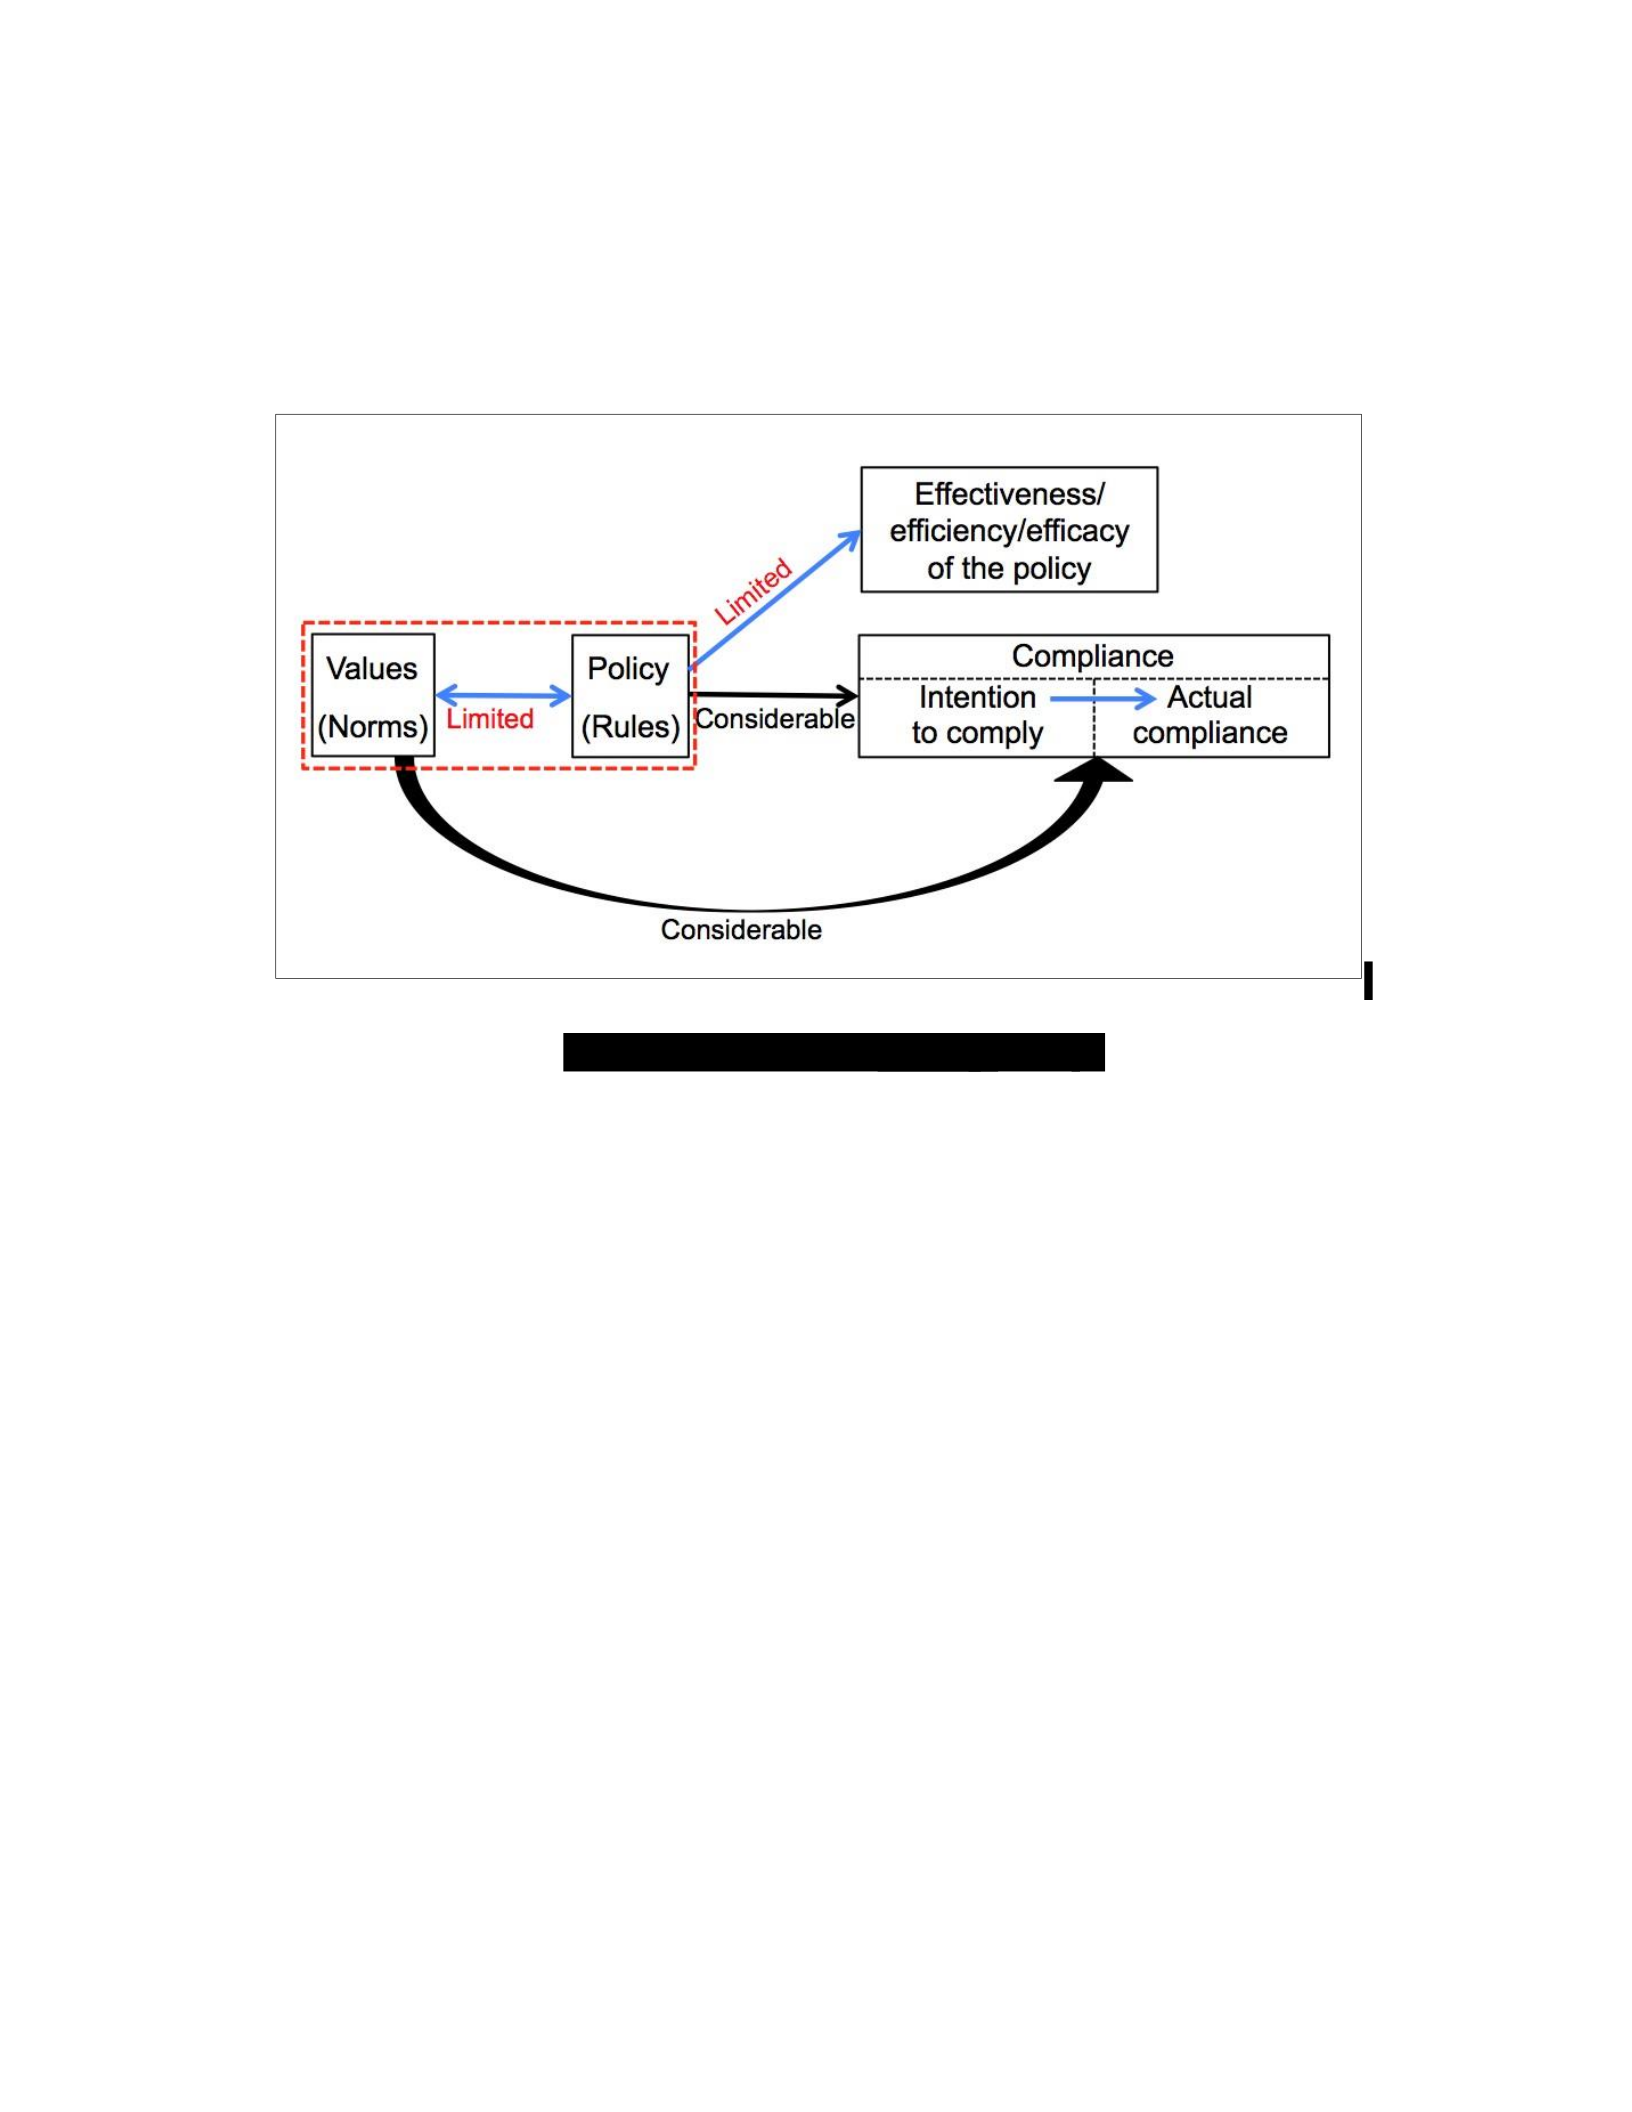
norms and rules while remaining suitable for all organizations. Therefore, this study introduces the
RepGrid security assessment mechanism, which can be used to evaluate and understand
individuals’ norms and how they perceive security rules in order to create sync between norms and
rules and create better policy. Figure 2.1 positions the gap in the IS security literature.
Chapter 3: Research Theory and Methodology
3.1 Introduction
The purpose of this chapter is to explain the research methodology (i.e. Repertory Grid technique)
and theory (i.e. Personal Construct Theory) underpinning this methodology.
Repertory Grid technique has been used in Information Systems research (e.g. Kanellis et al. 1999;
Davis and Hufnagel, 2007) to study human cognition, i.e. how a person interprets or understands
Figure 2.1: The gap in the IS
security
literature.

events that occur in the environment. In addition to Information Systems, this technique has been
used in different fields such as Psychology (e.g. Wright, 2004), education (e.g. Kreber et al., 2003),
human resource management (e.g. Siau et al., 2007), and humancomputer interaction (e.g. Crudge
and Johnson, 2004). This chapter consists of five sections. The first section provides an overview
of Kelly's (1950s) Personal Construct Theory (PCT), which underpins the Repertory Grid
technique. The second section explains Kelly’s Personal Construct Theory. The third section
provides an explanation of the Repertory Grid and the different alternatives that can be used within
this technique. The fourth section explains the Action Design Research method adopted by this
research, while the fifth section provides an overview of the design of this research.
3.2 Personal Construct Theory (PCT)
The Repertory Grid technique was invented by George Kelly, a psychologist, and is grounded on
Kelly's (1950s) Personal Construct Theory (PCT). Personal Construct Theory is a cognitive theory
that was proposed by Kelly (1955, 1963). The main focus of Kelly’s work is to help individuals
analyze and investigate their interpersonal relationships. Kelly (1955) argues that people use their
background, personal experiences, beliefs, and values to form their “personal construct systems”
that help them in understating and interpreting (i.e. construing) the world around them. People's
cognition, which represents the way of making meanings of the world, forms individual's
personality (Kelly, 1963). Thus, the Personal Construct Theory is also known as the Theory of
Personality (Kelly, 1955).
An individual’s “personal construct system” assists them to construe the present situation and to
predict future incidents (Tan and Hunter, 2002). Furthermore, people can share in varying degrees
the “personal construct systems” with others. Kelly argues that the similarity of people’s constructs
determines the degree to which the psychological processes match (Kelly, 1955).

Personal constructs are bipolar in nature. That is, constructs should be represented as a pair of
phrases, specifically the phrase and its opposite (Kelly, 1955). For example, employees in an
organization can be organized and categorized into those with a high-level Information Security
awareness and those with low-level Information Security awareness. Using bipolar labels to
represent constructs may help in gaining a better understanding of how people use their constructs
in interpreting the events around them (Tan and Hunter, 2002).
3.3 Repertory Grid Technique (RepGrid)
Repertory Grid is an interview technique for identifying people's constructs and perceptions that
are represented by a 2-dimensional matrix. The matrix consists of elements dimension and
constructs dimension. Elements are objects of interest such as events, objects or people.
Constructs represent people's perceptions, thoughts, beliefs or opinions (Kreber, et al., 2003; Tan
and Hunter, 2002). Each construct should be represented as a bipolar statement to identify the
differences and similarities concurrently (Kelly, 1955). That is, each construct should be
represented as a pair of phrases; the phrase and its opposite (e.g. strong – weak; secure – risky).
Elements and constructs should be linked to show how each element may be interpreted in regard
to each construct (Tan and Hunter, 2002).
Repertory Grid technique has been used in many studies across different disciplines; however, it
has received various critiques regarding how this technique was applied. Some researchers using
this technique have not grounded their technique on the assumptions of Kelly's Personal Construct
Theory (Marsden and Littler, 2000).
This research mainly focuses on people’s norms. Specifically, it focuses on how employees
understand the Information Security policy in their organization. That is, this research seeks
cognitive data that is related to people’s values. Reliable, trustworthy and efficient techniques are
needed to elicit and analyze such data. Thus, the Repertory Grid technique is the appropriate

method for this research, which seeks qualitative data (Hair et al., 2009). Curtis et al. (2008)
emphasize that the Repertory Grid technique helps in reduce research bias and supports qualitative
and quantitative analysis of the data (Curtis et al., 2008). Also, the Repertory Grid technique was
proven to be a superior technique to get people’s constructs through structured interviews (Cassell
and Walsh, 2004). The structured nature of this technique eases comparative analysis that is needed
to compare different perceptions and beliefs of the participants (Curtis et al., 2008).
The following section discusses the different alternatives for applying Repertory Grid technique.
This outline is grounded on Kelly's Personal Construct Theory.
3.3.1 Outline of The Method
Repertory Grid is a hybrid qualitative-quantitative technique; that is, the elicited data will be
analyzed both qualitatively and quantitatively. In this section, we clearly outline a sound Repertory
Grid method. The first part focuses on selecting participants and data collection. The data
collection consists of two phases: the first phase is about collecting data to elicit elements, and the
second phase is about collecting data to elicit constructs.
Before explaining the method, it is important to mention that there are four types of Repertory
Grids:
(1) Full/real Repertory Grids; both elements and constructs are elicited.
(2) Partial/fixed elements Repertory Grids: elements are supplied, whereas constructs are
elicited.
(3) Fixed elements and constructs Grids: both elements and constructs are supplied (Edwards et
al., 2009).
(4) Fixed constructs Grids: constructs are supplied and elements are elicited. The last type of
Repertory Grids is mostly used when there is a need to compare multiple Grids (Tan and Hunter,
2002). Figure 1 shows the four types of Repertory Grids.
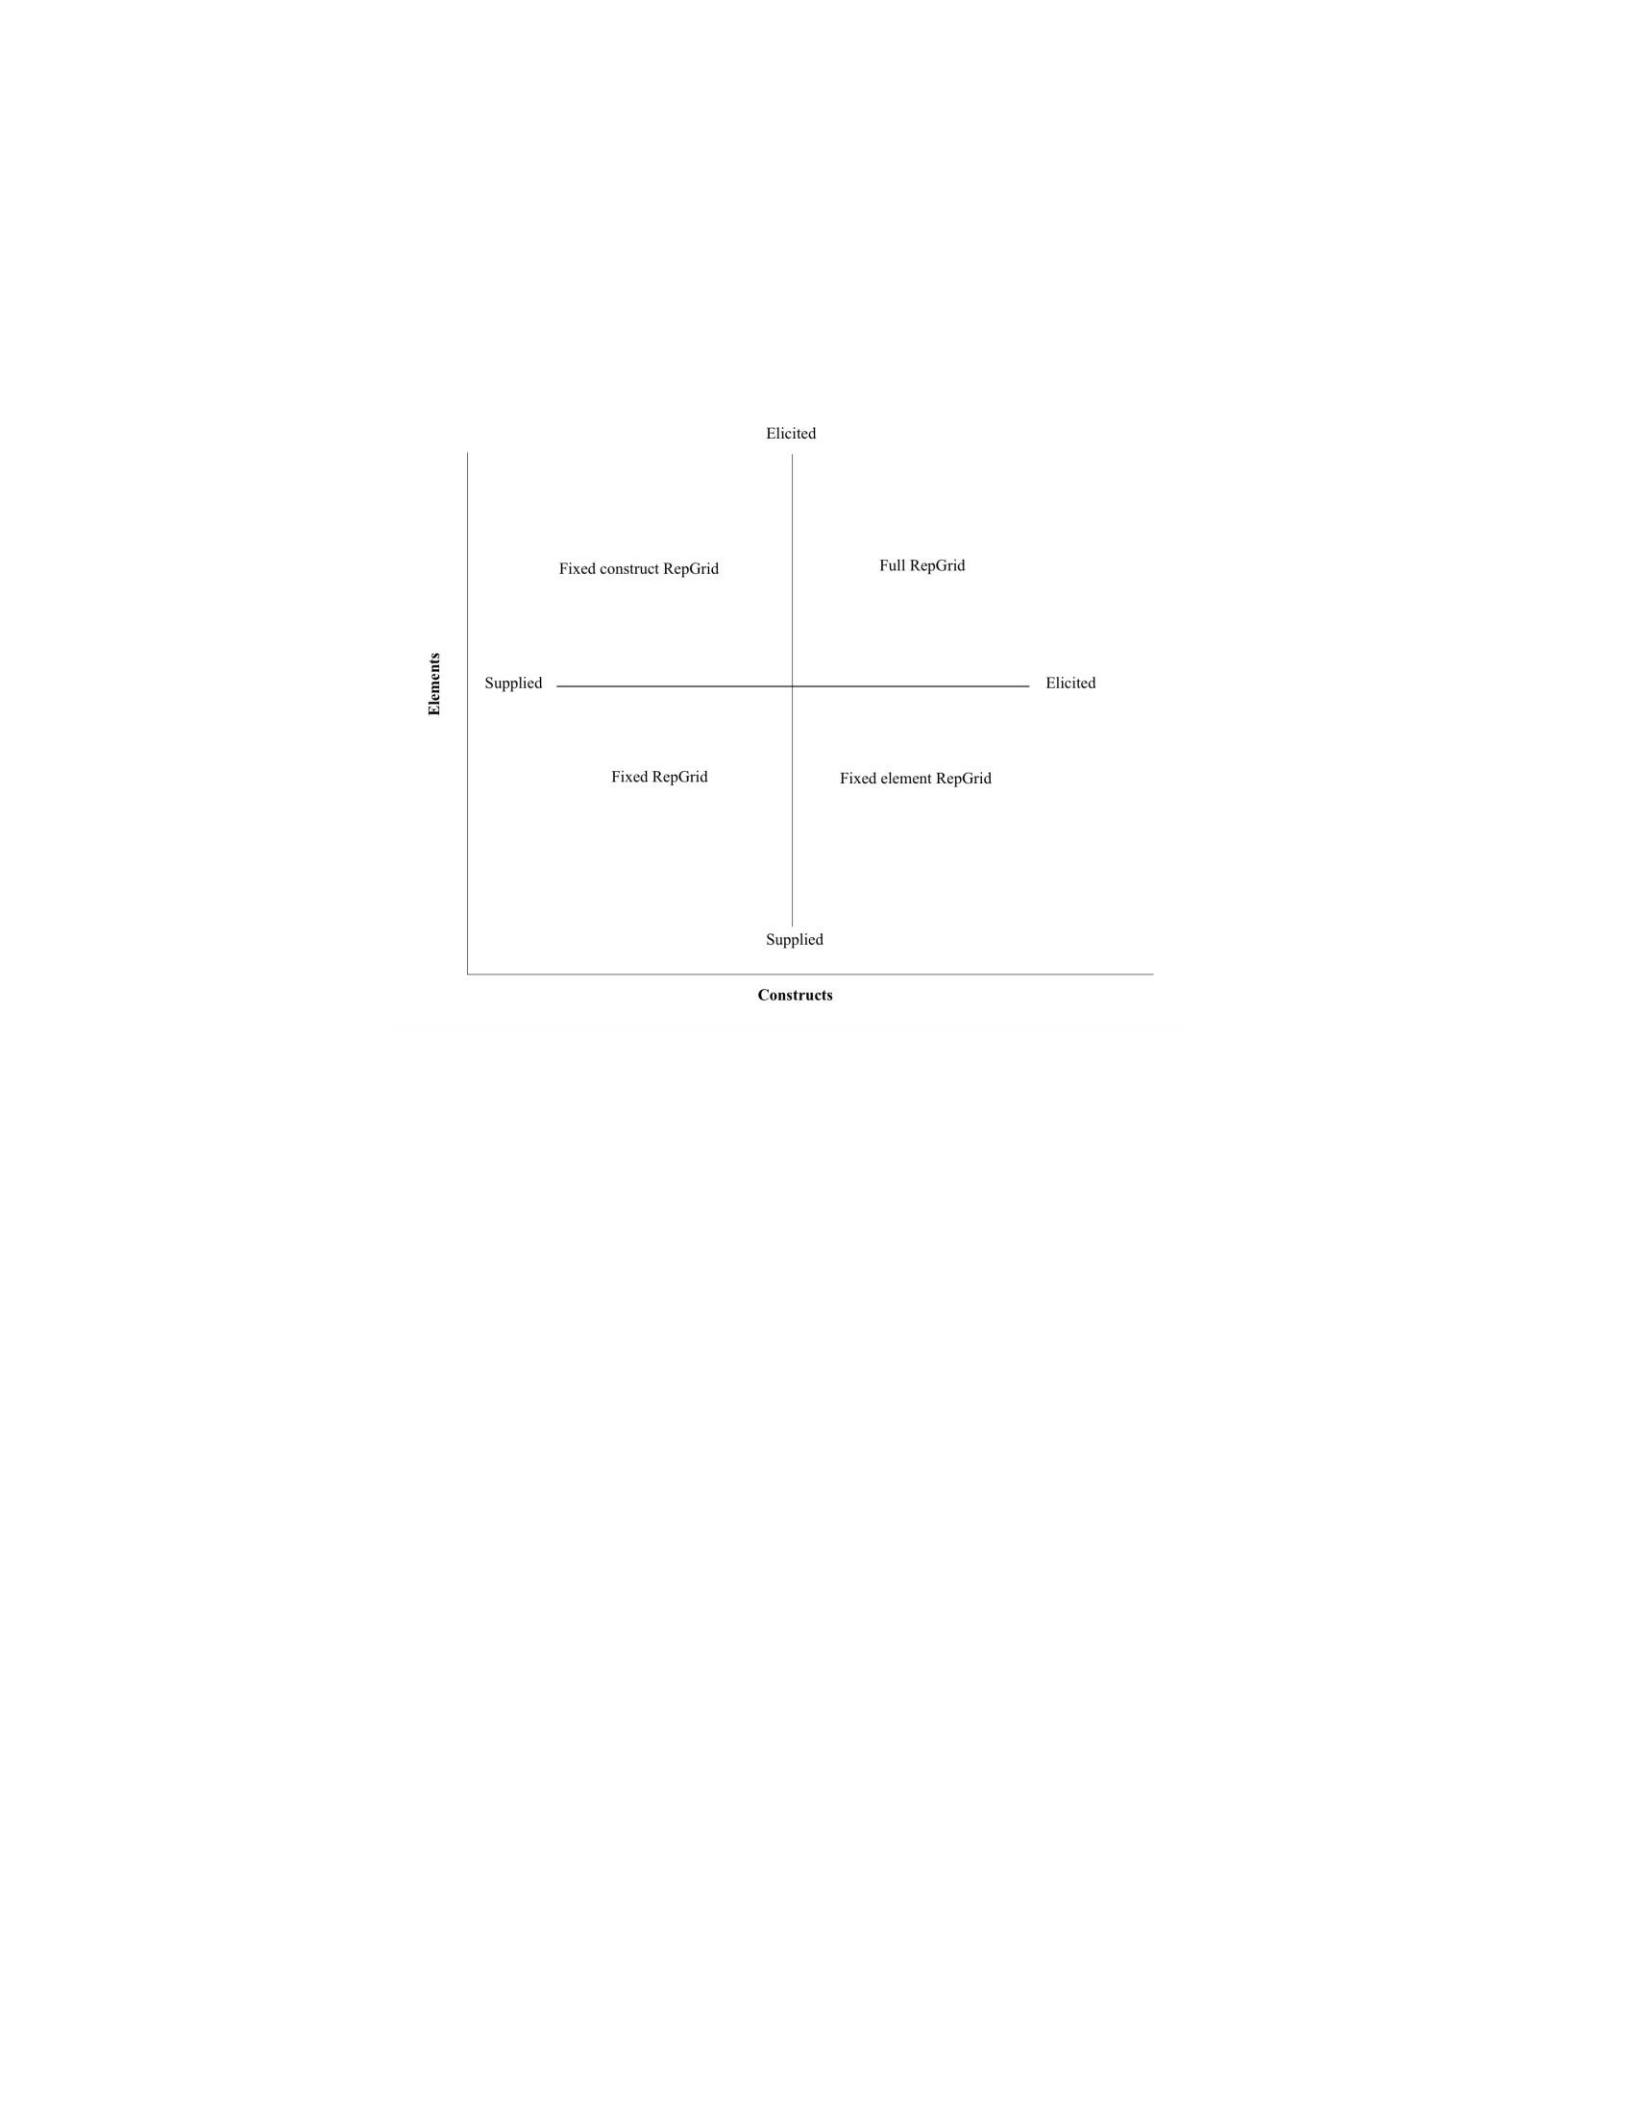
Figure 3.1: The four types of Repertory Grids.
The second part of the method outline focuses on analyzing grids and reporting findings. Various
analyses techniques may be used to analyze Repertory Grids. The choice among these techniques
depends on the context and purpose of the study. The third part focuses on the trustworthiness of
the technique, which is an important issue to be considered while conducting data collection and
analysis. Figure 2 summarizes the steps of the Repertory Grid methodology.
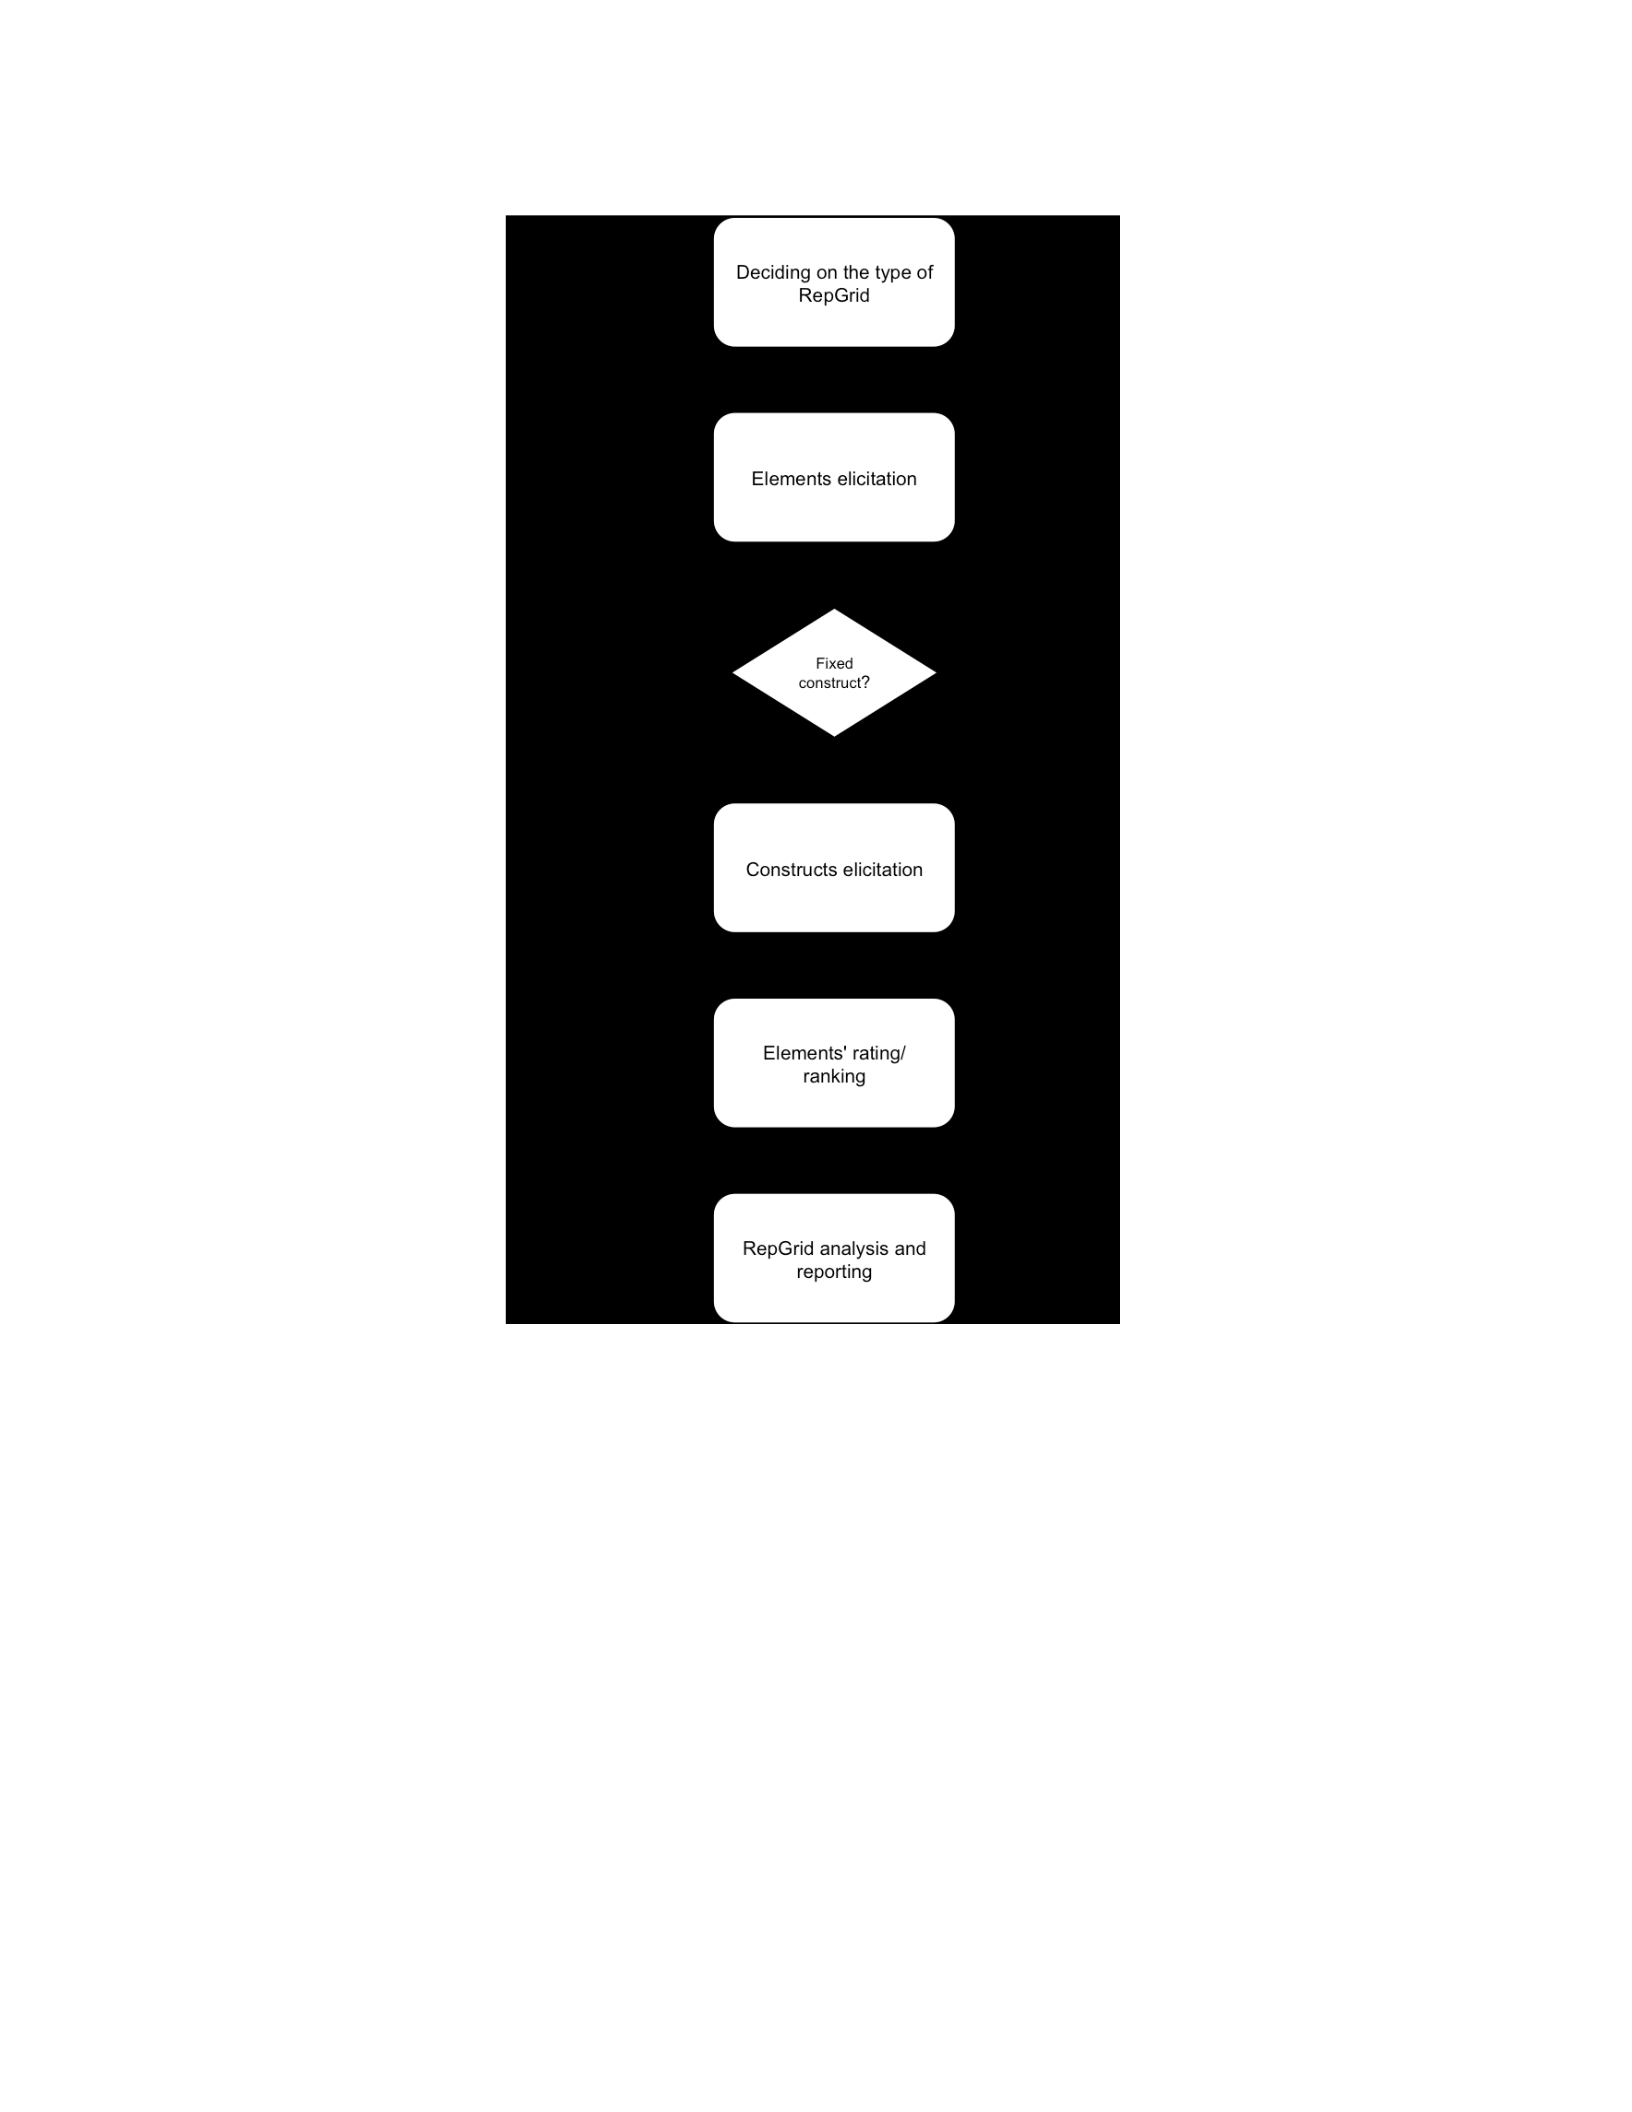
Figure 3.2: The process of Repertory Grid technique.
3.3.1.1 Participants and Data collection
Many studies emphasize that 15 to 25 participants are sufficient for Repertory Grids (Ginsberg,
1989; Tan and Hunter, 2002). That is, normally no more constructs will be generated even if the
sample size increased. The data collection process involves three stages: elements' elicitation,
constructs' elicitation, and elements' ranking/rating, in which elements are linked to constructs.
Stage One: Elements Elicitation

I. Interview
The main purpose of this stage is to identify the elements of the Repertory Grids. In the case of full
Repertory Grids or fixed constructs Repertory Grids, participants will be interviewed to elicit
elements for which they have opinions or thoughts. Most examples in the literature using the
Repertory Grid method used 'structured' interviews for data collection. However, structured
interviews restrict participants' freedom to fully express their opinions and thoughts. Thus,
semistructured interviews will be a better substituent because they allow participants to convey
their views easily, and elaborate and ask questions for clarification.
II. Coding and Categorization
In qualitative research, semi-structured interviews usually result in a large number of concepts that
can be used to generate elements. These concepts should be grouped and categorized to manage
them more easily. The qualitative data analysis should be conducted as follows. First, the researcher
needs to transcribe parts of interviews that are related to the subject under study. Second, the
researcher should perform thematic coding in order to group data into specific categories, which
encompasses all knowledge and experience of participants regarding the subject under study. Thus,
data should be decomposed, conceptualized, and grouped together in different groups (Strauss and
Corbin, 1990). This type of coding involves two steps. The first step focuses on eliciting all
concepts from interview transcriptions related to the subject under study. This process called “open
coding.” The second step focuses on decomposing, grouping, and categorizing concepts resulting
from the previous step. This process is known as “axial coding” (Strauss and Corbin, 1990). The
categorization process helps in identifying the concepts that are more related to the subject under
study. After the coding and categorization, the redundancy should be calculated for each concept.
That is, research should report how many times each concept was mentioned by all participants,
and how many participants mentioned a specific concept. This process helps later in selecting the
group of elements to be used in the study (Jankowics, 2004).

III. Elements selection
Many studies suggested that the number of elements should not exceed ten elements. Indeed,
having more than ten elements will lengthen the interviews in the next stage and will not guarantee
the generation of more constructs (Stewart et al., 1981; Easterby-Smith et al., 1996).
For the final set of elements, most studies select the ten most redundant elements (i.e. 10 most
elements that are mentioned by all participants). To select the appropriate elements, we need to
take two issues into consideration. All elements should be of the same type in the sense that whether
they are people, places, things, etc., and in the sense whether they are nouns or verbs (Stewart et
al., 1981). Another important issue is that elements should be mutually exclusive, that is, there is
no overlap between any two elements (Tan and Hunter 2002; Jankowics, 2004).
After deciding on which elements will be used in the Repertory Grids, the researcher moves to
identify constructs for the Grids. Stage Two: Constructs Elicitation
I. Interviews
This stage aims to identify bipolar constructs, which reflects participants' perceptions and beliefs
about elements. After deciding on the elements, the researcher should identify constructs that will
be used in each grid. If the researcher decides to use supplied constructs, all the grids will use the
same constructs and the researcher move directly to rate/rank the constructs (move directly to stage
3). The supplied constructs can be provided from different sources. Also, the researcher may elicit
constructs from a group and supply it to another group of participants for rating (Tan and Hunter,
2002). On the other hand, if the researcher decides to elicit constructs, a set of interviews should
be conducted. Here, the researcher can use the same participants from the first stage or a different
group of participants. An important issue is that purposive sampling should be employed at this
stage to avoid any biases, which mostly happen when random sampling is used. Also, purposive
sampling can ensure that the sample is more representative (Miles et al. 1994).

Repertory Grid interview is a kind of structured interview that is used in this research. In this stage,
this kind of interviews is the proper choice (Tan and Hunter 2002; Jankowics, 2004; Hair et al.,
2009) where participants need to explain how they construe similarities and differences between
elements. The structured interviews will use elements identified in stage 1 to elicit constructs.
There are different elicitation techniques the researcher can use to elicit constructs during the
interviews. Figure 3 shows a sample interview sheet used in this study for eliciting and rating
constructs. The sheet may include interviewee name or a given identification, date of the interview
and the purpose of the interview. Since we only elicit constructs, we have not included the purpose
of the interview in the interview sheet.
The elements should be represented on the top of the sheet (represented by E1, E2, etc. in figure
3). The bipolar constructs should be represented on the both sides of the sheet. The left-hand side
includes the constructs, while the right-hand side includes their opposites. The elicitation technique
should be specified at the bottom of the sheet, along with a brief illustration of how this process
was achieved. For example, the triadic method is used in this research to elicit constructs. Thus,
the elicitation method cell may include triadic, 123, 456, 258, and so on.
Interviewee:
Date:
Interview purpose:
Grid number:
1
E1
E2
E3
E4
E5
E6
E7
E8
E9
E10
5
C1
C1
C2
C2

C3
C3
C4
C4
C5
C5
C6
C6
C7
C7
C8
C8
C9
C9
C10
C10
Elicitation method:
Figure 3.3: A sample interview sheet for eliciting and rating/ranking constructs.
II. Elicitation methods
Researchers may use different elicitation methods to elicit “bipolar” constructs from the
participants. Construct elicitation is a method-dependent. That is, the type of constructs will differ
based on the elicitation method used (Caputi and Reddy, 1999). These methods are different in the
way elements are presented to participants. The five main methods for construct elicitation are as
follows:

• Monadic approach: the researcher asks a participant to describe each element with a single
word or phrase. Then, the participant will be requested to provide the opposite of the word
or phrase (Caputi and Reddy, 1999).
• Dyadic approach: the researcher provides two elements at a time to a participant. Then, the
participant will be asked to determine whether these elements are similar or different. If the
participants perceive these elements as similar, the remaining elements will be considered
to identify an element that is different from the original two and the participant will be
asked to describe the difference. On the other hand, if the two elements are perceived to be
different, then the participant will be asked to describe the difference. This process will be
repeated until reaching a proper set of relevant constructs (i.e. reach the saturation point).
This method is simpler than the triadic as it generates less complex constructs. It is preferred
for participants such as children who require a simpler elicitation process. In this process,
a participant must consider similarity or differences between elements. Thus, there is a
balance between positive and negative constructs (Caputi and Reddy, 1999).
• Triadic approach: this is the traditional method for eliciting constructs (Kelly's (1955)
triadic approach). The researcher randomly selects three elements and asks a participant
to identify and describe how two elements are similar and how they are different from the
third. This process will be repeated until reached proper set of relevant constructs (i.e.
saturation) (Tan and Hunter, 2002). This method creates constructs that are cognitively
more complex than those generated by the dyadic method. A participant needs to compare
and contrast elements simultaneously. Thus, it focuses more on positive constructs (Caputi
and Reddy, 1999).
• Full context form approach: the researcher asks a participant to sort all the elements into
separate groups based on similarities between them. Then, the participant will be asked to
describe each group in two or three words, which represent the group label. This approach

focuses more on similarities. Thus, it may be used in research about "understanding
cognitive grouping" and "shared meaning" (Tan and Hunter, 2002).
• Group elicitation: all participants work together to elicit constructs (e.g. work in a
workshop). Any of the techniques described above can be used to elicit the constructs but
with all participants instead of one participant. This method allows participants to explore
different constructs, which may help participants gain a better understanding (Tan and
Hunter, 2002).
An important issue to consider when eliciting constructs is that constructs should be bipolar.
Whatever method is used to elicit a construct, the researcher needs to elicit the opposite of the
construct (e.g. very important – not important). Another issue is that each grid should be supplied
with “overall bipolar construct,” which is a broad construct that can be applied for all of the
elements. This construct summarized participants' overall perceptions and beliefs (Jankowicz,
2004). It is required later to ensure the reliability of constructs rating/ranking. Each participant
should rate or rank the overall construct regarding each element. Also, it is preferred to let
participants rate or rank elements directly after completing constructs' elicitation process.
Stage Three: Rating/Ranking of Elements
Each bipolar construct should be rated/ranked regarding each element. Rating/ranking is a way for
linking elements to constructs (Tan and Hunter, 2002). Different techniques can be used for
ranking/rating elements. The first technique is dichotomizing. This technique is similar to binary
ranking technique. When an element is closest to the left construct, then a check mark is located
against that element. Otherwise, a cross is located against the element (Tan and Hunter, 2002). This
technique is not preferred because it can generate a skewed distribution (Esterby-Smith et al.,
1996). Another problem is that a participant needs to select either the left or right construct. This
technique ignores the options which may occur between the left and right construct, which may
not reflect the participant's beliefs (Beail, 1985).

The second method is ranking. A participant is asked to ranks elements between the right and left
construct (Tan and Hunter, 2002). This technique reduces the problem of generating skewed
distribution (Beail, 1985). However, participants need to differentiate elements, even if there is no
difference between them (Tan and Hunter, 2002).
The third technique is rating. This technique is most preferred and widely used technique
(Hunter, 1997). In this technique, a participant is asked to rate the elements on a Likert scale. The
Likert scale can be three, five, seven, nine or eleven scale. Many researchers emphasize that five-
points Likert scale is the optimal choice to use when rating elements in Repertory Grids
(Jankowicz, 2004; Bell, 1990). Using a Likert scale with less than five points may restrict
participants' freedom to explain their perceptions and beliefs (Tan and Hunter, 2002; Bell, 1990).
On the other hand, using a Likert scale with more than five points make it hard to visually examine
results (Tan and Hunter, 2002; Stewart et al., 1981). After the elicitation and rating processes are
completed, grids are ready for analysis.
3.3.1.2 Repertory Grids Analysis
Parts of the analysis process should be conducted in the first stage for coding and categorizing
elements. It is important to mention that data analysis at this stage consists of the integration of
qualitative and quantitative analysis. In term of qualitative analysis, the researcher should perform
a data coding and categorization for all constructs that are elicited from all participants, which is
necessary before starting the qualitative analysis. To generate constructs' categories, a researcher
can use pre-existing categories available in the literature, books, or international standards. Another
technique is the “bootstrapping” technique (Jankowics, 2004). The bootstrapping technique
involves examining each construct and see if it can fall under a predefined group, or there is a need
to create a new group. The categorization process is necessary as the first step for quantitative
analysis to facilitate construct management (Jankowics, 2004). For quantitative analysis, different

analysis methods that can be used to analyze the grids. The researcher should select an analysis
method based on the type of data at hand and the purpose of the study. Thus, the researcher needs
to define the type of data in the grids to ensure the validity of grid analysis (Bell, 1988). The data
in grids can involve ratings, rankings or ticks (based on rating technique used). Grids can contain
interval, nominal, categorical, or ordinal data. Therefore, the researcher needs to consider the type
of data in grids to select the proper analysis method.
Analyzing a Single Grid
Individual Repertory Grids can be analyzed using different statistical techniques. Deciding on
which technique the researcher need to use depends on the purpose of study and data at hand. An
important issue to consider is that each of the analysis technique can use visual representation to
represent data in the form of tables and graphs. This visual representation is very useful for
analyzing and interpreting results.
The first technique is the frequency count. The frequency count is a simple analysis technique
which involves counting how many times participants mentioned each element and construct. This
technique is mostly used to find the most popular trends. Another issue is that a frequency count
can be used only when constructs and elements are well defined. Having well-defined constructs
and elements minimizes the chance for having different understandings and beliefs for the same
element or construct (Hunter, 1997; Boyle, 2005).
In case where elements or constructs are not well defined, content analysis should be used (Stewart
et al., 1981). As mentioned above, elements and constructs coding and categorizing is the first step
before starting the content analysis. There are different methods for doing content analysis.
Jankowics (2004) suggested nine steps for content analysis based on Honey's (1979) method.
• The first step involves identifying ratings for the 'overall' construct regarding each element.
The ratings of overall construct reflect overall perception and beliefs of each participant.

• The second step involves calculating the sum of differences for each bipolar construct
against the overall construct.
• The third step includes converting the sum of differences for each construct into 'percentage
similarity score' (i.e. normalization process). Thus, the researcher can compare grids that
have a different number of constructs. A “look-up table” can be used to extract 'percentage
similarity score' rather than calculate it manually. Jankowics (2004) provided a method for
calculating “percentage similarity,” which can be used here.
• In the fourth step, “reversed” scores should be calculated for the overall construct. For
example, in a five-point scale 1 converted into 5, 2 into 4, 3 stays the same and so on. The
rule of thumb for reversing score is that if the researcher uses n-points scale then each score
should be subtracted from n+1 to reverse it (Jankowics, 2004). After reversing the overall
construct scores, the sum of the differences should be calculated against the “reversed”
scores.
• The fifth step involves converting the sum of differences for each construct (from step 4)
into percentage similarity scores per step 3.
• In step six, the highest percentage of similarity should be identified. This refers to the
highest percentage between the two “percentage similarity scores’ (from step 3 and step
5).
• Step seven includes recording the ranking for each “highest” percentage similarity score in
term of high, medium, or low. These rankings reflect the correlation between each bipolar
construct and the “overall” construct.
By completing step seven, individual grids are prepared for group analysis. The following section
focuses on multiple grid analysis comparing different grids together.

• In step eight, each construct should be assigned to one of the categories that were generated
before starting the quantitative analysis. All the information from the previous steps should
be recorded in spreadsheet tables.
• In step nine, all the tables should be converted into bar charts to show the most important
constructs' categories. Each chart is related to a subgroup of participants. Participants can
be categorized into subgroups based on specific criteria such as type or level of
professionalism or gender.
The researcher needs to create a table for each subgroup of participants. One chart can be created
for all participants. This chart shows the percentage of constructs in each subgroup or category.
Each bar represents a construct’s category and shows high, medium and low correlations between
constructs within that category and the overall construct. The most important category is the one
that with the highest bar. Another way for interpreting the charts is by considering the categories
that have the highest part of the bar that shows high correlation. That is, the researcher should focus
only on constructs that have high correlations and considers the ones that have highest “high” part
of the bar as the most important construct categories. Content analysis is important when analyzing
Repertory Grids. Many researchers have employed content analysis before doing any quantitative
analysis.
Moreover, Repertory Grids can be analyzed using a technique called “visual focusing” (Hunter,
1997). Visual focusing involves reordering elements and constructs, such that similar elements are
located next to each other. The same thing applied for constructs. In some cases, the researcher
needs to reverse the bipolar construct (i.e. the right construct placed in the left side and the left
construct placed in right side) based on the match between the ratings. Visual focusing helps in
elucidating the similarities and differences among elements and constructs (Tan and Hunter, 2002).
Another way to analyze Repertory Grids is to employ statistical analysis, which can explain
relationships between constructs and elements and among constructs and elements. One technique

is Cluster Analysis, which is considered a form of visual focusing (always electronic) (Tan and
Hunter, 2002). Certain Repertory Grids software provides a visual representation for elements
clustering as well as construct clustering using FOCUS algorithm.
Another statistical technique consists of Principal Component Analysis (PCA) and factor analysis.
This technique is the most common method used when analyzing Repertory Grids (Bell, 1990).
This technique allows the researcher to examine correlations and to decide on the number of factors
to retain based on eigenvalue (Velicer, 1976), percentage of variance explained (Bell, 1990), or
both. Other rules of thumb can be used to decide on the number of factors to retain, such as scree
plots and minimal average partial correlation (Velicer, 1976). PCA also measures loading of
constructs onto the factors, which helps in identifying the main factors that can help in answering
research questions. Besides tables, PCA can be represented graphically through tables with clusters
and plots to show the match among constructs and elements, and loadings.
Finally, a researcher may use a combination of some or all of the above techniques. For example,
Hunter (1997) used content analysis and visual focusing to analyze different grids. Thus, the
purpose of the study decides the kind of technique(s) that should be employed.
Analyzing Multiple Grids
Besides content analysis, Principle Component Analysis and Cluster Analysis, other techniques
can be used to inspect similarities and differences between different grids. Tan and Hunter (2002)
suggested three approaches to compare multiple grids. The first approach is linguistic analysis.
This approach focuses on classifying and grouping constructs through analyzing participants'
linguistics. Linguistic analysis reduces researcher bias in understanding participants' constructs.
However, this analysis is hard to carry (Tan and Hunter, 2002). The second approach is to employ
a mapping technique (e.g. Q-type factor analysis) to map participants' constructs (Tan and Hunter,

2002). Unlike standard factor analysis, Q-type factor analysis used to examine correlation among
cases (or participants). The primary goal of this technique is "to identify factors based on which
several individuals can be compared, wherein variables are not grouped, but individuals
discriminate among them" (Iliescu, 2005, p. 82). This technique results in clustering participants
based on the similarities among their constructs (Tan and Hunter, 2002). The last approach is to
use multivariate analysis techniques such as regression and discriminant analysis. These techniques
focus on grouping participants based on the similarities of their cognitive constructs (Tan and
Hunter, 2002).
3.3.1.3 Trustworthiness
Like any other scientific research, Repertory Grids must be verified to ensure the trustworthiness
(i.e. rigor) of the study. A study should be verified incrementally during the research process to
guarantee reliability and validity. The verification process is "the process of checking, confirming,
making sure, and being certain." Verification is important to build a solid product through
identifying and fixing errors. Also, it helps in directing the researcher regarding when to continue,
stop or modify the research to ensure reliability and validity (Morse et al., 2008).
In this method, different processes should be considered to ensure trustworthiness of the study.
Collecting data using structured interviews, as conducted based on Kelly's (1955) Personal
Construct theory, can ensure the validity and reliability of the data because structured interviews
(i.e. Repertory Grid interviews) can minimize or mitigate the researcher's bias (Tan and Hunter,
2002). A hermeneutic circle should be conducted to ensure reliability and validity of the data. That
is, after the researcher transcripts the interviews, he or she should forward the interviews back to
participants so; they can verify the data elicited from the interviews. Also, purposeful sampling is
used to increase the chance to gather more representative and relevant data and to minimize bias

(Strauss et al., 1990). Despite the suggestion in the current literature regarding the sample size,
interviews may be continued until a saturation is reached, ensuring more reliable and valid data.
After all, selecting the right method to analyze specific data and to serve a specific purpose in the
study is an important issue that contributes to the trustworthiness of the findings (Bell, 1988).
3.4 Action Design Research (ADR)
Many IS researchers emphasize that IS research must provide theoretical contributions and solve
issues that practitioners may face (Rosemann and Vessey, 2008). However, IS research still suffers
from the gap between research and practice.
Hevner et al. (2004) propose a design science approach that focuses on designing and building IT
artifacts. This approach allows researchers to create design knowledge related to practice (Hevner
et al. 2004). Sein et al. (2011) claim that the traditional design of science research ignore or do not
appreciate how organizational context can shape the design and the artifact. They argue that IS
research needs a method that “aims at building innovative IT artifacts in an organizational context
and learning from the intervention while addressing a problematic situation” (Sein et al., 2011, p.
38). Sein et al. (2011) have introduced a research method known as action design research (ADR),
which encompasses constructing, intervention, and evaluation of an ensemble artifact. Sein et al.
(2011) define ensemble artifact as “the material and organizational features that are socially
recognized as bundles of hardware and/or software” and which emerge from design, use, and
continuous alteration in an organizational context (Sein et al., 2011, p. 38).
In this research, we adopted Sein et al.’s (2011) action design research (ADR) method to show how
our artifact can emerge as a result of the interaction between information security and people
values. With ADR, the building and continuous testing of the artifact within an organizational
context helps in generating “prescriptive design knowledge.” Moreover, ADR tends to solve a
problem within an organizational context through building, intervening and evaluating the artifact.

ADR consists of four stages. Each stage is supported by principles that recognize the core
assumptions, beliefs, and values (Sein et al., 2011).
Stage One: Problem Formulation
This stage is triggered by an immediate or anticipated problem. Practitioners may perceive a
problem that can be framed by the researchers. Practitioners, users, the researchers, technologies,
and literature can provide input for this stage, where a research problem is recognized and
conceptualized based on current theories and technologies. In this stage, the researchers determine
the initial scope and frame the initial research questions. Also, the problem is defined as an
instantiation of a class of problems. One of the important tasks to be considered at this stage is to
secure the long-term organizational commitment from the participating organizations. Another
critical task that should be considered in this stage is deciding the roles and responsibilities of
participant practitioners (Sein et al., 2011).
This stage is anchored by two principles:
• Practice-Inspired Research
This principle stresses that problems should be considered as “knowledge-creation opportunities”
that are positioned at the intersection of technological and organizational fields. With ADR,
researchers need to create knowledge that is applicable to the class of problems where the particular
problem instantiated from. Thus, the research process is “problem-inspired.”
• Theory-Ingrained Artifact
This principle emphasizes that theories should underlie the ensemble artifacts. Within this
principle, previous theories can be used to structure the problem, identify solutions and direct
design. Also, action design researchers “ingrained” theoretical aspects in the artifact, so the theory
can be expressed “in a socially recognizable form.” As a result, this process results in the
production of the preliminary design of the “theory-ingrained” artifact.

Stage Two: Building, Intervention, and Evaluation
In this stage, the problem formulation and theoretical premises, which are generated in the first
stage, are used to provide a base to create the preliminary design of the artifact. Here, the processes
of building, intervention, and evaluation (BIE) of the artifact are interlinked. This stage involves
continuous testing of the problem and the artifact. The BIE stage results in “the realized design of
the artifact.” Also, it explains whether innovation derived from the artifact design or the
organizational intervention. Sein et al. (2011) have defined two end points for the range of research
design that a researcher can choose from:
• IT-Dominant BIE: This method fits ADR that tends to generate an innovative
technological design at the beginning. Organizational commitment can be shaped through
continuous instantiation and evaluation of the emerging artifact and the theories embedded
in it, which can be achieved through organizational intervention. The emerging artifact is
exposed to participants’ expectations and knowledge. This process leads to the final design
of the ensemble artifact. Therefore, researchers take “beta version” of the artifact and apply
it in a broader organizational context. This process comprises assessing the artifact in the
use setting. This extensive evaluation aims to keep the continuous refinement of the artifact
that is formed and re-formed by the setting of its usage.
• Organization-Dominant BIE: This approach tends to create design knowledge, although
the main cause of innovation is organizational intervention. During BIE, researchers should
deal with the participants’ current thoughts and assumptions regarding the use of the artifact
in certain context to generate and enhance the design. At the end of each iteration, the
artifact and design principles should be evaluated. Here, researchers deploy the artifact in
the organization during the design iterations. The iterations should be ended when the
decision is made to accept or refuse the artifact, or when the further cycles add no or minor
contributions.

This stage anchored by three principles:
• Reciprocal Shaping
This principle highlights that the mutual influences of the artifact and the organizational context
cannot be separated. Here, researchers are involved in the continuous decision cycles that go to
very detailed elements in each domain.
• Mutually Influential Roles
This principle emphasizes that it is important for the participants in ADR to learn from each other
and to share knowledge with each other. Researchers can provide knowledge about theory and
technology while practitioners can provide knowledge about work practices.
• Authentic and Concurrent Evaluation
This principle stresses that the process of evaluation cannot be not separated from the research
process that comes after the building. Thus, decisions regarding the design and shape of the artifact
should be associated with continuing evaluation. Here, the alpha version of the artifact is exposed
to “formative” evaluation, which helps in recognizing the expected and unexpected consequences.
On the other hand, the beta version of the artifact is exposed to “summative” evaluation to evaluate
its value and usefulness.
Stage Three: Reflection and Learning
This stage applies the learning from the previous stage to a wider class of problems. It is continuous
and can be achieved in parallel with the stage one and stage two. This stage emphasizes that the
“conscious reflection on the problem framing, the theories chosen, and the emerging ensemble is
critical to ensure that contributions to knowledge are identified.” The contiguous evaluation may
lead to changes in the research process, as the understanding of the artifact increases during the
research.

This stage anchored by one principle, namely Guided Emergence. This notion is used to reflect the
interplay between the design and the emergence. Researchers generate the initial design that
shaped by ongoing organizational use, perceptions and results of the evaluation. That is, the
ensemble artifact combines the preliminary design of the artifact (Principle 2) as refined by
interactions among participants, organizational use, and perceptions (Principles 3 and 4) and by
results of the “formative” evaluation (Principle 5). The refinement is triggered by both expected
and unexpected outcomes from BIE iterations.
Stage Four: Formalization of Learning
This stage aims to develop the learning from the ADR into general concepts for a class of field
problems. Researchers can formalize the learning through abstracting what is accomplished in the
artifact and defining the organizational consequences that can be considered as design principles
and reshaping to theories that support the preliminary design.
This stage anchored by the principle of Generalized Outcomes.
The resulting artifact from ADR is “a bundle of properties in different domains,” which can be a
solution to a specific problem. ADR emphasized that both problem and solution could be
generalized. One of the critical elements of ADR is the “move from the specific-and-unique to
generic-and-abstract.” Here, generalization has three levels: (1) generalizing the problem instance
through considering the problem as an instantiation of a class of problems, (2) generalizing the
solution instance through re-conceptualize the instantiated solution into a class of solutions, and
(3) driving design principles from the design research outcomes. The design principles are framed
and articulated in the stage of formalization of learning and refined thru the BIE cycles. BIE is an
inductive step linking design principles to a class of solutions and a class of problems.
To sum up, ADR is a design research technique that supports knowledge generation through
recognizing ensemble artifacts. It provides researchers with more comprehensive views of artifact
design and use. ADR tends to analyze the ongoing refinement and use of the artifact in order to

generalize the outcomes. It is an appropriate method to theorize ensemble artifacts through
exploring ongoing evolution of the artifact. ADR emphasizes that the artifact emerges from the
interplay between the organizational context and technology.
3.5 Research Design
3.5.1 Unit of Analysis
This research focuses on studying norms of employees within an organization. To do so, we
established a virtual e-commerce company known as Crown Confections. Crown Confections is
an independent, small e-commerce business that provides various interesting desserts for sale
through its website. The Crown Confections company offers a variety of desserts at a reasonable
price for different kinds of customers. The goal of the Crown Confections is to help customers to
find desserts they are looking for easier and faster. The website was launched in February 2015.
The Internet commerce website operates only in laboratory settings and does not have any public-
facing access. This social experiment is conducted to simulate a real e-commerce business. Like
any organization, Crown Confections has information security policies created based on security
standards typically used in real organizations.
3.5.2 Data Collection
This research adopts a hybrid type of Repertory Grid between fixed RepGrid and fixed element
RepGrid because the constructs were elicited from one group and supplied to other groups, and the
elements were supplied from the information security policy that was developed for the
experiment. In this research, the data is collected using Repertory Grids technique. This study is
conducted in two stages: the alpha stage and the beta stage. At the first stage, data is collected
through conducting a “conceptual” experiment that simulates real organizations. The participants
were grouped into five groups based on the SSE-CMM levels in addition to the “expert” group.

The elements were supplied from the information security policy that was developed for the social
experiment. Here, five elements are used in this study: acceptable use policy, information security
roles and responsibility, password policy, email policy, and remote access policy. These five
elements represent the five policy themes available in the information security policy that was
developed for the Crown Confections.
After deciding on the elements, “bipolar” constructs are elicited through interviewing the “expert”
group using Repertory Grid, structured interviews. In this research, the triadic approach is adopted.
The triadic approach is Kelly’s (1955) traditional method for eliciting constructs.
After eliciting constructs, participants need to rate each construct against each element. So,
participants should rate the constructs using five points Likert scale because it is the optimal choice
to use when rating elements in Repertory Grids (Jankowicz, 2004; Bell, 1990). The rating
technique is adopted because it is the most preferred and widely used technique for rating/ranking
Repertory Grids (Hunter, 1997). For the purpose of this study, each participant rated the same grid
twice, one before introducing the security breach and one after. At this point, grids are ready for
the analysis.
At the second stage, the data is collected through conducting a laboratory experiment. This
experiment simulates a real e-commerce organization. The participants were divided into five
groups based on the SSE-CMM levels in addition to the “expert” group. We used the expert group
to validate the constructs from the first stage and identifying emerging constructs. The same
process as the first stage was followed.
3.5.3 Data Analysis
The first step to analyze the grids is to code and categorize the constructs. In this research,
“bootstrapping” technique is use to categorize the constructs. By deciding on the categories, the
grids are ready for the quantitative analysis. Selecting an analysis method depends on the kind of

data at hand and the purpose of the study. As mentioned above, this research uses a 5-Likert scale
to rate the constructs against each element. Therefore, the data this research seeks is ordinal data.
This research aims to exploring the different norms of employees with respect to security rules and
standards and the changing in these norms following a security breach. In addition, it aims to
explore the relationship between security rules and employee’s norms. Therefore, each grid will
be analyzed separately, and then the grids will be analyzed in combination in order to compare
them.
Since our constructs are not well defined, the content analysis is conducted. In this research, the
content analysis method that is proposed by Jankowics (2004) is adopted. Jankowics (2004)
suggested nine steps for the content analysis based on Honey's (1979) method.
1. Identifying ratings for the overall construct regarding each element.
2. Calculating the sum of differences for each bipolar construct against the overall construct.
3. Converting the sum of differences for each construct into “ percentage similarity score.”
4. Calculating reversed scores for the overall construct.
5. Converting sum of differences for each construct (from step 4) into percentage similarity
scores.
6. Identifying the highest percentage of similarity.
7. Recording ranking for each highest percentage similarity score in term of high, medium or
low.
After the completion of step seven, individual grids are ready for group analysis:
8. Each construct should be assigned to one of the categories that were generated before
starting the quantitative analysis. All the information from the previous steps should be
recorded in spreadsheet tables.

9. All the tables should be converted into bar charts to show the most important constructs'
categories. Each chart is related to a subgroup of participants. Participants may be
categorized into subgroups based on specific criteria.
After finishing content analysis, Principal Component Analysis (PCA) is conducted to examine
the correlations among the constructs, among the elements and between the constructs and
elements. In this research, Microsoft Excel 2011 and SPSS Statistics 23 are used to conduct PCA
analysis. Also, trustworthiness has been considered during the data collection and analysis to
ensure reliability and validity.
3.6 Conclusion
This chapter provides an overview of the theory and research methodology that are used in this
study. It aims to present Repertory Grid technique, which is grounded on the Personal Construct
Theory, as a mean of investigation in this research. Also, it provides an overview of the different
alternatives that can be employed when conducting Repertory Grid technique. Selecting between
the alternatives of the Repertory Grid method depends on the nature and purpose of the research
topic and the type of data in hand.
On the other hand, this chapter describes the research design of this study. It provides an overview
of the Crown Confections company as the unit of analysis in this research. Besides, it provides an
overview of the two stages of this study. It also explains the RepGrid interview (triadic approach),
rating approach, coding and categorization, content analysis, and principle component analysis
technique that are adopted in this research.

Chapter 4: Conceptual Definition of the Artifact
4.1 Introduction
This study examines how employees of an organization perceive the security policy of their
organization and how their perceptions change in response to the occurrence of a security incident.
The goal of the alpha stage is to develop the alpha version of our artifact (i.e. the emerging artifact).
The emerging norm-rule compliance RepGrids (i.e. the alpha artifact) are continuously tested and
validated in order to build the beta artifact (at the beta stage).
In this chapter, we provide a detailed explanation of the alpha stage process. The alpha stage aims
to examine people perceptions regarding security policy of their organization and the changes in
their perception following security incidents. Also, it aims to build an “emerging” artifact
following Kelly’s Repertory Grid technique that was explained in the previous
chapter.
As previously mentioned, the Repertory Grid technique is an interviewing technique, which
generates data from a set of interviews. The elicited data is represented in two-dimensional grids
that can be analyzed using qualitative and quantitative methods. Here, elements are the main five
policy themes in Crown Confections security policy. Thus, the elements will be supplied in this
study, whereas the constructs will be elicited from one group and supplied to other groups.

Therefore, this research has adopted a hybrid type of Repertory Grid between fixed RepGrid and
fixed element RepGrid.
4.2 Data collection
The alpha stage of this study was conducted over a period of four months. As previously
mentioned, the elements are the main five policies in Crown Confections security policy. The
“supplied” five elements are:
• Clean desk policy
• Information security roles and responsibilities
• Password policy
• Email policy
• Remote access policy
Then, these five elements were used to elicit the constructs. The elicited constructs represent
employee perceptions regarding the security policy of the organization.
4.2.1 Eliciting Bipolar Constructs
i. Participants
A purposive sample was obtained to represent the “expert” group at this stage. This sampling
technique was used to serve the needs of this study. Purposive sampling helps to mitigate research
biases and ensure that the sample is more representative (Miles et al., 1994), which helps in
satisfying the research needs. So, five graduate students were chosen to represent the “expert”
group who were used to elicit the constructs. Each of the five students has high experience with

the information systems security, high technical skills or both. Also, they worked or are working
in varying types of organizations that have a different level of information security.
ii. Structured interviews and Construct Elicitation
In this research, RepGrid interviewing technique was adopted to elicit the constructs. The RepGrid
interview is a qualitative data collection technique to elicit beliefs, thoughts, views and perceptions
of the participants, which grounded on Kelly’s (1955) Personal Construct Theory. Many studies
show how RepGrid interviews should be conducted to ensure the validity of the
results.
Five one-to-one RepGrid interviews were conducted with the five “experts” to elicit a set of
“bipolar” constructs that shows how each participant perceives security policy. Each interview was
arranged through email contact with each participant. A copy of the Crown Confections security
policy was sent to each one of the experts before the day of the interview. One or two interviews
were conducted per day. Each interview lasted between 45 minutes to one and half hours. At the
beginning of the interview, the Crown Confection company was introduced to the interviewee.
After each interview, the researcher reviewed the interview script and reflected. It is important to
mention that a point of saturation was reached after the third interview. That is, the fourth and the
fifth interviews added no new constructs. However, the interviews were continued after the
saturation point to ensure that different types of “experts” were covered.
After clarifying the purpose and background of this research, the process of the traditional RepGrid
interview (i.e. triadic) was explained to the participants. The interviews involved five index cards.
Each element was written on one of the cards. The researcher clarified that the purpose of the
interview was to elicit the participant’s perception regarding each one of the five security policies.
During each interview, the index cards were offered to the participant in triads (i.e. three cards at
a time). The researcher asked the participant to specify which two of the three policies are similar
and how the third is different. By determining how two policies are similar, the researcher can get
the construct. On the other hand, obtaining how the third policy differs from the other two provides
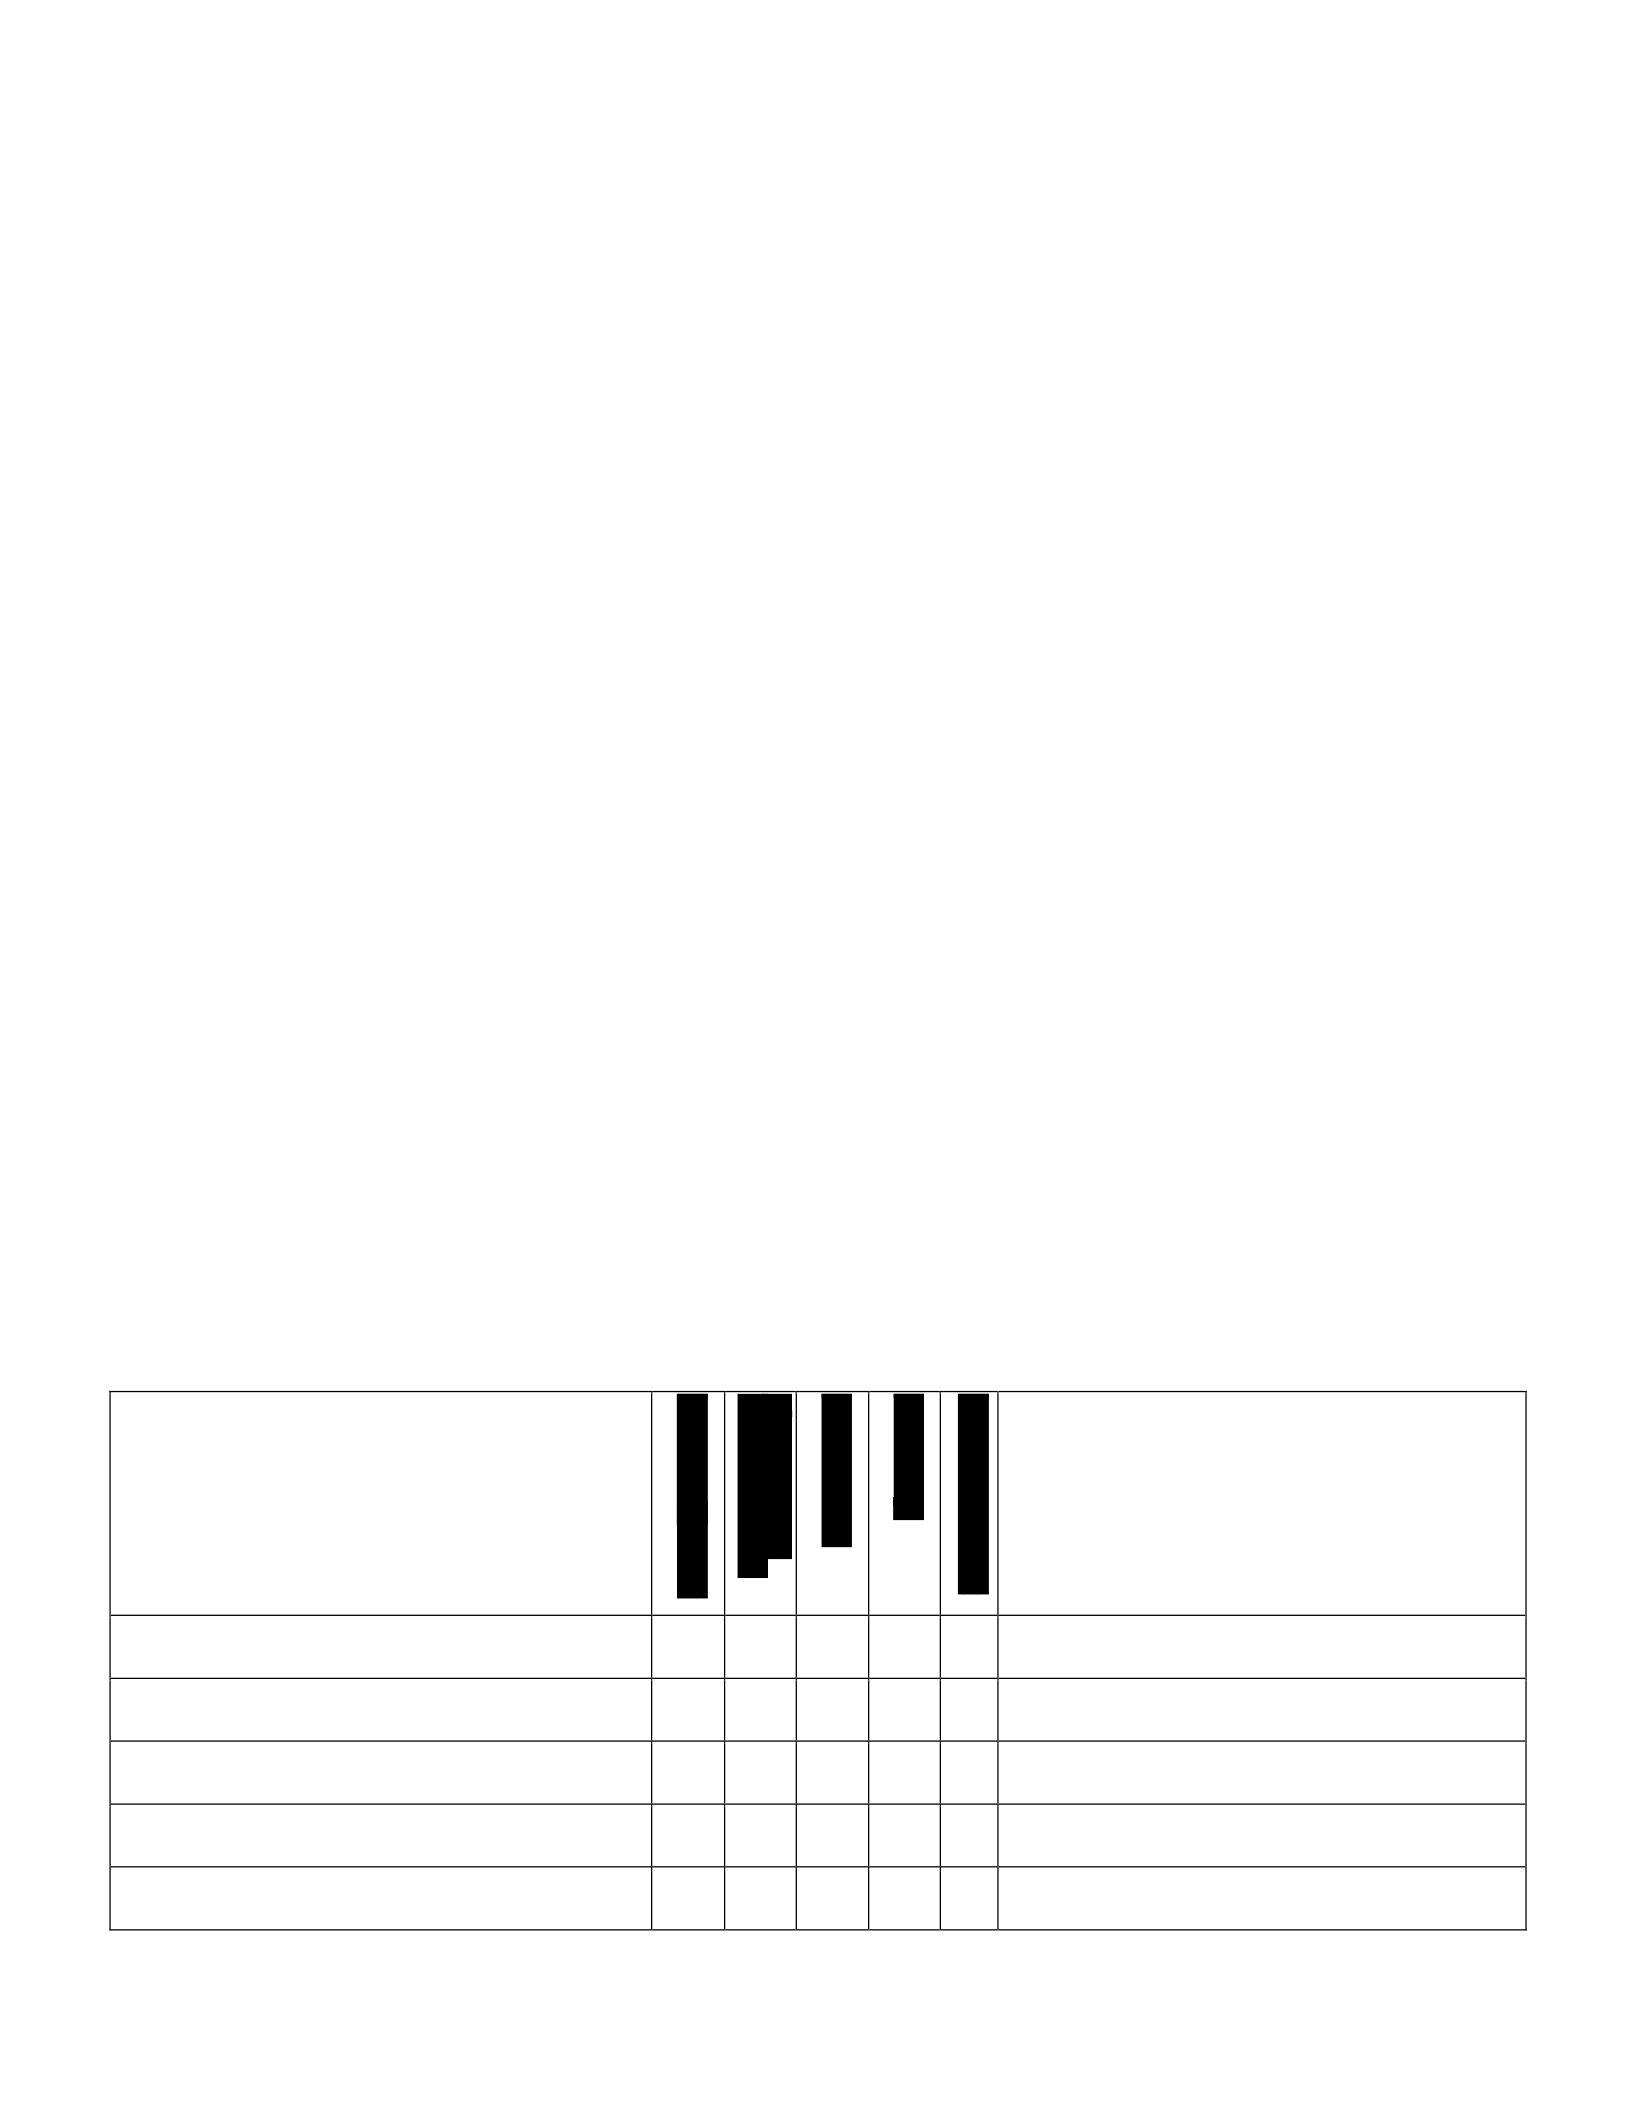
the opposite. The researcher gave the participant some time to think before getting her or his
response. The researcher repeated this process for many triads. This process continued until
saturation point was reached. After some “trial and error,” the researcher was able to get some
“good” constructs. Jankowicz (2004) explains a good construct as “one which expresses your
interviewee’s meaningfully and precisely, and this is matter of three things: (a) a clear contrast (b)
appropriate detail, and (c) a clear relationship to the topic in question” (Jankowicz, 2004; p.33).
Each interview was transcribed and reviewed by the corresponding participant to check and change
if needed. Four of the participants verified the elicited bipolar constructs. One of the participants
requested some minor changes. The interviews were recorded in case the researcher needs
clarification for some information in the interviews. After the refinement and validation, a set of
26 bipolar constructs was elicited. A RepGrid interview sheet was used to record the bipolar
constructs elicited from the interviews such that the left-hand column represents the construct, and
the right-hand column represent the opposite. Figure 4.1 shows a sample of a RepGrid interview
sheet with the 26 bipolar constructs plus the supplied overall construct.
5
1
This policy is customized / reflects the organization's
culture
This policy is standard / similar to other organizations
This policy is at an advanced level / provide high level of
security / strong
This policy is at a basic level / does not provide high level
of security / weak
This policy follows the latest standard for creating policies
This policy does not follow the latest standard for creating
policies
This policy shows who is responsible for what
This policy does not show who is responsible for what
This policy is prescriptive / shows how to do it
This policy is descriptive / shows only what to do

This policy is very detailed / explain all the rules in details
This policy is brief and general
Employees can have the same understanding to this policy
This policy is open to different interpretations
Removing this policy will affect the level of security in the
organization
Removing this policy will not affect the level of security
in the organization
This policy tells what to do in case of breach
This policy does not tell what to do in case of
breachpreventative
This policy is simple, clear, and straightforward
This policy is complicated, ambiguous and not
understandable
The link between this policy and other policies is available
and clear
The link between this policy and other policies is not
available/ not clear
The purpose of this policy is clear and understandable
The purpose of this policy is not clear
This policy is easy to remember
This policy is hard to remember
The consequences of non-compliance to this policy is clear
The consequences of non-compliance are not available /
not clear
The consequences of non- compliance to this policy is
enough
The consequences of non- compliance are not enough
This policy is complete / includes all the needed rules
This policy is incomplete / missing some rules
Easy to comply with this policy
Hard to comply with this policy
The boundary of the policy is clear / it is clear what it
covers and what not
The boundary of the policy is not clear / it is not clear
what it covers and what not
The cost of following this policy is less than the benefit of
following it
The cost of following this policy exceeds the benefit of
following it
This policy serves the business objectives / goals
This policy does not serve the business objectives / goals
This policy reflects its importance to me (as an employee) /
it is important for the security of the organization
This policy does not reflect its importance to me (as an
employee) / it is not important for the security of the
organization
This policy is flexible / less strict
This policy is stricter
This policy is reasonable and appropriate
This policy is not reasonable
This policy is written in simple, plain language
This policy includes some technical terminologies that are
not understandable by all employees
The technical part of this policy is available
The technical part is missing
This policy is well-documented / well-structured / precise /
organized
This policy is not well-documented / not well-structured
Overall, this policy is comprehensive and robust
Overall, this policy is neither comprehensive nor robust
Figure 4.1: a sample of a RepGrid interview sheet with the 26 bipolar constructs plus the supplied overall construct.
4.2.2 Rating the Elements
The elicited bipolar constructs needed to be rated against each of the five elements. The participants
rated the constructs using the five-Likert scale, such that five represents the construct and one
represents the opposite. The participants rated the elements based on how they perceive these
elements.

i. The Participants
A group of 57 participants (different from the “expert” group) was grouped into five sub-groups in
accordance with the SSE-CMM five levels. That is, the first group consists of 11 participants and
represents an organization with the first level of the SSE-CMM (i.e. performed informally). The
second group consists of 8 participants and represents an organization with the second level of the
SSE-CMM (i.e. planned and tracked). The third group consists of 12 participants and represents
an organization with the third level of the SSE-CMM (i.e. well defined). The fourth group consists
of 9 participants and represents an organization with the fourth level of the SSECMM (i.e.
qualitatively controlled). The fifth group consists of 17 participants and represents an organization
with the fifth level of the SSE-CMM (i.e. continuously improving). Each group was given one
version of the five security policy versions that were developed in accordance with the
SSE-CMM levels. The five versions of the security policy were created based on the SANS
Institute Information Security Policy Templates (SANS, 2015). Also, some demographic
information was collected for each participant, including age and experience.
ii. The Rating Process
The participants rated the bipolar constructs using a five-points Likert scale. A five-points Likert
scale was chosen for this study because Jankowicz (2004) considered it as “current practice” (p.
37). Also, a five-points Likert scale is easier to analyze than higher scales (Stewart et al., 1981).
Before starting the process of rating the constructs, the overall bipolar construct was supplied. The
overall construct should be broad so that it can be applied to all elements. Each participant should
rate the overall bipolar construct against each element using the five-point Likert scale.
The overall bipolar constructs were:

Overall, this policy is comprehensive and robust -- Overall, this policy is neither comprehensive nor robust The
resulted data from rating the overall construct is useful in comparing different grids using Honey’s
(1979) content analysis (as shown in the next section).
For each group of the participants, the researcher introduced the virtual company (Crown
Confections) and provided the corresponding security policy version to the participants. The first
group was given a security policy with the level 1 SSE-CMM (i.e. performed informally), the
second group was given a security policy that is at the second level of the SSE-CMM (i.e. planned
and tracked) and so on. Then, the researcher asked the participants to rate the constructs using a
five-point Likert scale. All participants rated the same constructs that were elicited from the
“expert” group in addition to the supplied overall construct. A total of 57 grids resulted from the
first round of the rating process.
After the first rating, the researcher “conceptually” introduced a security breach. The participants
were given time to think about that security breach and the security policy after the occurrence of
the breach. Five security breaches were used in this study such that each group had a different
breach. Table 4.1 shows the scenarios for the five security breaches introduced for the five groups.
Table 4.1: the scenarios for the five security breaches that were introduced for the five groups.
The Scenario
The group
Last week Crown Confections suffered a security breach. An insider logged into Crown Confections
server using SFTP and downloaded the database file. What is your first reaction to the breach and
how would you deal with this kind of a breach?
Level 1 group
Last week Crown Confections suffered a security breach. There was a “Phishing” E-mail that was
sent to System Administrator, requesting a username/password for access to the database. Then,
someone logged into Crown Confections server using SFTP and downloaded the database file.
What is your first reaction to the breach and how would you deal with this kind of a breach?
Level 2 group

Last week Crown Confections suffered a security breach. An insider obtained Physical access to
System Administrator’s computer to install Keylogger hardware and/or install malware
keylogger/spyware. Once Administrator logged into the system, credentials were stolen, and a login
to the system occurred with username/password to steal the database. What is your first reaction to
the breach and how would you deal with this kind of a breach?
Level 3 group
Last week Crown Confections suffered a security breach. An employee copied data on sticky notes
while taking Telephone orders. The customers’ information on those sticky notes was stolen. What is
your first reaction to the breach and how would you deal with this kind of a breach?
Level 4 group
Last week Crown Confections suffered a security breach. An employee did a DDoS attack, which is
shutting down the system during unmonitored periods. What is your first reaction to the breach and
how would you deal with this kind of a breach?
Level 5 group
After introducing the security breach, the participants were asked to re-rate the same bipolar
constructs. In total, 114 grids resulted; 57 grids before the breach and 57 after the breach.
4.3 Data Analysis and Results
In this study, the data was analyzed both qualitatively and quantitatively. That is, data was analyzed
using qualitative data coding and categorization and quantitative content analysis, in addition to
the statistical analysis (Jankowicz, 2004).
Indeed, the quantitative data analysis method should be selected based on the type of data generated
from the RepGrid rating (Bell, 1988). The type of data at hand should be defined before deciding
on techniques for the quantitative data analysis. As mentioned in the previous chapter, the
RepGrids can generate different types of data. The RepGrid data can be rankings, ratings or
different kinds of scores. The data in this study was generated through rating the grids to examine
the relationship between the elements and constructs. The ratings that were created from the grids
are integers ranging from one to five. Thus, this study uses an interval scale as measurement scale

to generate interval data. An interval scale was adopted because the distance between two
consecutive points is equal.
The data of the grids are close to being normally distributed and satisfy homoscedasticity. Also,
the relationship between elements and constructs is linear. These aspects represent the assumption
of principal components analysis. On the other hand, this study adopts Honey’s (1979) content
analysis to analyze the bipolar constructs. For this kind of analysis, type of data is not an issue.
Many available software packages can be used to analyze RepGrids. Some of these packages such
as SPSS statistics, SAS and MATLAB are reliable in performing principal components analysis,
cluster analysis, and other kinds of statistical analysis. On the other hand, some of the software
packages are dedicated to elicit and/or analyze Repertory Grids such as Rep V, WEBGRID,
IDIOGRID and GRIDSTAT. For this study, Excel 2011 and SPSS 23 were used to
analyze the generated grids.
4.3.1 Core Categorization
Before performing content analysis, we need to categorize the bipolar constructs (i.e. the
perceptions of security policy). Eliciting perceptions regarding security policy from the “expert”
group previously resulted in 26 bipolar constructs. These constructs need to be categorized using
the core categorization process to be more manageable (Jankowicz, 2004).
The core categorization process is important before content analysis so the results can have more
meaning (Jankowicz, 2004). First, a set of themes or categories needs to be developed. There are
various techniques that can be used to develop the categories or themes. The researcher can use
pre-existing categories that are available in the literature or from the international standards.
However, most of the literature and standards do not provide categories for perceptions regarding
the security policy. In such cases, Jankowicz (2004) suggests using the “bootstrapping” technique
to generate categories in accordance to the bipolar constructs. The “bootstrapping” technique has
been adopted in this study to categorize the perceptions regarding the security policy.

The “bootstrapping” process started with examining each elicited construct. Each construct is
compared with the other constructs. If a construct is in some way similar to the first construct, the
two constructs are placed under the same category. On the other hand, if a construct is different
from the first one, the construct should be placed in a separate category. The rest of the constructs
are compared with each category and placed under the appropriate category. If the construct does
not fit under any category, a new category should be created. This process is continued until all
constructs are classified. The unclassified constructs are placed under one category called
“miscellaneous,” which should not include more that 5% of the constructs (Jankowicz, 2004).
After generating the first version of the categories, a reliability check was performed with an
information security expert. The expert performed a crosschecking to verify the constructs
categorization. The information security expert has high-level knowledge and experience with
information security. The expert was given the categories and the constructs, then asked to approve
or change the category for each construct. The expert was able to create a new category if needed.
Few changes were made to the first version of the categorization. The changes were discussed with
the expert, and the final categorization was generated. Three main categories or themes were
generated from the core categorization process: policy form, policy content, and policy process.
The constructs that fall under policy form category represent 30.8% of the constructs. The policy
content category comprises 46.2% of the constructs. The policy process category contains 23.1%
of the constructs. These categories will be used in the content analysis discussed below.
4.3.2 Content Analysis
This section discusses the process of content analysis that was performed for the 57 grids. The 57
grids were sub-grouped into five groups (as previously mentioned) in accordance with the
SSECMM five levels. Each of these groups was subject to the content analysis as one group in
addition to different subgroups of the participants to compare perceptions of different groups of
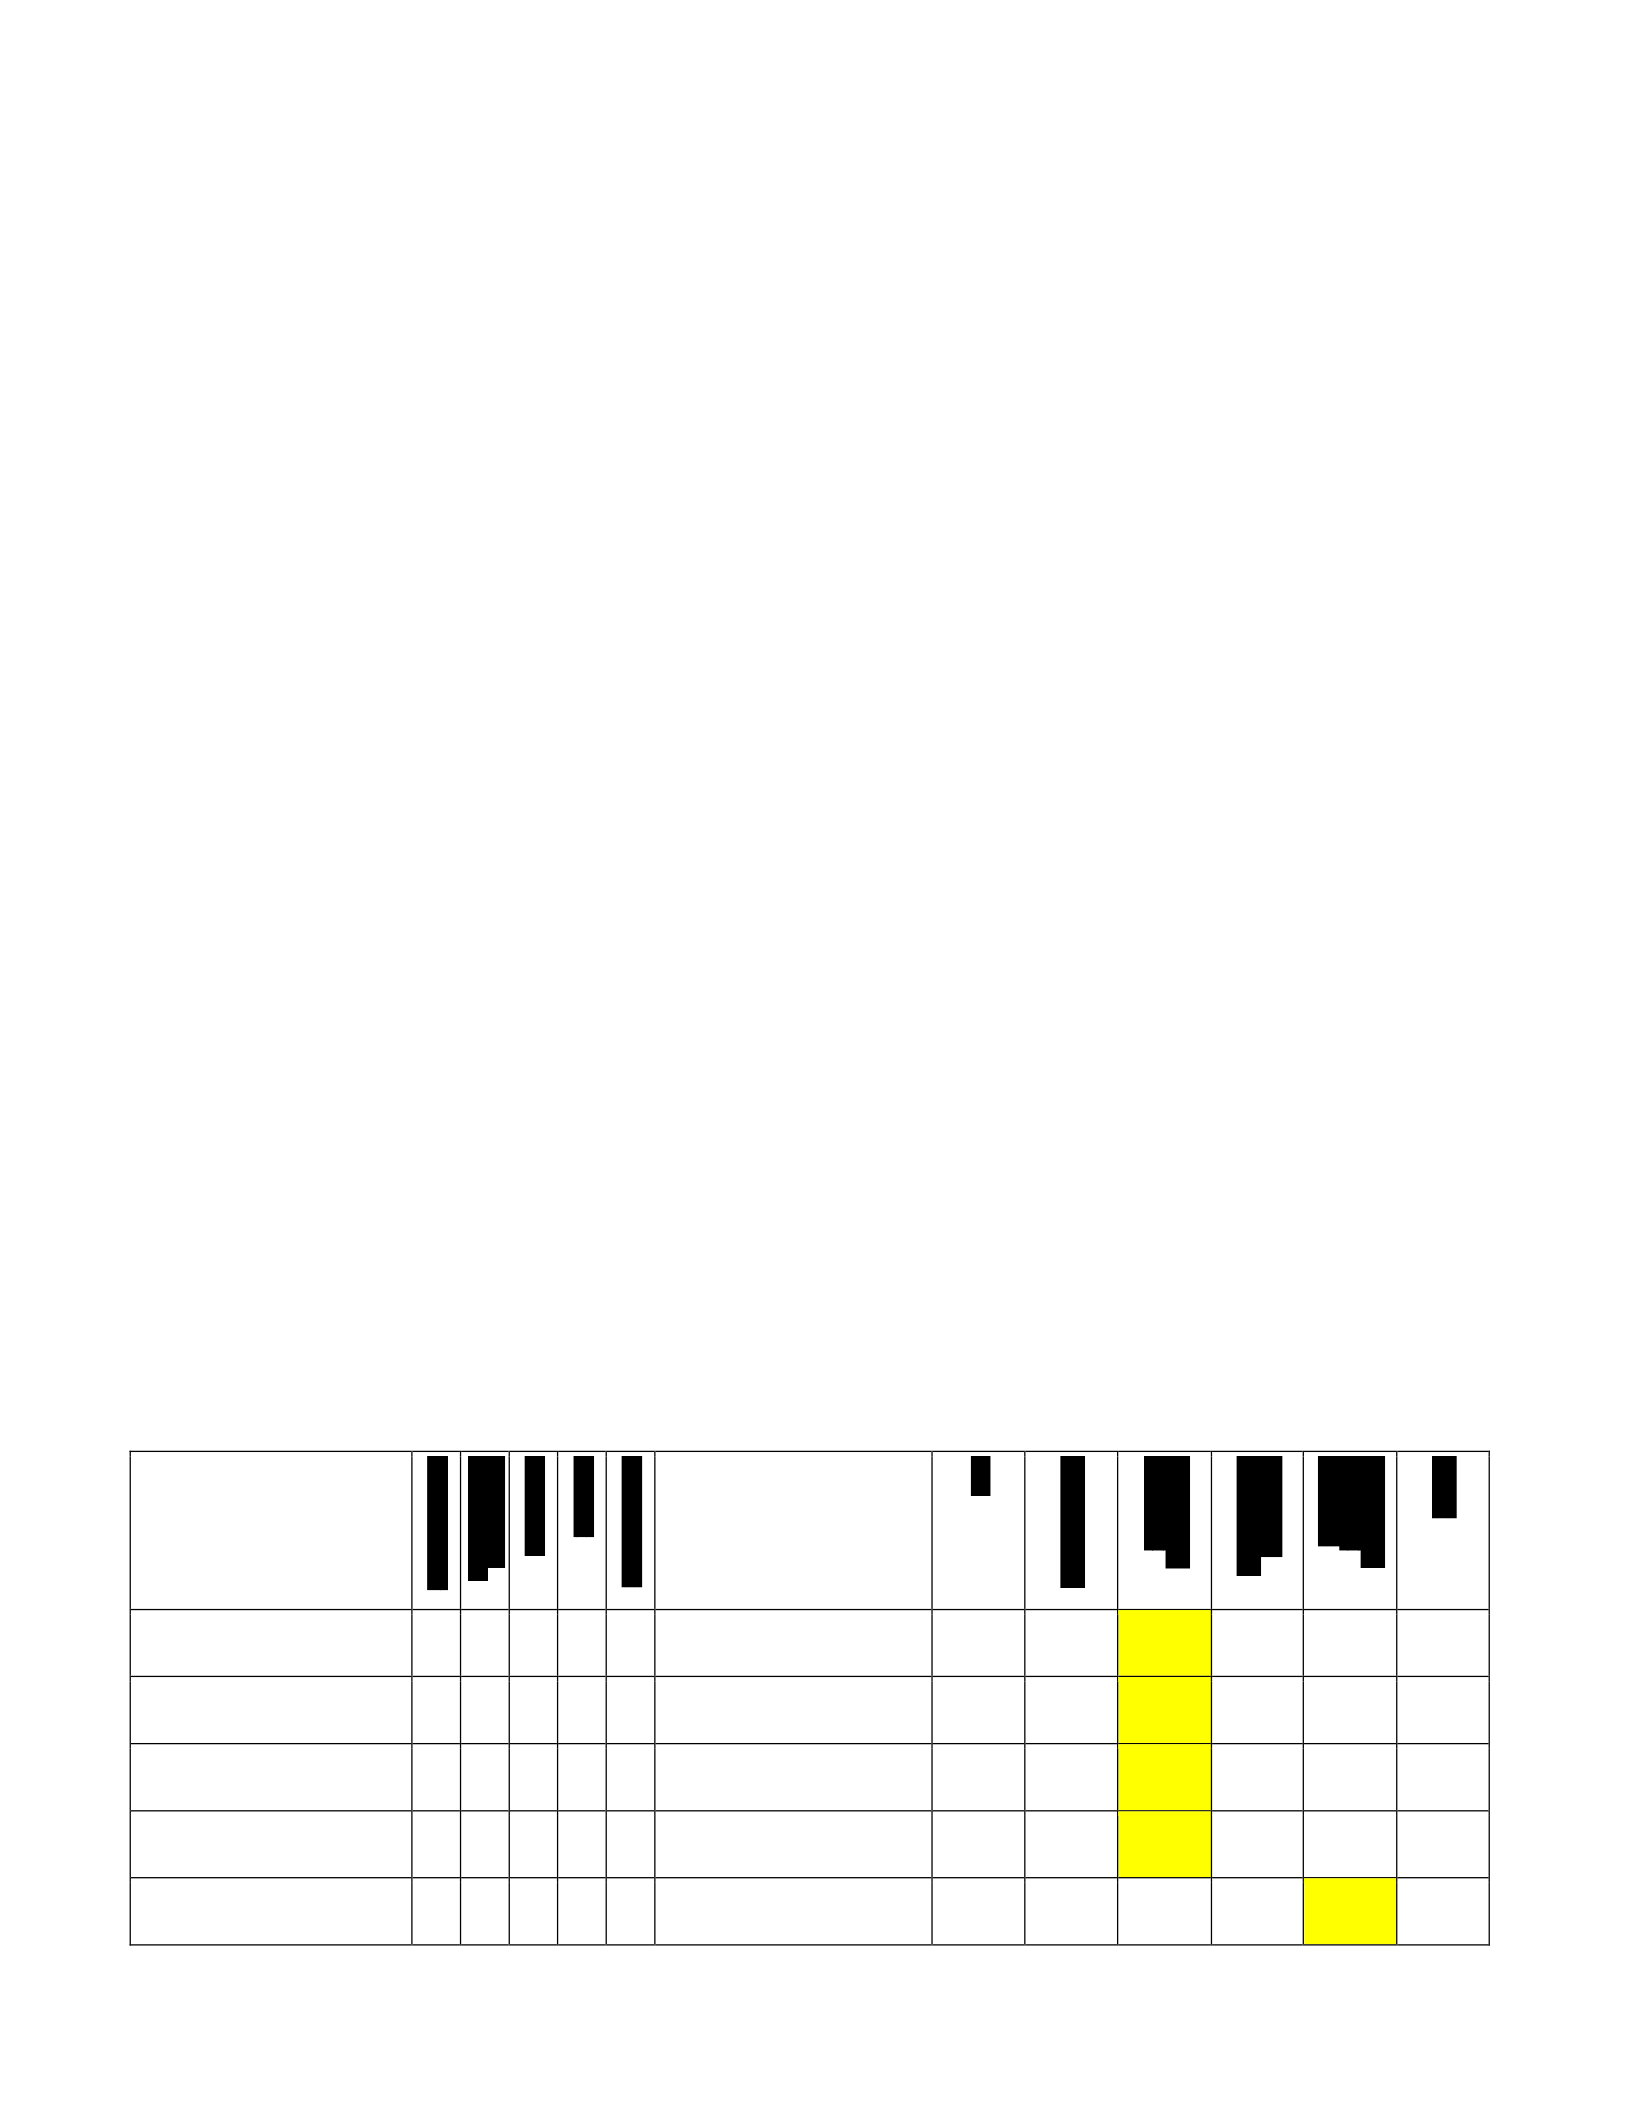
participants. Each group of the five groups was sub-grouped once based on the age range, and once
based on experience.
The content analysis method adopted in this study was Honey’s (1979) content analysis, which is
described in Jankowicz (2004) book. One advantage of this method over the other methods is that
it does not lose any construct rating through performing averaging of the ratings.
Content analysis process was performed as follows:
Step 1: identify ratings for the overall construct regarding each element. The ratings of overall
construct reflect the overall perception of each participant. Figure 4.2 shows a sample grid with
the overall construct rating rated as 5, 4, 4, 5, and 2.
Step 2: Calculate the sum of differences for each bipolar construct against the overall construct.
For example, the first construct (in the first row) has ratings as 3, 4, 3, 4, 2, whereas the overall
construct has ratings as 5, 4, 4, 5, and 2. Then, the difference between each two corresponding
ratings was identified. That is, we identified the difference between the rating of the first construct
against the first element and the overall construct against the first element and so on. After that,
the differences were added to get the sum of differences, which was equal to 4 for the first row.
This number is then written under the column “sum of differences” in the first row (refer to figure
4.2).
5
1
This policy is customized / reflect the
organization's culture
3
4
3
4
2
This policy is standard / similar to other
organizations
G2
4
88.89
10
72.22
H
This policy is at an advanced level / provide
high level of security / strong
4
5
3
4
3
This policy is at a basic level / does not
provide high level of security / weak
G2
5
86.11
11
69.44
M
This policy follows the latest standard for
creating policies
3
4
4
3
2
This policy does not follow the latest standard
for creating policies
G1
4
88.89
10
72.22
H
This policy shows who is responsible for what
4
5
3
3
3
This policy does not shows who is responsible
for what
G2
6
83.33
10
72.22
L
This policy is prescriptive / shows how to do it
3
2
2
3
2
This policy is descriptive / shows only what to
do
G2
8
77.78
6
83.33
L

This policy is very detailed / explain all the
rules in details
3
4
3
2
2
This policy is brief and general
G1
6
83.33
8
77.78
L
Employees can have the same understanding to
this policy
3
4
3
4
4
This policy is open to different interpretations
G2
6
83.33
8
77.78
L
Removing this policy will affect the level of
security in the organization
3
3
4
4
4
Removing this policy will not affect the level
of security in the organization
G2
6
83.33
8
77.78
L
This policy tells what to do in case of breach
3
3
1
1
1
This policy does not tell what to do in case of
breach-preventative
G3
11
69.44
7
80.56
L
This policy is simple, clear and straightforward
4
3
1
3
4
This policy is complicated, ambiguous and
not understandable
G1
9
75.00
7
80.56
L
The link between this policy and other policies
is available and clear
1
1
1
2
1
The link between this policy and other
policies is not available/ not clear
G3
14
61.11
6
83.33
L
The purpose of this policy is clear and
understandable
4
4
2
4
4
The purpose of this policy is not clear
G1
6
83.33
8
77.78
L
This policy is easy to remember
3
1
1
3
4
This policy is hard to remember
G2
12
66.67
6
83.33
L
The consequences of non-compliance to this
policy is clear
3
3
3
3
5
The consequences of non-compliance is not
available / not clear
G3
9
75.00
7
80.56
L
The consequences of non- compliance to this
policy is enough
2
2
1
1
4
The consequences of non- compliance is not
enough
G3
14
61.11
2
94.44
H
This policy is complete / includes all the
needed rules
2
2
1
1
1
This policy is incomplete / missing some rules
G3
13
63.89
5
86.11
M
Easy to comply with this policy
2
2
3
2
2
Hard to comply with this policy
G2
9
75.00
5
86.11
M
The boundary of the policy is clear / it is clear
what it cover and what not
3
2
3
3
4
The boundary of the policy is not clear / it is
not clear what it cover and what not
G1
9
75.00
5
86.11
M
The cost of following this policy is less than
the benefit of following it
2
2
5
2
2
The cost of following this policy exceeds the
benefit of following it
G2
9
75.00
7
80.56
L
This policy serves the business objectives /
goals
5
4
2
5
5
This policy does not serve the business
objectives / goals
G2
5
86.11
11
69.44
M
This policy reflects its importance to me (as an
employee) / it is important for the security of
the organization
5
2
2
4
4
This policy does not reflect its importance to
me (as an employee) / it is not important for
the security of the organization
G2
7
80.56
7
80.56
L
This policy is flexible / less strict
4
1
1
4
3
This policy is more strict
G2
9
75.00
9
75.00
L
This policy is reasonable and appropriate
4
3
1
4
5
This policy is not reasonable
G3
9
75.00
9
75.00
L
This policy is written in simple, plain language
5
1
1
5
5
This policy includes some technical
terminologies that are not understandable by
all employees
G1
9
75.00
11
69.44
L
The technical part of this policy is available
4
5
5
2
2
The technical part is missing
G3
6
83.33
12
66.67
L
This policy is well-documented /
wellstructured / precise / organized
5
3
3
3
3
This policy is not well-documented / not
wellstructured
G3
5
86.11
9
75.00
M
Overall, this policy is comprehensive and
robust
5
4
4
5
2
Overall, this policy is neither comprehensive
nor robust
Overall reverse
1
2
2
1
4
Figure 4.2: sample grid with the overall construct rating.
Step 3: Convert the sum of differences for each construct into “percentage similarity score.” Thus,
the researcher can compare grids that have a different number of constructs. A “look-up table” can
be used to extract “percentage similarity score” rather than calculate it manually. Jankowics (2004)
provided a method for calculating “percentage similarity look-up” that can be used here. In this

study, the “percentage similarity score” was calculated using the following formula (extracted from
Jankowics (2004)):
100-{[SD/((LR-1) *C)] *100}.
where SD is the sum of difference, LR is the largest rating possible (i.e. 5 in this study), and C is
the number of constructs (i.e. 26 in this study).
The “percentage similarity score” was calculated for each row (i.e. bipolar construct). The result
from this calculation was written under “% of similarity” column (refer to figure 4.2). For example,
“percentage similarity score” for the first row is 88.89% (refer to figure 4.2).
Step 4: “Reversed” scores should be calculated for the “overall” construct. For example, in
fivepoints scale 1 should be converted into 5, 2 into 4, 3 stays the same. The rule of thumb for
reversing score is that if the researcher uses an n-points scale, then each score should be subtracted
from n+1 to reverse it (Jankowics, 2004). After reversing the overall construct scores, the sum of
the differences should be calculated against the “reversed” scores. For example, the “reverse” score
for the grid in figure 4.2 was 1, 2, 2, 1, and 4. The “reversed” scores were recorded directly under
overall construct row, and the sum of differences for the “reversed” score was written under
“reverse sum of differences” column (refer to figure 4.2). In our example, the
“reverse sum of differences” for the first row was 10 (refer to figure 4.2).
Step 5: Convert the reverse sum of differences for each construct (from step 4) into percentage
similarity scores following the same way in step 3. The result from this calculation was written
under “reverse % of similarity” column (refer to figure 4.2). For example, the reverse percentage
similarity score for the first row was 72.22% (refer to figure 4.2).
Step 6: The highest percentage of similarity should be identified. That is, the highest percentage
between the two “percentage similarity scores” (from step 3 and step 5) should be identified. The
number highlighted in yellow represented the highest percentage of similarity (refer to figure 4.2).
Step 7: Record the ranking for each “highest” percentage similarity score in term of high (H),
medium (M) or low (L). These rankings reflect the correlation between each bipolar construct and

the “overall” construct. These similarity scores were looked at as a group such that third of them
are ranked as H, the next third as M, and the last third as L, per figure 4.
By completing step seven, individual grids were ready for group analysis. The following section
focuses on multiple grids analysis that involves comparing different grids together.
Step 8: Each construct should be assigned to one of the categories that were generated in the
previous section before beginning the quantitative analysis. All the information from the previous
steps was recorded in spreadsheet tables. The category was recorded under “group” column (refer
to figure 4.2). G1 refers to the constructs related to the form of the policy; G2 refers to the
constructs related to the process of the policy and G3 refers to the constructs related to the content
of the policy.
Step 9: Each of the tables should be converted into a bar chart to show the most important
constructs categories, which is the most significant security policy aspect that should be considered
when creating or changing security policy. Each chart was related to a subgroup of participants.
Participants can be categorized into subgroups based on specific criteria. In this study, the
participants were categorized in accordance with the SSE-CMM levels. Then each group was sub-
grouped twice based on gender and experience.
The researcher needs to create a table for each subgroup of participants. One chart can be created
for all participants. This chart shows the percentage of constructs in each subgroup or category.
Each bar represents a construct category and shows high, medium, and low correlations between
constructs within that category and the overall construct. The most important category is the one
that with the highest bar. Another way of interpreting the charts is by considering the categories
that have the highest part of the bar that shows high correlation. That is, the researcher should
focus only on constructs that have high correlations and consider the ones with the highest
“high” part of the bar as the most important construct categories.
• SSE-CMM Level Five
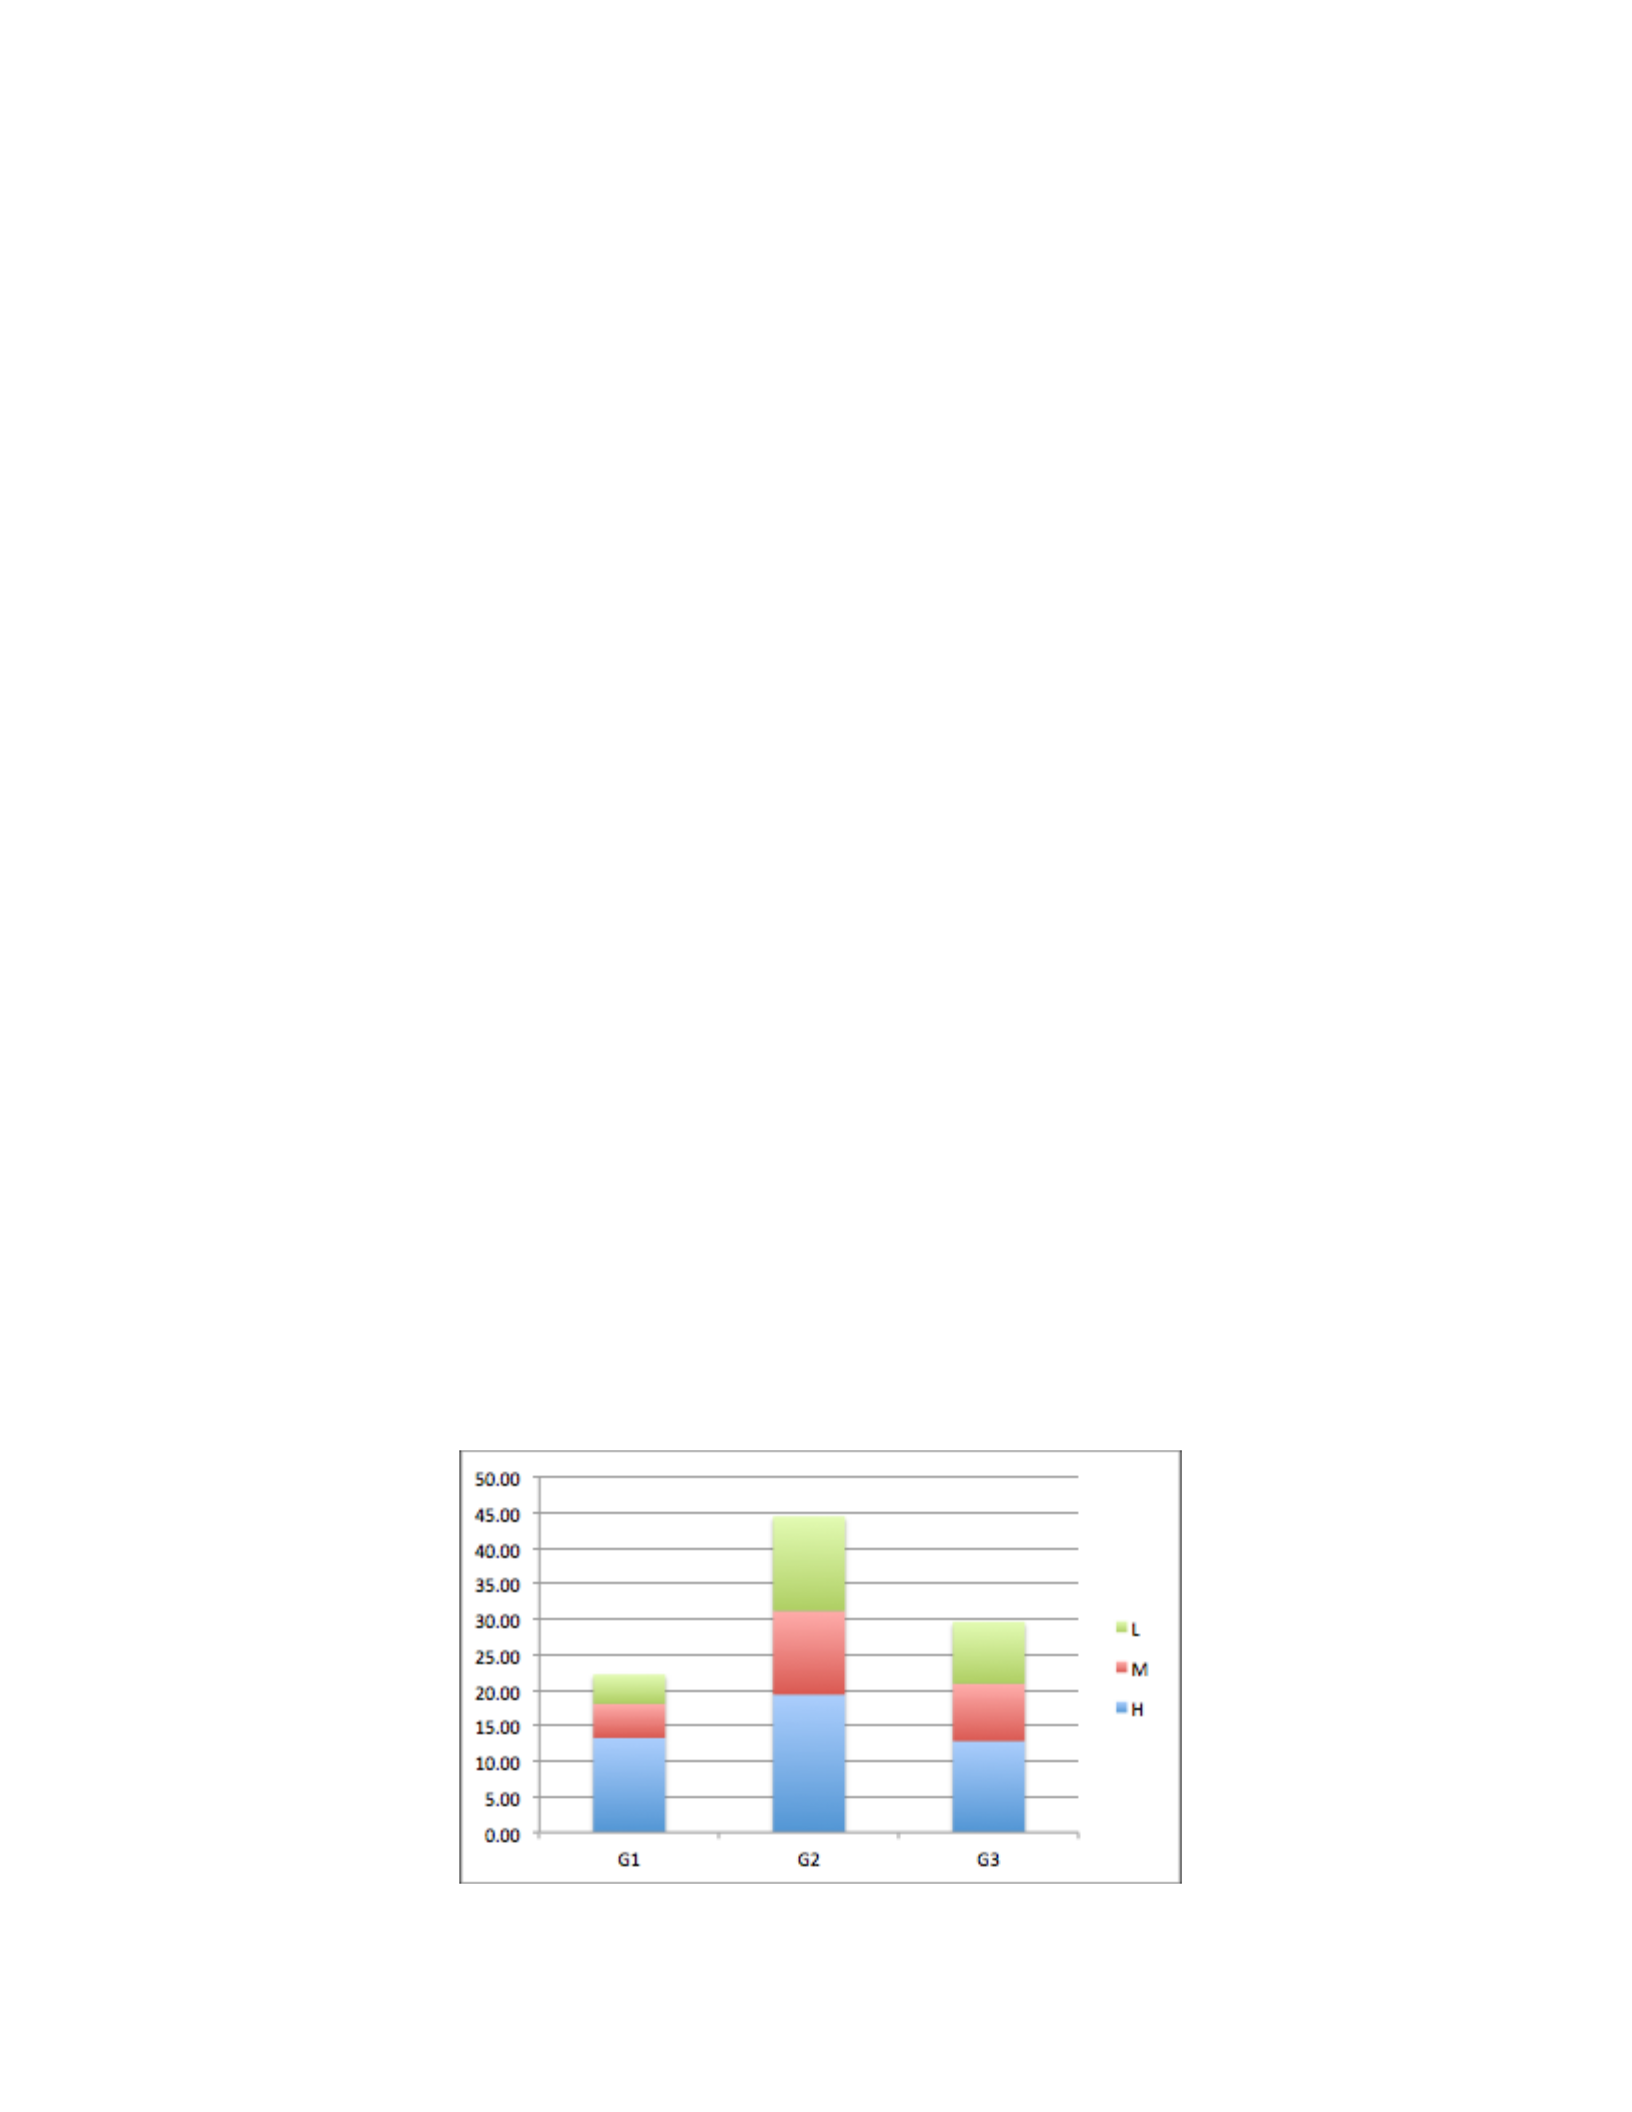
Figure 4.3 shows the bar chart for the total group of level 5 participants. The chart shows the
assignment of the constructs’ categories in a form of a percentage of the total number of constructs
in each group rated as high, medium, or low.
Each bar shows the high, medium, and low correlations between the constructs in each group and
the overall comprehension and robustness of the policy. As seen in the chart, the most significant
security policy perceptions were those related to security policy process since it has the tallest bar
among the groups. That is, the participants considered the constructs related to the security policy
process and how they should be as the most significant aspects of the security policy. The next
most significant constructs are those fall under the policy form, which focuses on the
documentation and the core components of the policy. Another way to interpret the result is to
focus on only the height of the highly correlated constructs rather than focusing on the accumulated
height of high, medium, and low correlated constructs. Here, both ways give the same result about
which category considered the most significant construct group. However, it gives a different result
regarding the next significant group. Considering the later method, the second most significant
group is the policy content. However, the percentage of the highly correlated constructs for policy
form and policy content are almost the same at 13.2% and 12.9% respectively. In this study, we
adopted the second method for interpreting the chart, which focuses on the height of the highly
correlated constructs with the overall construct.
Figure 4.3: Content analysis of the total group of level 5 participants before the breach.
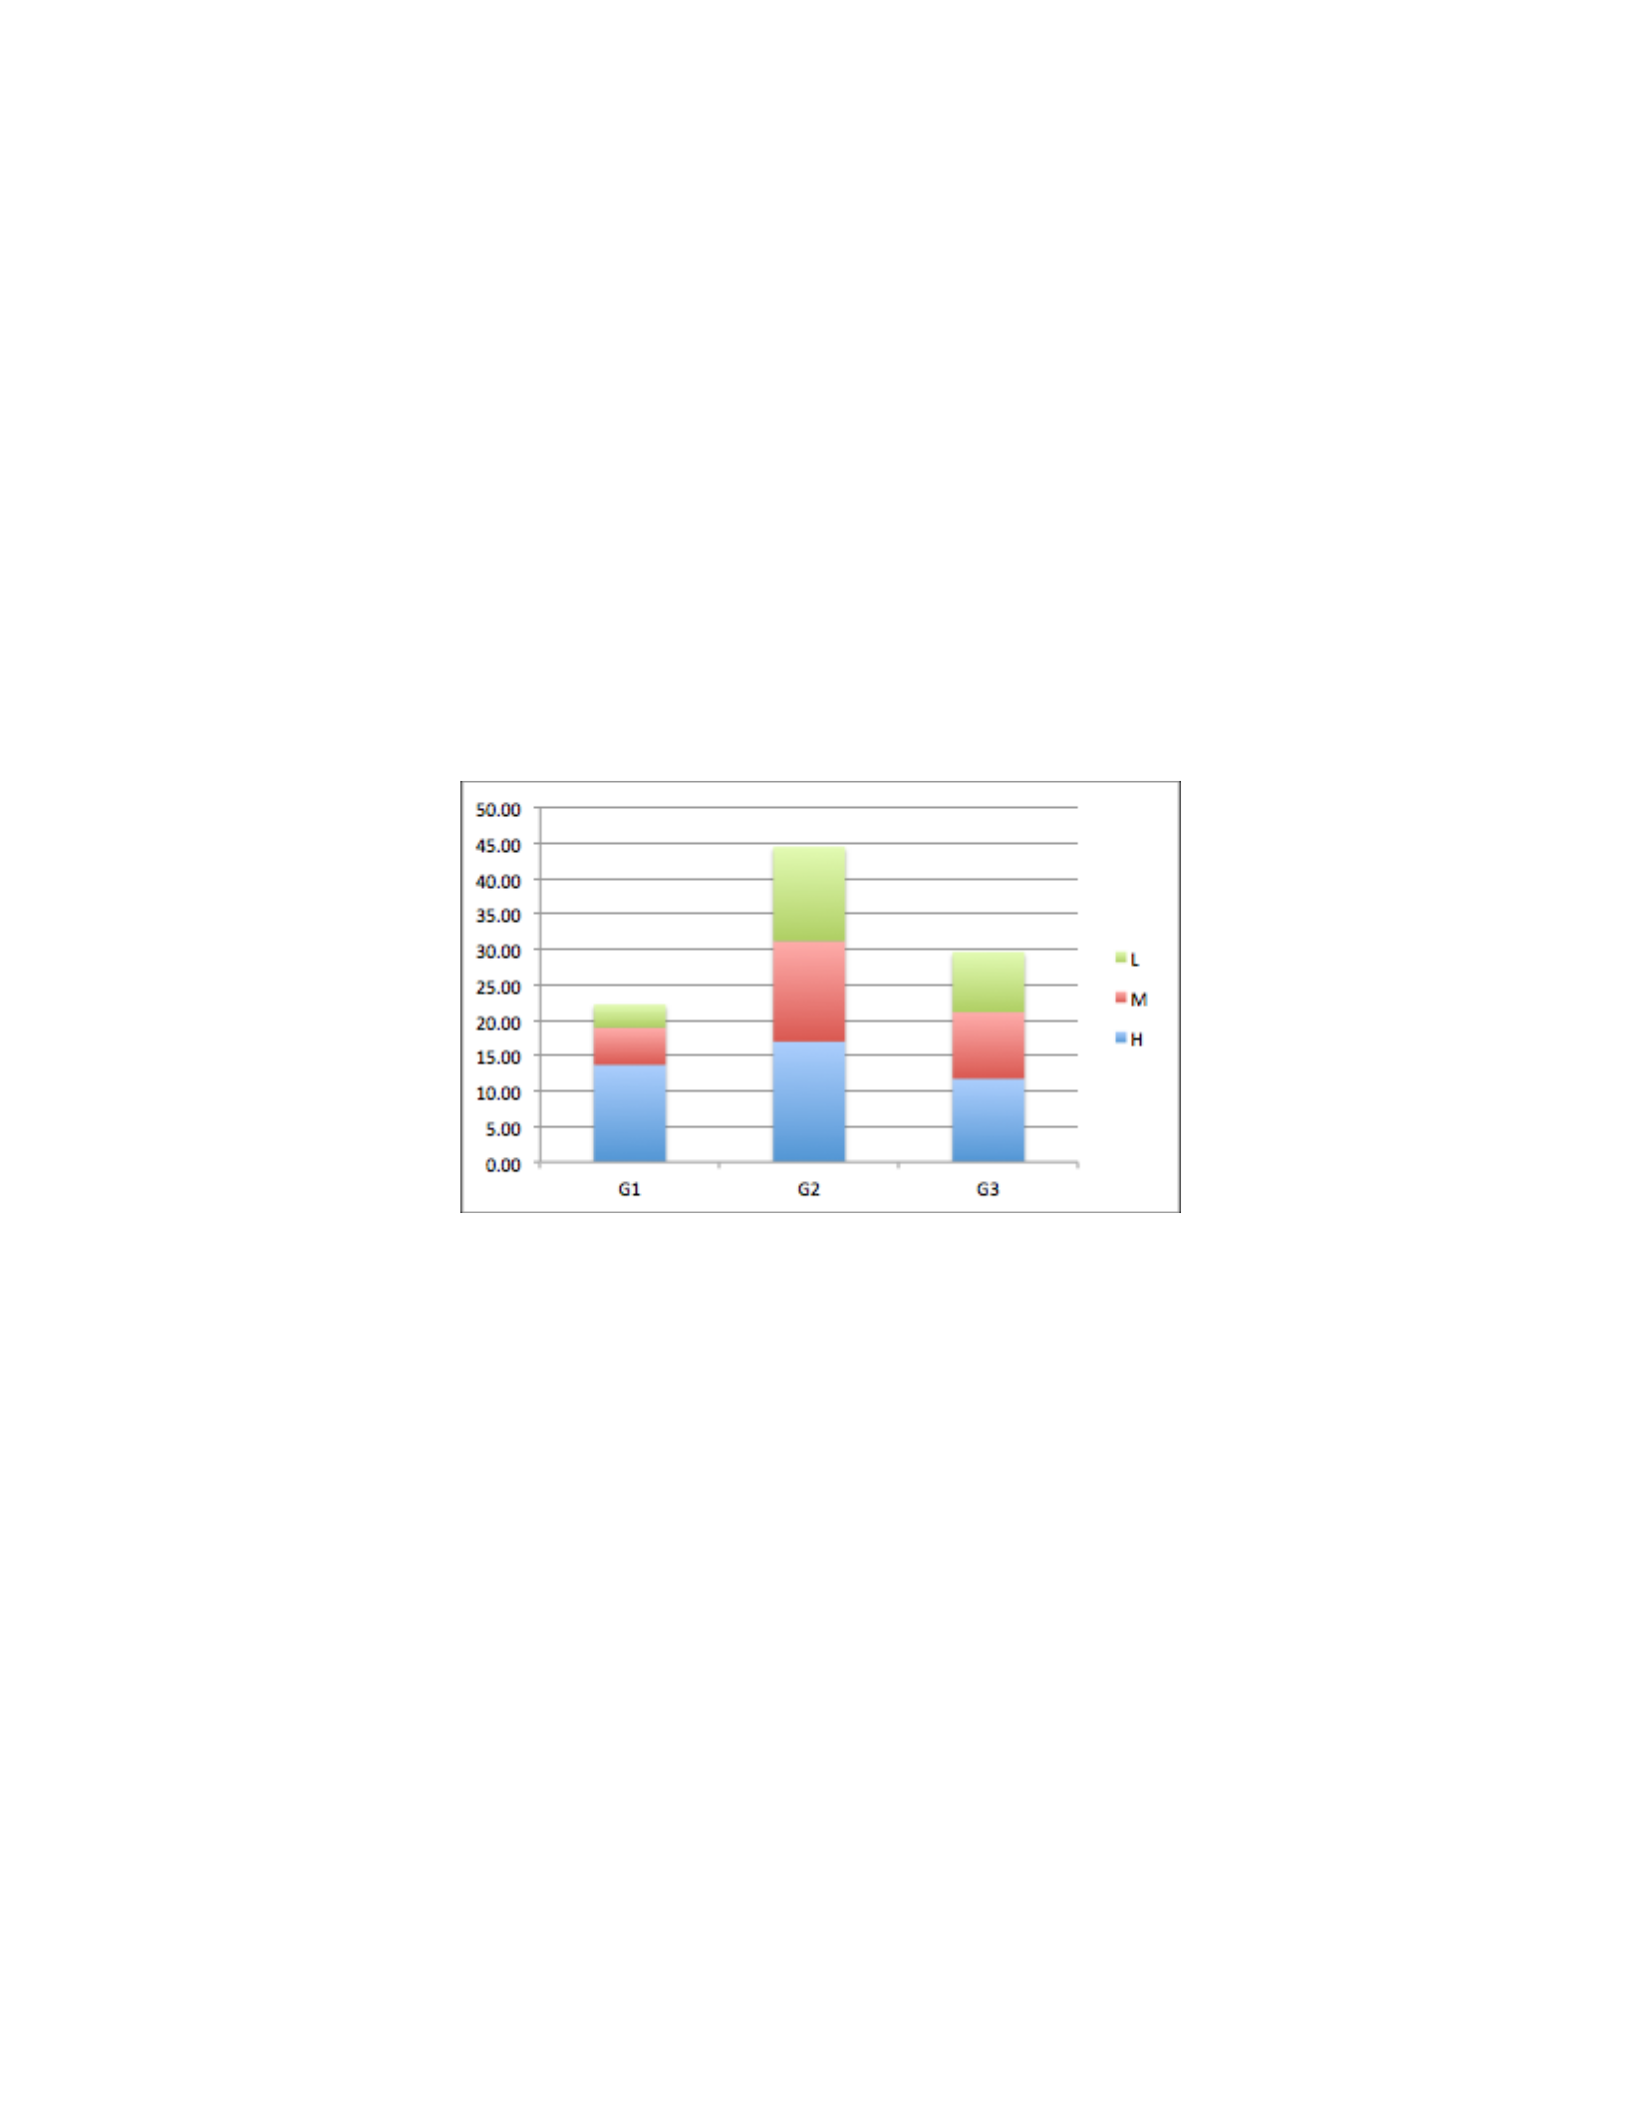
The previous results show the perception of level five participants regarding the security policy
that was created for our case study before introducing the security breach. The same analysis was
conducted for the data that was collected from the same participants after introducing the security
breach. Figure 4.4 depicts a bar chart for the total group of level 5 participants after introducing
the breach. This chart shows that the most significant security policy perceptions are those related
to security policy process. That is, the participants considered the constructs related to the security
policy process and how it should be as the most significant aspects of the security policy. The next
most significant constructs were those fall under the policy content.
Figure 4.4: Content analysis of the total group of level 5 participants after the breach.
Here, the perception of the participants regarding the security policy before and after the
occurrence of the breach was very close. The small variance between the two results could be due
to the maturity level of the policy that was introduced to the group. This group had a security policy
version with the highest maturity level among the other versions of the policy.
• SSE-CMM Level Four
Figure 4.5 shows the bar chart for the total group of level 4 participants. This chart shows that the
most significant security policy perceptions were those related to security policy process. That is,
the participants considered the constructs related to the security policy process and how it should
be as the most significant aspects of the security policy. The next most significant constructs were
those fall under the policy form.
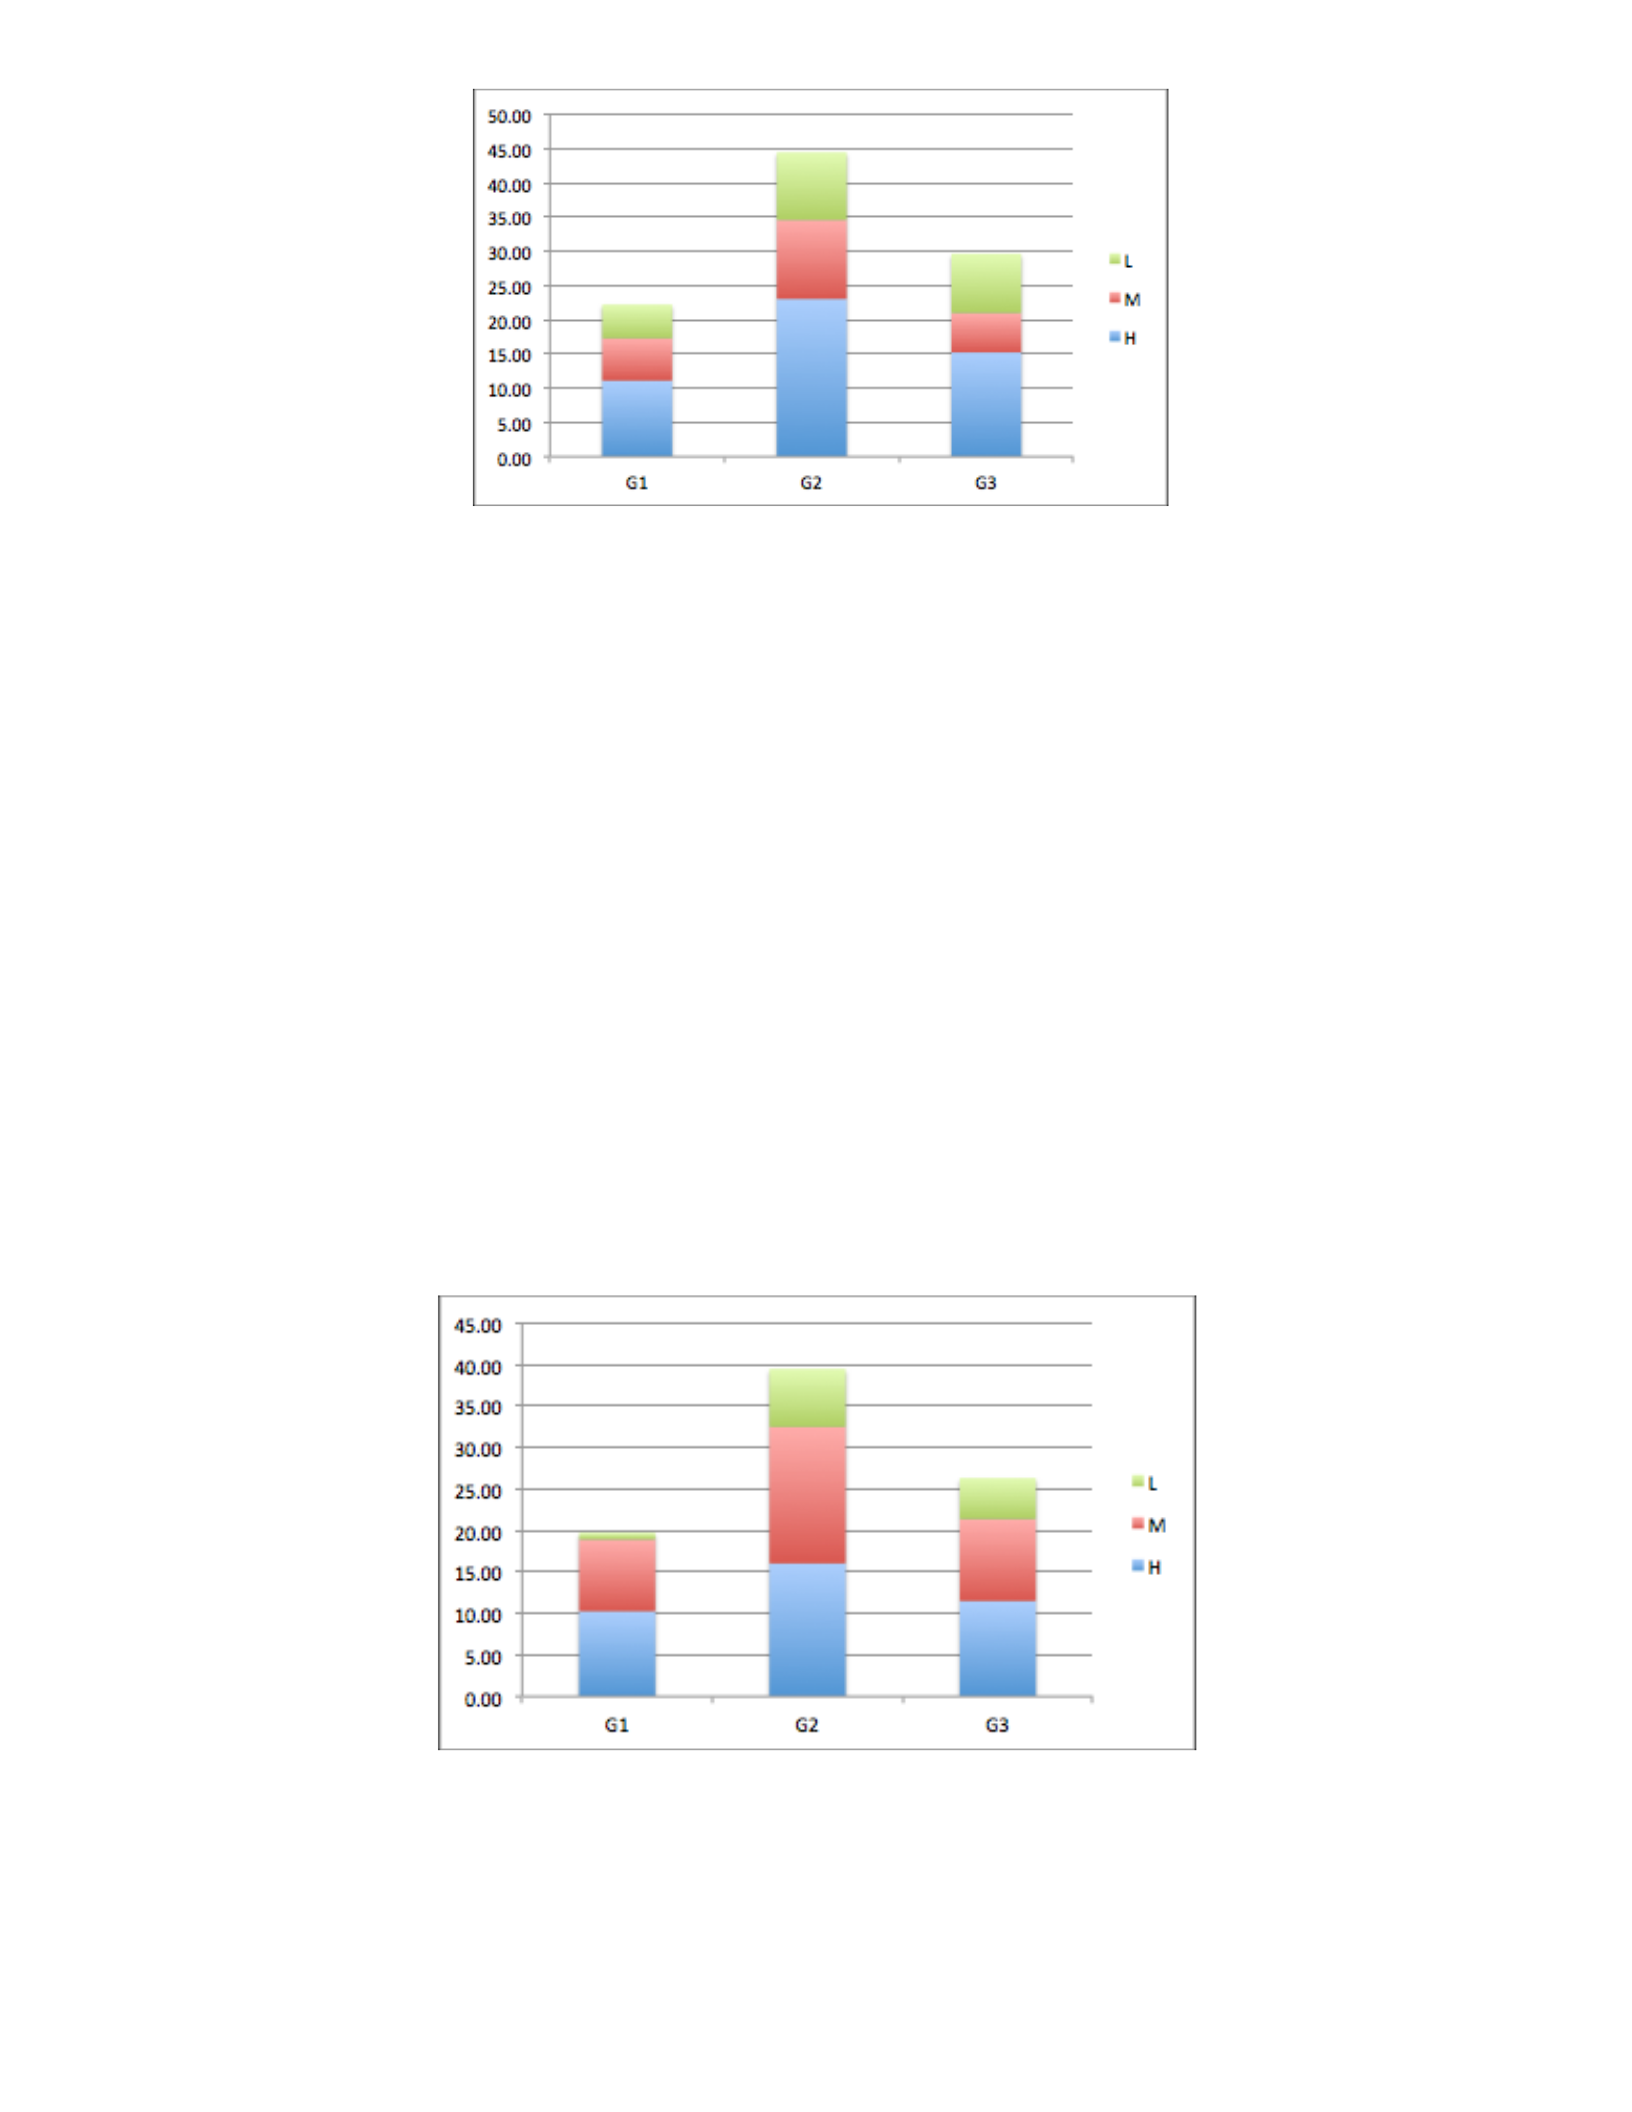
Figure 4.5: Content analysis of the total group of level 4 participants before the breach.
The previous results show the perception of level four participants regarding the security policy
that was created for our experiment before introducing the security breach. The same analysis was
conducted for the data that was collected from the same participants after introducing the security
breach. Figure 4.6 shows the bar chart for the total group of level 4 participants after introducing
the breach. This chart shows that the most significant security policy perceptions were those related
to security policy process. That is, the participants considered the constructs related to the security
policy process and how it should be as the most significant aspects of the security policy. The next
most significant constructs were those fall under the policy content.
Figure 4.6: Content analysis of the total group of level 4 participants after the breach.
Here, the perception of the participants regarding the security policy before and after the
occurrence of the breach was very close. The maturity level of the policy that was introduced for
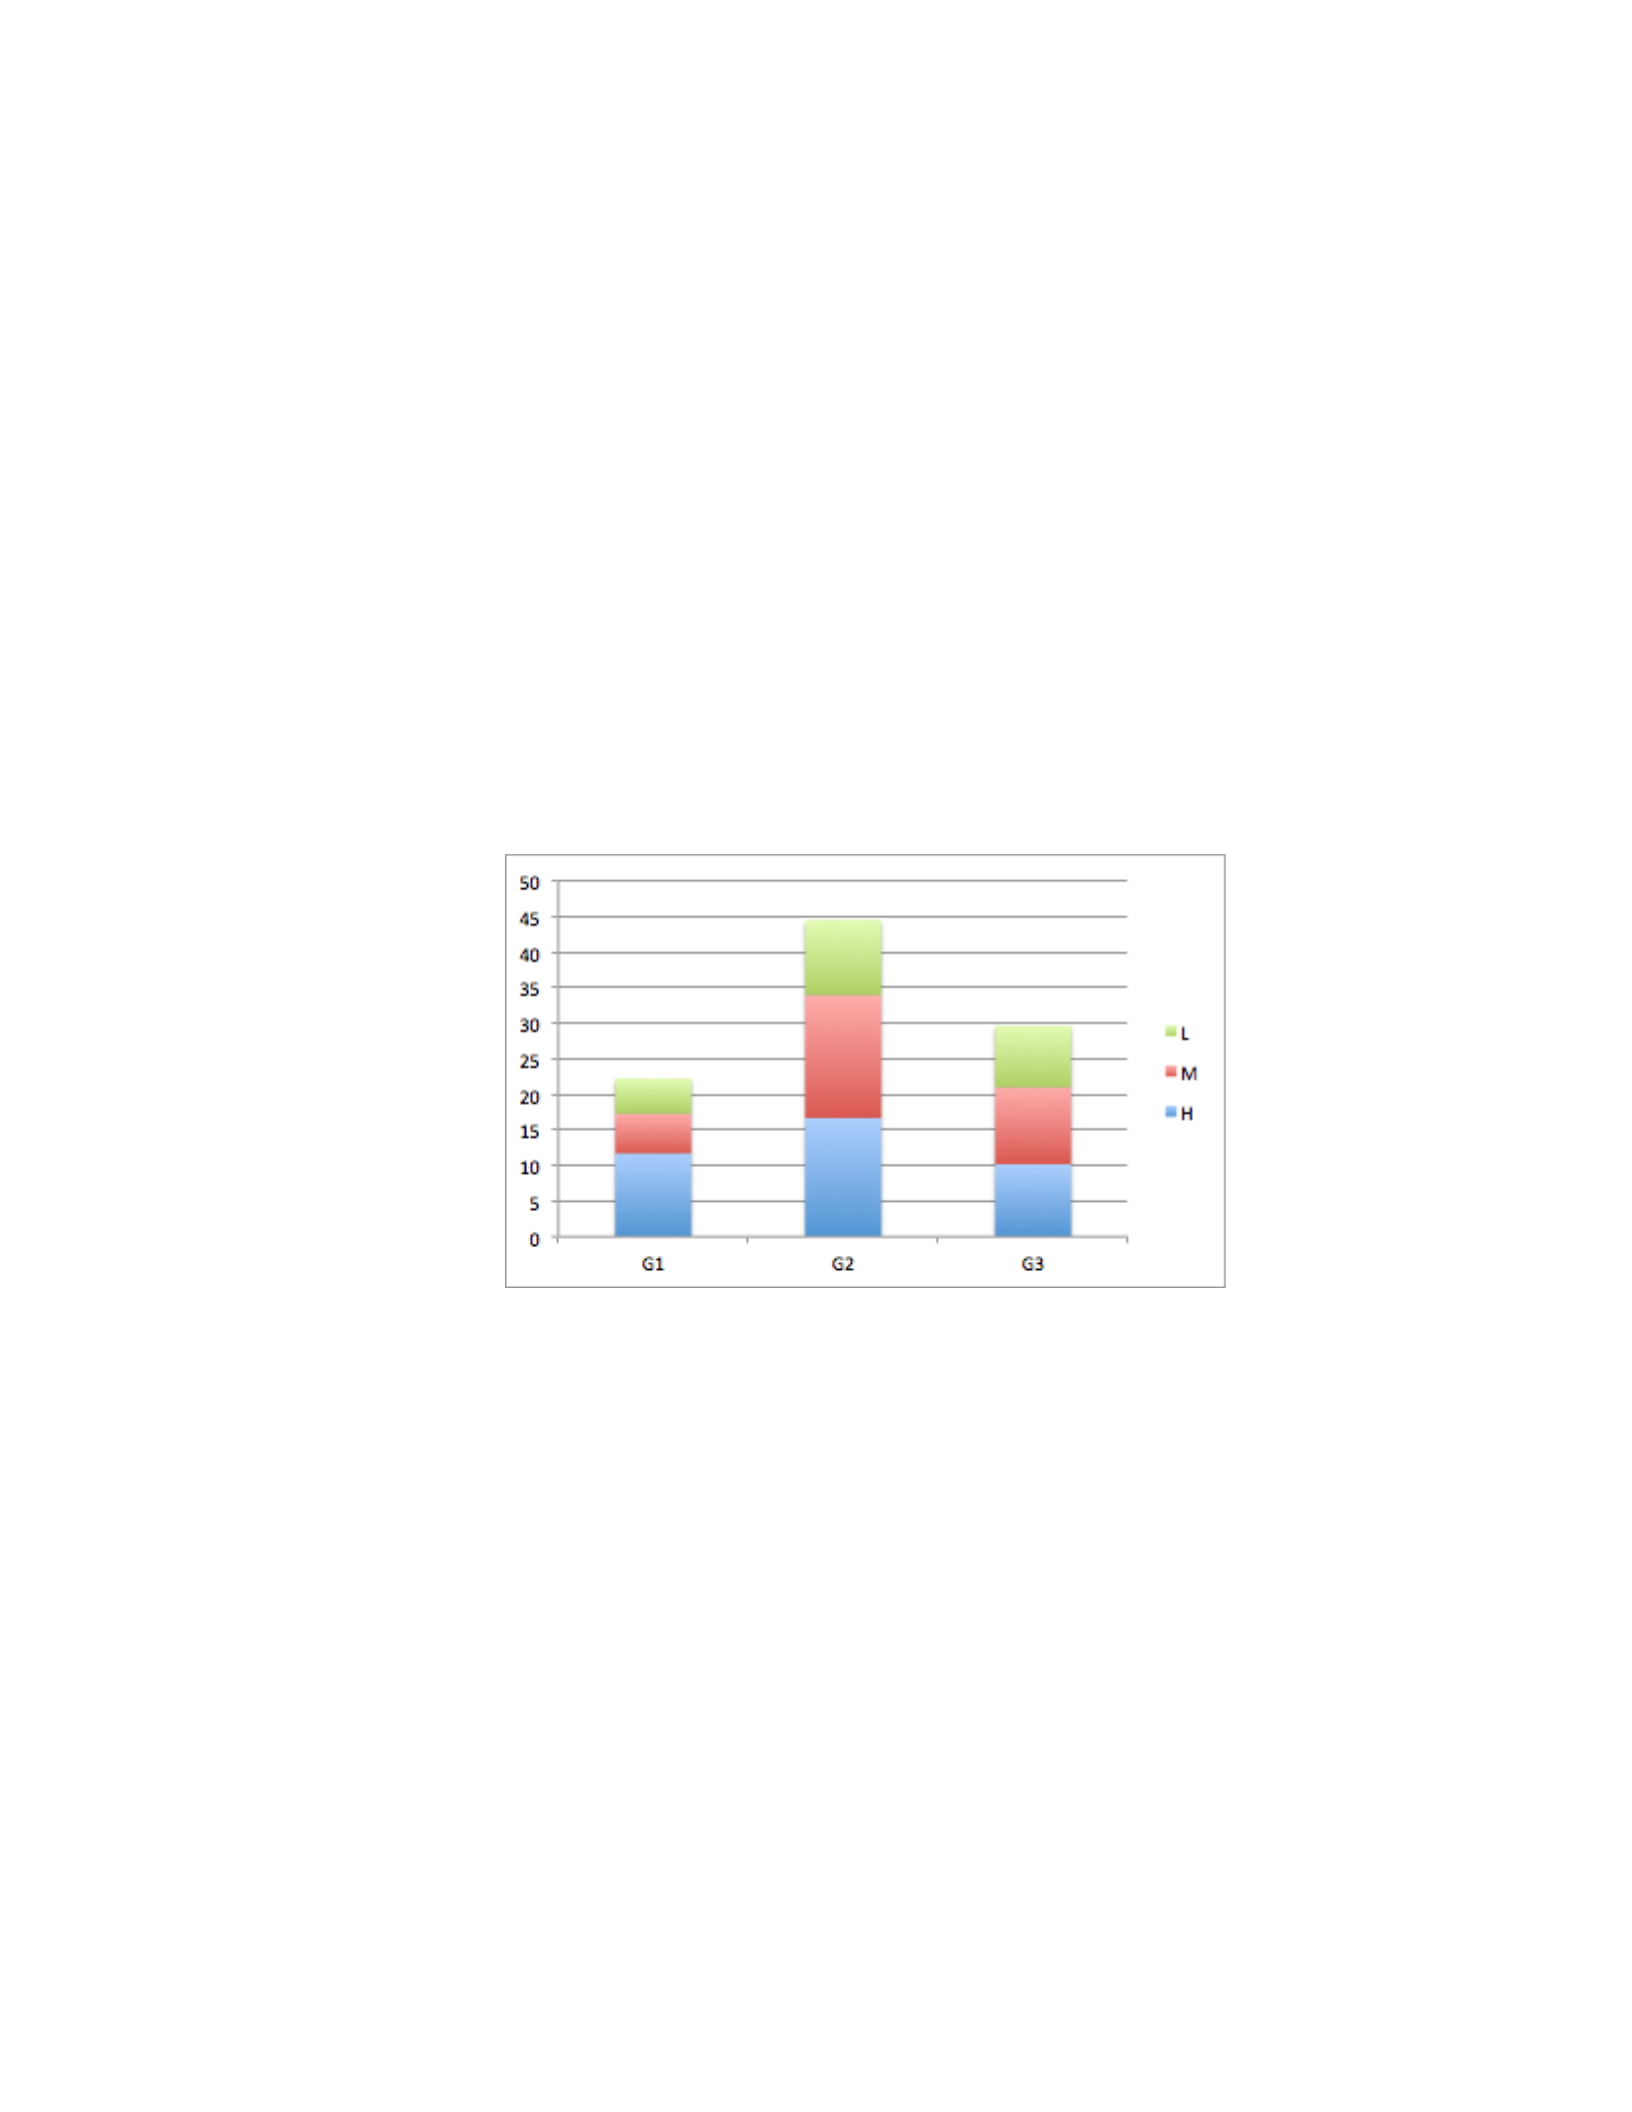
the participants may affect the difference between the two results. An interesting observation is
that the number of constructs that were seen as low significance was decreased. For example, 4.9%
of the constructs under the policy form group (G1) were considered to be of low significance before
introducing the breach. However, after introducing the breach the percentage change to 0.8%.
• SSE-CMM Level Three
Figure 4.7 shows the bar chart for the total group of level 3 participants. The chart shows that the
most significant security policy perceptions were those related to security policy process. That is,
the participants considered the constructs related to the security policy process and how it should
be as the most significant aspects of the security policy. The next most significant constructs were
those fall under policy form. However, the percentage of the highly correlated constructs for policy
form and policy content were 10.2% and 11.7%, respectively.
Figure 4.7: Content analysis of the total group of level 3 participants before the breach.
The previous results show the perception of level three participants regarding the security policy
that was created for our experiment before introducing the security breach. The same analysis was
conducted for the data that was collected from the same participants after introducing the security
breach. Figure 4.8 shows the bar chart for the total group of level 3 participants after introducing
the breach. This chart shows that the most significant security policy perceptions were those related
to security policy process and content. That is, the participants considered the constructs related to
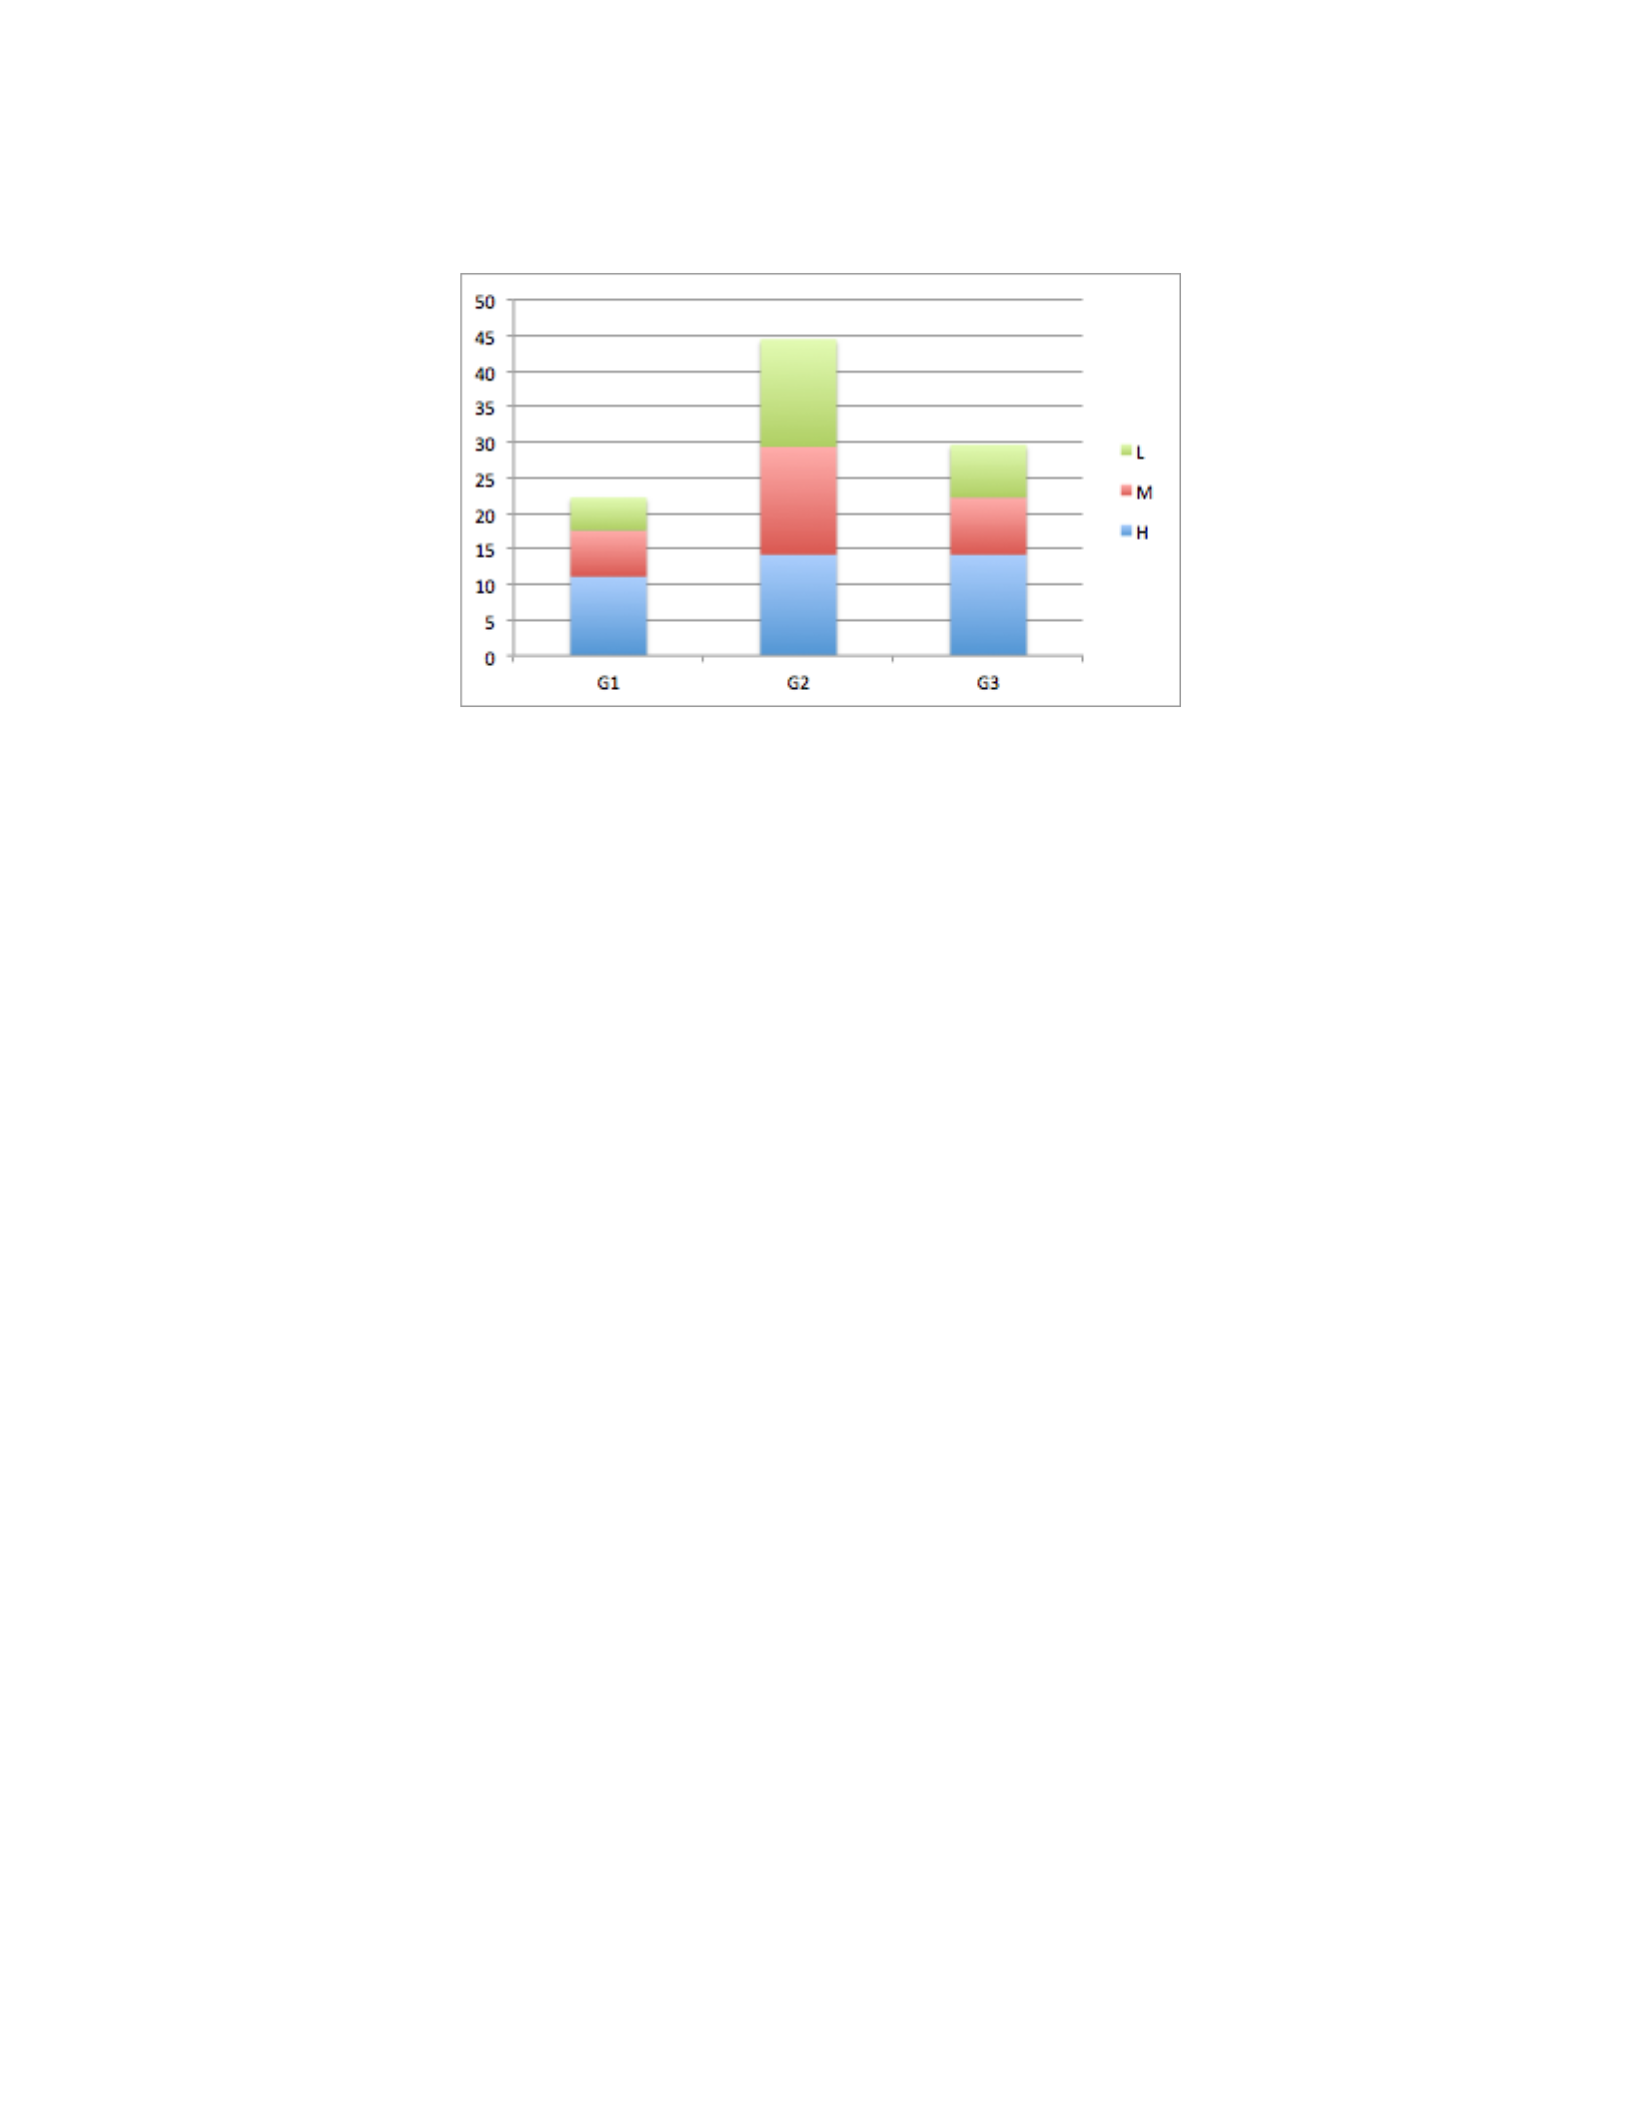
the security policy process, how it should be, and the content of the policy as the most significant
aspects of security policy.
Figure 4.8: Content analysis of the total group of level 3 participants after the breach.
Here, the perception of the participants regarding the security policy before and after introducing
the breach has been changed. Comparing figure 4.7 and figure 4.8, we realize that the number of
constructs in G3 considered highly significant increases from 10.1% (before the breach) to
14.1% (after the breach).
• SSE-CMM Level Two
Figure 4.9 shows the bar chart for the total group of level 2 participants. As it appears in the chart,
the most significant security policy perceptions were those related to security policy process. That
is, the participants considered the constructs related to the security policy process and how they
should be as the most significant aspects of the security policy. The next most significant constructs
are those fall under the policy content. The percentage of the highly correlated constructs for policy
process and policy content are 13.4% and 10.6%, respectively.
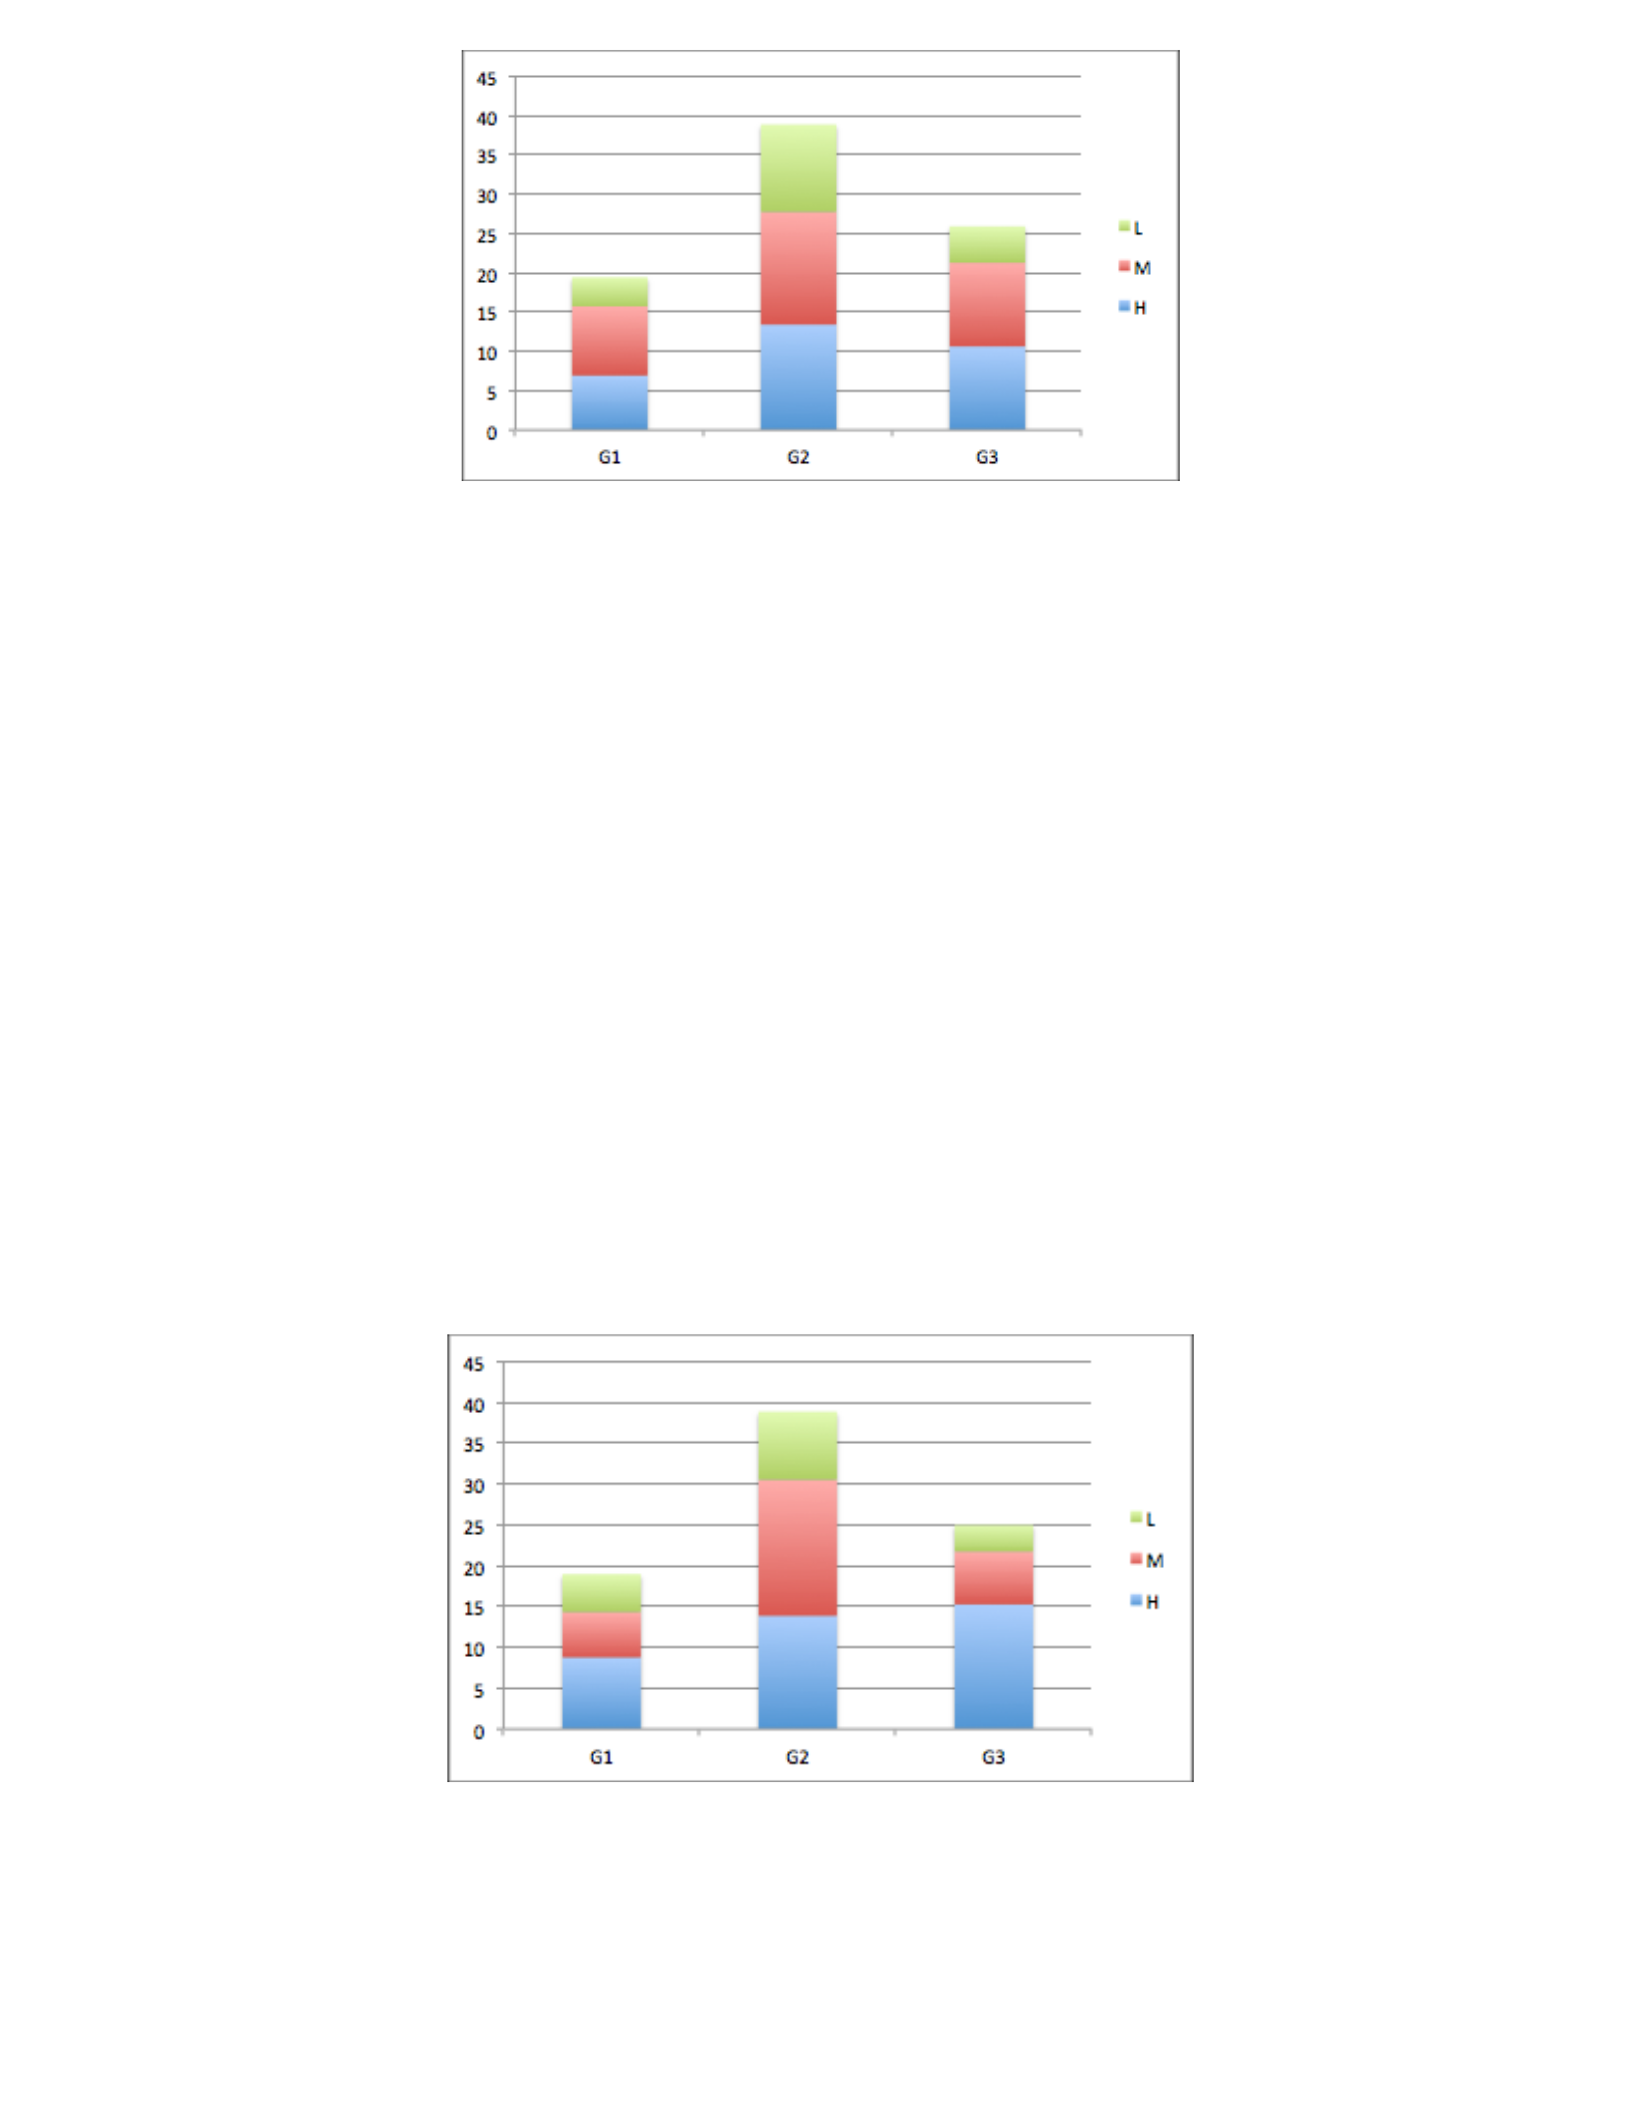
Figure 4.9: Content analysis of the total group of level 2 participants before the breach.
The previous results show the perception of level two participants regarding the security policy
that was created for our experiment before introducing the security breach. The same analysis was
conducted for the data that was collected from the same participants after introducing the security
breach. Figure 4.10 shows the bar chart for the total group of level 2 participants after introducing
the breach. This chart shows that the most significant security policy perceptions were those related
to security policy content. That is, the participants considered the constructs related to the content
of the policy as the most significant aspects of the security policy, followed by the constructs
related to the policy process.
Figure 4.10: Content analysis of the total group of level 2 participants after the breach.
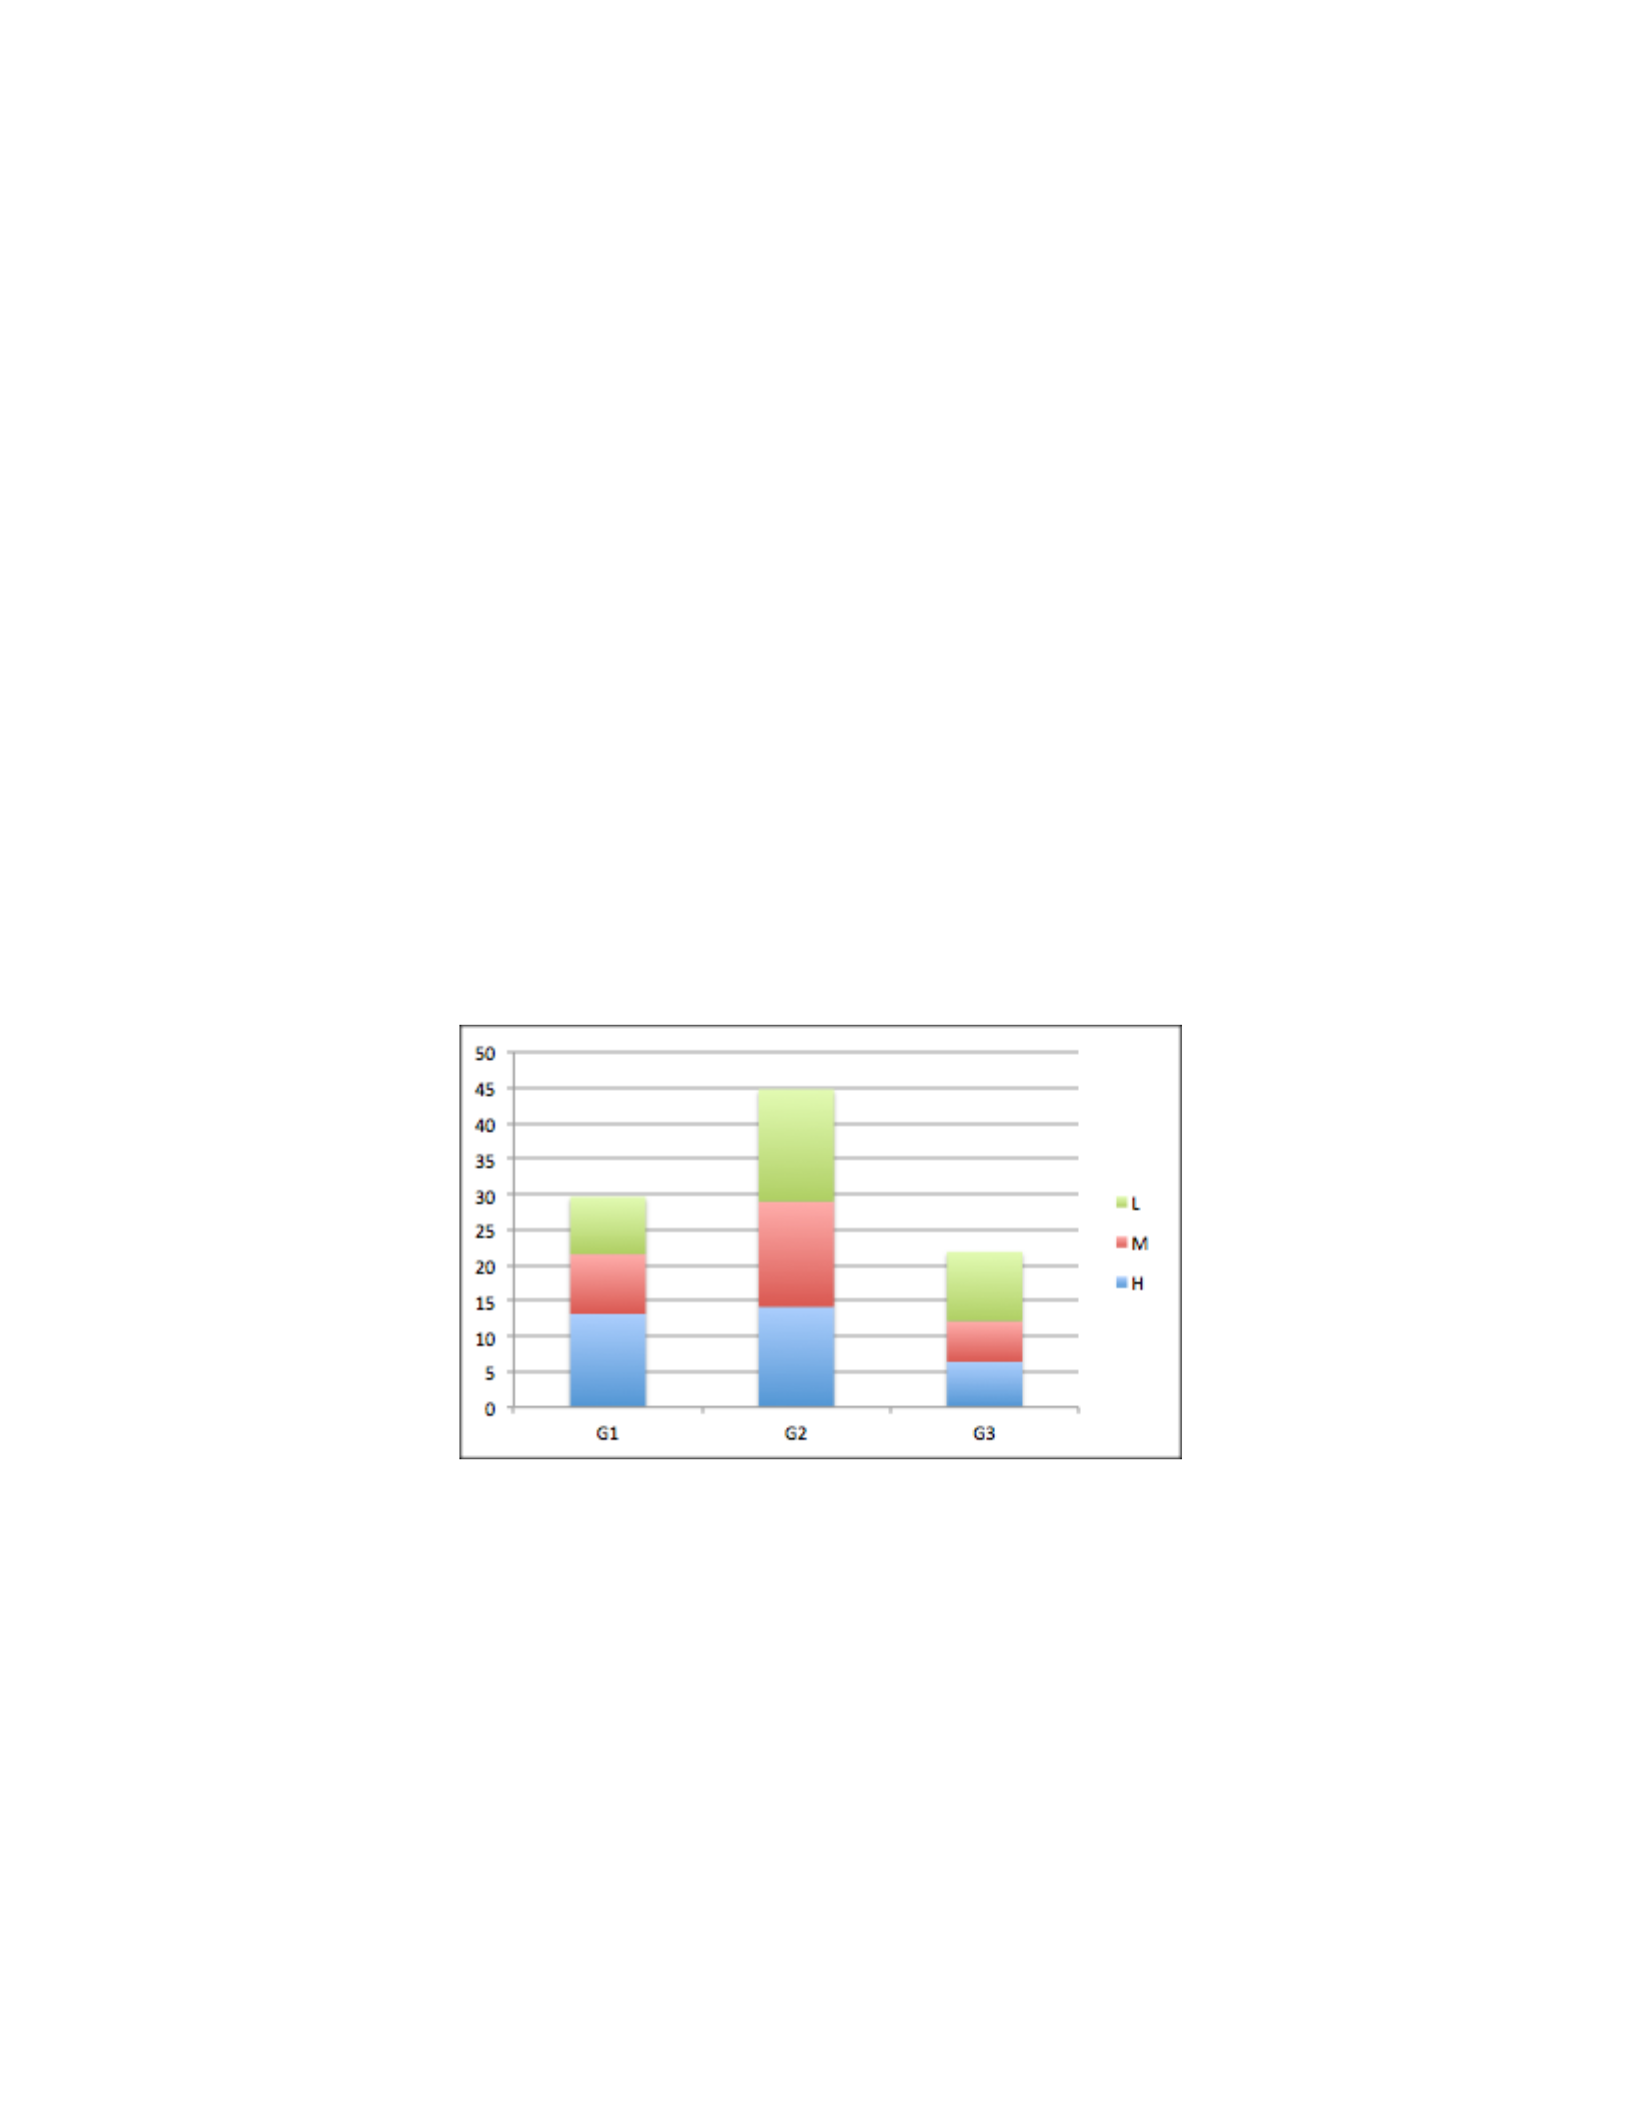
Here, the perception of the participants regarding the security policy before and after introducing
the breach has been changed. By comparing figures 4.9 and 4.10, we can realize that the number
of constructs considered highly significant increases from 6.9% (before the breach) to 8.8% (after
the breach) in the policy form group. Similarly, the number of constructs considered highly
significant increases from 13.4% (before the breach) to 13.8% (after the breach) in the policy
process group and from 10.6% (before the breach) to 15.3% (after the breach) in the policy content
group.
• SSE-CMM Level One
Figure 4.11 shows the bar chart for the total group of level 1 participants. As we can see from the
chart, the most significant security policy perceptions were those related to security policy process.
That is, the participants considered the constructs related to the security policy process and how it
should be as the most significant aspects of the security policy. The next most significant constructs
were those fall under policy form.
Figure 4.11: Content analysis of the total group of level 1 participants before the breach.
The previous results show the perception of level one participants regarding the security policy
that was created for our experiment before introducing the security breach. The same analysis was
conducted for the data that was collected from the same participants after introducing the security
breach. Figure 4.12 shows the bar chart for the total group of level 1 participants after introducing
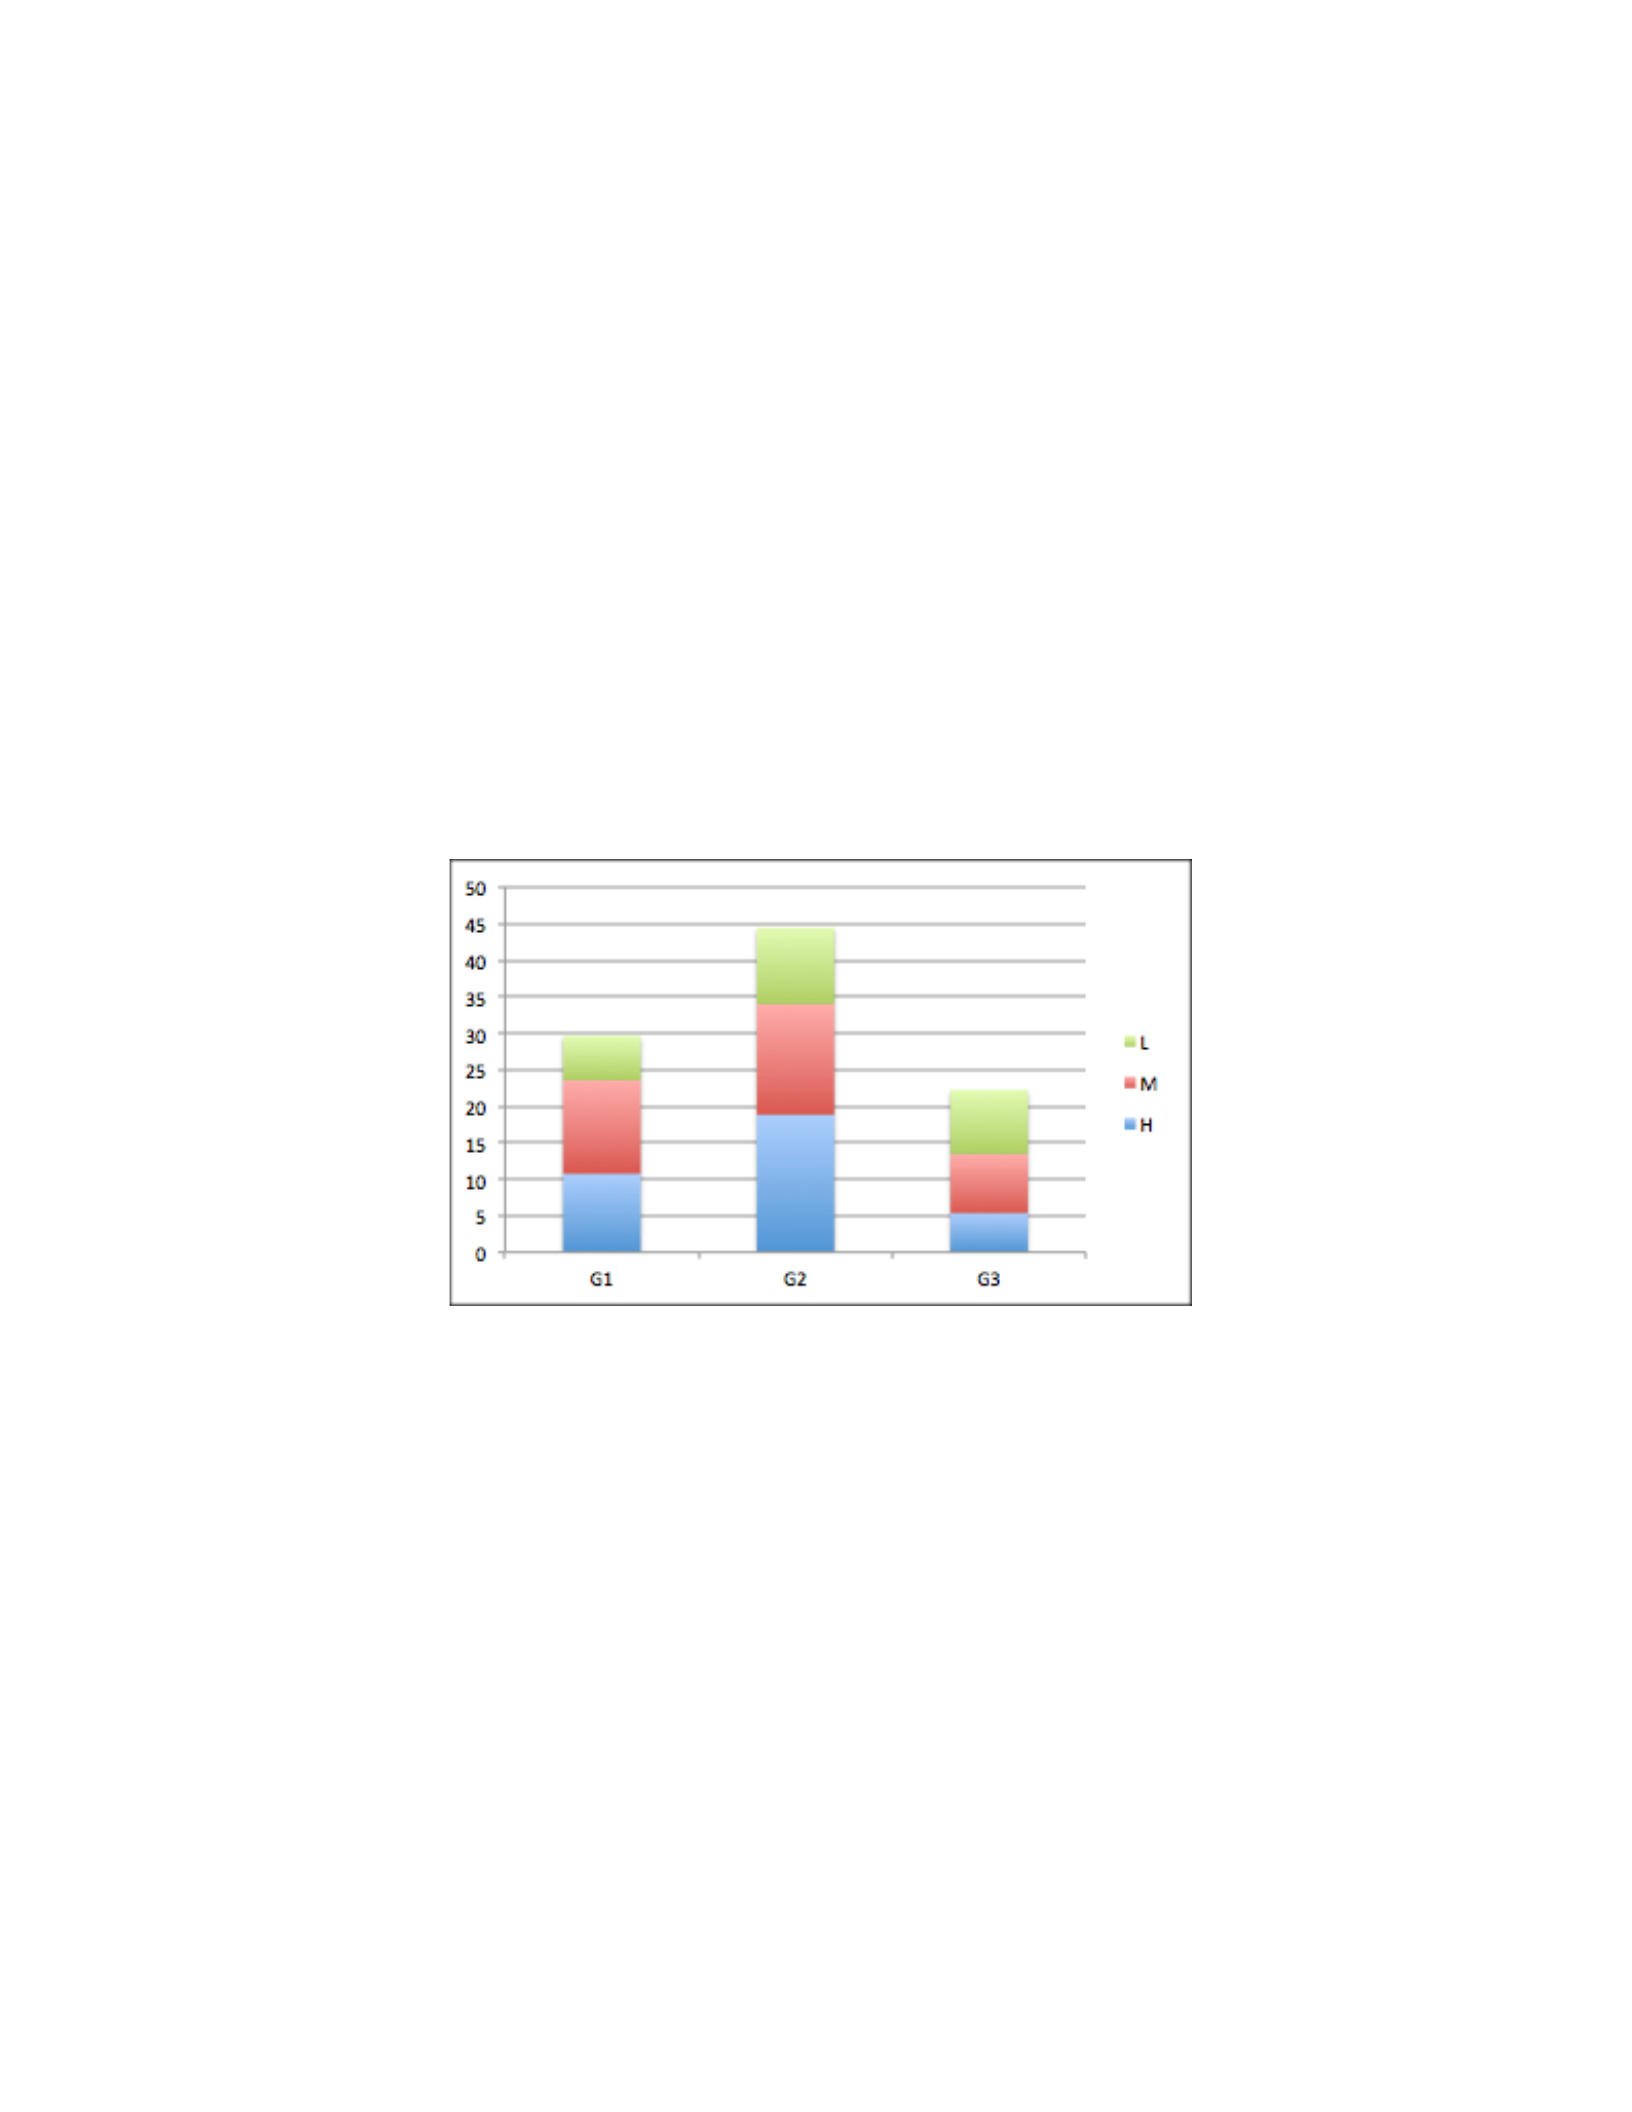
the breach. This chart shows that the most significant security policy perceptions were those related
to security policy process. That is, the participants considered the constructs related to the security
policy process and how it should be as the most significant aspects of the security policy, followed
by the constructs related to the policy form. An interesting observation here is that the number of
constructs that considered as highly significant constructs in the policy process group was
increased from 14.1% (before the breach) to 18.8% (after the breach). On the other hand, the
number of constructs that considered as highly significant constructs in the policy process group
was decreased from 13.1% (before the breach) to 10.8% (after the breach) in the policy form group.
Similarly, the number of constructs that considered as highly significant constructs in the policy
process group was decreased from 6.4% (before the breach) to 5.4% (after the breach) in the policy
content group.
Figure 4.12: Content analysis of the total group of level 1 participants after the breach.
To sum up, before introducing the security breach, the five groups of the participants agreed on
that the constructs related to policy process were the most significant aspects of the security policy.
However, they disagreed on which group was the next significant group. In this study, we
considered the second method to interpret the bar charts. Thus, level five, level three, and level one
groups agreed on was that the second most significant group is the policy form whereas the rest of
the groups agreed on that the second most significant group was the policy content.

After introducing the security breach, four of the five groups agreed on that the constructs related
to policy process were the most significant aspects of security policy. Level three participants
perceived the constructs related to policy process and policy content as the most significant aspects
of the security policy. However, the five groups perceptions were different regarding the next
significant group. Thus, level five, level one and level three groups agreed on that the second most
significant group was the policy form, whereas the rest of the groups agreed on that the second
most significant group was the policy content.
Comparing the results for all the groups before and after the introduction of security breach shows
the changes that occur in the participant perceptions regarding the security policy of the Crown
Confection Company. Here, the comparison was conducted for the group as a whole before and
after the breach.
Another comparison was performed to see how the perception of each person changes after
introducing the security breach. Figure 4.13 shows a sample of five participants from the five levels
and how the perceptions of each one changed after introducing the security breach.
The sample in figure 4.13 was selected randomly. Each chart represents one of the participants in
one of the SSE-CMM five levels. In the charts the much two points from each color get closer, the
much the perception of the participant get closer before and after the breach. For example, if we
take the level 1 participant, we may conclude that her/his perception regarding the five security
policy themes was very different. On the other hand, if we consider the level 4 participant, we can
see that her/his perception regarding acceptable use policy, email policy, and remote access policy
was different before and after the breach, whereas her/his perception regarding information
security roles and responsibilities policy and password policy was very similar. To sum up, the
perception of the participants after the breach was different from their perception before the breach.
Some of them had some similarities in their perceptions regarding some of the policy themes, as
we see in the example above. However, no one had an identical or very similar perception regarding
all the themes before and after the breach.
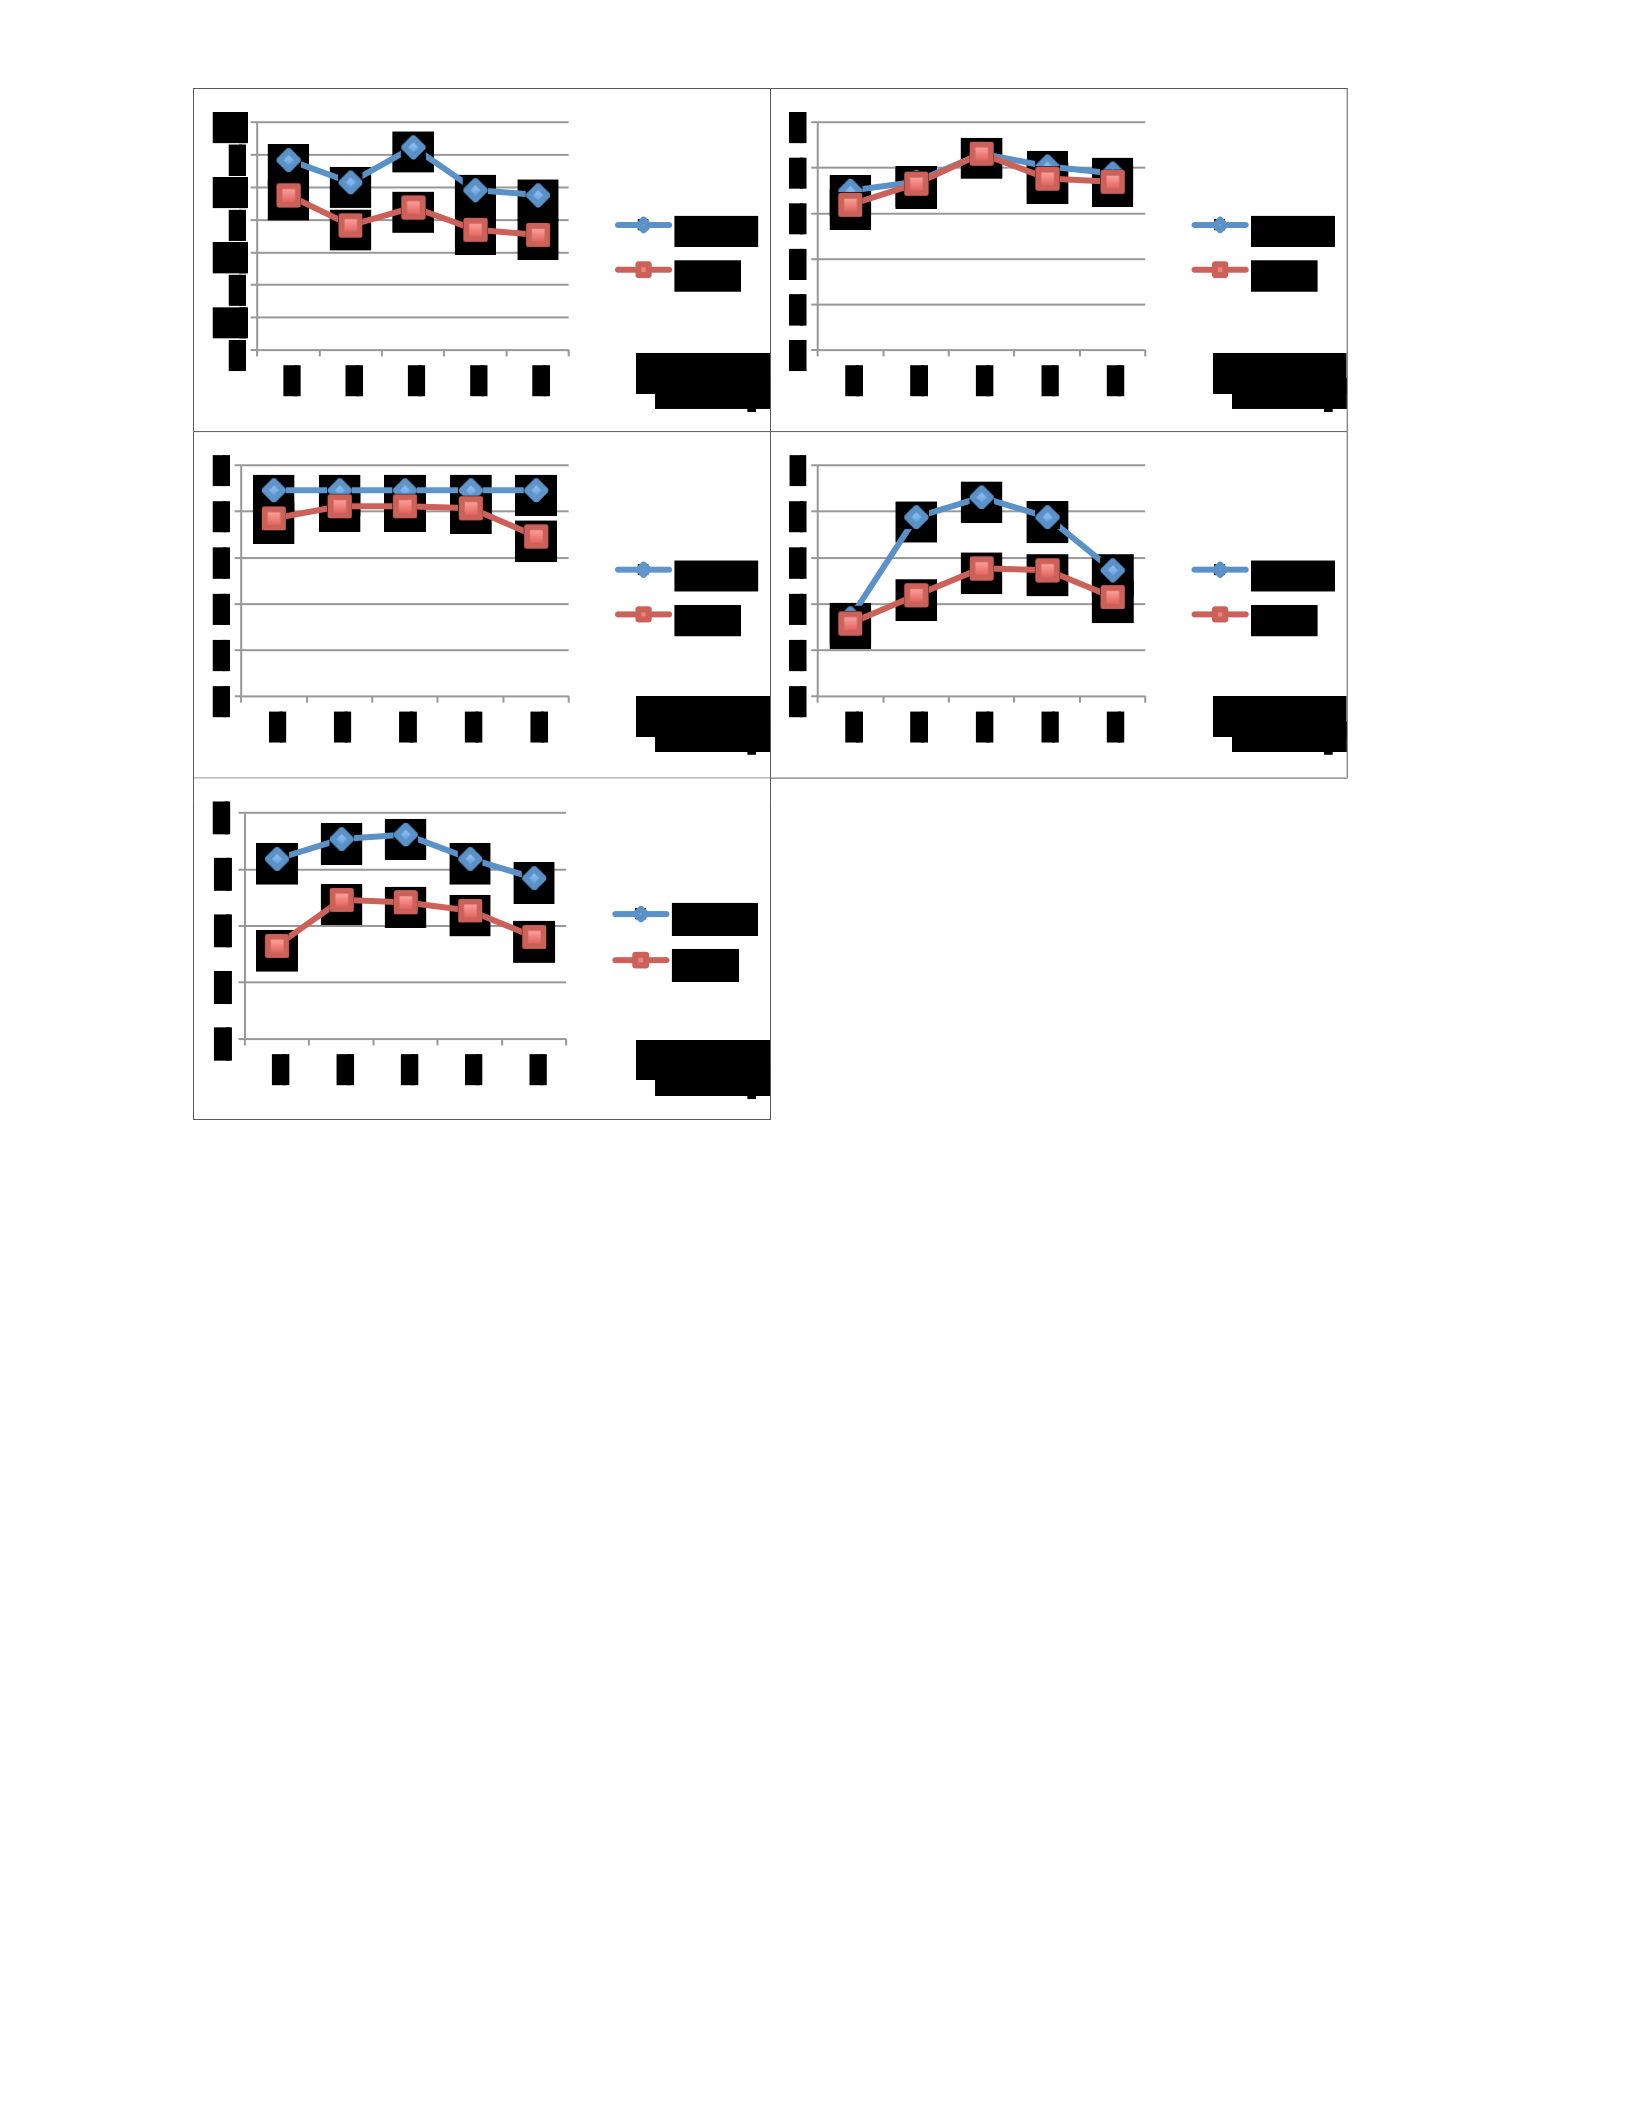
Figure 4.13: A sample of five participants from the five levels and how the perception of each of them changed after
introducing the security breach (1=acceptable use policy, 2=Info. Sec. roles and responsibilities, 3=password policy,
4=email policy, and 5=remote access policy).
Also, a comparison was conducted to compare the participant’s perception within each group. For
example, figure 4.14 shows how participants from the same group had different perception
regarding the security policy.
0
0.5
1
1.5
2
2.5
3
3.5
1
2
3
4
5
Before
After
Level 1
Participant
0
1
2
3
4
5
1
2
3
4
5
Before
After
Level 4
Participant
0
1
2
3
4
5
1
2
3
4
5
Before
After
Level 2
Participant
0
1
2
3
4
5
1
2
3
4
5
Before
After
Level 5
Participant
0
1
2
3
4
1
2
3
4
5
Before
After
Level 3
Participant
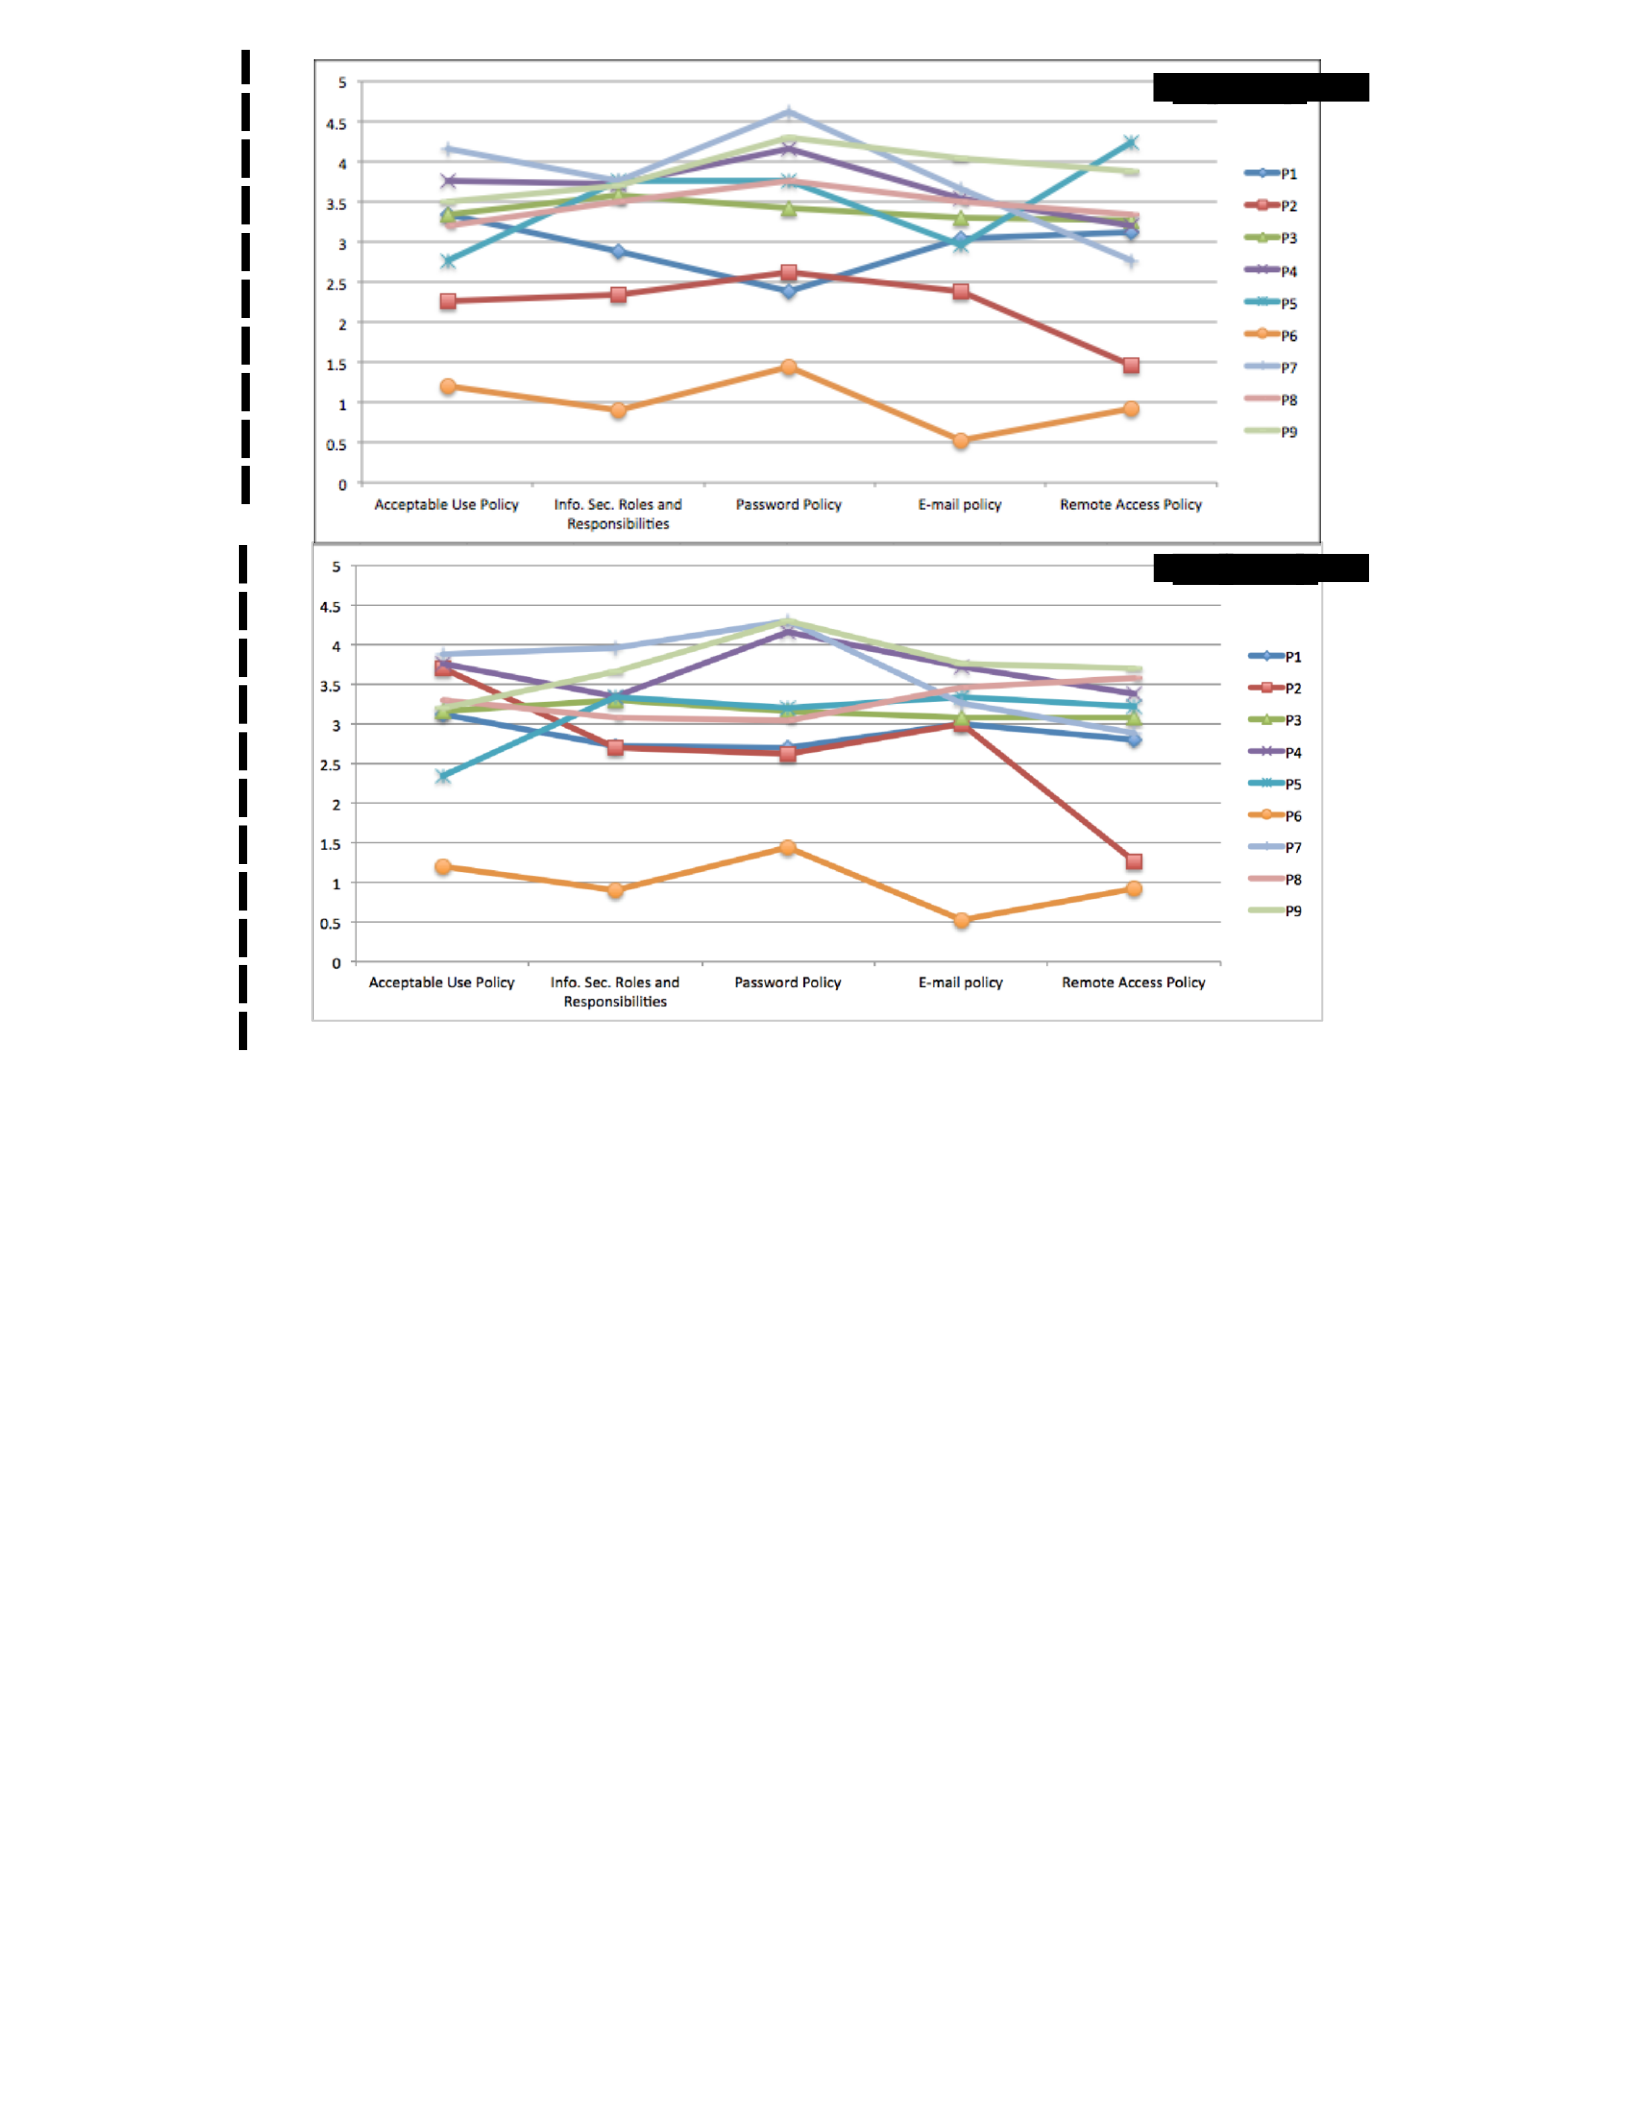
Figure 4.14: Difference in the participant’s perception regarding the security policy.
Each colored line in the figure 4.14 represents a participant’s perception. This figure shows how
participants had some differences in their perceptions regarding policy. When two points on two
lines intersect, that means the two participants have the same perception regarding the respected
policy. As the two points diverge, perceptions differ. For example, P1 and P5 had the same
perception regarding the E-mail policy; however, their perceptions were quite different regarding
the password policy.
The same analysis was conducted for all of the groups before and after the introduction of the
security breach. The results were consistent with the previous results. The participants in each
group hold different perceptions regarding the security policy. That difference in their perception
may be because of the different understanding of the same security policy. People in an
Pre
-
breach
Post
-
breach

organization can understand the same security policy differently because of the differences in the
people’s norms and values. A person has a different psychological process that he or she can use
to understand the world around her/him (Kelly, 1963).
It is hard to link these results to the previous studies because (to our knowledge) no study
investigated the people perceptions regarding security policy. For example, Siponen and Iivari
(2006) conducted a study that shows how various normative theories can influence the success of
the security policy. They emphasize that some exceptional situations such as unexpected business
opportunities may require a violation to security policy. Goel and Chengalur-Smith (2010) propose
a metrics to evaluate the effectiveness of the policy. They argue that breadth, clarity, and brevity
are the three dimensions that could be used to measure how well a policy is documented. Their
paper mainly focuses on the form of the security policy and ignores other aspects such as content
and process of the policy, which may play a role in the success of a security policy.
Similar content analysis has been conducted for different sub-groups to show how various
subgroups of the participants perceived the security policy. In this study, participants were mainly
grouped into five groups in accordance with the SSE-CMM five levels. Then, each of the five
groups was subcategorized once based on the participants’ age and once based on participant’s
experience. The content analysis is important when analyzing Repertory Grids. Many researchers
have employed content analysis before doing any quantitative analysis.
4.3.2.1 Security Policy Perception and Age in this section, the content analysis is
conducted on the groups that were categorized based on participant age. Each group of the
participants in the SSE-CMM levels was categorized based on the age of the participants of the
corresponding group. Then, content analyses were conducted for each sub-group.
• SSE-CMM Level Five
The participants of this group were sub-grouped based on their ages. They were grouped into three
groups: participants whose ages were between 18 and 25 years old; participants whose ages were
between 26 and 30 years old; and participants who were older that 30 years old. Figure 4.15 shows
how the five main policy themes of the Crown Confections security policy were perceived by
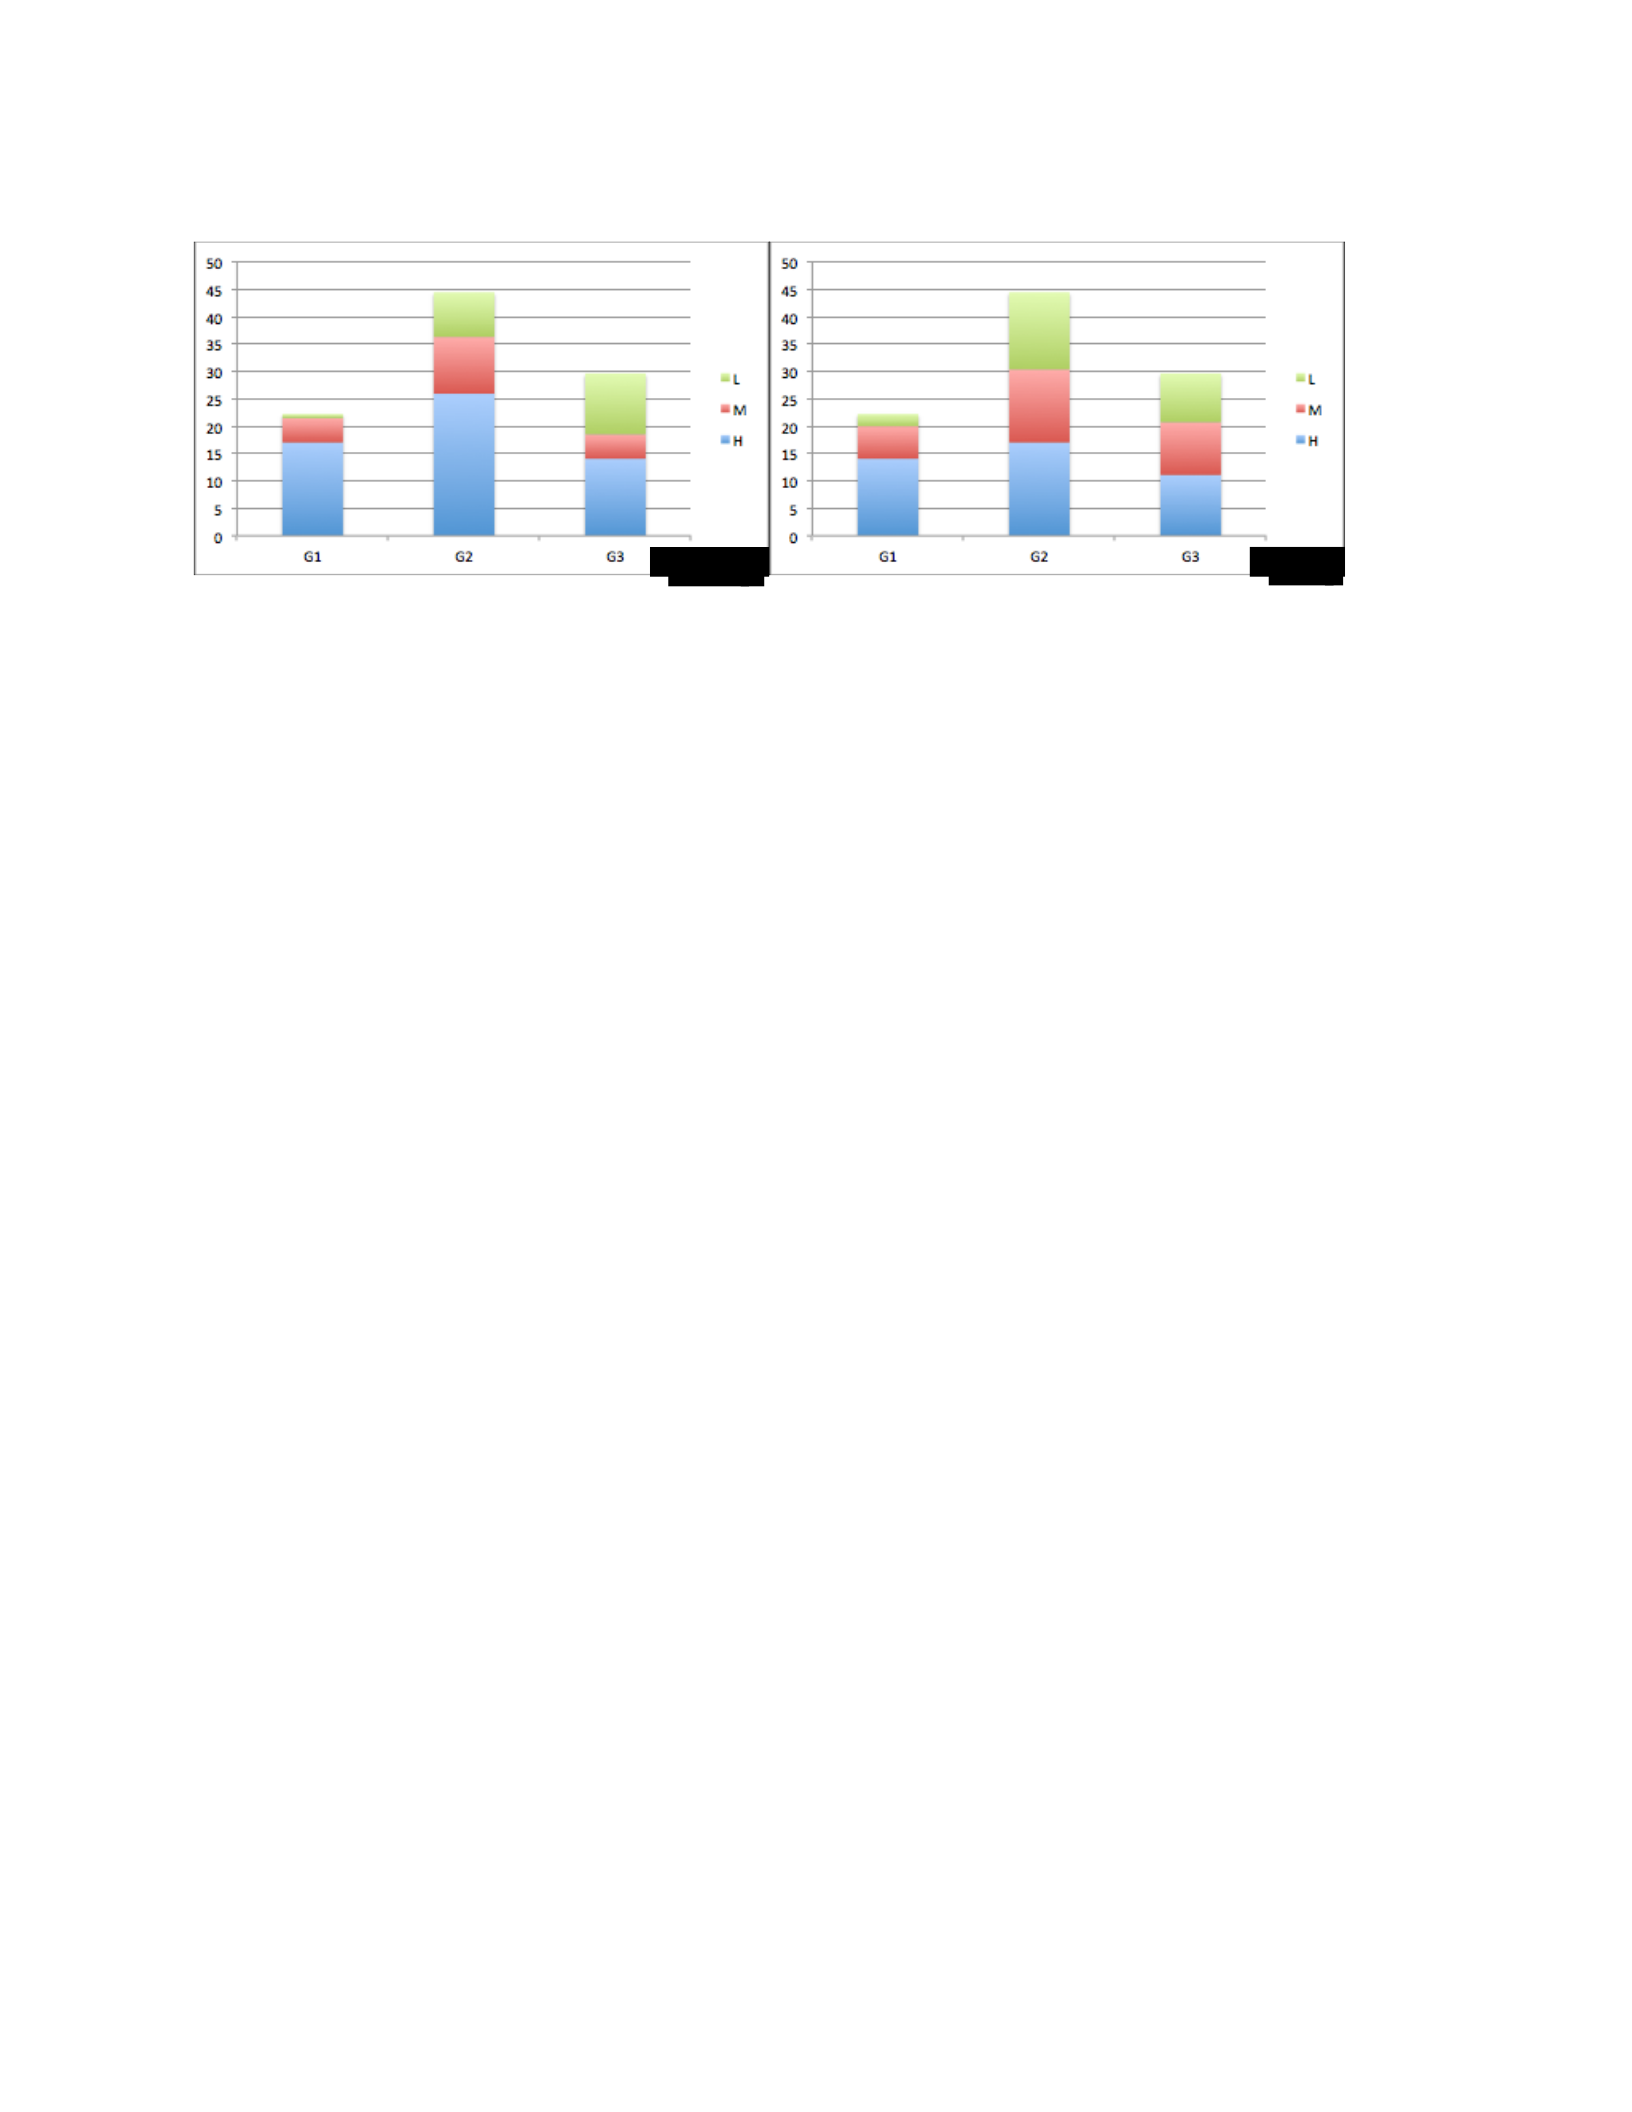
participants whose ages were between 18 and 25 years old before and after the occurrence of the
security breach.
Figure 4.15: How the five main policy themes of the Crown Confections security policy were perceived by
participants whose age was between 18 and 25 years old (before and after the breach).
Figure 4.15 shows the bar chart for the level 5 participants whose ages were between 18 and 25
years old. These charts show how this group perceived the security policy before the breach and
how their perception changed after introducing the breach. According to the charts, the level 5
participants whose age was between 18 and 25 years old perceive that the most significant security
policy perceptions were those related to security policy process. That is, the participants considered
the constructs related to the security policy process and how it should be as the most significant
aspects of the security policy. The second predominant perceptions were those related to policy
form.
Here, the perception of this group of the participants regarding the security policy before and after
the occurrence of the breach was very close. However, the number of constructs that were
considered as high, medium, or low differed after introducing the breach. For example, 25.9% of
the constructs that fall under G2 group are considered highly important before introducing the
breach. However, this percentage changed to 17% after the breach.
The same results were reached from the level 5 participants whose age was between 26 and 30
years old as it appears in figure 4.16. This group of the participants perceives that the most
Before
After
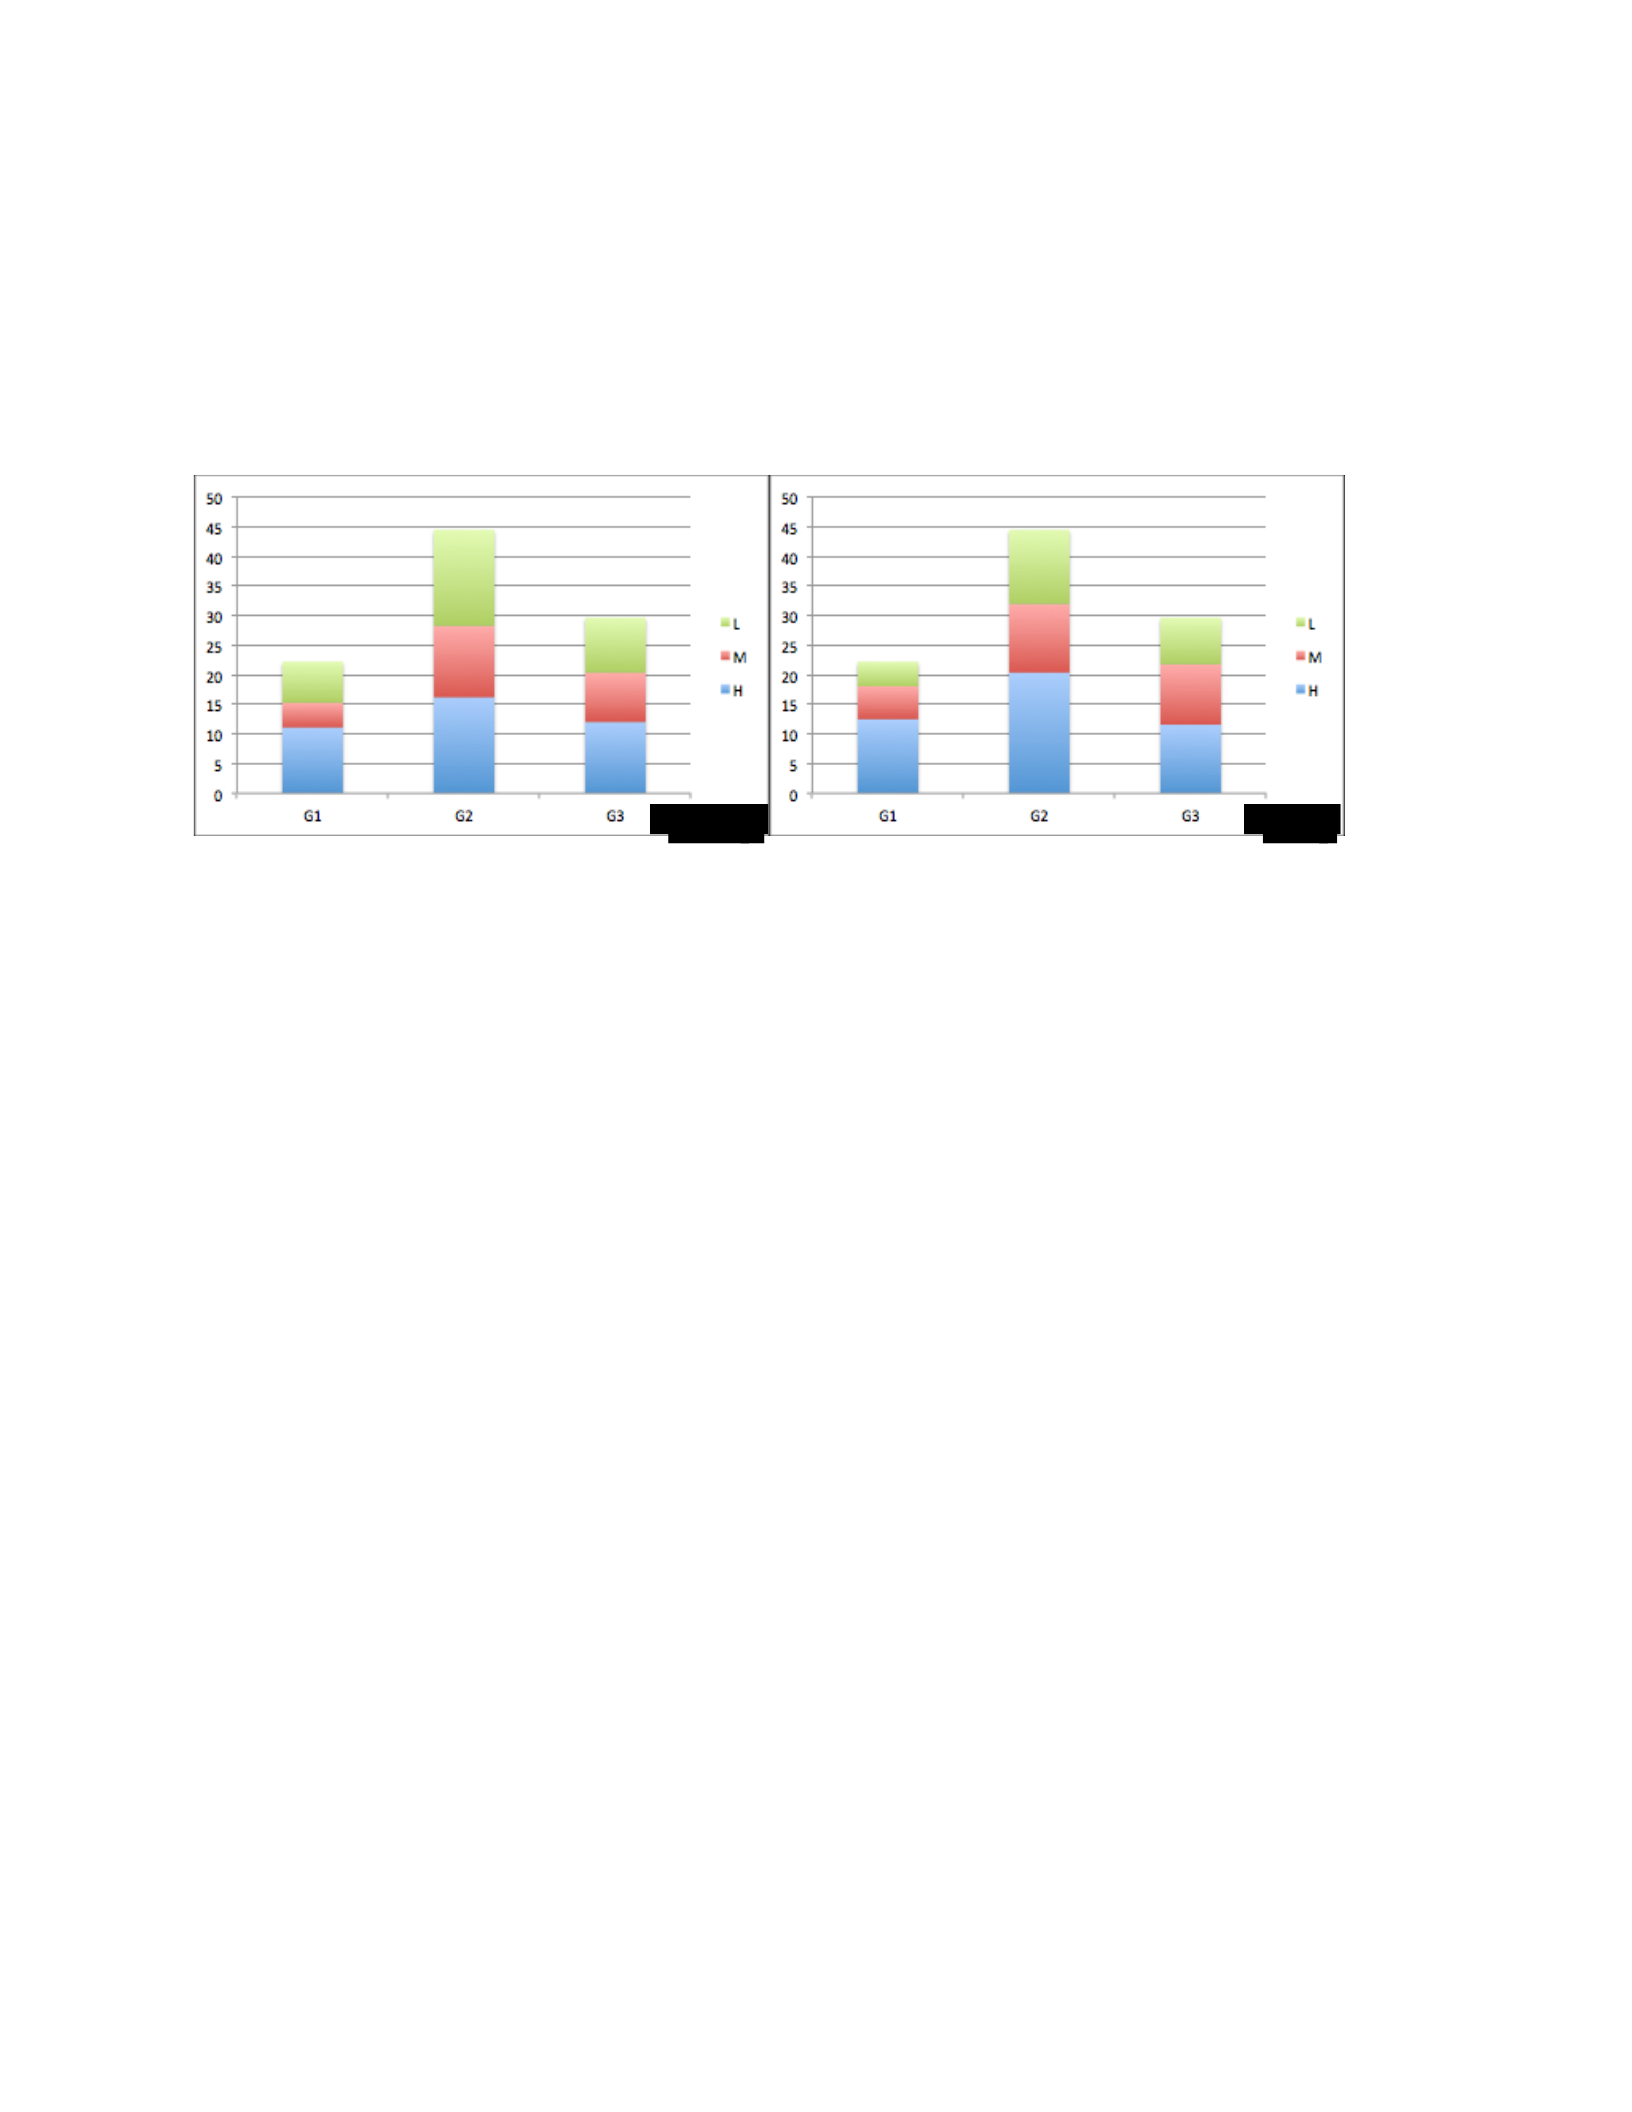
important security policy perceptions were those related to security policy process. The perception
of this group regarding the security policy before and after the breach was very close. However,
the number of the constructs that were considered as high, medium, or low changed after
introducing the breach.
Figure 4.16: How the five main policy themes of the Crown Confections security policy were perceived by
participants whose age falls between 26 and 30 years old (before and after the breach).
Lastly, the third group of level 5 participants who were older than 30 years old had very different
perceptions of the policy before and after the breach, as can be drawn from figure 4.17. Before
introducing the security breach, this group of the participants perceived that the most important
security policy perceptions were those related to security policy process, whereas the policy
content and the policy form groups had the same importance. After introducing the breach, this
group of the participants perceived that the most important security policy perceptions were those
related to security policy form, while the policy process has the least importance.
Before
After
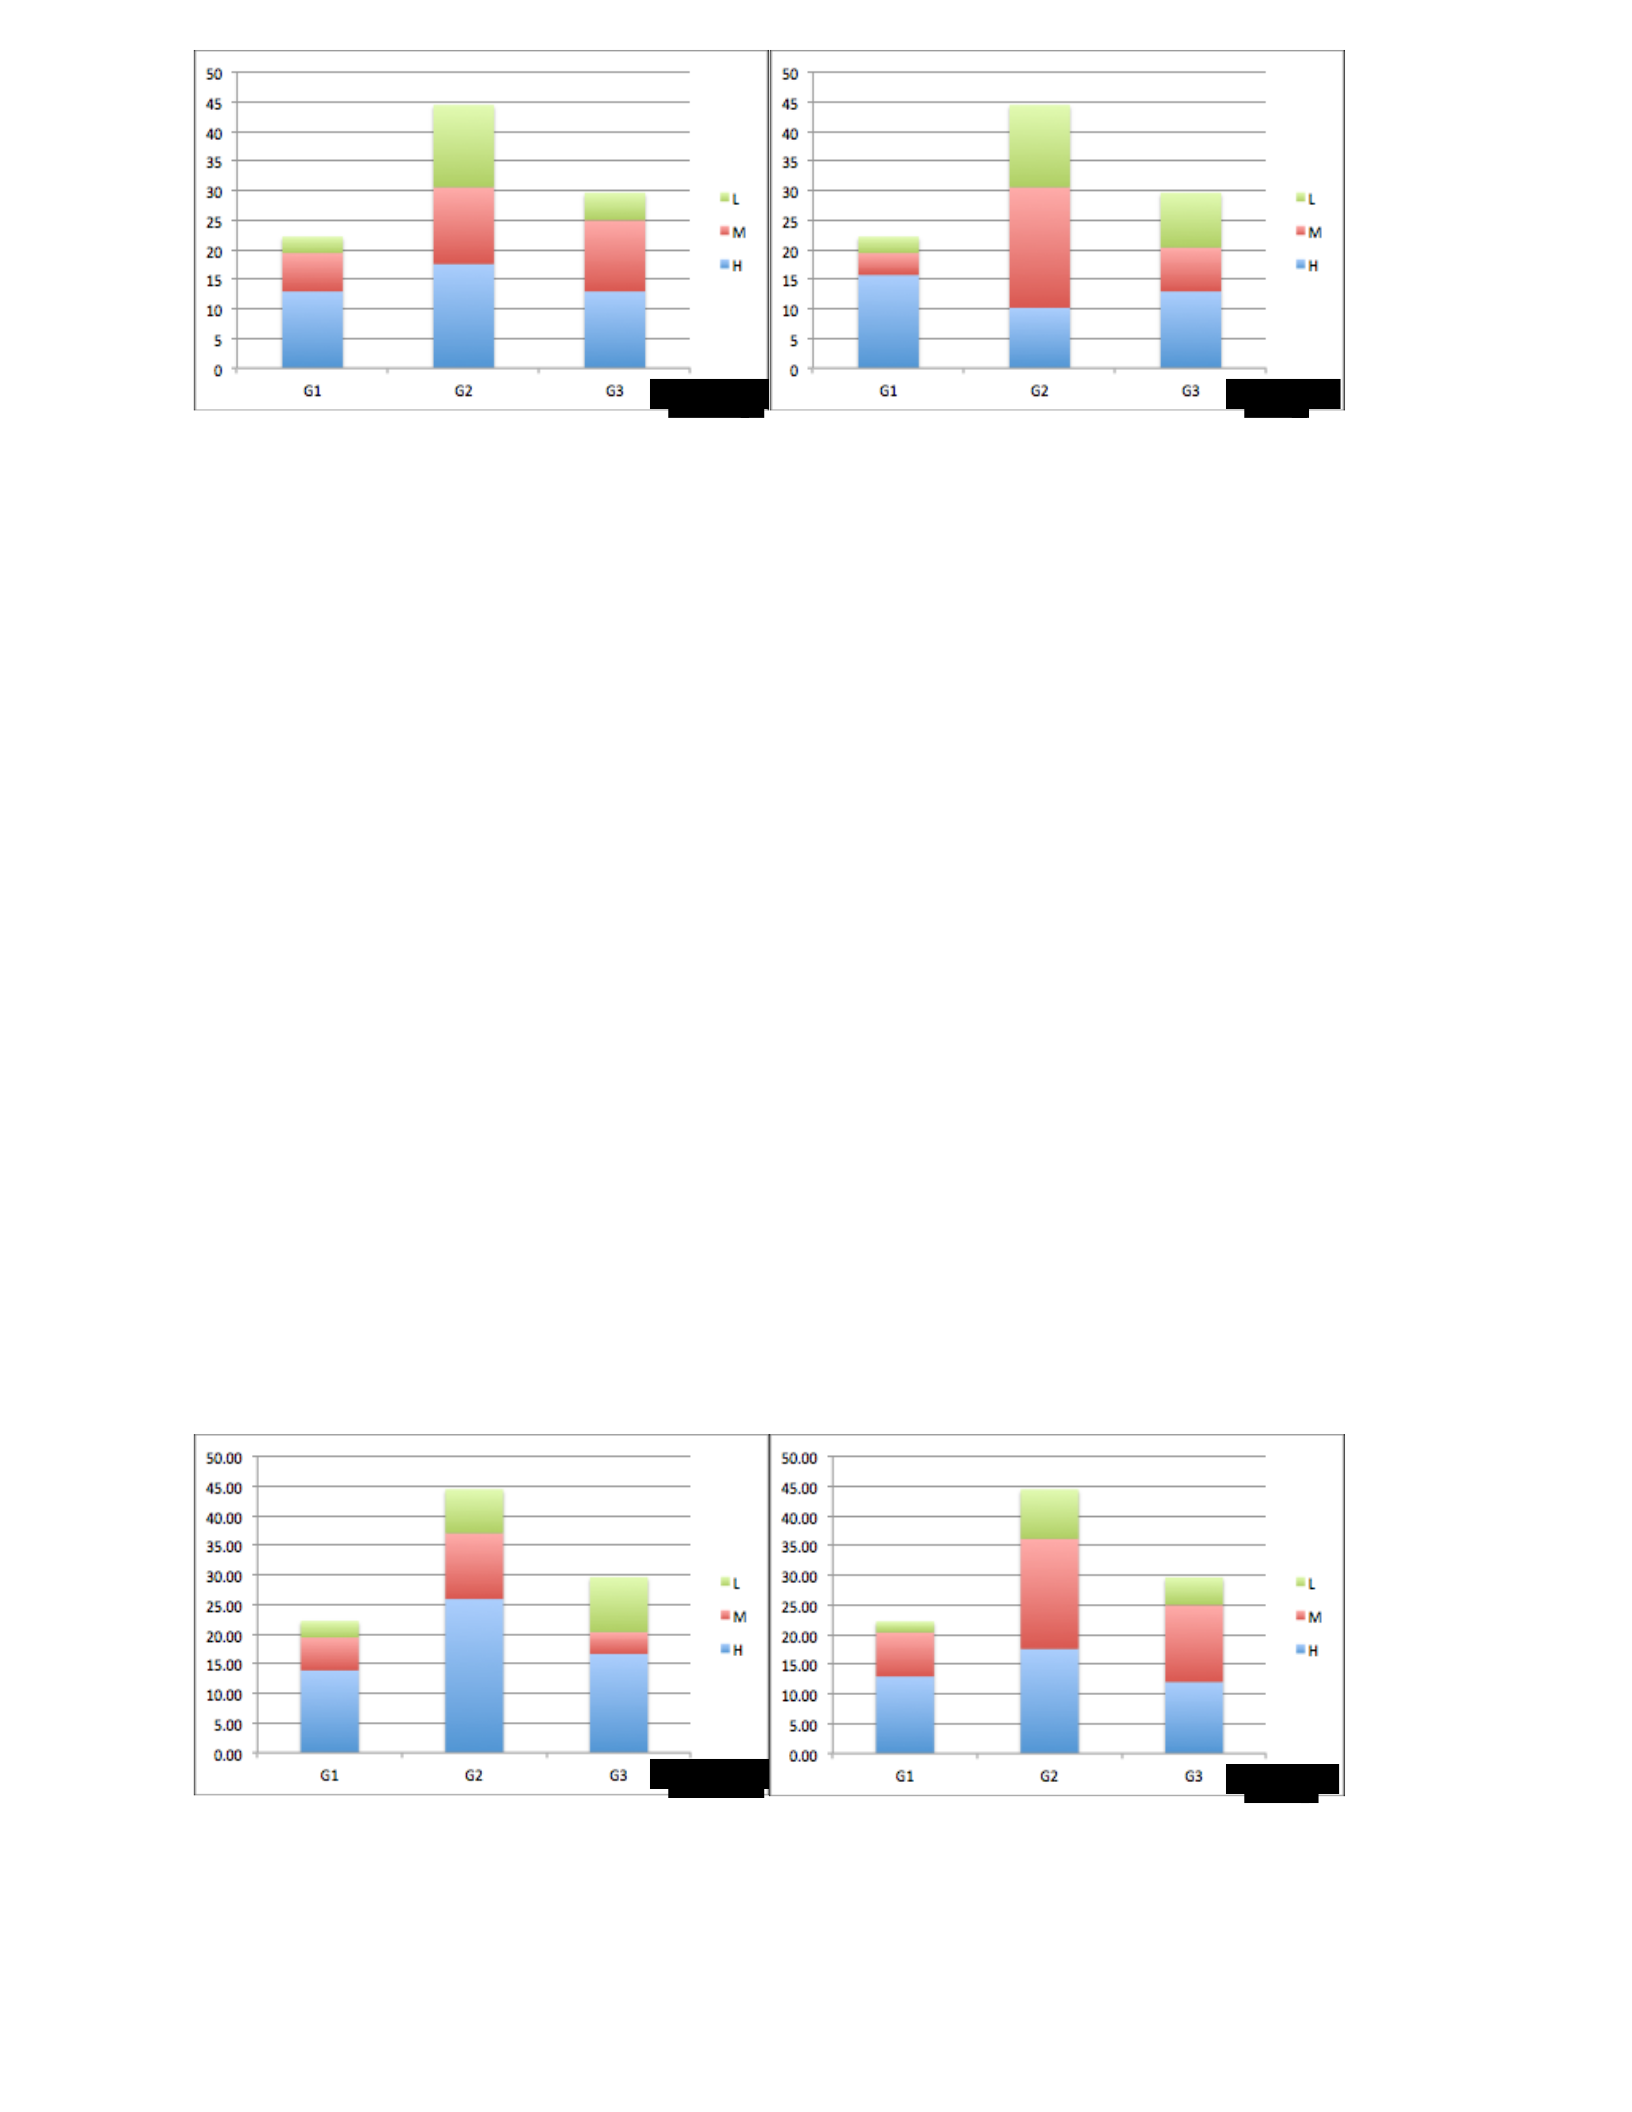
Figure 4.17: How the five main policy themes of the Crown Confections security policy were perceived by
participants whose age falls between 26 and 30 years old (before and after the breach).
To summarize, from the analysis above we can see that the people who work for organizations that
have level 5 information security policy believed that the policy process was the most important
aspect that should be taken into consideration when developing or updating security policy.
However, their perception was not stable. It was affected by the security incidents they have faced.
• SSE-CMM Level Four
The participants of this group were sub-grouped based on their age. They were grouped into three
groups: participants whose age was between 20 and 30 years old; participants whose age was
between 31 and 40 years old; and participants who were older than 40 years old. Figure 4.18 shows
how the five main policy themes of the Crown Confections security policy were perceived by
participants whose age was between 20 and 30 years old before and after the occurrence of the
security breach.
Figure 4.18: How the five main policy themes of the Crown Confections security policy were perceived by
participants whose age was between 20 and 30 years old (before and after the breach).
Before
Afte
r
Before
After
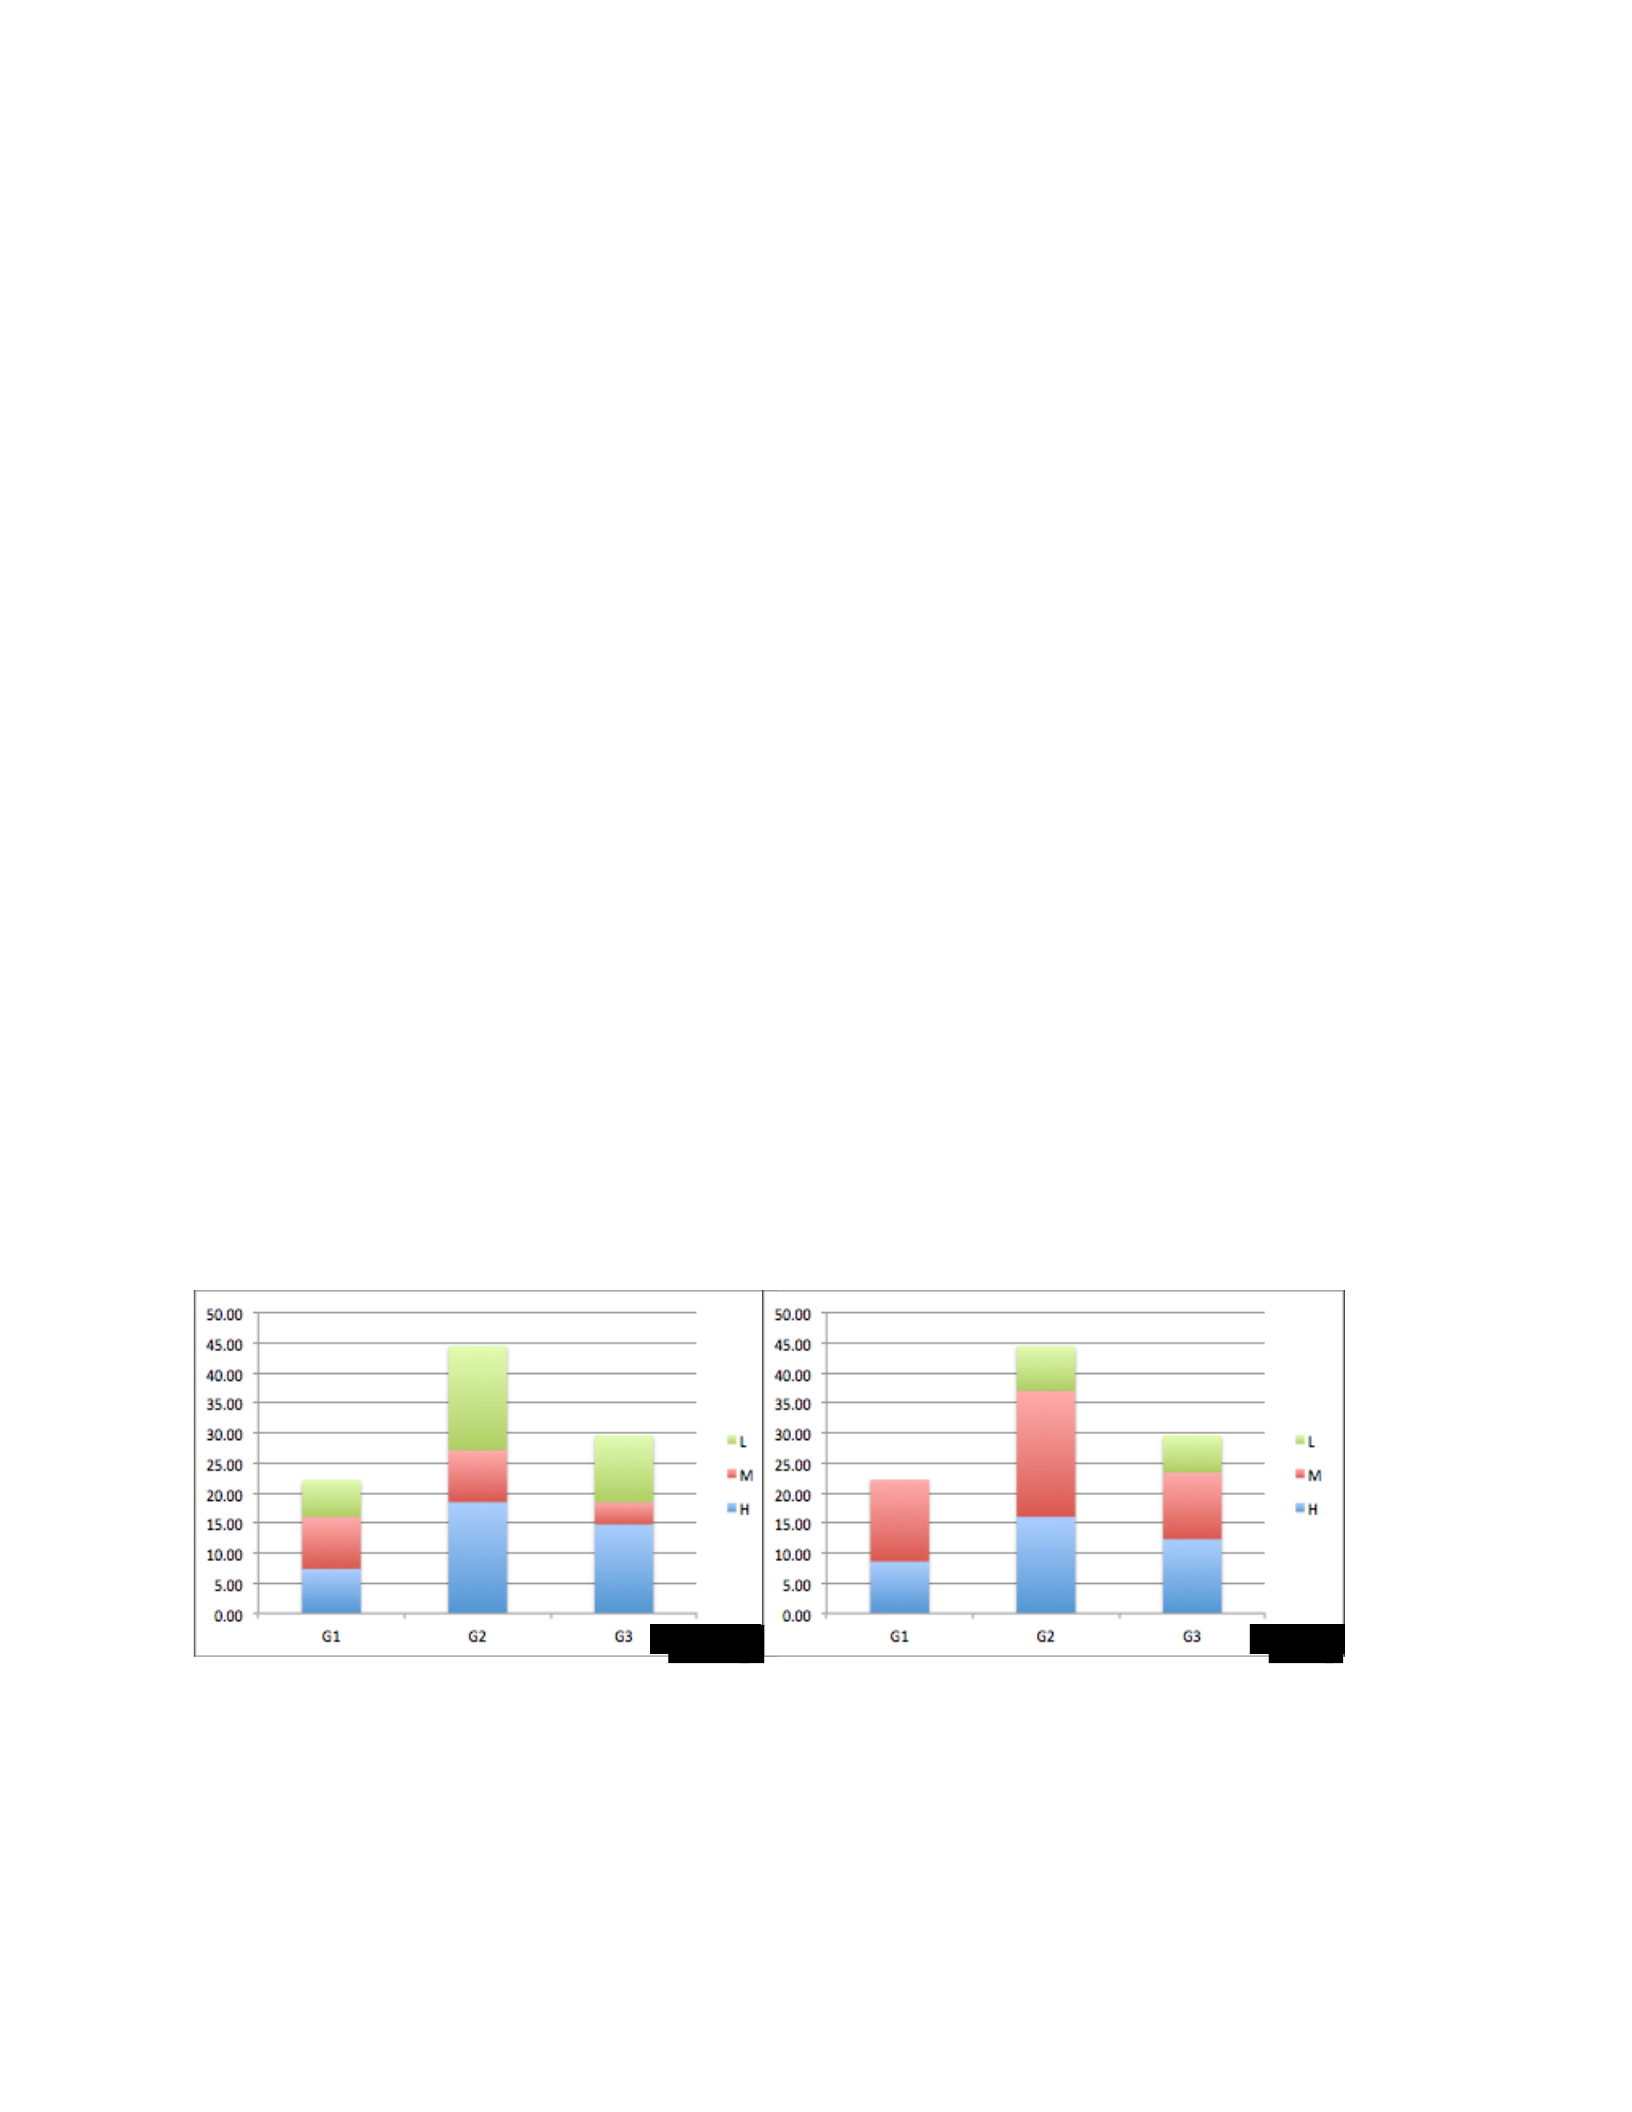
Figure 4.18 shows how the participants whose age was between 20 and 30 years old perceive the
security policy before the breach and how their perception differs after introducing the breach.
According to the charts, this group perceived that the constructs that related to security policy
process as the most significant security policy perceptions before and after the introduction of the
security breach. Here, the perception of this group of participants regarding the security policy
before and after the breach was mostly the same. However, the number of the constructs that got
high, medium, or low importance changed after introducing the breach. For example, 25.9% of the
constructs that are related to the G2 group are considered highly important before introducing the
breach. However, this percentage changed to 17.6% after the breach.
The same results were reached from the level 4 participants whose age was between 31 and 40
years old as it is shown in figure 4.19. This group of the participants perceived that the most
important security policy perceptions were those related to security policy process. The perception
of this group regarding the security policy before and after the breach was almost the same.
However, the number of the constructs with high, medium, or low importance level changed after
introducing the breach (refer to figure 4.19).
Figure 4.19: How the five main policy themes of the Crown Confections security policy were perceived by
participants whose age falls between 30 and 40 years old (before and after the breach).
Before
After
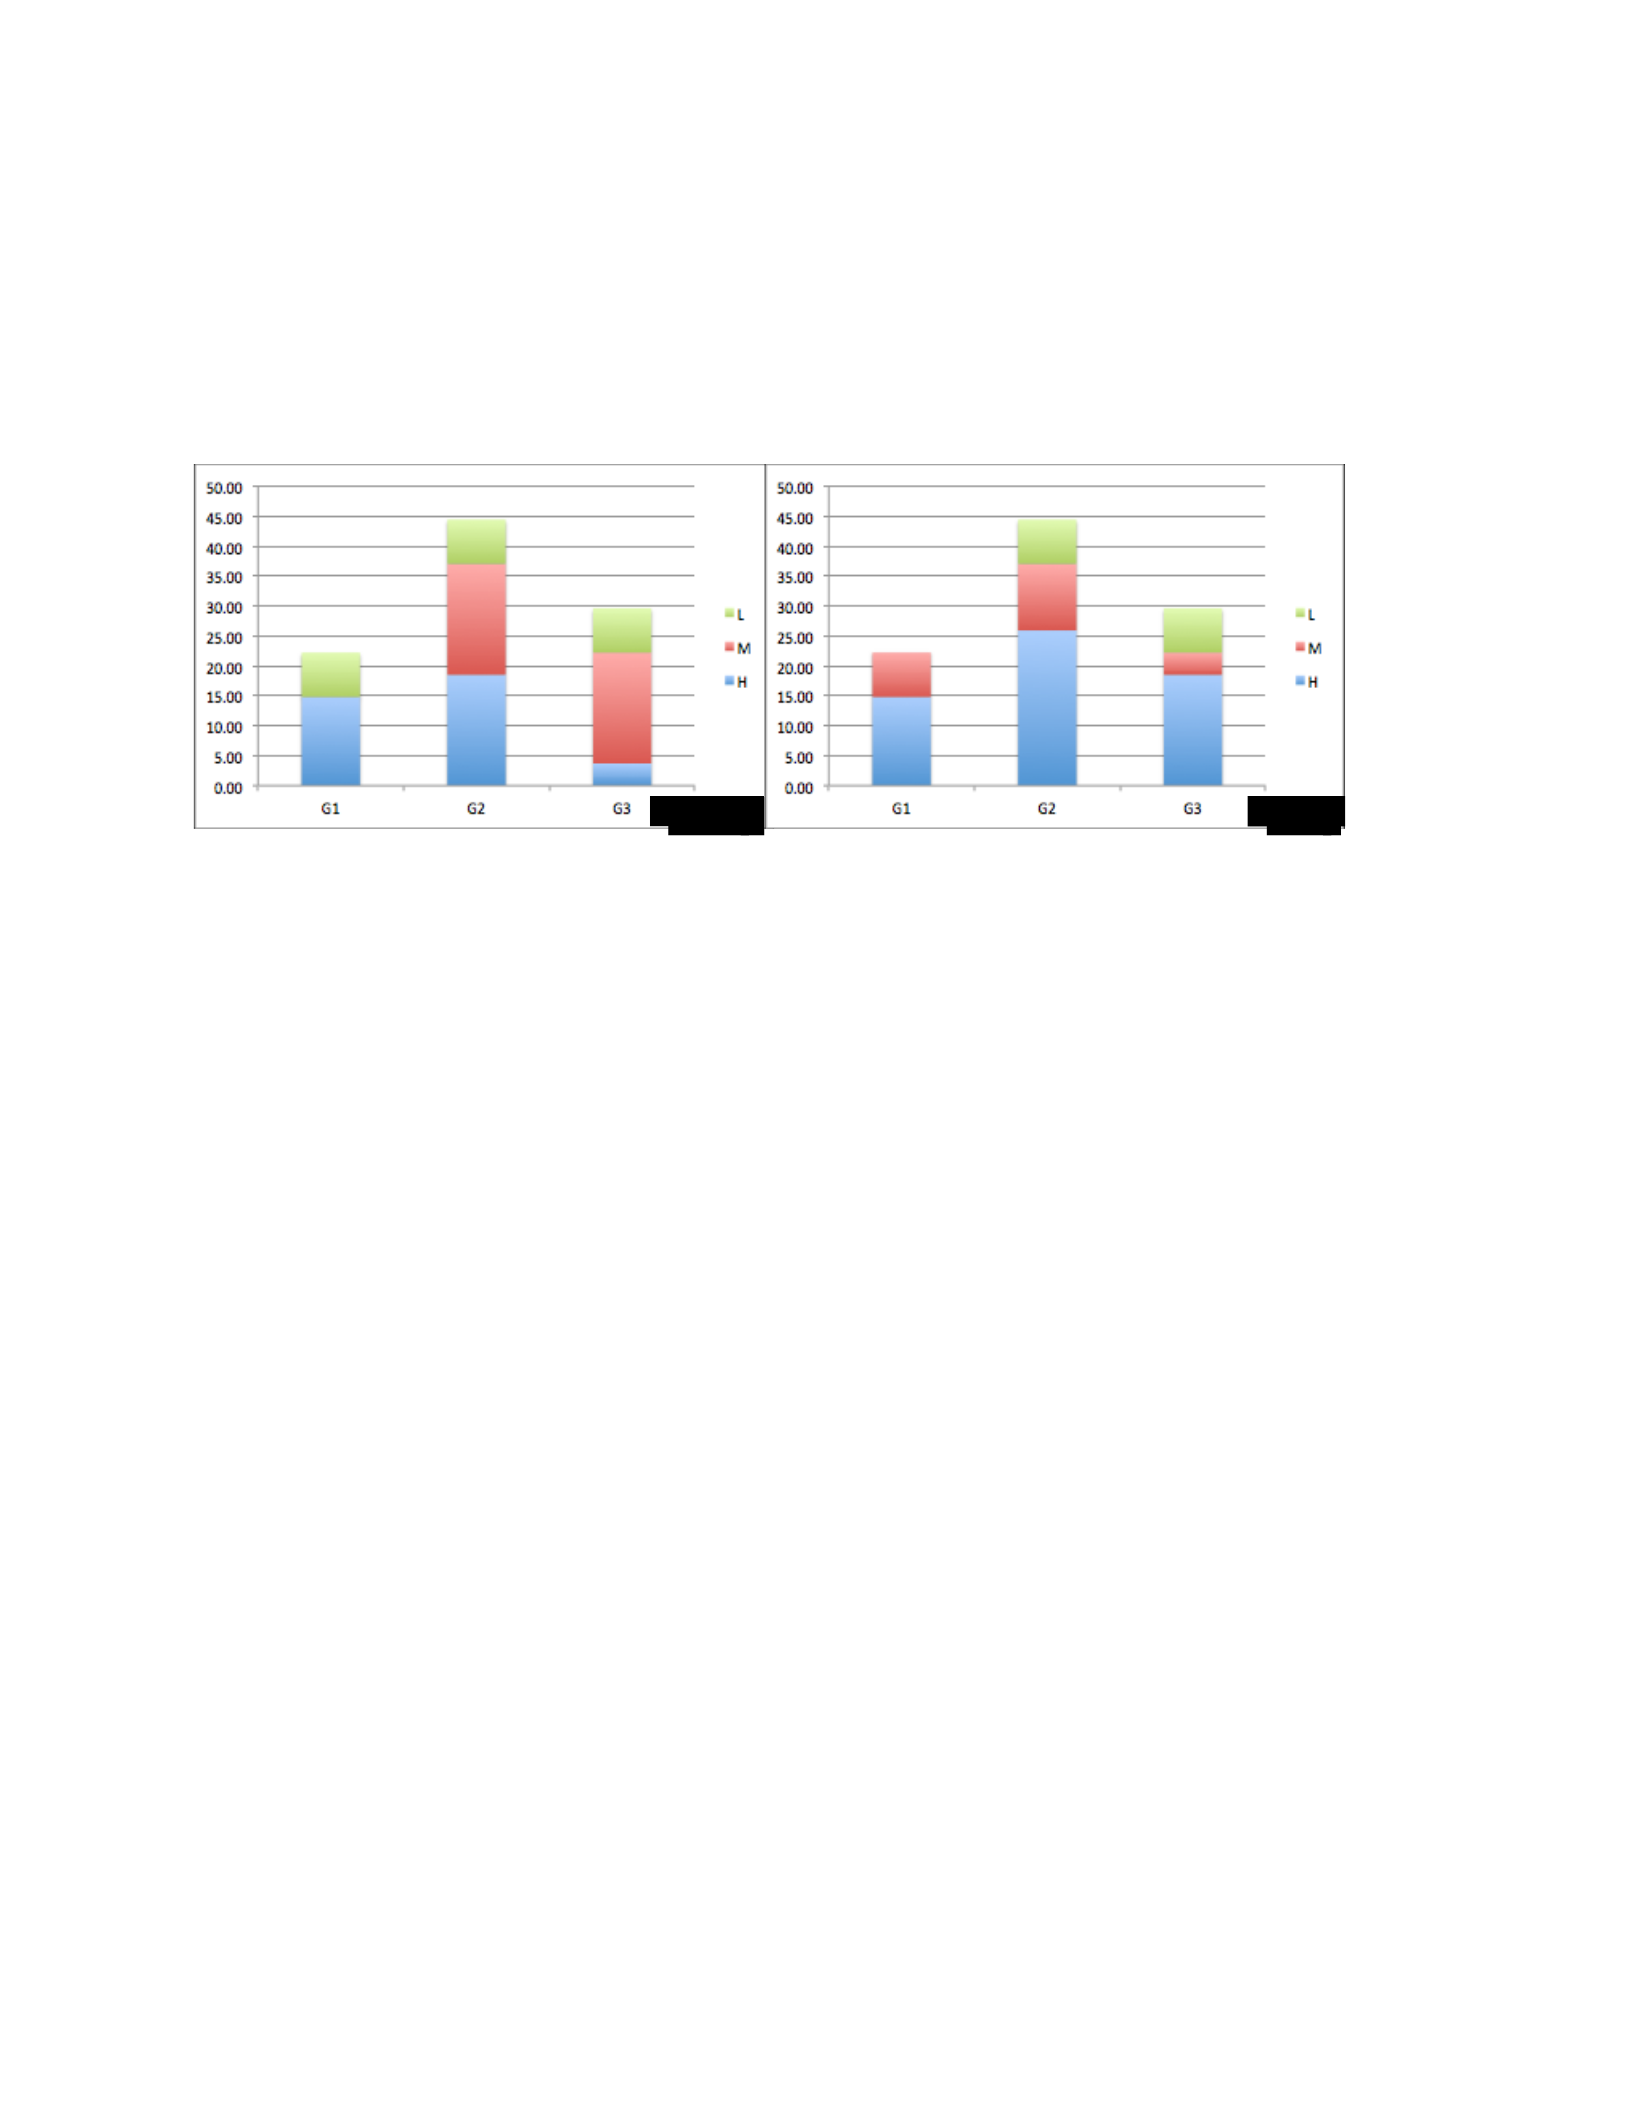
Finally, the level 4 participants who were older than 40 years old had very similar perceptions of
the policy before and after the breach especially for the constructs related to the G1 and G2 groups
as can be drawn from figure 4.20. However, for constructs related to the G3 group, the number of
constructs that were perceived as highly significant dramatically increased from 3.7% (before the
breach) to 18.5% (after the breach).
Figure 4.20: How the five main policy themes of the Crown Confections security policy were perceived by
participants whose are older than 40 years old (before and after the breach).
To summarize, from the analysis above we can see that the people who work for organizations that
have level 4 information security policy believed that the policy process was the most important
aspect that should be taken into consideration when developing or updating security policy.
However, their perception was not stable. It was affected by the security incidents they have faced.
• SSE-CMM Level Three
The participants of this group were grouped into three groups; participants whose age was between
20 and 30 years old, participants whose age was between 31 and 40 years old and participants who
were older than 40 years old. Figure 4.21 shows how the five main policy themes of the Crown
Confections security policy were perceived by participants whose age was between 20 and 30 years
old before and after the occurrence of the security breach.
Before
After
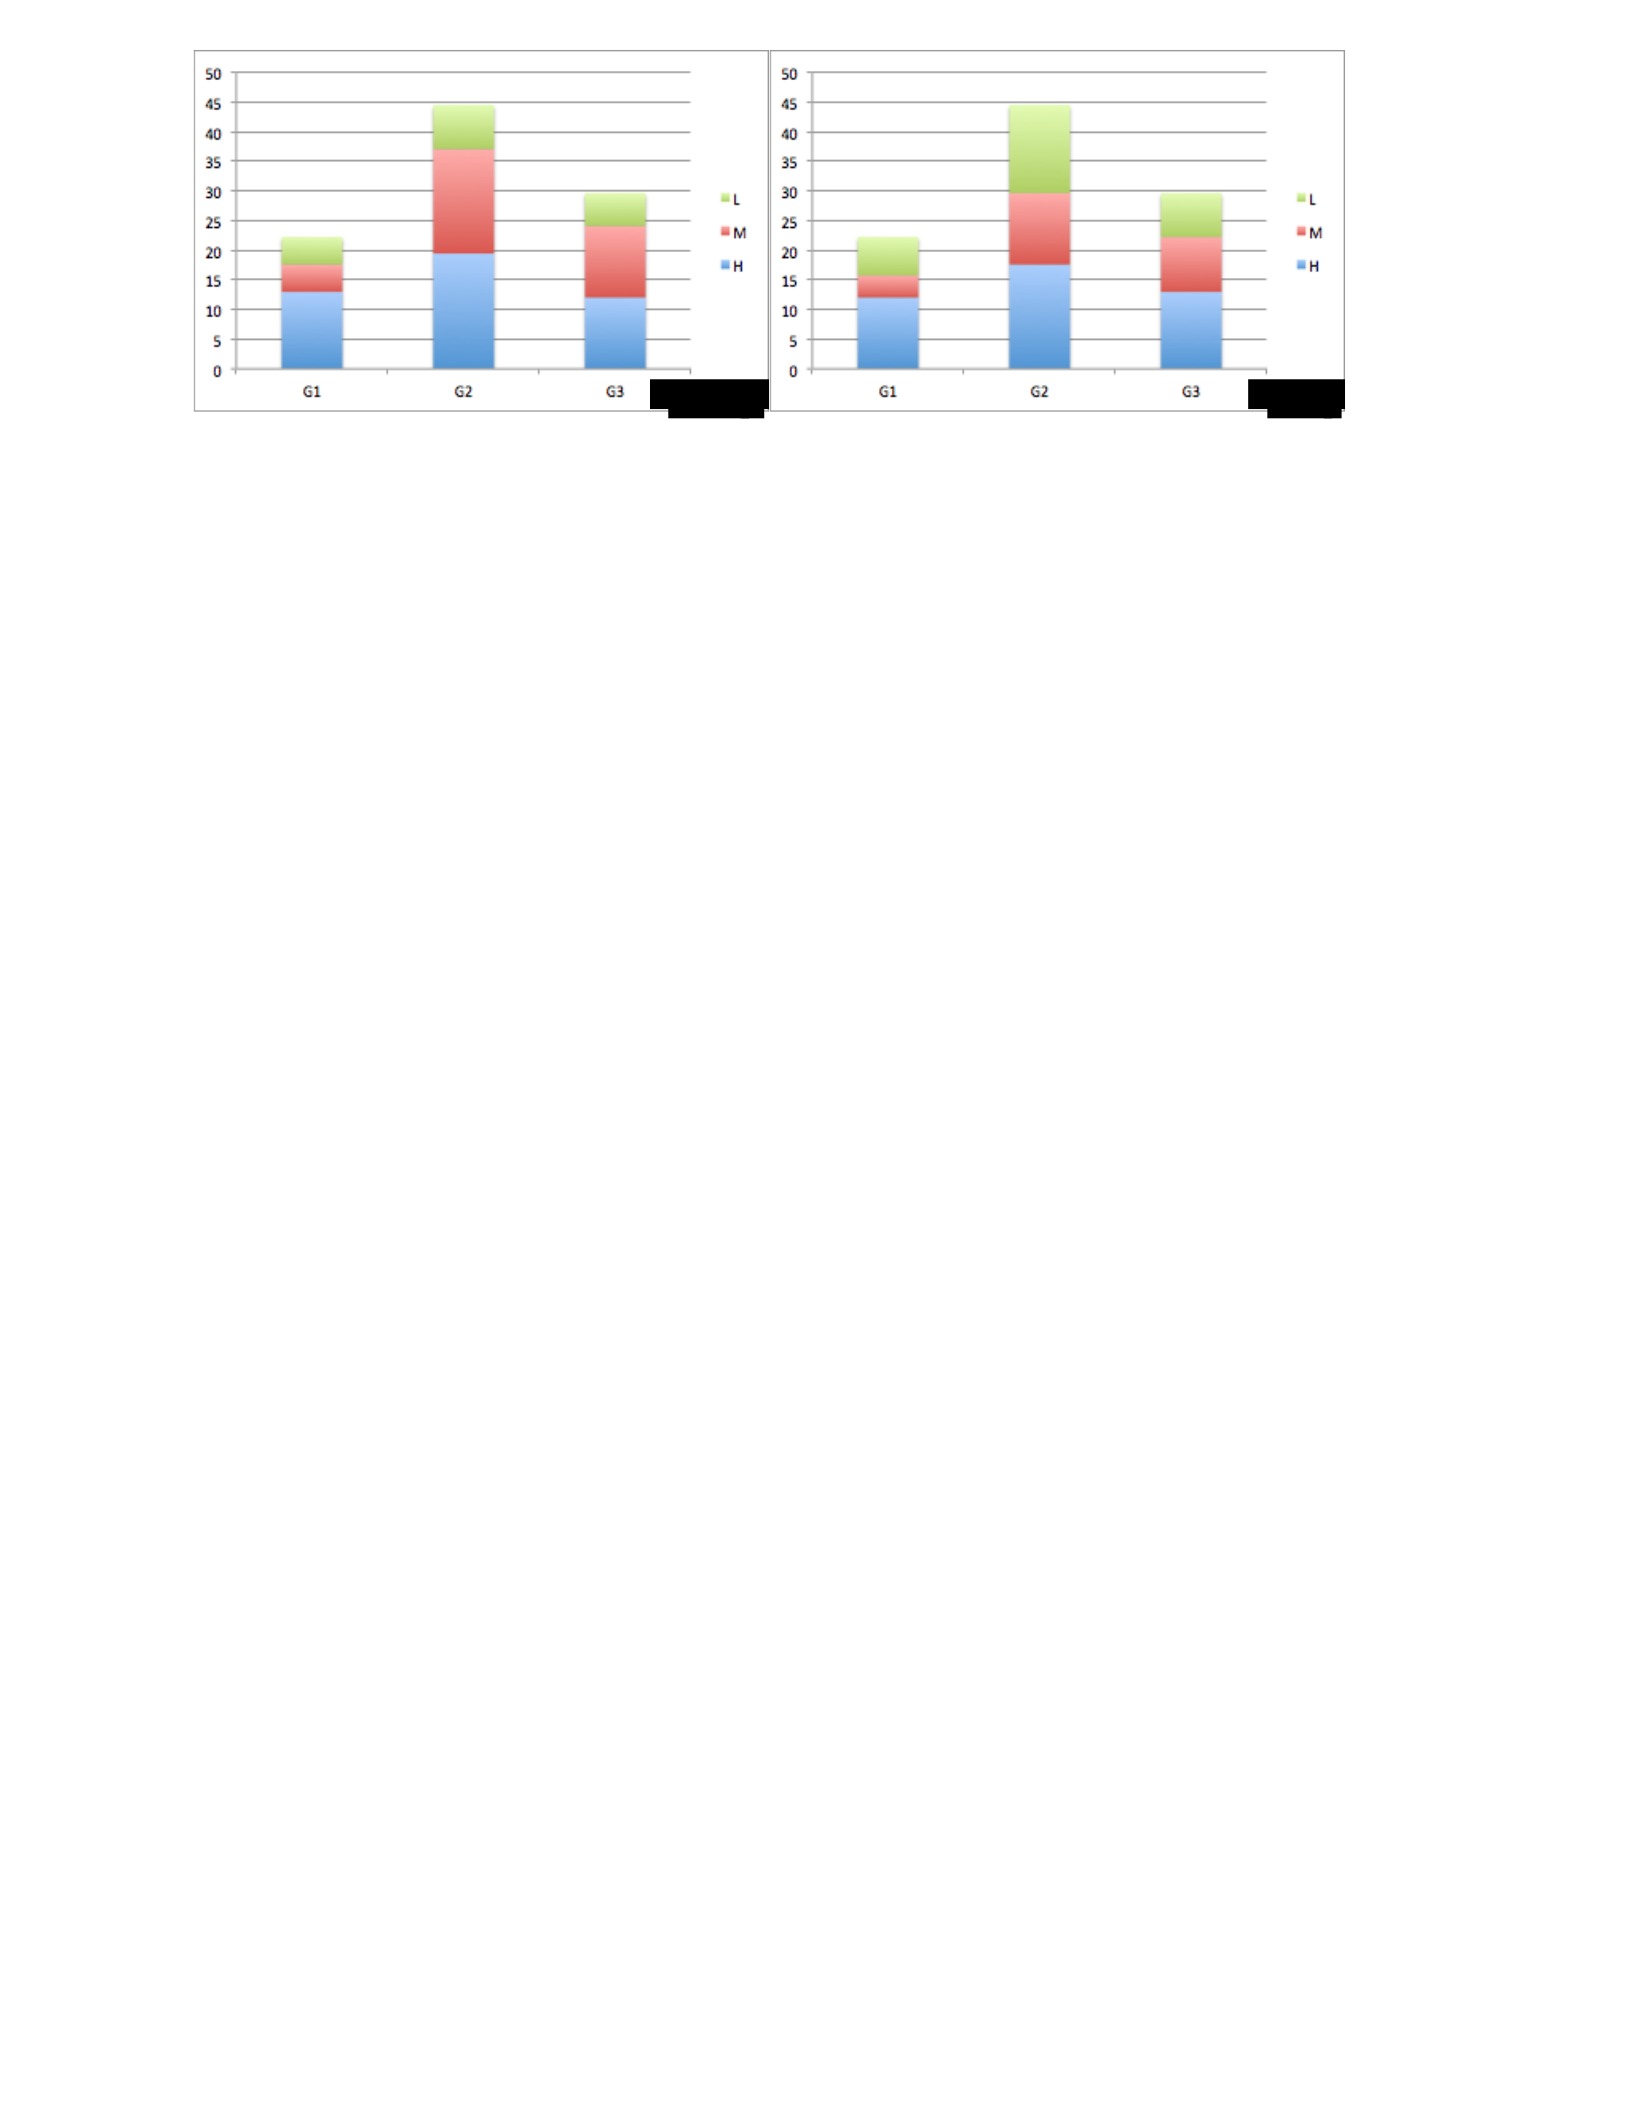
Figure 4.20: How the five main policy themes of the Crown Confections security policy were perceived
by participants whose age was between 20 and 30 years old (before and after the breach).
Figure 4.21 shows how the participants whose age was between 20 and 30 years old perceived the
security policy before and how their perception differs after introducing the breach. According to
the charts, this group perceived that the constructs related to security policy process to be the most
significant security policy perceptions before and after the introduction of the security breach.
Here, the perception of this group of the participants regarding the security policy before and after
the occurrence of the breach was very close. However, the number of the constructs related to the
G2 group that were considered as high, medium, or low important changed after introducing the
breach. For example, 19.4% of the constructs that are related to the G2 group were considered as
highly important before introducing the breach. However, this percentage changed to 17.6% after
the breach.
Although, before the breach level 3 participants whose age was between 31 and 40 years old (as it
is shown in figure 4.22) perceived that the most important security policy perceptions were those
related to security policy process. After the breach, the perception of this group was changed. They
perceived the constructs related to the policy content as the highest significant group. The
perception of this group regarding the security policy before and after the breach changed, per
figure 4.22.
Before
After
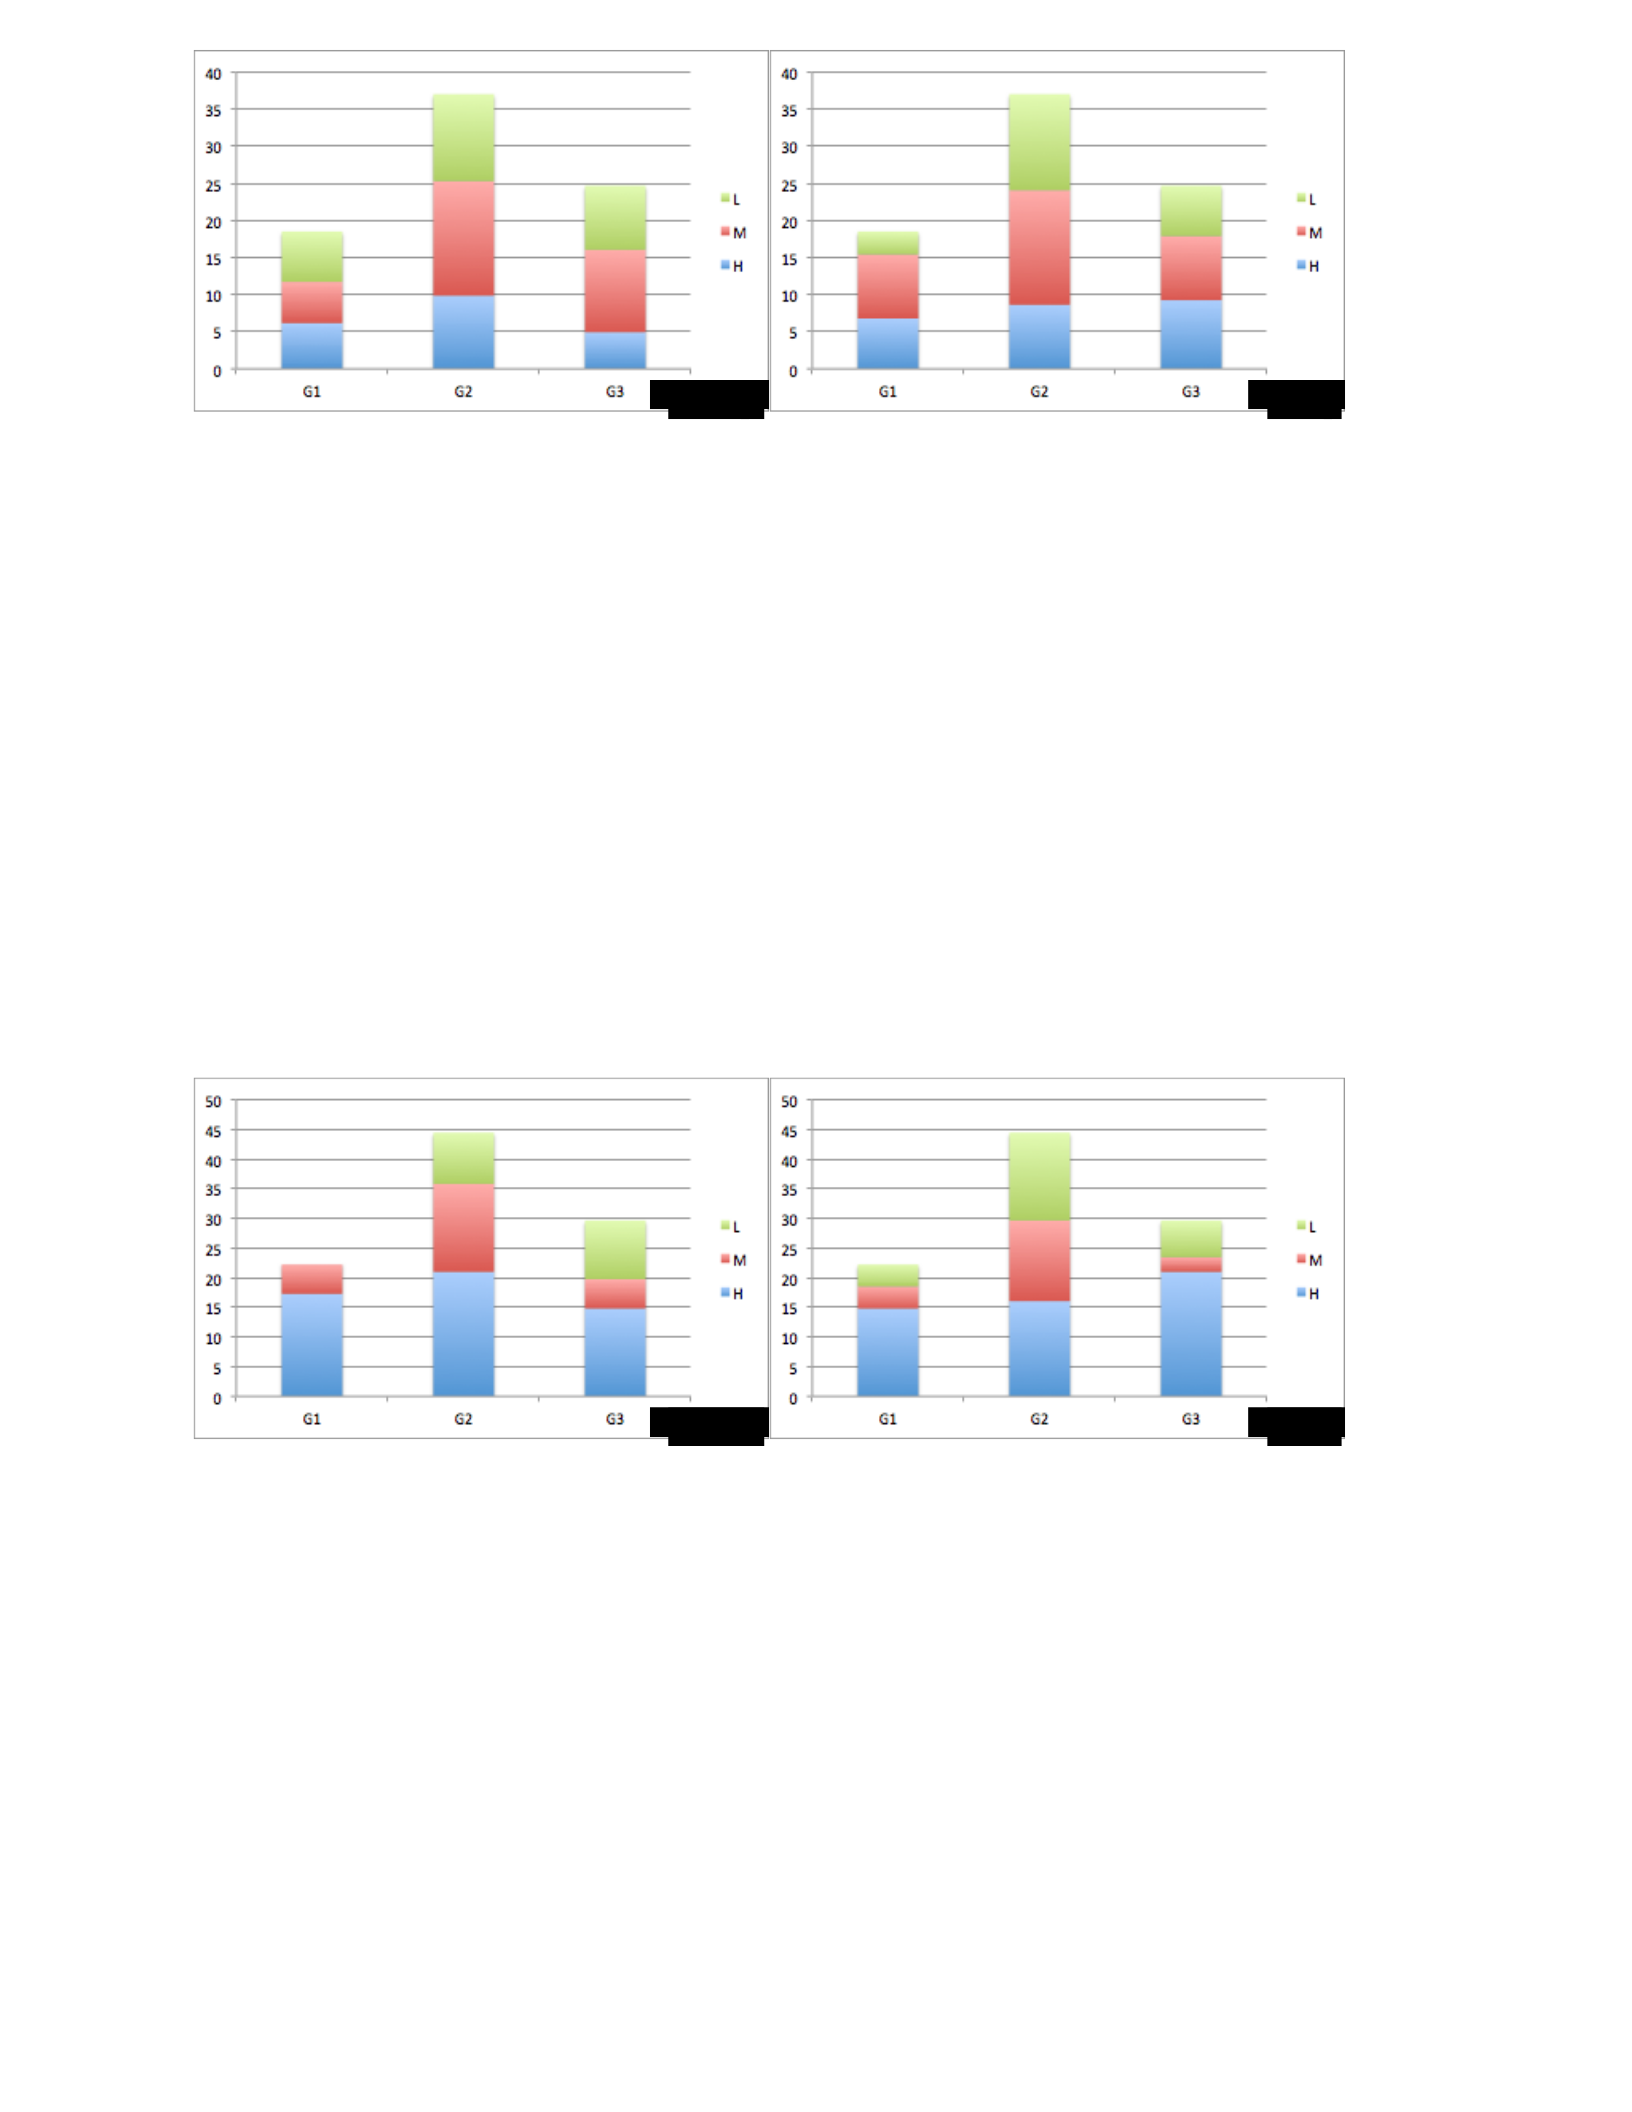
Figure 4.22: How the five main policy themes of the Crown Confections security policy were perceived by
participants whose age falls between 30 and 40 years old (before and after the breach).
The same results were drawn from the level 3 participants who were older than 40 years old. Before
the breach, they perceived that the most important security policy perceptions are those related to
security policy process. After the breach, the perception of this group changed. They perceive the
constructs related to the policy content as the highest significant group (refer to figure 4.23). In
general, the number of constructs that were rated as “high” significant in all of the three groups
increased after the occurrence of the security breach.
Figure 4.23: How the five main policy themes of the Crown Confections security policy were perceived by
participants whose are older than 40 years old (before and after the breach).
To summarize, the analysis above shows that people who work for organizations with a level 3
information security policy believed that the policy process is the most important aspect that should
be taken into consideration when developing or updating security policy. However, their perception
was not stable. It was affected by the security incidents they have faced.
• SSE-CMM Level Two
Before
After
Before
After
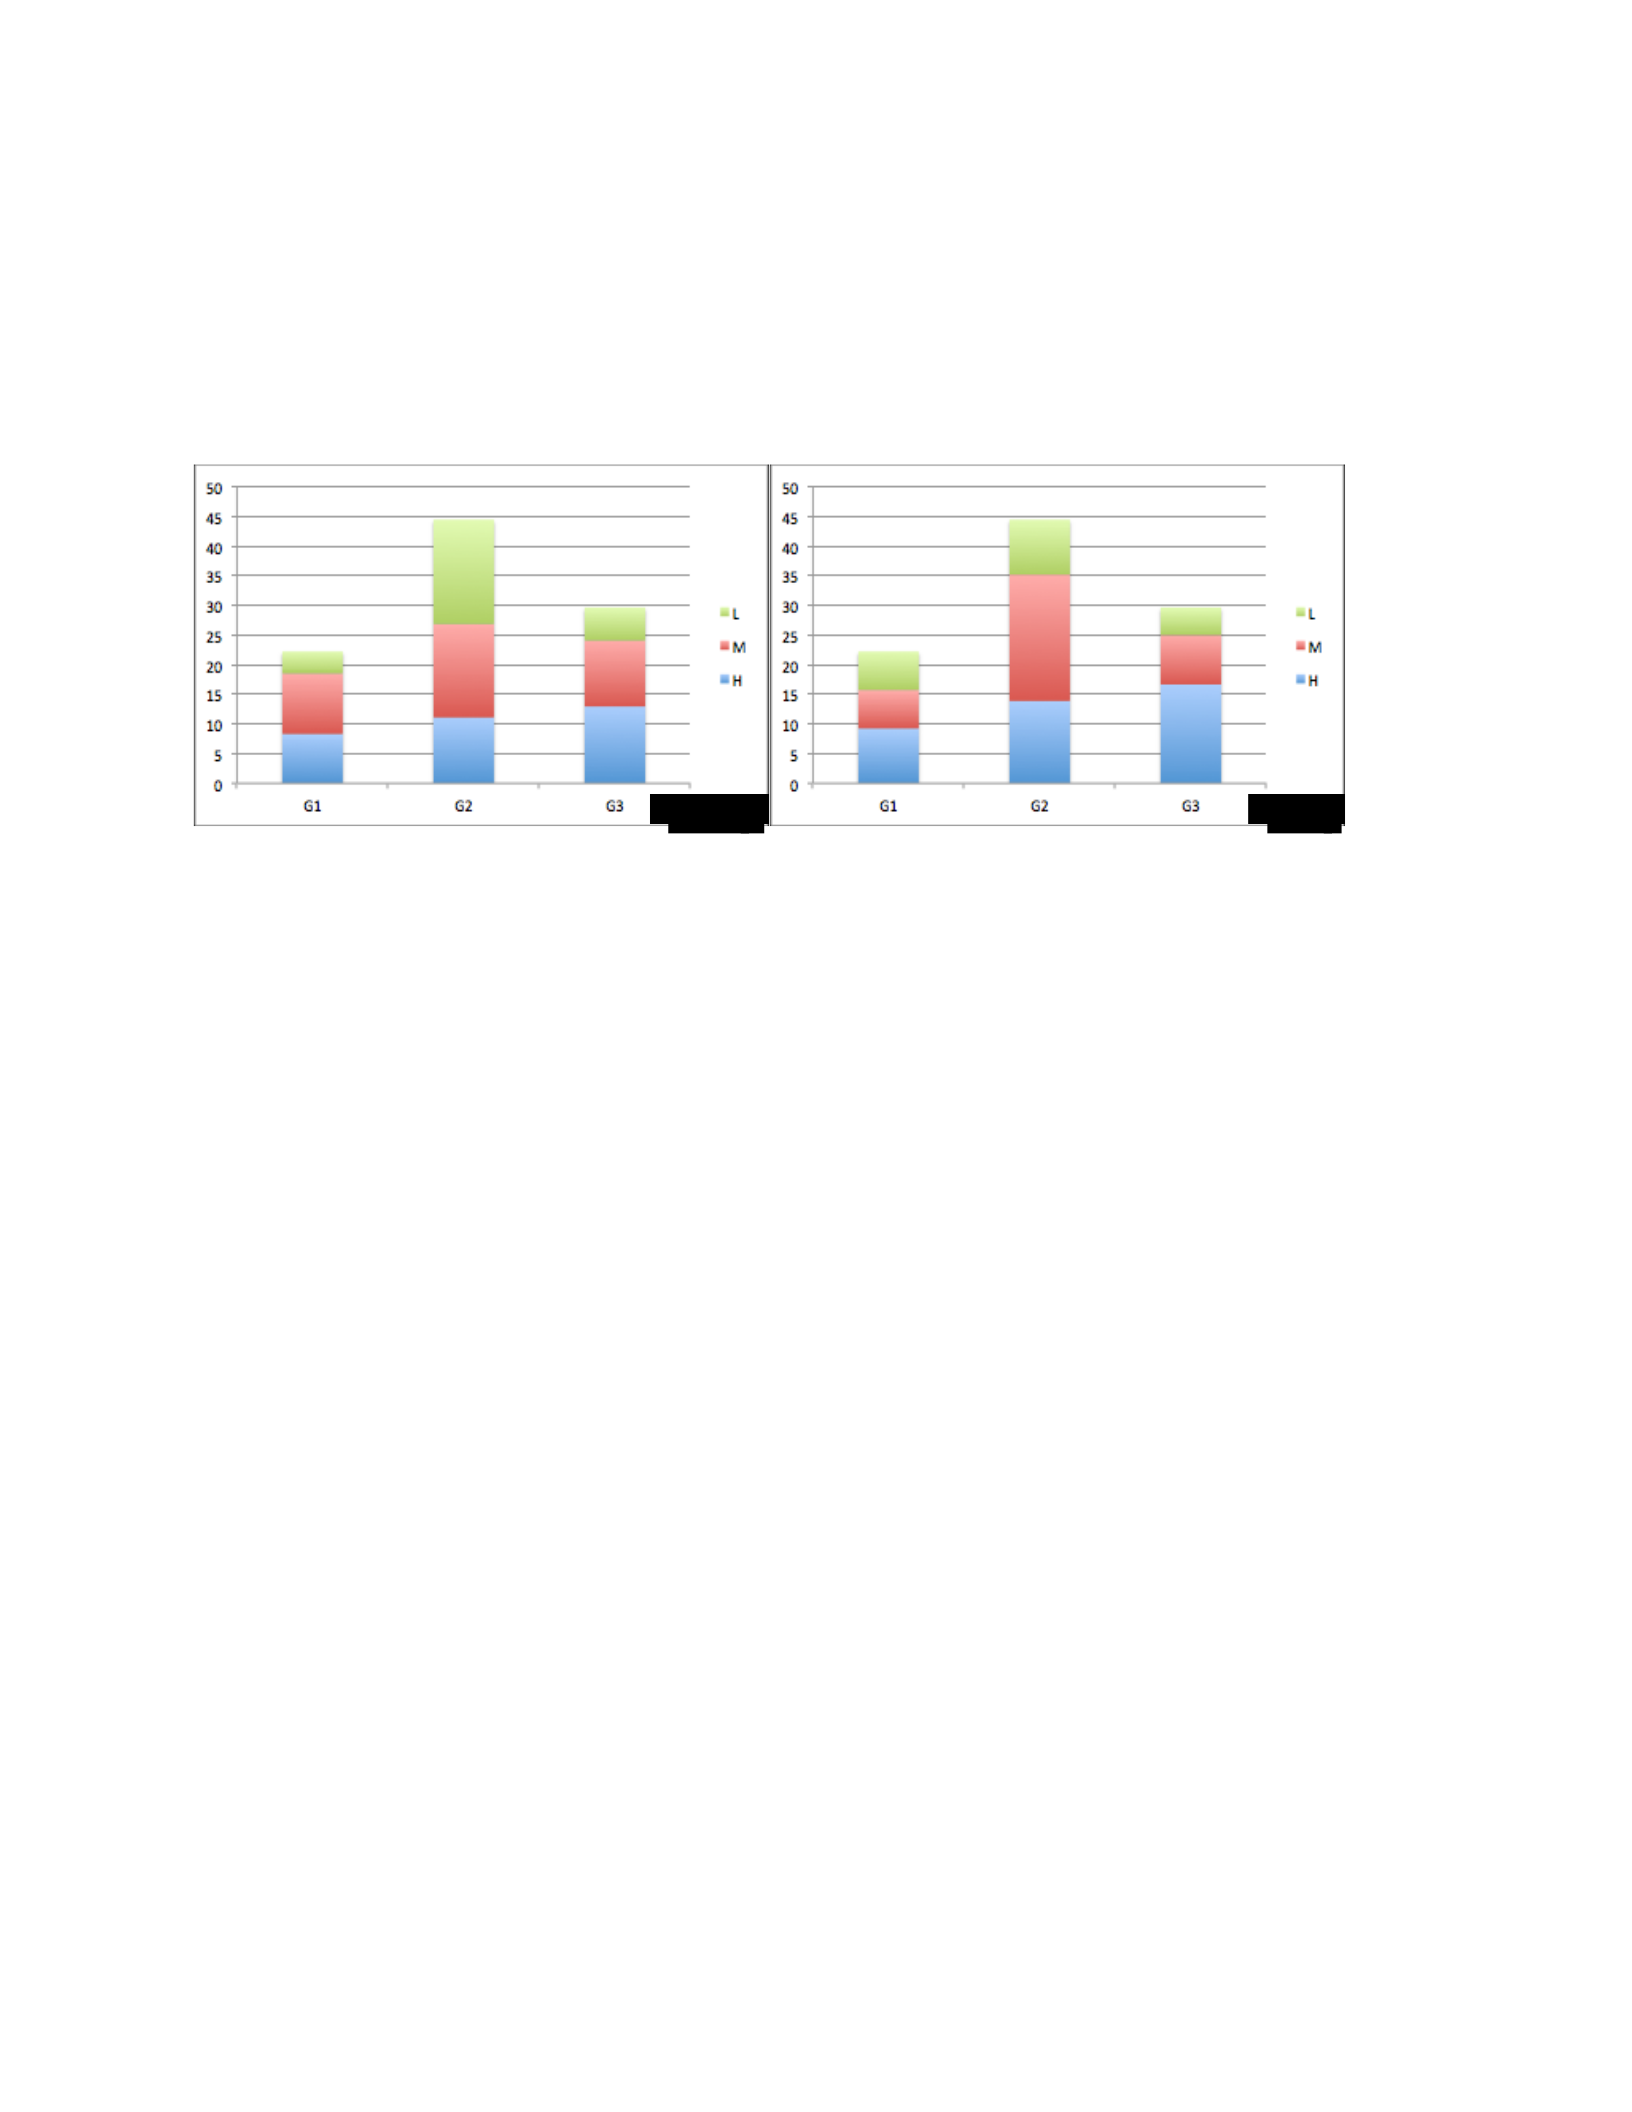
The participants of this group were grouped into three groups: participants whose age was between
18 and 25 years old; participants whose age was between 26 and 35 years old; and participants
who were older than 35 years old. Figure 4.24 shows how the five main policy themes of the Crown
Confections security policy were perceived by participants whose age was between 18 and 25 years
old before and after the occurrence of the security breach.
Figure 4.24: How the five main policy themes of the Crown Confections security policy were perceived by
participants whose age falls between 18 and 25 years old (before and after the breach).
As can be seen from figure 4.24, the participants whose age was between 20 and 30 years old
perceive that the constructs related to security policy content. Here, the perception of this group of
the participants regarding the security policy before and after the breach was very close. However,
the number of the constructs related to each group that was considered as high, medium, or low
important changed after introducing the breach. For example, 12.9% of the constructs that are
related to the G3 group are considered highly important before introducing the breach. However,
this percentage changed to 16.7% after the breach.
The level 2 participants whose age was between 31 and 40 years old had different perception
regarding the security policy. This group perceived that the most important security policy
perceptions were those related to security policy process. The perception of this group of the
participants regarding the security policy before and after the breach was very similar. However,
the number of constructs that were perceived as highly significant in all of the groups increased
Before
After
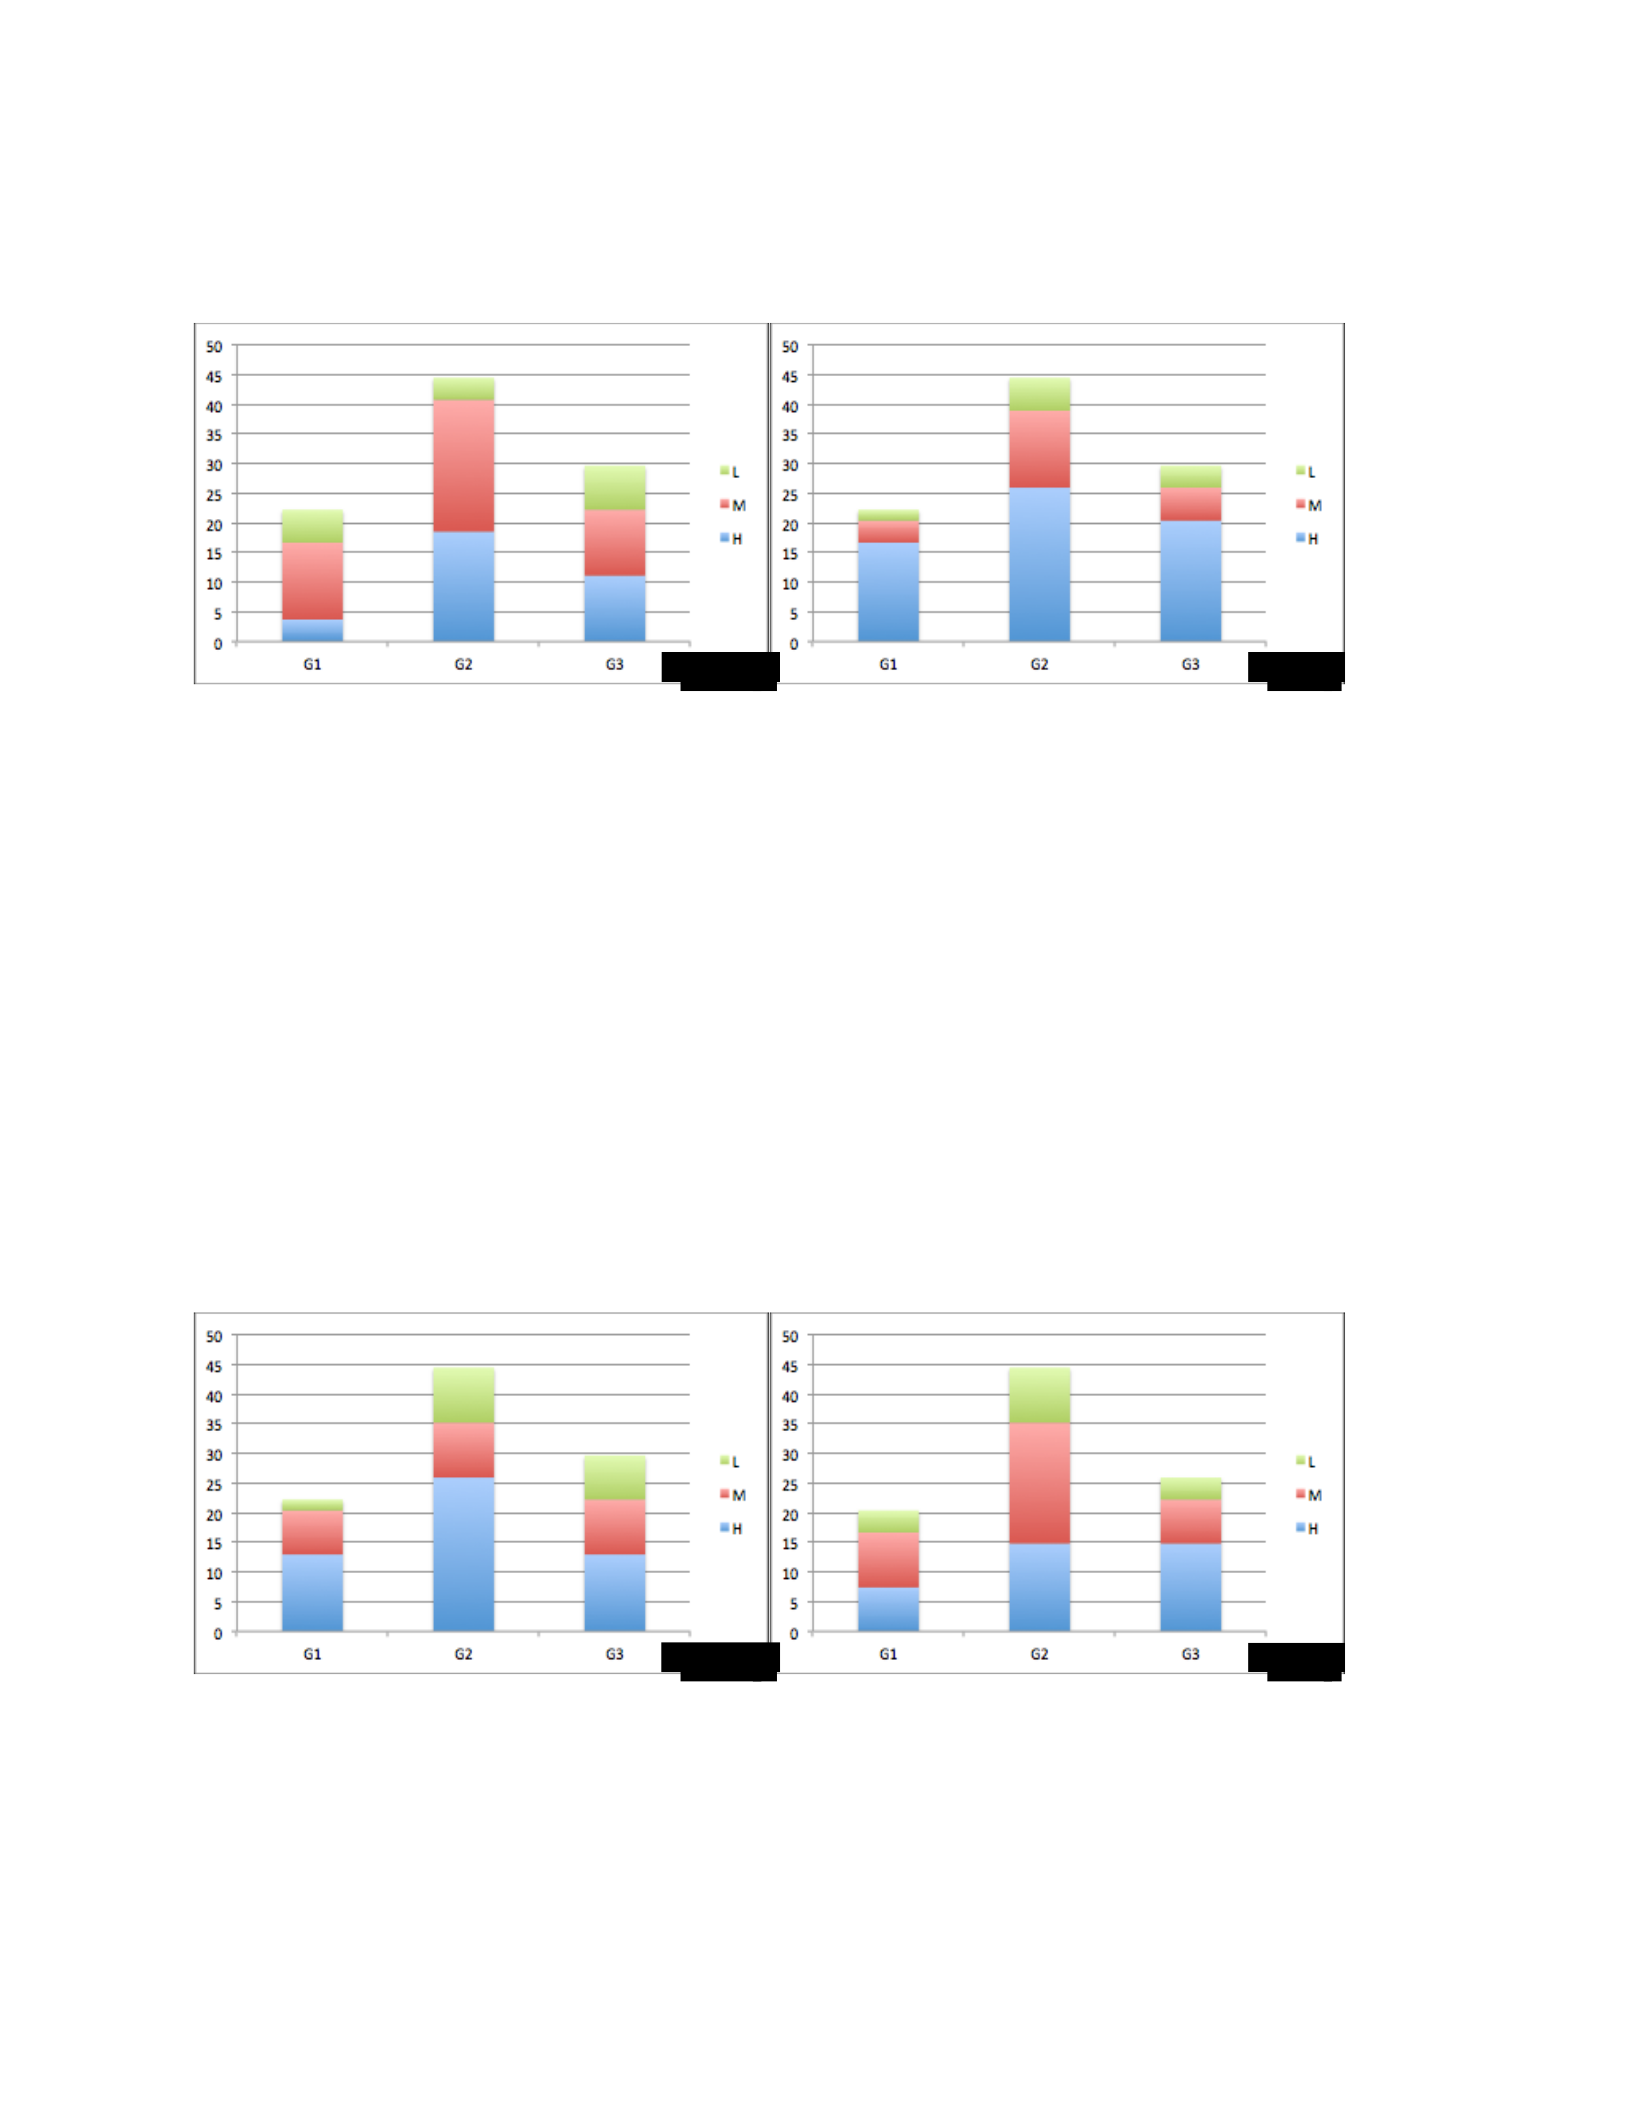
after the occurrence of the breach (refer to figure 4.25). For example, 3.7% of the constructs that
related to the G1 group were considered the highest significant before introducing the breach.
After introducing the breach, this percentage changed to 16.7%.
Figure 4.25: How the five main policy themes of the Crown Confections security policy were perceived by
participants whose age falls between 26 and 35 years old (before and after the breach).
Finally, different results were drawn from the level 2 participants who were older than 35 years
old. Before the breach, they perceived that the most important security policy perceptions were
those related to security policy process. After the breach, the perception of this group changed.
They then perceive the constructs related to both the policy process and policy content as the
highest significant (refer to figure 4.26).
Figure 4.26: How the five main policy themes of the Crown Confections security policy were perceived by
participants whose are older than 35 years old (before and after the breach).
Before
After
Before
After
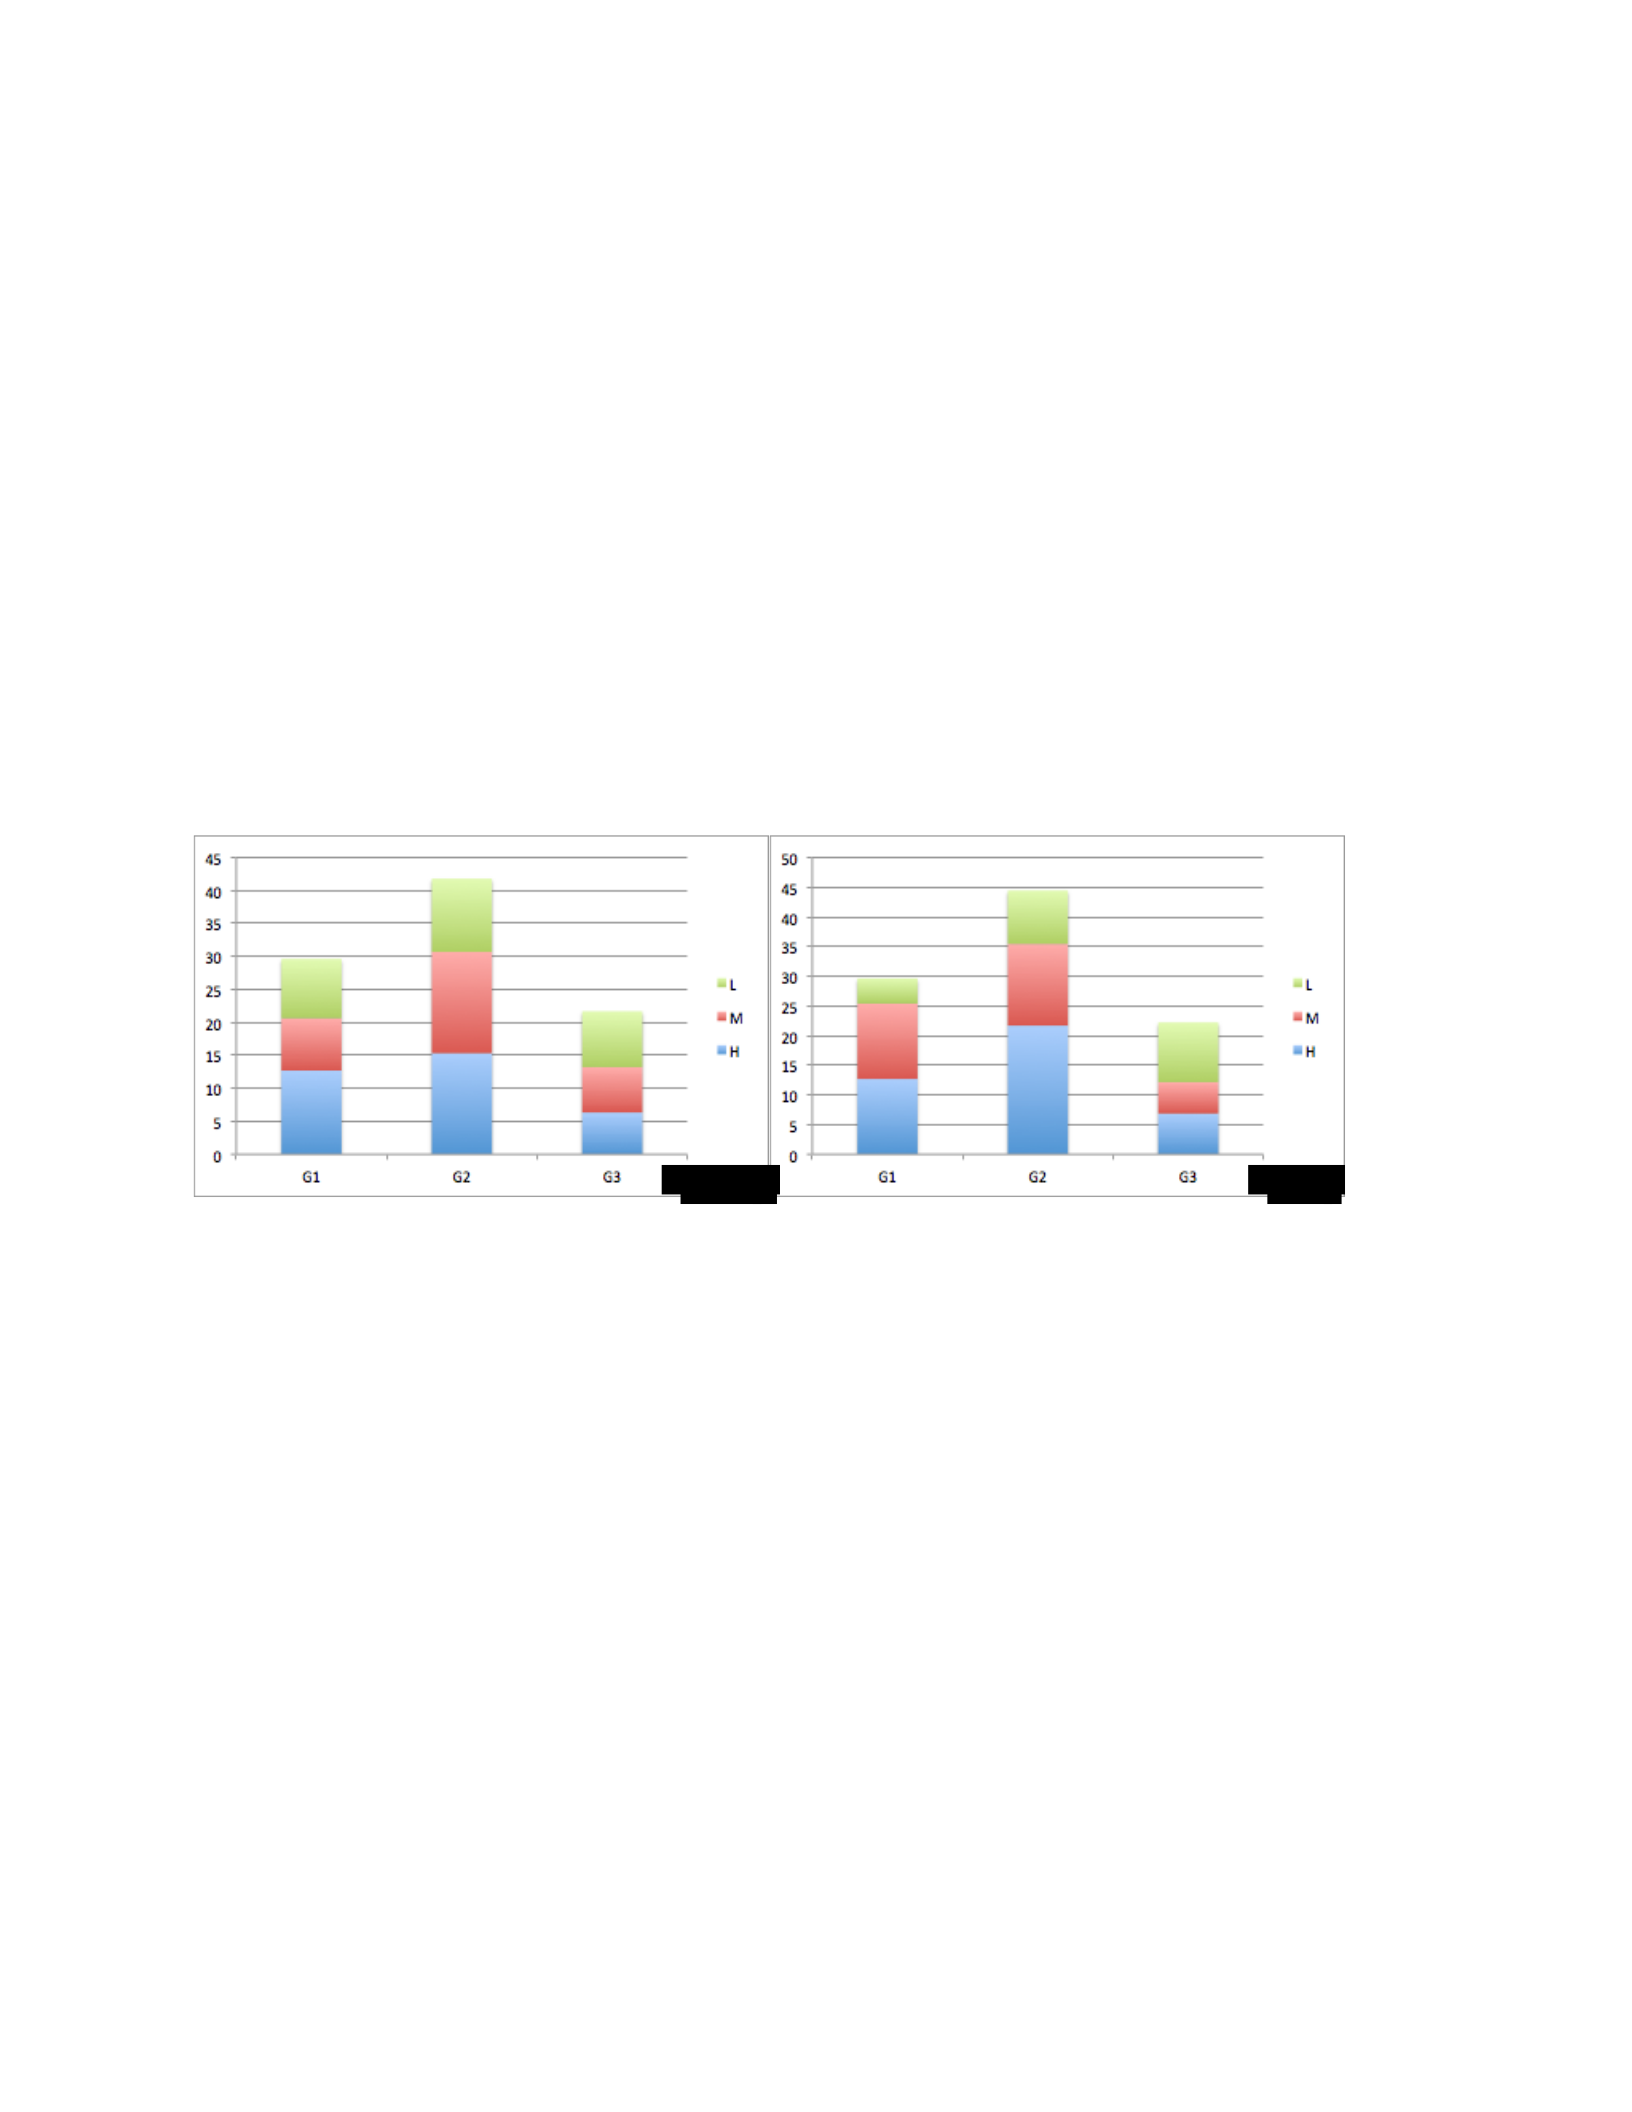
To summarize, the analysis above shows that people who was older than 35 years and who work
for organizations that have level 2 information security policy believed that the policy process was
the most important aspect that should be taken into consideration when developing or updating
security policy. However, their perception was not stable, being affected by the security incidents
respondents have faced.
• SSE-CMM Level One
The participants of this group were grouped into three groups: participants whose age was between
20 and 30 years old; participants whose age was between 31 and 40 years old; and participants
who were older than 40 years old. Figure 4.27 shows how the five main policy themes of the Crown
Confections security policy were perceived by participants whose age was between 20 and 30 years
old before and after the occurrence of the security breach.
Figure 4.27: How the five main policy themes of the Crown Confections security policy were perceived by
participants whose age falls between 20 and 30 years old (before and after the breach).
This chart shows how the participants whose age was between 20 and 30 years old perceived the
security policy before and how their perception differed after introducing the breach. According to
the charts, this group perceived that the constructs related to security policy process were the most
significant security policy perceptions before and after the introduction of the security breach.
Here, the perception of this group of the participants regarding the security policy before and after
the breach was very similar. However, the number of the constructs that were considered as high,
medium, or low important changed after introducing the breach. For example, 15.3% of the
Before
After
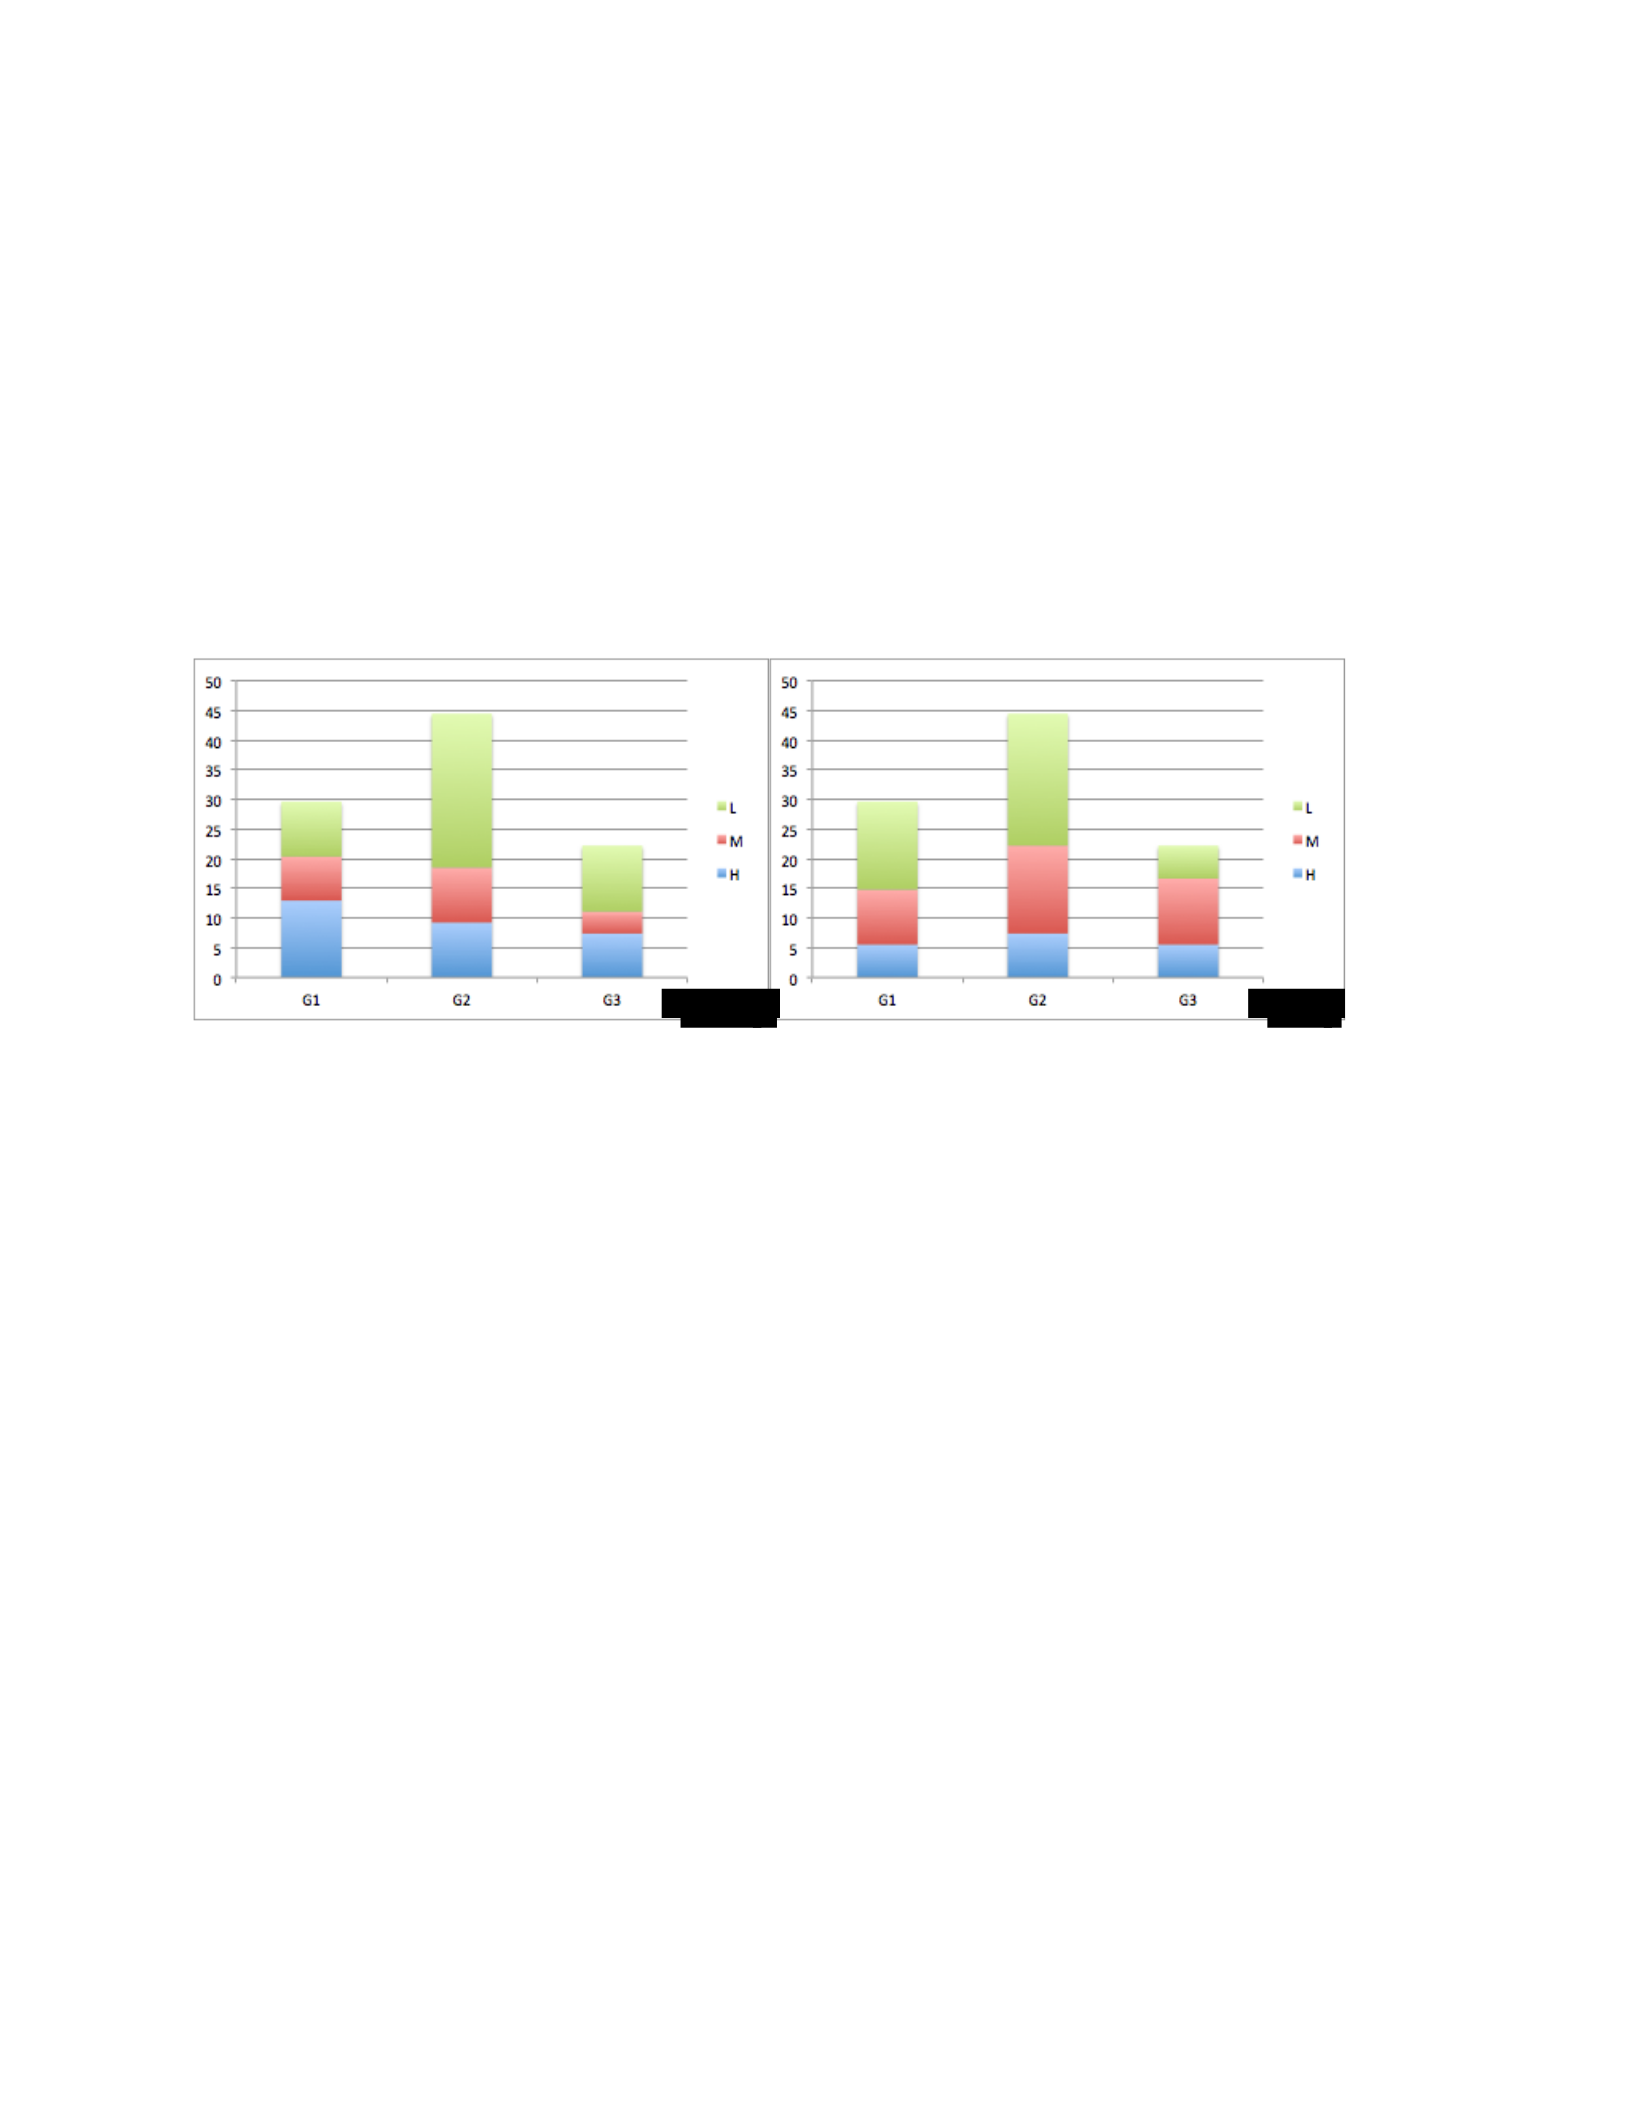
constructs that are related to the G2 group are considered highly important before introducing the
breach. However, this percentage changed to 21.7% after the breach.
Different results were drawn from the level 1 participants whose age was between 31 and 40 years
old (as it is shown in figure 4.28). Before the breach, this group perceived that the most important
security policy perceptions were those related to security policy form. After the breach, the
perception of this group was different. They perceive the constructs related to the policy process
to be the highest significant. The perceptions of this group regarding the security policy before and
after the breach differed (refer to figure 4.28).
Figure 4.28: How the five main policy themes of the Crown Confections security policy were perceived by
participants whose age falls between 30 and 40 years old (before and after the breach).
Different results were drawn from the level 1 participants who were older than 40 years. Before
the breach, they perceived that the most important security policy perceptions were those related
to security policy form. After the breach, they perceived the constructs related to the policy process
as the highest significant ones (refer to figure 4.29). Generally, the number of constructs that were
perceived as the highest significant in all of the groups changed after the occurrence of the breach.
With the G1 group, the percentage changed from 14.8% to 9.3%. For the G2 group, the percentage
changed from 3.7% to 20.4%. Finally, for the G3 group, the percentage changed from 5.6% to
0.0%.
Before
After
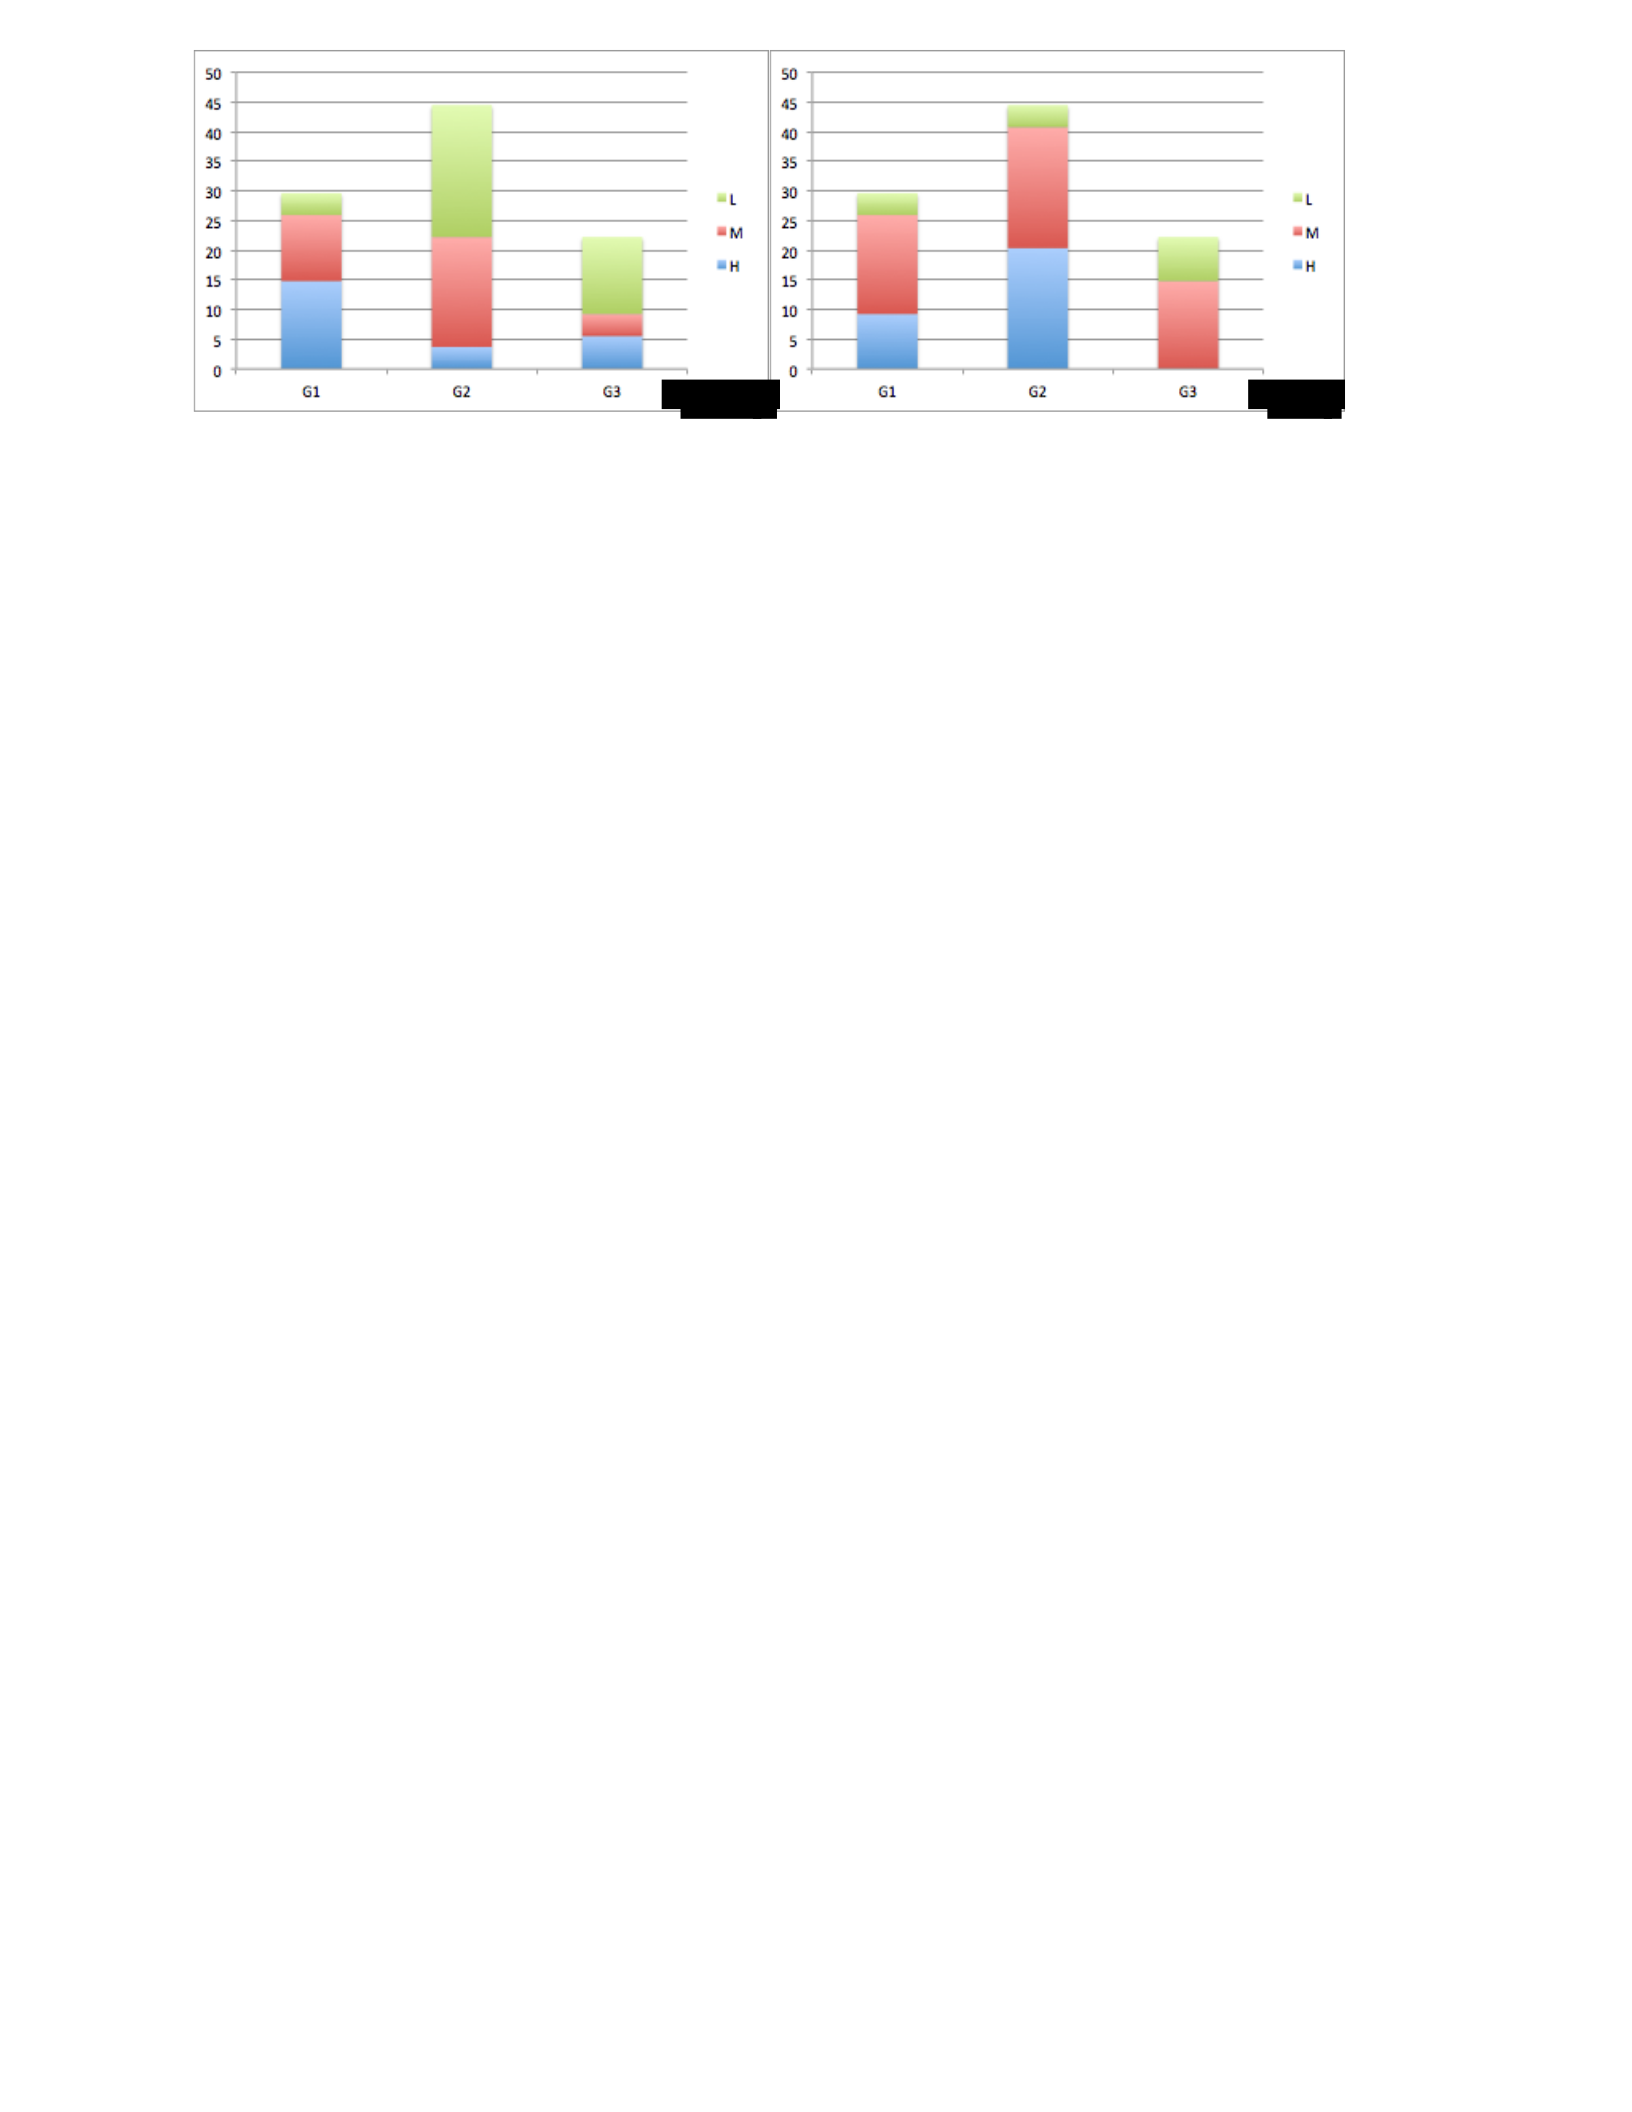
Figure 4.29: How the five main policy themes of the Crown Confections security policy were perceived by
participants whose are older than 40 years old (before and after the breach).
From the analysis above we can observe that people who was older than 40 years old and who
work for organizations that have level 1 information security policy believed that the policy form
was the most important aspect that should be taken into consideration when developing or updating
security policy. However, their perception was not stable. It was affected by the security incidents
they have faced.
To sum up, examining the five groups with the age sub-grouping shows how the perceptions of the
participants in each group were different before and after introducing the security breach. That is,
the perception of the participants regarding which constructs group was the highest significant one
was different before and after the breach. For some of the groups, they perceived the same
constructs group as the most important group before and after the breach. In this case, the change
in their perception was not regarding the constructs group that perceived as the highest important,
but it was regarding the number of the constructs within the constructs group that perceived as
high, low or medium important. For example, the level 2 participants whose age was between 31
and 40 years perceived the policy process as the most significant construct group before and after
the breach. However, the percentage of constructs that were rated as highly important changed
from 18.5% to 25.9%, the percentage of constructs that were rated as a medium important change
from 22.2% to 12.9% and the percentage of constructs that were rated as the least important change
from 3.7% to 5.6% after the breach. It is important to point out to that the perceptions of the
Before
After
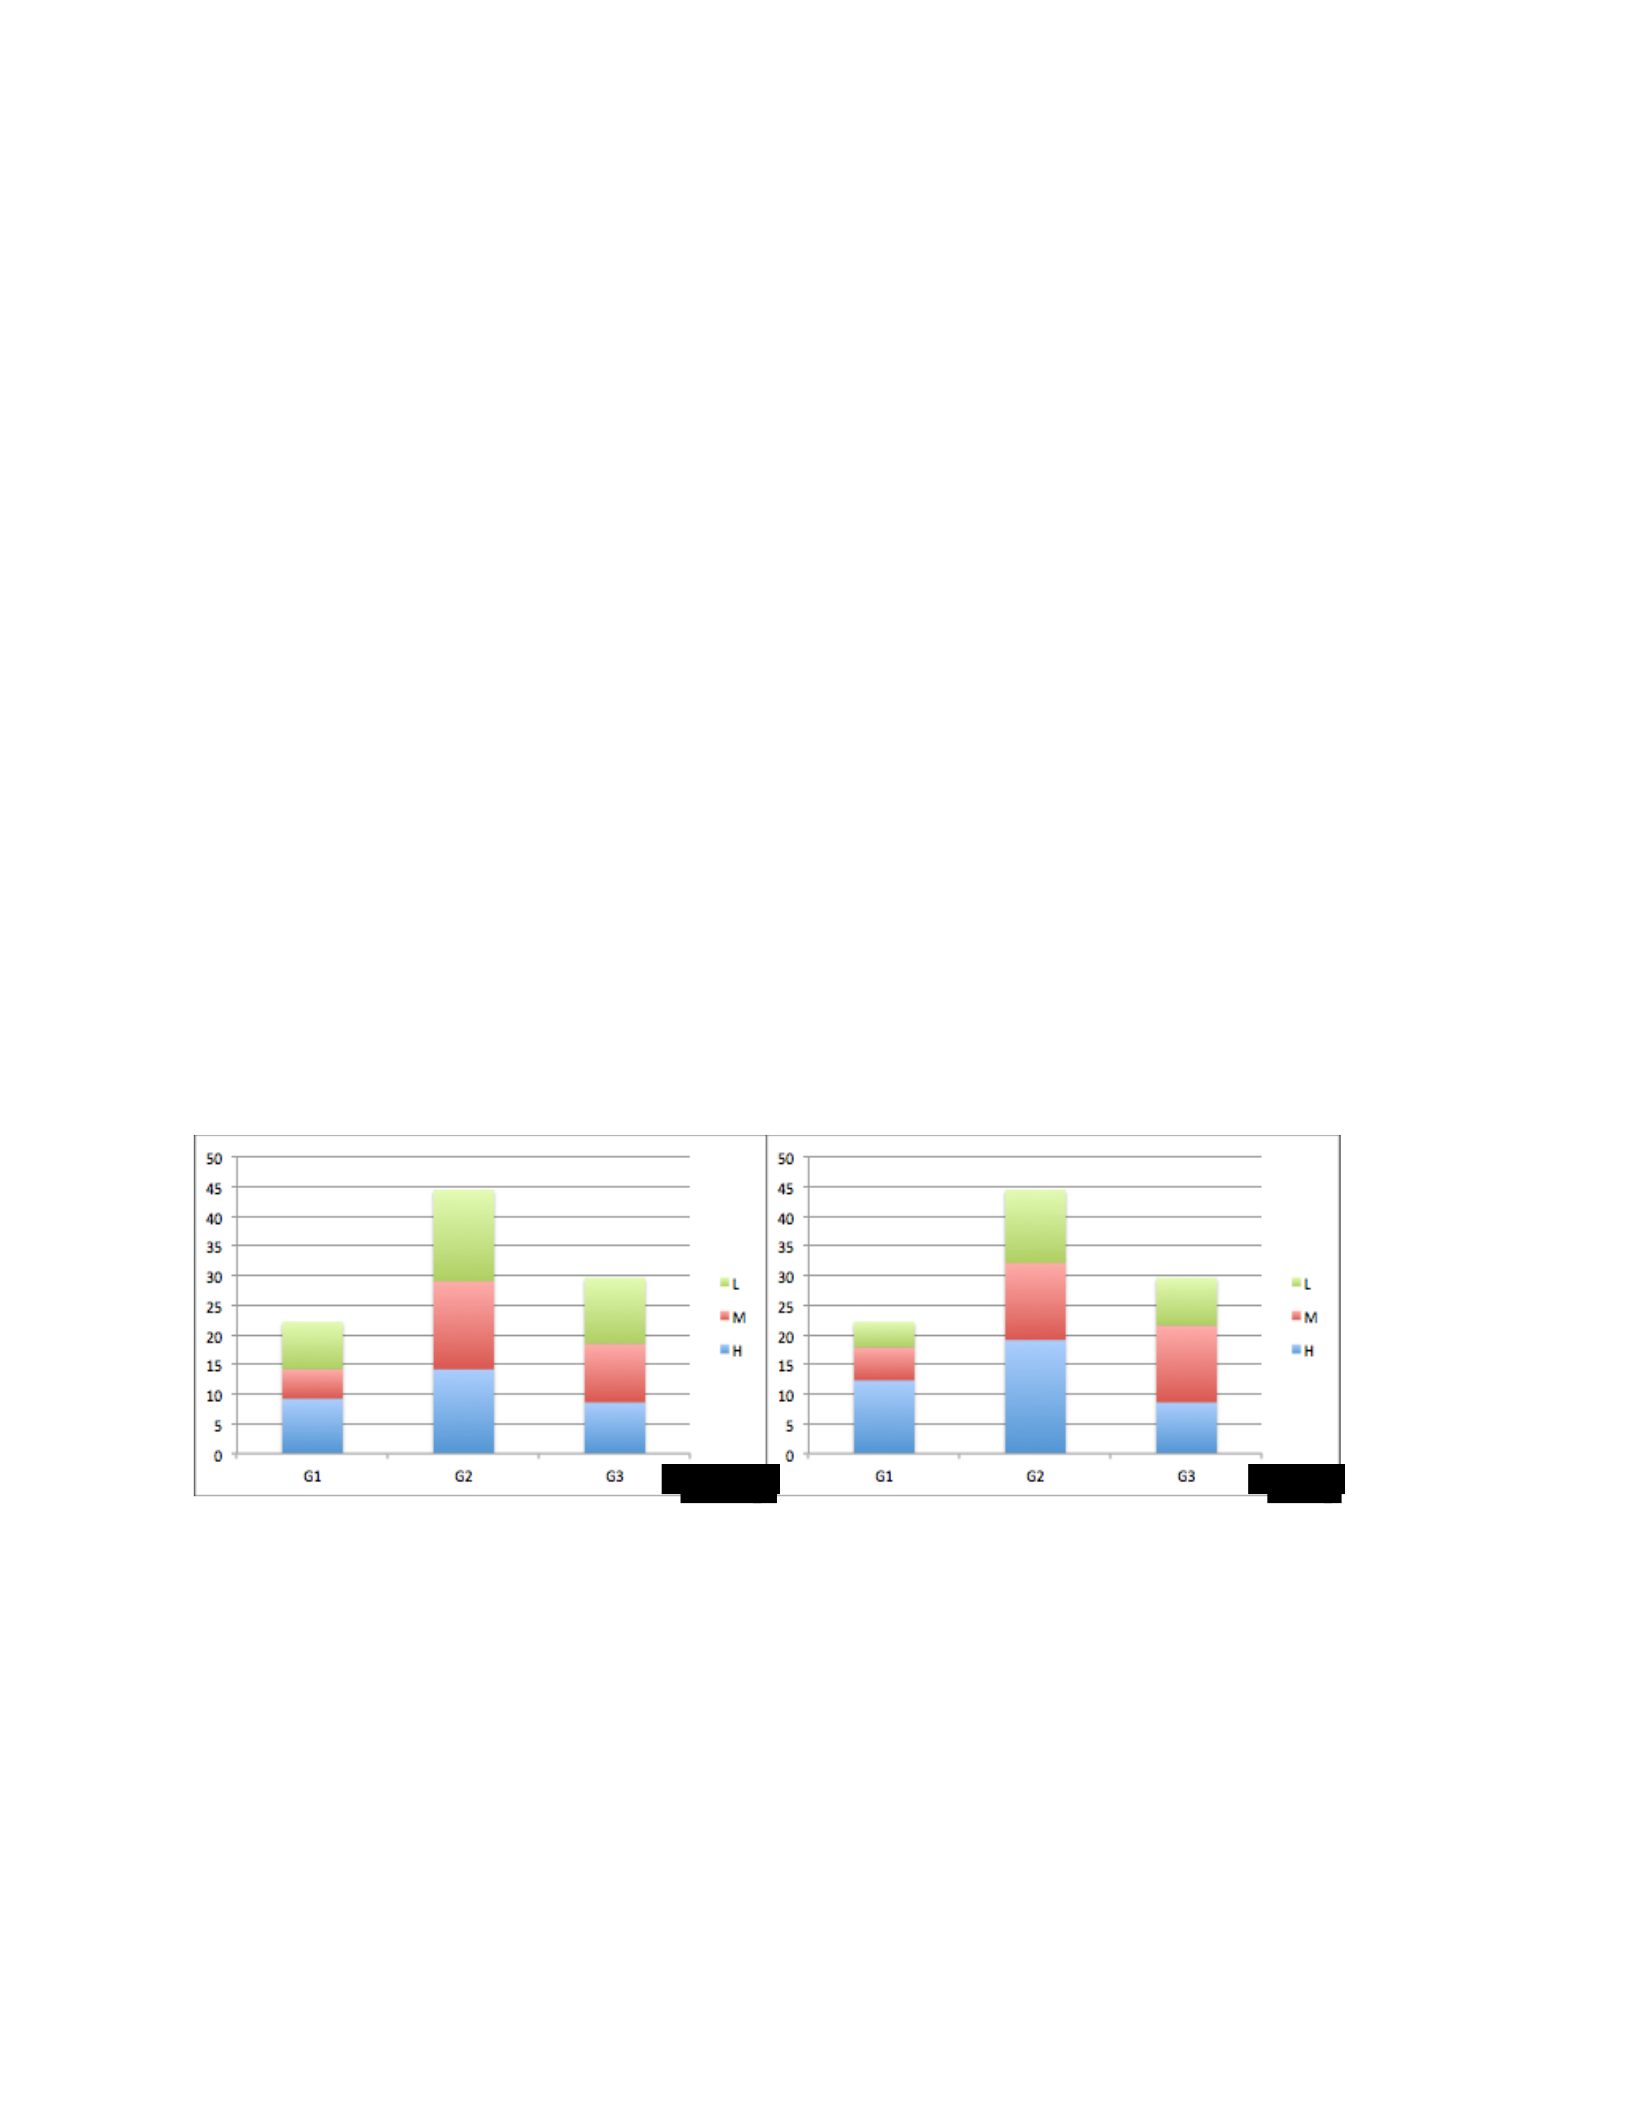
participants after introducing the breach is not necessarily the right perception. That is, the
occurrence of the breach does not correct the perception; it only changes the participants’
perceptions.
4.3.2.2 Security Policy Perception and Experience
The next step was to conduct the content analysis on the groups that were categorized based on the
experience of the participants. After categorizing the participants into five groups based on the
SSE-CMM five levels, each of the groups was categorized based on the experience of the
participants. Then, the content analysis was conducted for each sub-group.
• SSE-CMM Level Five
The participants of this group were sub-grouped into three groups based on their experience:
participants with less than 5 years of experience, participants who had between 5 to 10 years of
experience and participants who had more than 10 years of experience. Figure 4.30 shows how the
five main policy themes of the Crown Confections security policy were perceived by participants
who had less than 5 years of experience before and after the occurrence of the security breach.
Figure 4.30: How the five main policy themes of the Crown Confections security policy were perceived
by participants with less than 5 years of experience (before and after the breach).
The charts in figure 4.30 show the level 5 participants who had less than 5 years of experience.
These charts show how this group perceived the security policy before the breach and how their
perception changed after introducing the breach. According to the charts, the participants in this
group perceived that the most significant security policy perceptions were those related to security
Before
After
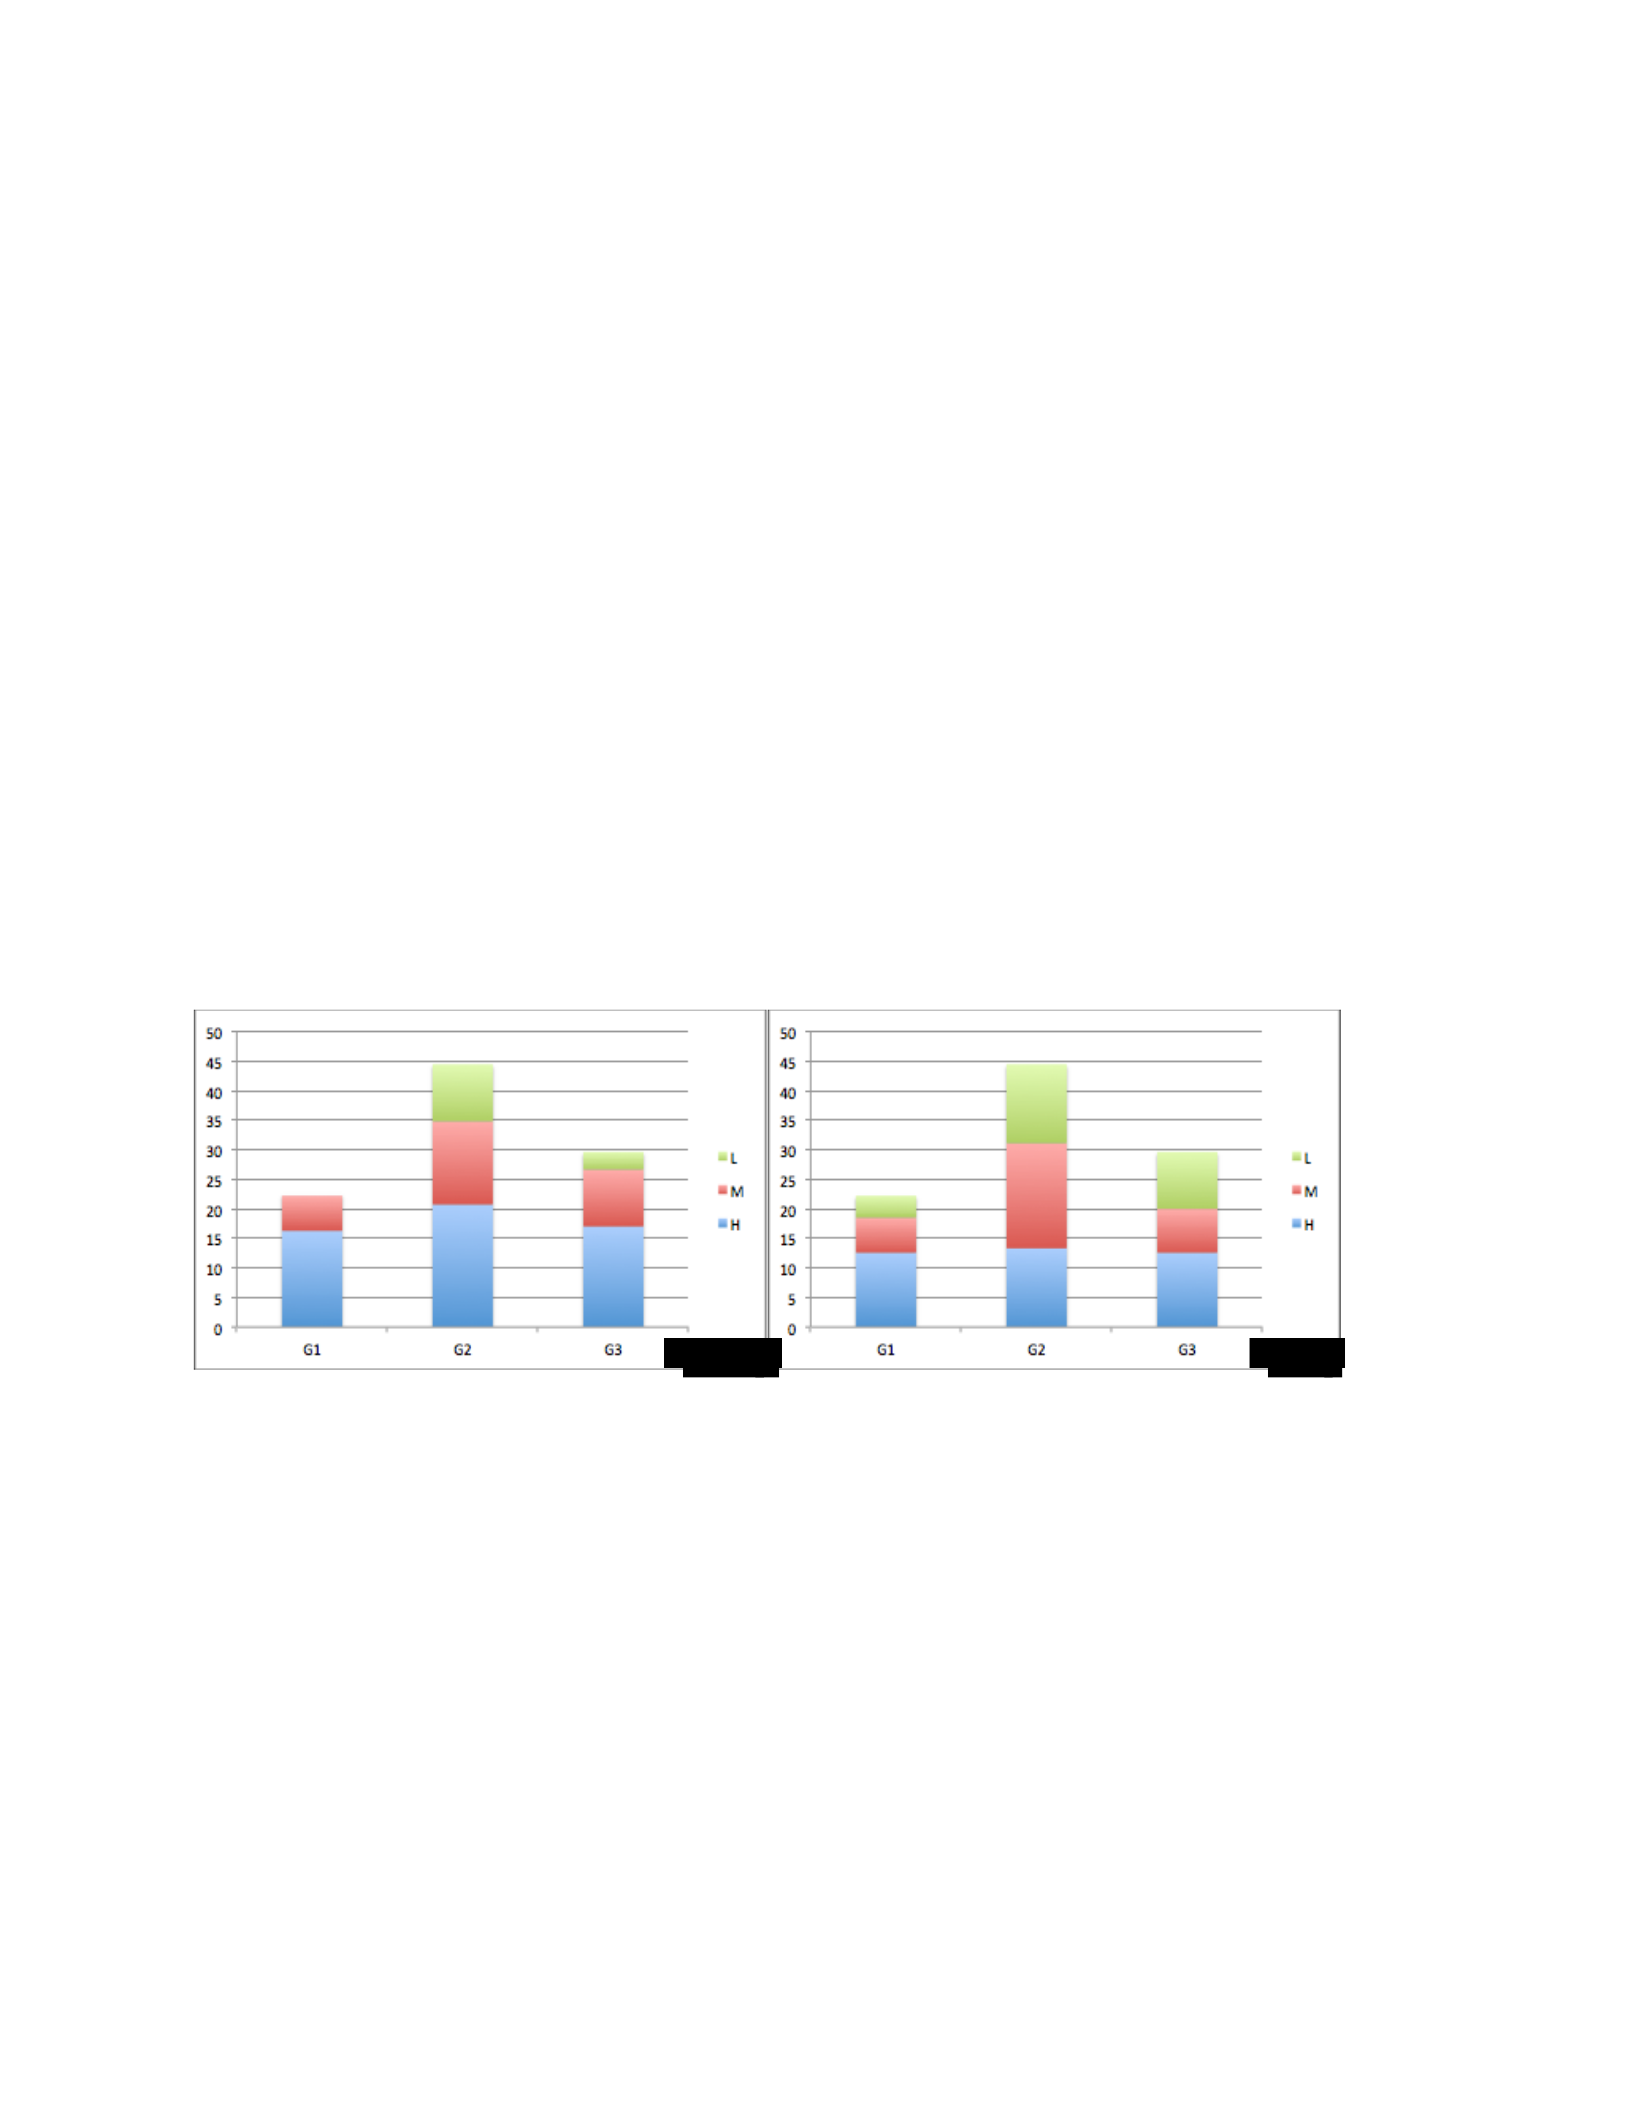
policy process. That is, the participants considered the constructs related to the security policy
process and how it should be as the most significant aspects of the security policy.
Here, the perception of this group of the participants regarding the security policy before and after
the breach was very similar. However, the number of the constructs that were considered as high,
medium, or low has been changed after introducing the breach. For example, 14.2% of the
constructs that fall under G2 group were rated as highly important before introducing the breach.
However, this percentage changed to 19.2% after the occurrence of the breach.
The same results were reached from the level 5 participants who had between 5 to 10 years of
experience as it appears in figure 4.31. This group perceives that perceptions that related to the
security policy process were the most important security policy perceptions. Their perception
regarding the security policy before and after the breach was similar. However, the number of the
constructs that were considered as high, medium, or low important changed after introducing the
breach (refer to figure 4.31).
Figure 4.31: How the five main policy themes of the Crown Confections security policy were perceived by
participants who have between 5 to 10 years of experience (before and after the breach).
Also, the third group of the level 5 participants who had more than 10 years of experience had
similar perceptions of the policy before and after the breach, as can be drawn from figure 4.32.
Before introducing the security breach, this group of participants perceived that the most important
security policy perceptions were those related to security policy process. After introducing the
breach, they had the same perception regarding which constructs group was the most important
Before
After
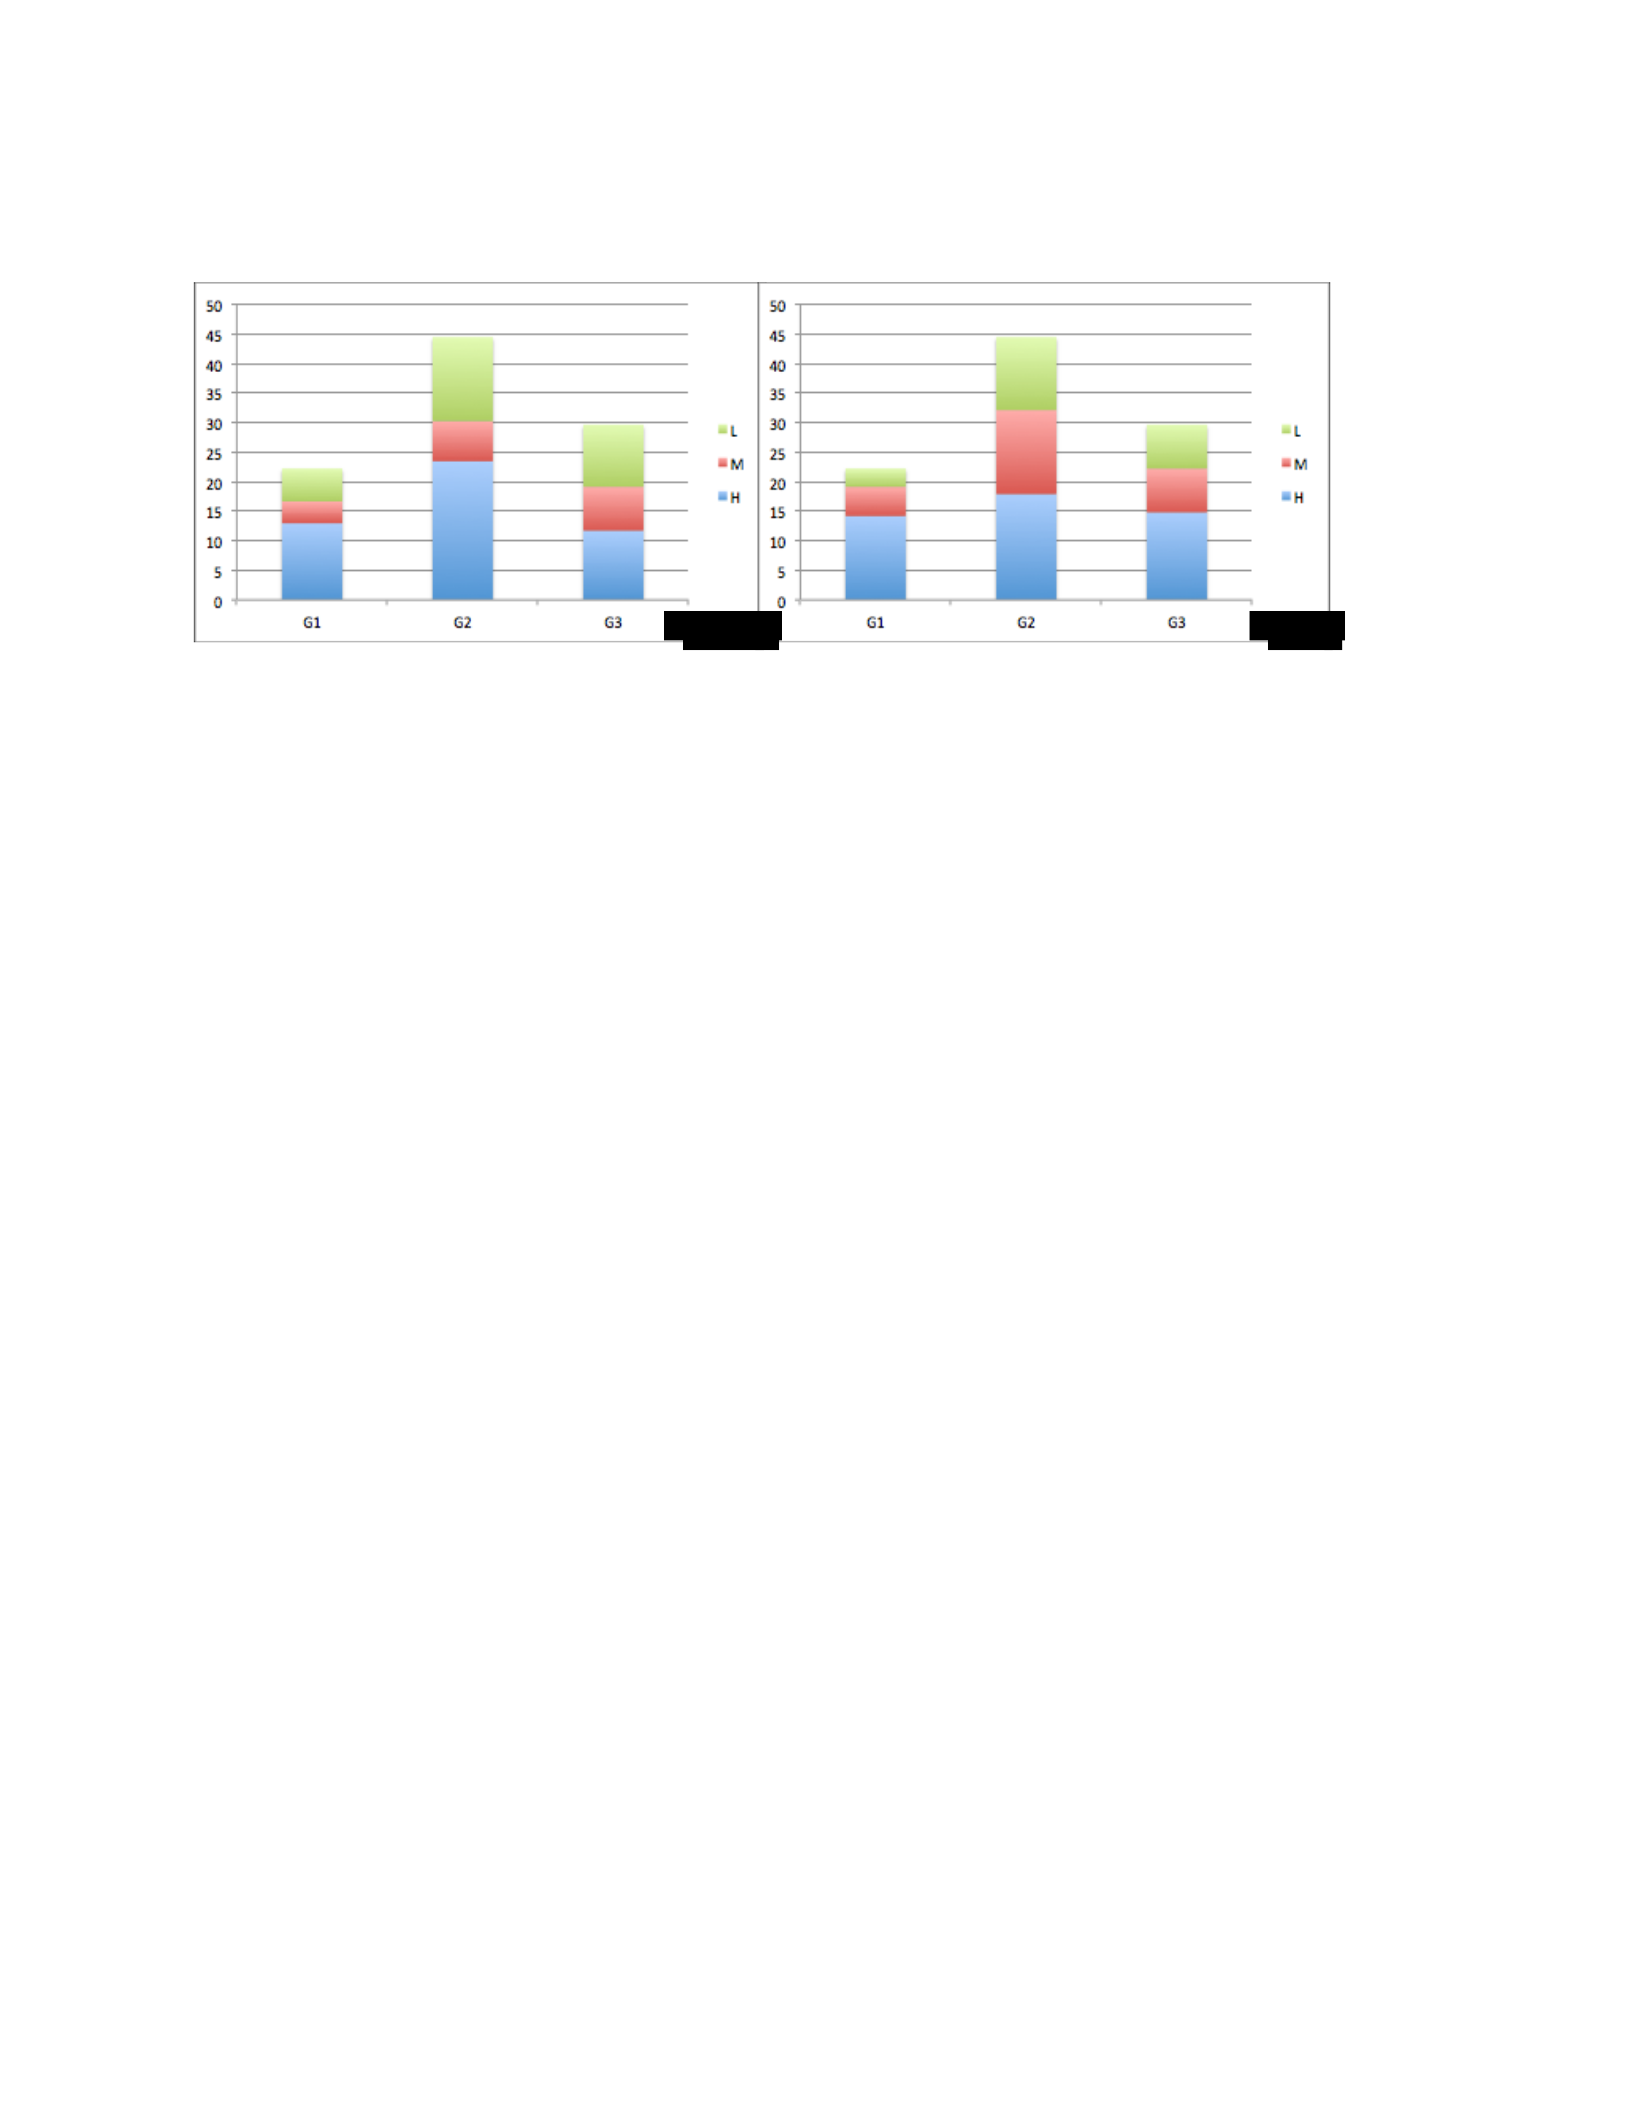
group. However, the number of the constructs that were considered as high, medium, or low
changed after introducing the breach (refer to figure 4.32).
Figure 4.32: How the five main policy themes of the Crown Confections security policy were perceived by
participants who have more than 10 years of experience (before and after the breach).
To summarize, from the analysis above we can see that people who work for organizations that
have level 5 information security policy believed that the policy process was the most important
aspect that should be taken into consideration when developing or updating security policy.
However, their perception was not stable. It was affected by the security incidents they have faced.
• SSE-CMM Level Four
The participants of this group were categorized into three groups based on their experience:
participants who had less than 5 years of experience, participants who had between 5 to 10 years
of experience and participants who had more than 10 years of experience. Figure 4.33 shows how
the five main policy themes of the Crown Confections security policy were perceived by
participants who had less than 5 years of experience before and after the occurrence of the security
breach.
Before
After

Figure 4.33: How the five main policy themes of the Crown Confections security policy were perceived by
participants with less than 5 years of experience (before and after the breach).
Figure 4.33 shows how the participants with less than 5 years of experience perceived the security
policy before and how their perception canged after introducing the breach. The charts show that
this group perceived that the constructs related to security policy process as the most significant
security policy perceptions before the introduction of the security breach. After the occurrence of
the breach, their perception changed, so they perceived the constructs that were related to the policy
form as the most significant constructs followed by policy process group and policy content group.
Here, the perception of this group of the participants regarding the security policy before and after
the breach was different.
Different results were found from the level 4 participants who had more than 10 years of experience
as it appears in figure 4.34. This group perceived that the most important security policy
perceptions were those related to security policy process. The perception of this group regarding
the security policy before and after the breach was almost the same. However, the number of the
constructs that ranked as high, medium, or low important changed after introducing the breach
(refer to figure 4.34). For example, the percentage of the constructs that were rated as high
important in the G2 group was 27.8% before the breach and 19.4% after the breach.
Before
After
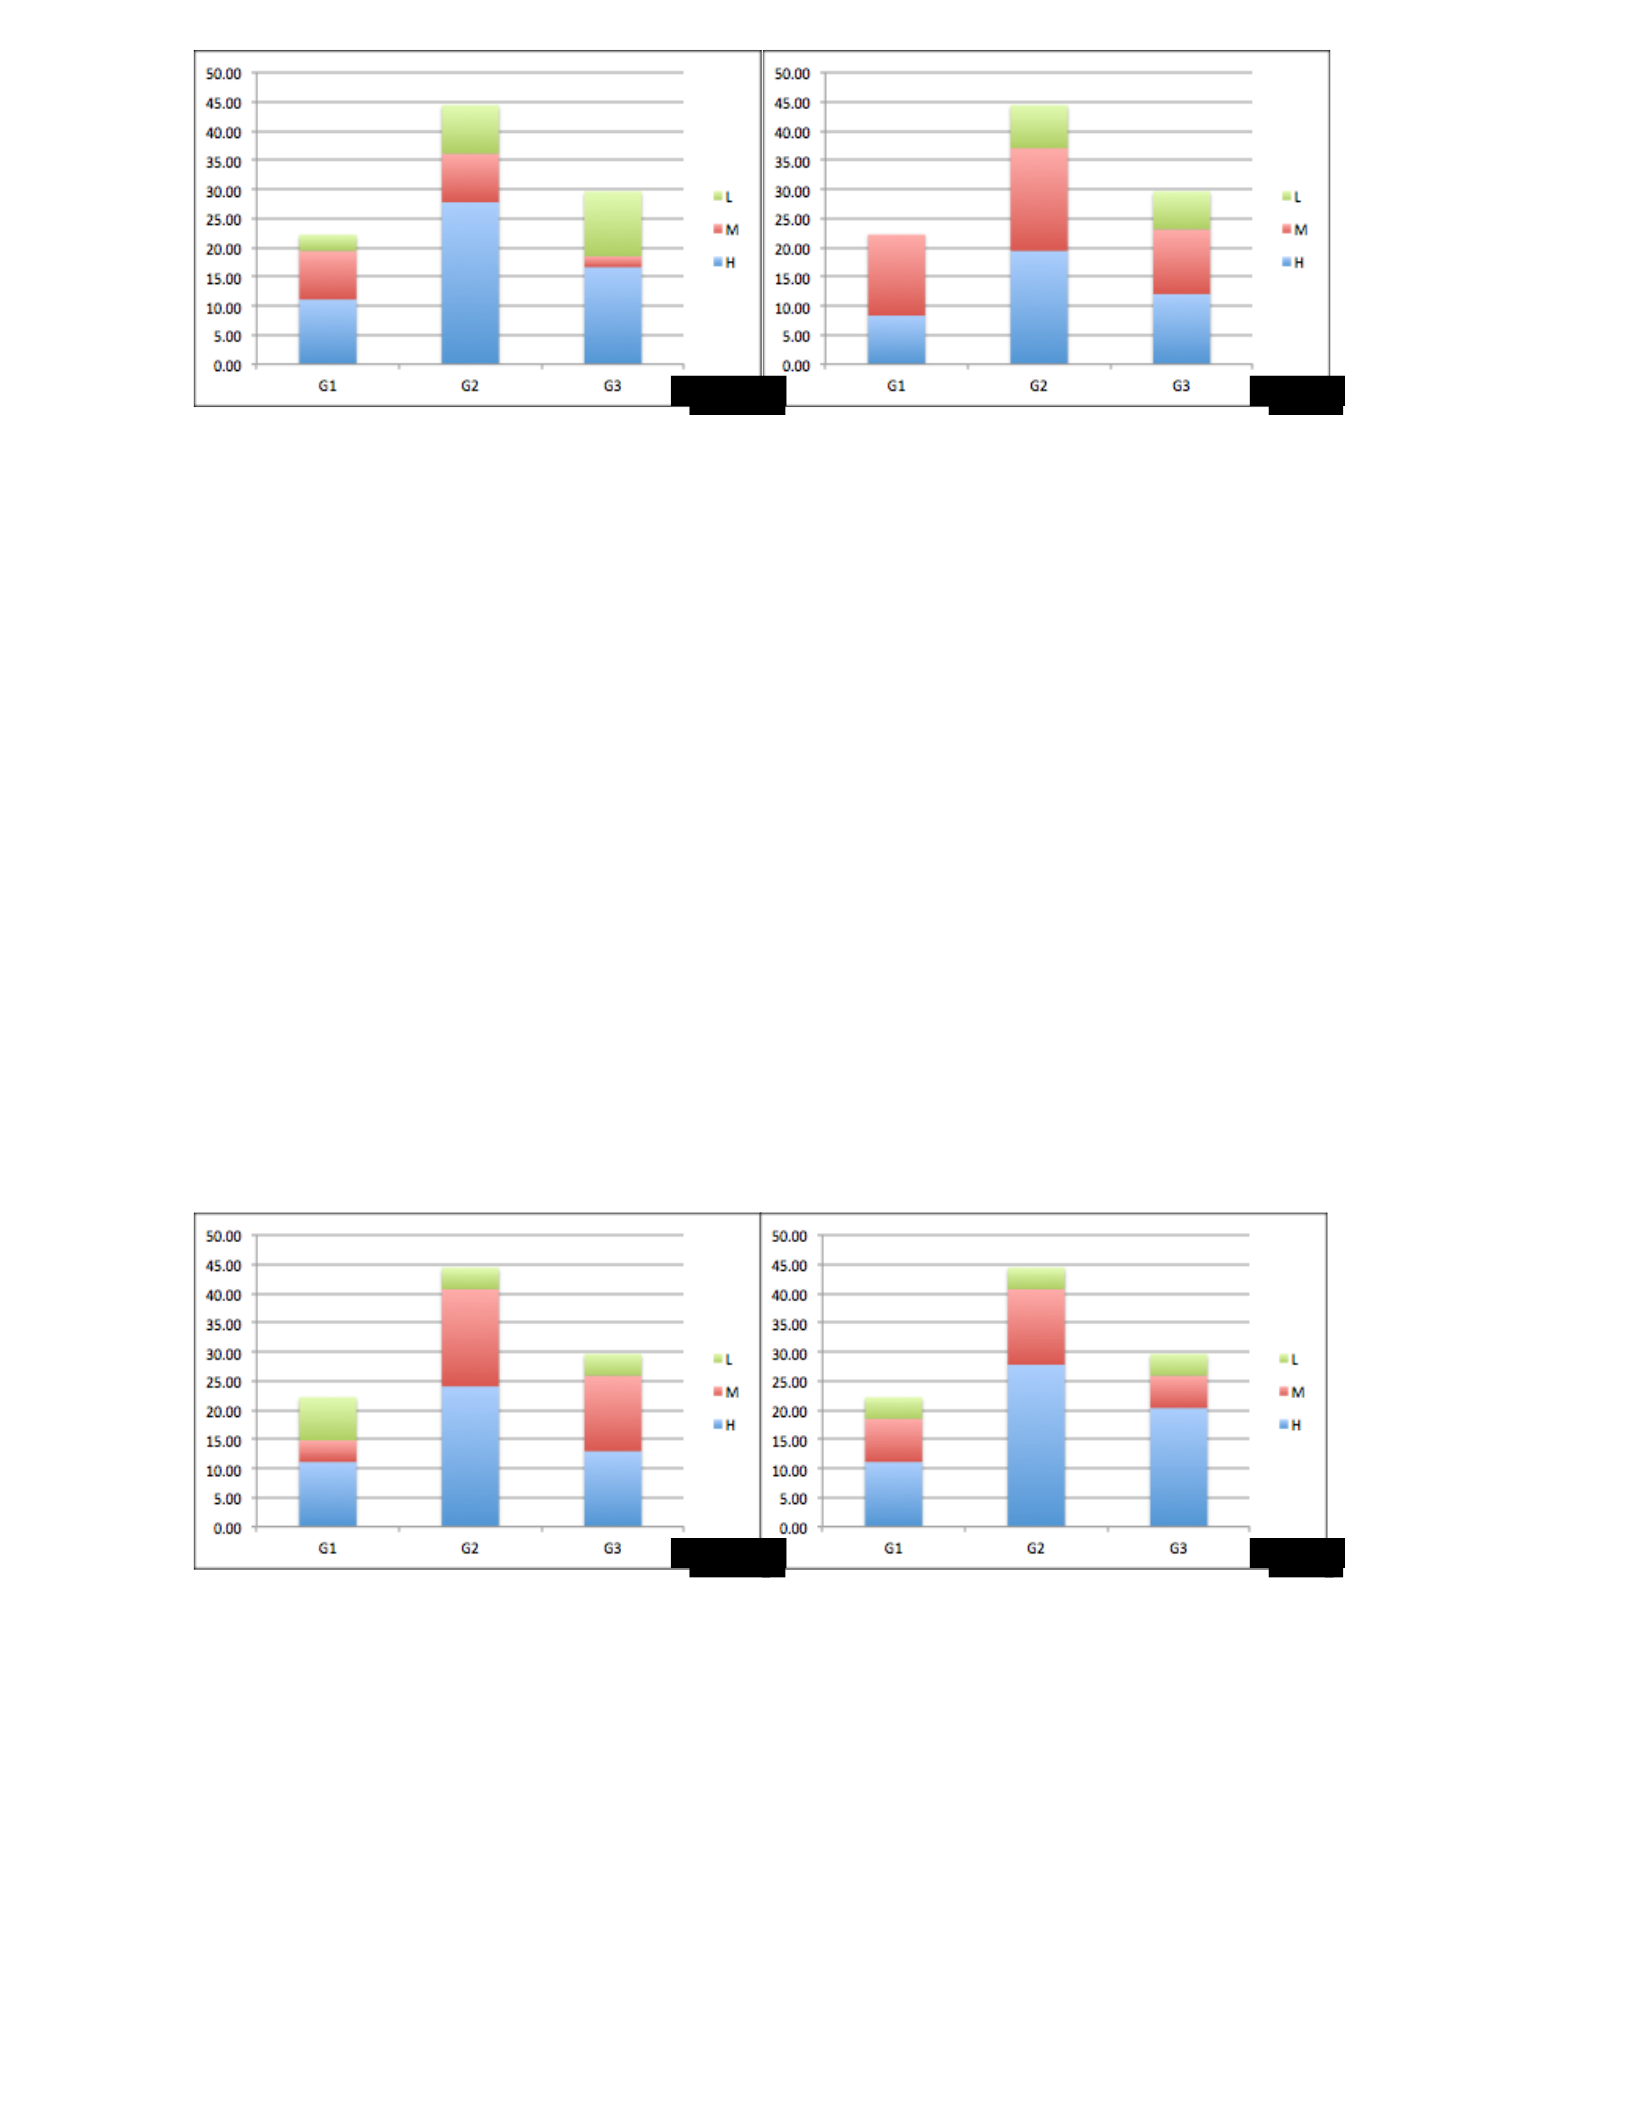
Figure 4.34: How the five main policy themes of the Crown Confections security policy were perceived by
participants who have more than 10 years of experience (before and after the breach).
Lastly, the level 4 participants with more than 10 years of experience perceived that the most
important security policy perceptions were those related to the security policy process. They had
the same perception regarding which group was the most important group before and after the
breach. However, the number of the constructs that got high, medium, or low importance level
changed after introducing the breach (refer to figure 4.35). For example, the percentage of the
constructs rated as high important in the G3 group is 13% before the breach and 20.4% after the
breach.
Figure 4.35: How the five main policy themes of the Crown Confections security policy were perceived by
participants with less than 5 years of experience (before and after the breach).
To conclude, from the analysis above we can see that the people who work for organizations that
have a level 4 information security policy believed that the policy process was the most important
Before
After
Before
After
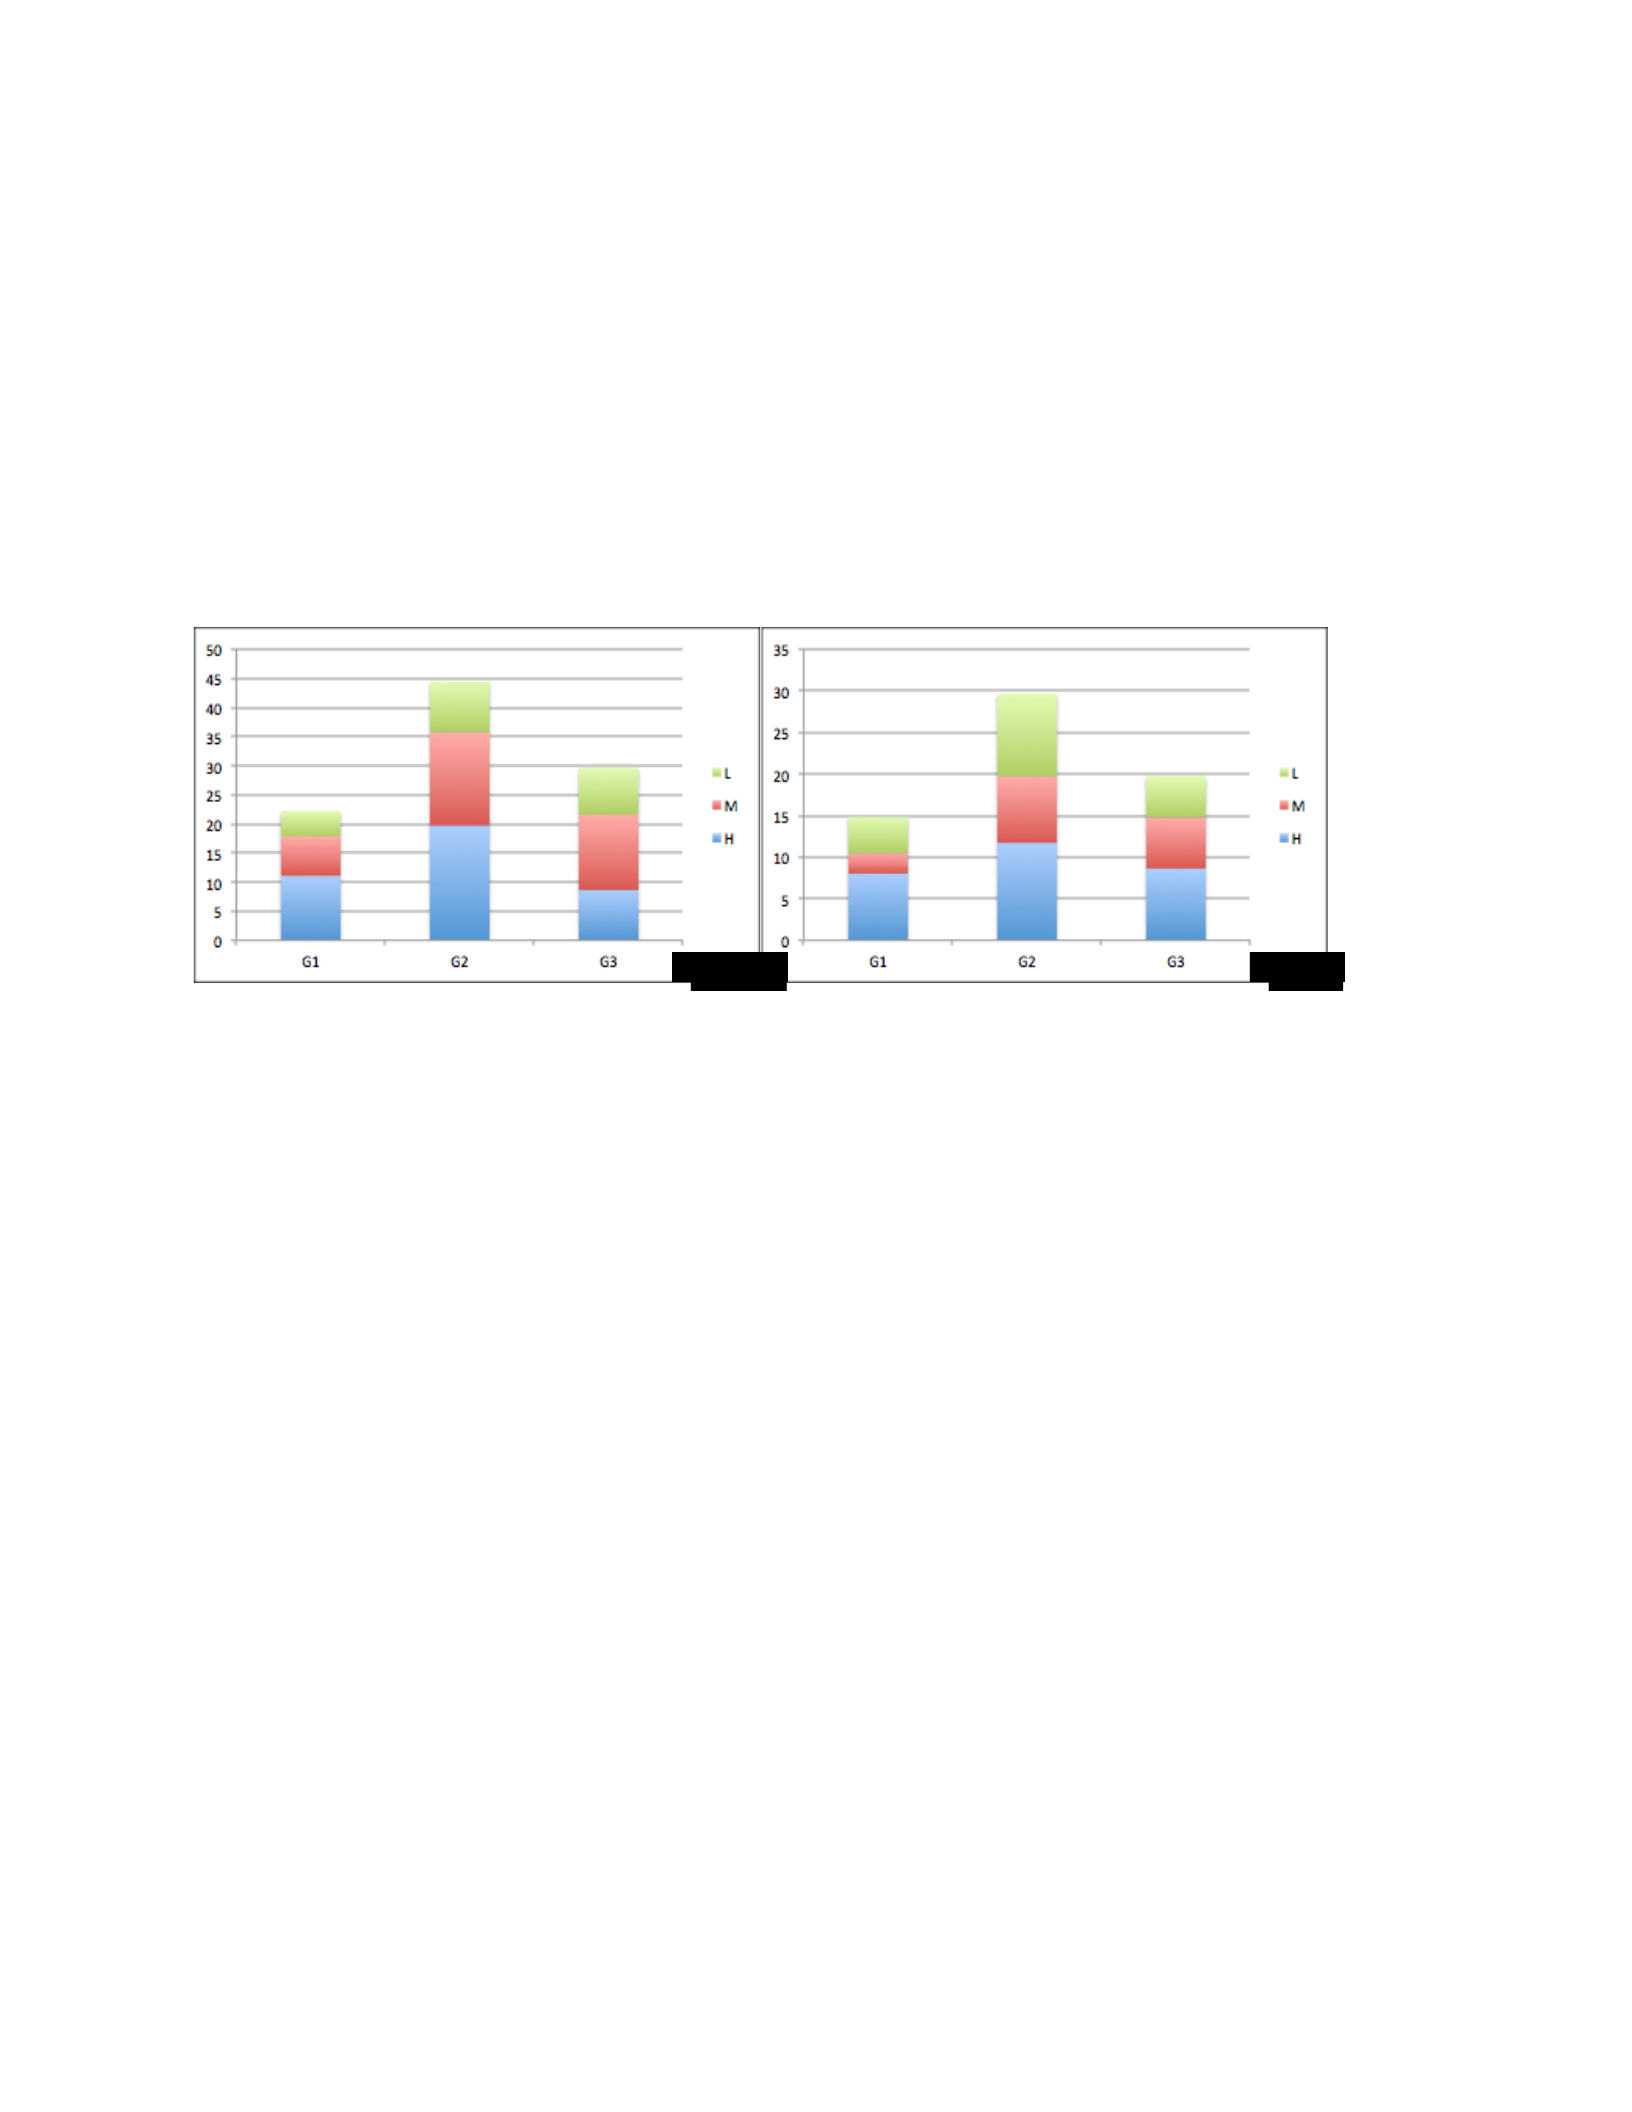
aspect that should be taken into consideration when developing or updating security policy.
However, their perception was not stable. It was affected by the security incidents they have faced.
• SSE-CMM Level Three
The participants of this group were grouped into three groups: participants who had less than 5
years of experience; participants who had between 5 to 10 years of experience; and participants
who had more than 10 years of experience. Figure 4.36 shows how participants with less than 5
years of experience perceived the five main policy themes of the security policy before and after
the occurrence of the security breach.
Figure 4.36: How the five main policy themes of the Crown Confections security policy were perceived
by participants with less than 5 years of experience (before and after the breach).
The charts reveal that the participants with less than 5 years of experience perceived the constructs
related to security policy process as the most significant security policy perceptions before and
after the introduction of the security breach. The perception of this group of the participants
regarding the security policy before and after the breach was very similar. However, the number
of the constructs that were rated as high, medium, or low important in each construct group
changed after introducing the breach. For example, 19.8% of the constructs that are related to the
G2 group were considered as highly important before introducing the breach. However, this
percentage changed to 11.7% after the breach.
Different results were drawn from the level 3 participants who had between 5 to 10 years of
experience. They perceived that the most important security policy perceptions were those related
to security policy form, as shown in figure 4.37. The perception of this group regarding the security
Before
After
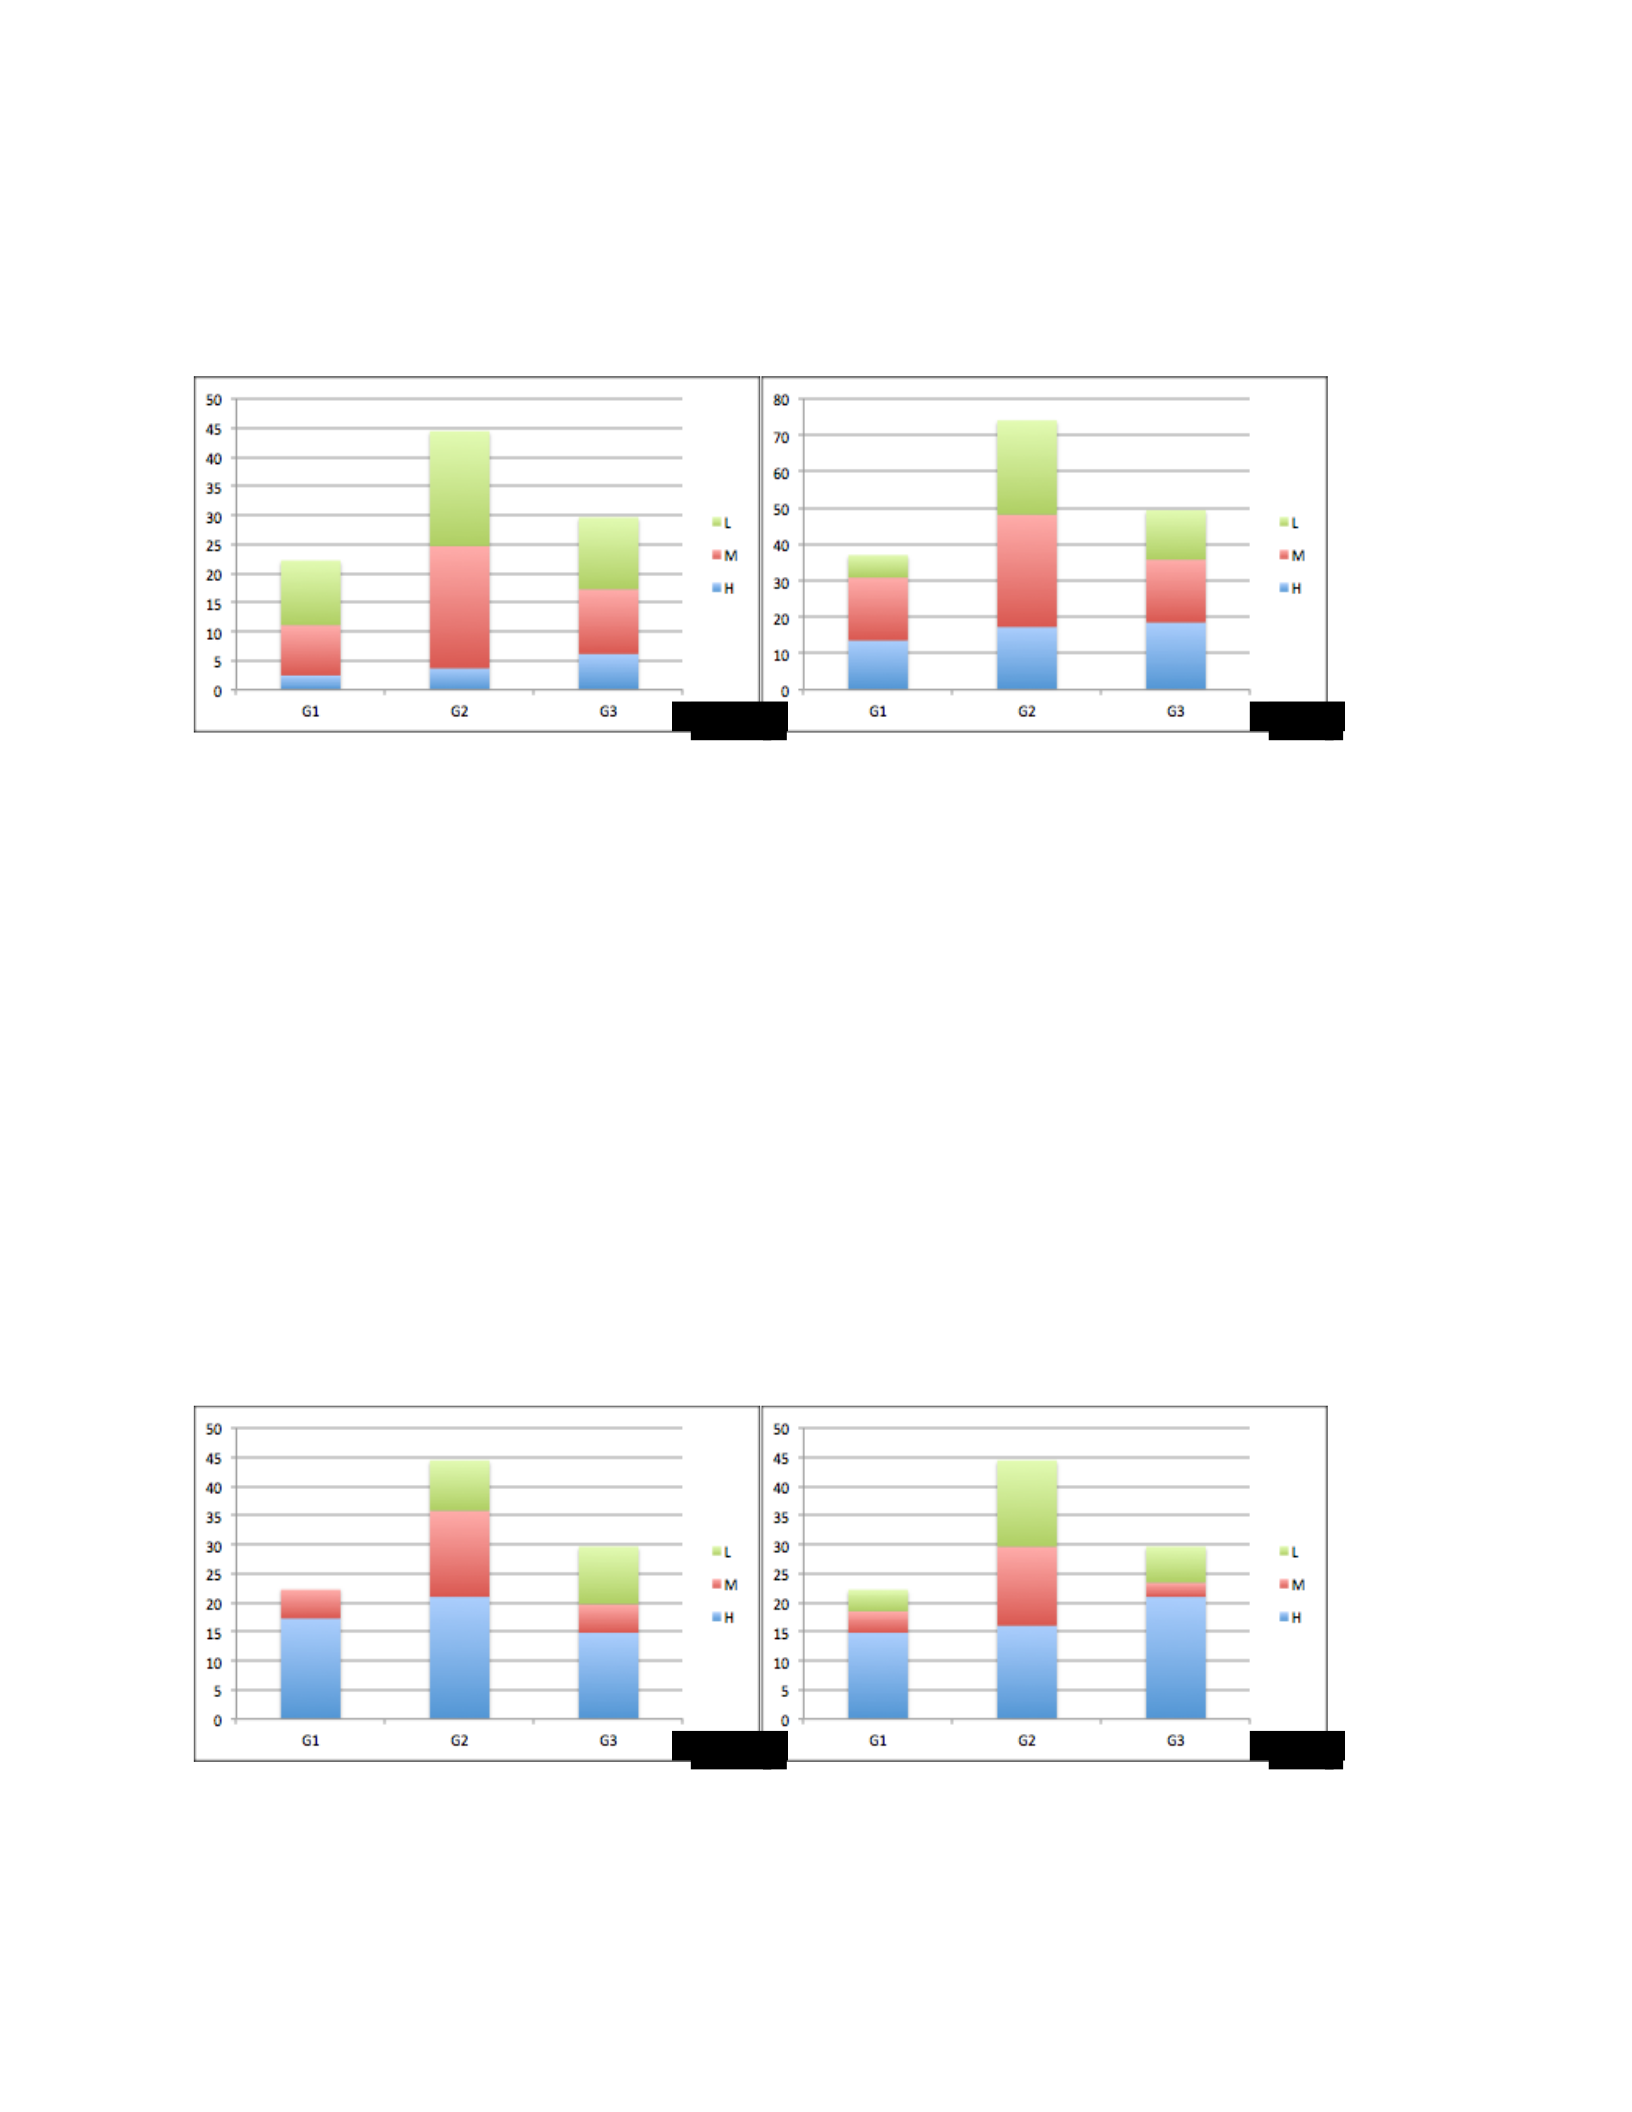
policy before and after the breach was similar (refer to figure 4.37). However, the number of the
constructs that were considered as high, medium, or low important within each construct group
changed after introducing the breach. As shown in figure 4.37, the percentage of the constructs that
were rated as high in each group increased.
Figure 4.37: How the five main policy themes of the Crown Confections security policy were perceived by
participants who have between 5 to 10 years of experience (before and after the breach).
Finally, different results were seen from the level 3 participants who had more than 10 years of
experience. Before the breach, this group perceived that the most significant security policy
perceptions were those related to security policy process. After the breach, the perception of this
group was changed. They perceived the constructs related to the policy content as the most
important group (refer to figure 4.38).
Figure 4.38: How the five main policy themes of the Crown Confections security policy were perceived by
participants who have more than 10 years of experience (before and after the breach).
Before
After
Before
After
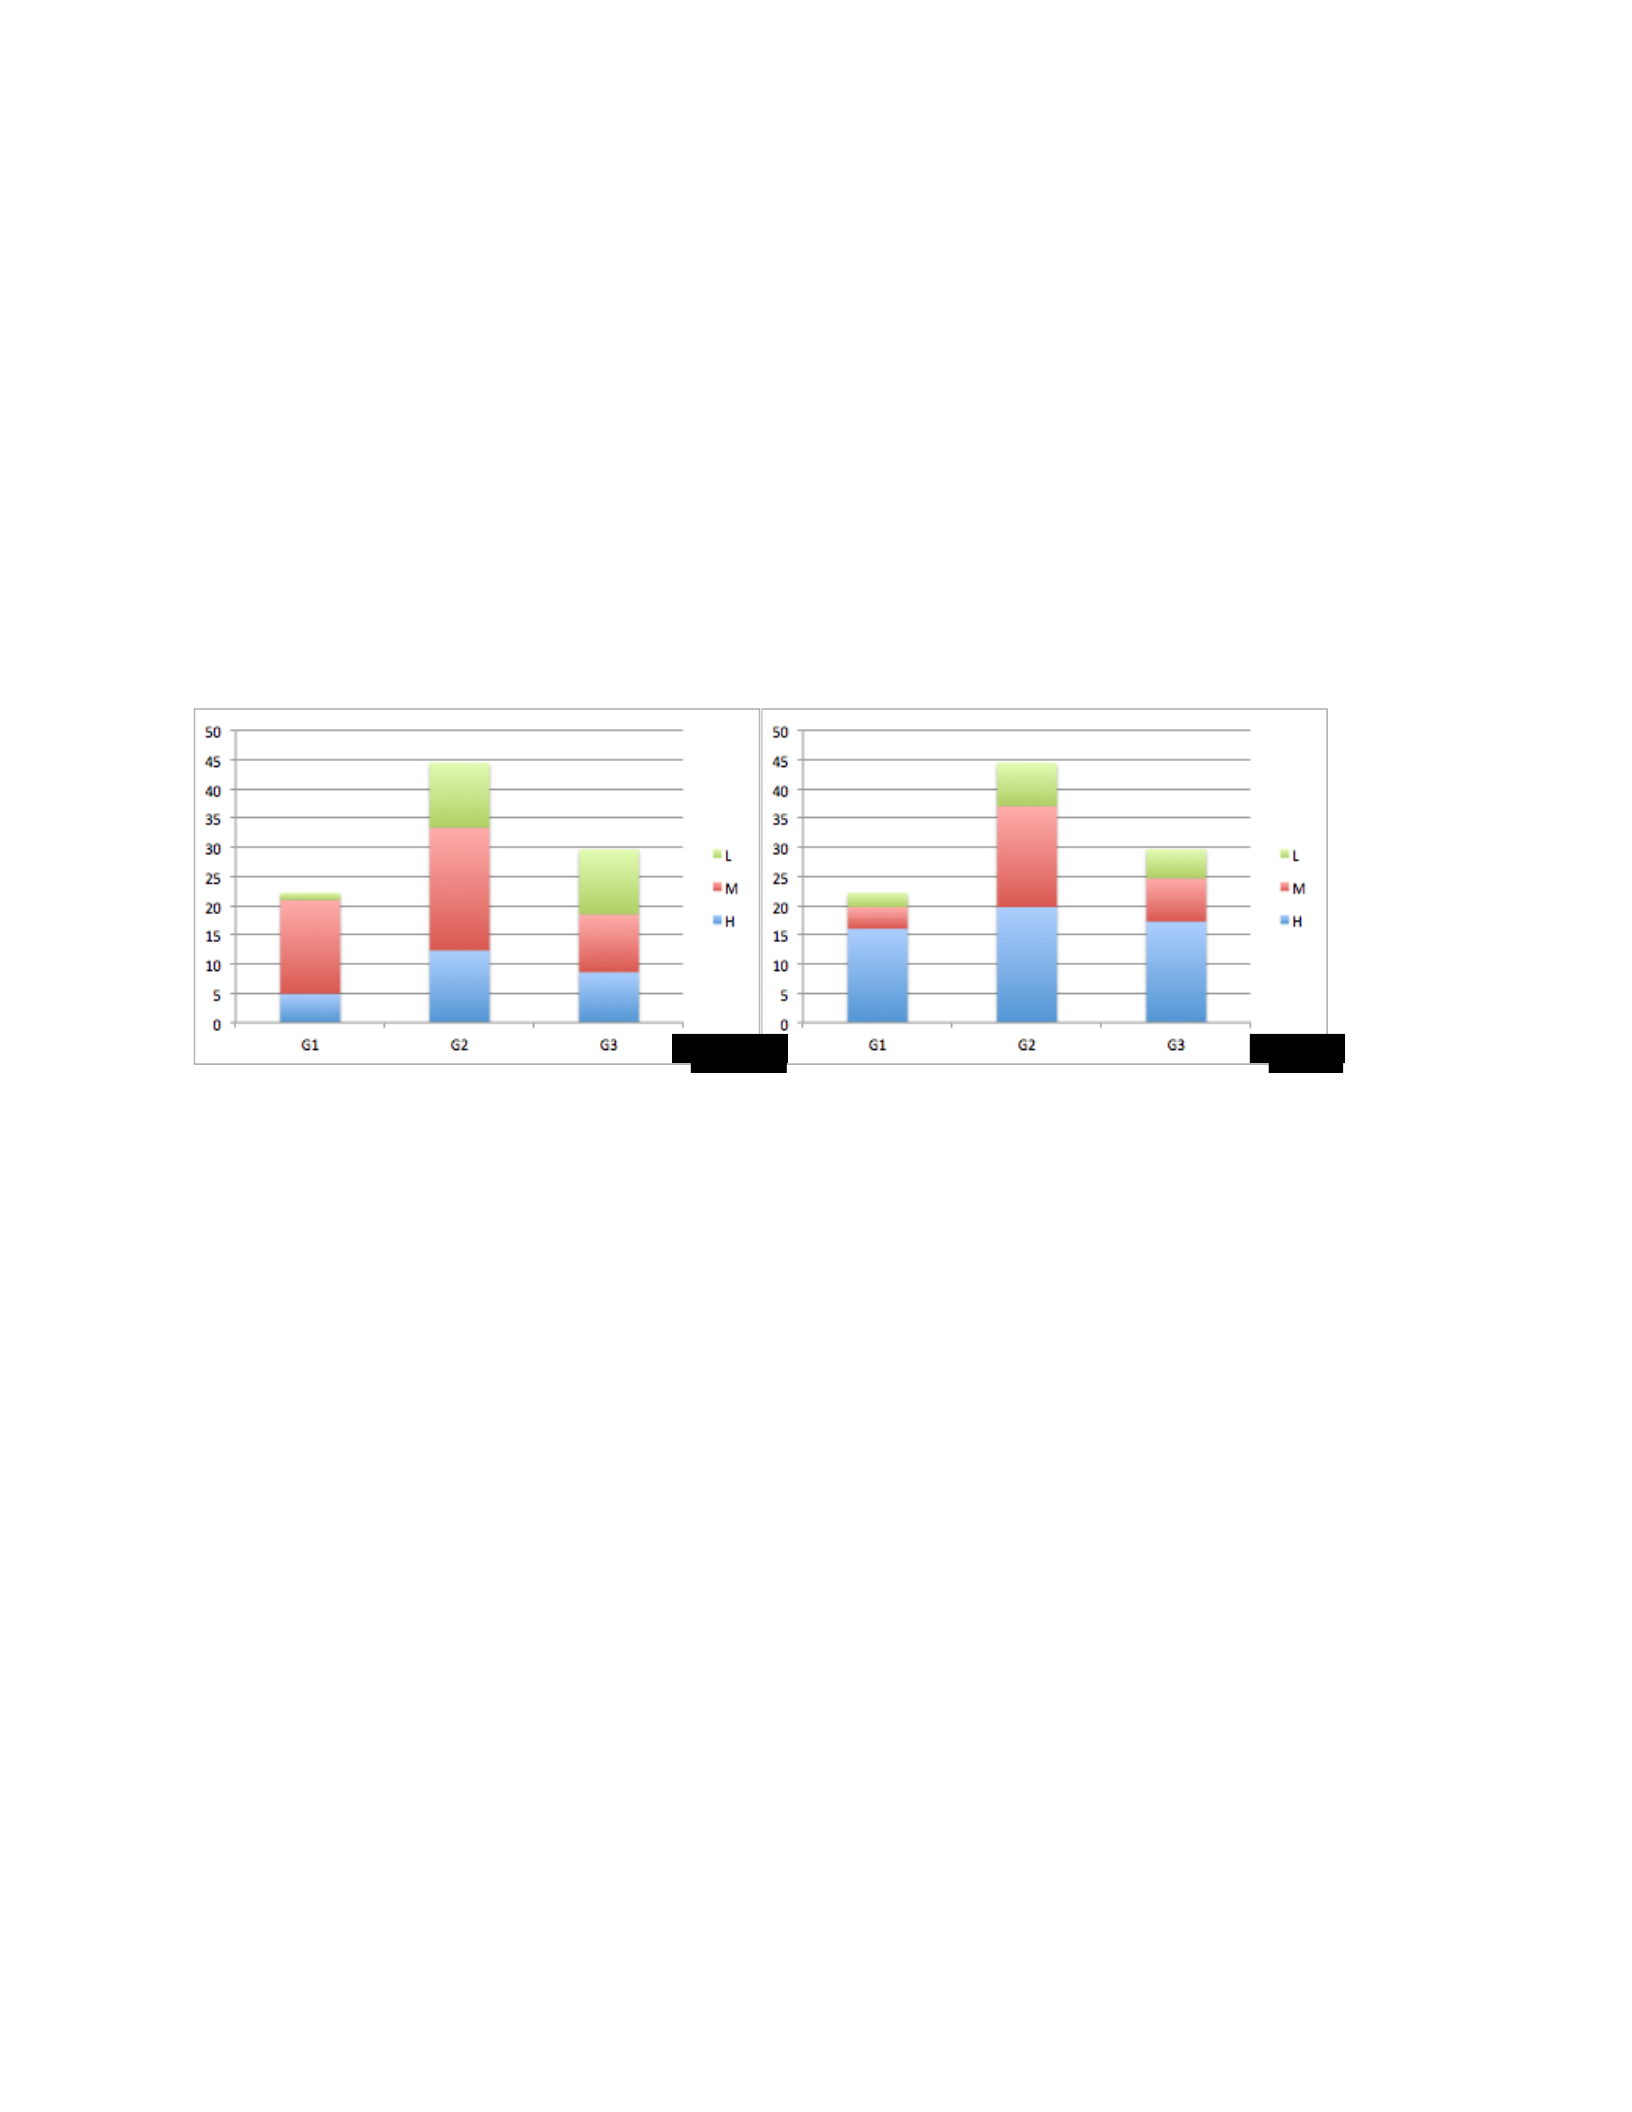
From the analysis above, we can see that the people who had 5 to 10 years of experience and who
work for organizations that have level 3 information security policy believed that the policy form
was the most important aspect that should be taken into consideration when developing or updating
security policy. However, their perception was not stable. It was affected by the security incidents
they have faced.
• SSE-CMM Level Two
The participants of this group were grouped into three groups: participants who had less than 5
years of experience, participants who had between 5 to 10 years of experience and participants
who had more than 10 years of experience.
Figure 4.39: How the five main policy themes of the Crown Confections security policy were perceived by
participants with less than 5 years of experience (before and after the breach).
Figure 4.39 shows how participants who had less than 5 years of experience perceived the five
main policy themes of the security policy before and after the occurrence of the security breach.
As can be seen from the figure, the participants in this group perceived that the constructs related
to security policy process as the most important group of the constructs. Here, the perception of
this group of the participants regarding the security policy before and after the breach was close.
However, the number of the constructs related to each group that was considered as high, medium,
or low important differed after introducing the breach. For example, 12.4% of the constructs that
are related to the G2 group were considered highly important before introducing the breach.
However, this percentage changed to 19.8% after the breach.
Before
After
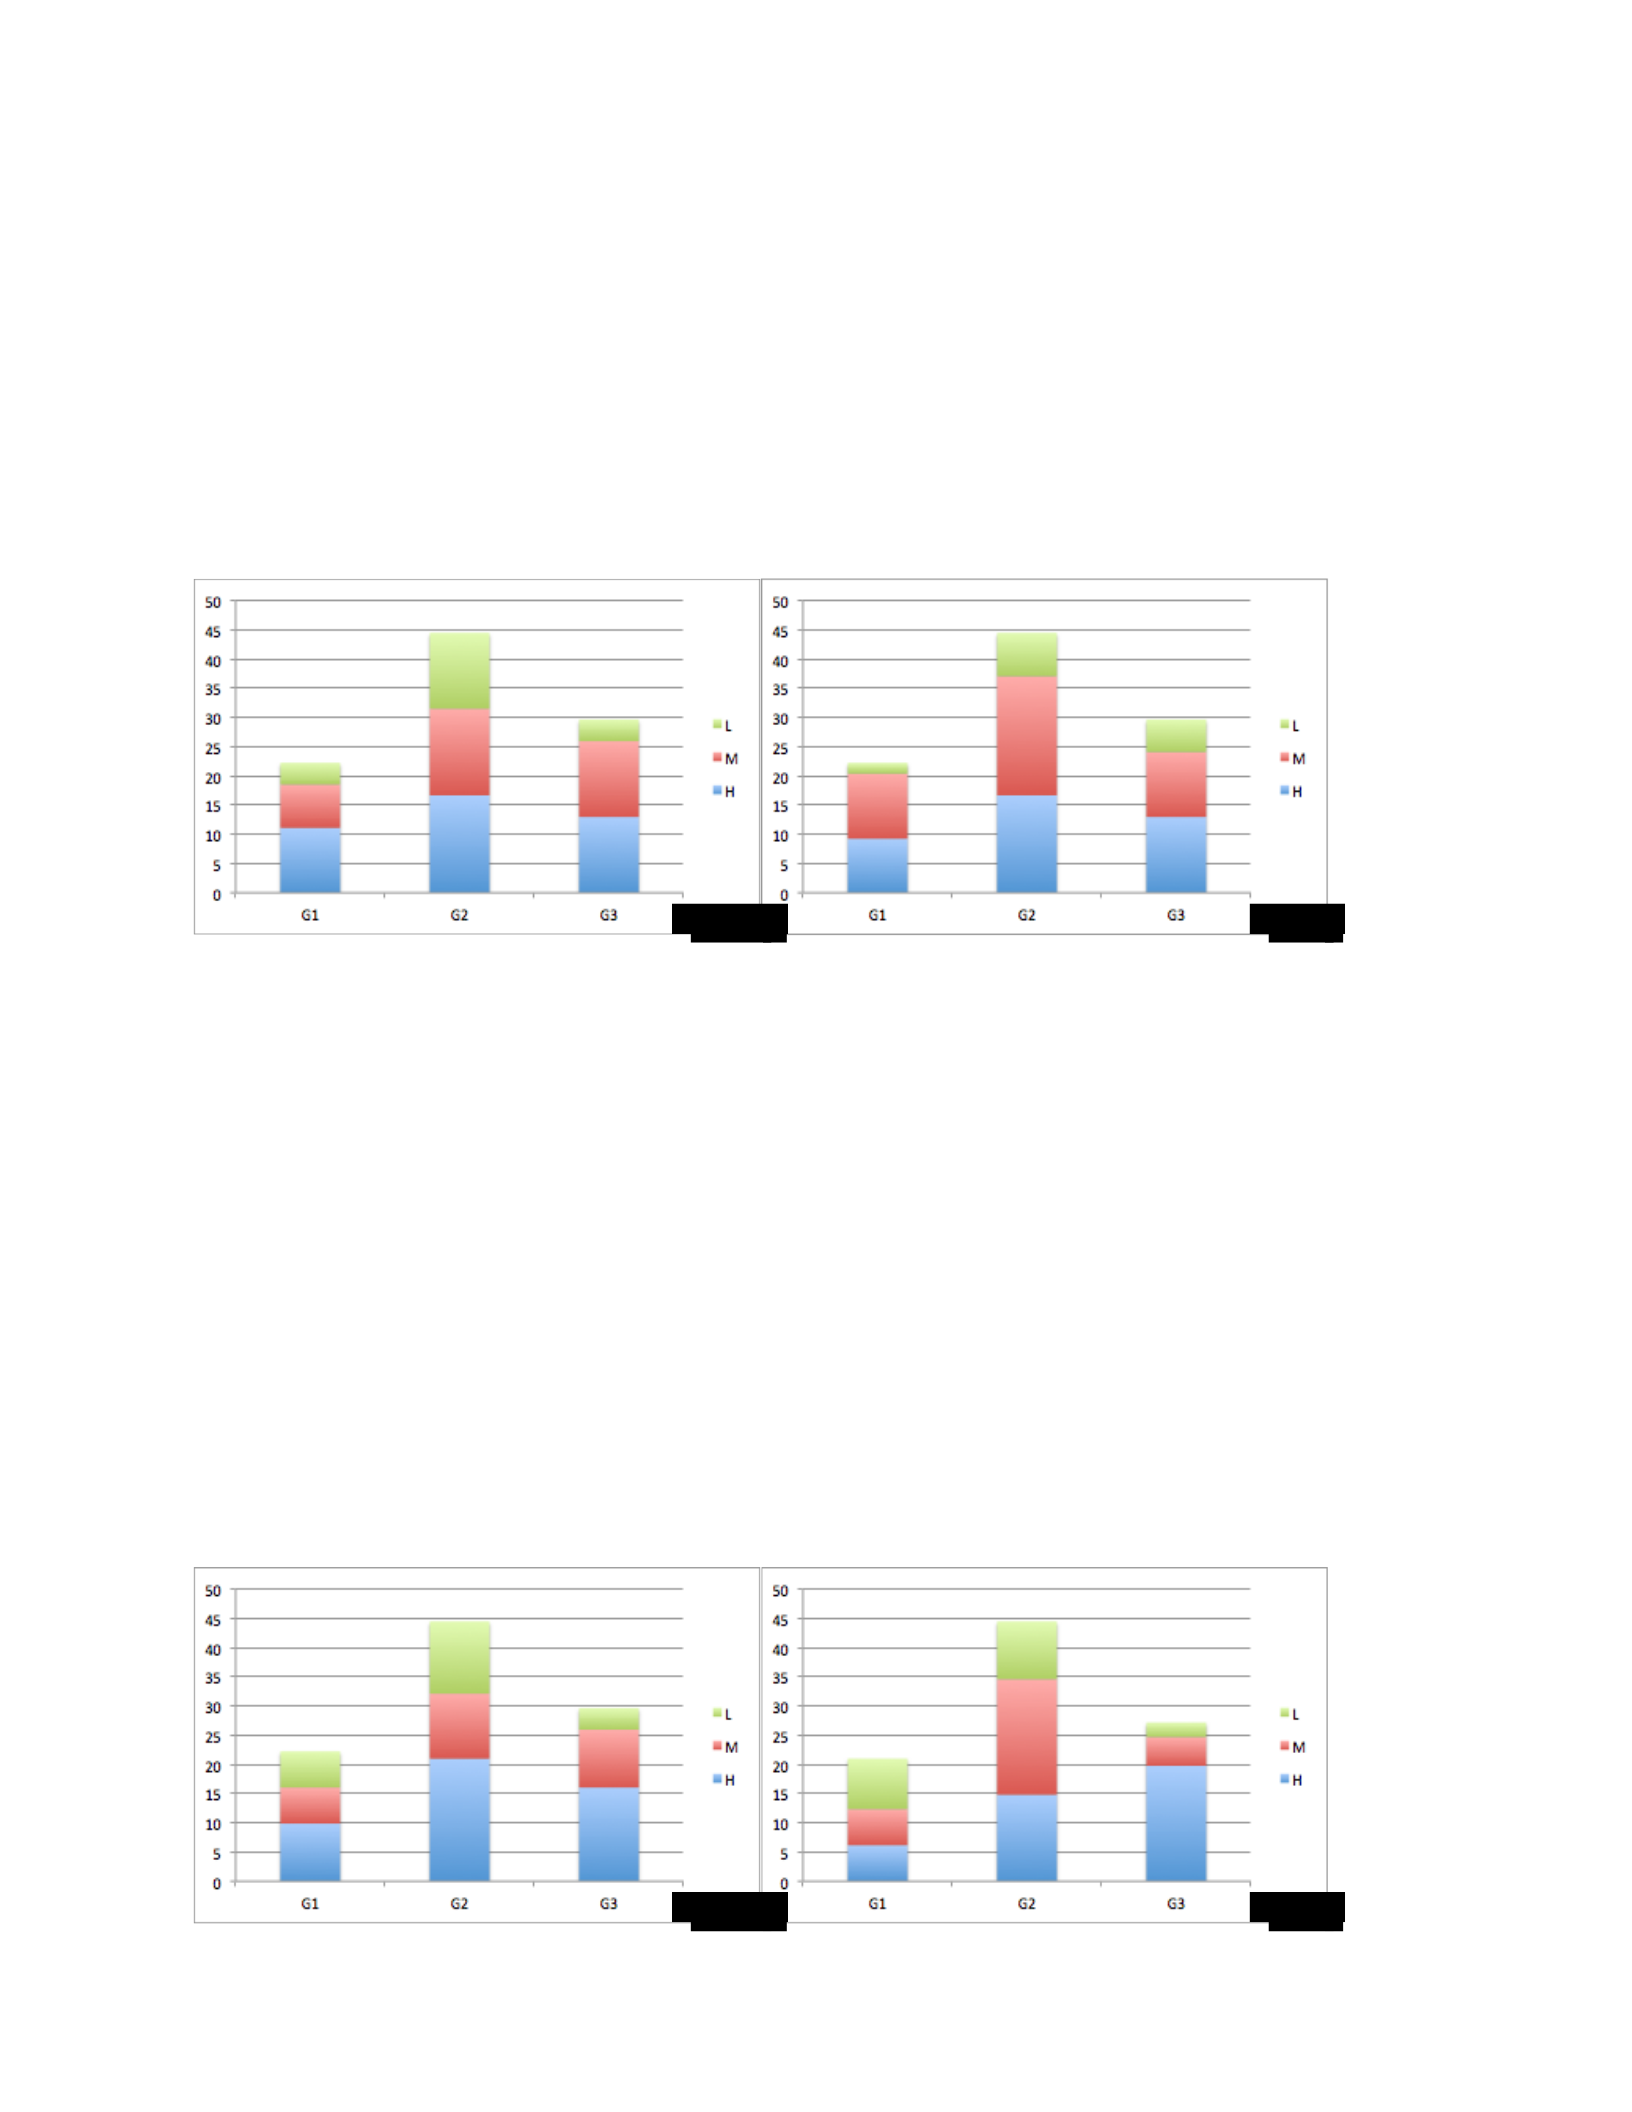
Similarly, the level 2 participants who had between 5 to 10 years of experience perceive that the
most important security policy perceptions were those related to security policy process. The
perception of this group of the participants regarding the security policy before and after the breach
was similar. However, the number of constructs that were perceived as highly significant in all of
the groups changed after the breach (refer to figure 4.40). For example, 11.1% of the constructs
related to the G1 group were considered as highly significant before introducing the breach. After
introducing the breach, this percentage changed to 9.3%.
Figure 4.40: How the five main policy themes of the Crown Confections security policy were perceived by
participants who have between 5 to 10 years of experience (before and after the breach).
Finally, similar results were drawn from the level 2 participants who had more than 10 years of
experience. Before the breach, they perceived that the most important security policy perceptions
were those related to security policy process. After the breach, the perception of this group was
changed. They perceive the constructs related to the policy content as highly significant (refer to
figure 4.41).
Before
After
Before
After

Figure 4.41: How the five main policy themes of the Crown Confections security policy were perceived by
participants who have more than 10 years of experience (before and after the breach).
To conclude, the analysis above shows that people who work for organizations that have level 2
information security policy believed that the policy process was the most important aspect that
should be taken into consideration when developing or updating security policy. However, their
perception was not stable. It was affected by the security incidents they have faced.
• SSE-CMM Level One
The participants of this group were grouped into three groups: participants who had less than 5
years of experience; participants who had between 5 to 10 years of experience; and participants
who had than 10 years of experience.
Figure 4.42 shows how the five main policy themes of the Crown Confections security policy were
perceived by participants who had less than 5 years of experience before and after the occurrence
of the security breach. The chart shows that this group of participants perceives that the constructs
related to security policy process as the most significant security policy perceptions before and
after the introduction of the security breach. Here, the perception of this group of the participants
regarding the security policy before and after the breach was similar. However, the number of the
constructs that were considered as high, medium, or low important changed after introducing the
breach. For example, 20.4% of the constructs that are related to the G2 group were considered as
highly important before introducing the breach. However, this percentage changed to 12% after
the breach.
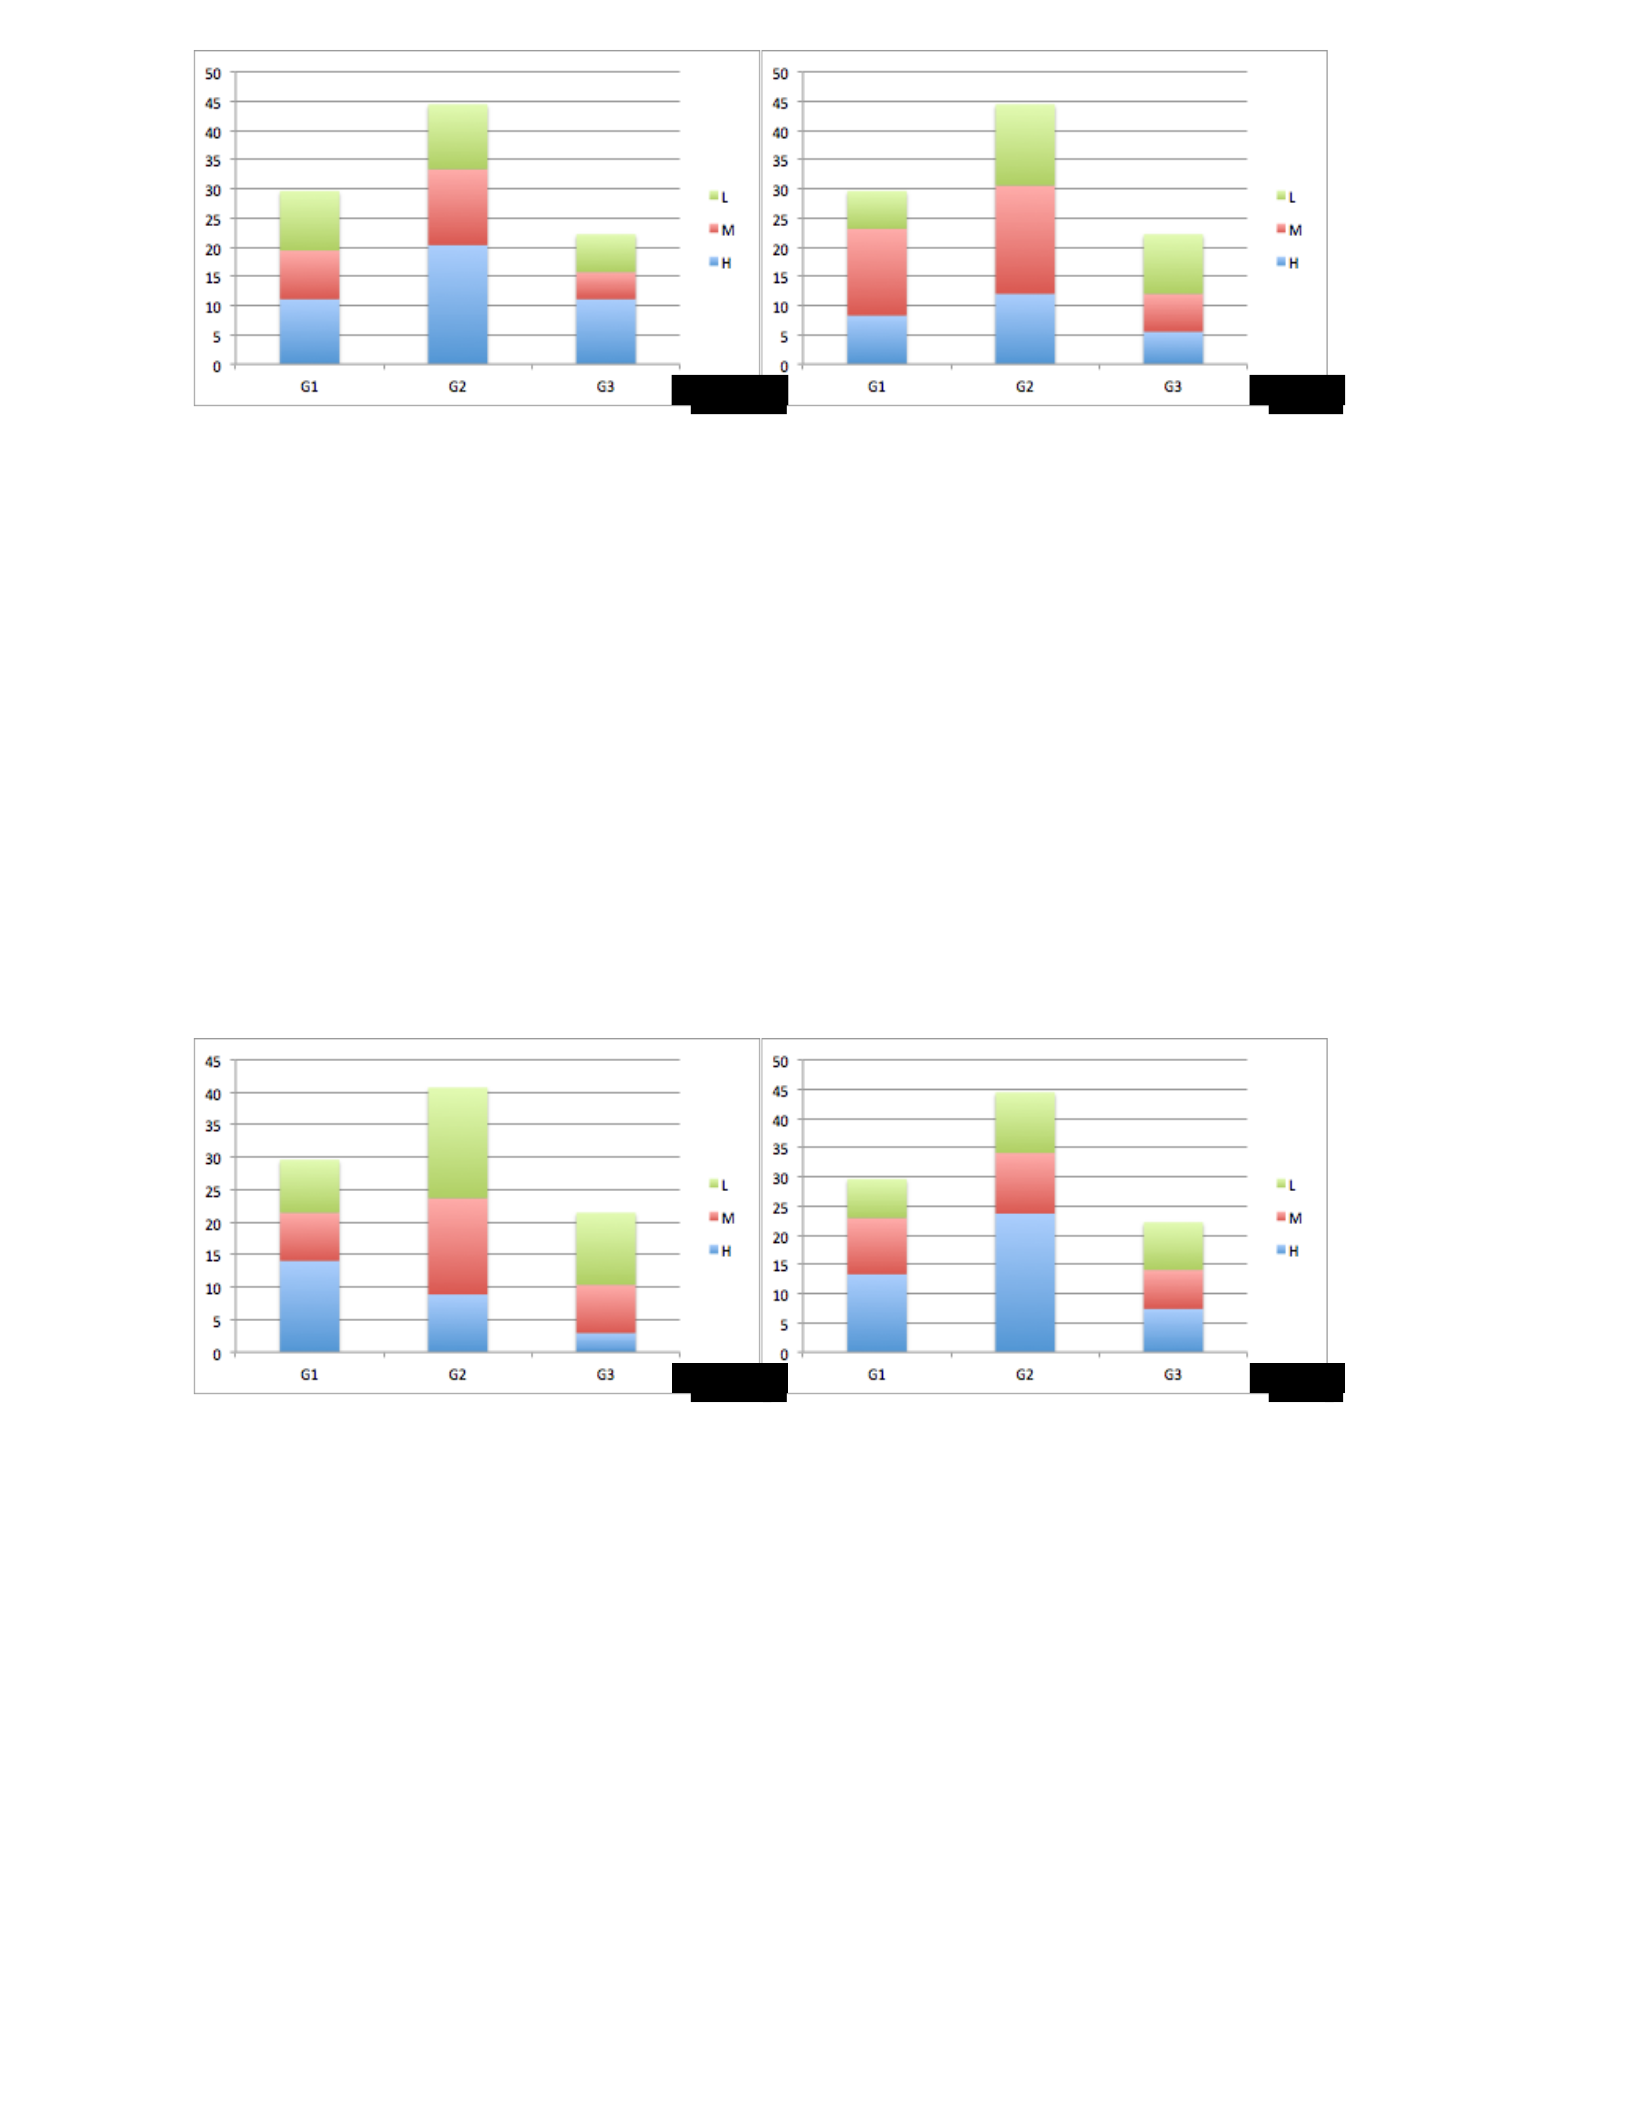
Figure 4.42: How the five main policy themes of the Crown Confections security policy were perceived by
participants with less than 5 years of experience (before and after the breach).
Different results were drawn from the level 1 participants who had between 5 to 10 years of
experience (as it is shown in figure 4.43). Before the breach, this group of participants perceived
constructs related to security policy form as the most significant security policy perceptions. After
the introduction of the security breach, they perceived that the constructs related to security policy
process as the most significant security policy perceptions (refer to figure 4.43).
Figure 4.43: How the five main policy themes of the Crown Confections security policy were perceived by
participants who have between 5 to 10 years of experience (before and after the breach).
Similarly, before the breach, level 1 participants who had more than 10 years of experience
perceived that the most important security policy perceptions were those related to security policy
form. After the breach, they perceived the constructs related to the policy process as highly
significant (refer to figure 4.44). An interesting observation from the after the breach chart was that
this group perceives that none of the constructs related to policy content were highly important.
Before
After
Before
After

Figure 4.44: How the five main policy themes of the Crown Confections security policy were perceived by
participants who have more than 10 years of experience (before and after the breach).
The analysis above shows that people who work for organizations that have level 1 information
security policy believed that policy form was the most important aspect that should be taken into
consideration when developing or updating security policy. However, their perception was not
stable. It was affected by the security incidents they have faced.
To sum up, the results from analyzing the five groups with the experience sub-grouping shows the
changes in the perceptions of the participants in each group before and after introducing the
security breach. That is, the perception of the participants regarding which constructs group is the
highest significant one was different before and after the breach. In some cases, some of the groups
perceived the same constructs group as the most important group before and after the breach. In
such cases, the difference in their perception was in the number of the constructs within the
constructs group that perceived as high, low or medium important not regarding the constructs
group that perceived as the highest important. For example, the level 3 participants who had
between 5 to 10 years of experience perceived the policy content as the most important group both
before and after the breach. However, the percentage of constructs that were rated as highly
important changed from 6.2% to 18.5%. The percentage of constructs that were rated as medium
important changed from 11.1% to 17.3%. Also, the percentage of constructs that were rated as the
least important changed from 12.4% to 13.6% after the breach (refer to figure 4.37). It is important
to point out to that the perceptions of the participants after introducing the breach not necessarily
Before
After

the right perception. That is, the occurrence of the breach does not correct the perception; it cause
changes to the participants’ perceptions, which can be reflected on their norms.
4.3.3 Principal Components Analysis (PCA)
The principal components analysis was applied on each Repertory Grid to identify the components
or factors that represent a set of bipolar constructs. PCA became a very common method to be used
in analyzing Repertory Grid data (Huang et al., 2007). It helps in identify the correlations between
constructs and group the constructs into a set of labels. This step helps in finding which constructs
are highly important. Here, the constructs were grouped using PCA using the ratings of the
participants. The aim of this analysis is to show which security policy aspects have the most effect
on developing an effective security policy.
Each grid was analyzed using principle components analysis. In this research, both Excel 2011 and
SPSS 23 were used to perform this analysis. Here, the correlation was chosen to be among the
constructs. The researcher chooses the number of factors to retain based on the eigenvalues. The
number of factors retained in this study was between three and four components. A sample of SPSS
sheet is available in the appendix.
Also, this research used Varimax Orthogonal Rotation, which is the default type of rotation. It is
important to mention that PCA was applied on the data drawn before the introduction of the breach
(called “pre-breach PCA”) and the data drawn after the breach (called “post-breach PCA”). Table
4.2 shows a sample of the loadings of one of the grids. It shows the constructs that load more than
0.70 in each component.
Table 4.2: Varimax Rotated Construct Loadings (pre-breach PCA)
Constructs
1
2
3
This policy is customized / reflect the organization's culture
0.664
0.082
-0.743
This policy is at an advanced level / provide high level of security / strong
-0.525
0.849
0.058
This policy follows the latest standard for creating policies
0.646
-0.362
-0.247
This policy shows who is responsible for what
0.205
0.062
0.975
This policy is prescriptive / shows how to do it
0.289
-0.709
-0.643
This policy is very detailed / explain all the rules in details
-0.525
0.849
0.058
Employees can have the same understanding to this policy
0.31
0.95
0.044
Removing this policy will affect the level of security in the organization
0.669
0.454
-0.589
This policy tells what to do in case of breach
-0.055
-0.101
0.992
This policy is simple, clear and straightforward
0.939
0.138
-0.313
The link between this policy and other policies is available and clear
-0.988
0.146
0.031
The purpose of this policy is clear and understandable
-0.087
0.96
-0.266
This policy is easy to remember
0.939
0.138
-0.313
The consequences of non-compliance to this policy is clear
-0.903
0.355
0.239
The consequences of non- compliance to this policy is enough
-0.903
0.355
0.239
This policy is complete / includes all the needed rules
-0.903
0.355
0.239
Easy to comply with this policy
0.952
0.157
0.254
The boundary of the policy is clear / it is clear what it covers and what not
0.134
0.617
0.622
The cost of following this policy is less than the benefit of following it
-0.289
0.709
0.643
This policy serves the business objectives / goals
0.849
0.526
0.009
This policy reflects its importance to me (as an employee)
0.31
0.95
0.044
This policy is flexible / less strict
0.952
0.157
0.254
This policy is reasonable and appropriate
0.31
0.95
0.044
This policy is written in simple, plain language
0.985
0.051
0.156
The technical part of this policy is available
-0.289
0.709
0.643
This policy is well-documented / well-structured / precise / organized
-0.289
0.709
0.643
After applying the principle components analysis on each grid, too many components were
resulted from analyzing all the grids at this stage. Thus, a priori set of labels was identified so that
the resulted components can be assigned to one of those labels. The researcher scoured the
literature for the aspects of creating an optimal policy. This scanning resulted in the following list
of labels:
• Policy process (Knapp et al., 2009): how the policy should be and should be implemented.
• Clarity of the policy (Goel and Chengalur-Smith, 2010): clearness, non-ambiguity of the
policy content and it easiness to understand.
• Policy breadth (Goel and Chengalur-Smith, 2010): the policy scope, range, or coverage.
• Policy Standards and guidelines (Peltier, 2001): aspects related to the “how” aspect of the
policy; how the rules should be applied and implemented.
• Consequences of non-compliance with policy (Hsu et al., 2015): the influence of the
noncompliance to security policy on the organization or/and the individuals within the
organization.

• Policy level of advancement (Herath and Rao, 2009): aspects related to improving or
advancing the effectiveness and efficiency of the policy.
• Policy documentation: all rules, standards and guidelines needed are documented and
available.
The next step was to assign each component to on of the labels. Here, an “inductive coding”
(Patton, 2002) was used to assign each component to the proper label. In some cases, a component
could not be assigned to any label because the constructs under that component cannot suit any
label. In this case, the components were labeled as “Ambiguous.” A second round of the inductive
coding were performed to evaluate the labeling and to see if any of the components that was labeled
as “Ambiguous” can fit any of the labels. Thus, this process did not result in any change.
For pre-breach PCA, 66 out of 222 components were labels as “Ambiguous.” Thus, 156
components were assigned to the other labels. From these components, the most influential
security policy aspects can be drawn. Table 4.3 shows a list of the labeled components that were
generated from pre-breach PCA. The “X” indicates that the component is not included in the
rotation.
For the post-breach PCA, 67 out of 218 components were labels as “Ambiguous.” Thus, 151
components were assigned to the other labels. From these components, the most influential
security policy aspects can be drawn. Table 4.4 shows a list of the labeled components generated
from post-breach PCA. The “X” indicates that the component has not been included in the
rotation.

Table 4.3: summary of pre-breach PCA that shows the labels of the components.
The SSE-CMM Level
Grid#
Component 1
Component 2
Component 3
Component 4
L1
1
Ambiguous
Process
Guideline
Process
2
Ambiguous
Process
Consequences
Guideline
3
Process
Ambiguous
Level of advancement
Guideline
4
Breadth
Ambiguous
Process
Process
5
Ambiguous
Ambiguous
Consequence
Guideline
6
Clarity
Clarity
Ambiguous
Process
7
Level of advancement
Ambiguous
Clarity
Ambiguous
8
Ambiguous
Process
Clarity
Clarity
9
Documentation
Ambiguous
Process
Process
10
Ambiguous
Process
Clarity
Ambiguous
11
Clarity
Process
Guideline
X
L2
1
Ambiguous
Process
Guideline
X
2
Ambiguous
Process
Clarity
Ambiguous
3
Process
Clarity
Process
Guideline
4
Ambiguous
Breadth
Guideline
Process
5
Process
Clarity
Process
Consequence
6
Process
Ambiguous
Ambiguous
Consequence
7
Process
Breadth
Clarity
Clarity
8
Ambiguous
Process
Breadth
Clarity
L3
1
Ambiguous
Process
Clarity
Clarity
2
Clarity
Ambiguous
Ambiguous
Process
3
Documentation
Ambiguous
Ambiguous
Process
4
Ambiguous
Consequence
Documentation
Ambiguous
5
Process
Ambiguous
Ambiguous
Clarity
6
Process
Consequence
Process
Clarity
7
Process
Ambiguous
Process
Breadth
8
Process
Ambiguous
Process
Clarity
9
Process
Breadth
Ambiguous
Process
10
Ambiguous
Process
Clarity
Clarity
11
Clarity
Process
Process
X
12
Process
Clarity
Ambiguous
Process
L4
1
Clarity
Ambiguous
Process
Ambiguous
2
Ambiguous
Ambiguous
Process
Process
3
Ambiguous
Ambiguous
Process
Process
4
Clarity
Process
Process
Process
5
Ambiguous
Clarity
Process
Consequence
6
Ambiguous
Clarity
Breadth
X
7
Clarity
Process
Process
Consequence
8
Process
Clarity
Process
Ambiguous
9
Ambiguous
Ambiguous
Process
Process
L5
1
Clarity
Process
Clarity
Process
2
Ambiguous
Process
Clarity
Consequence
3
Ambiguous
Ambiguous
Clarity
Breadth
4
Ambiguous
Clarity
Documentation
Guideline
5
Ambiguous
Ambiguous
Consequence
Process
6
Ambiguous
Ambiguous
Breadth
Clarity
7
Ambiguous
Clarity
Clarity
Consequence
8
Breadth
Breadth
Ambiguous
Guideline

9
Ambiguous
Clarity
Consequence
Documentation
10
Process
Ambiguous
Process
X
11
Process
Clarity
Guideline
Guideline
12
Ambiguous
Ambiguous
Documentation
Documentation
13
Process
Clarity
Ambiguous
Guideline
14
Ambiguous
Process
Ambiguous
Documentation
15
Documentation
Clarity
Process
Consequence
16
Clarity
Clarity
Clarity
Process
17
Clarity
Process
Consequence
Process
Table 4.4: summary of post-breach PCA that shows the labels of the components.
The SSE-CMM Level
Grid#
Component 1
Component 2
Component 3
Component 4
L1
1
Ambiguous
Process
Process
Clarity
2
Documentation
Clarity
Consequence
Guideline
3
Clarity
Ambiguous
Ambiguous
Process
4
Ambiguous
Process
Clarity
Consequence
5
Clarity
Process
Documentation
Consequences
6
Process
Documentation
Clarity
Breadth
7
Ambiguous
Process
Process
Documentation
8
Ambiguous
Process
Documentation
Process
9
Breadth
Process
Consequence
Process
10
Ambiguous
Process
Process
Guideline
11
Process
Clarity
Documentation
Ambiguous
L2
1
Ambiguous
Breadth
Process
Breadth
2
Process
Documentation
Process
Clarity
3
Process
Breadth
Ambiguous
Documentation
4
Breadth
Ambiguous
Process
Ambiguous
5
Process
Ambiguous
Clarity
Breadth
6
Ambiguous
Clarity
Consequence
Breadth
7
Ambiguous
Documentation
Ambiguous
Process
8
Process
Documentation
Ambiguous
Process
L3
1
Ambiguous
Clarity
Process
Ambiguous
2
Clarity
Documentation
Ambiguous
Process
3
Ambiguous
Process
Process
Breadth
4
Ambiguous
Consequence
Consequence
Ambiguous
5
Ambiguous
Documentation
Ambiguous
Consequence
6
Process
Process
Process
Breadth
7
Process
Ambiguous
Ambiguous
Consequence
8
Process
Process
Breadth
Ambiguous
9
Process
Ambiguous
Ambiguous
Process
10
Process
Ambiguous
Documentation
Process
11
Clarity
Ambiguous
Process
X
12
Ambiguous
Ambiguous
Process
Documentation
L4
1
Ambiguous
Process
Clarity
Breadth
2
Breadth
Ambiguous
Process
X
3
Ambiguous
Documentation
Process
Clarity
4
Clarity
Process
Ambiguous
Process
5
Breadth
Ambiguous
Breadth
Consequence
6
Ambiguous
Documentation
Breadth
Ambiguous
7
Ambiguous
Clarity
Ambiguous
Consequence
8
Process
Ambiguous
Documentation
Clarity
9
Ambiguous
Process
Process
Ambiguous
L5
1
Ambiguous
Process
Process
Clarity
2
Ambiguous
Ambiguous
Consequence
Level of advancement
3
Ambiguous
Process
Clarity
Documentation
4
Process
Ambiguous
Documentation
Clarity
5
Ambiguous
Process
Ambiguous
Process
6
Process
Ambiguous
Process
Clarity

7
Ambiguous
Documentation
Ambiguous
Consequence
8
Documentation
Ambiguous
Clarity
Documentation
9
Ambiguous
Clarity
Documentation
Process
10
Process
Ambiguous
Level of advancement
Process
11
Ambiguous
Breadth
Documentation
Breadth
12
Process
Process
Ambiguous
Clarity
13
Process
Ambiguous
Breadth
Documentation
14
Ambiguous
Process
Documentation
Clarity
15
Documentation
Ambiguous
Process
Process
16
Ambiguous
Clarity
Ambiguous
Documentation
17
Ambiguous
Process
Documentation
Process
By applying the eyeball analysis on both tables, we can conclude which bipolar constructs (i.e.
perceptions of the security policy) that had the most influence on the effectiveness security policy.
For the pre-breach PCA, the predominant, the most influential security policy perceptions were
those related to policy process. The second predominant security policy perceptions were those
related to policy clarity. The third predominant security policy perceptions were those related to
consequences of non-compliance with the security policy. Table 4.5 shows the number of
occurrence of each label for the pre-breach PCA. For the post-breach PCA, the predominant, the
most influential security policy perceptions were those related to policy process. The second
predominant security policy perceptions are those related to documentation of the policy. The third
predominant security policy perceptions were those related to policy clarity. Table 4.6 shows the
number of occurrence of each label for the post-breach PCA.
Table 4.5: the number of occurrence of each label for the pre-breach PCA.
The Factor
# Of Occurrence
Process
66
Clarity
45
Consequence
13
Guideline
12
Breadth
11
Documentation
6
Level of advancement
1
Ambiguous
62
Total
216

Table 4.6: the number of occurrence of each label for the post-breach PCA.
The Factor
# Of Occurrence
Process
67
Documentation
28
Clarity
27
Breadth
19
Consequence
12
Level of advancement
2
Guideline
2
Ambiguous
67
Total
218
The results of pre-breach and post-breach PCA agreed on the first predominant perception of the
information security policy. However, they were different in the ranking of the rest of perceptions.
Thus, the participants agreed on that the policy process had the most effect on developing an
effective security policy. Examples of the aspects related to policy process are that “the policy
should follow the latest standard,” and “the policy should reflect the organization culture.” Also,
table 4.5 shows that the policy clarity (as the second predominant group) had a major effect on the
security policy perception before the introduction of the breach. That is, before introducing the
security breach the participants believed that the security policy should be clear and readable.
Examples of the aspects related to policy clarity include “the purpose of the policy being clear”
and “the policy being written in simple, clear language.” On the other hand, table 4.6 shows that
the policy documentation (as the second predominant group) had a major effect on the security
policy perception after the introduction of the breach. That is, after introducing the security breach,

participants believed that the security policy should be well documented in a structured and
organized manner.
The third predominant factor before the breach was the aspects related to consequences of
noncomplying to security policy. In other words, participants believe that the consequences of
noncomplying with the security policy should be available, clear, and sufficient. The consequences
include the consequences on individuals (punishment and rewards) and organizations. The third
predominant factor after the breach was the aspects related to security policy clarity. In other words,
the participants believed that the security policy should not be ambiguous. The last three factors
on each table had less effect on the perception of the security policy.
Another interesting result can be drawn from this analysis. Comparing the results of the prebreach
PCA and post-breach PCA reveals the change in the participant’s perceptions regarding which
factors have the major influence on the perception of the security policy. Tables 4.5 and 4.6 show
that before the breach, the three factors that had the major influence were: policy process, policy
clarity and consequences of non-compliance. This result is consistent with the previous studies.
After the breach, the three factors that had the major influence were: policy process, policy
documentation, and policy clarity. Knapp et al. (2009) emphasize the importance of policy process
and how it can contribute to the success of the information security. Goel and Chengalur-Smith
(2010) use the clarity as one of the dimensions to measure the effectiveness of the policy. They
considered clarity as one of the vital aspects of the quality of the security policy. Trevino (1992)
argues that punishment (as a consequence of non-compliance) may affect norms of employees in
an organization and prevent deviant behaviors. Thus, punishment can result in favorable results.
Also, Sims (1980) emphasizes that a reward has a strong influence on individuals’ behavior. Thus,
knowing the consequences motivates individuals to comply with the policy.

4.4 Conclusion
In the alpha stage, we studied how individuals in an organization perceived the security policy of
their organization differently and how their perceptions changed after the occurrence of a security
breach. The aim of this chapter is to develop the alpha version of the artifact that can be used to
develop the beta artifact at the beta stage. Here, the alpha version artifact was the Repertory Grid
that was rated by the participants before and after the occurrence of the security breach (refer to
figure 4.1).
After the ratings, the grids were analyzed qualitatively and quantitatively. First, the grids were
subject to core categorization, where the constructs were grouped into three groups. Then, each
one of the grids was analyzed using content analysis and principal components analysis (PCA).
The results of these analyses showed how participants had different perceptions regarding the
security policy and how their perceptions changed after the occurrence of a security breach.
Chapter 5: Experimental Definition of the Artifact
5.1 Introduction
The aim of the second stage (the beta stage) is to develop a beta version of the artifact. The alpha
stage aims to develop the alpha version of our artifact; the emerging norm-rule compliance
RepGrid. In the beta stage, the alpha artifact is tested and validated to develop the beta artifact, i.e.

more mature norm-rule compliance RepGrid. The beta stage allows for a full involvement that
comprises assessing the artifact “in the use setting” (Sein et al., 2011). Thus, the beta atage of this
study evaluates and refines the artifact resulted from the alpha stage through simulating a real e-
commerce organization and applying Repertory Grid data collection and analysis to get the beta
version of the RepGrid.
In this chapter, we provide a detailed explanation of the beta stage process. The beta stage aims to
study people perceptions regarding security policy of their organization and how their perceptions
change following the occurrence of security incidents. It will build a more mature artifact,
following Kelly’s Repertory Grid technique explained in the chapter three.
As previously mentioned, Repertory Grid is represented in two-dimensional grids that can be
analyzed qualitatively and quantitatively. In this stage, elements were the main five policies in
Crown Confections security policy: acceptable use policy, information security roles and
responsibilities, password policy, email policy, and remote access policy. These elements were
supplied from the Crown Confections security policy. The constructs in the beta stage were elicited
from one group and compared to the constructs from the alpha stage to generate the final version
of the beta stage constructs. Then, the constructs were supplied to another group for rating. This
research adopts a hybrid type of Repertory Grid between fixed RepGrid and fixed element
RepGrid, as the constructs were elicited from one group and supplied to another.
5.2 Data collection
The beta stage of this study was conducted over a period of three months. As mentioned before,
elements were the main five policies of Crown Confections security policy. These “supplied”
elements are: clean desk policy, information security roles and responsibilities, password policy, E-
mail policy, and remote access policy.

Then, these elements were used in the constructs elicitation. The elicited constructs represent
individuals’ perceptions regarding the security policy of their organization.
5.2.1 Eliciting Bipolar Constructs ii.
Participants
Again, a purposive sample was achieved to represent the “expert” group at the beta stage. This
sampling technique was used to serve the needs of this study. As mentioned before, purposive
sampling helps in mitigate research biases and ensure that the sample is more representative (Miles
et al., 1994). Thus, four security professionals who had a good experience with information
security were chosen to represent the “expert” group. Each of them had worked in at least two
different organizations. The expert group was used to elicit the constructs in this stage. iii.
Structured interviews and Construct Elicitation
In this research, RepGrid interviewing technique, which is grounded on Kelly’s (1955) Personal
Construct Theory is used to elicit the bipolar constructs from the expert group. Four one-to-one
RepGrid Structured interviews were conducted with the four experts to elicit a set of “bipolar”
constructs that shows how each expert perceives the security policy. Each interview was arranged
through email contact with each expert. A copy of the Crown Confections security policy was sent
to each expert before the day of the interview. Indeed, one interview was conducted in a day. Each
interview took between one to one and half hours. After each interview, the researcher reviewed
the script and reflected. A point of saturation was reached after the third interview. That is, the
fourth interview did not add any new constructs. However, the interviews were continued after the
saturation point was reached to ensure that different types of experts were covered. Before the
beginning of the interview, the purpose and background of this research were explained and
clarified. Then, the process of the RepGrid interview adopted in this study (i.e. triadic) was
introduced to each expert. The researcher used five index cards to conduct the interviews; each

card contains one of the five elements. The researcher clarified that the purpose of the interview
was to elicit the participant’s perception regarding each one of the five security policies. In each
interview, index cards were provided to the participant in triads (i.e. three cards at a time). The
expert was asked to identify which two of the three policies are similar and how the third is
different. Getting two similar policies provided a construct, while eliciting how the third policy
differs provided the opposite. The researcher gave each expert some time to think before getting
her or his response. This process was repeated for many triads in each interview. The researcher
continued presenting new triads until a saturation point was reached. After some “trial and error,”
the researcher was able to get some “good” constructs.
Each interview script was transcribed and reviewed by the corresponding expert to check and
change if needed. Three of the experts verified the elicited bipolar constructs. One of the experts
requested some changes. The interviews were recorded in case the researcher needed clarification
for some information. After eliciting the constructs from the four experts, the beta stage constructs
were compared to the alpha stage constructs for evaluation and refinement. Most of the constructs
from the alpha stage were mentioned by at least one expert from the beta stage. One of the
constructs (i.e. “This policy is complete/ includes all the needed rules”) was not mentioned by any
experts at this stage. The constructs “The consequences of non-compliance to this policy is clear,”
and “The consequences of non-compliance to this policy is enough” were mention in more details
at this stage. That is, these two constructs were replaced by the following constructs: “The risk of
non-complying to this policy is available and clear,” “The sanctions of non-complying to this
policy are stated clearly/explicit,” “The sanctions of non-complying to this policy are enough,” and
“The sanctions of non-complying to this policy are specific.” Eight new constructs that were not
mentioned at all by the experts from the alpha stage were added at this stage. A total of 34 bipolar
constructs were resulted at this stage. Before starting the process of rating the constructs, the overall
bipolar construct was supplied. The overall construct should be broad so that it can be applied to

all elements. Each participant should rate the overall bipolar construct against each element using
the five-point Likert scale. The overall bipolar constructs were as follows:
Overall, this policy is comprehensive and robust -- Overall, this policy is neither comprehensive nor robust The
resulted data from rating the overall construct is useful in comparing different grids using Honey’s
(1979) content analysis (as shown in the next section).
A RepGrid interview sheet was used to record the resulted bipolar constructs such that the lefthand
column represents the construct, and the right-hand column represent the opposite. Figure 5.1
shows a sample of a RepGrid interview sheet with the resulted 34 bipolar constructs in addition to
the supplied overall construct.
5
1
This policy is customized / reflect the organization's culture
This policy is standard / similar to other organizations
This policy is in advanced level / provide high level of
security / strong
This policy is in basic level / does not provide high level of
security / weak
This policy follows the latest standard for creating policies
This policy does not follow the latest standard for creating
policies
This policy shows who is responsible for what/ The
employee can know if it applicable to him/her or not
This policy does not shows who is responsible/ The
employee can’t know if it applicable to him/her or not
This policy is prescriptive / shows how to do it (guidelines is
included)
This policy is descriptive / shows only what to do
This policy tells what to do in case of breach / the guideline
to execute the policy is clear
This policy does not tell what to do in case of breach
The standards and guidelines are clearly separated
The standards and guidelines are mixed and overlap
The standards within this policy do not conflict with other
standards and policies
This policy has some standards that conflict with other
standards and policies
The standards within this policy are consistent
The standards within this policy are not consistent/ conflict
This policy has the required level of detail / explain all the
rules in details
This policy is does not has the required level of detail/ brief
and general
This policy has the required controls/ rules
Some necessary controls need to be added to this policy
Employees can have the same understanding to this policy
This policy is open to different interpretations
Removing this policy will affect the level of security of the
organization
Removing this policy will not affect the level of security
This policy is simple, clear and straightforward
This policy is complicated, ambiguous and not
understandable
This policy is accurate and precise
This policy lacks of accuracy and precision
The standards within this policy are not repeated in other
policies
Some of the standards within this policy are repeated in other
policies
This policy is easy to remember
This policy is hard to remember
The link between this policy and other policies is available
and clear
The link between this policy and other policies is not
available/ not clear

This policy has standards that are subset of another policy
This policy does not has any standard that is subset of
another policy
The purpose of this policy is clear and understandable
The purpose of this policy is not clear
The risk of non-complying to this policy is available and
clear
The risk of non-complying is not available / not clear
The sanctions of non-complying to this policy are stated
clearly/ explicit
The sanctions of non-complying to this policy are not stated
clearly/ need more details
The sanctions of non-complying to this policy are enough
The sanctions of non-complying are not enough
The sanctions of non-complying to this policy are specific
The sanctions of non-complying to this policy are subjective
and not specific
Both the technical and business parts of this policy are
available
The technical part or business part is missing
Easy to comply with this policy
Hard or impossible to comply with this policy
The boundary of the policy is clear / it is clear what it cover
and what not
The boundary of the policy is not clear / it is not clear what it
cover and what not
The cost of following this policy is less than the benefit of
following it
The cost of following this policy exceeds the benefit of
following it
This policy serves the business objectives / goals
This policy does not serve the business objectives / goals
This policy reflects its importance to me (as an employee) / it
is important for the security of the organization
This policy does not reflect its importance to me (as an
employee) / it is not important for the security of the
organization
This policy is flexible / less strict
This policy is more strict
This policy is reasonable and appropriate
This policy is not reasonable
This policy is written in simple, plain language
This policy is include some technical terminologies that are
not understandable by all employees
This policy is well-documented / well-structured / precise /
organized
This policy is not well-documented / not well-structured
Overall, this policy is comprehensive and robust
Overall, this policy is not comprehensive nor robust
Figure 5.1: Sample of a RepGrid interview sheet with the 34 bipolar constructs that were resulted from the beta
stage plus the supplied overall construct.
5.2.2 Rating the Elements
Each element should be rated against each of the elicited bipolar constructs. As mentioned above,
in this stage we simulated a real organization and applied the Repertory Grid technique to collect
and analyze the data. We created five versions of the Crown Confections security policy according
to SSE-CMM Levels and associated a proper version of the security policy.
ii. Participants
A group of 46 participants (excluding the “expert” group) was divided into five sub-groups. That
is, the first group involved 8 participants and representd an organization with the first level of the
SSE-CMM (i.e. performed informally). The second group contained 10 participants and
represented an organization with the second level of the SSE-CMM (i.e. planned and tracked). The

third group consisted of 10 participants and represented an organization with the third level of the
SSE-CMM (i.e. well defined). The fourth group consisted of 9 participants and represents an
organization with the fourth level of the SSE-CMM (i.e. qualitatively controlled). The fifth group
had 10 participants and represented an organization with the fifth level of the SSE-CMM (i.e.
continuously improving). Five versions of security policy were developed in accordance with SSE-
CMM Levels. Each group was given the intended version of the security policy. The five versions
of the security policy were created based on the SANS Institute Information Security Policy
Templates (SANS, 2015). Also, some demographic information was collected including like age
and experience.
iii. Rating Process
In this stage, five sessions of the Crown Confections e-commerce company were conducted and
associated a proper version of the security policy. The participants were randomly associated with
each session, and the intended security policy was given to the participants before the day of the
experiment. In each company session, the Crown Confections company was introduced. Each
participant was given a particular role within the Crown Confections. Examples of the roles
assigned to the participants include order fulfillment, finance, technical service, and call center.
The researcher was the CEO of the company. The experiment was conducted in laboratory settings.
All of the participants were working on the Crown Confections website that was develop for the
purpose of this study. Each participant was given some responsibilities based on her or his role in
the company. For example, participants working in the order fulfillment department were
responsible for processing the orders. Participants who were working at the technical service were
responsible for exploring the website and creating a report for any technical problem. Each session
lasted between 3-4 hours. At the beginning of the session, the researcher explained the process of
the experiment and the purpose of the study. Then, each participant was assigned to a certain role.
After the introduction, the participants started working on based on their assigned roles. After 30
minutes, the participants were asked to rate the constructs that were elicited from the “expert”

group in addition to the supplied overall construct using a five-point Likert scale, such that 5
represents the construct and 1 represents the opposite.
The rating process reflects how the participants perceive the Crown Confections security policy.
The participants were given between one hour and one hour and fifteen minutes to do the first
rating (i.e. the pre-breach rating). Here, some demographic information was collected for the
purpose of analysis. In total, 46 grids have resulted from the pre-breach rating process.
During the first rating, the researcher introduced a security breach. A different security breach was
introduced to each group (see table 5.1). The participants had no idea that a security breach would
be introduced. Table 5.1 shows the scenarios for the five security breaches introduced to the five
groups. After the rating, the participants were asked to go back to their assigned roles such that
they could experience the breach.
Table 5.1: Scenarios for the five security breaches that were introduced for the five groups.
The Scenario
The group
A person stole the names, addresses and personal details of all the Crown Confection customers and
employees. That person sent an email to the Crown Confections employees that said:
Hey... I cracked it. Now I have the names, addresses and personal details of all the Crown Confection
customers and employees. Use them as you please. I am just a hacker doing this for fun.
Then, another email was sent to the employees from the Crown Confections admin said:
All,
A security breach was taking place today. Someone logged into Crown Confections server and
downloaded some database files that include confidential information related to customers and
employee.
We are really sorry that you have experienced this breach. We will offer one year of credit monitoring
to ensure that your personal information is not abused.
Level 1 group

“Phishing” E-mail was sent to the employees and asked them to update their information (name,
address, SSN, DOB, email, etc.). After few minutes, another email was sent to the employees from
the Crown Confections admin that said:
All,
ALERT! Our systems were breached today. There was a phishing attack. Crown Confections
employees were asked to update their information. Personally identifiable information was stolen
and may be used inappropriately.
Please be aware of such attacks in the future.
Level 2 group
The employees to sign in to the systems by their own.
Suppose a person previously installed a keylogger in our system and all or some of the usernames
and passwords of admin and employees were stolen. That person sends an email to all employees
including administrator stating that:
Hi Crown Confections
All the credentials are mine now. The fun will begin soon.
Then, another email was sent to the employees from the Crown Confections admin said:
All,
A security breach has taking place today. Someone installed a keylogger spyware on Crown
Confection systems. Some of the credentials of Crown Confection employees may have been stolen.
These may subsequently be used inappropriately.
We are really sorry that you have experienced this breach.
Level 3 group
Suppose that an employee copied customers’ data (includes: names, address and credit cards
information) on a sticky note while taking Telephone orders. These sticky notes were stolen, which
means customers’ data were stolen. The person who stole these data sent an email to Crown
Confections’ employees, with a picture of the sticky notes said:
Thanks, Crown Confections. All these are mine.
Then, another email was sent to the employees from the Crown Confections admin said:
All,
A security breach was taking place today. Someone got the customer(s) information that was written
on a paper note while taking phone orders.
We are currently working on investigating the problem and ensure that customers’ information is not
abused and to ensure such behavior is not happening in the future.
Level 4 group
Delete all the information from the database (customers information, employees information,
financial information and orders).
Then, an email was sent to the employees from the Crown Confections admin that said:
All,
A security breach was taking place today. Someone had access to Crown Confections database and
deleted sensitive information related to customers, employees and financial information.
We are really sorry that you have experienced this breach. We are currently working on investigating
the problem.
Level 5 group

After the participants experienced the breach, the researcher asked them to respond based on the
given security policy and to re-think the given security policy. After that, the participants were
asked to re-rate the same bipolar constructs. In total, 92 grids resulted, 46 grids before the breach
and 46 after the breach.
5.3 Data Analysis and Results
Similar to the alpha stage, the data from the beta stage was analyzed both qualitatively and
quantitatively. The data was analyzed using data coding and categorization, and content analysis
beside the statistical analysis (Jankowicz, 2004).
As mentioned before, selecting the quantitative data analysis method depends on the type of data
generated from the RepGrid rating (Bell, 1988). Therefore, the type of data at hand should be
defined before deciding on the quantitative data analysis method. The data from this stage was
generated through rating the grids using a five-point Likert scale. The ratings that were generated
from the grids of the beta stage were integers that were ranging between one and five. That is, this
stage adopted an interval scale as measurement scale to generate interval data. An interval scale
was adopted because the distance between two consecutive points is equal.
Besides, the data of the grids are almost normally distributed and satisfy the homoscedasticity.
Also, the elements and constructs have a linear relationship. These features embody the
assumptions of the principal components analysis. To analyze the bipolar constructs, this stage
applies Honey’s (1979) content analysis. Indeed, the type of data is not an issue with Honey’s
(1979) content analysis.
As we know, there are many software packages that can be used to elicit and/or analyze Repertory
Grids. In this stage, Excel 2011 and SPSS 23 were used to analyze the generated
grids.

5.3.1 Core Categorization
The bipolar constructs should be categorized before performing the content analysis. Eliciting
perceptions regarding security policy from the “expert” group resulted in 34 bipolar constructs.
These constructs should be classified to be more manageable through applying core categorization
process (Jankowicz, 2004).
The core categorization process is important before doing the content analysis so the results can
have more meaning (Jankowicz, 2004). First, we need to generate a set of themes or categories.
Different methods can be used to develop the themes or categories such as using pre-existing
categories that are available in the literature or from the international standards. In case the
literature and standards do not provide categories for perceptions, Jankowicz (2004) suggests using
“bootstrapping” technique to generate. In this stage, the “bootstrapping” technique was adopted to
classify the perceptions regarding security policy.
First, each construct was examined by comparing it with the other constructs. If a construct was in
some way similar to the first construct, the two constructs were assigned to the same category. On
the other hand, if the construct was different from the first one, the construct was assigned a
separate category. The remaining constructs were compared with the constructs under each
category and placed under the suitable category. If the construct did not fit any category, a new
category should be generated. This process was continued until all constructs were categorized.
The unclassified constructs were placed under one category called “miscellaneous,” which should
not include more that 5% of the constructs (Jankowicz, 2004).
A reliability check was performed after generating the first version of the categories with an
information security expert. A crosschecking was conducted to validate the constructs
categorization. The information security expert had high-level knowledge of and experience with
information security. The expert was given the categories and the constructs and was asked to
approve or suggest changes the categories. The expert could generate a new category as needed.

Here, the same categories from the alpha stage were suggested and discussed with the expert. We
tried to fit the constructs under these categories and asked the expert to verify the categorization.
The expert approved these categories. The three main categories used in the core categorization
process were policy form, policy content, and policy process. The constructs that were under policy
form category represented 32.4% of the constructs. The policy content category comprised 26.5%
of the constructs. The policy process category contained 41.1% of the constructs. These categories
were used in the content analysis discussed below.
5.3.2 Content Analysis
This section discusses the process of content analysis was performed for the 46 pre-breach grids
and the 46 post-breach grids. The 46 pre-breach grids were sub-grouped into five subgroups (as
previously mentioned) in accordance with the SSE-CMM five levels. The same process was
applied for the 46 post-breach grids. Each of these groups was subject to content analysis as one
group. Also, each one of the five groups was categorized into subgroups, and these subgroups were
analyzed to compare perceptions of different groups of participants. Each group of the five groups
was sub-grouped once based on the age range and once based on the experience.
The content analysis method adopted in this stage is Honey’s (1979) content analysis, which is
described in Jankowicz (2004) book. As described in the previous chapter, the content analysis
process was performed as follows:
Step 1: Identify ratings for the overall construct regarding each element. The ratings of overall
construct reflected the overall perception of each participant. Figure 5.2 shows a sample grid with
the overall construct rating that rated as 4, 4, 5, 5, and 5.
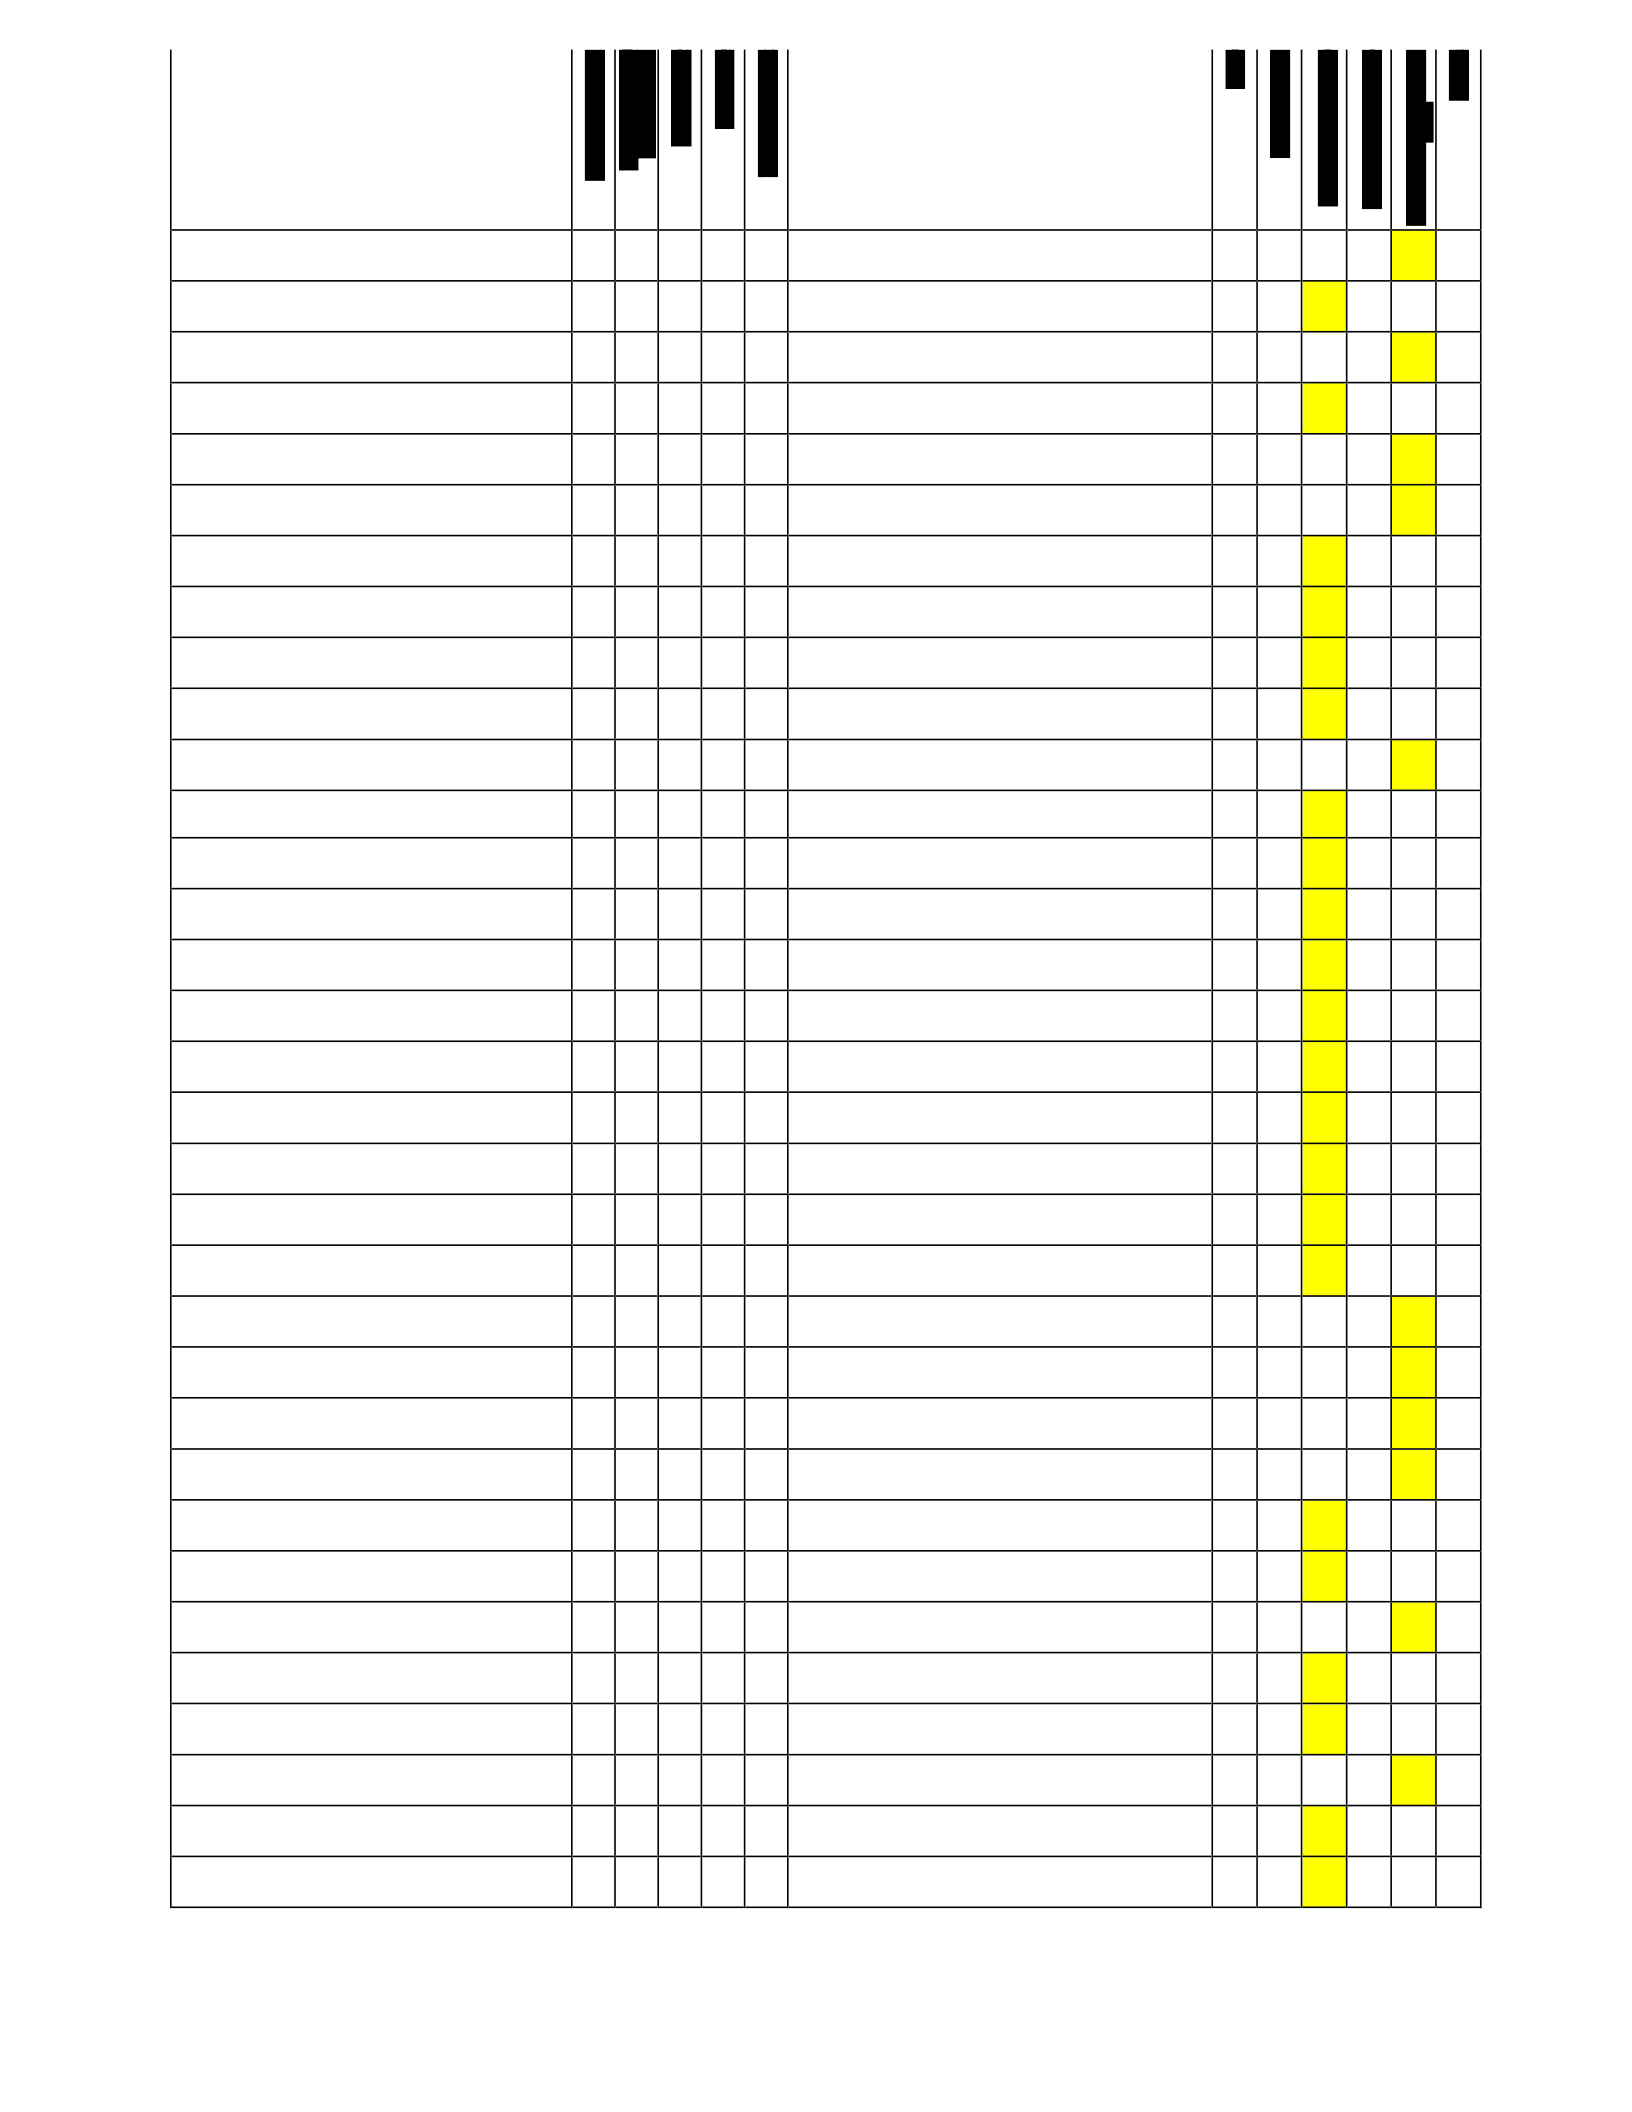
5
1
This policy is customized / reflect the organization's culture
4
1
1
1
1
This policy is standard / similar to other organizations
G2
15
58.3
3
91.7
M
This policy is in advanced level / provide high level of security /
strong
5
1
5
5
3
This policy is in basic level / does not provide high level of security /
weak
G2
6
83.3
14
61.1
L
This policy follows the latest standard for creating policies
5
1
4
1
3
This policy does not follow the latest standard for creating policies
G2
11
69.4
9
75.0
L
This policy shows who is responsible for what/ The employee can
know if it applicable to him/her or not
4
2
5
5
5
This policy does not shows who is responsible/ The employee can’t
know if it applicable to him/her or not
G3
2
94.4
14
61.1
M
This policy is prescriptive / shows how to do it (guidelines is
included)
1
4
1
2
1
This policy is descriptive / shows only what to do
G3
14
61.1
4
88.9
M
This policy tells what to do in case of breach / the guideline to
execute the policy is clear
1
4
1
1
1
This policy does not tell what to do in case of breach
G3
15
58.3
3
91.7
M
The standards and guidelines are clearly separated
3
4
5
5
2
The standards and guidelines are mixed and overlap
G1
4
88.9
12
66.7
M
The standards within this policy do not conflict with other
standards and policies
3
3
5
5
4
This policy has some standards that conflict with other standards and
policies
G2
3
91.7
13
63.9
M
The standards within this policy are consistent
5
5
4
5
5
The standards within this policy are not consistent/ conflict
G2
3
91.7
17
52.8
M
This policy has the required level of detail / explain all the rules in
details
3
3
3
5
2
This policy is does not has the required level of detail/ brief and
general
G1
7
80.6
9
75.0
L
This policy has the required controls/ rules
3
4
3
2
1
Some necessary controls need to be added to this policy
G1
10
72.2
6
83.3
L
Employees can have the same understanding to this policy
4
4
5
5
3
This policy is open to different interpretations
G2
2
94.4
14
61.1
M
Removing this policy will affect the level of security of the
organization
5
4
5
5
5
Removing this policy will not affect the level of security
G2
1
97.2
17
52.8
M
This policy is simple, clear and straightforward
5
5
5
5
3
This policy is complicated, ambiguous and not understandable
G1
4
88.9
16
55.6
M
This policy is accurate and precise
4
3
5
5
3
This policy lacks of accuracy and precision
G1
3
91.7
13
63.9
M
The standards within this policy are not repeated in other policies
4
3
5
1
4
Some of the standards within this policy are repeated in other policies
G3
6
83.3
10
72.2
L
This policy is easy to remember
4
4
5
5
5
This policy is hard to remember
G1
0
100.0
16
55.6
H
The link between this policy and other policies is available and
clear
4
4
5
5
5
The link between this policy and other policies is not available/ not
clear
G2
0
100.0
16
55.6
H
This policy has standards that are subset of another policy
4
3
5
5
5
This policy does not has any standard that is subset of another policy
G2
1
97.2
15
58.3
H
The purpose of this policy is clear and understandable
4
5
5
5
5
The purpose of this policy is not clear
G1
1
97.2
17
52.8
H
The risk of non-complying to this policy is available and clear
4
4
5
5
5
The risk of non-complying is not available / not clear
G3
0
100.0
16
55.6
H
The sanctions of non-complying to this policy are stated clearly/
explicit
1
1
2
1
1
The sanctions of non-complying to this policy are not stated clearly/
need more details
G1
17
52.8
3
91.7
M
The sanctions of non-complying to this policy are enough
1
1
2
1
1
The sanctions of non-complying are not enough
G3
17
52.8
3
91.7
M
The sanctions of non-complying to this policy are specific
1
1
2
1
1
The sanctions of non-complying to this policy are subjective and not
specific
G3
17
52.8
3
91.7
M
Both the technical and business parts of this policy are available
4
4
1
4
1
The technical part or business part is missing
G1
9
75.0
7
80.6
L
Easy to comply with this policy
4
5
5
5
5
Hard or impossible to comply with this policy
G2
1
97.2
17
52.8
M
The boundary of the policy is clear / it is clear what it cover and
what not
4
5
5
5
5
The boundary of the policy is not clear / it is not clear what it cover
and what not
G1
1
97.2
17
52.8
H
The cost of following this policy is less than the benefit of
following it
2
1
1
1
1
The cost of following this policy exceeds the benefit of following it
G2
17
52.8
1
97.2
M
This policy serves the business objectives / goals
5
4
4
5
4
This policy does not serve the business objectives / goals
G2
3
91.7
15
58.3
M
This policy reflects its importance to me (as an employee) / it is
important for the security of the organization
5
5
5
5
4
This policy does not reflect its importance to me (as an employee) / it
is not important for the security of the organization
G2
3
91.7
17
52.8
M
This policy is flexible / less strict
1
1
1
1
2
This policy is more strict
G1
17
52.8
3
91.7
M
This policy is reasonable and appropriate
5
5
5
4
5
This policy is not reasonable
G2
3
91.7
17
52.8
M
This policy is written in simple, plain language
5
5
5
4
5
This policy is include some technical terminologies that are not
understandable by all employees
G3
3
91.7
17
52.8
M

This policy is well-documented / well-structured / precise /
organized
4
4
5
5
3
This policy is not well-documented / not well-structured
G3
2
94.4
14
61.1
M
Overall, this policy is comprehensive and robust
4
4
5
5
5
Overall, this policy is not comprehensive nor robust
Overall reverse
2
2
1
1
1
Figure 5.2: sample grid with the overall construct rating.
Step 2: Calculate the sum of differences for each bipolar construct against the overall construct.
For example, the first construct (in the first row) had ratings as 4, 1, 1, 1, 1, whereas the overall
construct had ratings as 4, 4, 5, 5, and 5. Then, the difference between each two corresponding
ratings is identified. That is, we identified the difference between the rating of the first construct
against the first element and the overall construct against the first element and so on. After that,
the differences were added to get the sum of differences, which was equal to 15 for the first row.
This number was then written under the column “sum of differences” in the first row (refer to
figure 5.2).
Step 3: convert the sum of differences for each construct into “percentage similarity score.” This
allows the researcher to compare grids that have a different number of constructs. A “look-up table”
could be used to extract “percentage similarity score” rather than calculate it manually. Jankowics
(2004) provided a method for calculating “percentage similarity look-up” that can be used here. In
this study, the “percentage similarity score” was calculated using the following formula as
extracted from Jankowics, (2004):
100-{[SD/((LR-1)*C)]*100}.
where SD is the sum of difference, LR is the largest rating possible (i.e. 5 in this study), and C is
the number of constructs (i.e. 34 in this study).
The “percentage similarity score” was calculated for each row (i.e. bipolar construct). The result
from this calculation was written under “% of similarity” column (refer to figure 5.2). For example,
“percentage similarity score” for the first row was 58.3% (refer to figure 5.2).
Step 4: “Reversed” scores should be calculated for the “overall” construct. For example, in
fivepoints scale 1 converted into 5, 2 into 4, 3 stays the same. The rule of thumb for reversing score
is that if the researcher uses n-points scale then each score should be subtracted from n+1 to reverse
it (Jankowics, 2004). After reversing the overall construct scores, the sum of differences was

calculated against the “reversed” scores. For example, the “reverse” score for the grid in figure 4.2
was 2, 2, 1, 1, and 1. The “reversed” scores were recorded directly under overall construct row,
and the sum of differences for the “reversed” score was written under “reverse sum of differences”
column (refer to figure 5.2). In our example, the “reverse sum of
differences” for the first row was 3 (refer to figure 5.2).
Step 5: Convert the reverse sum of differences for each construct (from step 4) into percentage
similarity scores following the same way in step 3. The result from this calculation was written
under “reverse % of similarity” column (refer to figure 4.2). For example, the reverse percentage
similarity score for the first row was 91.7% (refer to figure 5.2).
Step 6: The highest percentage of similarity should be identified, which is the highest percentage
between the two “percentage similarity scores” (from step 3 and step 5). The number highlighted
in yellow represented the highest percentage of similarity (refer to figure 5.2).
Step 7: Record the ranking of each “highest” percentage similarity score in term of high (H),
medium (M) or low (L). These rankings reflected the correlation between each bipolar construct
and the “overall” construct. These similarity scores were looked at as a group such that each third
were ranked as H, M, and L, respectively (refer to figure 5.2).
After completing step seven, individual grids were ready for group analysis. The following section
focuses on multiple grids analysis that involves comparing different grids together.
Step 8: Each construct should be assigned to one of the categories that were generated in the
previous section before beginning the quantitative analysis. All the information from the previous
steps was recorded in spreadsheet tables. The category was recorded under “group” column (refer
to figure 5.2). G1 refers to the constructs related to the form of the policy; G2 refers to the
constructs related to the process of the policy and G3 refers to the constructs related to the content
of the policy.
Step 9: Each of the tables should be converted into a bar chart to show the most important
constructs' categories, which is the most significant security policy aspect that should be considered
when to create or change security policy. Each chart was related to a subgroup of participants.

Participants could be categorized into subgroups based on specific criteria. In this stage, the
participants were categorized in accordance with the SSE-CMM levels. Then, each group was
categorized based on gender and experience.
A table was created for each subgroup of participants. Then, one chart was created for all
participants. This chart illustrated the percentage of constructs in each subgroup. Each bar
represented a construct category and illustrated the high, medium, and low correlations between
constructs and the overall construct. The category that had the highest bar was the most important
one. Another way for interpreting the charts was via considering the categories that have the highest
part of the bar that represents the high correlation. That is, the focus should be only on the
constructs that have high correlations and consider those who have highest “high” part of the bar
as the most important construct categories. The latest method was adopted in this study.
• SSE-CMM Level Five
Figure 5.3 shows the bar chart for the total group of level 5 participants. The chart shows the
allocation of the constructs’ categories in the form of a percentage of the total number of constructs
in each group that rated as high, medium, and low.
Each bar shows the high, medium, and low correlation between the constructs or participants’
perceptions and the comprehension and robustness of the policy. As can be drawn from the chart,
the most significant security policy perceptions were those related to security policy process. That
is, the participants considered the constructs related to the security policy process and how it should
be as the most significant aspects of the security policy. The next most significant constructs are
those that fall under the policy form, which focuses on documentation and the stucture of the
policy.
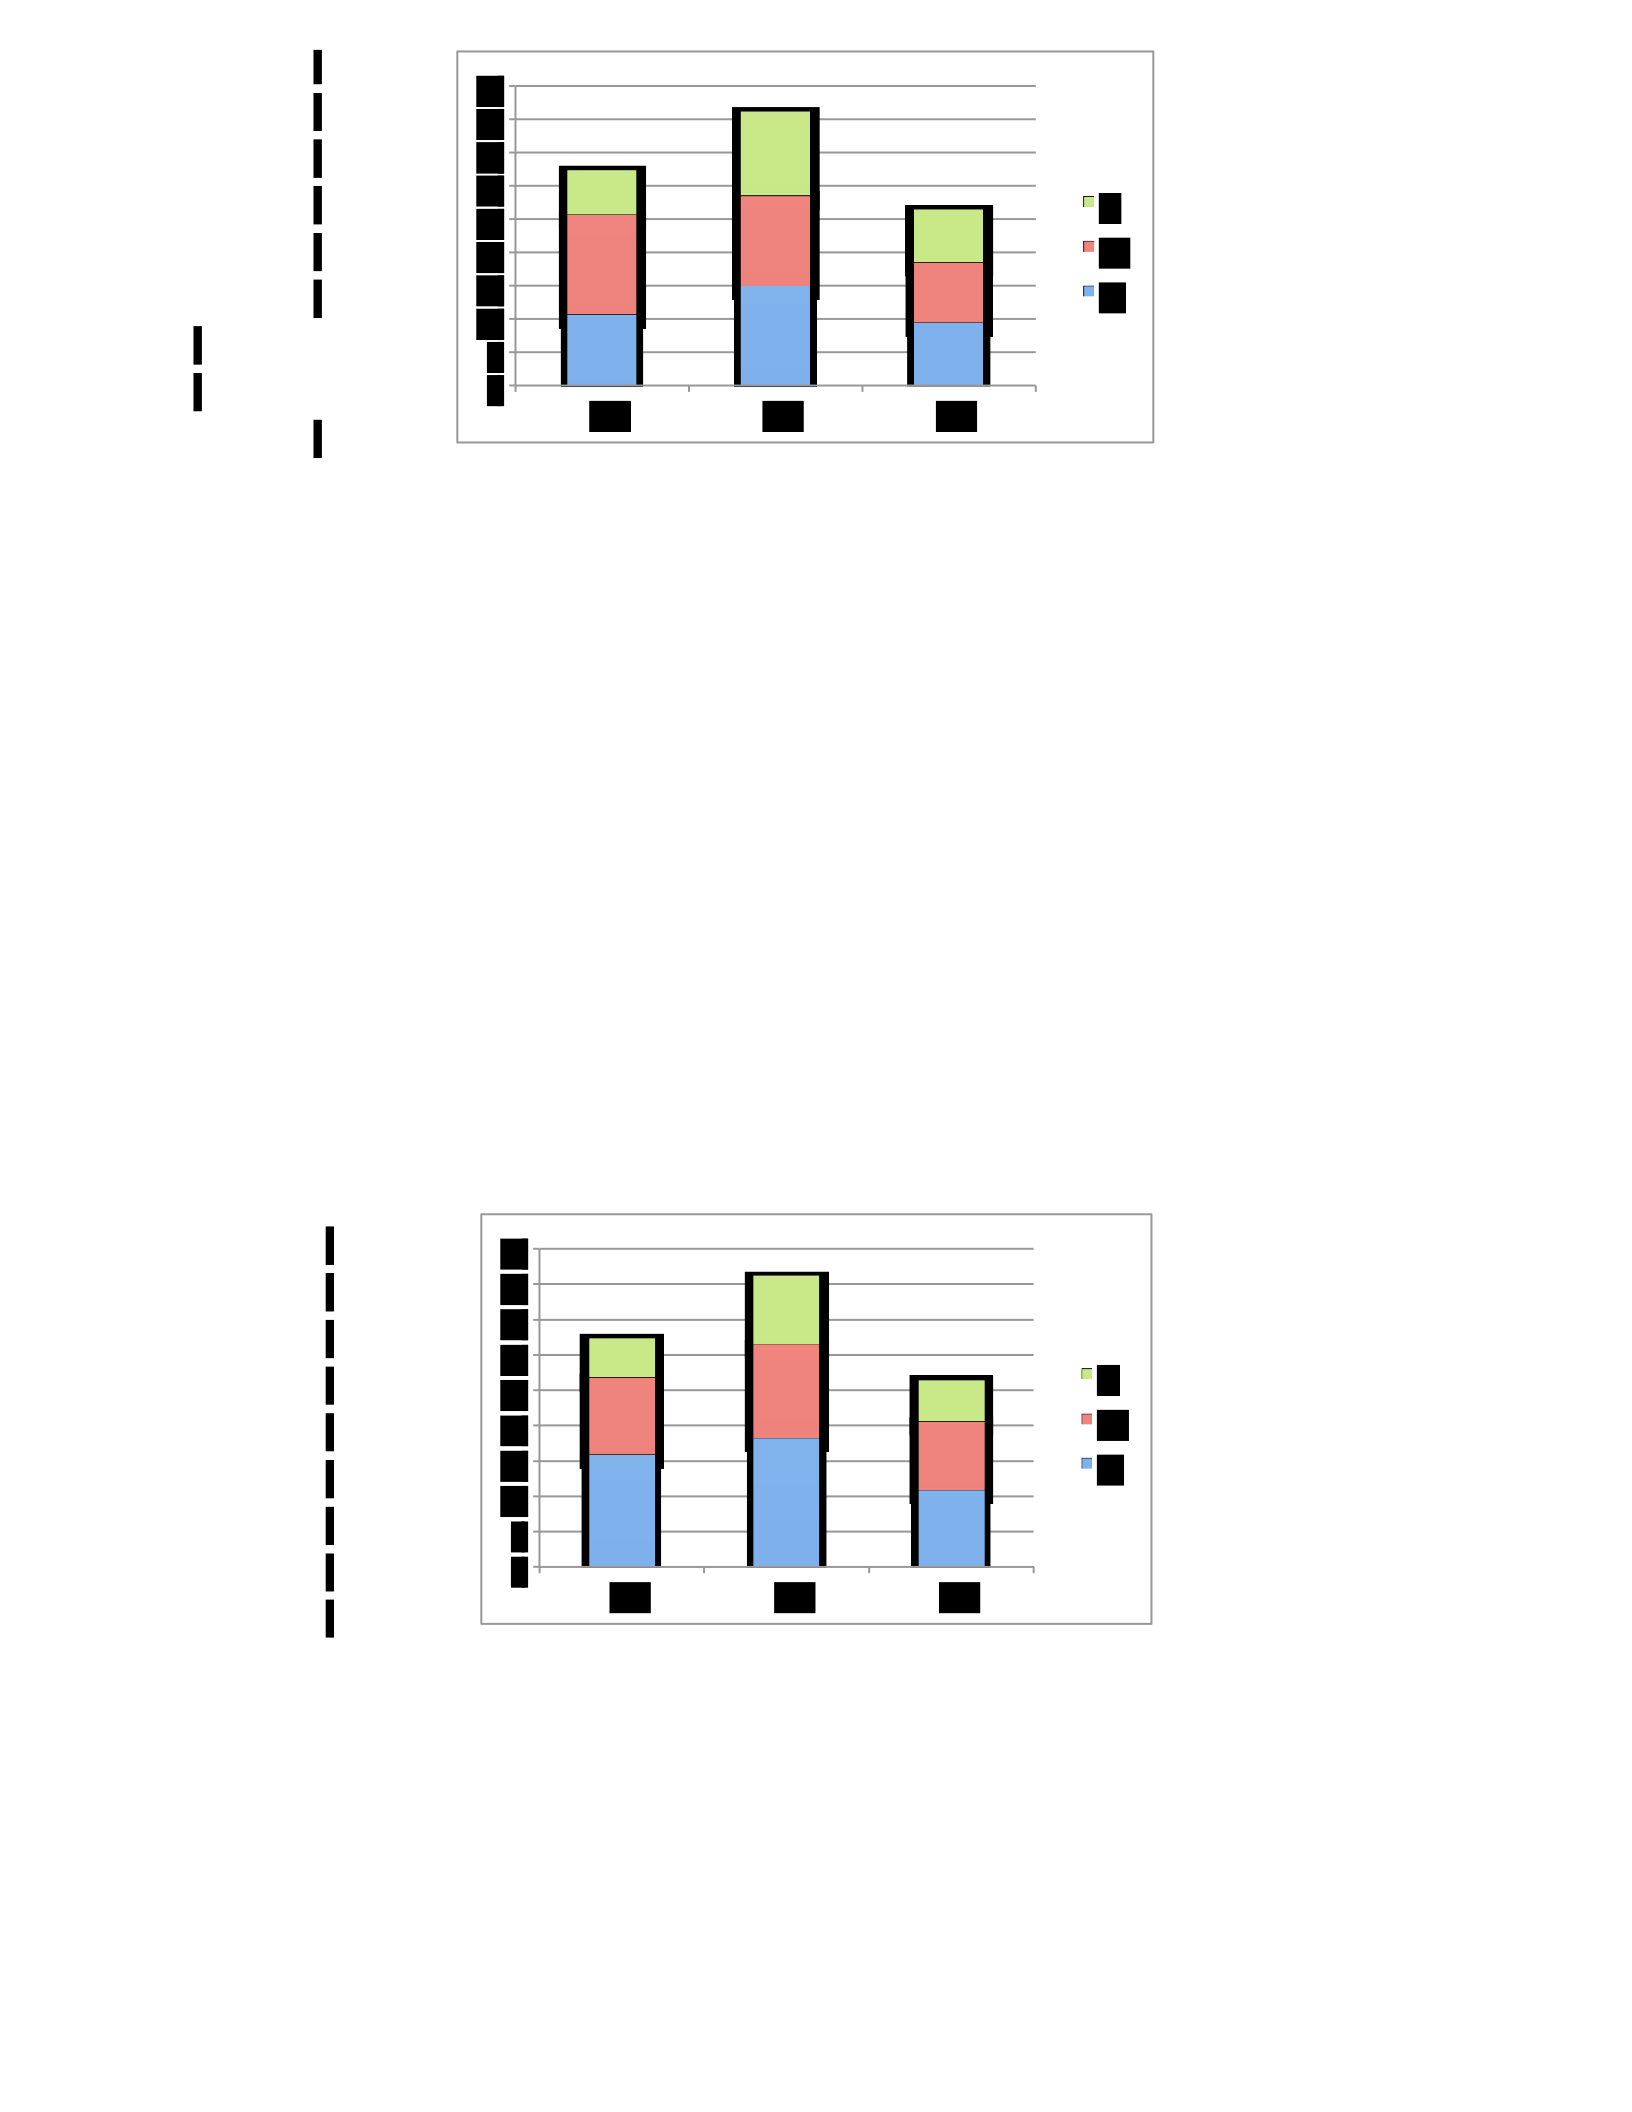
Figure 5.3: Content analysis of the total group of level 5 participants before the breach.
The previous results show the perception of level five participants regarding the security policy
that was created for our experimental study before initiating the security breach. Likewise, the data
collected from the same participants after introducing the security breach was analyzed. Figure 5.4
shows a bar chart for the total group of level 5 participants after introducing the breach. This chart
shows that the most significant security policy perceptions were those related to security policy
process. That is, the participants considered the constructs related to the security policy process
and how it should be as the most significant aspects of the security policy. The next most significant
constructs were those that fall under the policy form.
Figure 5.4: Content analysis of the total group of level 5 participants after the breach.
Thus, the perception of the level 5 participants regarding the security policy before and after the
occurrence of the breach was very close. That could happen because of the maturity level of the
0
5
10
15
20
25
30
35
40
45
G1
G2
G3
L
M
H
0
5
10
15
20
25
30
35
40
45
G1
G2
G3
L
M
H
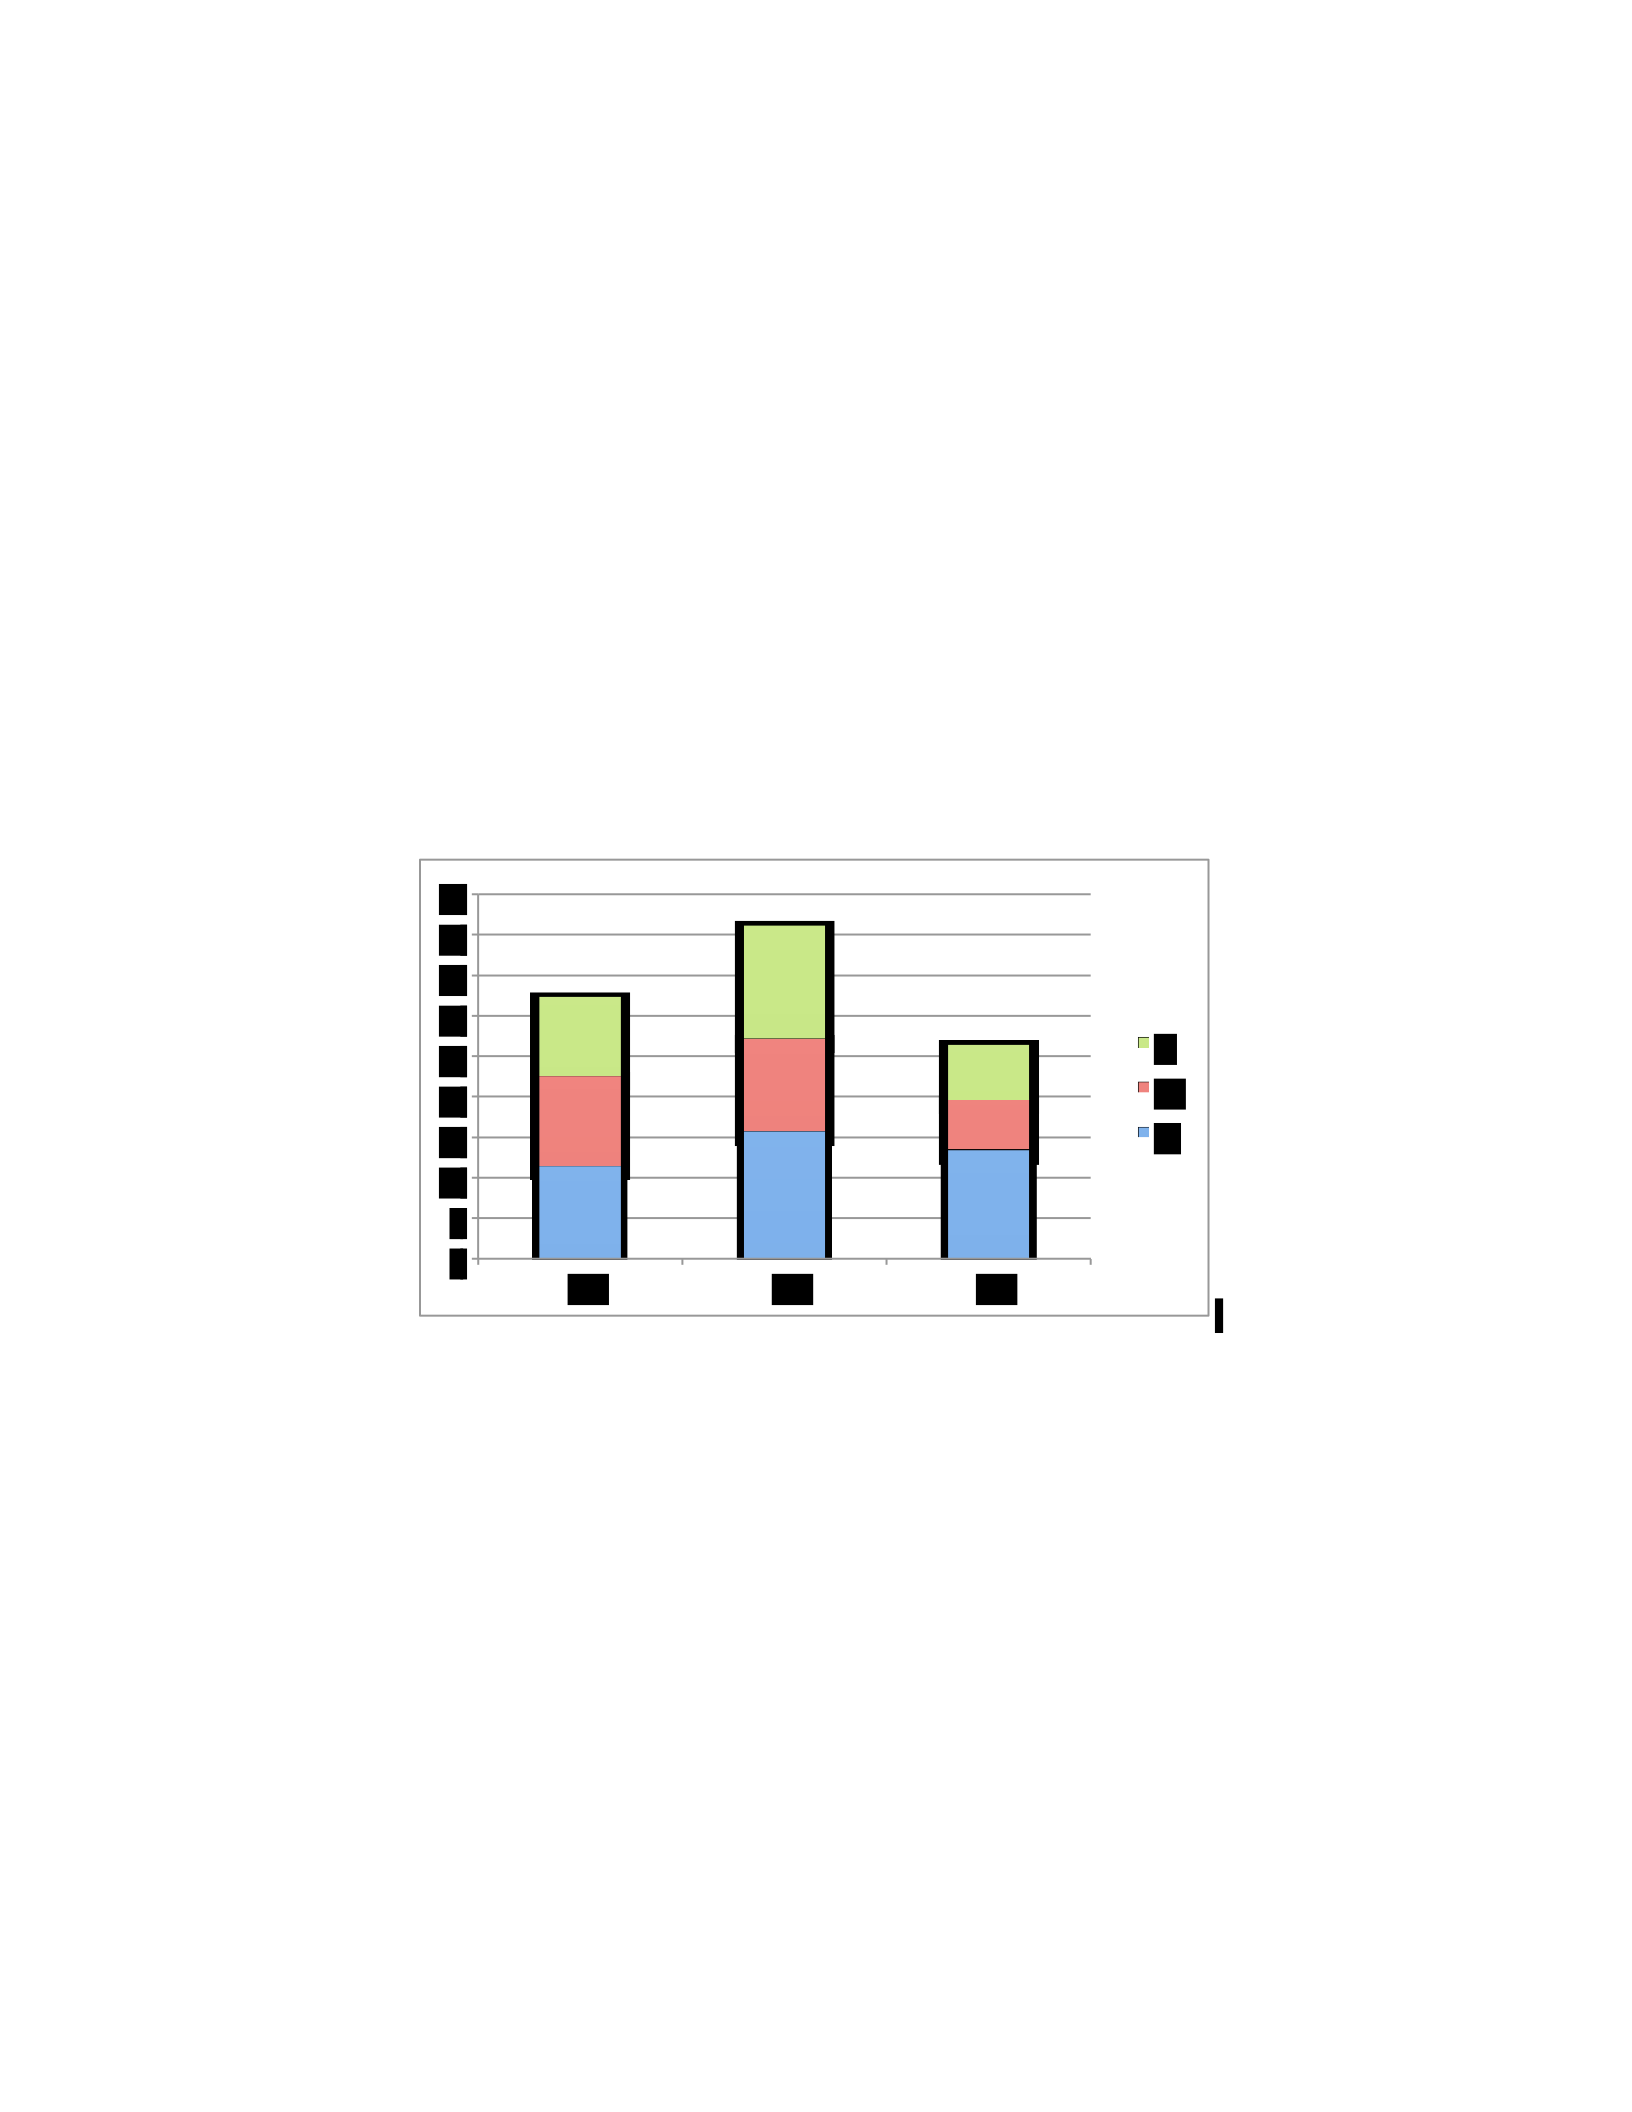
policy that was introduced. The security policy version with the highest maturity level among the
other versions of the policy was introduced to this group of the participants. However, the
percentage of the constructs that were rated as high was changed before and after the breach. For
example, 10.5% of the constructs in the G2 group were rated as high before the breach whereas
15.9% of the constructs in the G2 group were rated as high after the introduction of the breach.
• SSE-CMM Level Four
In figure 5.5, the bar chart shows the perception of the total group of level 4 participants. This chart
illustrates that the most important security policy constructs were the constructs related to the
process of security policy. That is, level 4 participants believed that the constructs related to the
security policy process and how it should be were the most significant features of the security
policy. The next most important perceptions are those related to the security policy content.
Figure 5.5: Content analysis of the total group of level 4 participants before the breach.
The previous result displays the perception of level four participants regarding the Crown
Confections security policy before introducing the security breach. Similarly, the data that was
collected from the same participants after introducing the security breach was analyzed, and a bar
chart was created for these data. Figure 5.6 shows the bar chart for the total group of level 4
participants after introducing the breach. As can be seen from the chart, the most significant
security policy perceptions for the level 4 participants after introducing the breach were those
0
5
10
15
20
25
30
35
40
45
G1
G2
G3
L
M
H
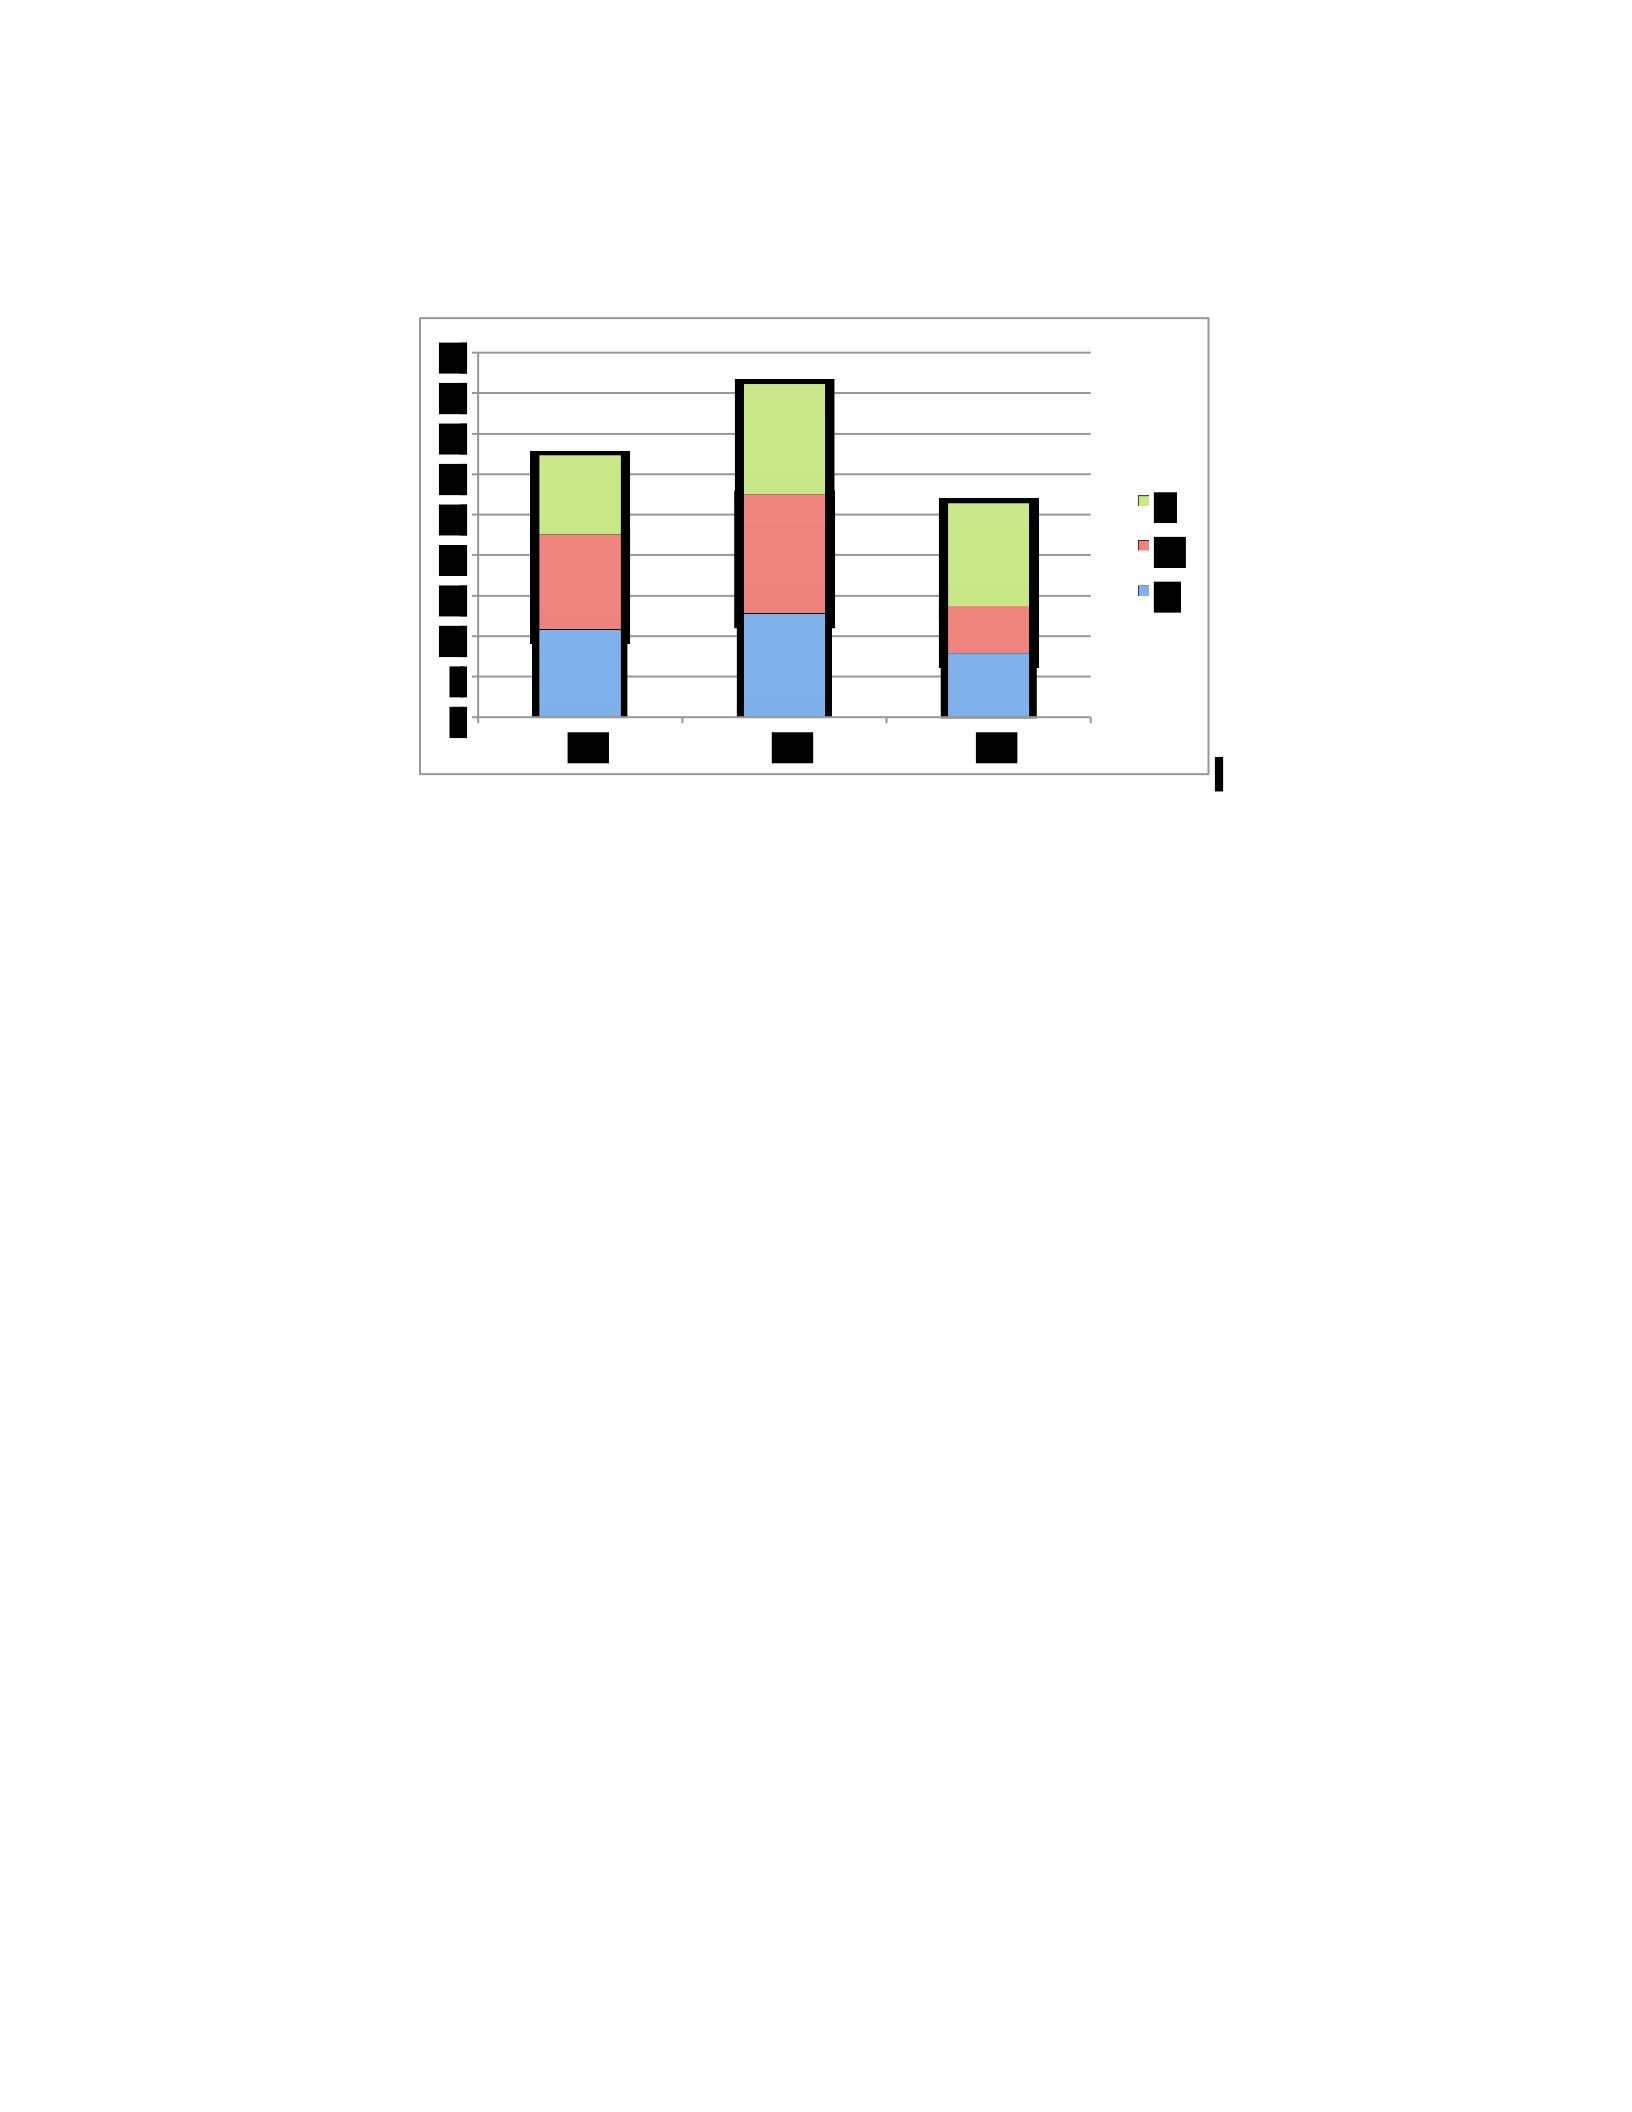
related to security policy process. That is, the level 4 participants considered the constructs related
to the security policy process and how it should be as the most significant aspects of the security
policy. The next most significant constructs are those that fall under the policy form.
Figure 5.6: Content analysis of the total group of level 4 participants after the breach.
Here, the perception of the participants regarding the security policy before and after the breach
was very close regarding the most significant perception. However, the percentage of the G2
constructs that were rated as “high” changed after the breach from 15.7% to 12.7%. For the next
important perception, level 4 participants’ perceptions changed after the introduction of the security
breach from policy content to policy form.
• SSE-CMM Level Three
Figure 5.7 shows the bar chart for the perception of the total group of level 3 participants regarding
the security policy before initiating the security breach. The most significant security policy
perceptions were those related to security policy process. The participants believed that the
constructs related to the security policy process and how it should be were the most significant
aspects of the security policy. The next most significant constructs are those that fall under the
policy form.
0
5
10
15
20
25
30
35
40
45
G1
G2
G3
L
M
H
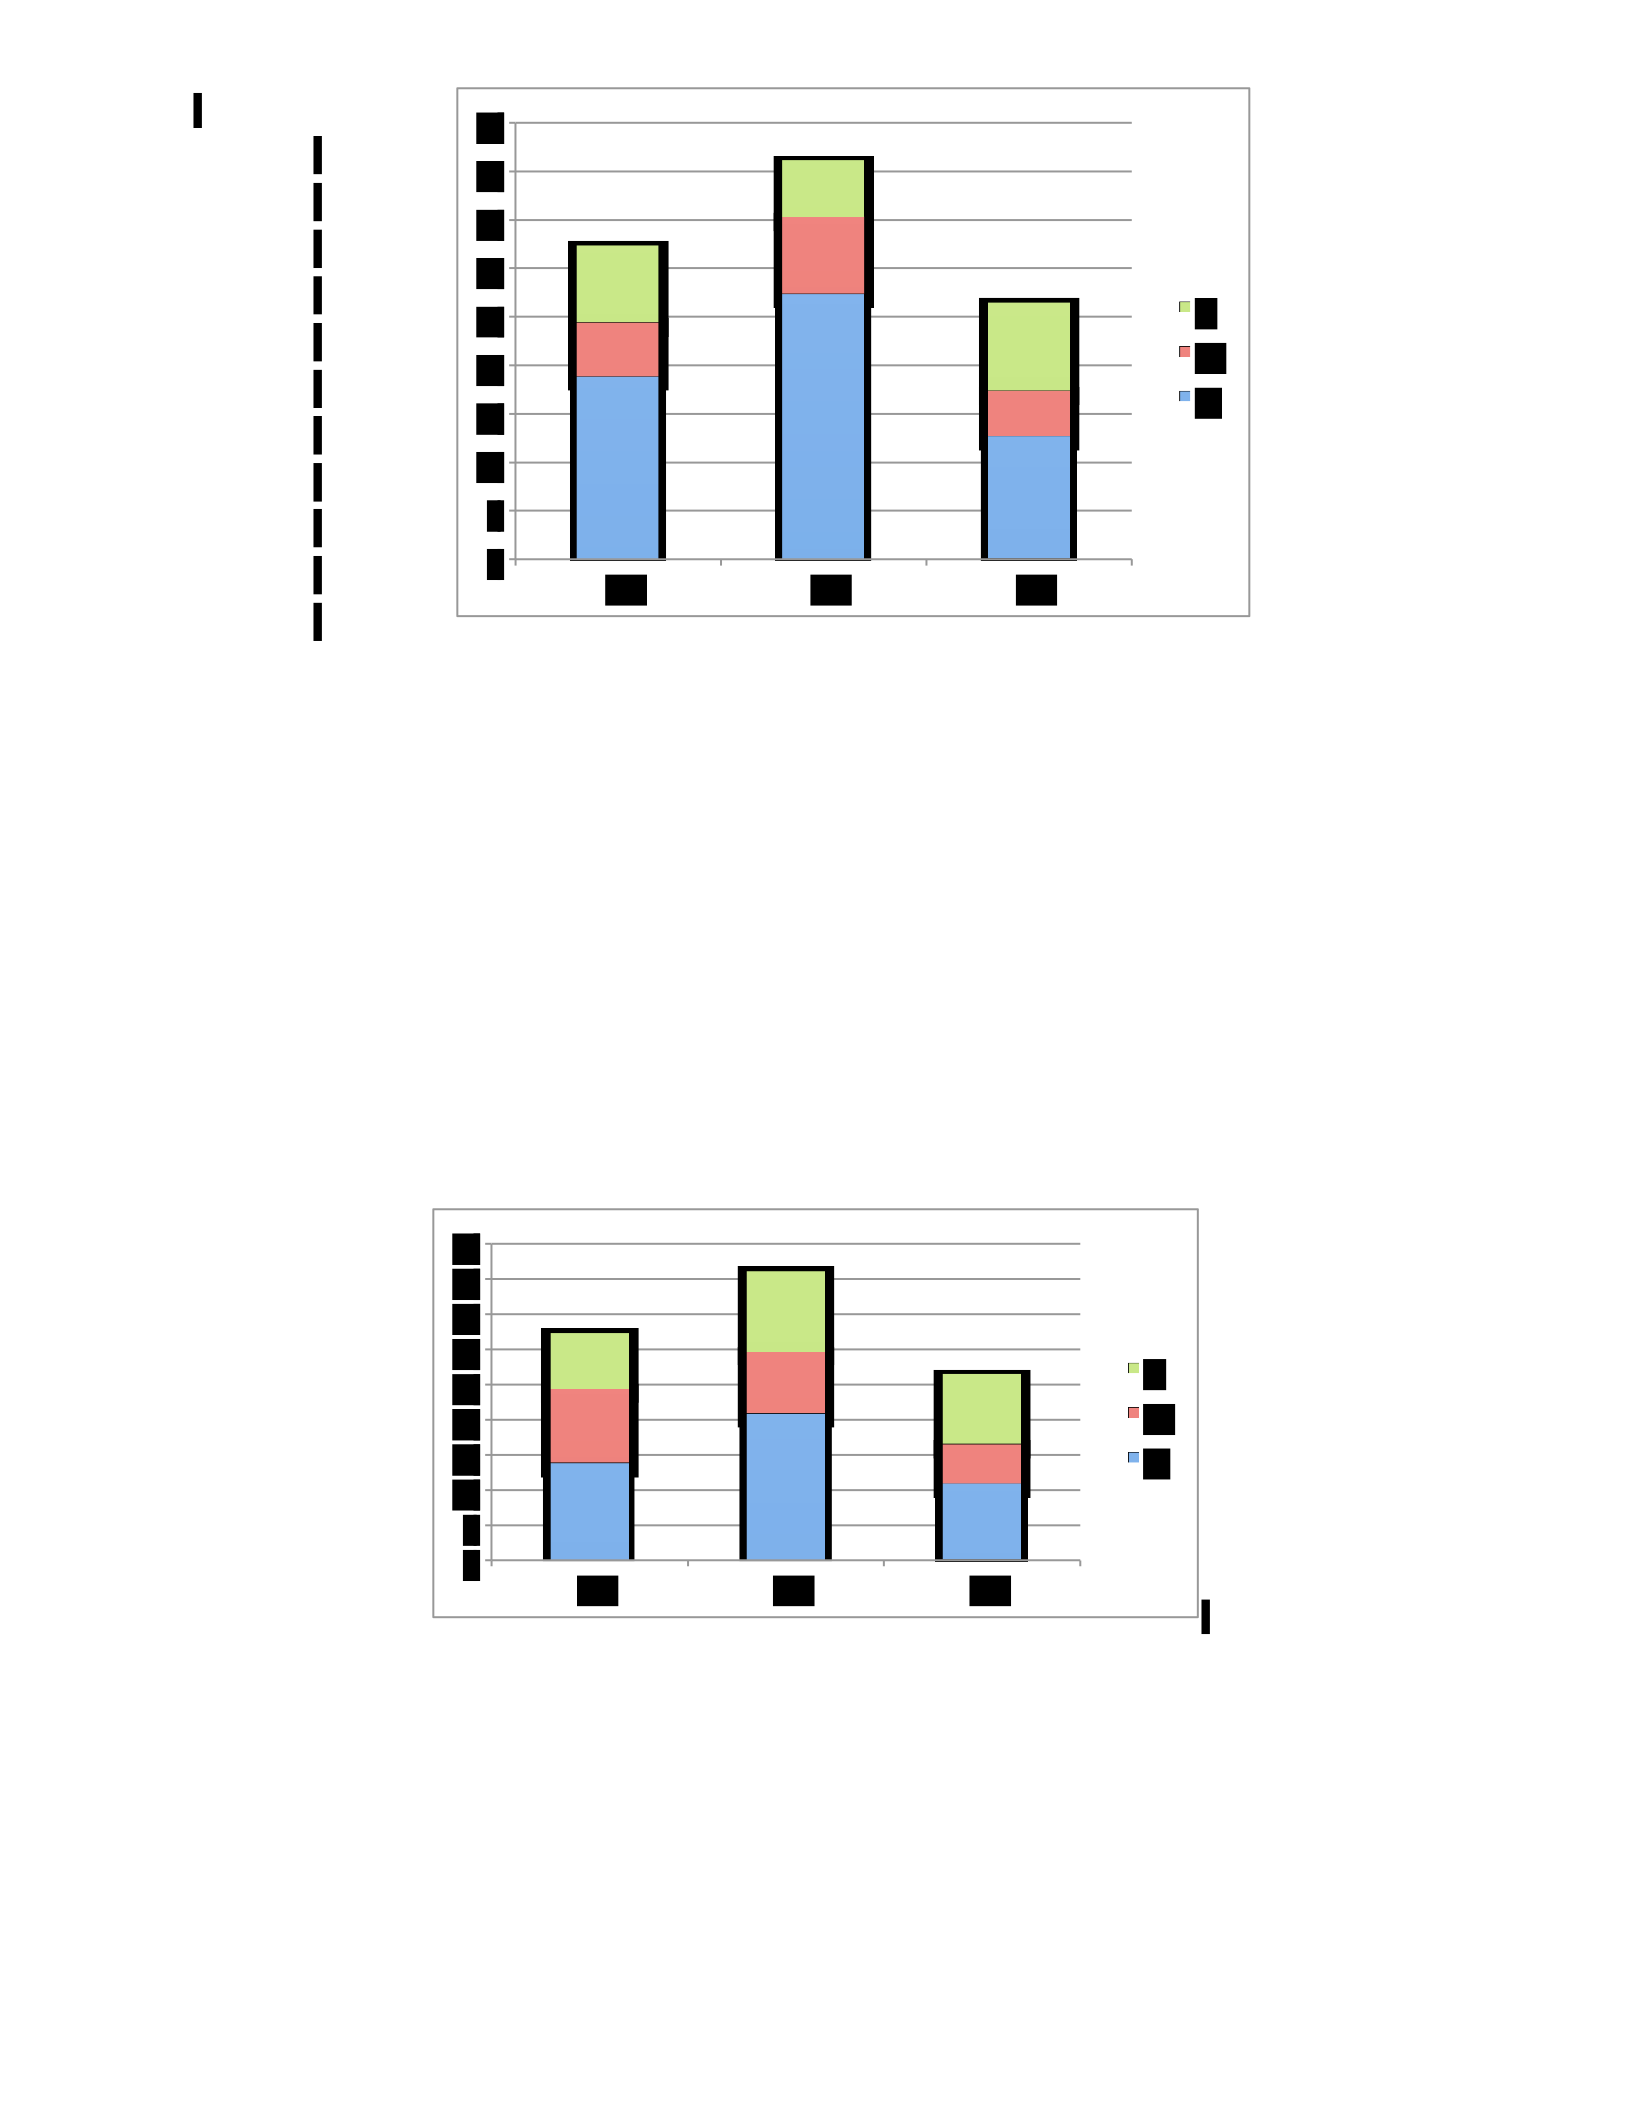
Figure 5.7: Content analysis of the total group of level 3 participants before the breach.
The same analysis was conducted for the data that was collected from the same participants after
the occurrence of the security breach. Figure 5.8 shows the bar chart for the total group of level 3
participants after introducing the breach. This chart shows that the most significant security policy
perceptions were those related to security policy process. The next most significant perceptions
regarding the security policy were those related to security policy form.
Figure 5.8: Content analysis of the total group of level 3 participants after the breach.
Here, the perception of the participants regarding the security policy before and after introducing
the breach was almost the same in term of which group had the highest importance. The change
0
5
10
15
20
25
30
35
40
45
G1
G2
G3
L
M
H
0
5
10
15
20
25
30
35
40
45
G1
G2
G3
L
M
H
occurred in the percentage of the constructs that were rated as “high” in each group. By comparing
figure 5.7 and figure 5.8, we can realize that the number of constructs in the G2 group that
considered highly significant decreased from 27.4% (before the breach) to 20.9% (after the
breach). The same thing happened with the G1 and G3 groups (refer to figure 5.7 and 5.8).
• SSE-CMM Level Two
Figure 5.9 shows the bar chart for perceptions of the total group of level 2 participants before
introducing the security breach. As it appears in the chart, the most significant security policy
perceptions were those related to security policy process and policy form. The percentage of the
constructs that were rated as “high” in both the G1 and G2 groups was 13.5%.
Figure 5.9: Content analysis of the total group of level 2 participants before the breach.
Similarly, the data that was collected from the same participants after introducing the security
breach was analyzed in the same way. Figure 5.10 shows the bar chart for the total group of level
2 participants after introducing the breach. As shown in the chart, the most significant security
policy perceptions were those related to security policy process. The next most significant security
policy constructs were those that related to the policy form. An interesting observation from this
result is that the percentage of the constructs that were rated as “high” in the G1 group stays the
same before and after the breach, and only slight change happened to the constructs rated as
0
5
10
15
20
25
30
35
40
45
G1
G2
G3
L
M
H
“medium” and “low.” That maybe because of the kind of breach introduced to this group. This
issue will be discussed further in chapter 6.
Figure 5.10: Content analysis of the total group of level 2 participants after the breach.
Here, the perception of the participants regarding the security policy before and after introducing
the breach changed. By comparing figures 5.9 and 5.10, we determine that even the G1 considered
as highest important before and after the breach the number of constructs that considered highly
significant increased from 13.5% (before the breach) to 15.3% (after the breach). Also, the policy
form considered as highest important before the breach, but it was considered the second most
important after the breach.
• SSE-CMM Level One
The chart in figure 5.11 represents the data related to the whole group of level 1 participants that
was collected before introducing the security breach. As it appears from the chart, the most
important security policy perceptions were those related to security policy process. The participants
perceived that the constructs related to the security policy process and how it should be were the
most significant aspects of the security policy. The next most significant constructs were those that
fall under the policy form.
0
5
10
15
20
25
30
35
40
45
G1
G2
G3
L
M
H
Figure 5.11: Content analysis of the total group of level 1 participants before the breach.
The same analysis was conducted for the data that was collected from the same participants after
introducing the security breach. Figure 4.12 shows the bar chart for the total group of level 1
participants after introducing the breach. This chart shows that the most significant security policy
perceptions were those related to security policy process. That is, the participants considered the
constructs related to the security policy process as the most important constructs, followed by the
constructs related to the policy form. An interesting observation here is that the percentage of
constructs that considered as highly important constructs in the policy process group increased
from 8.1% (before the breach) to 16.6% (after the breach). Similarly, the percentage of constructs
that considered as highly significant increased from 7.4% (before the breach) to 13.7% (after the
breach) in the policy form group.
0
5
10
15
20
25
30
35
40
45
G1
G2
G3
L
M
H
0
5
10
15
20
25
30
35
40
45
G1
G2
G3
L
M
H

Figure 5.12: Content analysis of the total group of level 1 participants after the breach.
To summarize, before introducing the security breach the five groups of the participants agreed on
that the constructs related to policy process were the most significant aspects of the security policy.
However, the difference between the groups was in the next significant group. The level four and
level two groups considered the policy content as the next most significant group. The rest of the
groups considered the policy form to be the next most significant group.
After introducing the security breach, all groups agreed on that the constructs related to policy
process were the most significant aspects of the security policy. Also, all of the groups agreed on
that the second most significant group was the policy form. Even if the groups agree on which
policy group was the most significant one, the change in the participants’ perceptions appeared in
the percentage of the constructs that were rated as “high,” “medium,” or “low.” Comparing the
results for all the groups before and after the introduction of security breach shows the changes
that occur to the participants’ perception regarding the security policy of the Crown Confection
Company. Here, the comparison was conducted for the group as a whole before and after the
breach.
Another comparison was accomplished to examine how the perception of each person changed
after introducing the security breach. Figure 5.13 shows a sample of five participants from the five
levels and how the perceptions of each changed after introducing the security breach.
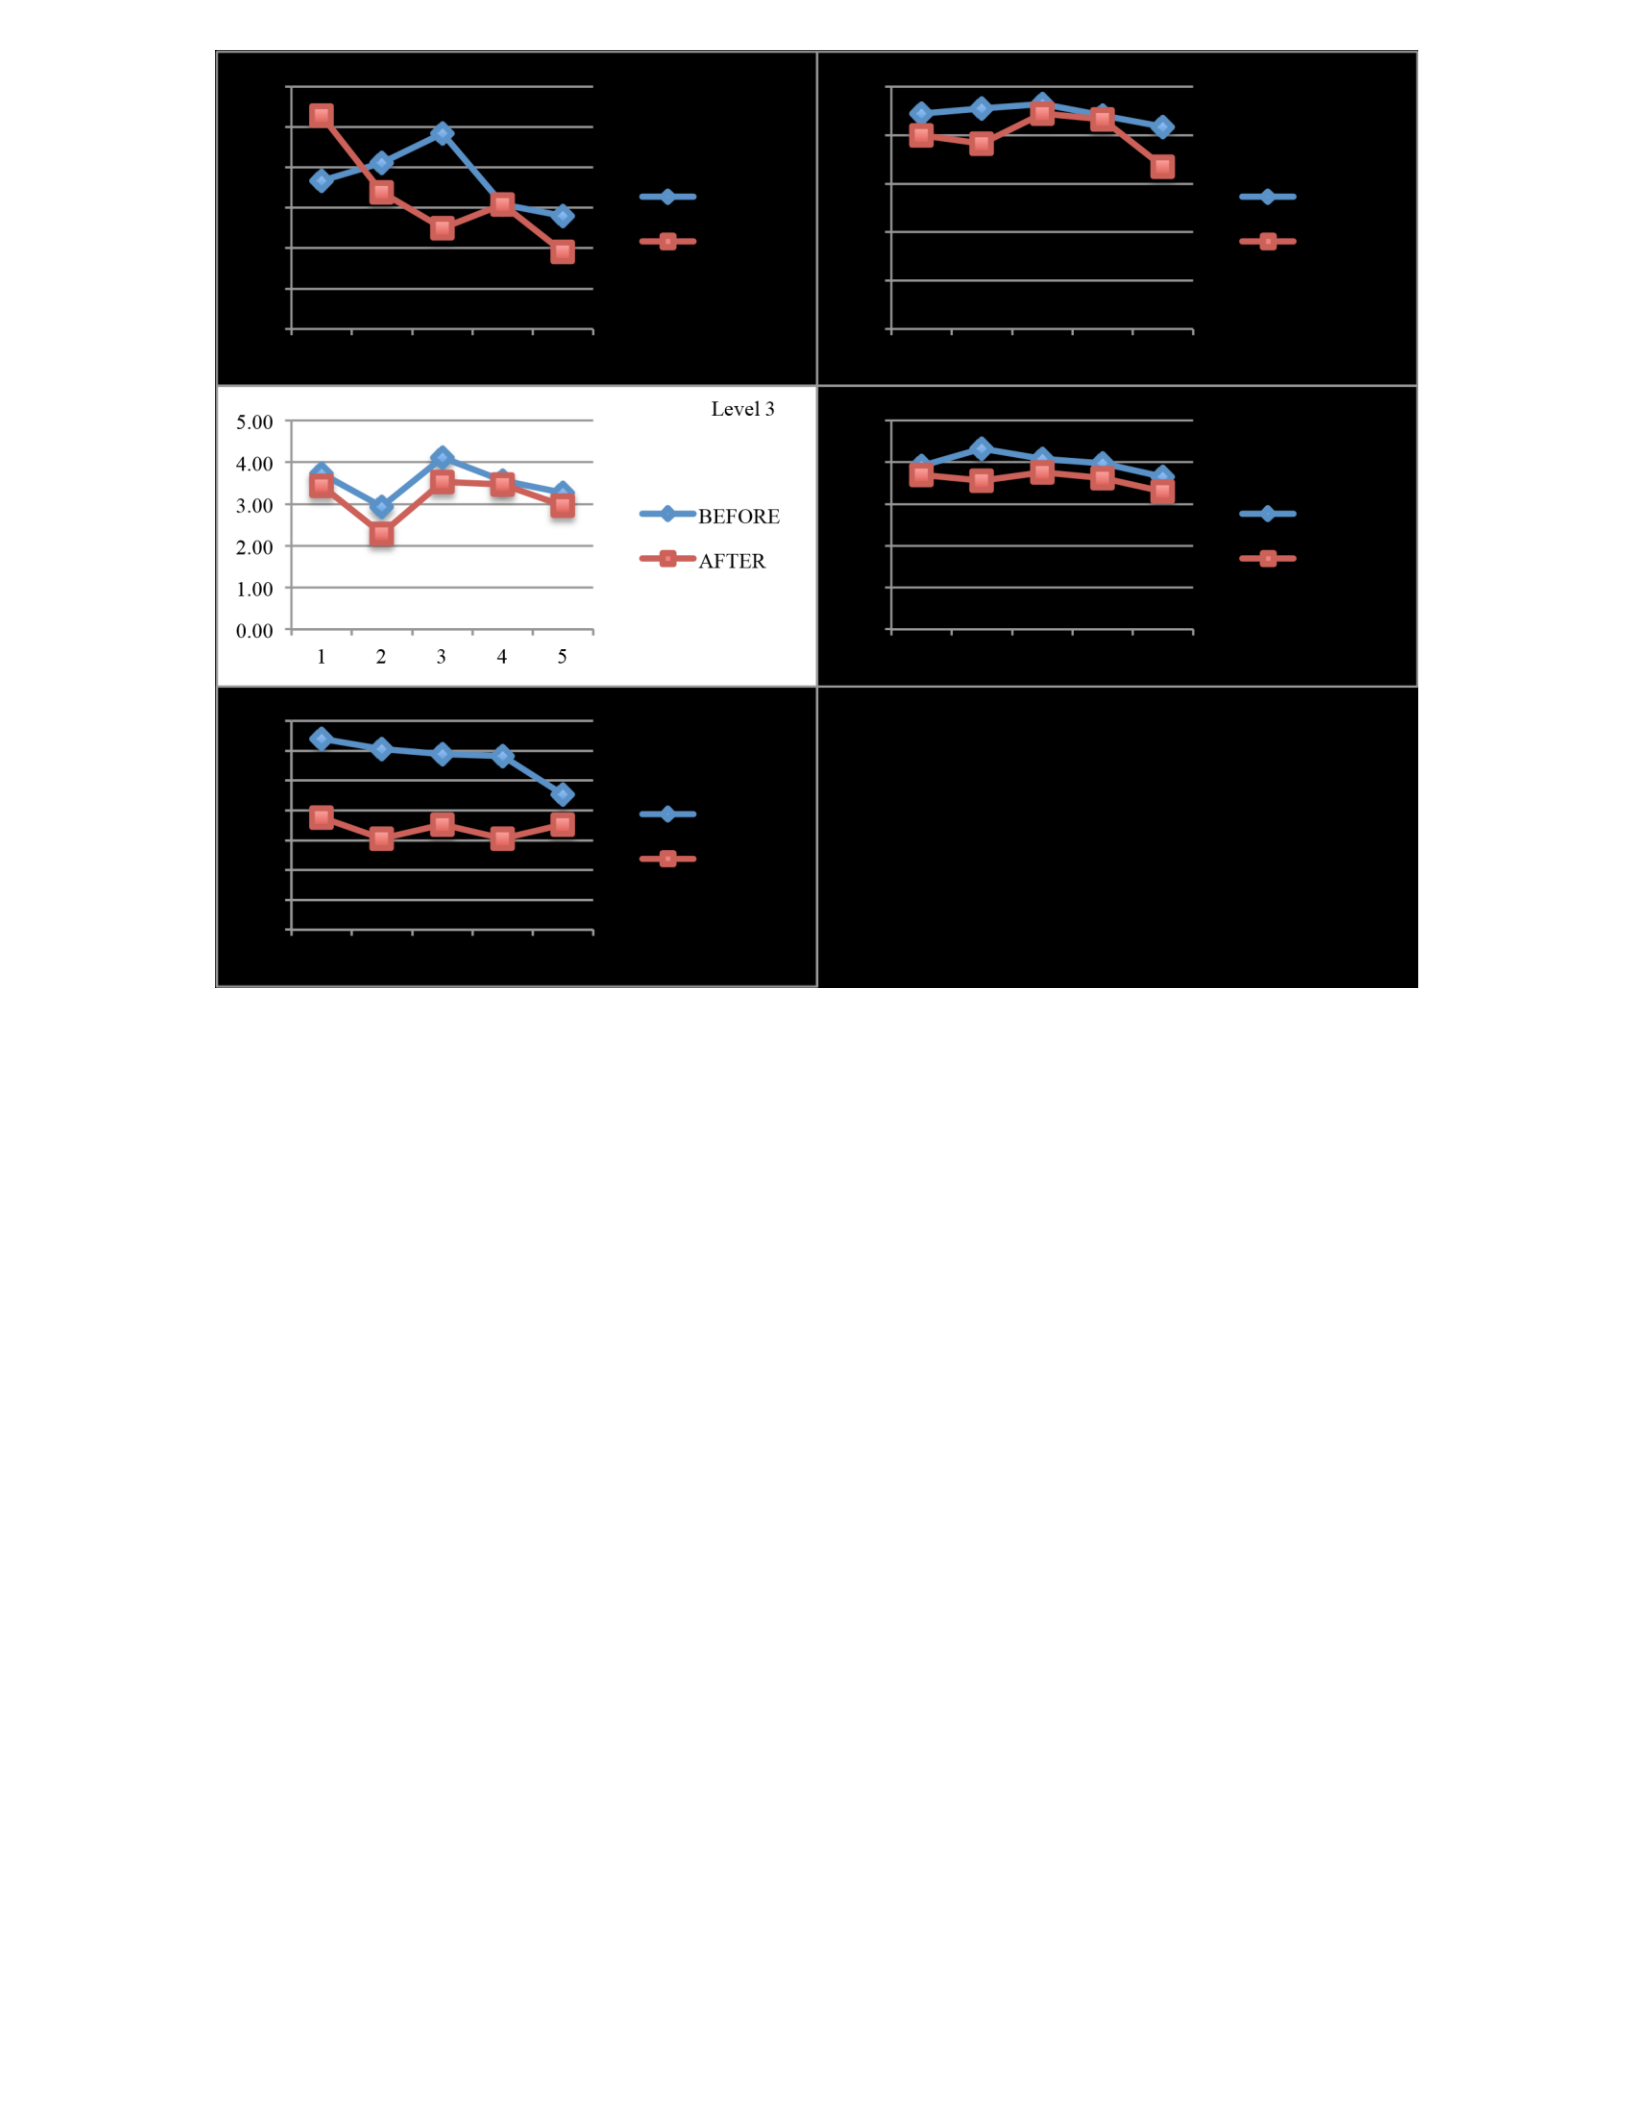
Figure 5.13: a sample of five participants from the five levels and how the perception of each of them changed after
introducing the security breach (1=acceptable use policy, 2=Info. Sec. roles and responsibilities, 3=password policy,
4=email policy, and 5=remote access policy).
The sample in figure 5.13 was selected randomly. Each one of the charts represents one of the
participants from one of the SSE-CMM five levels. In the charts, the more two points from each
color get closer, the more the perception of the participant get closer before and after the breach.
For example, for the level 1 participant, we can conclude that her or his perception regarding the
five security policies was entirely different. On the other hand, if we look at the level 2 participant
we can conclude that her or his perception regarding acceptable use policy was almost the same
before and after the breach, whereas his or her perception regarding information security roles and
responsibilities policy differs significantly.
To sum up, the perception of the participants after the policy was mostly different from their
perception before the policy. Some of them had some similarities in their perceptions regarding
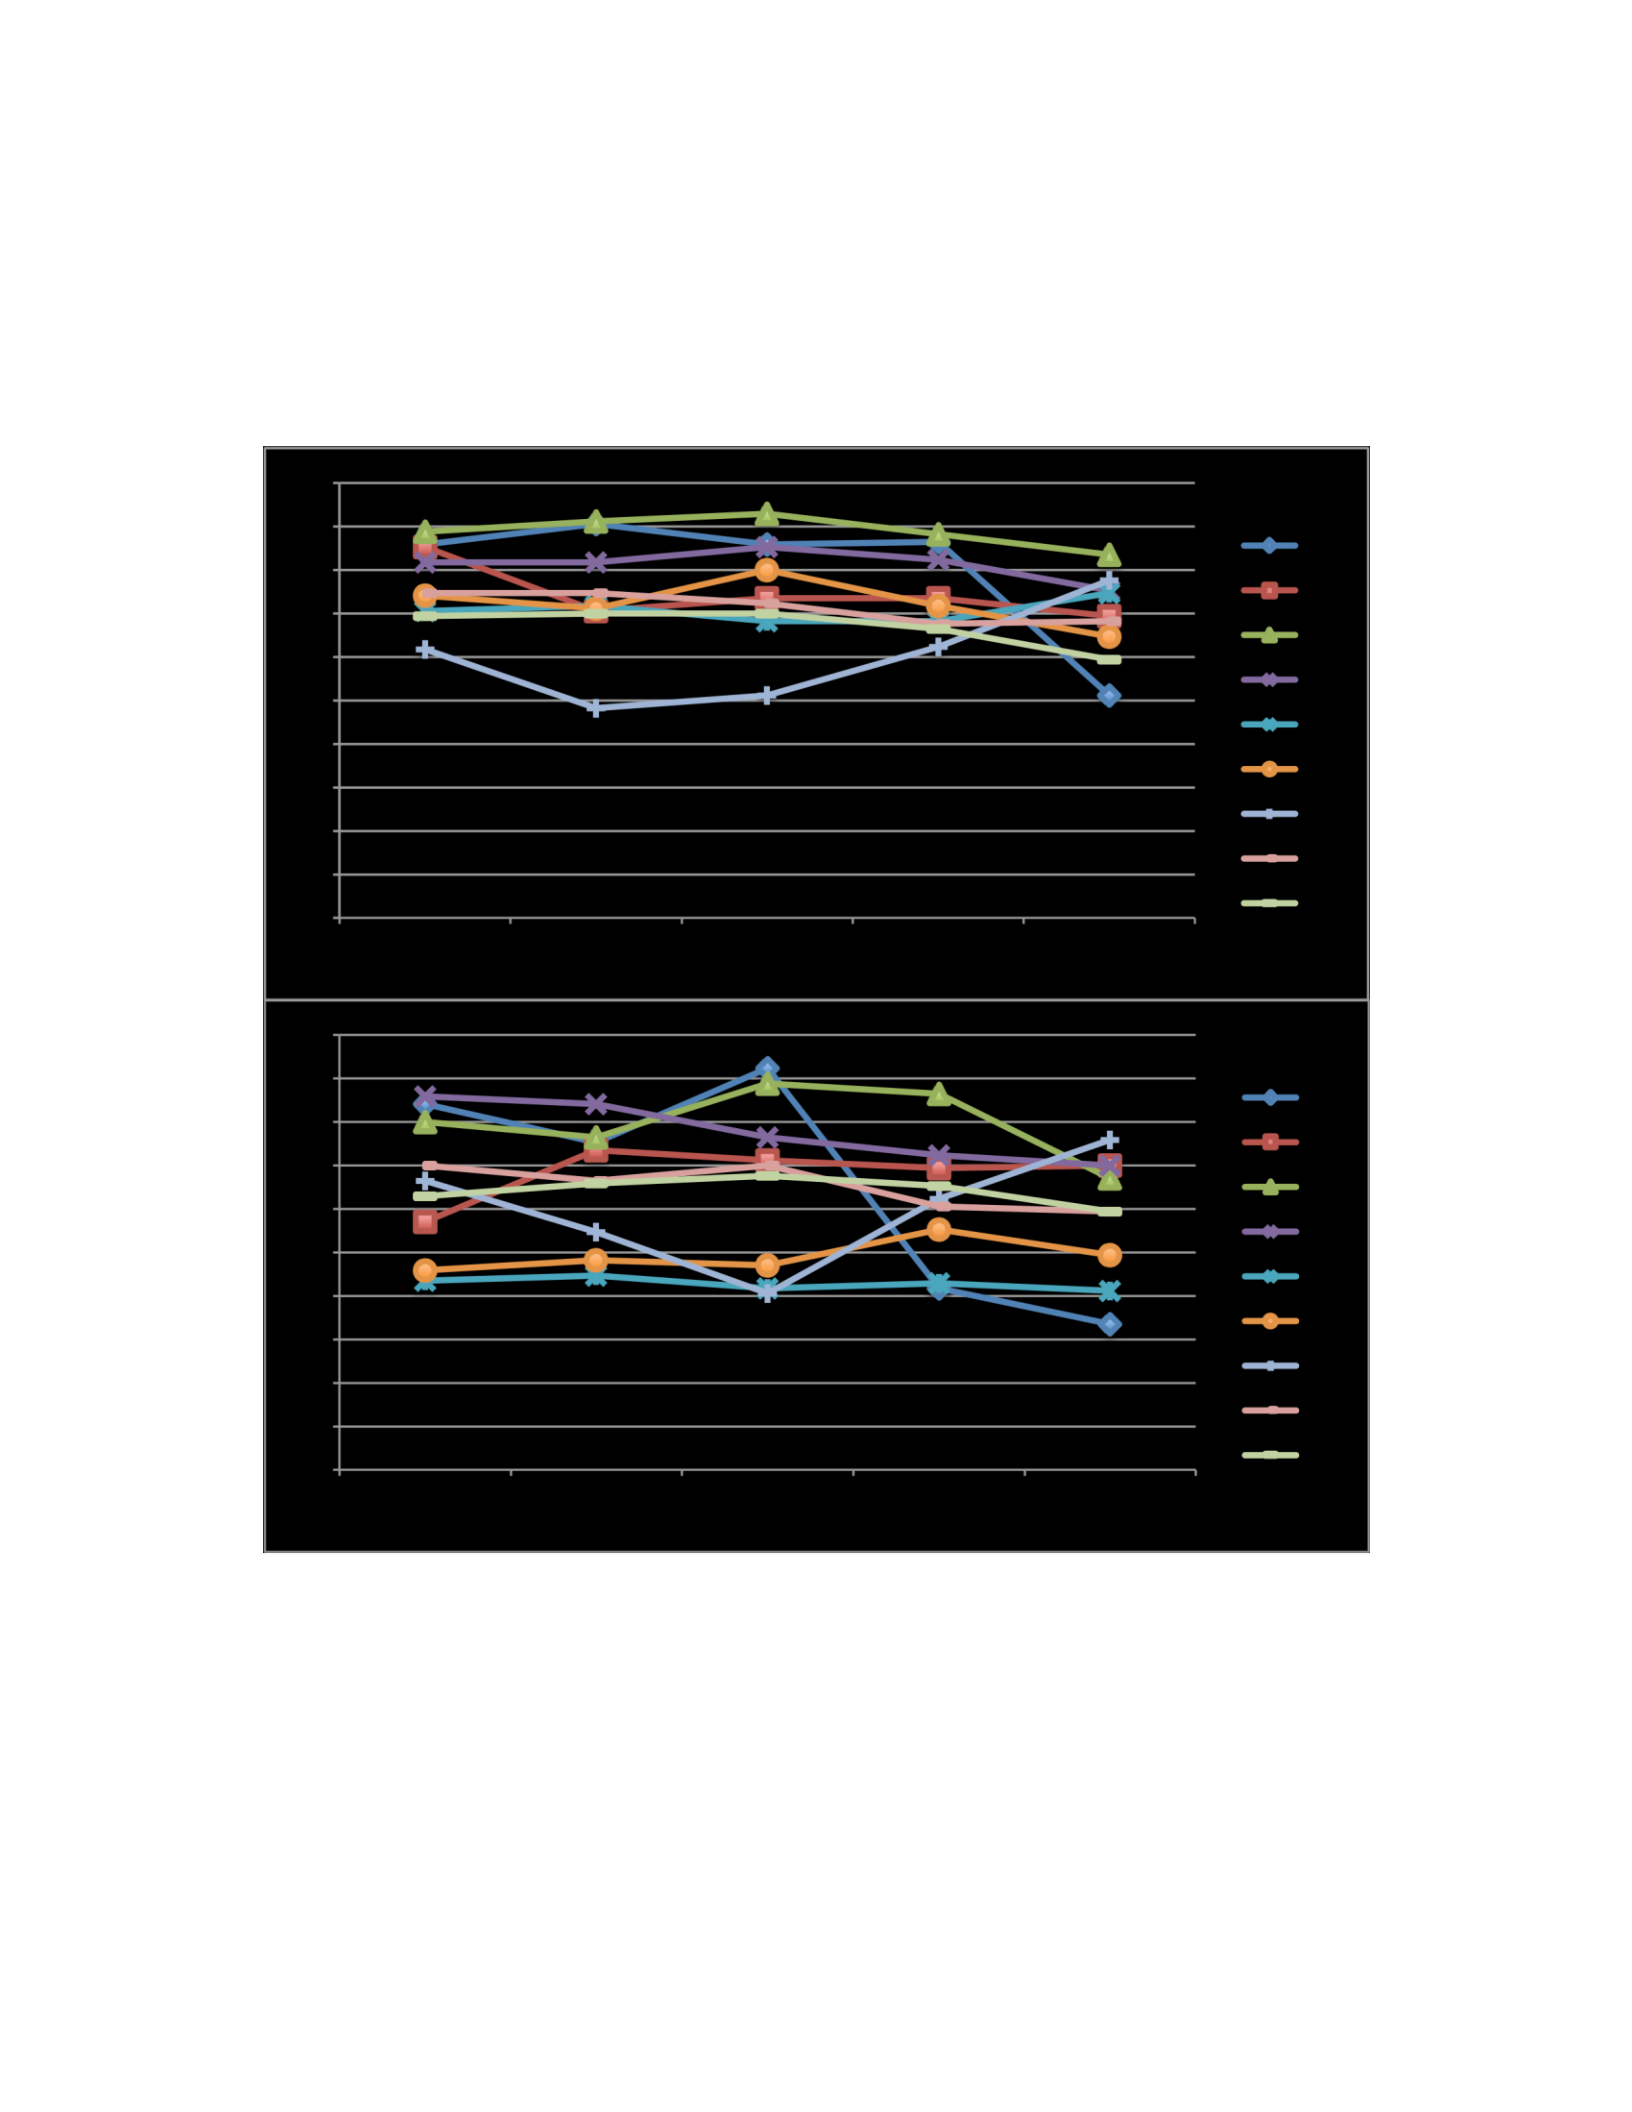
some of the policy themes as we saw in the example above. However, no one had an identical or
very similar perception regarding all the themes before and after the breach.
Also, a comparison was conducted to compare the participant’s perception within each group. For
example, figure 5.14 shows how participants from level 4 group have different perceptions of the
five security policy themes.
Figure 5.14: the difference in the participant’s perception regarding the security policy (pre- and post- breach).
Each colored line in the figure 5.14 represents the perception of one participant. The figure displays
how the participants had some differences in their perceptions regarding each of the five policies
before introducing the security breach. When two points on two different lines intersect, that means

the two participants have the same perception regarding the respected policy. As the two points
diverge, the perceptions change. For example, participants 028 and 030 had the same perception
regarding the information security roles and responsibilities policy; however, their perceptions
were widely different regarding the remote access policy.
The same analysis was conducted for all of the groups before and after the initiation of the security
breach. The results from each group were consistent with the previous results. The participants in
each group had different perceptions regarding the security policy. That difference in their
perception was due to the different understanding of the same security policy. People in an
organization may understand the same security policy in different ways in regards to the differences
in their values. An individual has a different psychological process that she or he can use to
understand the world around her/him (Kelly, 1963).
As mentioned before, it is not easy to link these results to the prior studies because, to our
knowledge, no study that examined the people perceptions regarding the security policy. Some
scholars like Siponen and Iivari (2006) investigated how different norms can influence the success
of the security policy.
Likewise, the content analysis has been achieved for various subgroups to show how different
subgroups of the participants perceive the Crown Confections security policy. In this study, the
participants were first categorized into five groups in accordance with the SSE-CMM five levels.
Then, each of the five groups was re-grouped one time based on the participants’ age and another
time based on the participants’ experience. The content analysis is necessary when analyzing
Repertory Grids. Many researchers used content analysis before doing any quantitative analysis.
5.3.2.1 Security Policy Perception and Age
In this section, the groups were categorized based on the participants’ age. First, the participants
groups were categorized into five groups according to the SSE-CMM levels. Then, each group of
the five groups was categorized based on the age of the participants. After the grouping, content
analyses were conducted for each subgroup.
• SSE-CMM Level Five

The participants of this group were sub-grouped based on their age. They were grouped into three
groups: participants whose age was less than 20 years old; participants whose age was between 20
and 30 years old; and participants who were older than 30 years. Figure 5.15 shows how
participants whose age was less than 20 years old perceived the five policy themes of the Crown
Confections security policy before and after the occurrence of the security breach.
Figure 5.15 shows the bar chart for the level 5 participants aged less than 20 years old. The charts
demonstrate how this group perceived the security policy before the introduction of the security
breach and how their perception changed after introducing the breach. According to the charts, the
level 5 participants whose age was less than 20 years old believed that the most significant security
policy perceptions were those related to security policy process. That is, the participants considered
the constructs related to the security policy process to be the most significant features of the
security policy.
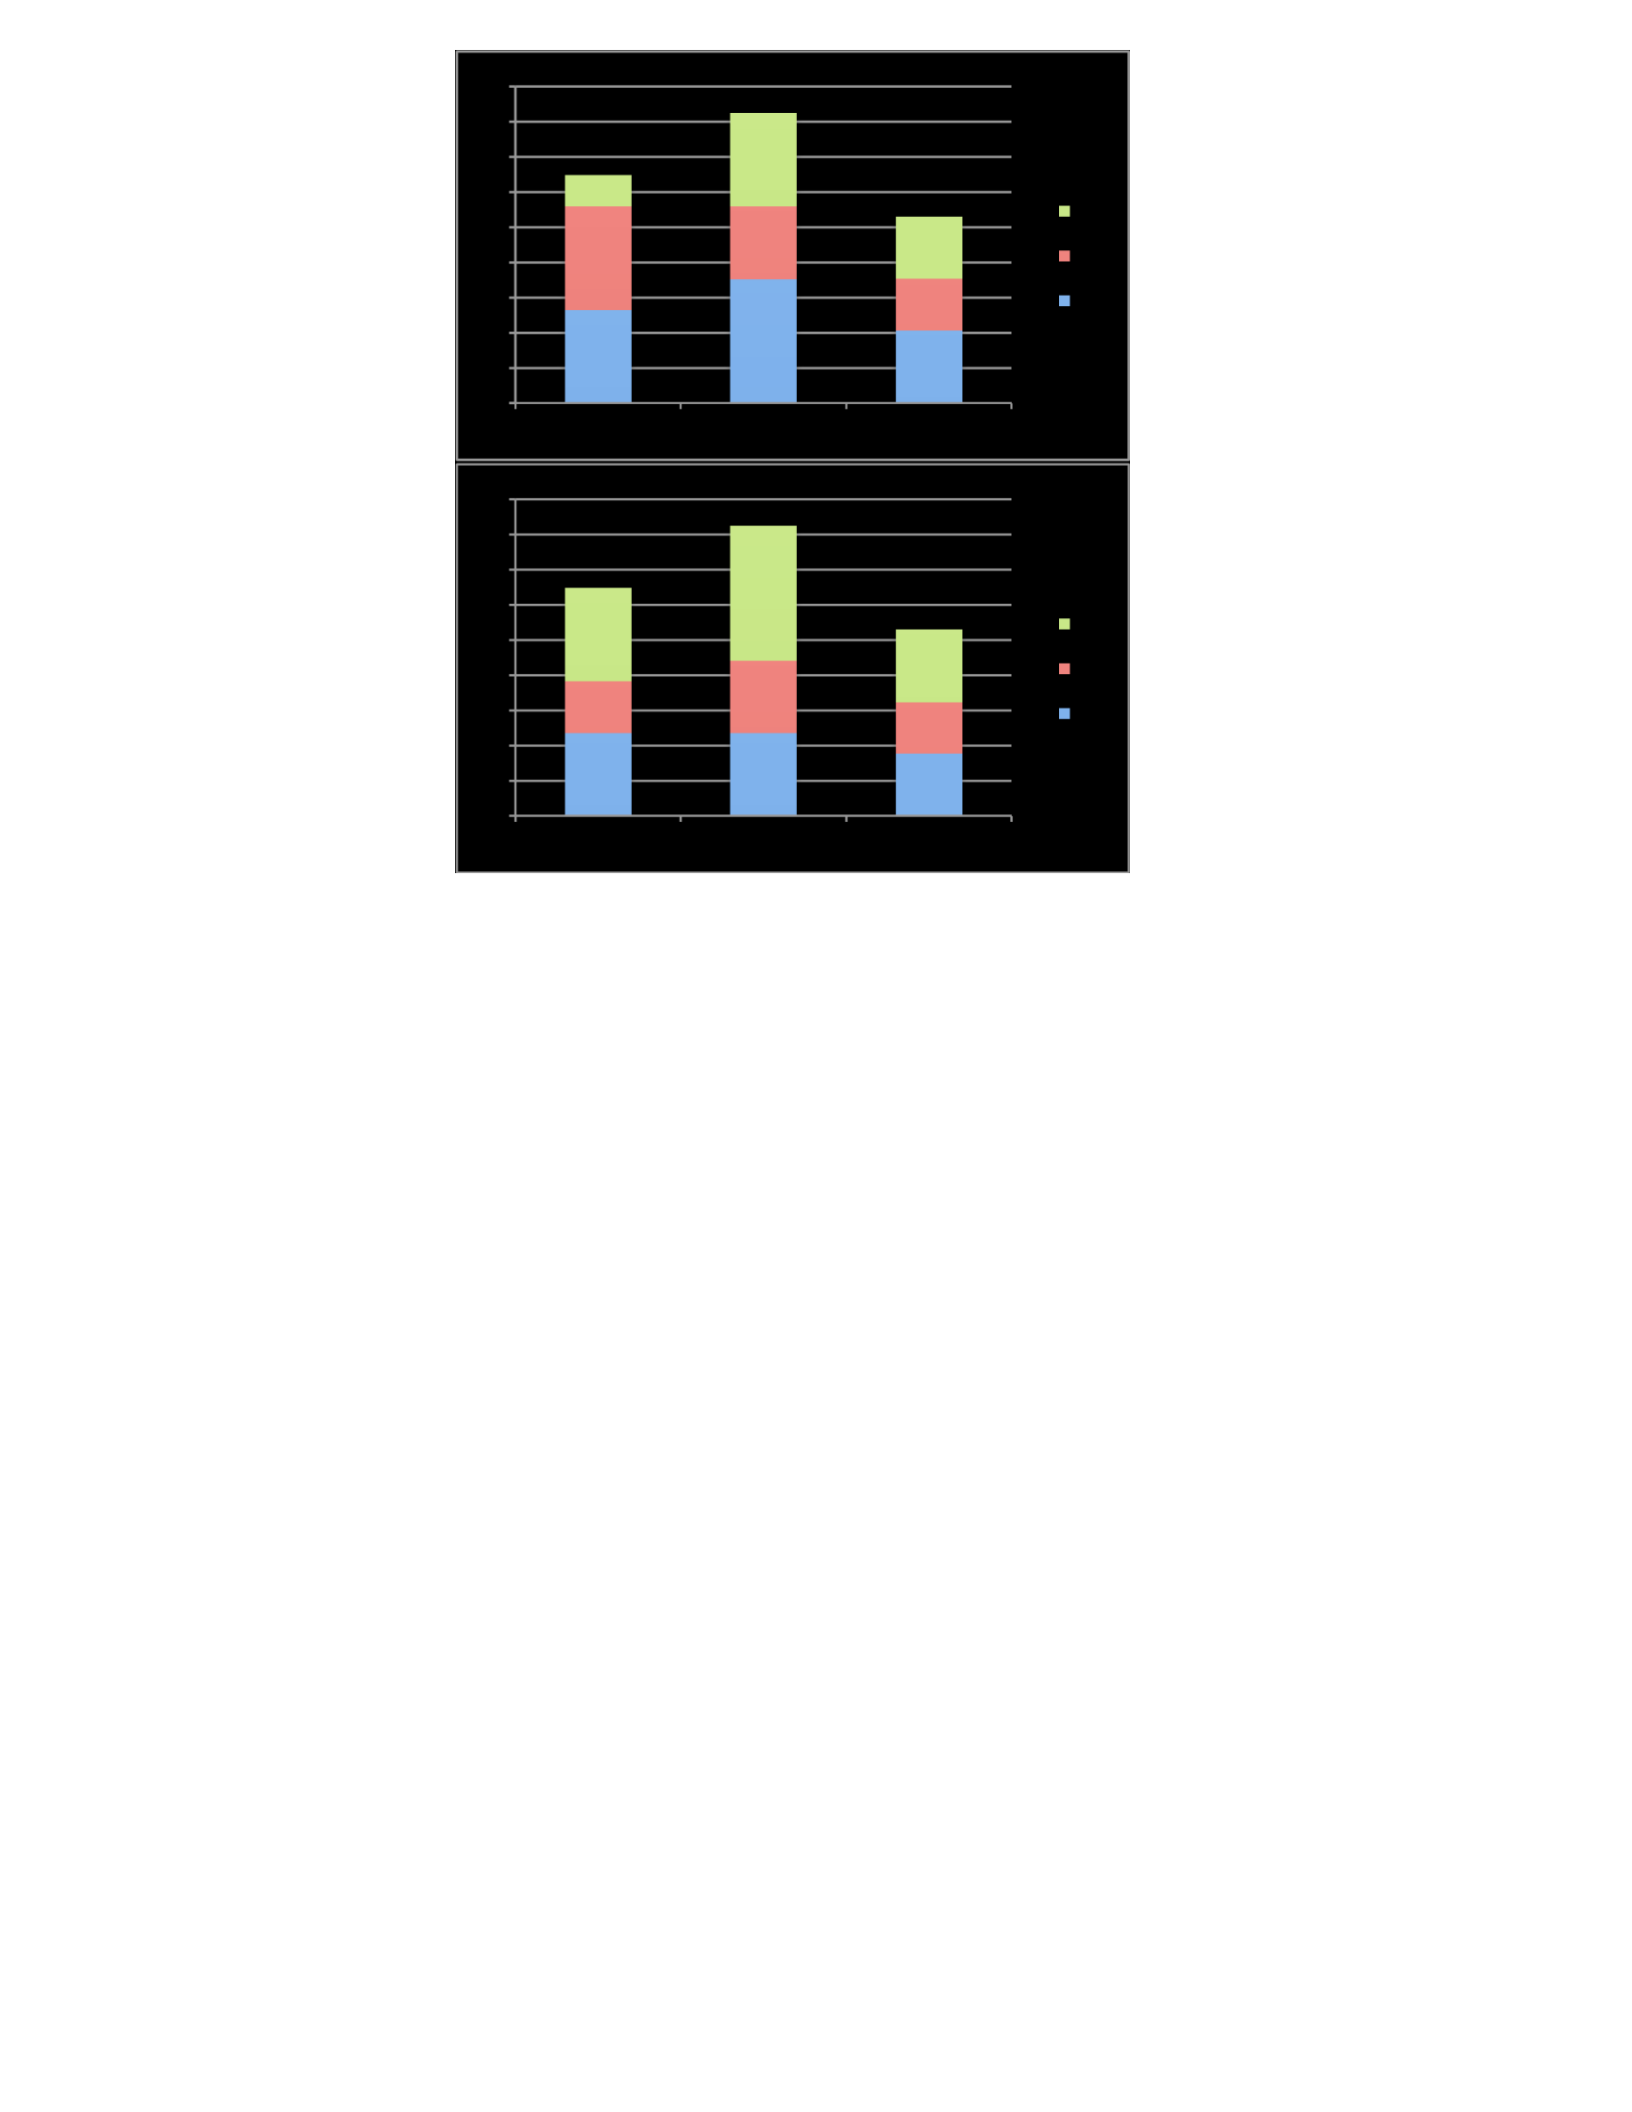
Figure 5.15: How the five main policy themes of the Crown Confections security policy were perceived by
participants whose age is less than 20 years old (before and after the breach).
Here, the perception of this group of the participants regarding the security policy before and after
the occurrence of the breach was very close. However, after the breach, the most important
perceptions were those related to security policy process and form. Also, the number of the
constructs that were considered as high, medium or low was different after introducing the breach.
For example, 17.7% of the constructs that fall under G2 group were considered highly important
before introducing the breach. However, this percentage changed to 11.8% after the breach.
The same results were reached from the level 5 participants whose age was between 20 and 30
years old, as shown in figure 5.16. This group of the participants perceived that the most important
security policy perceptions were those related to security policy process. The perception of this
group regarding the security policy before and after the introduction of the breach was very close.
However, the number of the constructs that were considered as high, medium or low changed after
introducing the breach. Also, the second most significant perception was different before and after
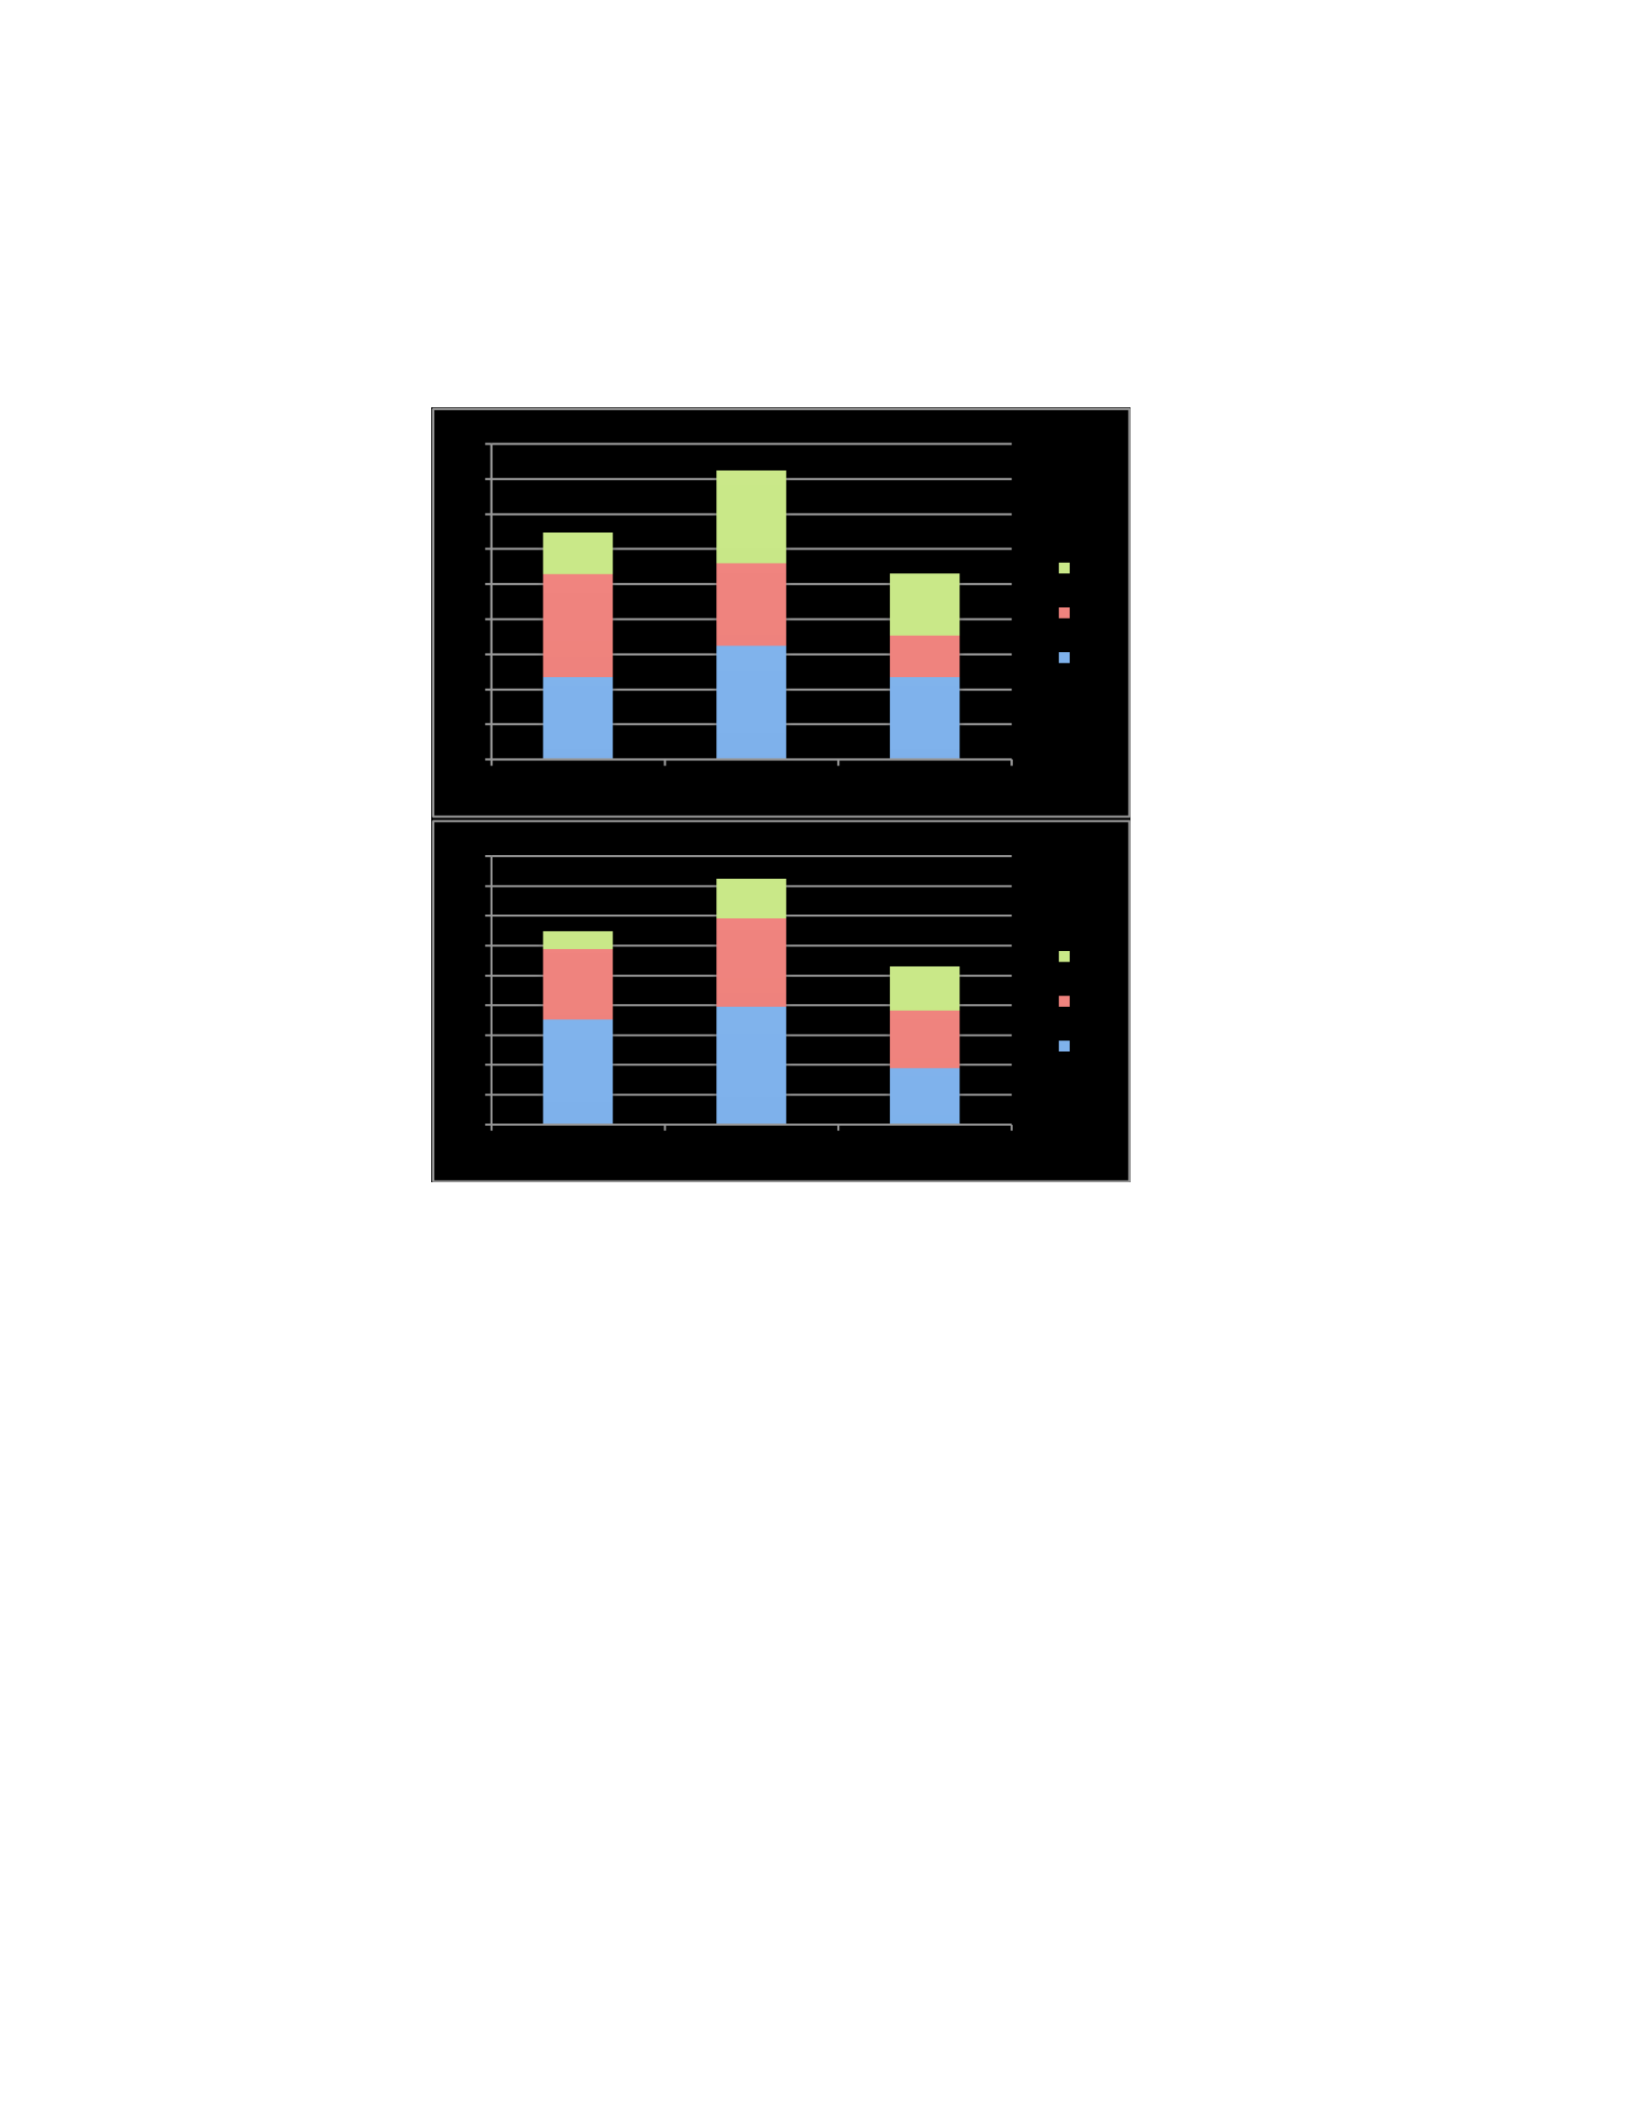
the breach. Before the breach, they considered perceptions related to both policy form and content
as the next most significant perception (11.8%). After the breach, they considered perceptions
related to policy form as the next most significant perception (17.7%), followed by the perceptions
related to policy content (9.6%).
Figure 5.16: How the five main policy themes of the Crown Confections security policy were perceived by
participants whose age falls between 20 and 30 years old (before and after the breach).
Finally, the third group of the level 5 participants who were older than 30 years had somewhat
different perceptions of the policy before and after the breach, as can be drawn from figure 5.17.
Before and after introducing the security breach, this group of the participants perceived that the
most important security policy perceptions were those related to security policy process. Also, they
believed that the next important constructs were those related to security policy form. The change
in their perception was in the percentage of the constructs that were rated as “high,” medium,” or
“low.” The percentage of the constructs that were rated as “high” in G1, G2, and G3 groups of the
policy perceptions increased from 12.5%, 8.1% and 6.6% to 19.9%, 16.2% and
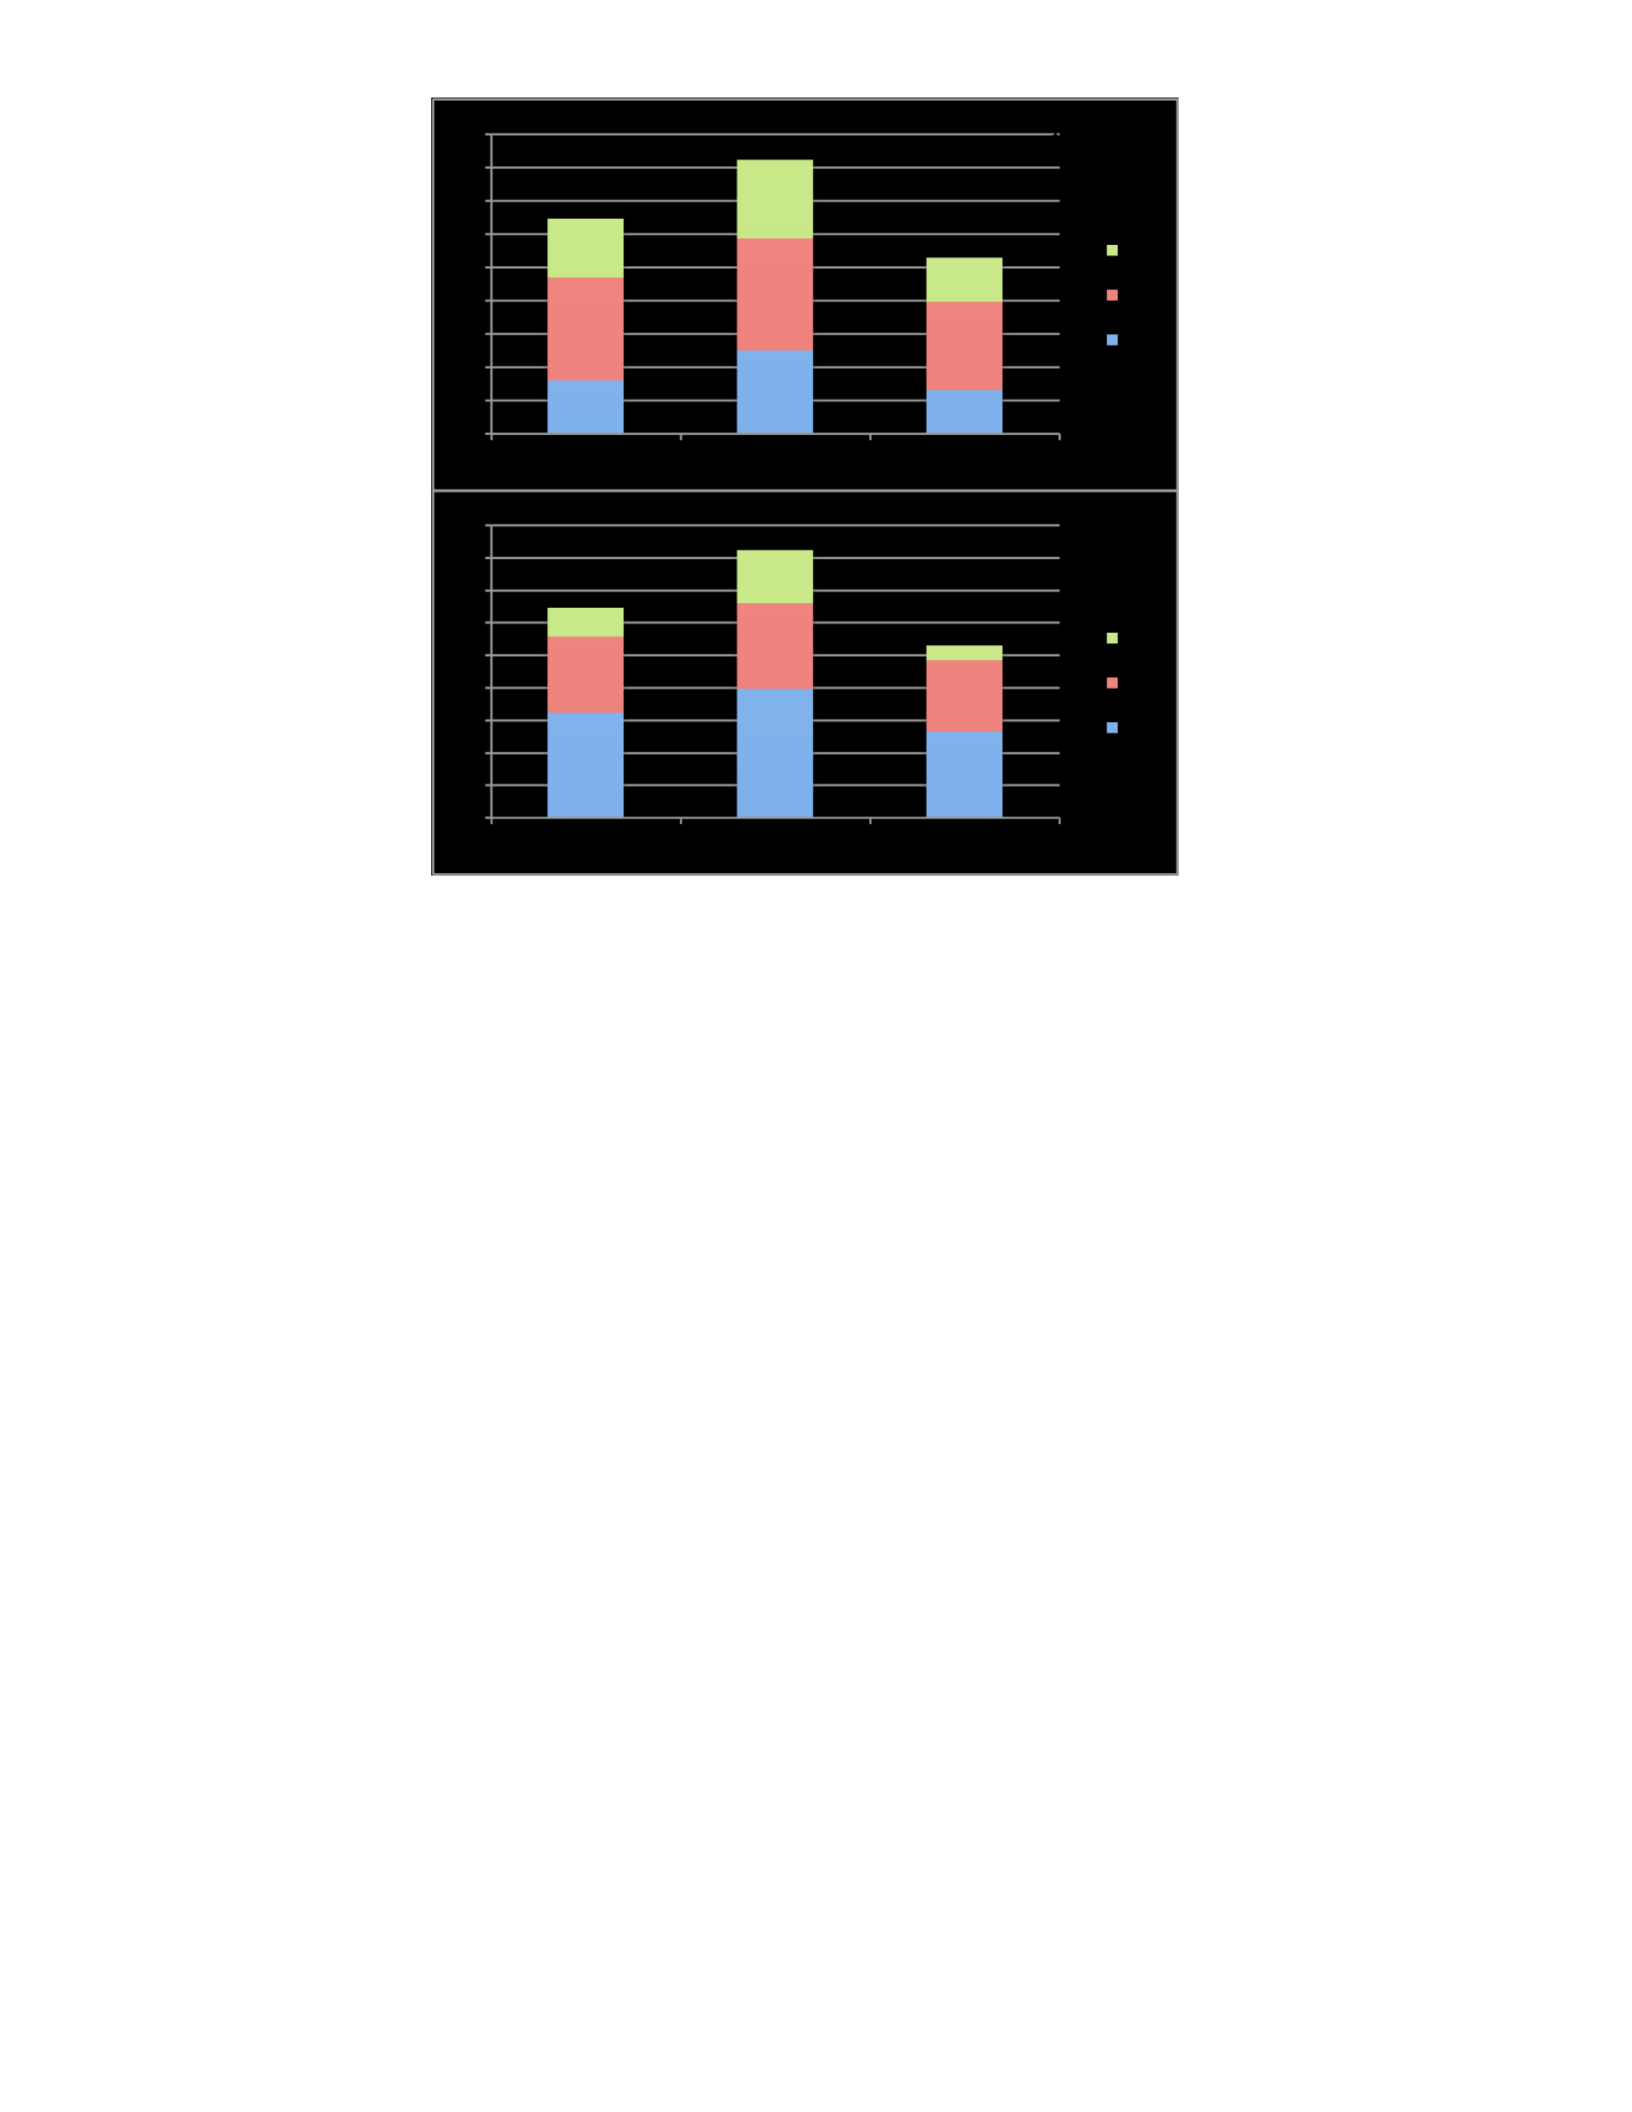
13.2%, respectively.
Figure 5.17: How the five main policy themes of the Crown Confections security policy were perceived by
participants who are older than 30 years old (before and after the breach).
To summarize, the analysis above shows that the individuals who work for organizations that have
level 5 information security policy believed that the policy process was the most important aspect
that should be taken into consideration when developing or updating security policy. However,
their perception was not stable. It was affected by the security incidents they may encounter.
• SSE-CMM Level Four
In this group, the participants were sub-grouped based on their age. They were grouped into three
groups: participants whose age was less than 20 years old; participants whose age was between 20
and 30 years old; and participants who were older than 30 years old. Figure 5.18 shows how the
five policy themes of the Crown Confections security policy were perceived by participants whose
age was between 20 and 30 years old before and after the occurrence of the security breach.
Figure 5.18 shows how the participants whose age was less than 20 years old perceive the security
policy before the breach and how their perception changed after the occurrence of the breach.
Before the breach, this group perceived that the constructs related to both security policy process
and policy content as the most significant security policy perceptions. However, this group
perceived that the constructs related to security policy process as the most significant security
policy perceptions after the breach, followed by the perceptions related to policy form.
Figure 5.18: How the five main policy themes of the Crown Confections security policy were perceived by
participants whose age were less than 20 years old (before and after the breach).
Here, the perception of this group of the participants regarding the security policy before and after
the breach was different. Also, the number of the constructs that got “high,” “medium,” or “low”
importance changed after introducing the breach. For example, 19.1% of the constructs that are
related to the G2 group were considered as highly important before introducing the breach.
However, this percentage changed to 16.2% after the breach.
The same results were reached from the level 4 participants whose age was between 20 and 30
years old as it is indicated in figure 5.19. This group perceived that the most important security
policy perceptions were those related to security policy process. The perception of this group
regarding the most significant security policy perception before and after the breach was almost
the same. However, the number of the constructs that got “high,” “medium,” or “low” important
changed after introducing the breach (refer to figure 5.19). Also, before the breach, the next most
significant perceptions were those related to both policy form and content (10%). However, after
the breach, the next most significant perceptions were those related to policy form (5.9%) followed
by those related to policy content (4.1%).
Figure 5.19: How the five main policy themes of the Crown Confections security policy were perceived by
participants whose age falls between 20 and 30 years old (before and after the breach).
Finally, the level 4 participants who were older than 30 years had very similar perceptions of the
policy before and after the breach regarding the most significant and the next significant perception
Pre-breach
Post-breach
0
5
10
15
20
25
30
35
40
45
G1
G2
G3
L
M
H
0
5
10
15
20
25
30
35
40
45
G1
G2
G3
L
M
H
of the security policy as can be drawn from figure 5.20. However, for the percentage of the
constructs that was perceived as “highly,” “medium” or “low” significant changed after the
introduction of the breach. For example, the percentage of the constructs that were rated as “high,”
“medium” and “low” in the G2 group changed from 23.5%, 8.8% and 8.8% to 22.1%,
17.7% and 1.5% after the breach, respectively.
Figure 5.20: How the five main policy themes of the
Crown Confections security policy were perceived by participants whose are older than 40 years old (before and
after the breach).
To summarize, we can draw from the analysis above that the individuals who work for
organizations that have a level 4 information security policy believed that the policy process was
the most important aspect that should be taken into consideration when developing or updating
security policy. However, their perception was not stable. It was affected by the security incidents
they have faced.
• SSE-CMM Level Three
Pre-breach
Post-breach
0
5
10
15
20
25
30
35
40
45
G1
G2
G3
L
M
H
0
5
10
15
20
25
30
35
40
45
G1
G2
G3
L
M
H
The participants of this group were grouped into three groups: participants whose age was less
than 20 years old; participants whose age was between 20 and 30 years old; and participants who
were older than 30 years old. Figure 5.21 shows how participants whose age was less than 20 years
old perceived the five policy themes of the Crown Confections security policy before and after the
occurrence of the security breach.
Figure 5.21: How the five main policy themes of the
Crown Confections security policy were perceived by participants whose age is less than 20 years old (before and
after the breach).
Figure 5.21 shows how the participants whose age was less than 20 years old perceived the security
policy before the occurrence of the breach and how their perception changed after occurrence the
breach. According to the charts, this group perceived that the constructs related to security policy
process as the most significant security policy perceptions before and after the introduction of the
security breach. However, before the breach, they perceived perceptions related to security policy
Pre-breach
Post-breach
0
5
10
15
20
25
30
35
40
45
G1
G2
G3
L
M
H
0
5
10
15
20
25
30
35
40
45
G1
G2
G3
L
M
H

form as the next most significant policy perceptions. Whereas after the breach, they perceived
perceptions related to security policy content as the next most significant policy perceptions.
The perception of this group of the participants regarding the most significant security policy
perception before and after the occurrence of the breach was very close. However, the number of
the constructs related to G2 group that were rated as “high,” “medium,” or “low” changed after
introducing the breach. For example, 19.1% of the constructs that are related to the G2 group were
considered as highly important before introducing the breach. However, this percentage reduced
to 8.8% after the breach. A similar reduction occurred in the percentage of the G1 and G3 construct
groups that were considered as highly significant (refer to figure 5.21).
Although, before the breach the level 3 participants whose age was between 20 and 30 years old
(as it is shown in figure 5.22) perceived that the most important security policy perceptions were
those related to security policy process. Also, they perceived the constructs related to the policy
form as the next most significant constructs. Their perceptions were the same before and after the
breach. The change in their perception was in the percentage of the constructs that were rated as
“high,” “medium,” or “low.” For example, 28.9% of the constructs that are related to the G2 group
were considered as highly important before introducing the breach. This percentage was changed
to 24.5% after the security breach (refer to figure 5.22).
Figure 5.22: How the five
main policy themes of the Crown Confections security
policy were perceived by participants whose age falls
between 20 and 30 years old (before and after the breach).
Similarly, the level 3 participants who were
older than 30 years old perceive that the most
important security policy perceptions were
those related to security policy process. Moreover,
they perceived the constructs related to the
policy form as the next most significant
constructs. Their perceptions were similar
before and after the occurrence of the breach. The difference in their perception was in the
percentage of the constructs that were rated as “high,” “medium,” or “low.” For example, 30.9%
of the constructs that are related to the G2 group were considered as highly important before
introducing the breach. This percentage was reduced to 22.1% after the security breach (refer to
figure 5.23).
Pre-breach
Post-breach
0
5
10
15
20
25
30
35
40
45
G1
G2
G3
L
M
H
0
5
10
15
20
25
30
35
40
45
G1
G2
G3
L
M
H
Figure 5.23: How the five main
policy themes of the Crown Confections security
policy were perceived by participants whose are older
than 30 years old (before and after the breach).
To summarize, from the analysis above we can
see that the individuals who work for
organizations that have level 3 information
security policy believed that the policy
process was the most important aspect that
should be taken into consideration when
developing or updating security policy.
However, their perceptions changed in response to the security incidents they have faced.
• SSE-CMM Level Two
The participants of this group were grouped into three groups: participants whose age was less than
20 years old; participants whose age was between 20 and 30 years old; and participants who were
older than 30 years old. Figure 5.24 shows how the participants whose age was less than 20 years
old perceived the five policy themes of the Crown Confections security policy before and after the
occurrence of the security breach.
Pre-breach
Post-breach
Pre-breach
0
5
10
15
20
25
30
35
40
45
G1
G2
G3
L
M
H
0
5
10
15
20
25
30
35
40
45
G1
G2
G3
L
M
H
0
5
10
15
20
25
30
35
40
45
G1
G2
G3
L
M
H
Figure 5.24: How the five main policy themes of the Crown Confections security policy were perceived by
participants whose age is less than 20 years old (before and after the breach).
Figure 5.24 shows that the participants whose age was less than 20 years old perceived the
constructs related to security policy form as the most significant security policy perception group
followed by security policy process. Here, the perception of this group of the participants regarding
the security policy before and after the breach was very close. However, the number of the
constructs related to each group that was rated as “high,” “medium,” or “low” changed after
introducing the breach. For example, 11.8% of the constructs related to the G1 group were
considered as highly important before introducing the breach. However, this percentage changed
to 16.2% after the breach.
Post-breach
0
5
10
15
20
25
30
35
40
45
G1
G2
G3
L
M
H

The level 2 participants whose age was between 20 and 30 years old had different perception
regarding the security policy before and after the occurrence of the breach. Before the breach, this
group perceived that the most important security policy perceptions were those related to security
policy form (15.7%) followed by security policy process (13.2%). After the breach, this group
perceived that the most important security policy perceptions were those related to security policy
process (14.2%) followed by security policy form (12.3%). Also, the percentage of constructs that
were perceived as highly significant in all of the groups was change after the occurrence of the
breach (refer to figure 5.25). For example, 9.3% of the constructs related to the G3 group were
considered as highly significant before introducing the breach. After introducing the breach, this
percentage changed to 8.3%.
Figure 5.25: How the
five main policy themes of the Crown
Confections security policy
were perceived by participants
whose age falls between 20 and 30 years
old (before and after the breach).
Lastly, different results were drawn from
the level 2 participants who were older than 30
years old. Before the breach, they perceived
that the most important security policy
perceptions were those related to security
policy process (17.7%) followed by
security policy content (11.8%). After the
breach, the perception of this group was changed. They perceived the most important security
policy perceptions were those related to security policy process (20.6%) followed by security
policy form (14.7%). Also, the percentage of constructs that were perceived as highly significant
in all of the groups changed after the occurrence of the breach (refer to figure 5.26).
Pre-breach
Post-breach
Pre-breach
0
5
10
15
20
25
30
35
40
45
G1
G2
G3
L
M
H
0
5
10
15
20
25
30
35
40
45
G1
G2
G3
L
M
H
0
5
10
15
20
25
30
35
40
45
G1
G2
G3
L
M
H
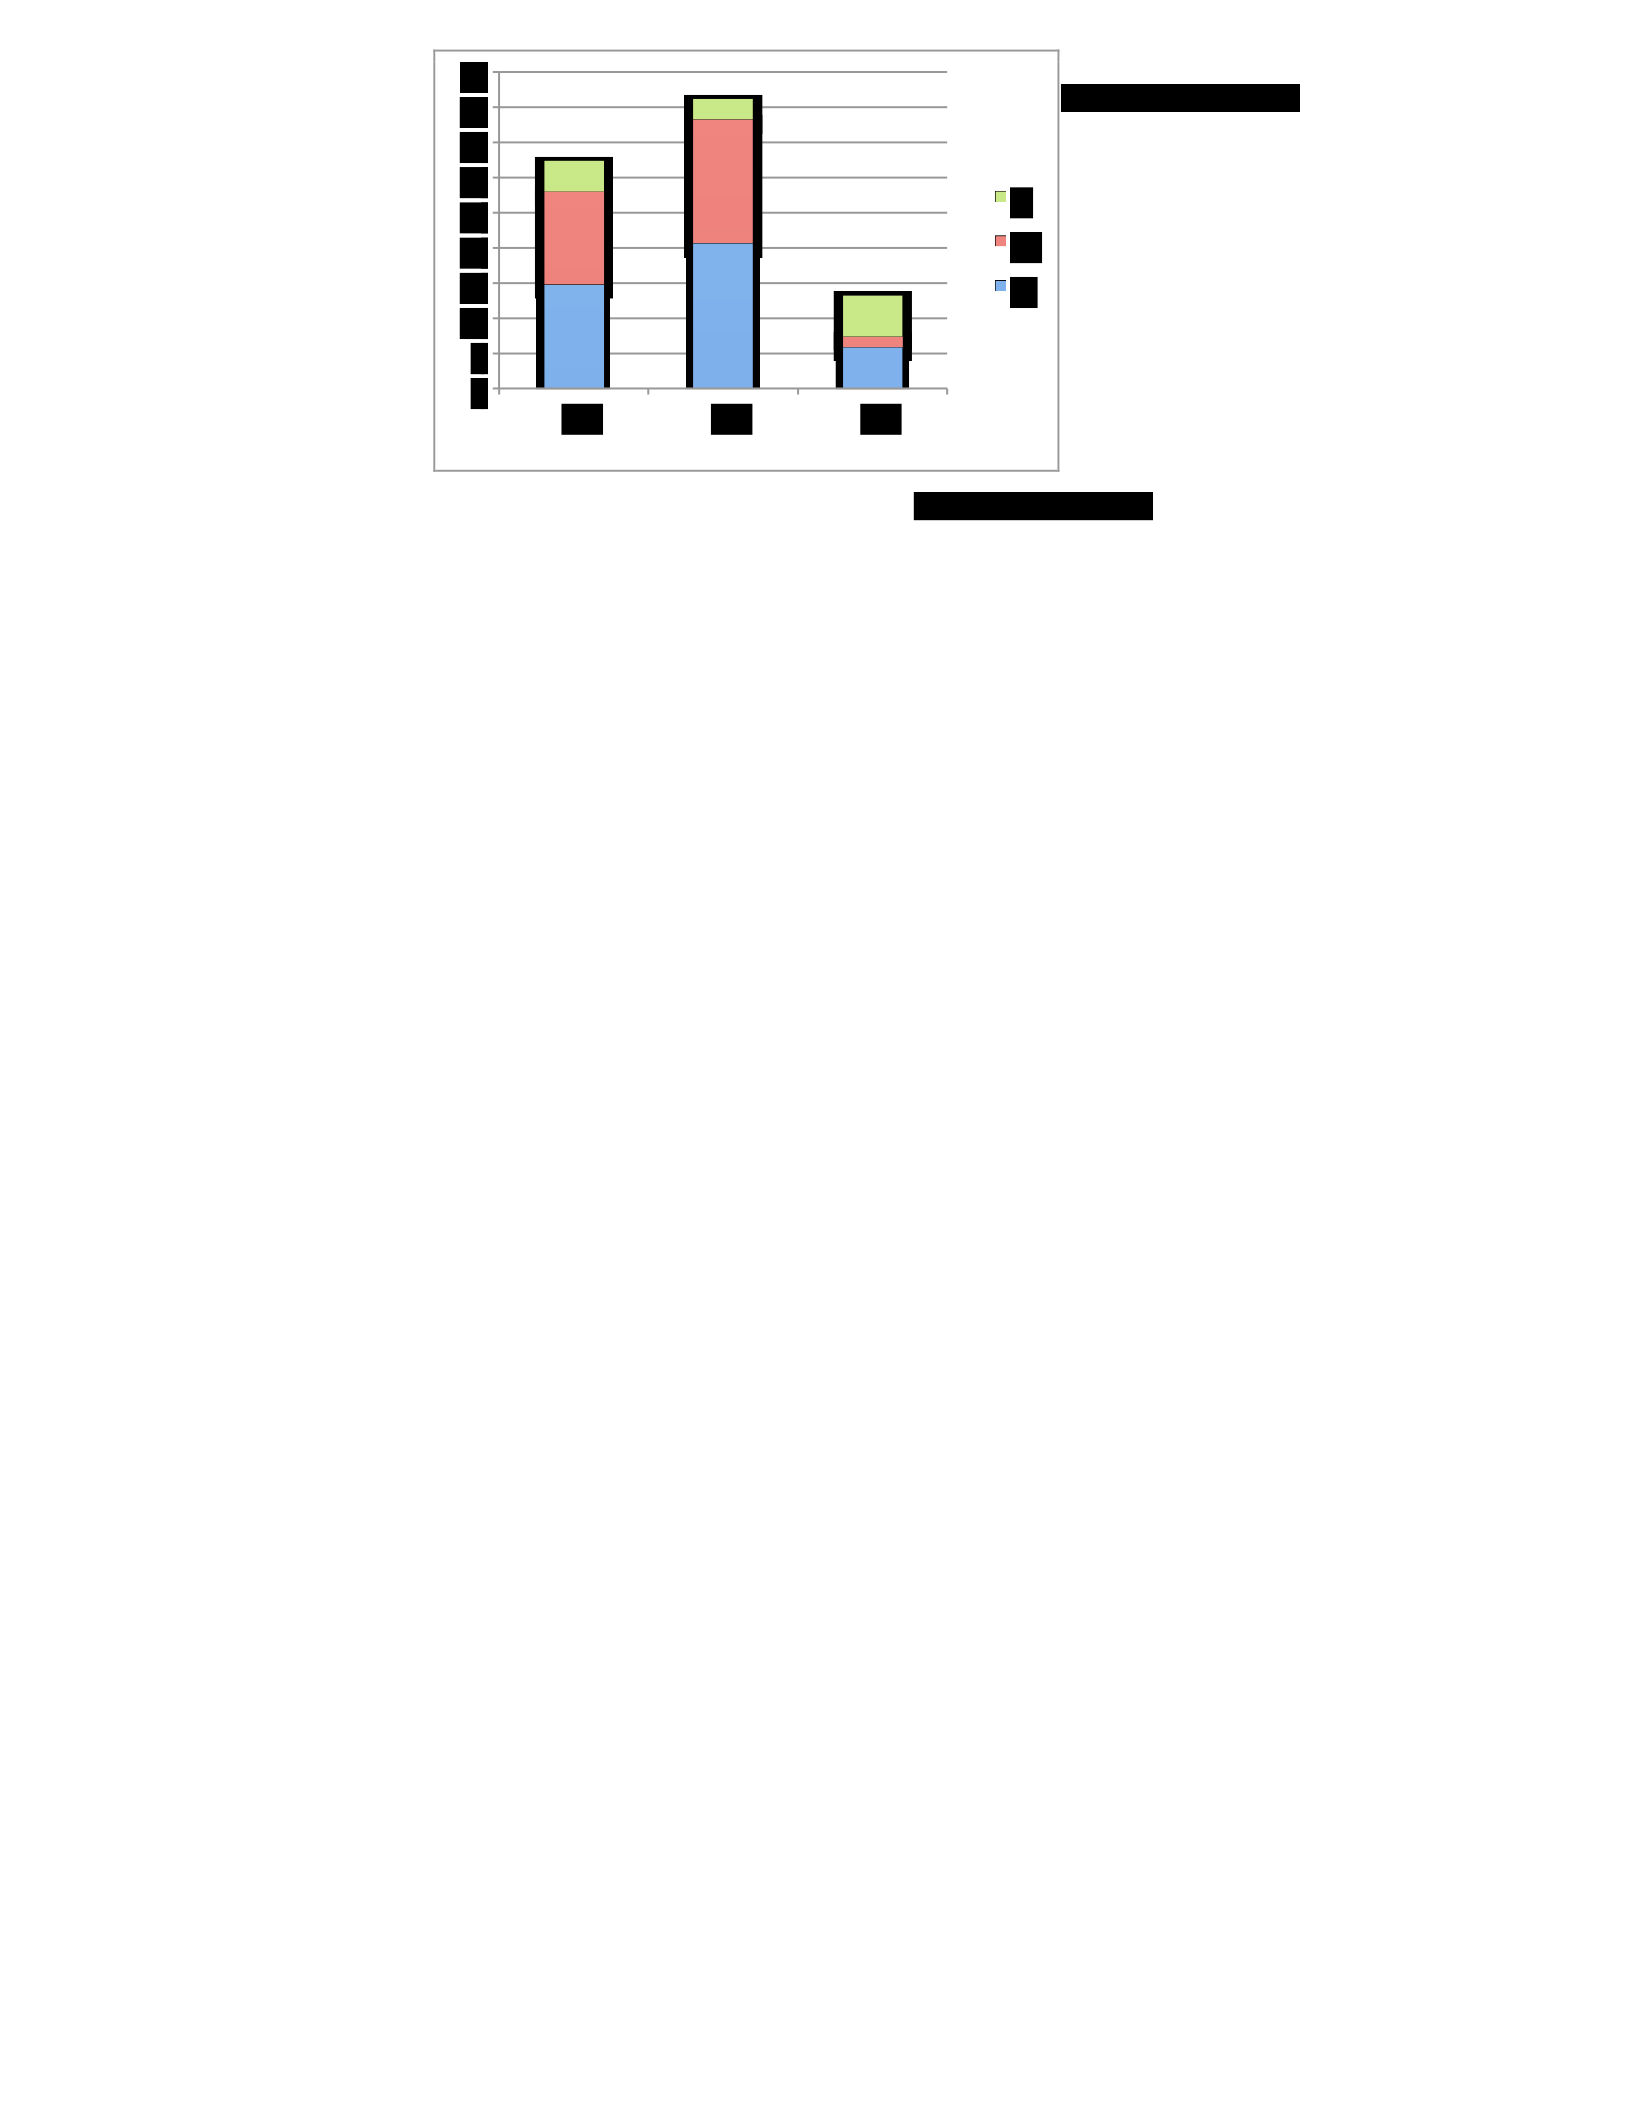
Figure 5.26: How the five main policy themes of the Crown Confections security policy were perceived by
participants whose are older than 30 years old (before and after the breach).
To summarize, from the analysis above we can see that the individuals who were work for
organizations that have level 2 information security policy, except those who were younger than
20 years old, believed that the policy process was the most important aspect that should be taken
into consideration when developing or updating a security policy. However, their perception was
not stable. It was affected by the security incidents they have faced.
• SSE-CMM Level One
Post-breach
0
5
10
15
20
25
30
35
40
45
G1
G2
G3
L
M
H
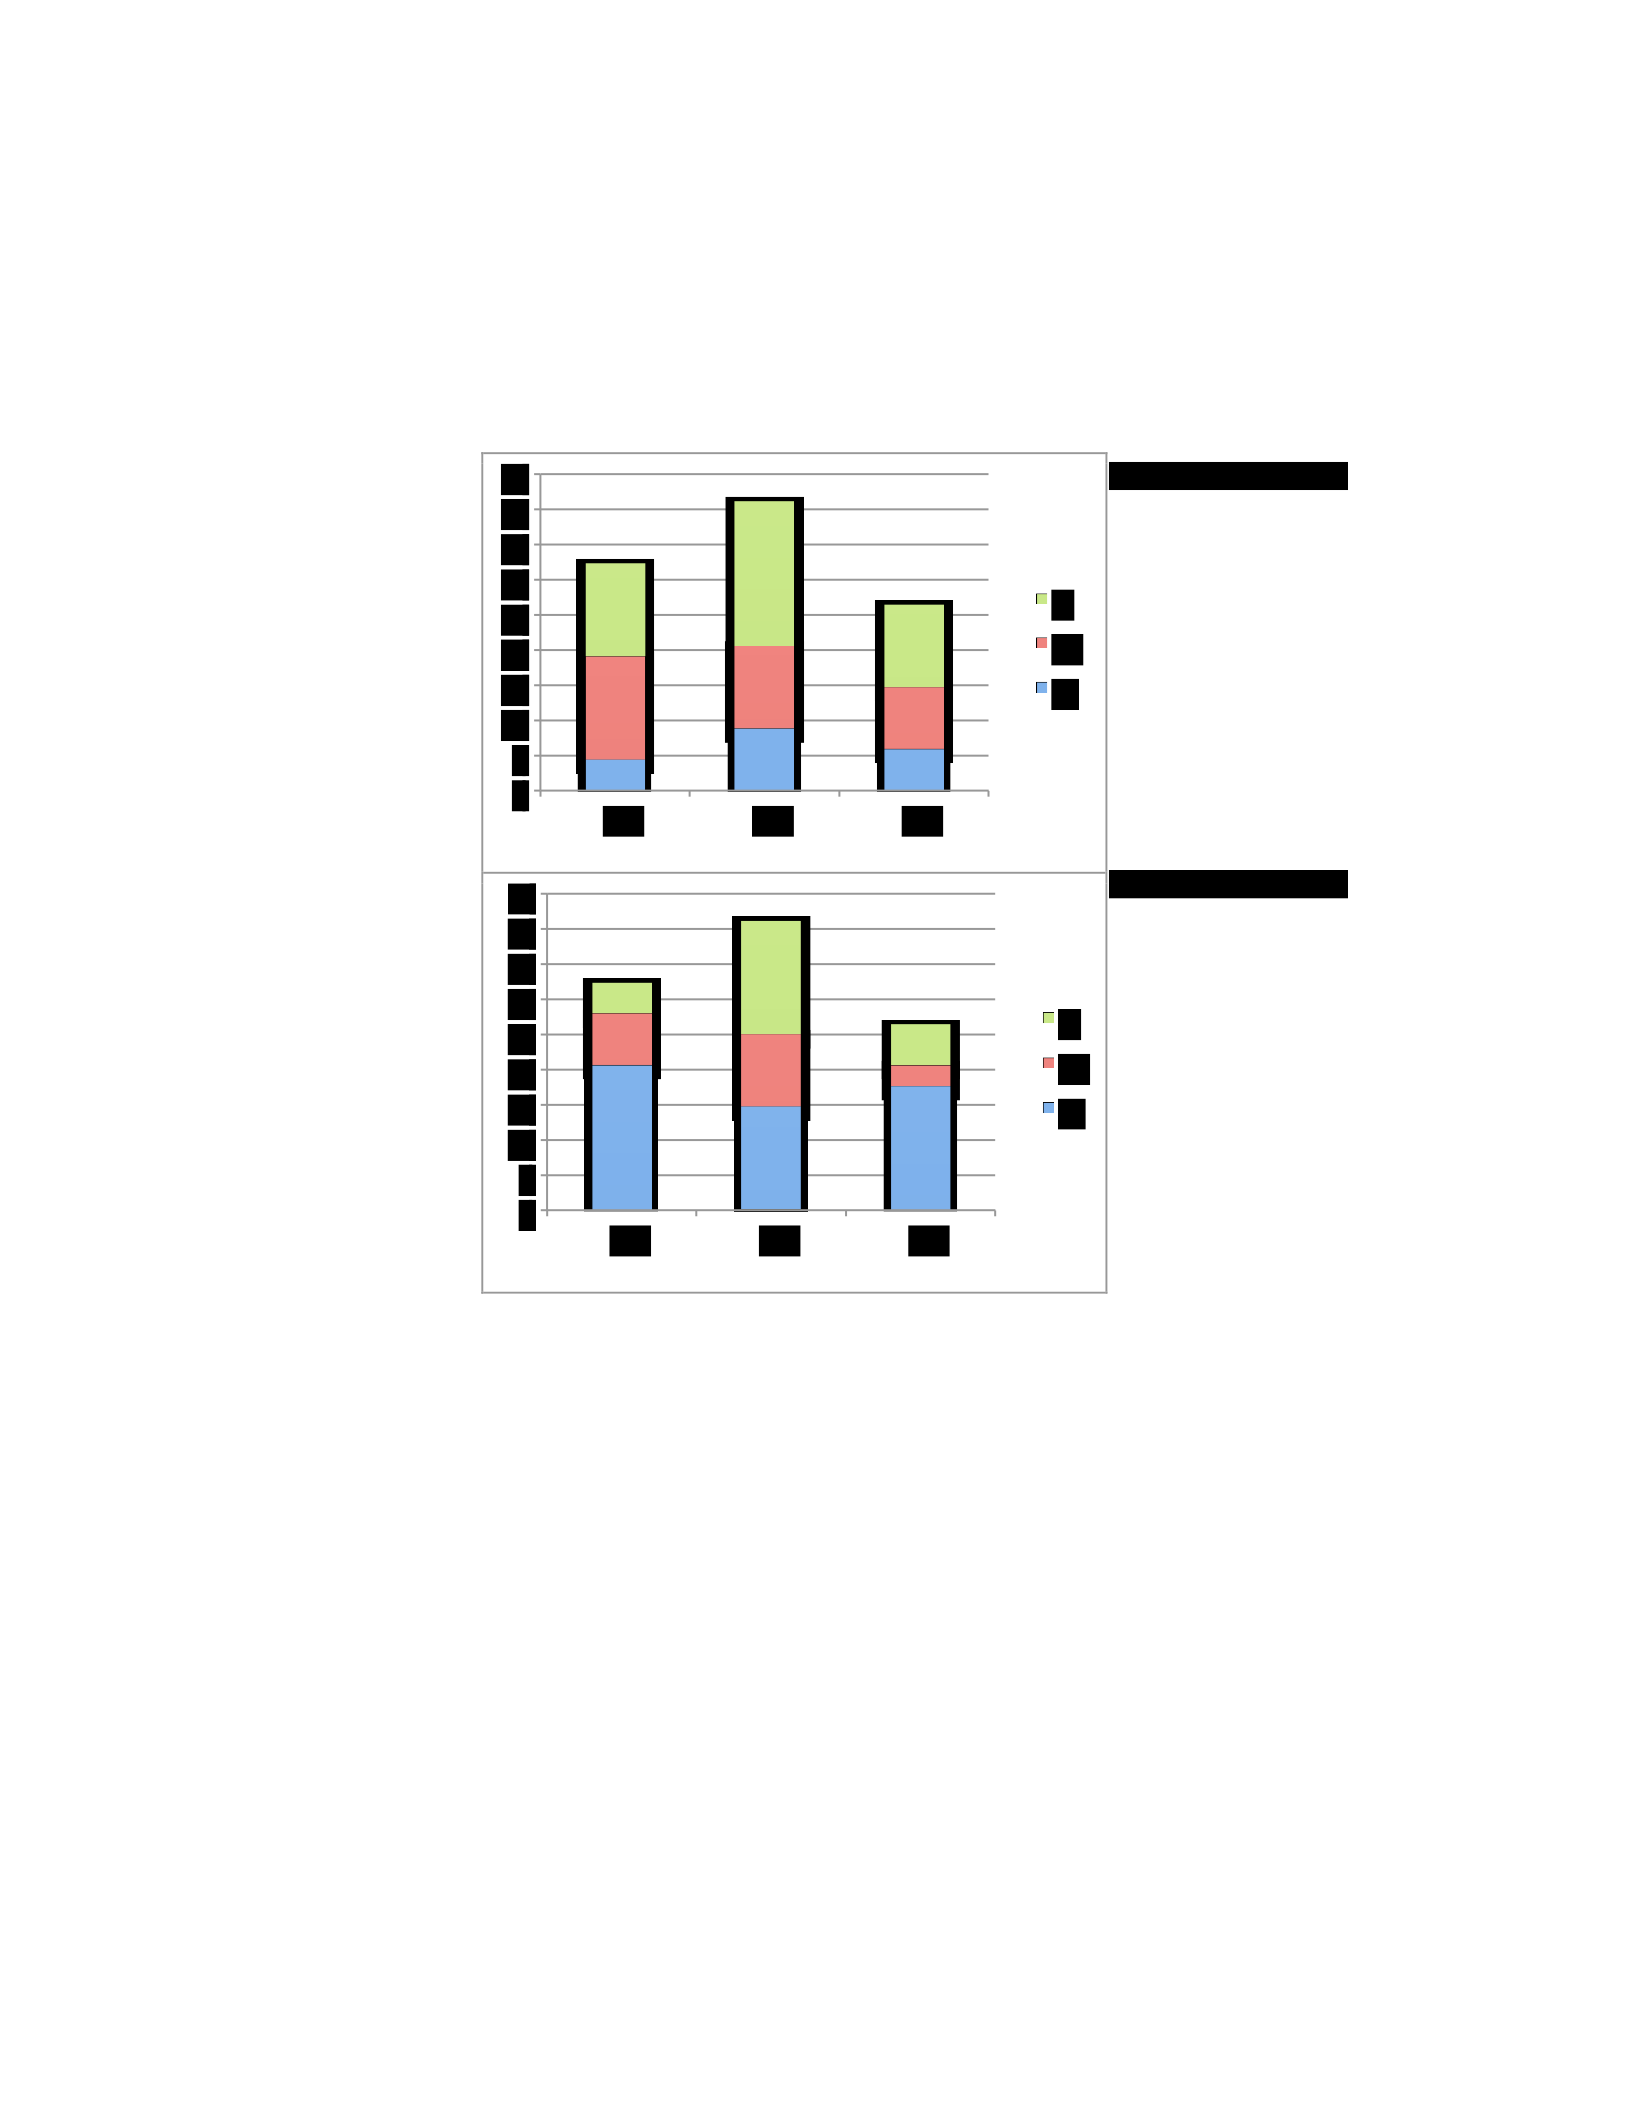
The participants of this group were grouped into three groups: participants who were younger than
20 years old; participants whose age was between 20 and 30 years old; and participants who were
older than 30 years old. Figure 5.27 shows how the participants who were younger than 20 years
old perceived the five policy themes of the Crown Confections security policy before and after the
occurrence of the security breach.
Figure 5.27: How the five main policy themes of the
Crown Confections security policy were perceived
by participants whose age is less than 20 years old (before and after the breach).
This chart shows how the participants who were younger than 20 years old perceived the security
policy before and how their perception changed after introducing the breach. According to the
figure 5.27, before the introduction of the security breach, this group believed that the constructs
related to security policy process (8.8%) as the most significant security policy perceptions
followed by those related to security policy content (5.9%). However, this perception changed after
the occurrence of the security breach. After the introduction of the security breach, this group
believed that the constructs related to security policy form (20.6%) were the most significant
Pre-breach
Post-breach
0
5
10
15
20
25
30
35
40
45
G1
G2
G3
L
M
H
0
5
10
15
20
25
30
35
40
45
G1
G2
G3
L
M
H

security policy perceptions followed by those related to security policy content (17.7%). Besides,
the percentage of the constructs that were rated as “high” was increased after introducing the
breach. For example, 4.4% of the constructs that are related to the G1 group were considered as
highly important before introducing the breach. However, this percentage increased to 20.6% after
the breach.
Different results were drawn from the level 1 participants whose age was between 20 and 30 years
old (as it is shown in figure 5.28). Before the introduction of the breach, this group perceived that
the most important security policy perceptions were those related to security policy process and
those related to policy form (9.6%). After the introduction of the breach, this group perceived that
the most important security policy perceptions were those related to security policy process
(13.2%) followed by those related to policy form (10.3%). Also, the change in their perception was
in the percentage of the constructs that were rated as “high,” “medium” and “low” in each
perception group (refer to figure 5.28).
Different results were drawn from the level 1 participants who were older than 30 years old. Before
the breach, they perceived that the most important security policy perceptions were those related
to security policy form (5.9%) followed by those related to security process (%4.4). After the
breach, they perceived the constructs related to the policy process (25%) as highly significant
followed by those related to policy form (13.2%) (refer to figure 5.29). It is important to point out
to that; generally, the percentage of constructs that were perceived as highly significant in all of
the perception groups increased after the occurrence of the breach. With the G1 group, the
percentage changed from 5.8% to 13.2%. For the G2 group, the percentage changed from 4.4% to
25%. Finally, for the G3 group, the percentage changed from 2.9% to 11.8% (refer to figure
5.29).
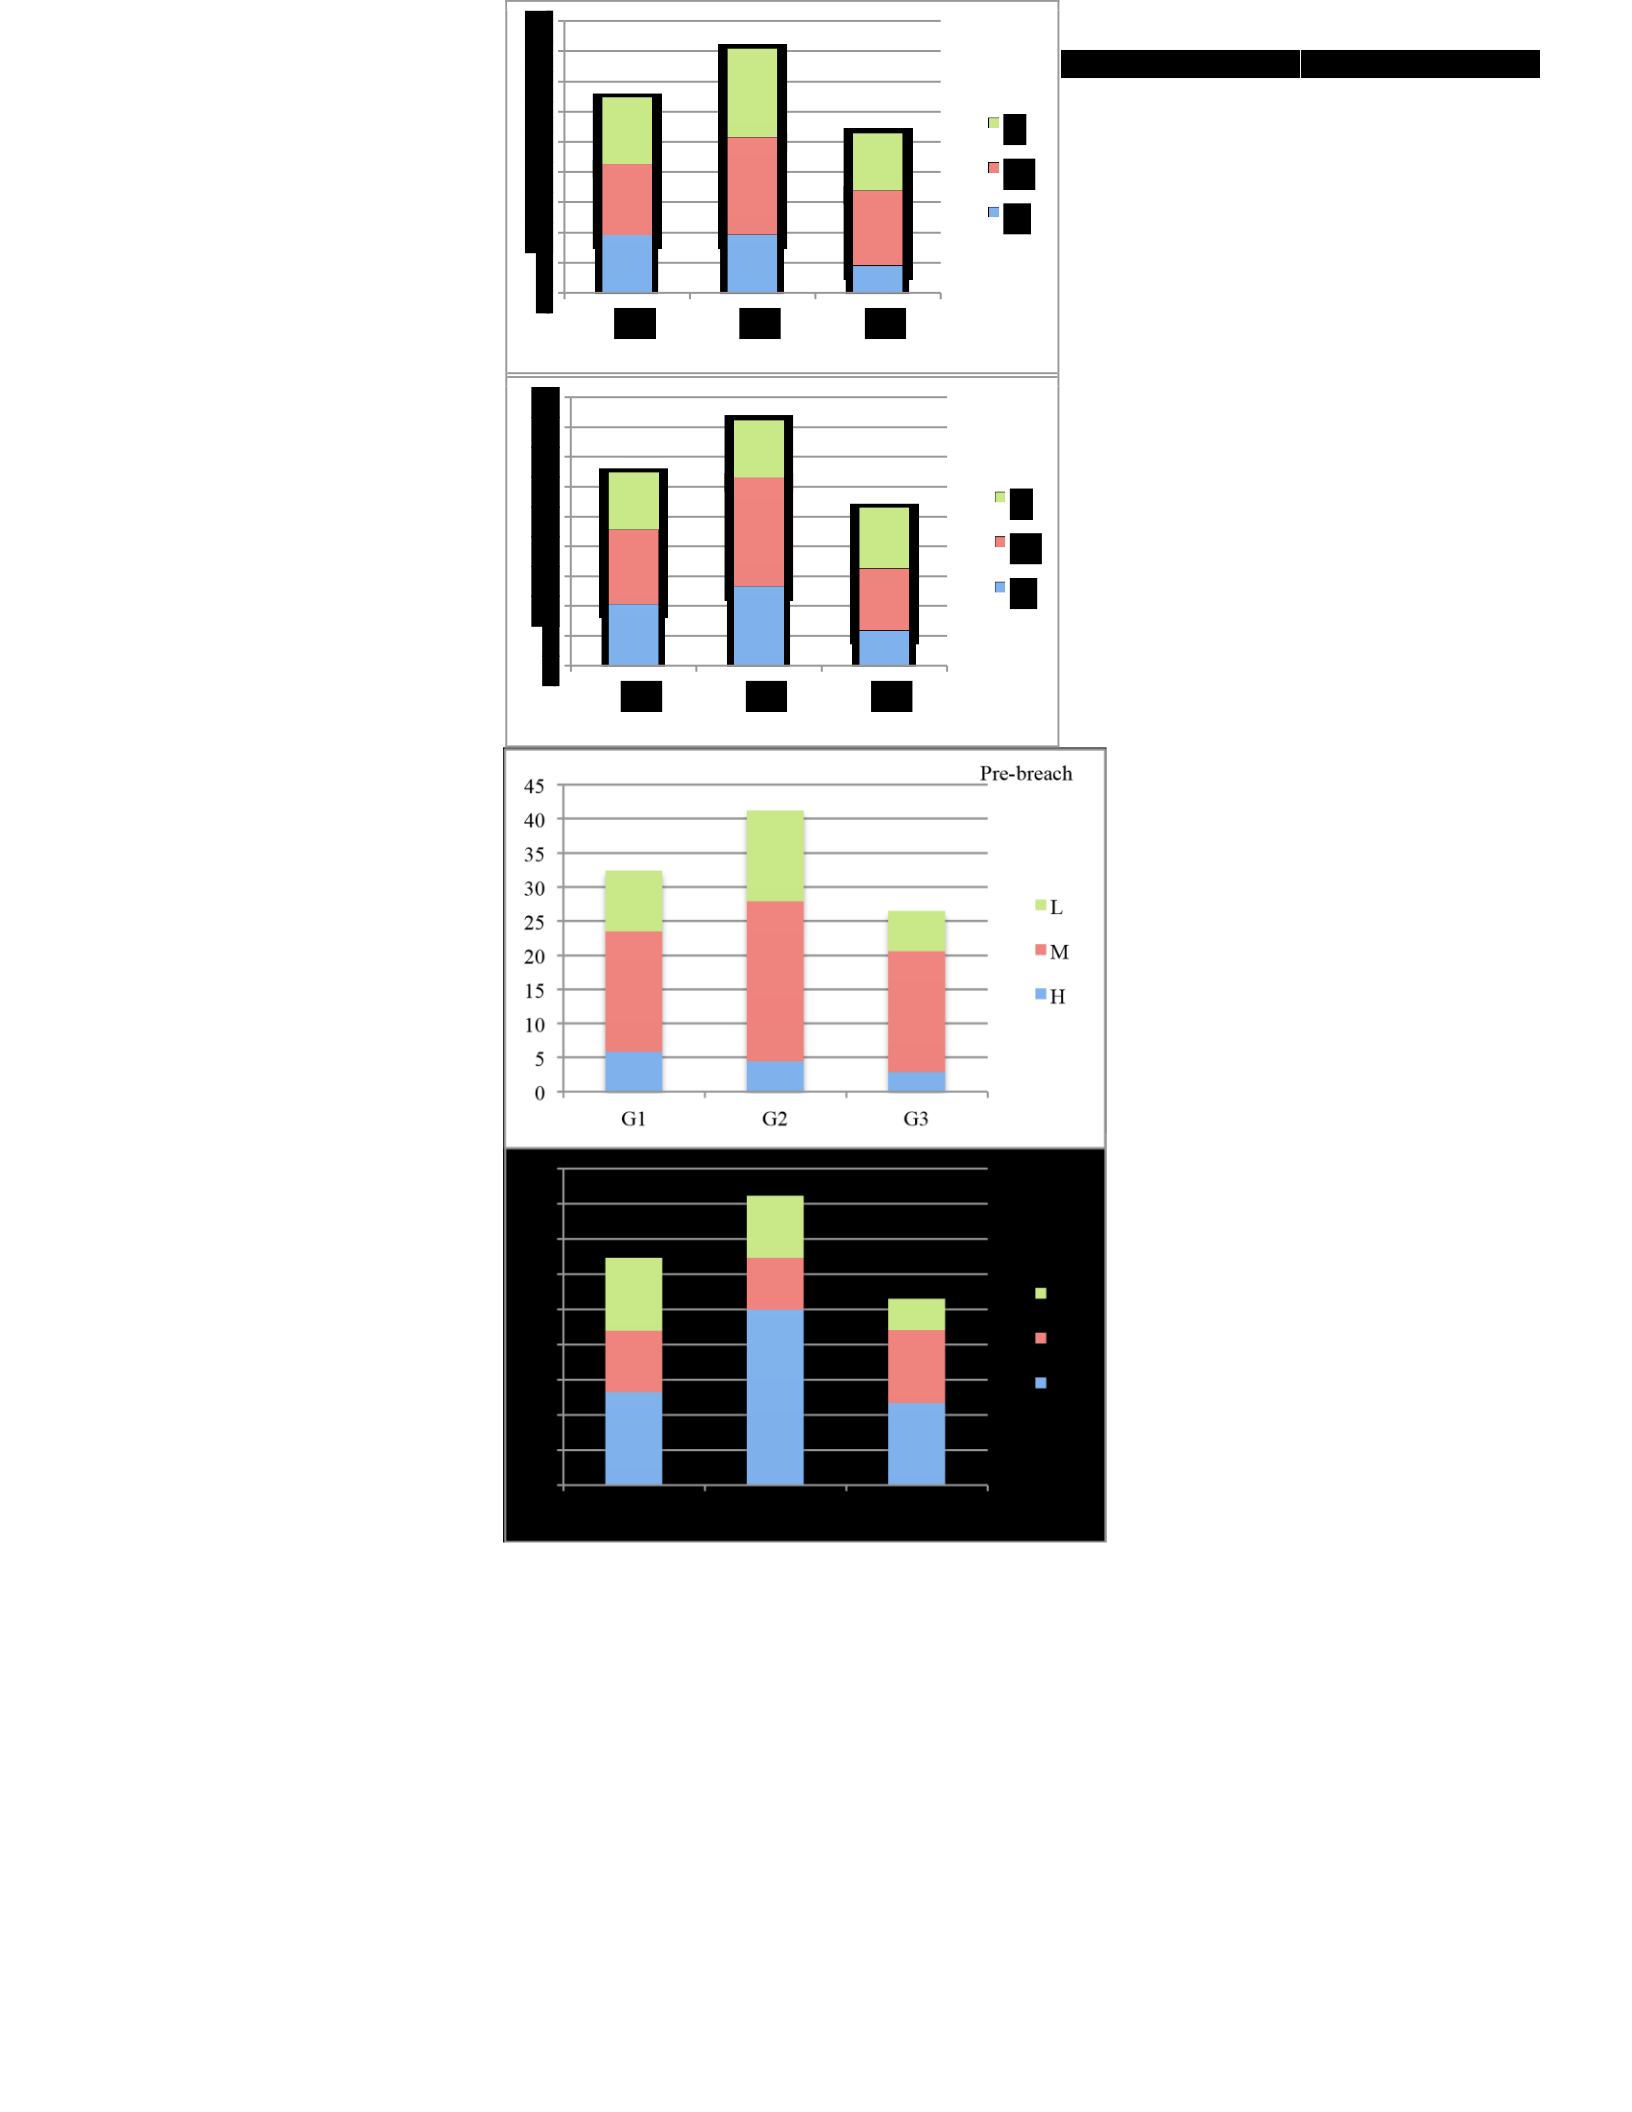
Figure 5.28: How the five
main policy themes of the Crown Confections security policy
were perceived by participants whose age falls
between 20 and 30 years old (before and after the breach).
Figure 5.29: How the five main policy themes of the Crown Confections security policy were perceived by
participants whose are older than 30 years old (before and after the breach).
We can conclude from the analysis above that the individuals who work for organizations that have
level 1 information security policy held different perceptions regarding the security policy in
accordance with their age. They perceived that the policy process and the policy form were the
Pre-breach
Post-breach
0
5
10
15
20
25
30
35
40
45
G1
G2
G3
L
M
H
0
5
10
15
20
25
30
35
40
45
G1
G2
G3
L
M
H

most significant construct groups. However, their perception changed in response to the security
incidents they have faced.
To sum up, examining the five groups with the age subgrouping demonstrates how the perceptions
of the participants in each group were different before and after introducing the security breach.
That is, the perception of the participants regarding which constructs group was the highest
significant was different before and after the occurrence of the security breach. For some of the
groups, they perceived the same constructs group as the highest important group before and after
the breach. In this case, the change in their perception was not regarding the constructs group that
perceived as the highest important, but regarding the percentage of the constructs within each
constructs group that were rated as “high,” “medium,” or “low.” For example, the level 2
participants who were older than 30 years perceived the policy process as the most significant
constructs’ group. However, the percentage of constructs that were rated as “high” changed from
17.7% to 20.6%. The percentage of constructs that were rated as “medium” changed from 14.7%
to 17.7%. The percentage of constructs that were rated as the least important changed from 8.8%
to 2.9% after the breach. It is important to point out to that the perceptions of the participants after
the occurrence of the security breach were not necessarily the optimal perceptions. That is, the
occurrence of the breach does not fix the perceptions; it only changes the participants’ perceptions,
which is reflected on their norms.
5.3.2.2 Security Policy Perception and Experience
Next, the content analysis was conducted on the groups that were categorized based on the
experience of the participants. After categorizing the participants into five groups based on the
SSE-CMM five levels, each group was categorized based on the experience of the participants.
Then, each sub-group was analyzed via a content analysis.
• SSE-CMM Level Five
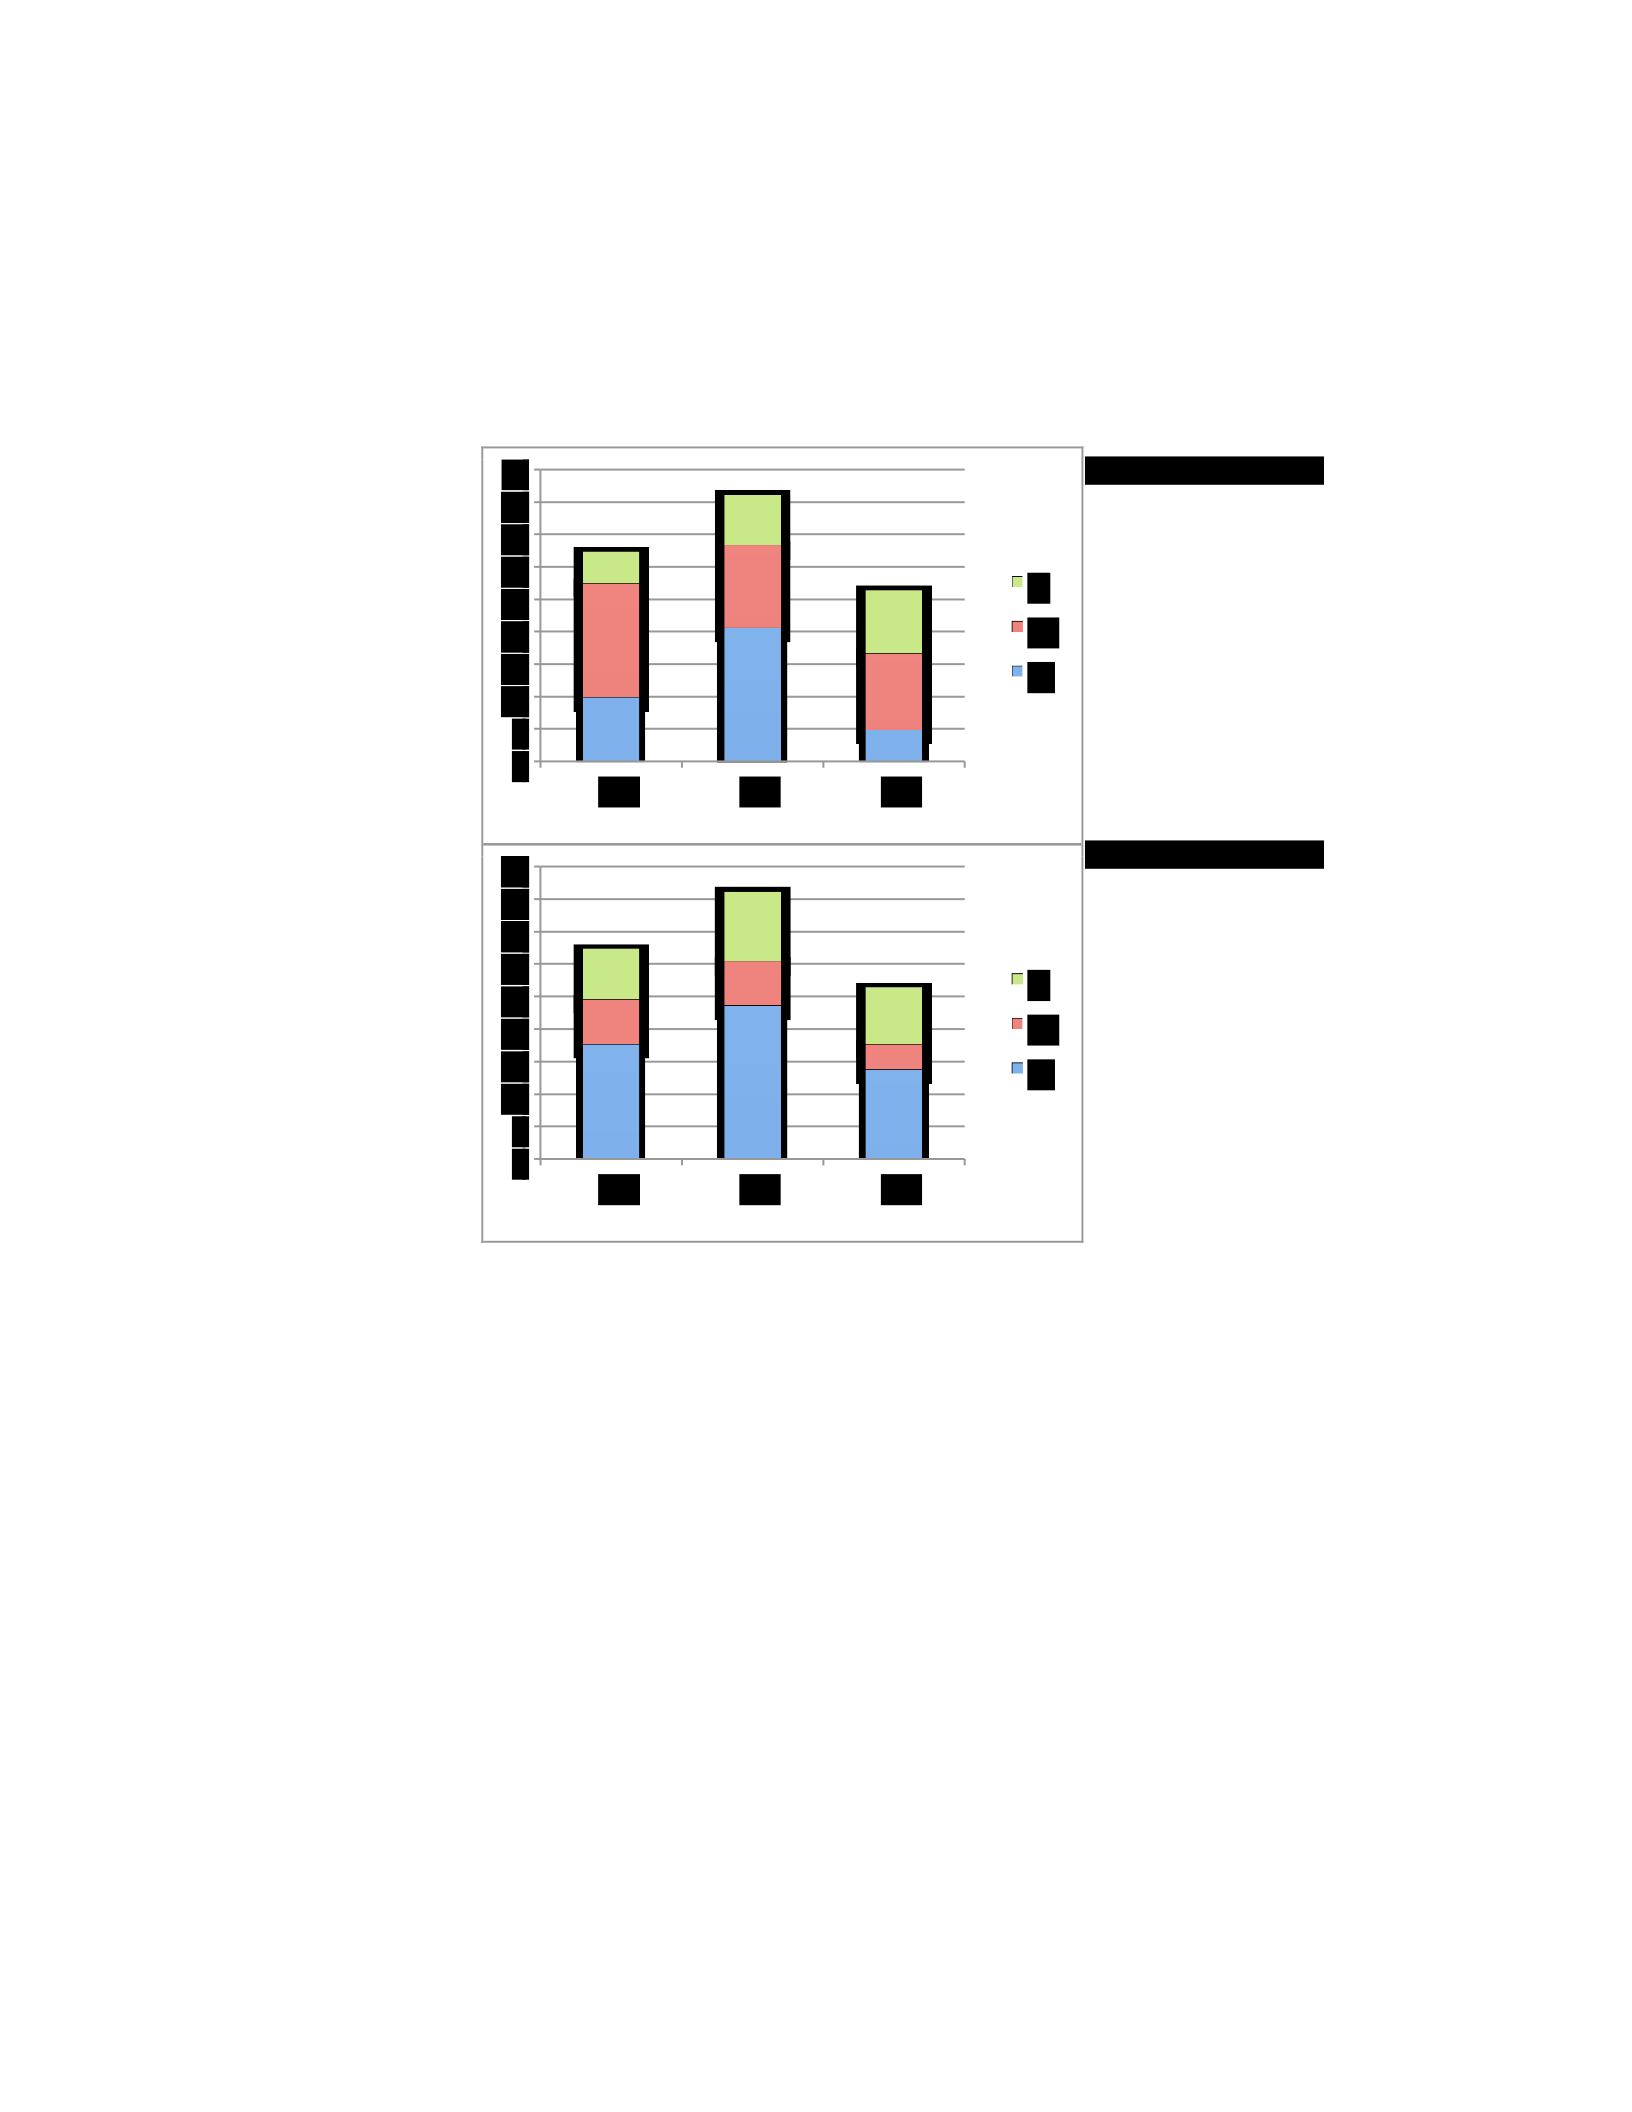
The participants of this group were sub-grouped into three groups based on their experience:
participants who had less than 2 years of experience, participants who had between 1 to 5 years of
experience and participants who had more than 5 years of experience. Figure 5.30 shows how the
participants who had less than 2 years of experience perceived the five policy themes of the Crown
Confections security policy before and after the occurrence of the security breach.
Figure 5.30: How the five main policy themes of the Crown
Confections security policy were perceived by
participants who have less than 2 years of experience
(before and after the breach).
The charts in figure 5.30 show that the level 5 participants who had less than 2 years of experience
perceived that the most significant security policy perceptions were those related to security policy
process followed by those related to policy form. That is, the participants considered the constructs
related to the security policy process and how it should be as the most significant aspects of the
security policy.
Here, the perception of this group regarding the security policy before and after the breach was
very similar. Though, the percentage of the constructs that were rated as “high,” “medium,” or
Pre-breach
Post-breach
0
5
10
15
20
25
30
35
40
45
G1
G2
G3
L
M
H
0
5
10
15
20
25
30
35
40
45
G1
G2
G3
L
M
H

“low” changed after introducing the breach. For example, 20.6% of the constructs that fall under
G2 group were rated as highly important before introducing the breach. However, this percentage
increased to 23.5% after the occurrence of the breach. Similarly, the change occurred to G1 and
G3 (refer to figure 5.30).
For the level 5 participants who had between 2 to 5 years of experience, they perceived that
perceptions that related to security policy process were the most important security policy
perceptions as it appears in figure 5.31. The difference here was in the constructs that considered
as the next significant ones. Their perception regarding the most significant security policy aspects
before and after the breach was similar. Before the breach, the policy form and policy content got
the same percentage of the constructs that were rated as “high.” After the breach, the next
significant constructs’ group was the policy form. Also, the percentage of the constructs that were
rated as “high,” “medium,” or “low” changed after introducing the breach (refer to figure
5.31).
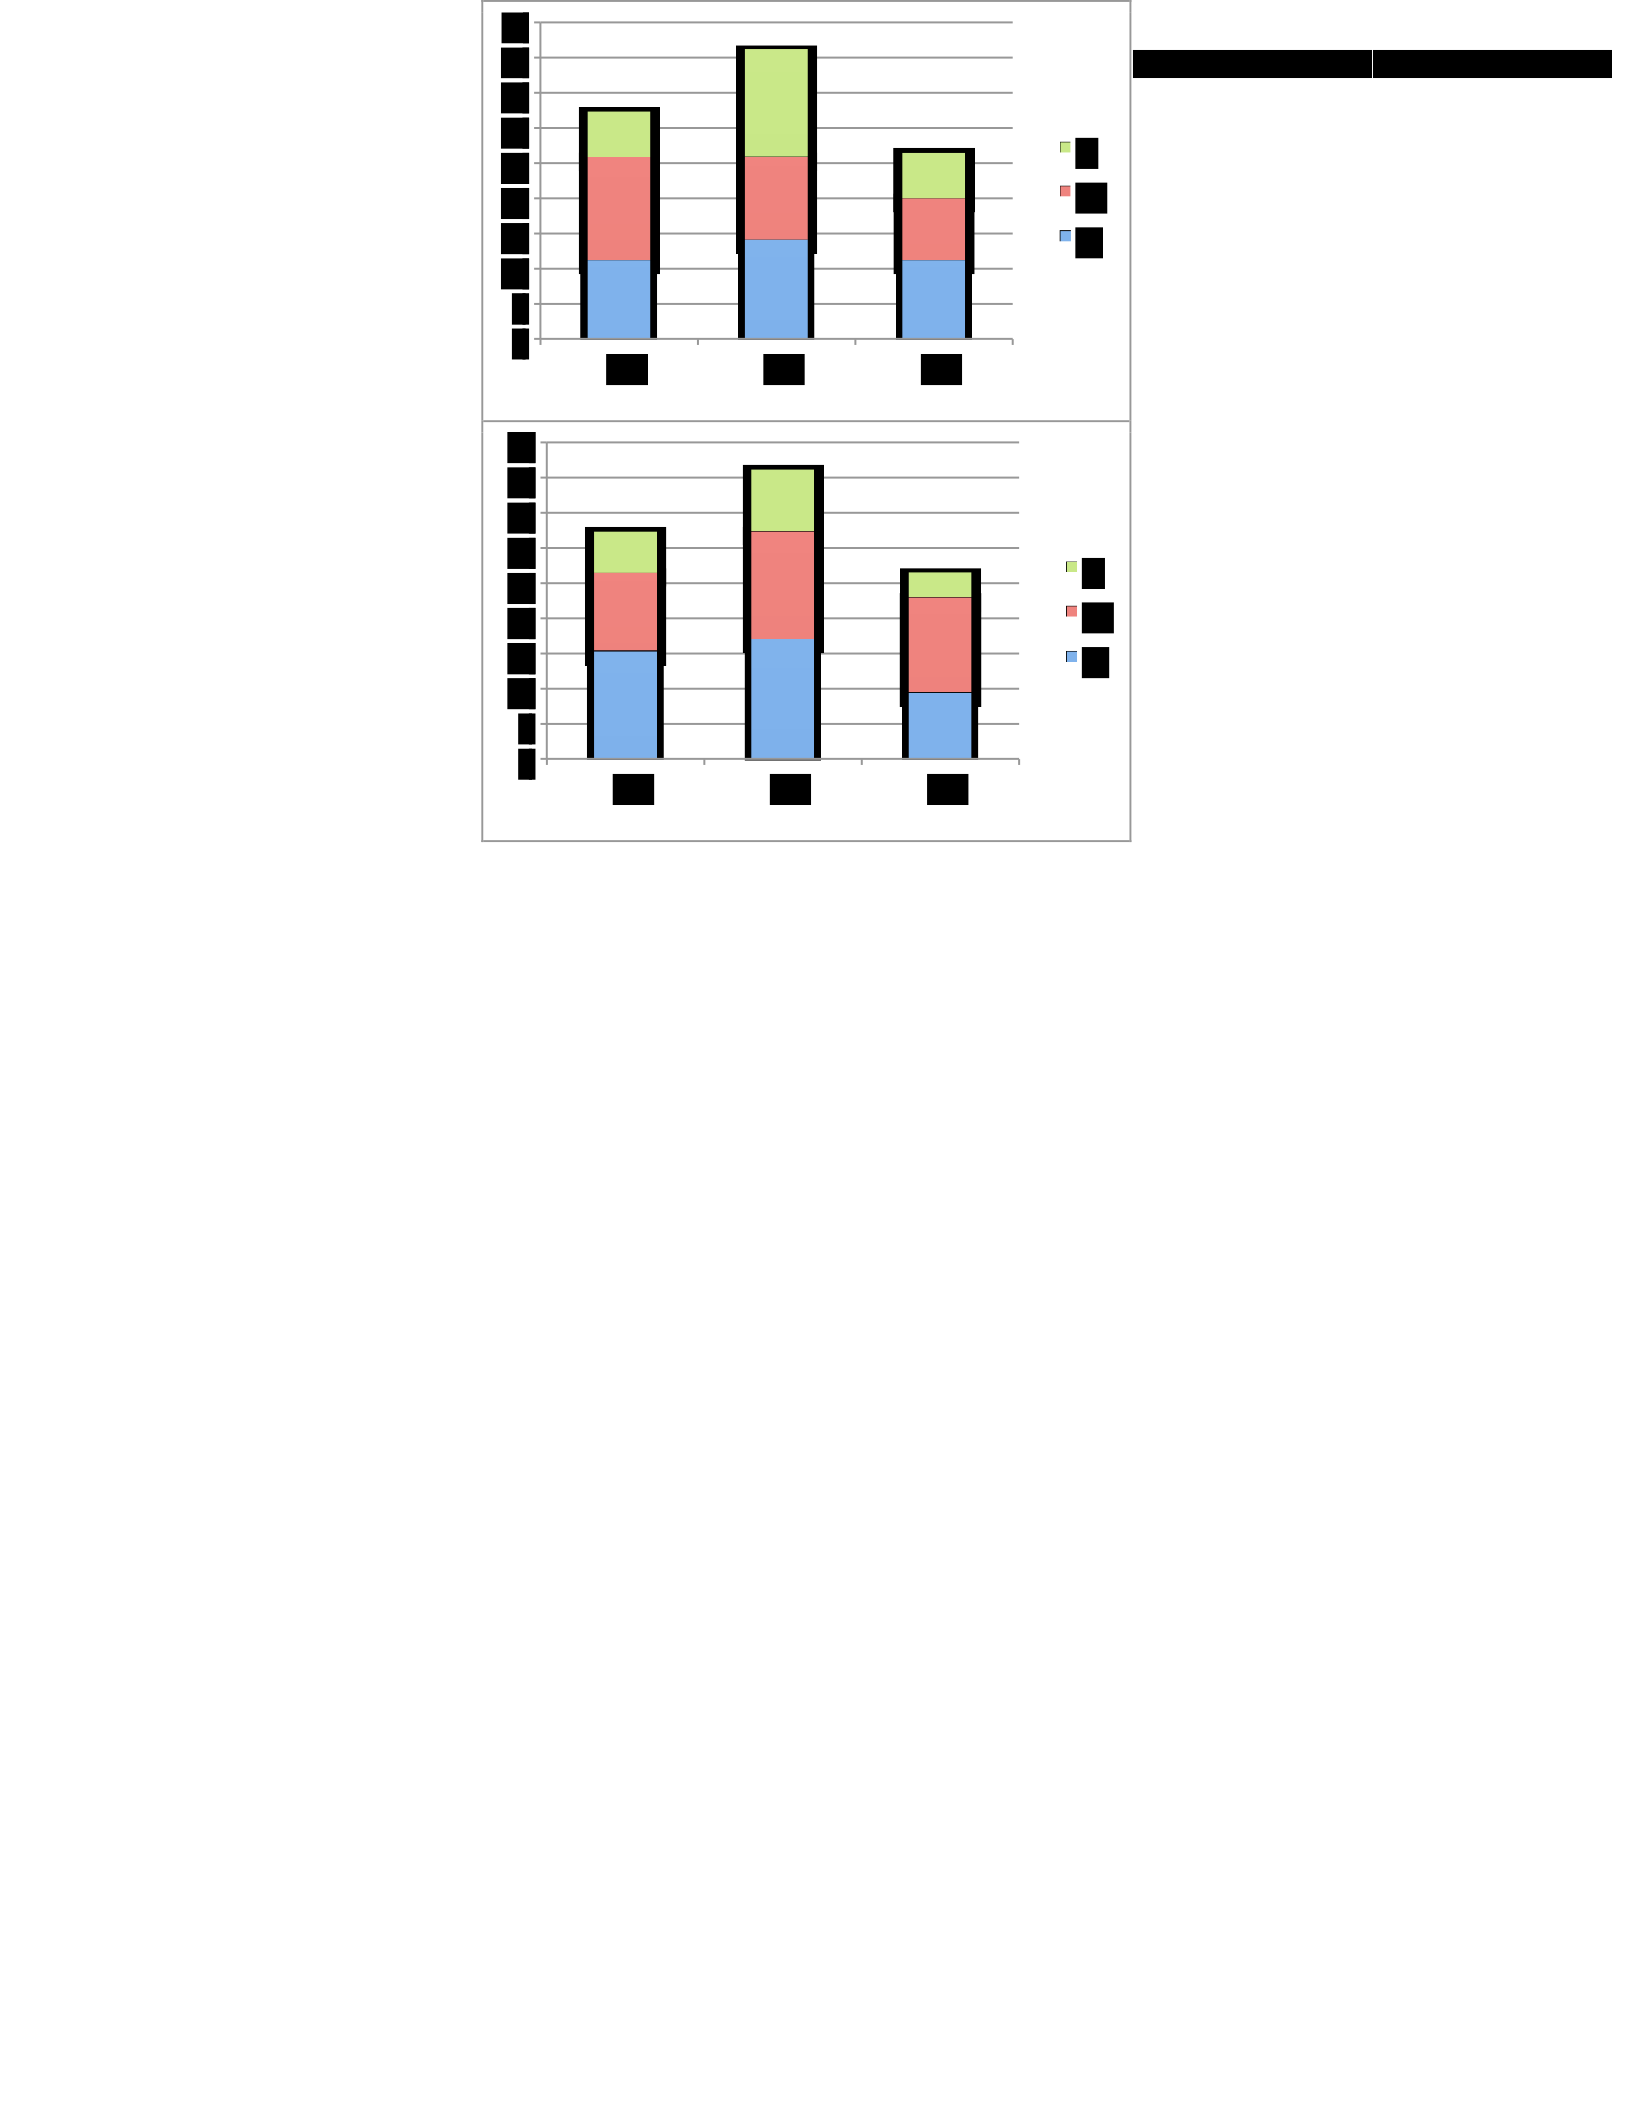
Figure 5.31: How the five
main policy themes of the Crown Confections security
policy were perceived by participants with between 2
and 5 years of experience (before and after the
breach).
Finally, the third group of the level 5
participants who had more than 5 years of
experience had different perceptions of
the policy before and after the breach as can
be drawn from figure 5.32. Before
introducing the security breach, this
group perceived that the most important
security policy perceptions were those
related to security policy content followed by those related to security policy form. After
introducing the breach, this group perceived that the most important security policy perceptions
were those related to security policy form followed by those related to security policy process. The
perception of this group totally changed after introducing the security breach. Besides that, the
percentage of the constructs that were rated as “high,” “medium,” or “low” changed after
introducing the breach (refer to figure 5.32).
Pre-breach
Post-breach
0
5
10
15
20
25
30
35
40
45
G1
G2
G3
L
M
H
0
5
10
15
20
25
30
35
40
45
G1
G2
G3
L
M
H
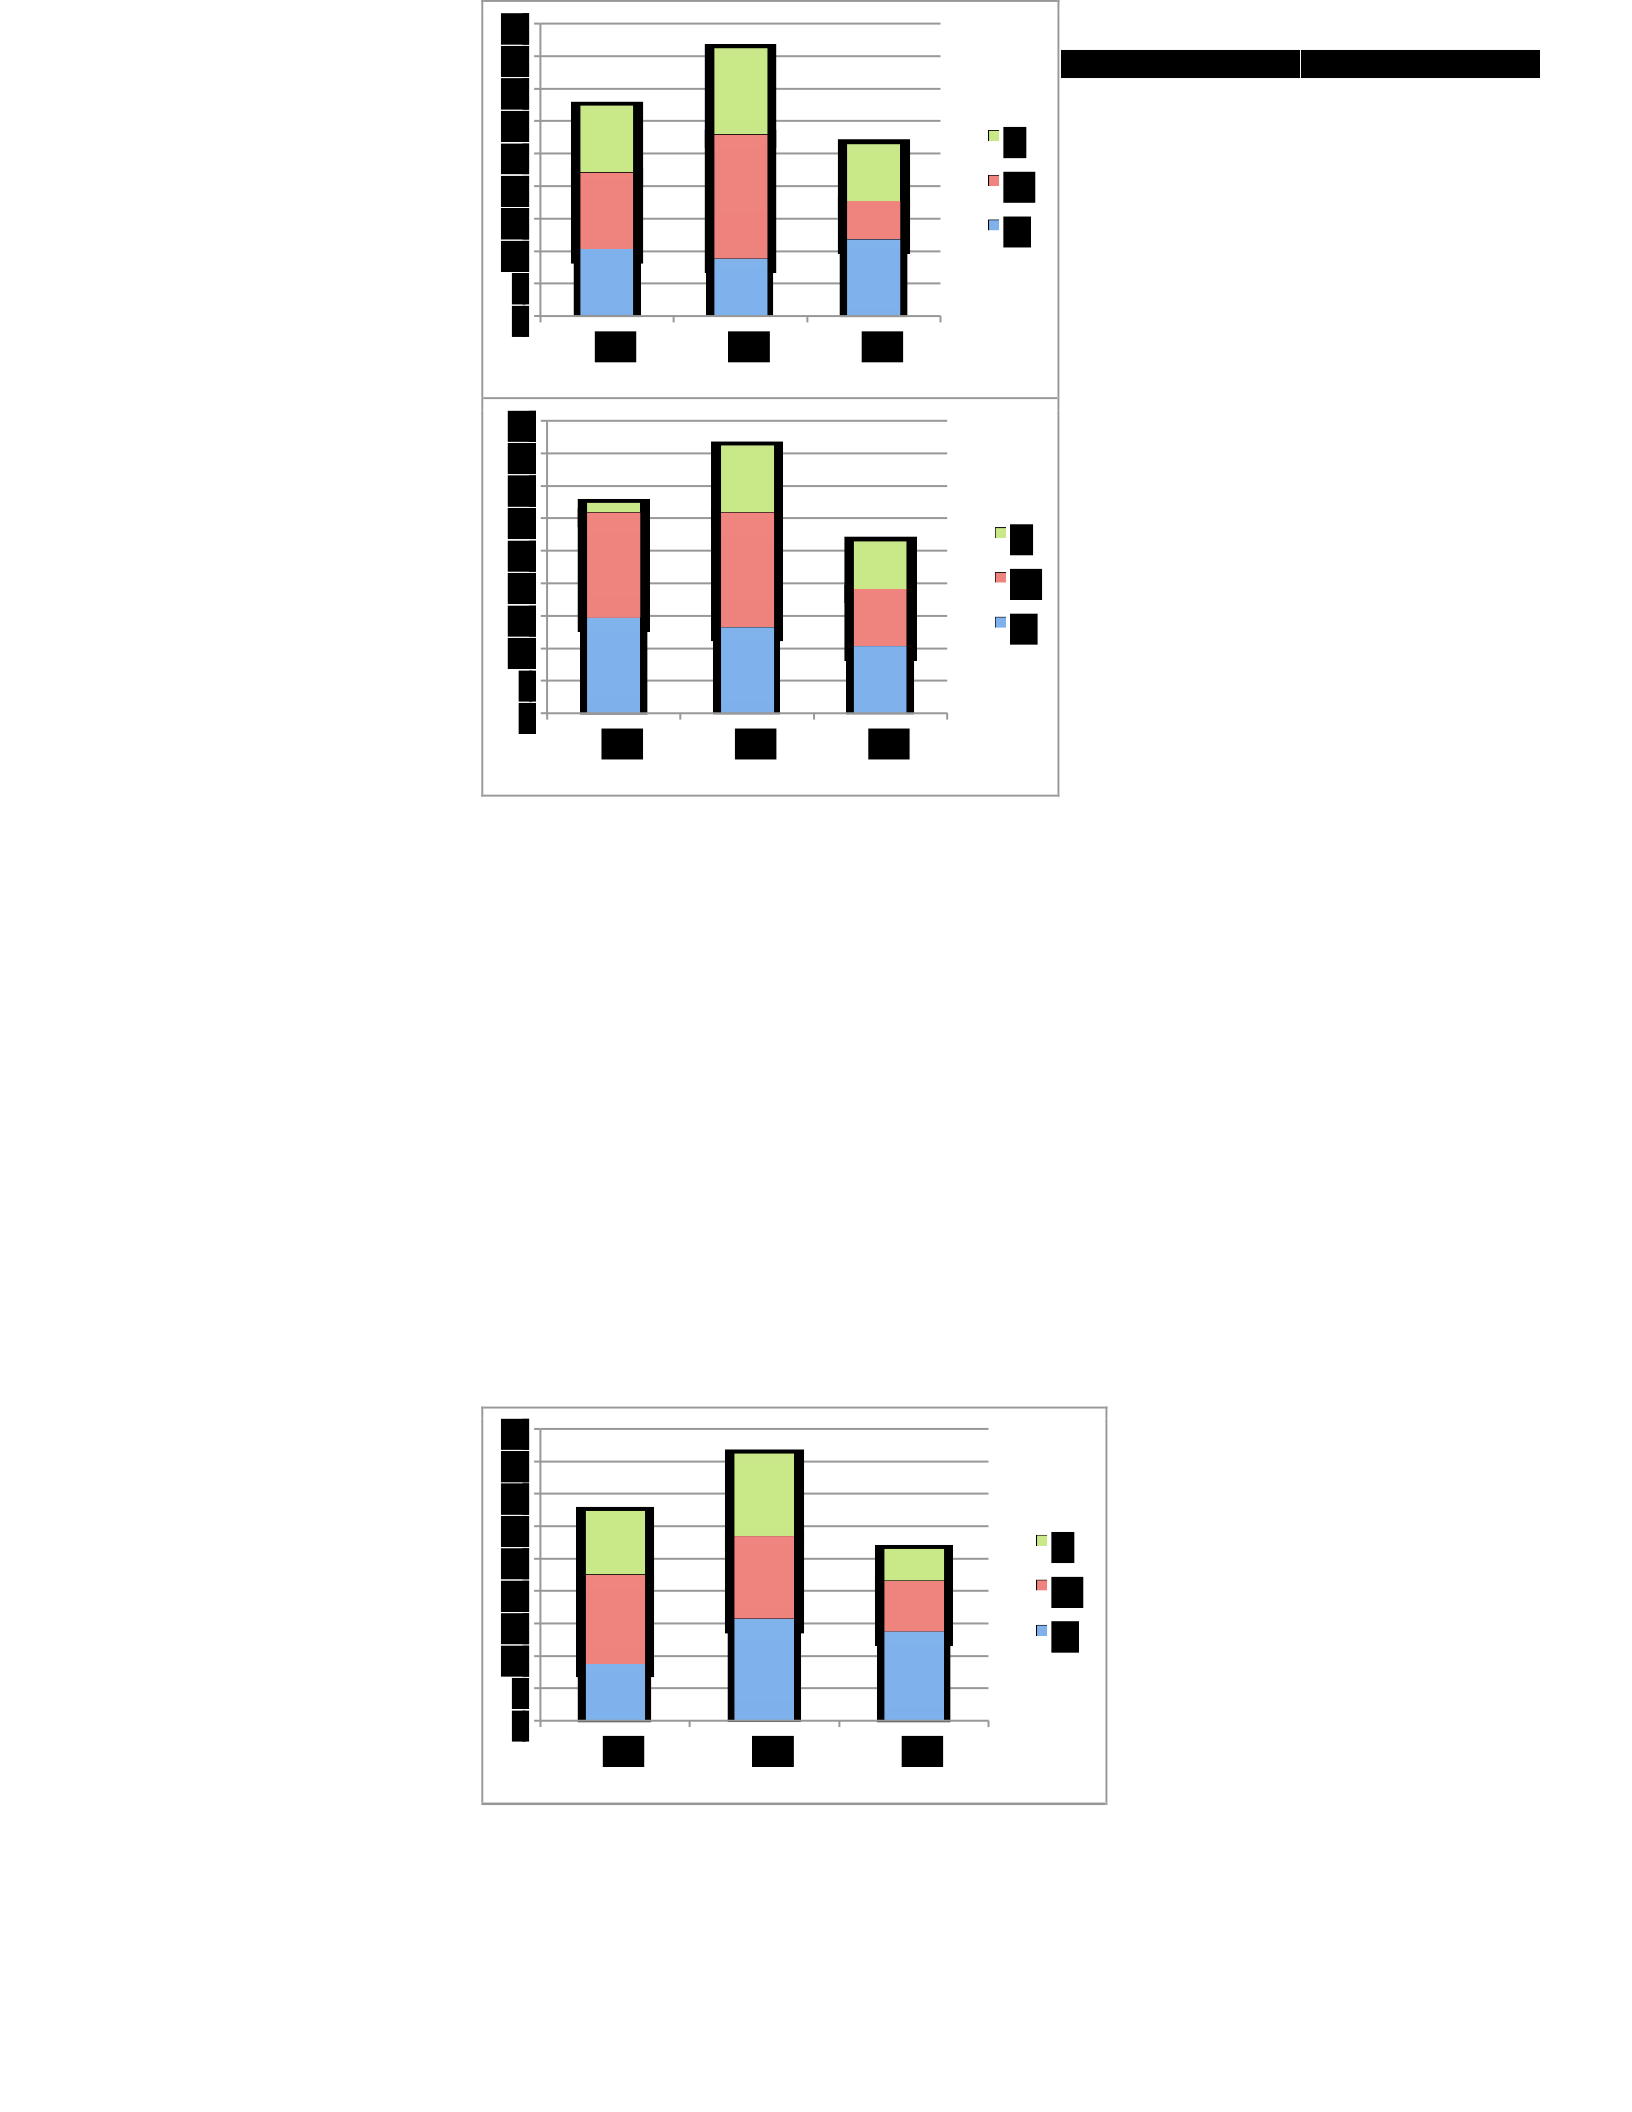
Figure 5.32: How the five
main policy themes of the Crown Confections security policy
were perceived by participants with more than 5 years
of experience (before and after the breach).
To summarize, individuals who work for
organizations that have level 5 information
security policy, except who had more than 5 years of
experience, believed that the policy process was the
most important aspect that should be taken into
consideration when developing or updating
security policy. However, their perception
was not stable. It was affected by the security
incidents they have faced.
• SSE-CMM Level Four
Pre-breach
Post-breach
Pre-breach
0
5
10
15
20
25
30
35
40
45
G1
G2
G3
L
M
H
0
5
10
15
20
25
30
35
40
45
G1
G2
G3
L
M
H
0
5
10
15
20
25
30
35
40
45
G1
G2
G3
L
M
H
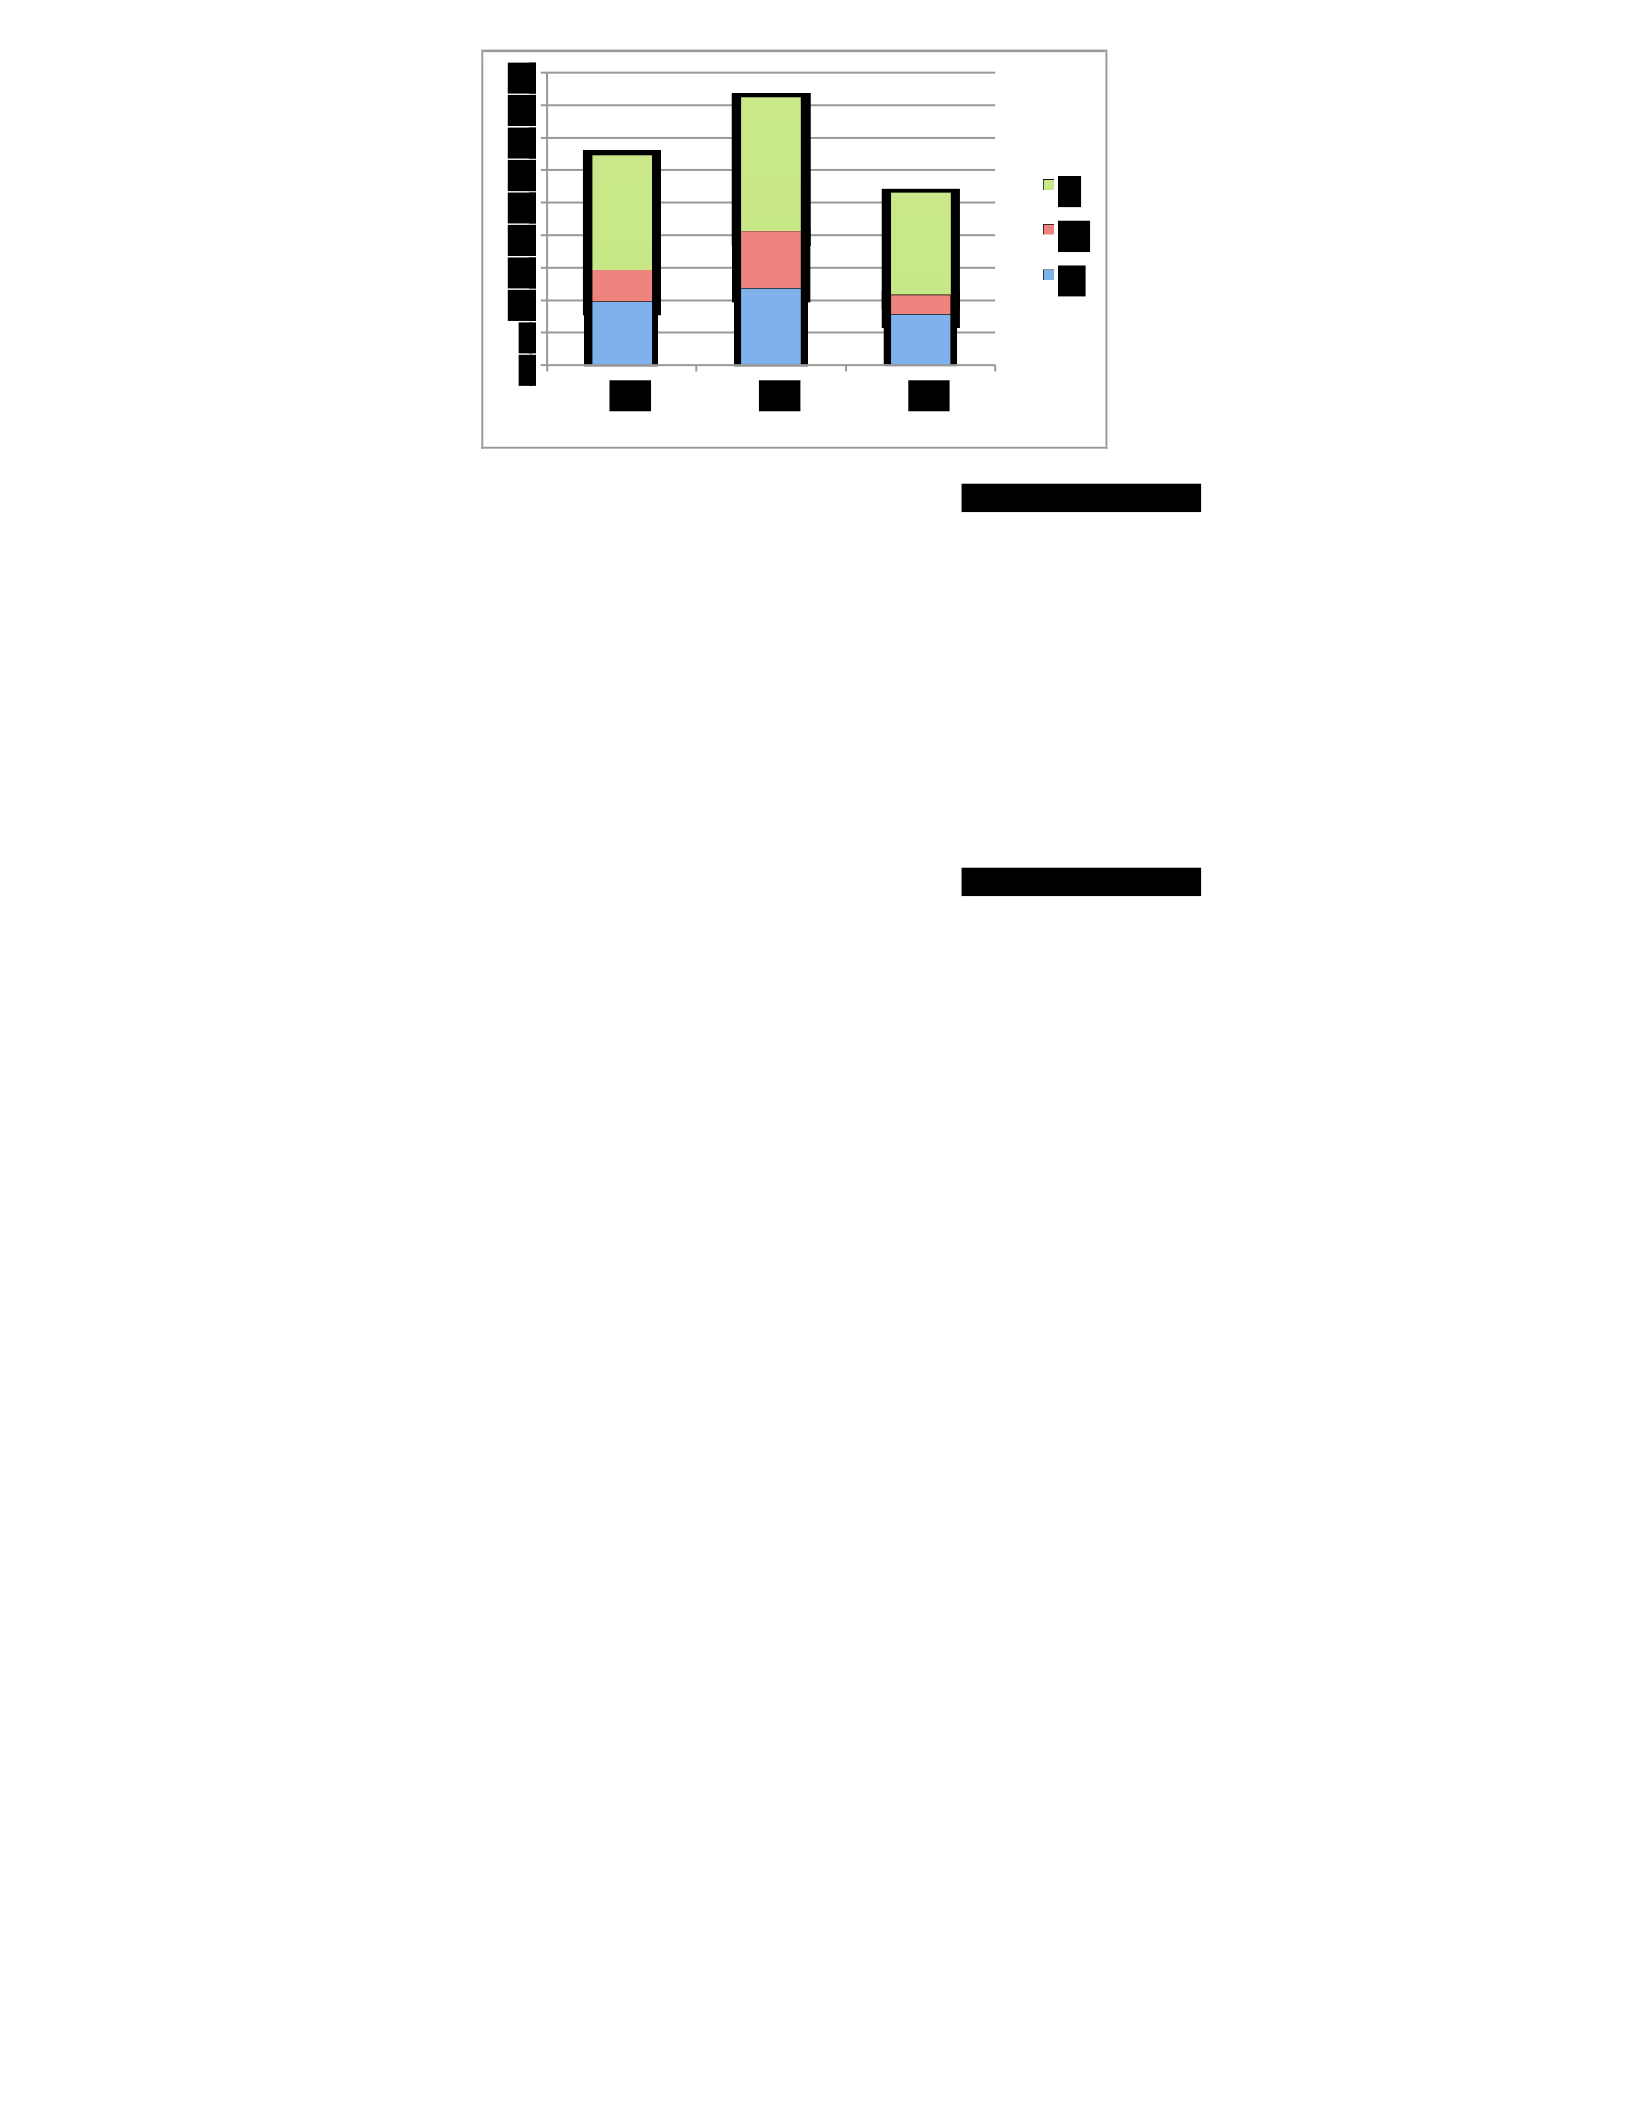
The participants of this group were
categorized into three groups based on their
experience: participants who had less
than 2 years of experience, participants
who had between 2 and 5 years of experience
and participants who had more than 5 years of
experience. Figure 5.33 shows how did the participants who had less
than 2 years of experience perceived the five policy themes of the Crown Confections security
policy before and after the occurrence of the security breach.
Figure 5.33: How the five main policy themes of the Crown Confections security policy were perceived by
participants who have less than 2 years of experience (before and after the breach).
Figure 5.33 illustrates how the participants who had less than 2 years of experience perceived the
security policy before the occurrence of the breach and how their perception changed after the
breach. The charts show that this group perceived the constructs related to security policy process
Post-breach
0
5
10
15
20
25
30
35
40
45
G1
G2
G3
L
M
H

as the most significant security policy perceptions. Their perception after the breach was consistent
with their perception before introducing the security breach. The next most significant perception
before the breach was policy content, whereas the next most significant perception after the breach
was policy form. Also, the percentage of the constructs that were rated as “high,” “medium,” or
“low” changed after introducing the breach. For example, before the breach the percentage of the
constructs that were rated as “high” in the G1 group was 8.8%, in the G2 group was 15.7% and in
the G3 group was 13.7%. These percentages changed after the occurrence of the breach to 9.8%
in the G1 group, 11.8% in the G2 group and 7.8% in the G3 group.
Different results were drawn from the level 4 participants who had between 2 and 5 years of
experience as it appears in figure 5.34. The perception of this group regarding the security policy
before and after the breach was different. Before the breach, this group believed that the most
important security policy perceptions were those related to security policy process and those
related to security policy content. After the breach, however, this group believed that the most
important security policy perceptions were those related to security policy process followed by
those related to security policy form. Also, the number of the constructs that got “high,” “medium,”
or “low” importance level in their ratings changed after introducing the breach (refer to figure
5.34). For example, the percentage of the constructs that were rated as highly important in the G2
group was 11% before the breach and 14.7% after the breach.
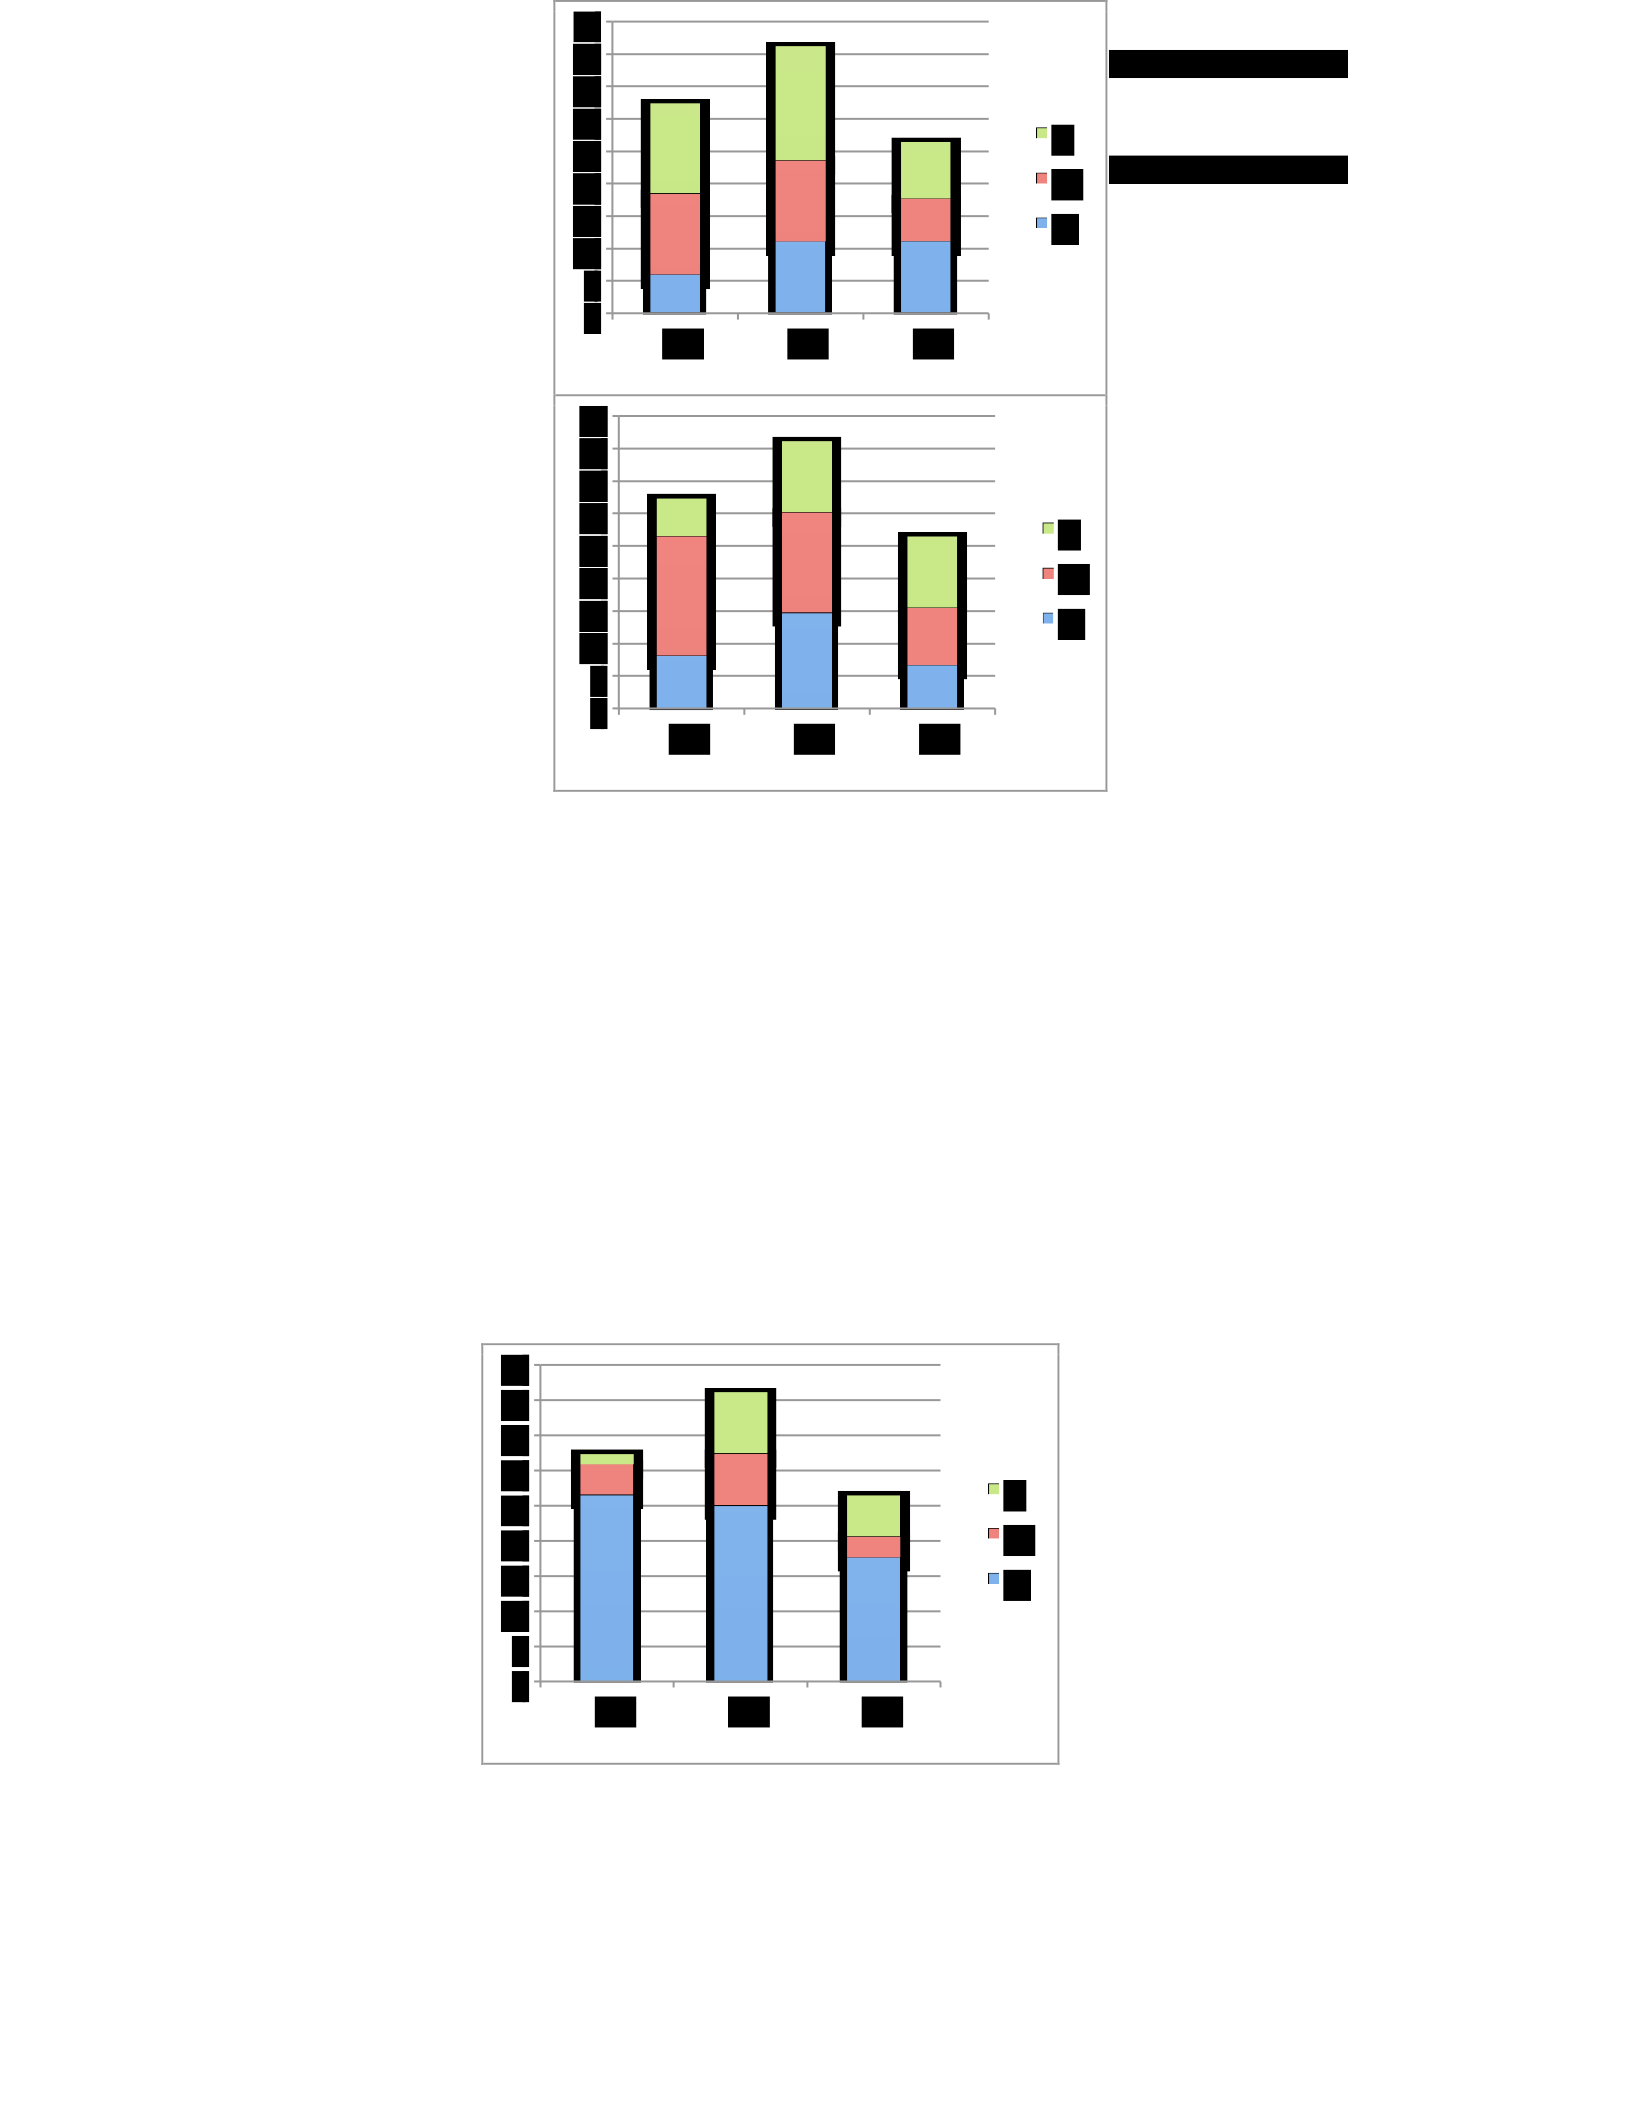
Figure 5.34: How the five main policy themes of the Crown
Confections security policy were perceived by participants with
between 2 and 5 years of experience (before and after
the breach).
Lastly, the level 4 participants who had
more than 5 years of experience held same
perceptions regarding which group was the most
influential group before and after the breach. They
perceived that the most important security policy
perceptions were those related to security policy
form. Here the difference was in the next significant security perception. Before the breach, the
next important security policy perceptions were those related to the policy process. On the other
hand, the next important security policy perceptions after the breach were those related to policy
process and content. Also, the number of the constructs that rated as “high,” “medium,” or “low”
changed after introducing the breach (refer to figure 5.35). For example, the percentage of the
constructs that were rated as highly important in the G3 group was 17.7% before the breach and
10.3% after the breach.
Pre-breach
Post-breach
Pre-breach
0
5
10
15
20
25
30
35
40
45
G1
G2
G3
L
M
H
0
5
10
15
20
25
30
35
40
45
G1
G2
G3
L
M
H
0
5
10
15
20
25
30
35
40
45
G1
G2
G3
L
M
H
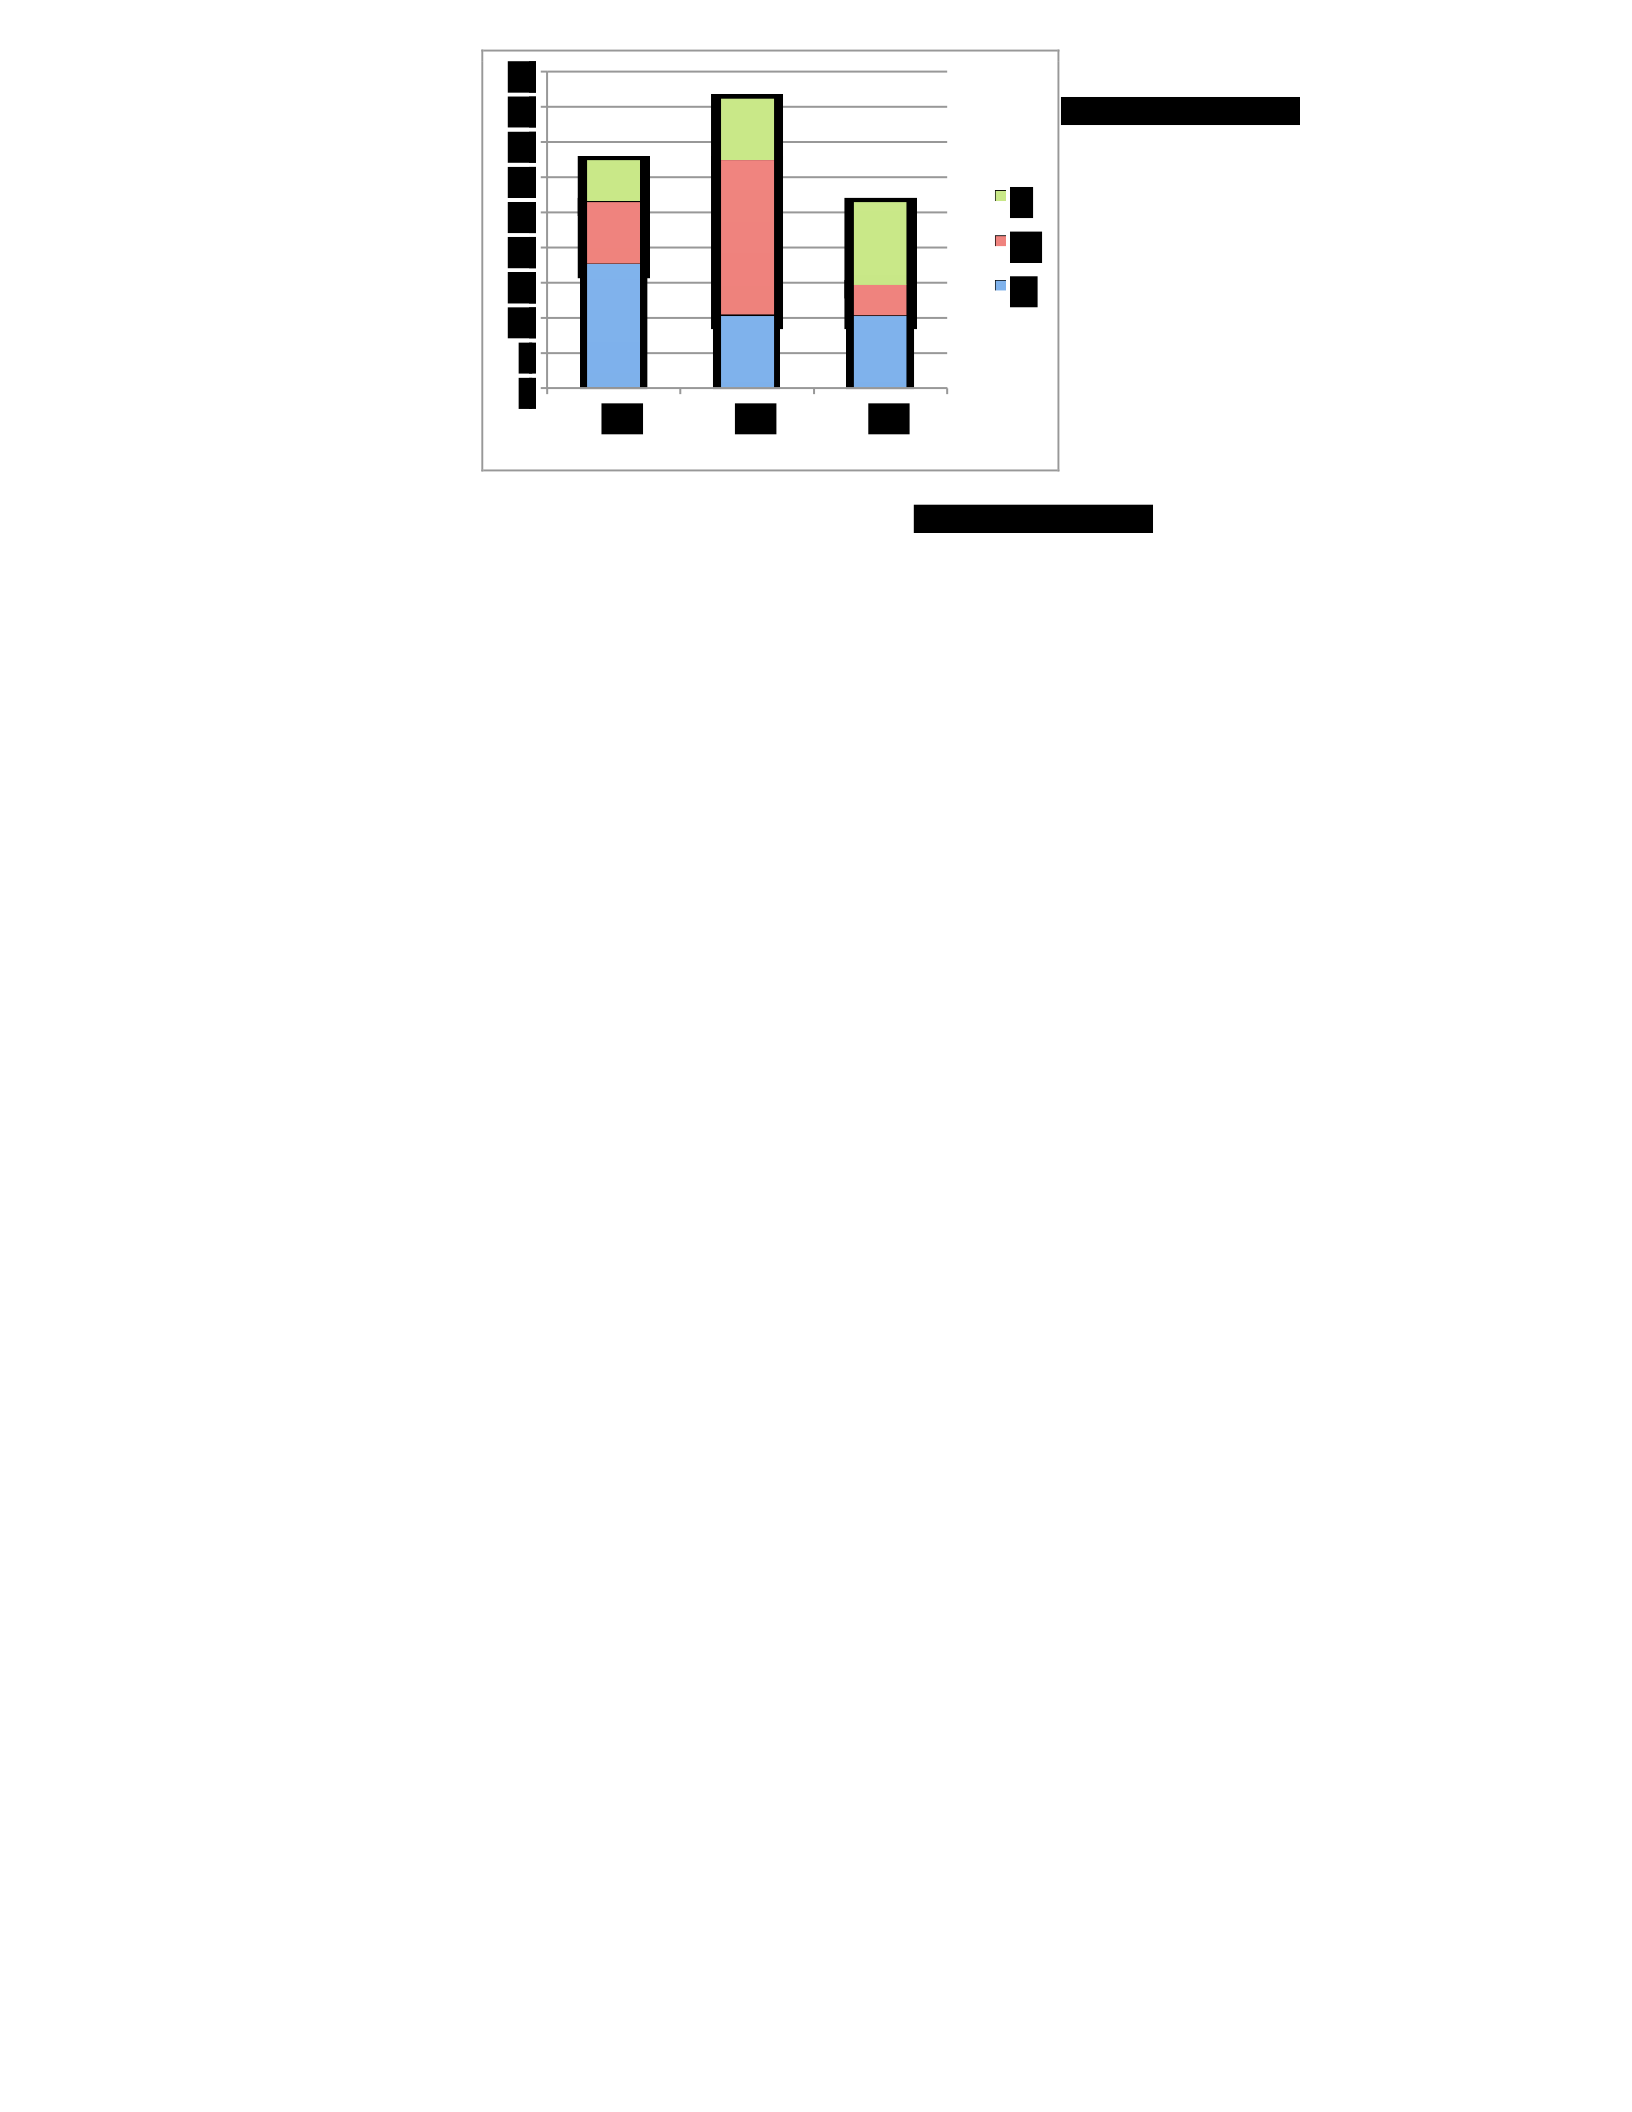
Figure 5.35: How the five main policy themes of the Crown Confections security policy were perceived by
participants who have more than 5 years of experience (before and after the breach).
To conclude, from the analysis above we can see that individuals who work for organizations that
have level 4 information security policy and had higher experience (more than 5 years) had
different perception regarding security policy from individuals who had less experience.
Individuals who had less experience believed that the policy process was the most important aspect
that should be taken into consideration when developing or updating security policy.
However, their perception could change in response to any security incident they may face.
• SSE-CMM Level Three
Post-breach
0
5
10
15
20
25
30
35
40
45
G1
G2
G3
L
M
H
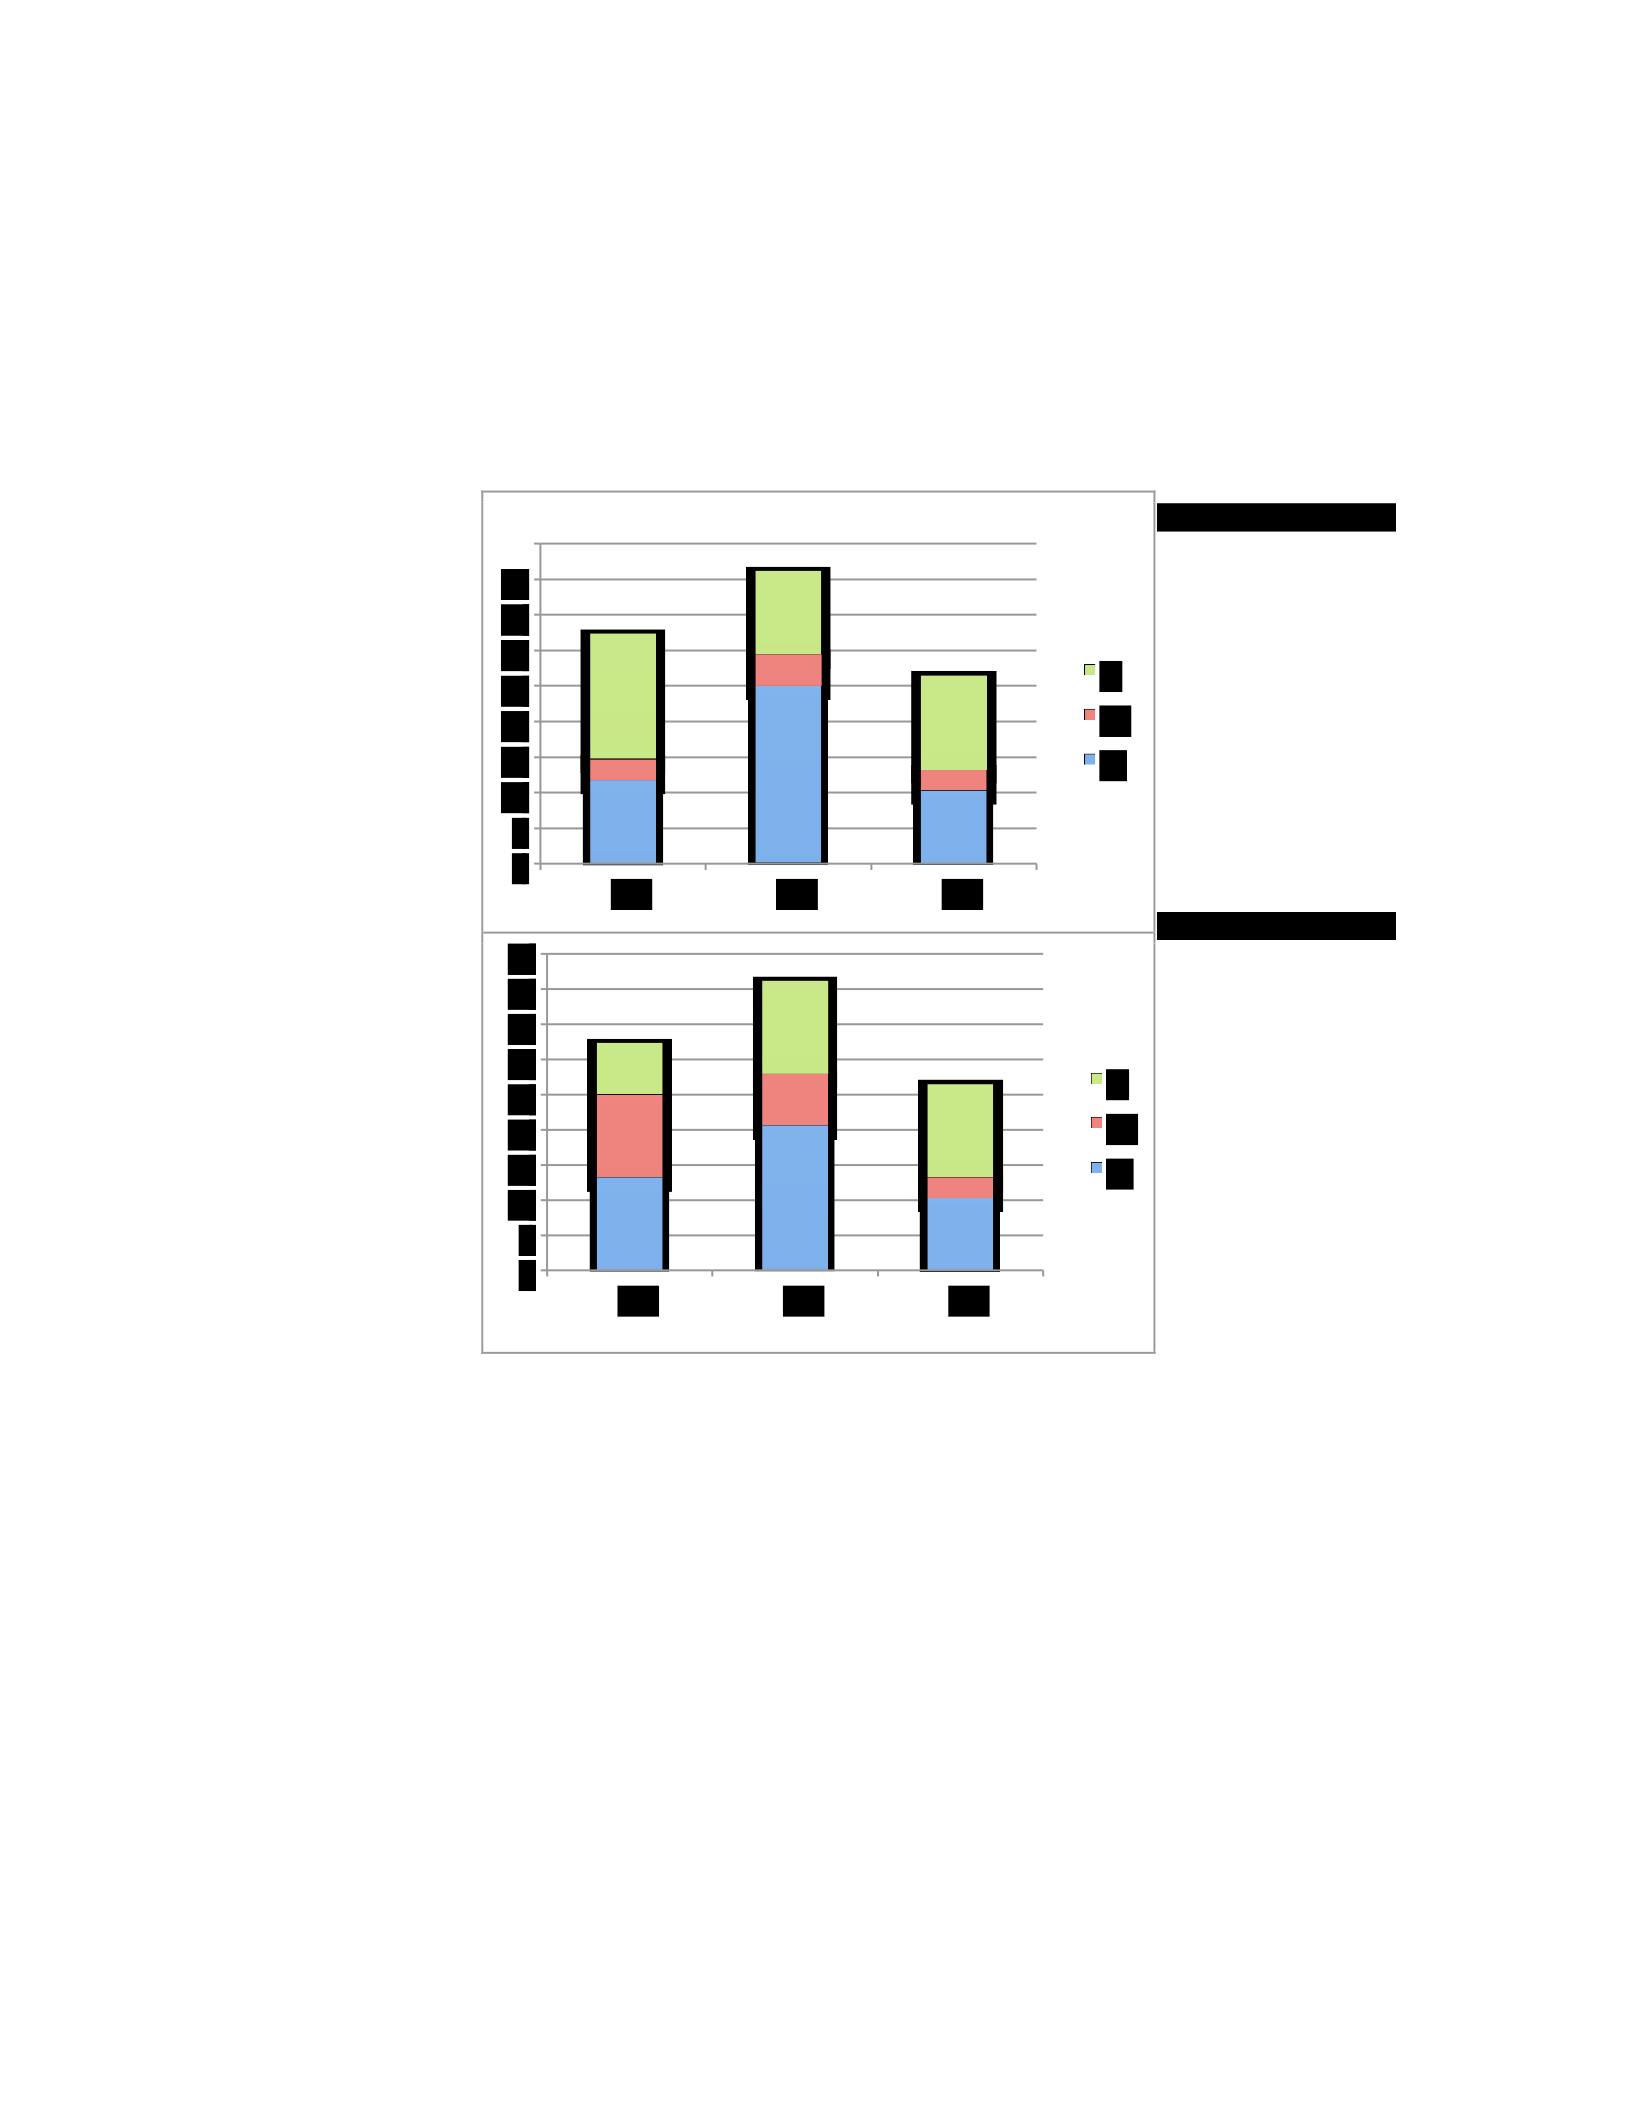
The participants of this group were grouped into three groups; participants who had less than 2
years of experience, participants who had between 2 to 5 years of experience and participants who
had more than 5 years of experience. Figure 5.36 shows how did participants who had less than 2
years of experience perceived the security policy before and after the occurrence of the security
breach.
Figure 5.36: How the five main policy themes of the Crown Confections security policy were perceived by
participants who have less than 2 years of experience (before and after the breach).
The charts show that, before and after the introduction of the security breach, the participants who
had less than 2 years of experience perceived the constructs related to security policy process as
the most significant security policy perceptions followed by those related to security policy form.
The perception of this group regarding the security policy before and after the breach was very
similar. However, the percentage of the constructs that were considered as “high,” “medium,” or
45
Pre-breach
Post-breach
0
5
10
15
20
25
30
35
40
G1
G2
G3
L
M
H
0
5
10
15
20
25
30
35
40
45
G1
G2
G3
L
M
H

“low” important in each construct group changed after introducing the breach. For example, 25%
of the constructs that are related to the G2 group were considered as highly important before
introducing the breach. However, this percentage changed to 20.4% after the breach.
Similarly, results of the level 3 participants who had between 2 to 5 years of experience show that
they believed that the most important security policy perceptions were those related to security
policy process (as it is shown in figure 5.37). The perception of this group regarding the most
significant security policy perception before and after the breach was similar (refer to figure 4.37).
However, the different was in the next significant security policy perception. Before the breach,
this group perceived the constructs related to security policy form as the next significant policy
perception. Whereas after the breach, this group perceived the constructs related to security policy
content as the next significant policy perception. Also, the percentage of the constructs related to
each group that was considered as “high,” “medium,” or “low” important changed after
introducing the breach. As it appears in figure 5.37, the percentage of the constructs that were rated
as “high” in G2 changed from 20.6% before the breach to 17.7% after the breach.
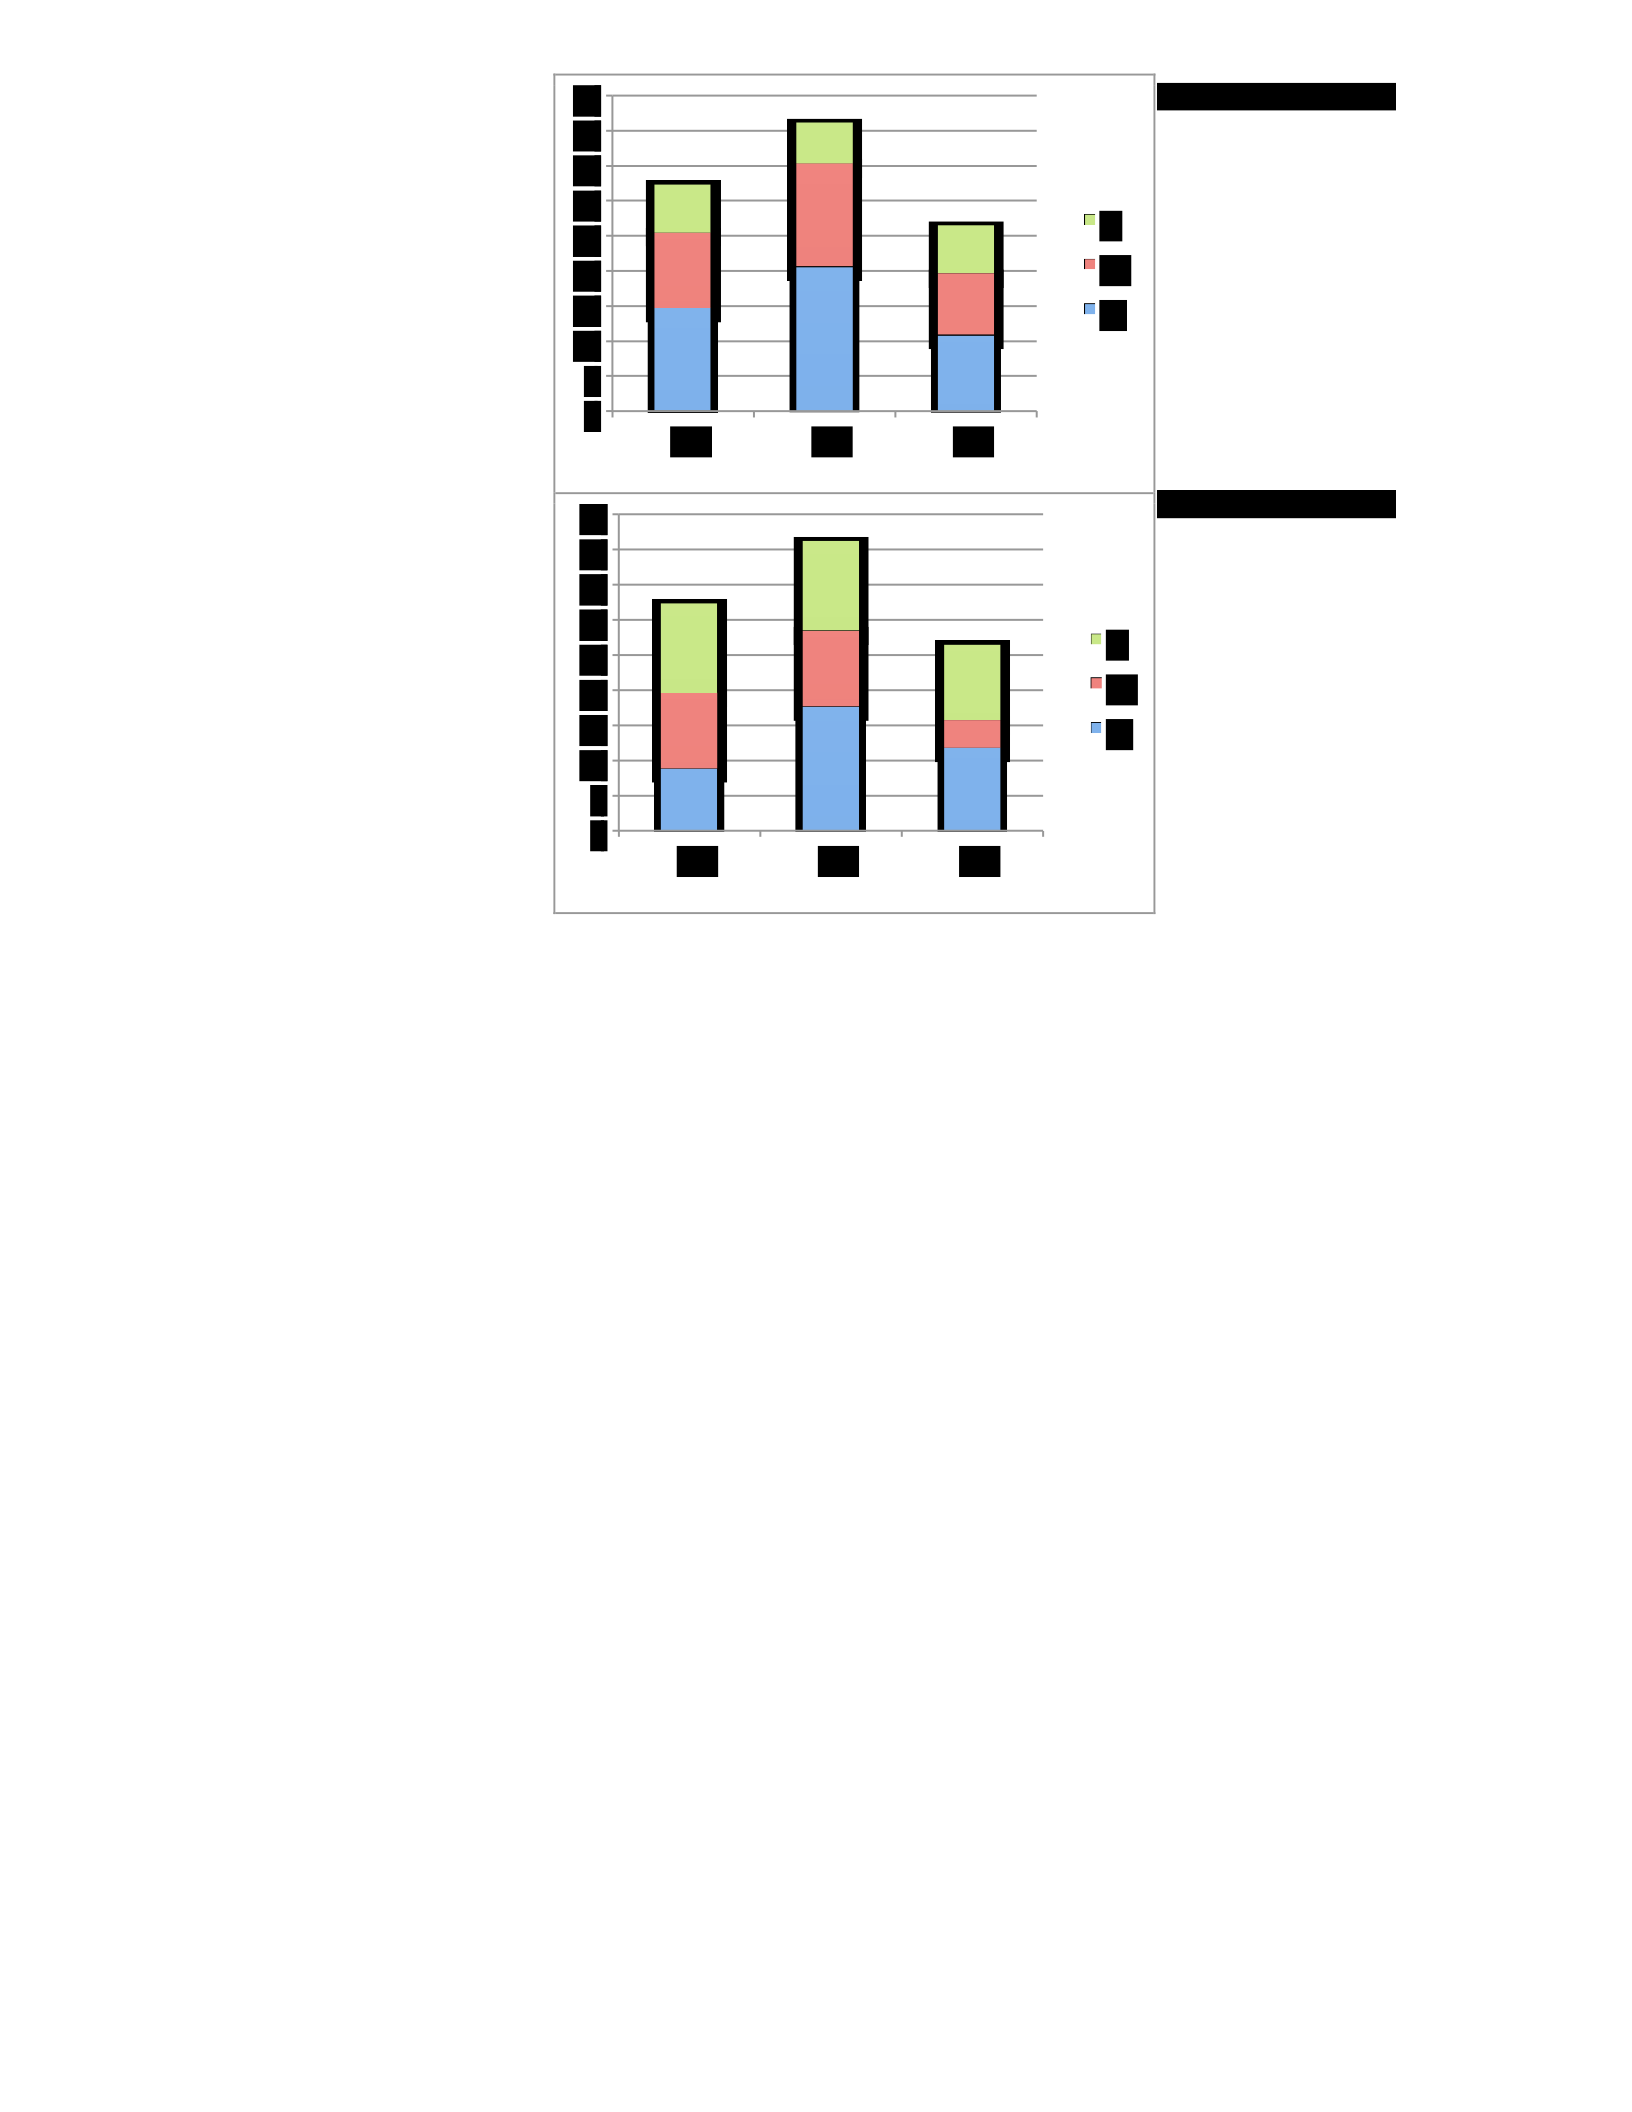
Figure 5.37: How the five main policy themes of the Crown Confections security policy were perceived by
participants with between 2 and 5 years of experience (before and after the breach).
Lastly, results of the level 3 participants who had more than 5 years of experience show that this
group perceives that the most significant security policy perceptions were those related to security
policy process followed by those related to security form. The change in their perceptions could
appear from the change in the percentage of the constructs that was rated as “high,” “medium,” or
“low” in each group and how this percentage changed after introducing the breach. For example,
the percentage of the constructs that was rated as “high” in the G1, G2, and G3 groups changed
from 24.1%, 32.4% and 14.7% to 17.1%, 22.9% and 10.6%, respectively.
Pre-breach
Post-breach
0
5
10
15
20
25
30
35
40
45
G1
G2
G3
L
M
H
0
5
10
15
20
25
30
35
40
45
G1
G2
G3
L
M
H
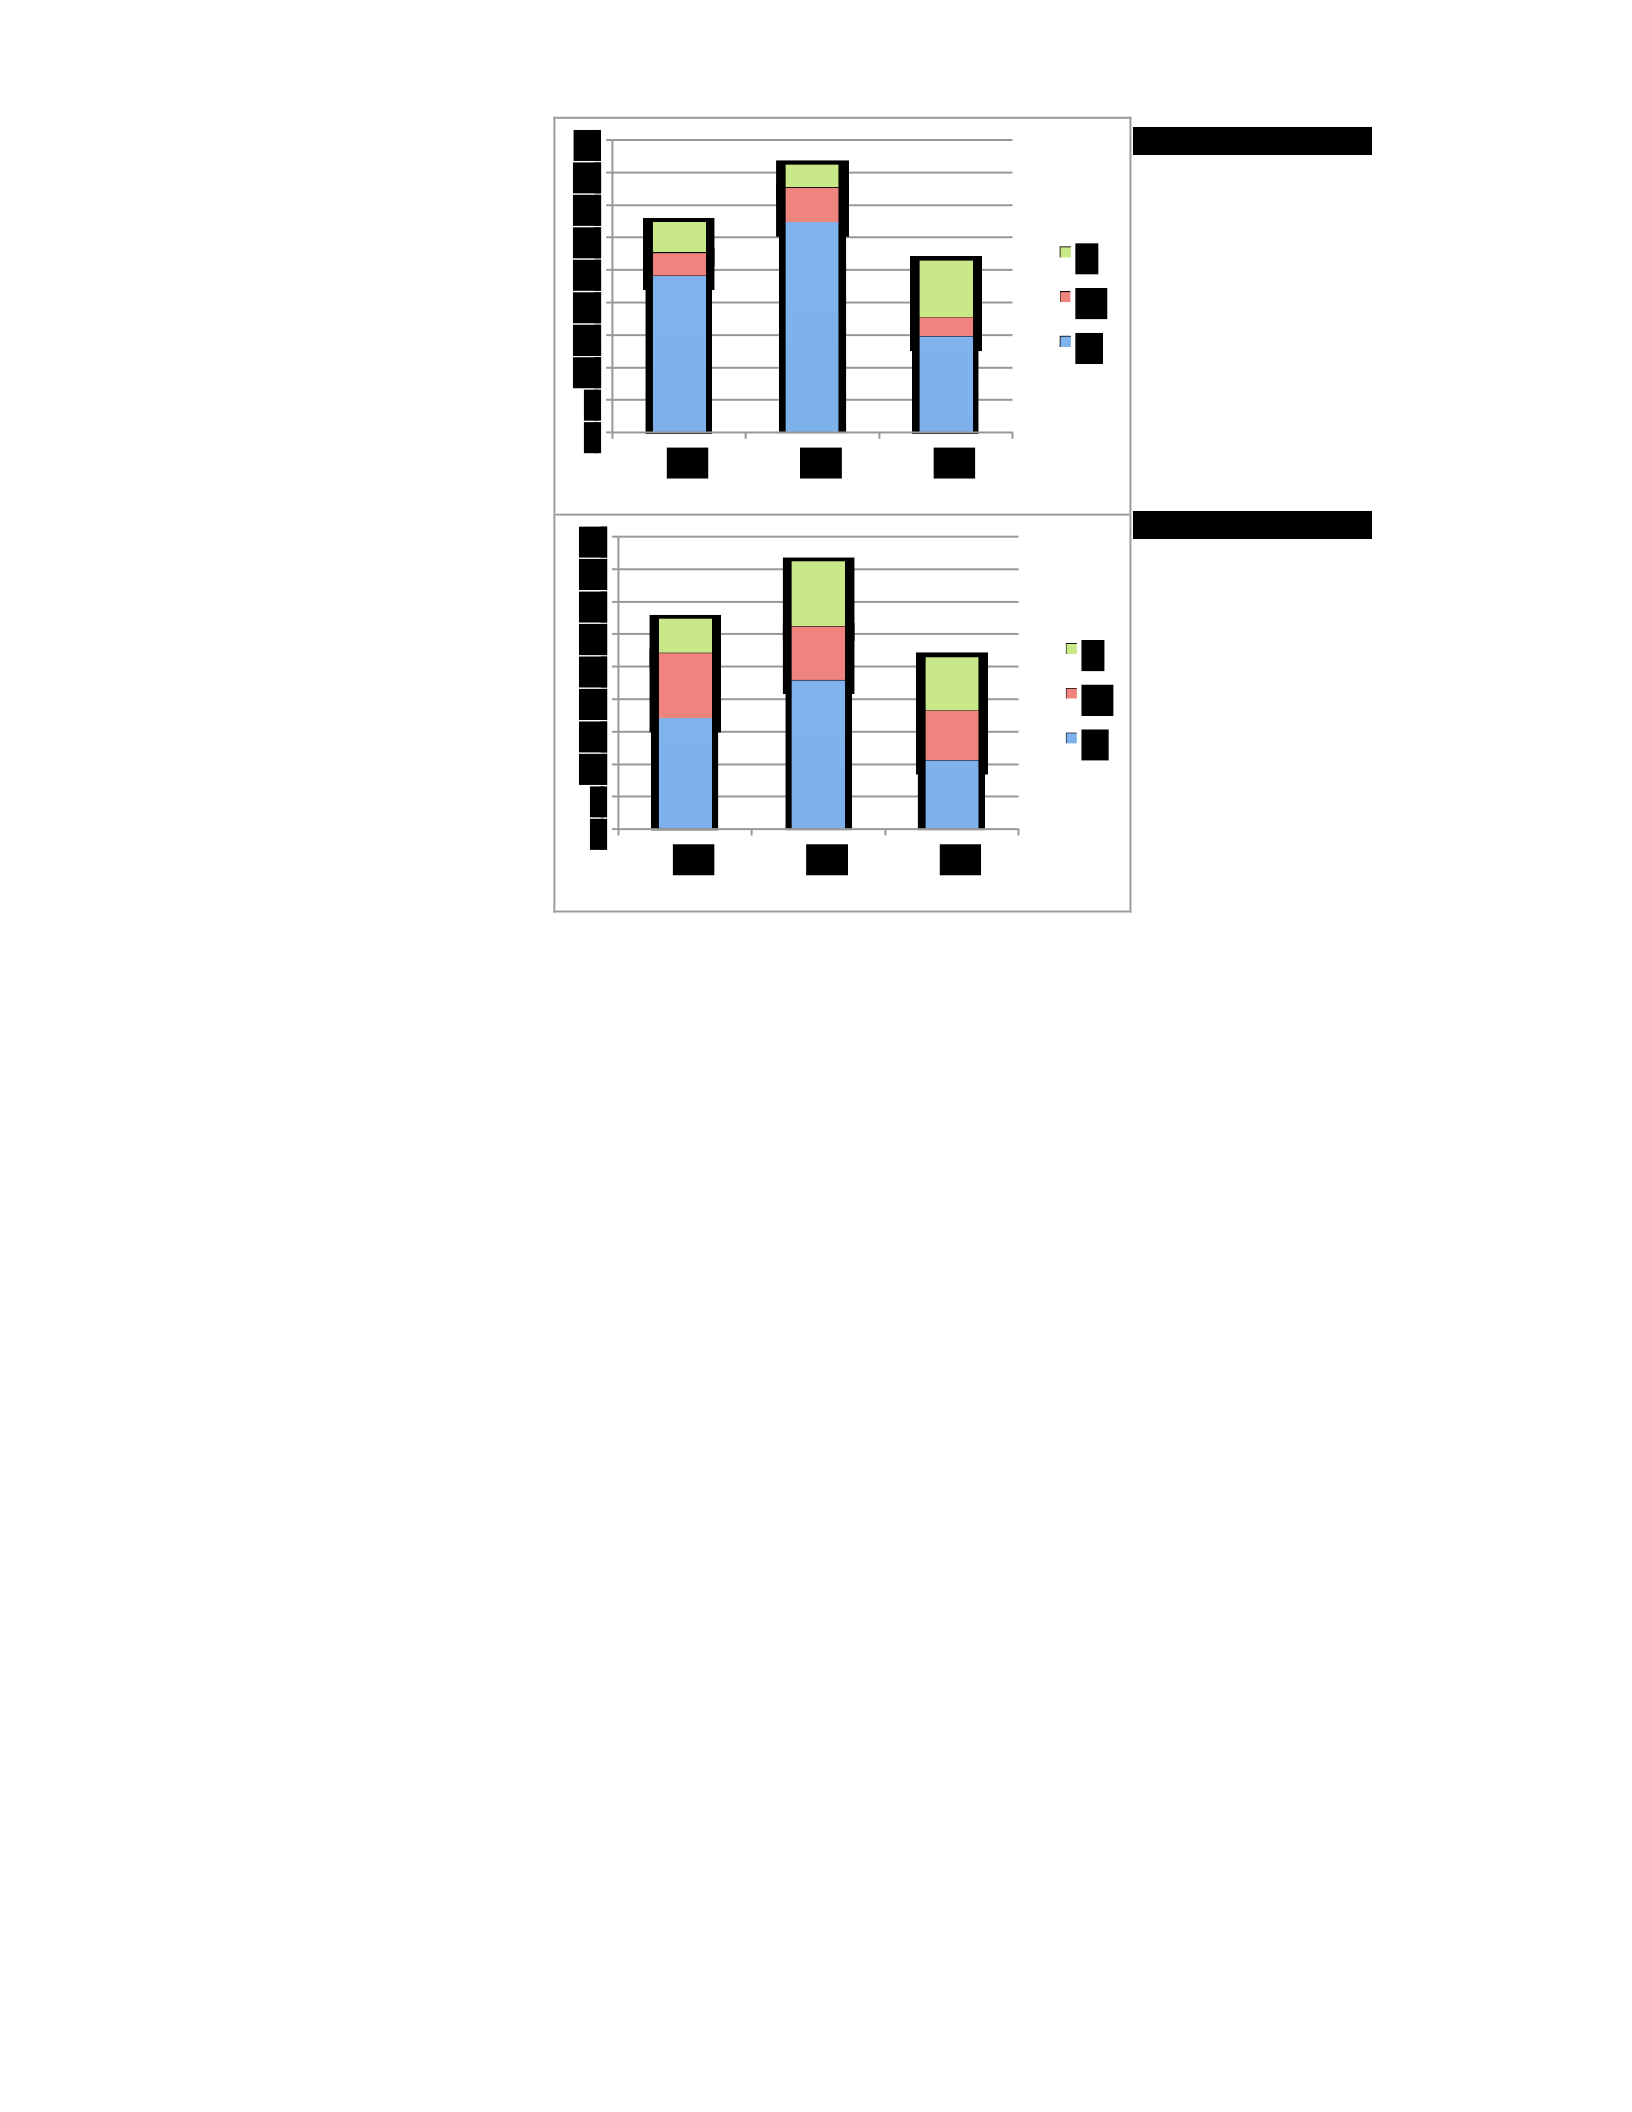
Figure 5.38: How the five main policy themes of the Crown Confections security policy were perceived by
participants with more than 5 years of experience (before and after the breach).
From the analysis above, we can see that the individuals who work for organizations that had level
3 information security policy believed that the policy form was the most important aspect that
should be taken into consideration when developing or updating security policy. However, their
perception was not stable. It was affected by the security incidents they have encountered.
• SSE-CMM Level Two
The participants of this group were grouped into three groups; participants who had less than 2
years of experience, participants who had between 2 to 5 years of experience and participants who
had more than 5 years of experience.
Pre-breach
Post-breach
0
5
10
15
20
25
30
35
40
45
G1
G2
G3
L
M
H
0
5
10
15
20
25
30
35
40
45
G1
G2
G3
L
M
H
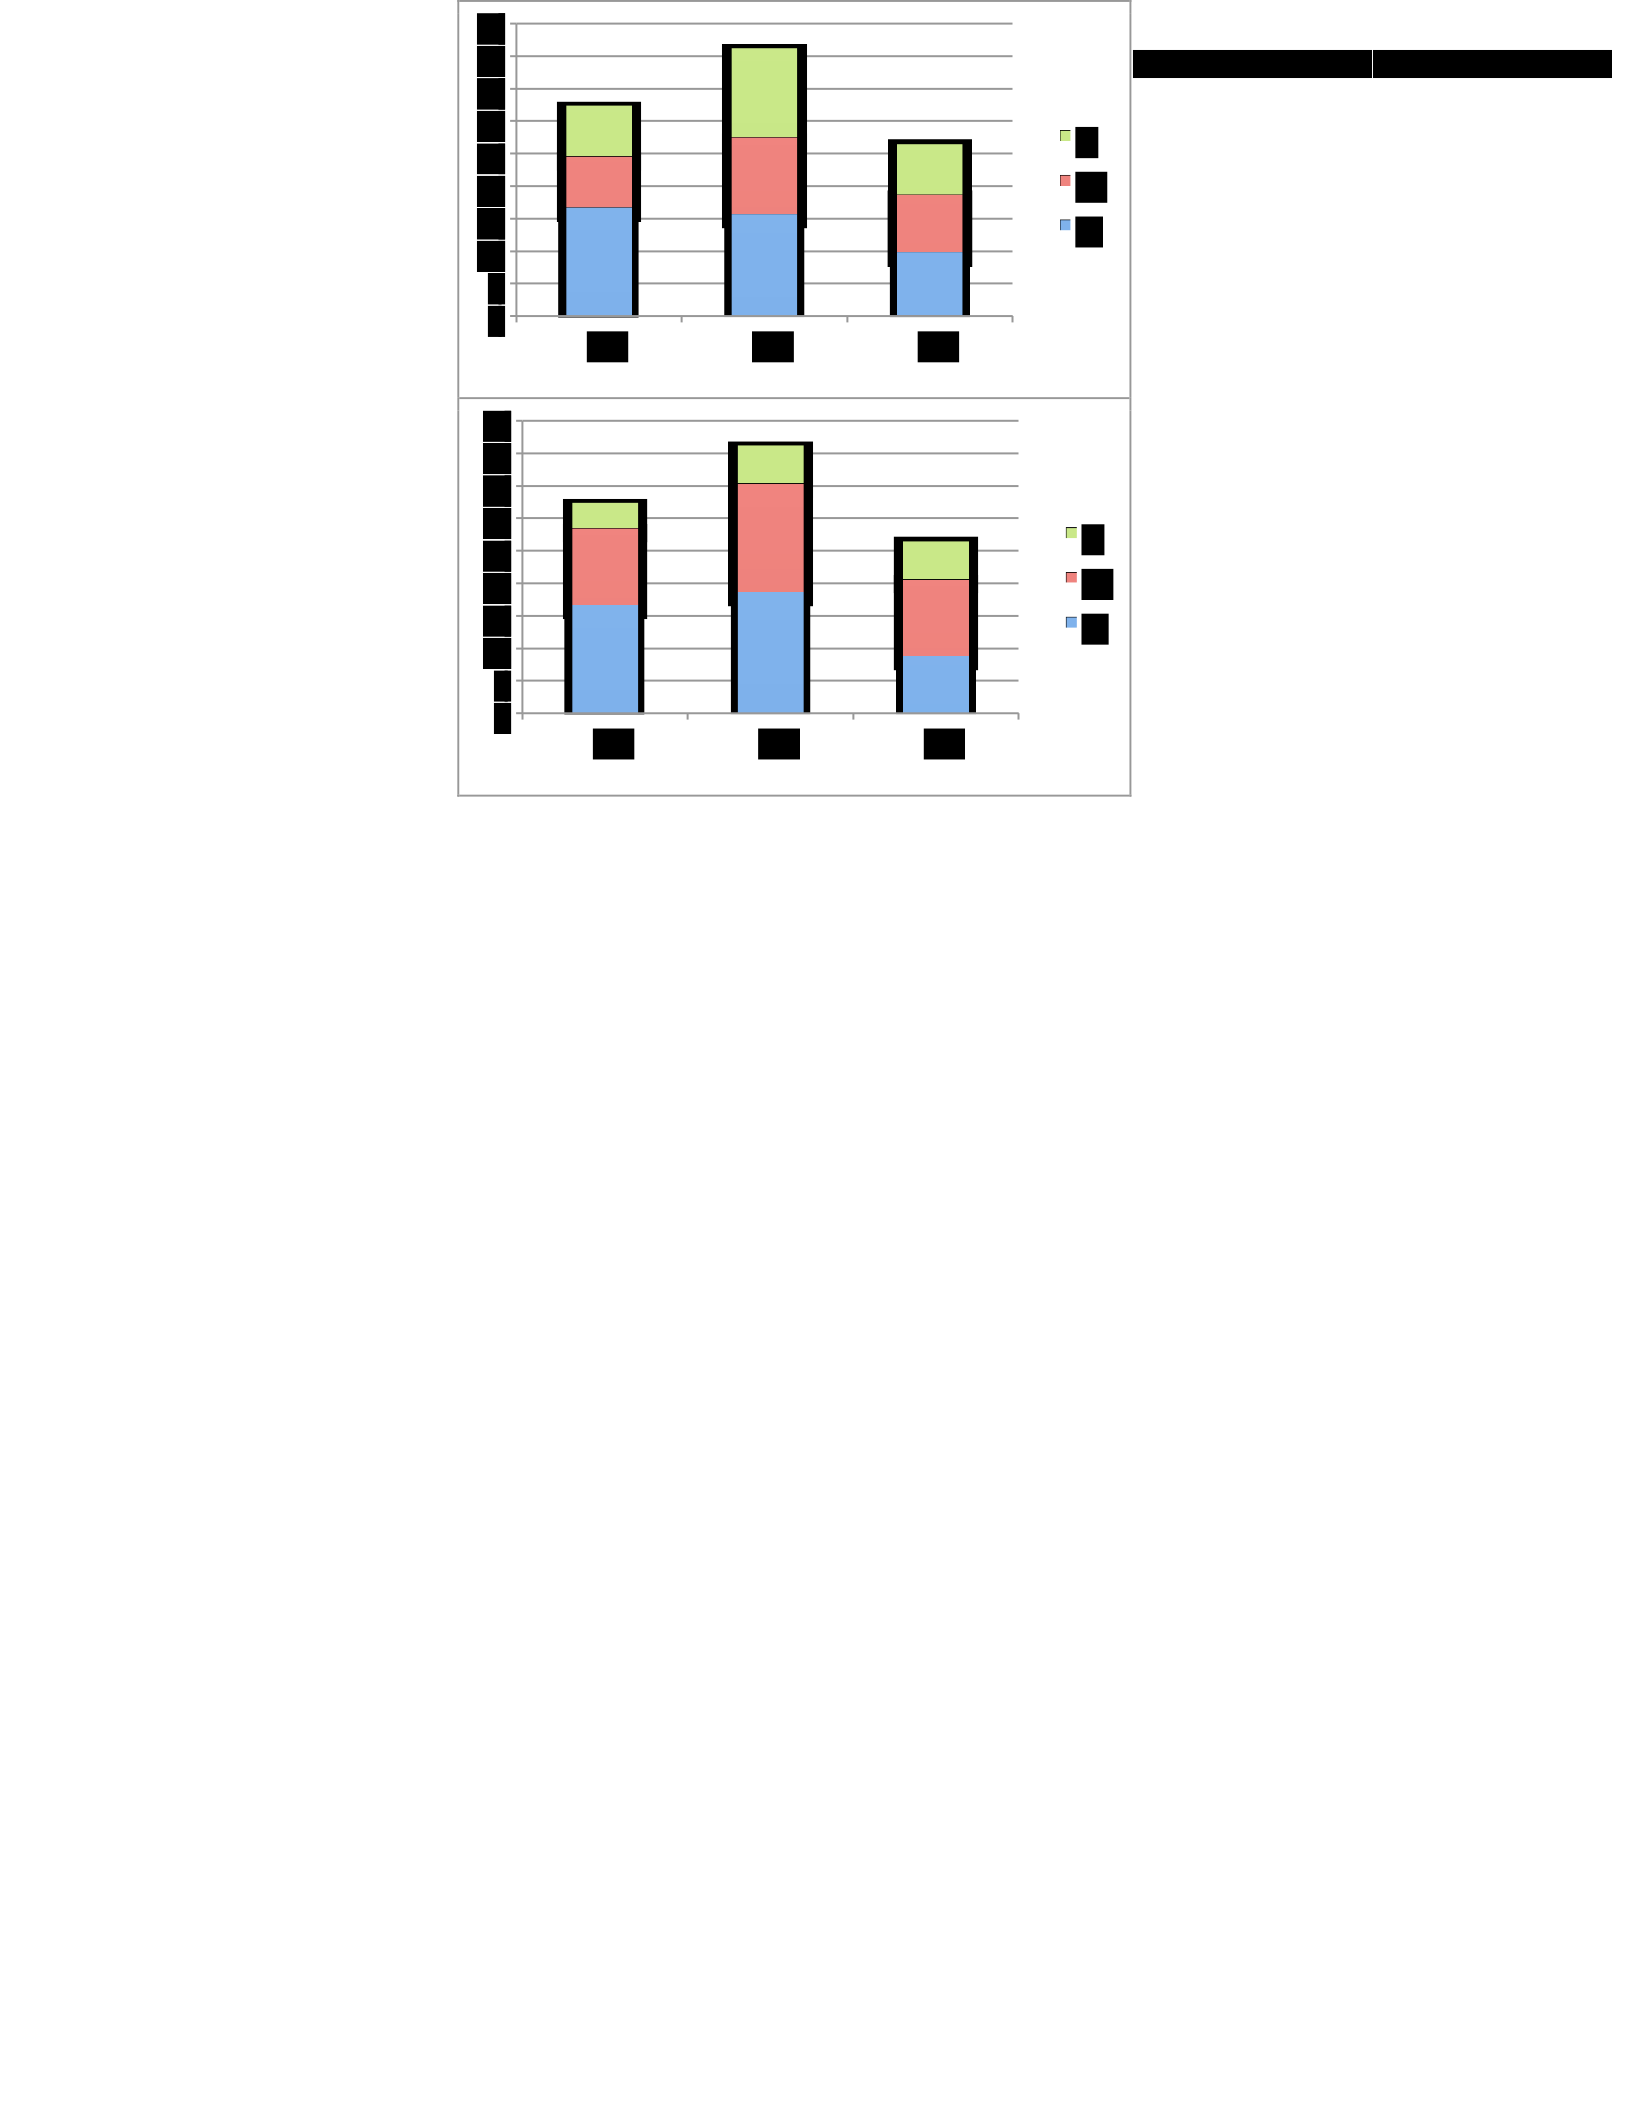
Figure 5.39: How
the five main policy themes of
the Crown Confections security
policy were perceived by
participants who have less
than 2 years of experience (before
and after the breach).
Figure 5.39 shows how participants who
had less than 2 years of experience perceived
the security policy before and after the
occurrence of the security breach. As it
can be drawn from the figure, the
participants in this group perceived that the
constructs related to security policy form as the most influential group of the constructs followed
by those related to security policy process. Here, the perception of this group of the participants
regarding the security policy changed after the occurrence of the security breach. After the breach,
this group perceived the constructs related to security policy process to be the most influential
group of the constructs, followed by those related to security policy form. Also, the percentage of
the constructs related to each group that was considered as “high,” “medium,” or “low” significant
differed after introducing the breach. For example, 15.7% of the constructs that are related to the
G2 group were considered as highly important before introducing the breach. However, this
percentage changed to 18.6% after the breach.
Similarly, before the breach the level 2 participants with between 2 to 5 years of experience
perceived that the most important security policy perceptions were those related to security policy
form followed by those related to the policy process. After the breach, this group perceived the
constructs related to security policy process as the most important group of the constructs followed
by those related to security policy content. Also, the number of constructs that were rated as “high,”
“medium,” or “low” in all of the groups changed after the breach (refer to figure 5.40). For
Pre-breach
Post-breach
0
5
10
15
20
25
30
35
40
45
G1
G2
G3
L
M
H
0
5
10
15
20
25
30
35
40
45
G1
G2
G3
L
M
H
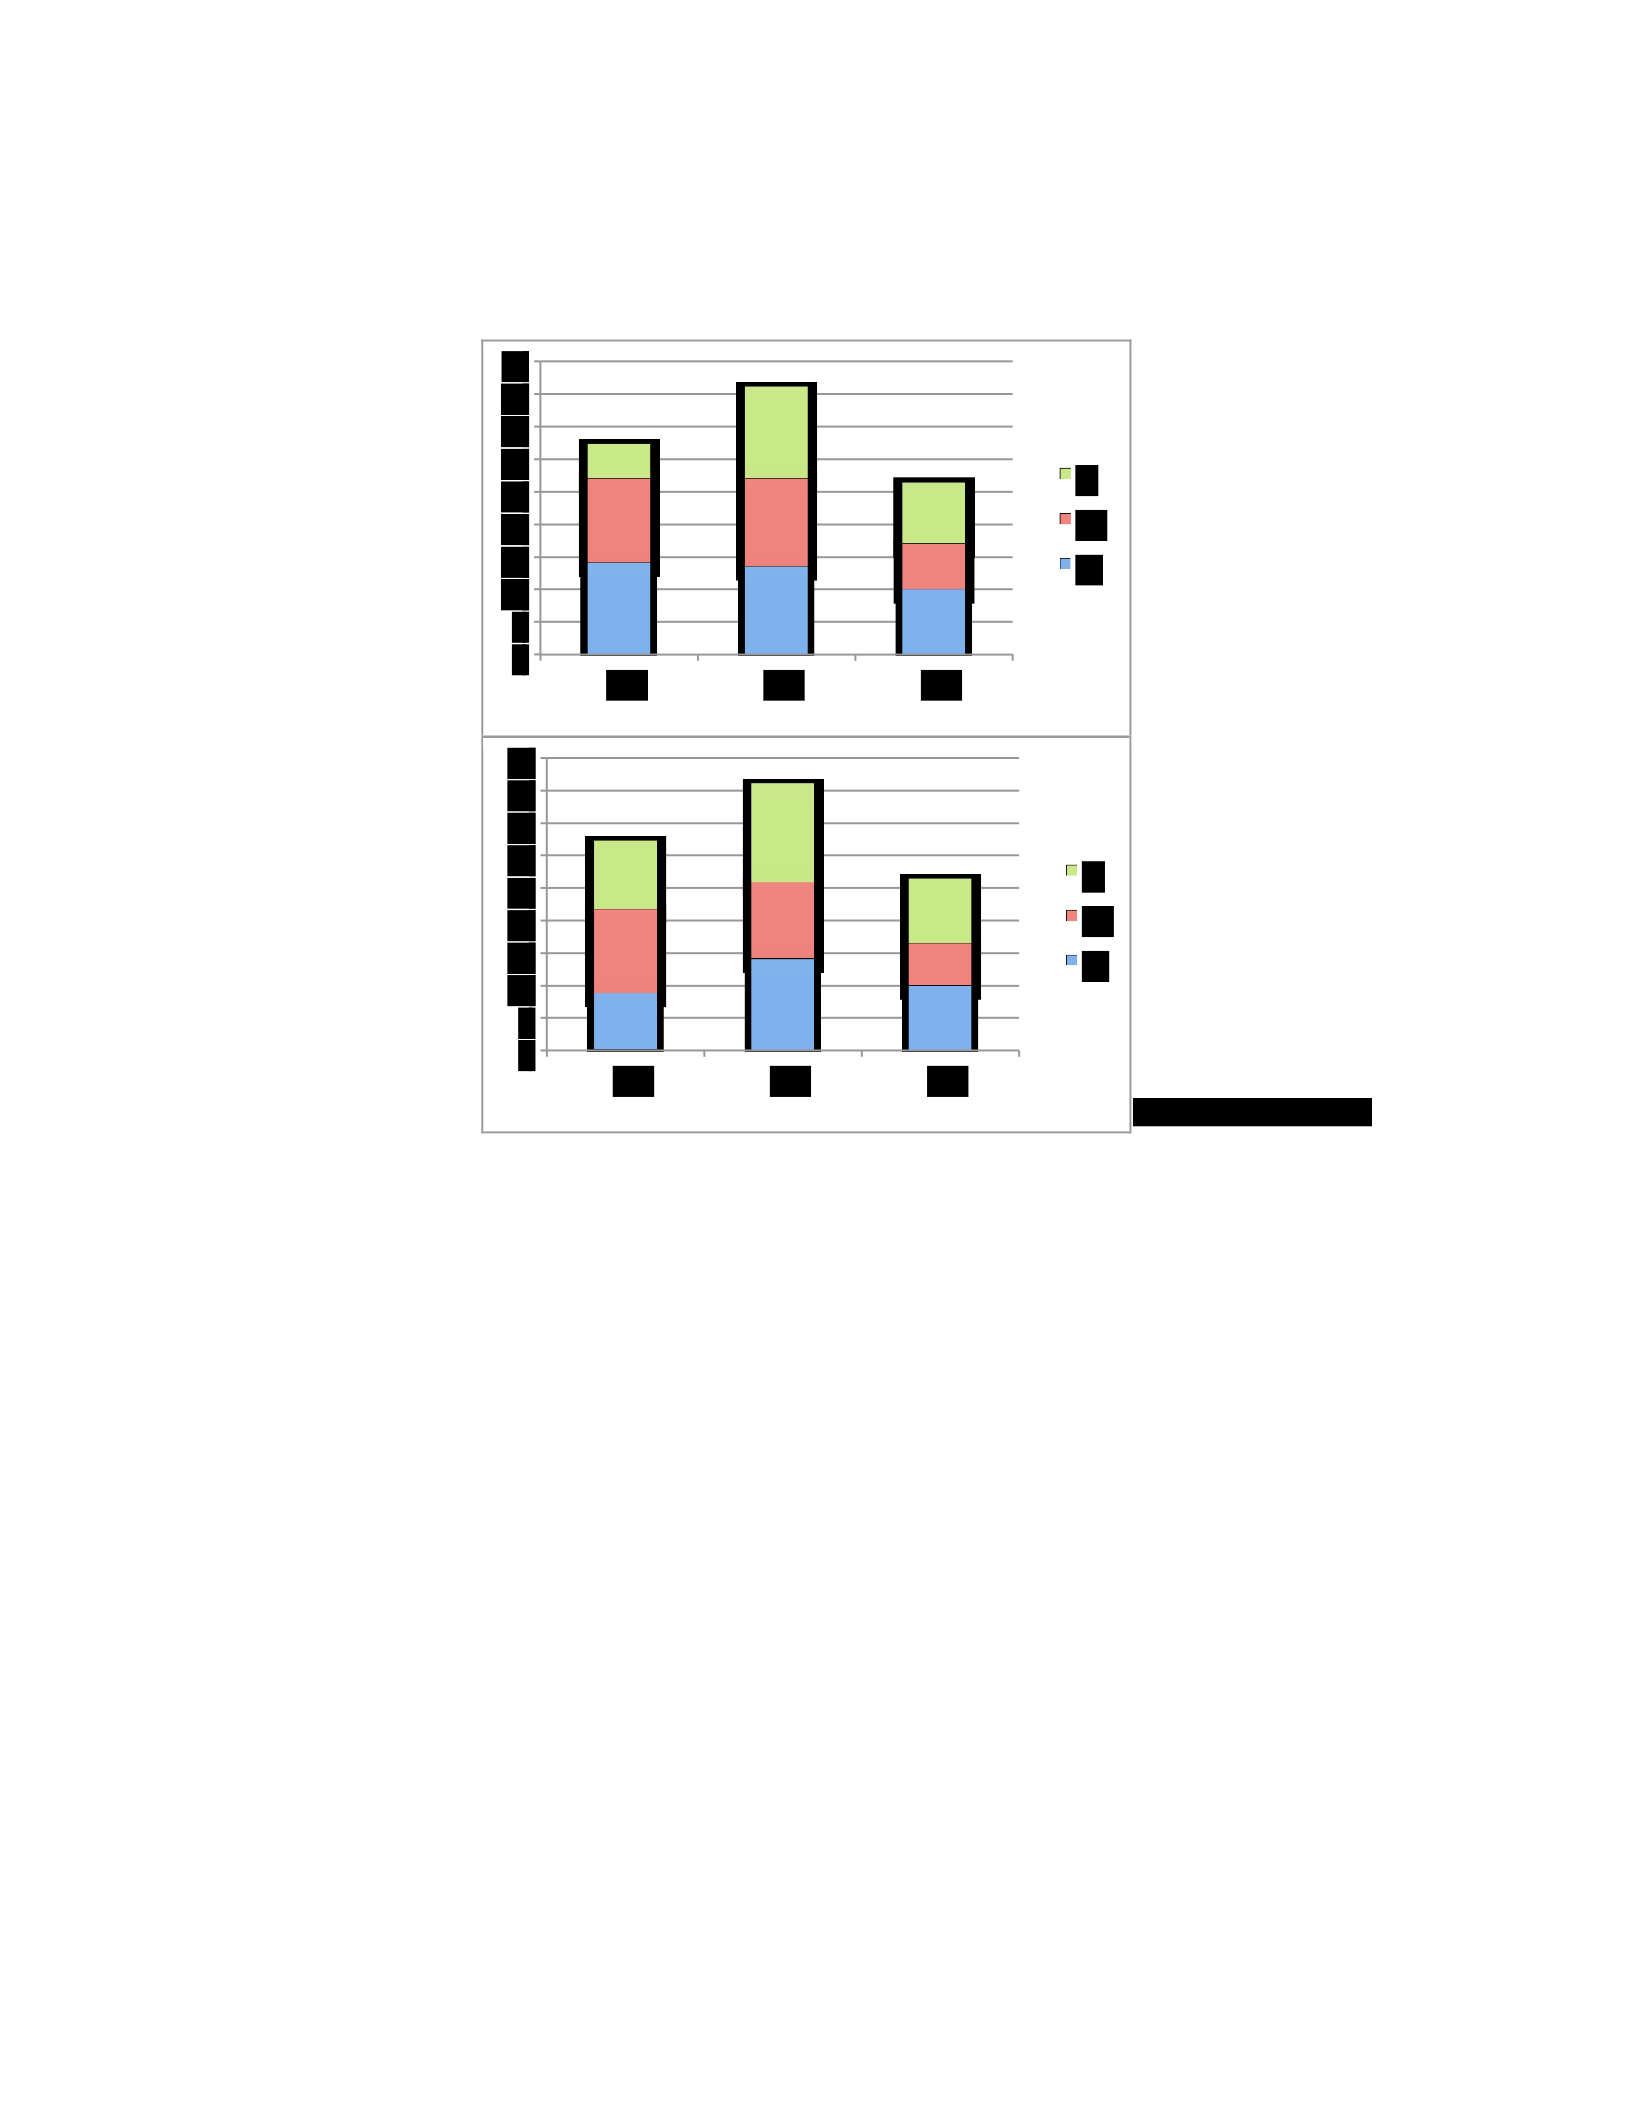
example, 14.1% of the constructs that were related to the G1 group are considered as highly
significant before introducing the breach. After introducing the breach, this percentage changed to
8.8%.
Finally, different results were drawn from the level 2 participants who had more than 5 years of
experience. Before the breach, they perceived
that the most important security
policy perceptions are those related to security
policy process followed by those
related to security policy content. were the
breach, the perception of this group changed.
They perceived the constructs related to the
policy form as the most important
perception followed by those related to
policy process (refer to figure 5.41).
Figure 5.40: How the five main policy themes of the Crown Confections security policy were perceived by
participants with between 2 to 5 years of experience (before and after the breach).
Pre-breach
Post-breach
0
5
10
15
20
25
30
35
40
45
G1
G2
G3
L
M
H
0
5
10
15
20
25
30
35
40
45
G1
G2
G3
L
M
H
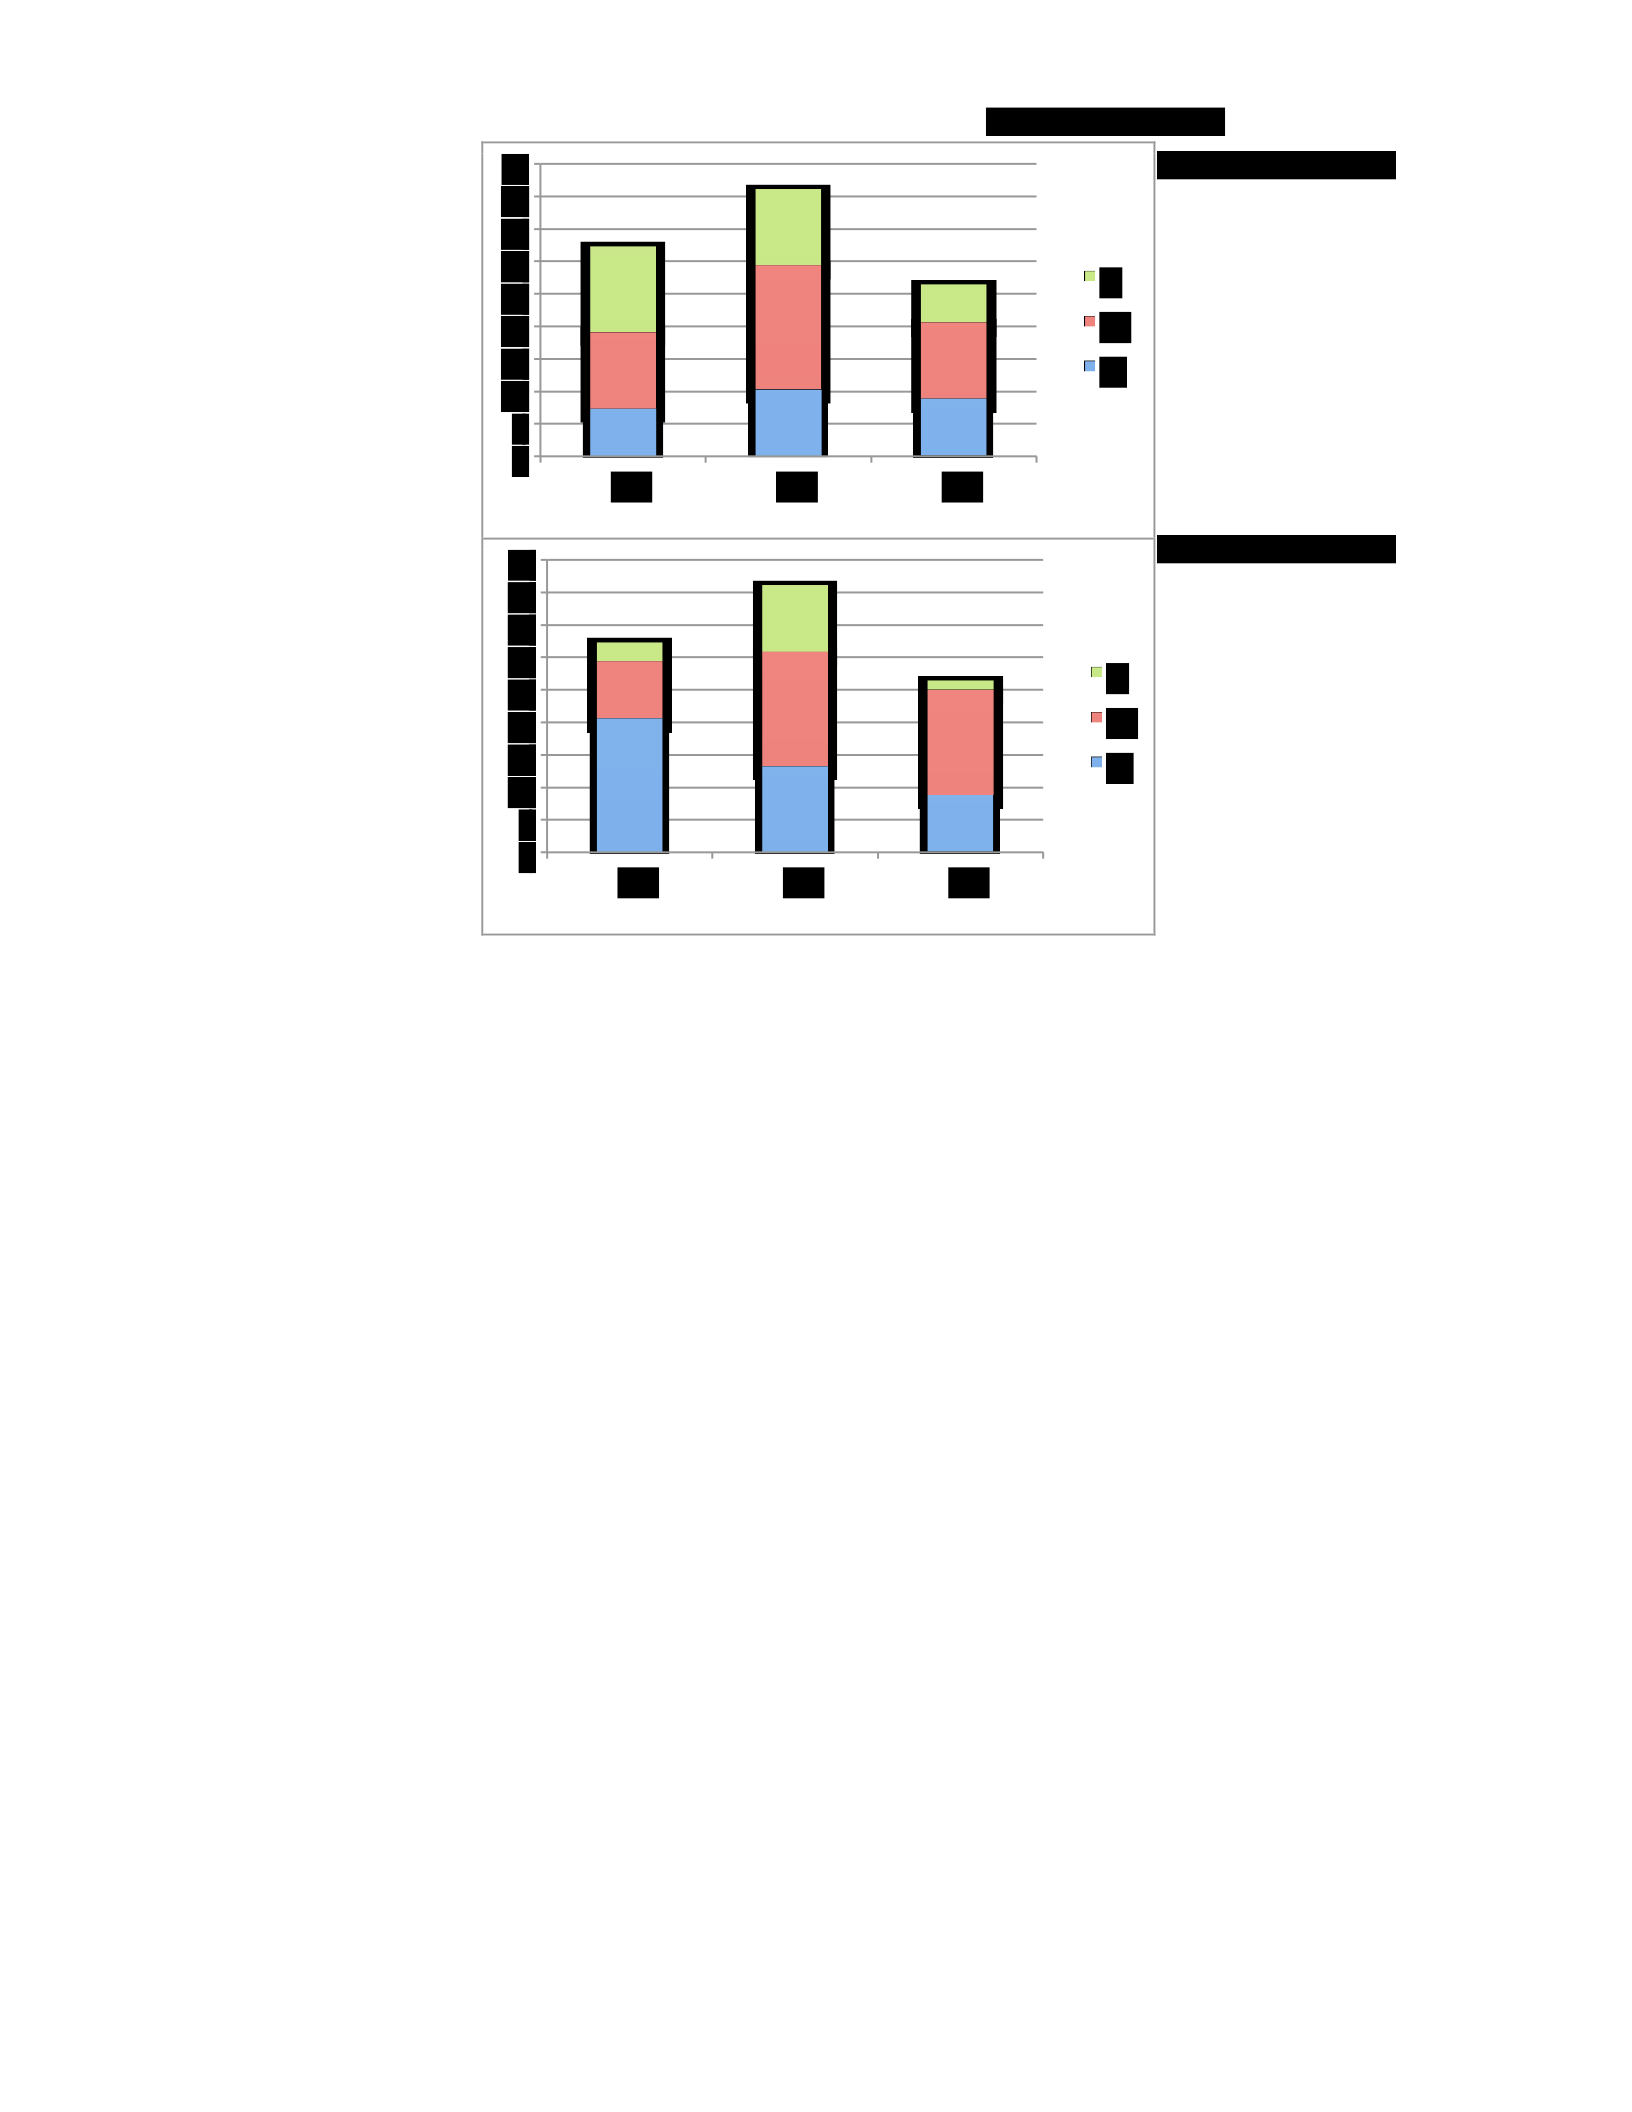
Figure 5.41: How the five main policy themes
of the Crown Confections security policy were perceived by participants with more than 5 years
of experience (before and after the breach).
What can be drawn from the analysis is that the individuals who work for organizations that have
level 2 information security policy held different perceptions regarding what was the most
important aspect that should be taken into consideration when developing or updating security
policy. Also, their perception was not stable. It was affected by the security incidents they may
face.
• SSE-CMM Level One
Pre-breach
Post-breach
0
5
10
15
20
25
30
35
40
45
G1
G2
G3
L
M
H
0
5
10
15
20
25
30
35
40
45
G1
G2
G3
L
M
H
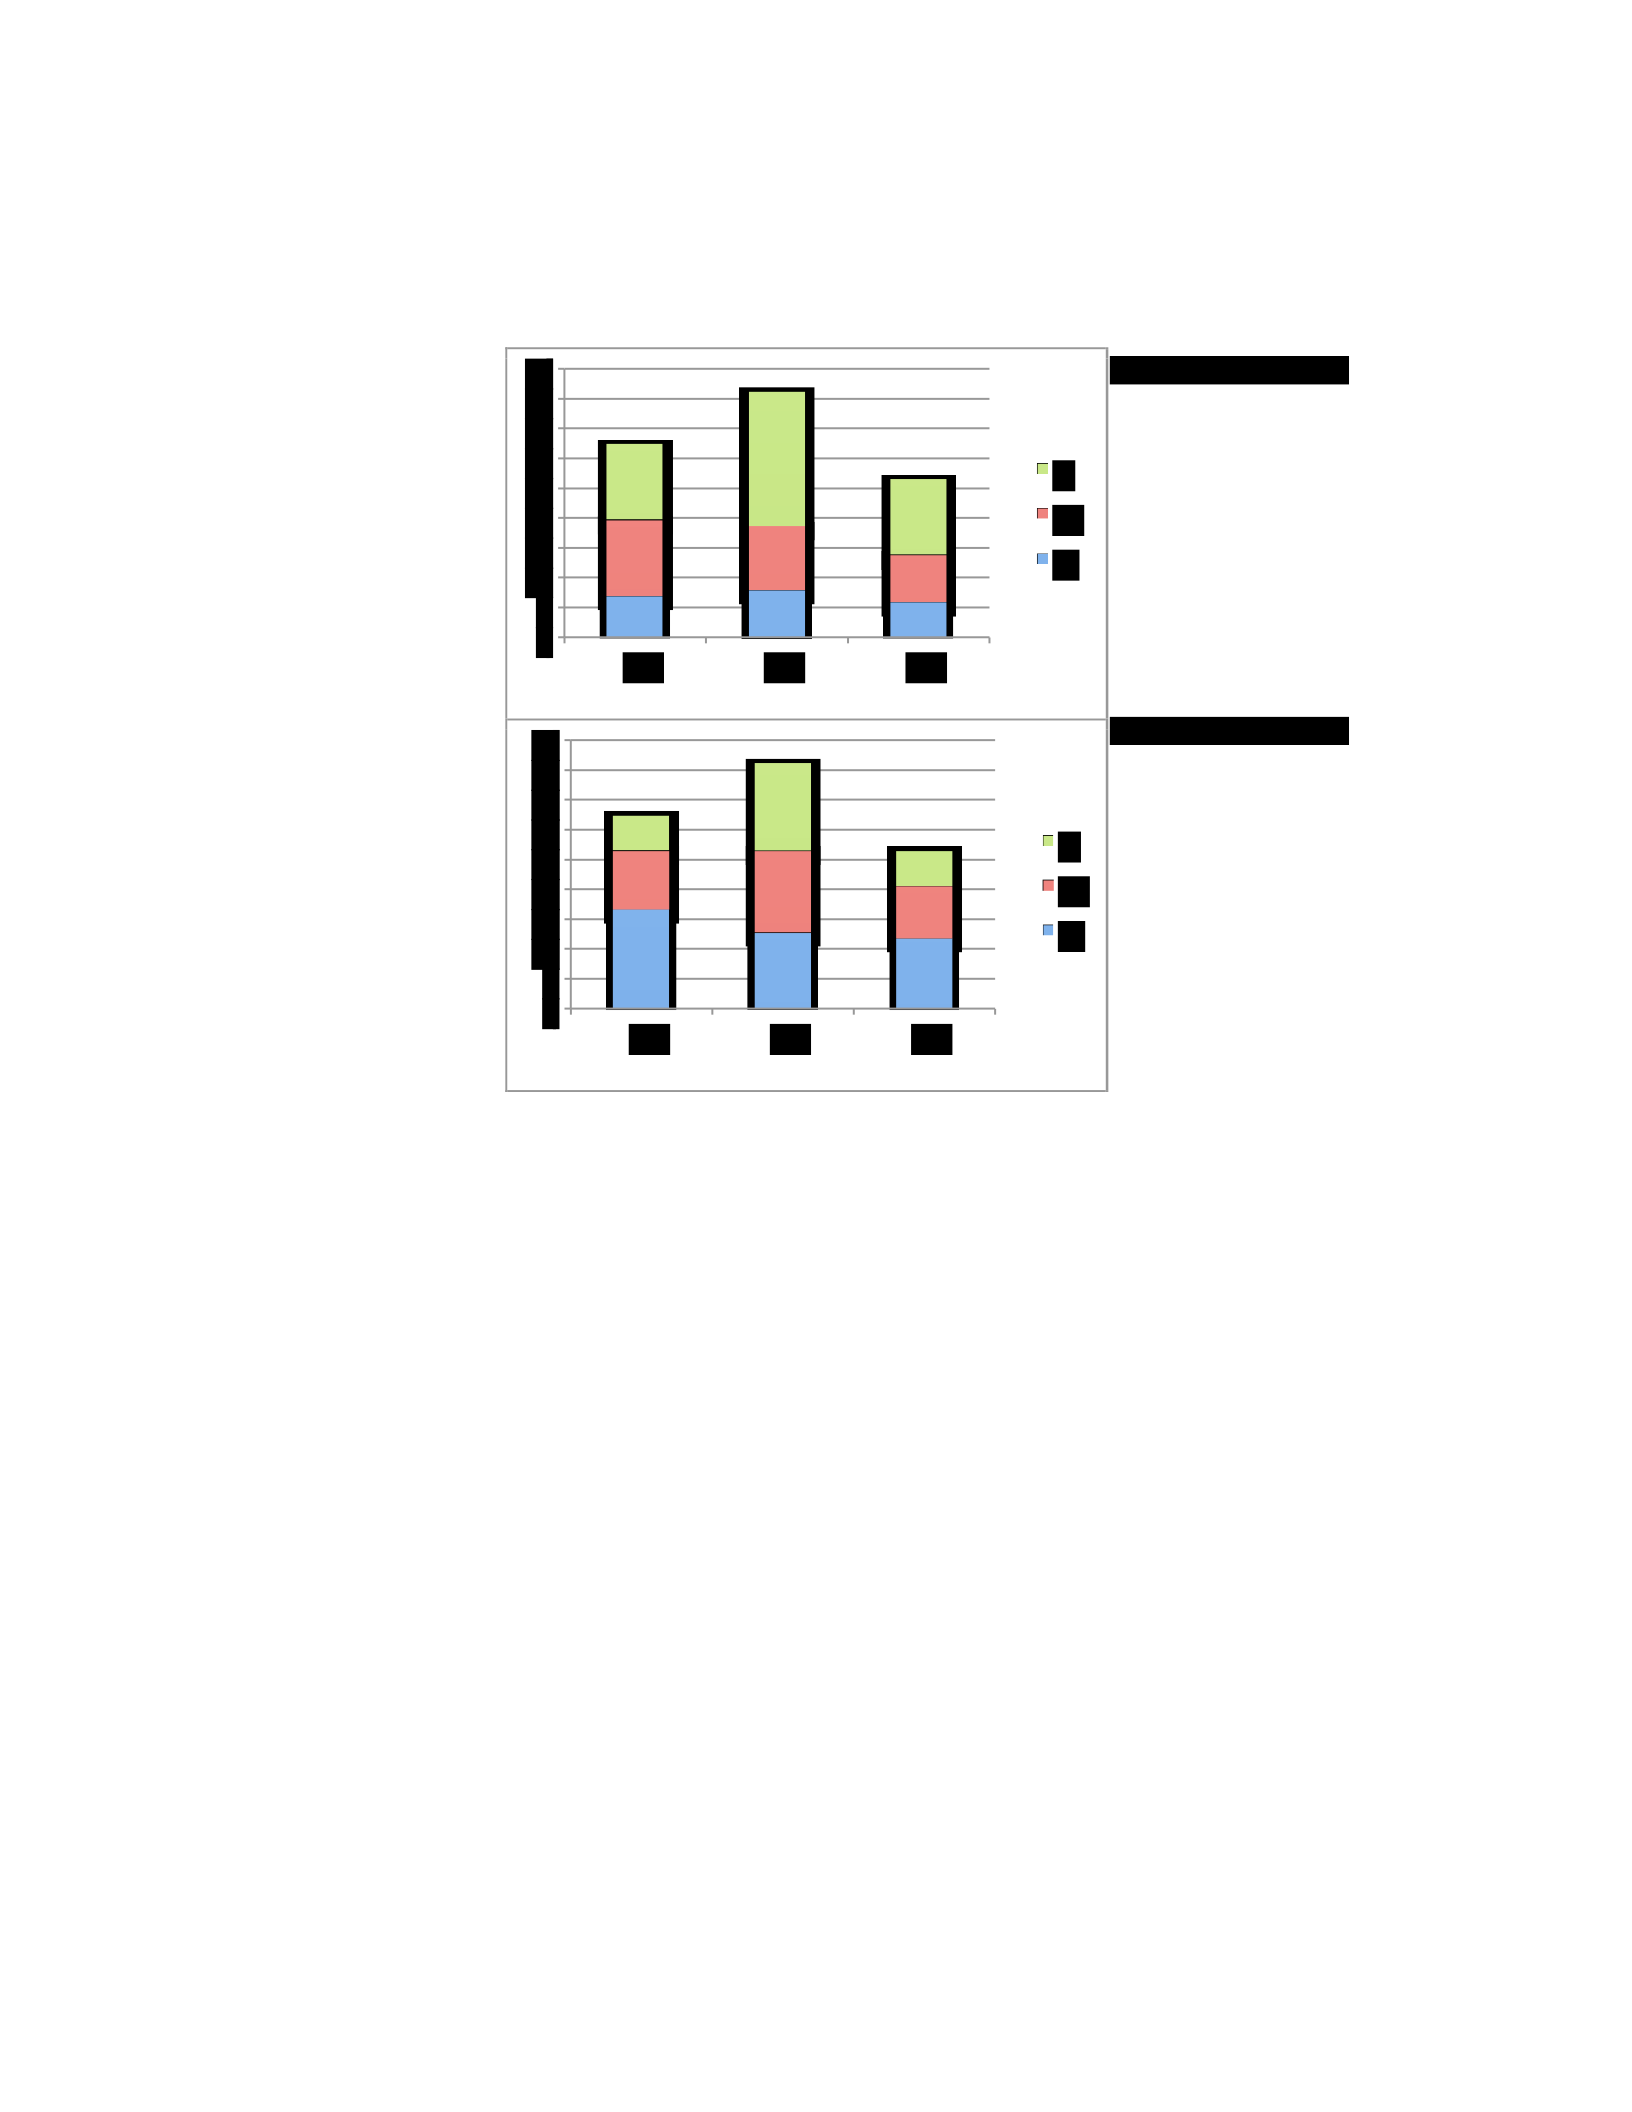
The participants of this group were grouped into three groups; participants who had less than 2
years of experience, participants who had between 2 to 5 years of experience and participants who
had more than 5 years of experience.
Figure 5.42: How the five main policy themes of the
Crown Confections security policy were perceived by
participants who have less than 2 years of experience (before and after the breach).
Figure 5.42 shows how the security policy of the Crown Confections was perceived by participants
who have less than 2 years of experience before and after the occurrence of the security breach.
The chart shows that this group of participants perceived that the constructs related to the security
policy process were the most significant security policy perceptions before the introduction of the
security breach, followed by those related to policy form. After the breach, this group perceived
the security policy form as the most significant security policy perception followed by those related
to security policy process. Also, the percentage of the constructs that were considered as “high,”
“medium,” or “low” important changed after introducing the breach. For example, 7.8% of the
constructs that are related to the G2 group were considered as highly important before introducing
the breach. However, this percentage changed to 12.8% after the breach.
Pre-breach
Post-breach
0
5
10
15
20
25
30
35
40
45
G1
G2
G3
L
M
H
0
5
10
15
20
25
30
35
40
45
G1
G2
G3
L
M
H
Different results were drawn from the level 1 participants who had between 2 to 5 years of
experience (as it is shown in figure 5.43). Before the breach, this group of participants perceived
that the constructs related to security policy form as the most significant security policy perceptions
followed by those related to the policy process. After the introduction of the security breach, they
perceive that the constructs related to security policy process as the most significant security policy
perceptions, followed by those related to policy form. Also, the percentage of the constructs that
were considered as “high,” “medium,” or “low” important changed after introducing the breach
(refer to figure 5.43).
Figure 5.43: How the five main policy themes of the Crown Confections security policy were perceived by
participants with between 2 to 5 years of experience (before and after the breach).
Lastly, level 1 participants who had more than 5 years of experience perceived that the most
important security policy perceptions were those related to security policy process followed by
those related to policy form. Their perception regarding the most significant policy perception was
similar before and after the breach. However, the percentage of the constructs that were considered
as “high,” “medium,” or “low” important changed after introducing the breach. Also, the
Pre-breach
Post-breach
0
5
10
15
20
25
30
35
40
45
G1
G2
G3
L
M
H
0
5
10
15
20
25
30
35
40
45
G1
G2
G3
L
M
H
percentage of the constructs in each of
the three groups that were rated as “high”
increased after the occurrence of the
security breach (refer to figure 5.44).
Figure 5.44: How the five main policy themes of the
Crown Confections security policy were perceived by
participants with more than 5 years of experience
(before and after the breach).
The analysis above shows that the perceptions of
individuals who work for organizations that
have level 1 information security policy regarding which of the policy perceptions was the most
significant one that should be taken into consideration when developing or updating security policy
were between policy process and policy form. They gave the least importance to constructs related
to policy content. However, their perception was not stable. It was affected by the security incidents
they have faced.
To sum up, the results from analyzing the five groups with the experience subgrouping expresses
the changes in the perceptions of the participants in each group before and after introducing the
security breach. That is, the perception of the participants regarding which constructs group is the
highest significant one was different before and after the breach. In some cases, some of the groups
perceived the same constructs group as the highest important group before and after the breach. In
these cases, the change in their perception appeared in the percentage of the constructs within each
constructs group that was rated as “high,” “medium,” or “low,” but not regarding the constructs
group that was perceived as the highest important. For example, the level 1 participants who had
more than 5 years of experience perceived the policy process as the most important group both
before and after the breach. However, the percentage of constructs in the G2 group that were rated
as “high” important changed from 11.8% to 17.7%. The percentage of constructs in the G2 group
Pre-breach
Post-breach
0
5
10
15
20
25
30
35
40
45
G1
G2
G3
L
M
H
0
5
10
15
20
25
30
35
40
45
G1
G2
G3
L
M
H

that were rated as “medium” important changed from 20.6% to 16.2%. Also, the percentage of
constructs in the G2 group that were rated as the least important changed from 10.3% to 7.4% after
the breach (refer to figure 5.44). It is important to point out to that the perception of the participants
after the occurrence of the security breach is not necessarily the optimal perception. That is, the
occurrence of the breach does not correct the perception. However, the occurrence of any security
breach can cause changes the participants’ perceptions, which could be reflected on their norms.
5.3.3 Principal Components Analysis (PCA)
The principal components analysis was applied on each of the Repertory Grids to find the
components or factors that represent a set of bipolar constructs. Indeed, it is very common for the
principal components analysis to be used for analyzing Repertory Grid data (Huang et al., 2007).
PCA helps in identifying the correlations between constructs and grouping the constructs into a set
of labels. This step helps in finding which constructs are highly significant. In this study, the
constructs were grouped using PCA that utilized the ratings of the participants. The PCA could
show the security policy aspects that had the most effect on developing an effective security policy.
This goal is not necessary for the aim of this study. Instead, the PCA was used in this study to show
the differences in the perception of the participants before and after the introduction of the security
breach.
Each grid was analyzed using the principle components analysis following the same steps of the
PCA that were applied in the alpha stage. In this research, both Excel 2011 and SPSS 23 were used
to achieve this analysis. For the purpose of this study, the correlation was done among the
constructs. The researcher chose the number of factors to retain based on the eigenvalues. The
number of factors that were retained in this study was between three and four factors. A sample of
SPSS sheet is available in the appendix.
Furthermore, the researcher used Varimax Orthogonal Rotation, which is the default type of
rotation. It is important to mention that PCA was applied to the data drawn before the introduction
of the breach (we called it “pre-breach PCA”) and the data drawn after the breach (we called it
“post-breach PCA”). Table 5.2 shows a sample of the loadings of one of the grids. It shows the
constructs that load more than 0.70 in each component.
Table 5.2: Varimax Rotated Construct Loadings.
Constructs
Component 1
Component 2
Component 3
Component 4
This policy is customized / reflect the organization's culture
-0.282
0.935
-0.115
0.182
This policy is in advanced level / provide high level of security / strong
-0.254
0.906
0.287
0.178
This policy follows the latest standard for creating policies
0.984
-0.156
0.003
0.088
This policy shows who is responsible for what/ The employee can know
if it applicable to him/her or not
-0.671
-0.418
-0.585
-0.181
This policy is prescriptive / shows how to do it (guidelines is included)
0.984
-0.156
0.003
0.088
This policy tells what to do in case of breach / the guideline to execute
the policy is clear
0.984
-0.156
0.003
0.088
The standards and guidelines are clearly separated
0.984
-0.156
0.003
0.088
The standards within this policy do not conflict with other standards and
policies
0.653
0.262
-0.695
0.145
The standards within this policy are consistent
0.831
0.396
-0.338
0.198
This policy has the required level of detail / explain all the rules in
details
0.984
-0.156
0.003
0.088
This policy has the required controls/ rules
-0.282
0.935
-0.115
0.182
Employees can have the same understanding to this policy
0.984
-0.156
0.003
0.088
Removing this policy will affect the level of security of the organization
0.984
-0.156
0.003
0.088
This policy is simple, clear and straightforward
0.892
0.082
-0.424
0.133
This policy is accurate and precise
0.984
-0.156
0.003
0.088
The standards within this policy are not repeated in other policies
-0.653
-0.262
0.695
-0.145
This policy is easy to remember
0.877
-0.082
0.465
0.091
The link between this policy and other policies is available and clear
0.014
0.121
0.992
0.028
This policy has standards that are subset of another policy
0.014
0.121
0.992
0.028
The purpose of this policy is clear and understandable
0.984
-0.156
0.003
0.088
The risk of non-complying to this policy is available and clear
0.984
-0.156
0.003
0.088
The sanctions of non-complying to this policy are stated clearly/ explicit
-0.222
-0.317
0.067
-0.92
The sanctions of non-complying to this policy are enough
0.984
-0.156
0.003
0.088
The sanctions of non-complying to this policy are specific
-0.222
-0.317
0.067
-0.92
Both the technical and business parts of this policy are available
0.984
-0.156
0.003
0.088
Easy to comply with this policy
0.753
0.607
-0.091
0.237
The boundary of the policy is clear / it is clear what it covers and what not
0.867
0.445
-0.072
0.213
The cost of following this policy is less than the benefit of following it
0.984
-0.156
0.003
0.088
This policy serves the business objectives / goals
0.984
-0.156
0.003
0.088
This policy reflects its importance to me (as an employee) / it is
important for the security of the organization
-0.282
0.935
-0.115
0.182
This policy is flexible / less strict
0.558
0.443
0.347
0.61
This policy is reasonable and appropriate
-0.184
0.477
-0.855
0.089
This policy is written in simple, plain language
0.951
0.247
-0.048
0.178
This policy is well-documented / well-structured / precise / organized
0.984
-0.156
0.003
0.088
After applying the principle components analysis on each grid, a huge number of factors was
resulted. Therefore, a priori set of labels were identified. The researcher scoured the literature for
the aspects of creating a robust policy. This literature scouring resulted in the following list of
labels:
• Policy process (Knapp et al., 2009): how the policy should be and should be implemented.
• Clarity of the policy (Goel and Chengalur-Smith, 2010): clearness, non-ambiguity of the
policy content and it easiness to understand.
• Policy breadth (Goel and Chengalur-Smith, 2010): the policy scope, range, or coverage.
• Policy Standards and guidelines 9Peltier, 2001): aspects related to the “how” aspect of the
policy; how the rules should be applied and implemented.

• Consequences of non-compliance with policy (Hsu et al., 2015): the influence of the
noncompliance to security policy on the organization or/and the individuals within the
organization.
• Policy level of advancement (Herath and Rao, 2009): aspects related to improving or
advancing the effectiveness and efficiency of the policy.
• Policy documentation: All rules, standards and guidelines needed are documented and
available.
The next step was to assign each component to one of these labels. In this study, an “inductive
coding” (Patton, 2002) was used to assign each component to the proper label from the
preidentified list. Sometimes, a component cannot fit with any label. In such cases, that component
should be labeled as “Ambiguous.” An additional round of inductive coding was conducted to
assess the labeling process and to check if any of the “Ambiguous” components can fit any of the
labels. Consequently, this process resulted in one change to one of the “Ambiguous” components.
For the pre-breach PCA, 29 out of 188 components were labels as “Ambiguous.” Thus, 159
components were assigned to one of the pre-defined labels. Table 5.3 shows a list of the labeled
components that were generated from pre-breach PCA. The “X” indicates that the component was
not included in the rotation.
For the post-breach PCA, 19 out of 184 components were labels as “Ambiguous.” Thus, 165
components were assigned to one of the labels. Table 5.4 shows a list of the labeled components
that were created from post-breach PCA. The “X” indicates that the component is not included in
the rotation.

Table 5.3: summary of pre-breach PCA that shows the labels of the components.
Grid#
Component 1
Component 2
Component 3
Component 4
L5
1
Clarity
Ambiguous
Process
Process
2
Process
Ambiguous
Ambiguous
Clarity
3
Guideline
Process
Ambiguous
Process
4
Clarity
Process
Documentation
Process
5
Clarity
Breadth
Consequence
Process
6
Process
Process
Ambiguous
Breadth
7
Ambiguous
Clarity
Documentation
Documentation
8
Process
Ambiguous
Documentation
Breadth
9
Clarity
Ambiguous
Process
Process
10
Process
Ambiguous
Documentation
Breadth
L4
1
Ambiguous
Process
Process
Guideline
2
Process
Ambiguous
Documentation
Clarity
3
Process
Ambiguous
Process
Guideline
4
Process
Clarity
Clarity
Guideline
5
Clarity
Documentation
Breadth
Guideline
6
Process
Ambiguous
Process
Clarity
7
Process
Ambiguous
Clarity
Breadth
8
Process
Clarity
Process
Ambiguous
9
Process
Process
Clarity
Ambiguous
L3
1
Process
Ambiguous
Process
Clarity
2
Process
Ambiguous
Consequence
Documentation
3
Clarity
Clarity
Breadth
Process
4
Process
Process
Ambiguous
Process
5
Process
Clarity
Ambiguous
Process
6
Process
Process
Ambiguous
Clarity
7
Process
Ambiguous
Process
Process
8
Process
Process
Ambiguous
Guideline
9
Process
Clarity
Process
Consequence
10
Clarity
Process
Clarity
Process
L2
1
Process
Ambiguous
Level of advancement
Process
2
Clarity
Process
Documentation
Clarity
3
Process
Process
Clarity
Documentation
4
Process
Ambiguous
Clarity
Breadth

5
Process
Process
Clarity
Guideline
6
Process
Documentation
Guideline
Consequence
7
Process
Consequence
Clarity
Documentation
8
Process
Process
Process
Consequence
9
Process
Clarity
Process
Level of advancement
10
Process
Process
Clarity
Consequence
L1
1
Ambiguous
Process
Process
Process
2
Process
Ambiguous
Clarity
Clarity
3
Process
Process
Process
Ambiguous
4
Process
Process
Clarity
Process
5
Process
Process
Clarity
Guideline
6
Clarity
Process
Process
Process
7
Process
Process
Process
Documentation
8
Process
Ambiguous
Process
Guideline
Table 5.4: summary of post-breach PCA that shows the labels of the components.
Grid#
Component 1
Component 2
Component 3
Component 4
L5
1
Ambiguous
Process
Clarity
Clarity
2
Ambiguous
Clarity
Documentation
Documentation
3
Clarity
Process
Guideline
Consequence
4
Process
Breadth
Clarity
Clarity
5
Clarity
Ambiguous
Process
Clarity
6
Clarity
Process
Clarity
Guideline
7
Process
Clarity
Documentation
Guideline
8
Ambiguous
Process
Guideline
Documentation
9
Ambiguous
Ambiguous
Process
Documentation
10
Ambiguous
Documentation
Consequence
Guideline
L4
1
Process
Consequence
Clarity
X
2
Process
Clarity
Documentation
Clarity
3
Clarity
Clarity
Process
Clarity
4
Process
Ambiguous
Guideline
Documentation
5
Clarity
Level of advancement
Process
Process
6
Process
Level of advancement
Ambiguous
Process
7
Clarity
Documentation
Clarity
Clarity
8
Process
Ambiguous
Process
Level of advancement
9
Clarity
Documentation
Process
Clarity
L3
1
Process
Ambiguous
Clarity
Clarity
2
Clarity
Level of advancement
Ambiguous
Process
3
Process
Process
Clarity
Guideline
4
Clarity
Process
Ambiguous
Consequence
5
Clarity
Consequence
Process
Level of advancement
6
Process
Process
Guideline
Process
7
Process
Ambiguous
Process
Clarity
8
Process
Clarity
Clarity
X
9
Process
Ambiguous
Clarity
Clarity
10
Clarity
Process
Level of advancement
Process
L2
1
Ambiguous
Guideline
Clarity
Ambiguous
2
Process
Process
Clarity
Guideline
3
Process
Ambiguous
Clarity
Breadth
4
Process
Clarity
Clarity
X

5
Clarity
Process
Process
Clarity
6
Process
Clarity
Clarity
Level of advancement
7
Process
Process
Documentation
X
8
Ambiguous
Level of advancement
Documentation
Consequence
9
Process
Clarity
Consequence
Process
10
Clarity
Process
Process
Process
L1
1
Clarity
Clarity
Process
Documentation
2
Process
Process
Process
Clarity
3
Process
Clarity
Clarity
Documentation
4
Clarity
Process
Guideline
Guideline
5
Process
Clarity
Guideline
Clarity
6
Clarity
Process
Clarity
Documentation
7
Clarity
Clarity
Breadth
Clarity
8
Process
Process
Clarity
Process
The next step was to apply an eyeball analysis on both tables to identify which of the bipolar
constructs (i.e. perceptions of the security policy) have the most influence on the effectiveness
security policy. For the pre-breach PCA, the most important security policy perceptions were those
related to the policy process. The second predominant security policy perceptions were those
related to the policy clarity. The third predominant security policy perceptions were those related
to the documentation of the security policy. Table 5.5 shows the number of occurrence of each
label for the pre-breach PCA. For the post-breach PCA, the predominant security policy
perceptions were those related to policy clarity. The second predominant security policy
perceptions were those related to the policy process. The third predominant security policy
perceptions were those related to security standards and guidelines and policy documentation.
Table 5.6 shows the number of occurrence of each label for the post-breach PCA.
Table 5.5: the number of occurrence of each label for the pre-breach PCA.
Label
# Of occurrence
Process
84
Clarity
36
Documentation
12
Guideline
10
Breadth
8
Consequence
7

Level of advancement
2
Ambiguous
29
Total
188
Table 5.6: the number of occurrence of each label for the post-breach PCA.
Label
# Of occurrence
Clarity
60
Process
59
Guideline
14
Documentation
14
Level of advancement
8
Consequence
7
Breadth
3
Ambiguous
19
Total
184
The results of the pre-breach and the post-breach PCAs show the difference in the ranking of the
perceptions. In general, the participants believed that the policy clarity and policy process had a
higher effect on the effectiveness of the security policy. Table 5.5 shows that the policy process
had the highest effect on the security policy perception before the occurrence of the security breach.
An example of the aspects related to policy process is “the policy should be customized and reflect
the organization culture.” On the other hand, table 5.6 shows that policy clarity had a major effect
on the security policy perception after the introduction of the breach. That is, after introducing the
security breach, the participants believed that the security policy should be clear and
understandable.

The second predominant factor before the breach was the aspect related to clarity of the security
policy. In other words, participants believed that the policy should be clear and understandable.
Furthermore, the second predominant factor after the breach was the aspect related to the policy
process.
Besides, the third factor that had a significant influence before the breach was the aspect related to
documentation of the security policy. In other words, participants believed that the security policy
should be well documented to be more effective. The good documentation includes, but not limited
to, the good wording, simplicity, and completeness. On the other hand, the third predominant factor
after the breach was the aspect related to security policy guideline. In other words, the participants
believed that the security policy should be clear, understandable and clearly separated from the
rules. The last three factors on each table had less effect on perceptions of the security policy.
By comparing the results of the pre-breach PCA and post-breach PCA, the results reveal how the
perceptions regarding which factors have the major influence on the perception of the security
policy changed after the occurrence of the security breach. Table 5.5 and table 5.6 show that before
the breach, the three factors that had the significant influence were policy process, policy clarity,
and consequences of non-compliance. This result is consistent with the previous studies. After the
breach, the three factors that had the significant influence were policy process, policy clarity, and
policy documentation. According to Knapp et al. (2009), policy process can contribute to the
success of the information security. Goel and Chengalur-Smith (2010) emphasize that policy clarity
is an important measure to measure the quality of a security policy. On the other hand, the policy
documentation is not an easy process. Ensuring the effectiveness of the security policy is an
important issue. Thus, the security policy document should support the business objectives and
reveal the control and security of organizational operations (Höne and Eloff, 2002).

5.4 Conclusion
The primary goal of the beta stage is to investigate how individuals in an organization perceive the
security policy of their organization differently and how their perceptions differ after the
occurrence of a security breach. In this stage, we assessed and evaluated the alpha version of the
artifact to develop a more mature artifact, the beta artifact. Here, the beta version artifact was the
Repertory Grid as rated by the participants at this stage before and after the breach, per figure
5.1.
The grids were analyzed qualitatively and quantitatively after the participants rated them. First, the
constructs within the grids were categorized via core categorization. Then, each grid was analyzed
via content analysis and principal components analysis (PCA). The results drawn from these
analyses illustrate how the participants perceived security policy differently and how these
perceptions change after the occurrence of any security breach.
Chapter 6: Discussion

5.5 Introduction
This chapter aims to synthesize the findings and implications of this research. In this chapter, we
interpret and discuss the findings from our study to confirm their contributions to both the practice
and academia. These findings include shaping the values of people via security policy in the first
place, changing people values in response to a security incident, and the relationship between
people values and security policy, which can be identified through the assessment of norm-rule
compliance. In this study, we argue that occurrence of security incident may cause changes to
values in light of the security policy of an organization. These changes in the values may be
reflected on the compliance of people’s norms with information security rules and standards.
Previous IS literature studied the factors that directly and indirectly affect compliance with security
policies. Few studies have touched on how norms influence employees’ intention to comply with
security policies. That is, they studied the link between the values and security policies. However,
the IS literature ignores how people values (in respect to security policy) change in response to a
security breach.
Thus, this chapter tries to answer our research questions regarding what are people’s values in
regard to security policy, how their values change in response to a security incident, and how
organizations can assess the relationship between people norms and security rules and standards in
order to develop a more effective security policy.
6.2 Security Policy Shapes Individual’s Values
This study argues that values of individuals in an organization are shaped by the security policy of
the organization at the first place. That is, when employees receive the security policy of their
organization, they gain preliminary perceptions regarding these security policies, which in turn
play a significant role in shaping their values. Previous research indicates that the policy can shape
the people’s norms, and behaviors (Sabatier and Weible, 2014; Schneider and Ingram 1997). On
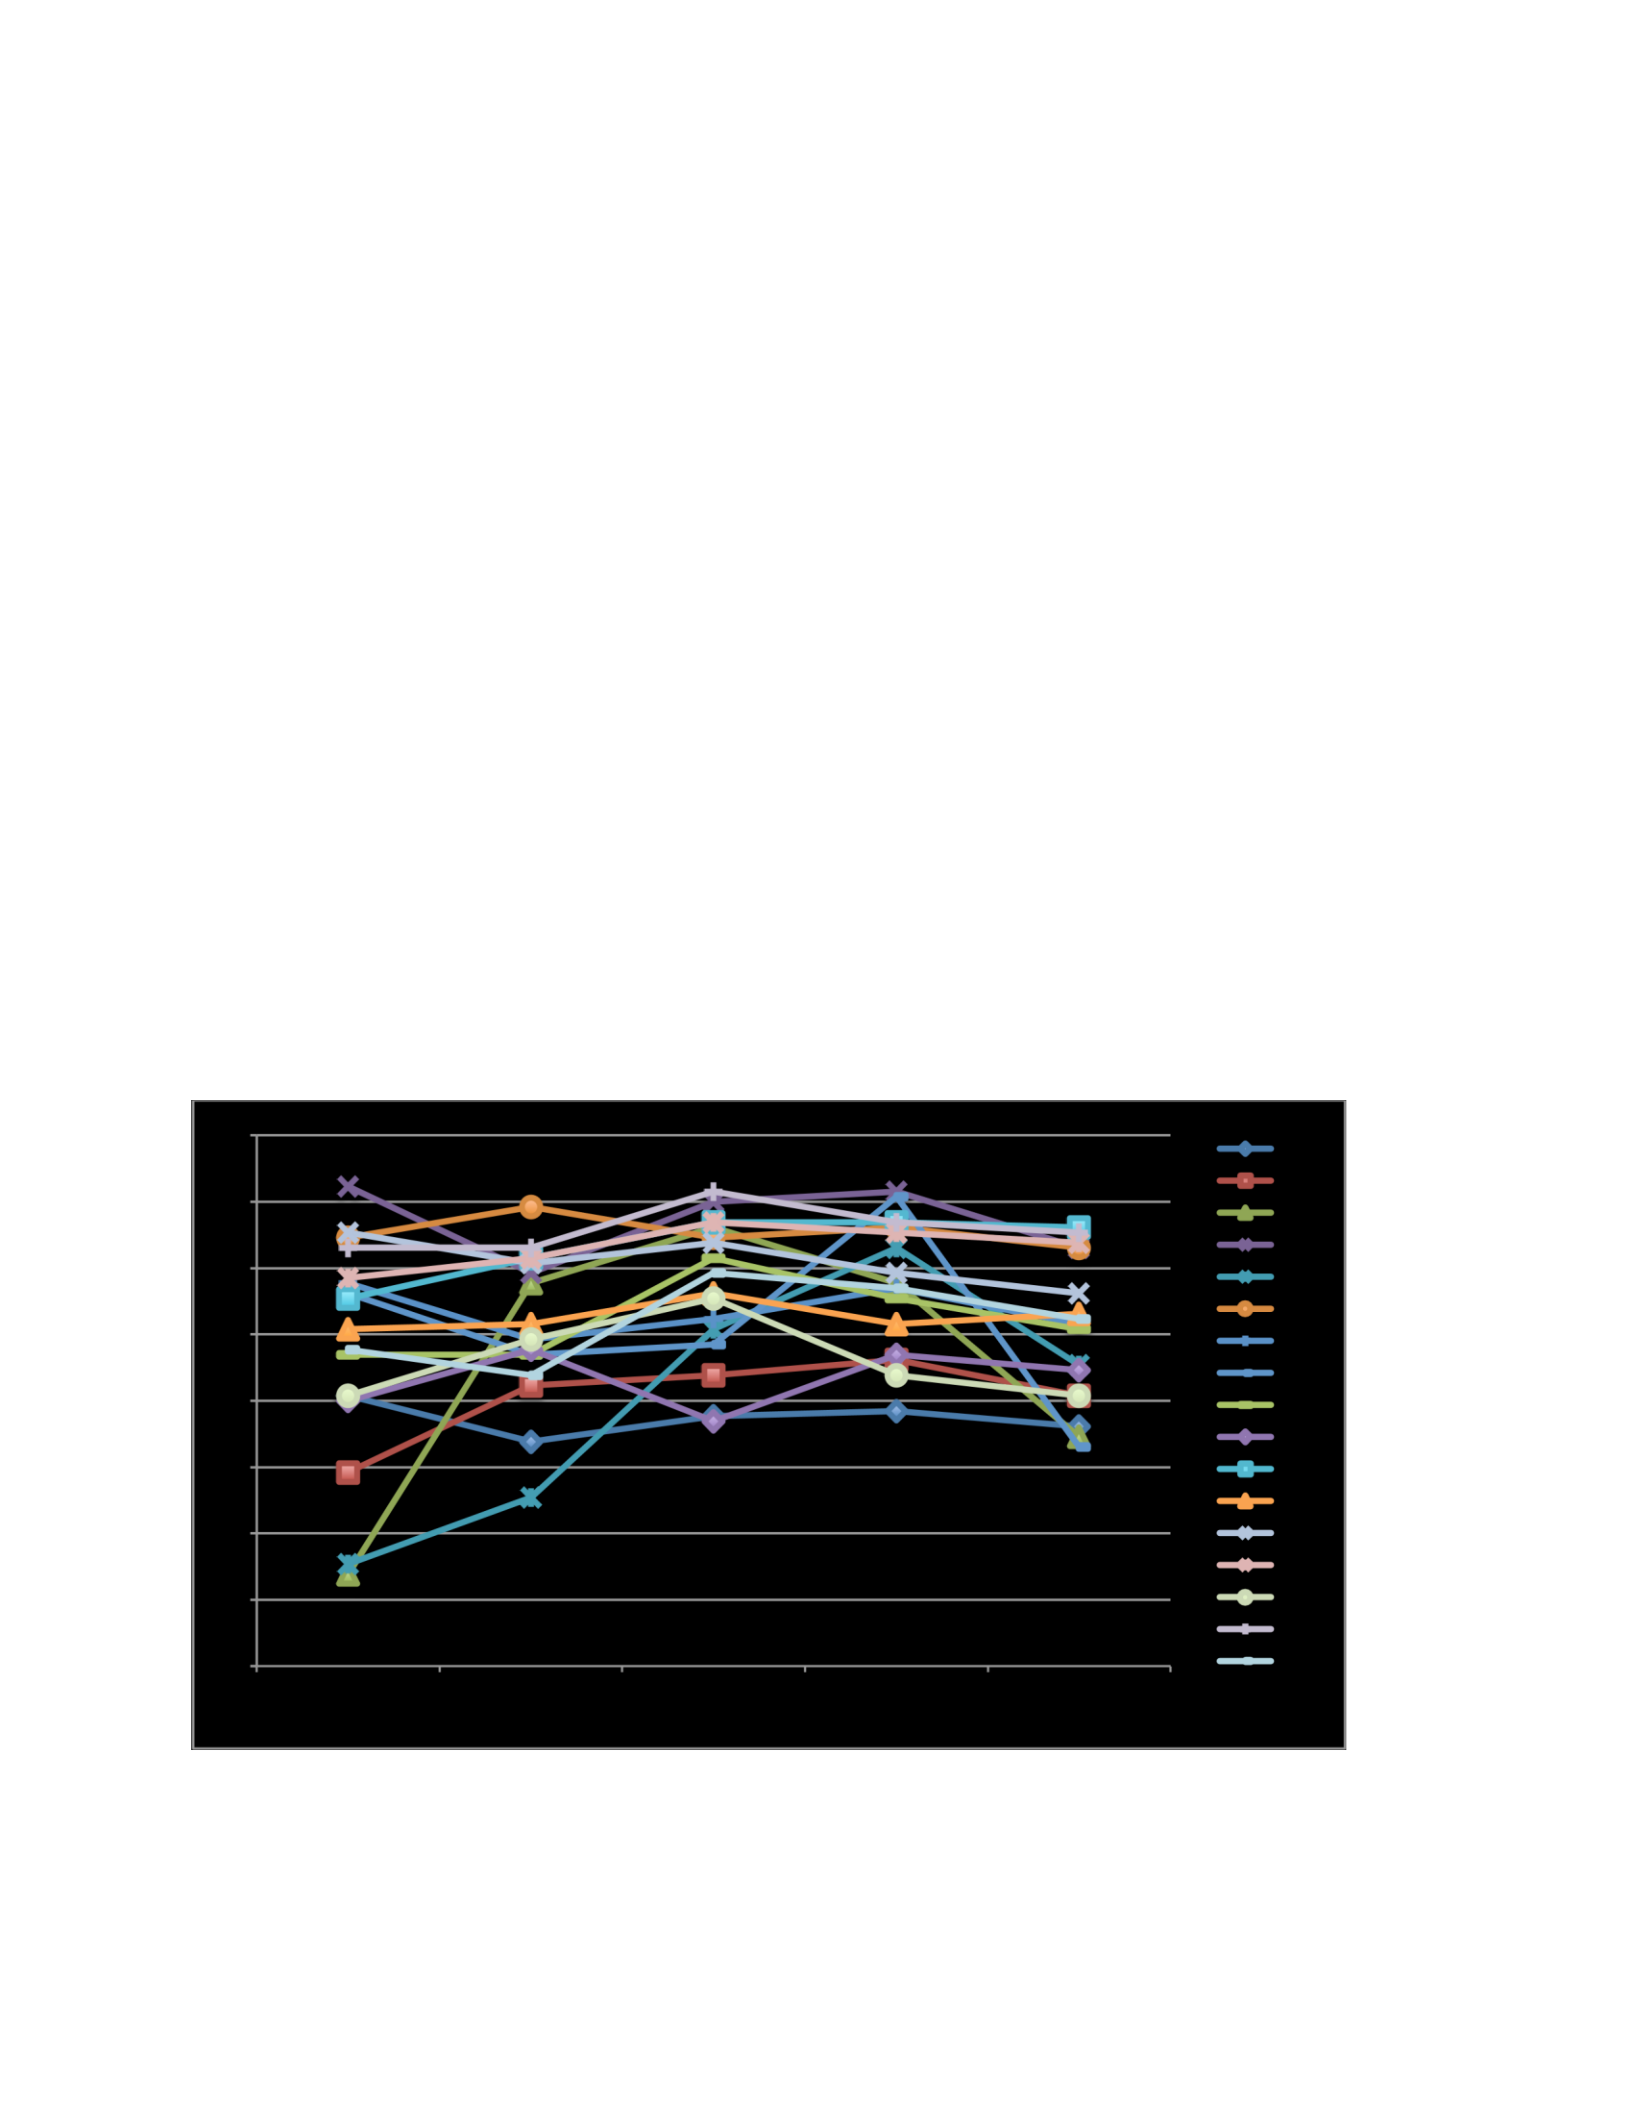
the other hand, people who belong to the same organization may have different perceptions and
understanding according to the different values they have in the first place (Vaast, 2007;
Albrecthsen and Hovdena, 2009).
The findings of this research indicate that there is a noticeable difference among employees values
concerning their organization’s security policy. By comparing the ratings of the participants before
the breach in both stages (the alpha stage and the beta stage), we can see the differences in people
perceptions regarding each of the security policy. Figures 6.1 and 6.2 show how the participants
who have the same security policy perceived these policies differently in the two stages, the alpha
stage and the beta stage, respectively. When two points on two different lines intersect, that means
the two participants have the same perception regarding the respected policy. As the two points
diverge, the perceptions also differ.
Figure 6.1: the perceptions of the whole participants regarding each security policy (level five participants - alpha
stage).
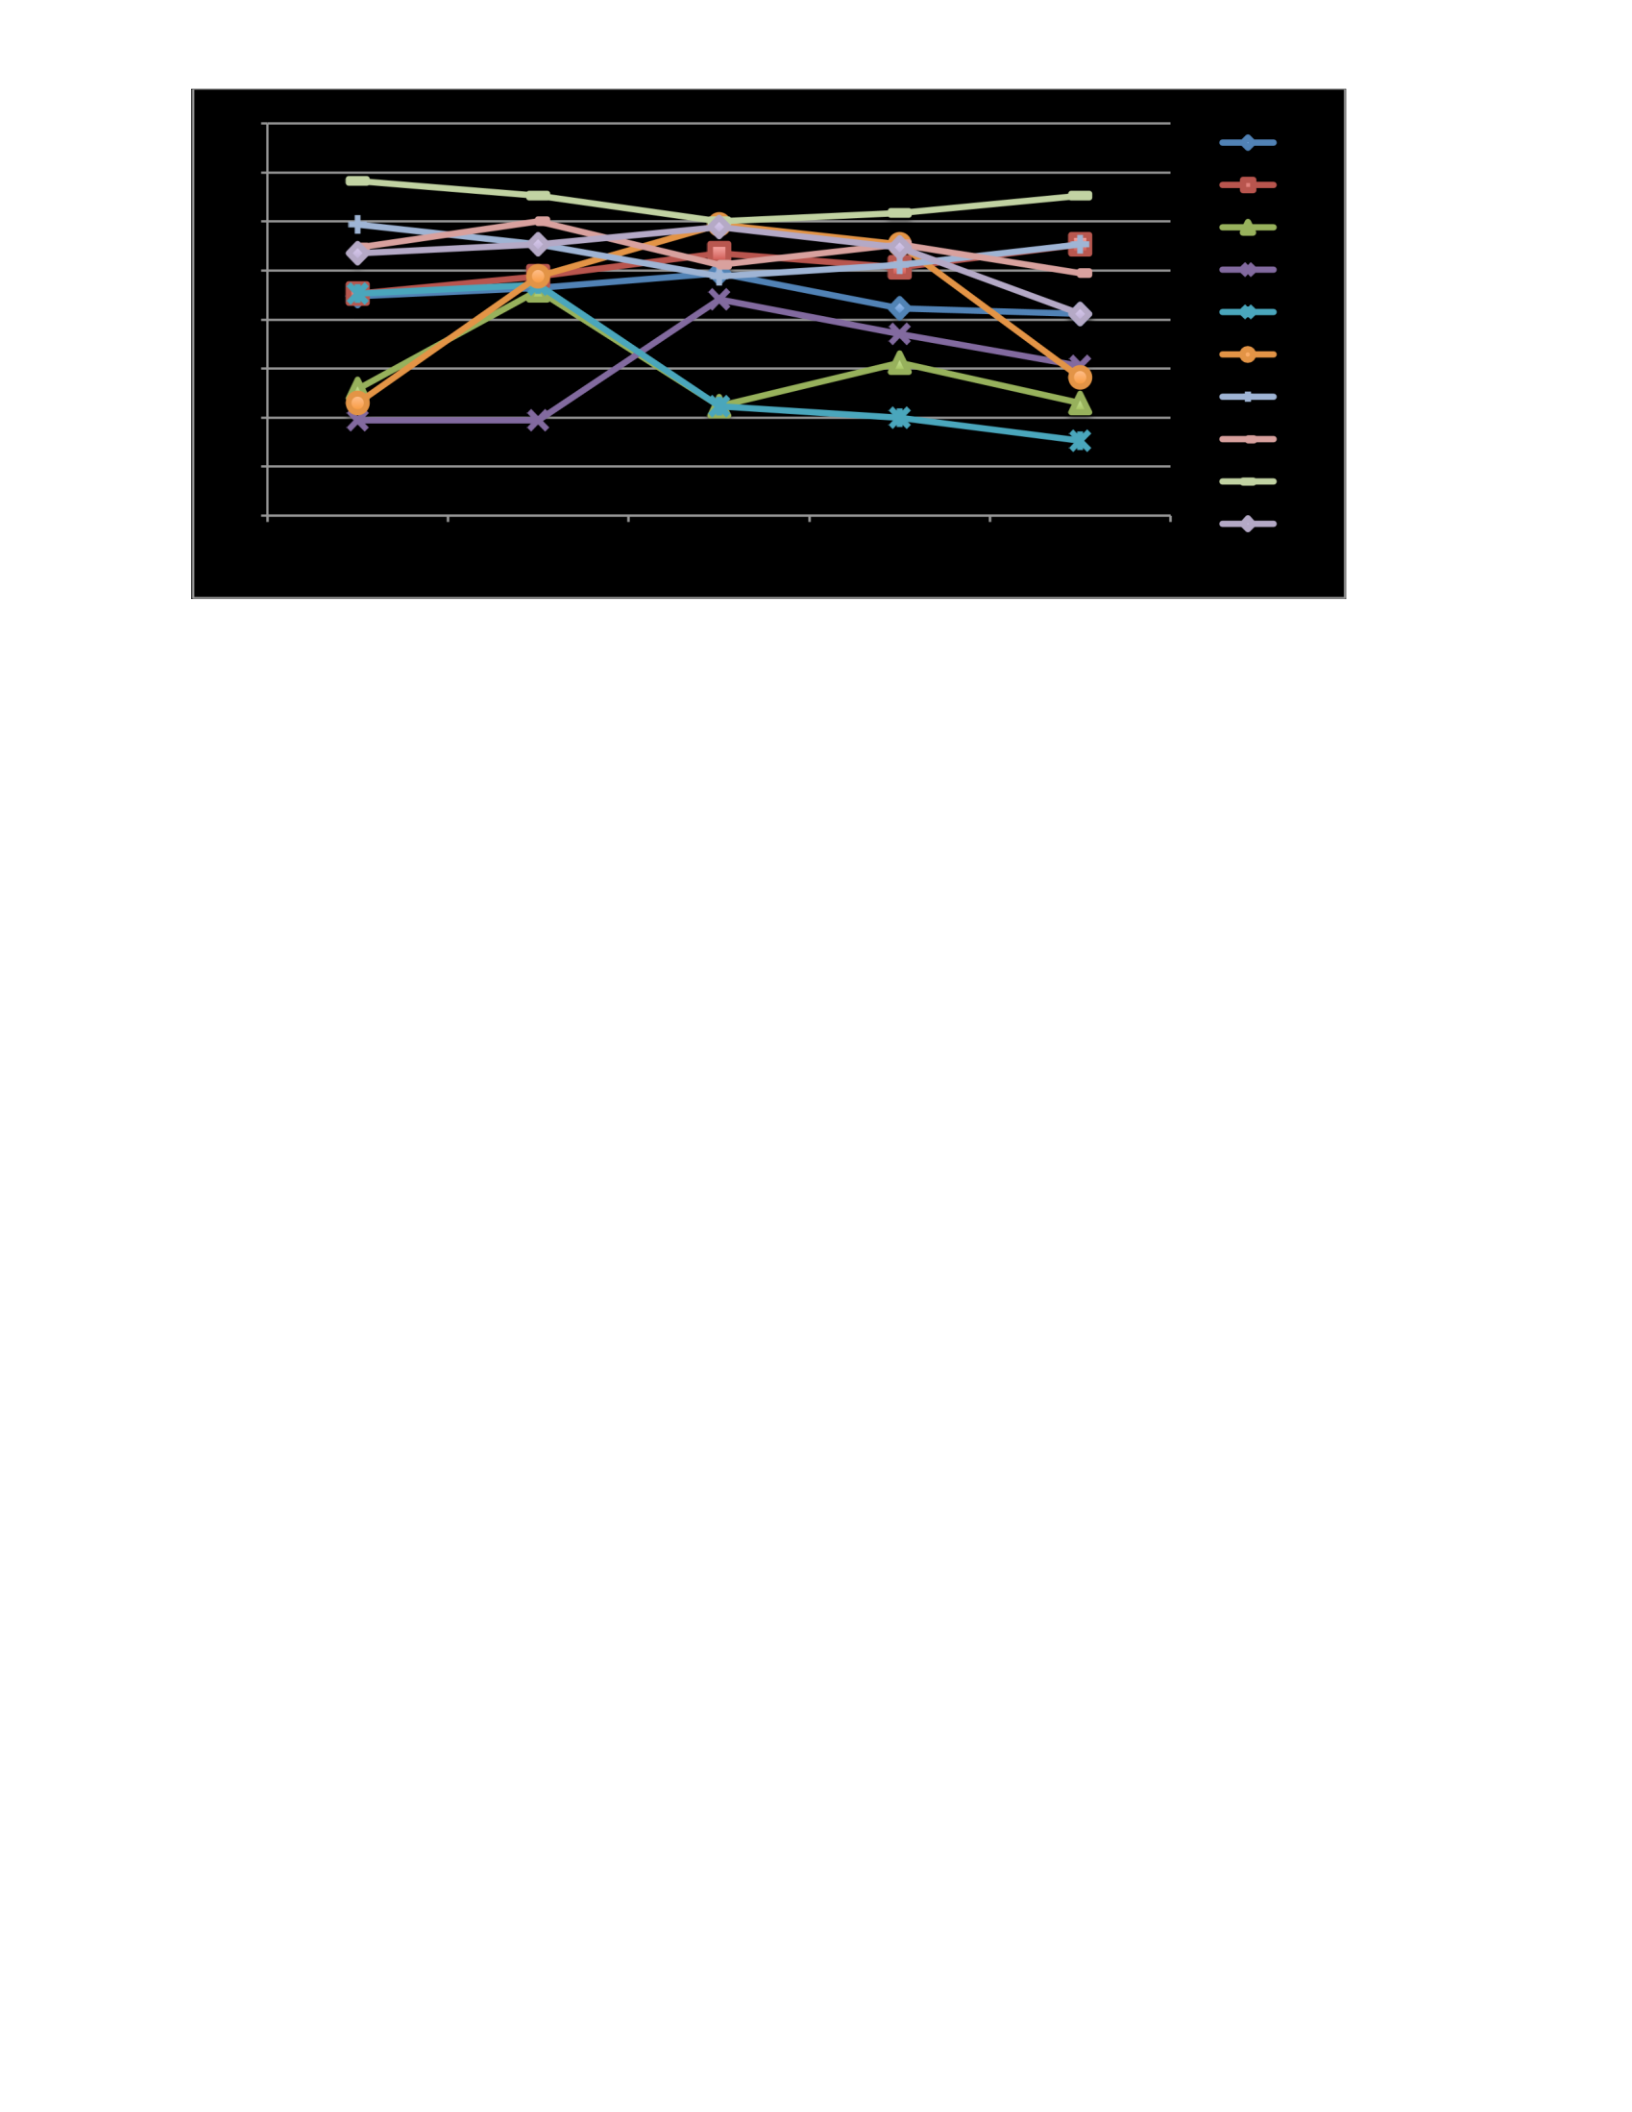
Figure 6.2: Perceptions of the whole participants regarding each security policy (level five participants - beta stage).
As it appears in the figures above, there are big deviations in the individuals’ perceptions regarding
each policy. Thus, even though they have the same security policy, this security policy does not
shape their norms in the same way. They may construe the security policy differently due to the
differences in the individuals’ original values. This finding is consistent with Kelly’s (1955)
Personal Construct Theory that implies that people construe events around them based on their
personal experience, values, and beliefs.
At the groups level, the results of this study show that people perceptions regarding security policy
vary in accordance with the maturity level of the information security policy. In this study, we had
five groups of participants and five versions of the information security policy, each with a different
level of SSE-CMM. Each group had a different version of the security policy. At the alpha stage,
individuals who received a security policy with a lower maturity level had different perceptions
from those who received a security policy with higher maturity level.
Table 6.1 shows the means of the five groups as divided based on the five SSE-CMM levels.
Table 6.1: Means of the five groups of the five SSE-CMM levels (alpha stage).
Acceptable Use
Policy
Info. Sec. Roles
and
Responsibilities
Password Policy
E-mail policy
Remote
Access Policy
L1
MEAN
3.00
3.55
2.45
2.45
1.91
SD
1.61
1.21
1.29
1.21
1.22
L2
MEAN
3.25
3.75
2.88
3.00
2.88
SD
1.39
1.04
1.25
1.20
1.25
L3
MEAN
3.17
3.42
3.92
3.42
3.08
SD
1.03
1.24
1.16
0.79
1.16
L4
MEAN
4.22
4.00
4.67
3.67
3.33
SD
0.67
0.71
0.50
1.00
1.41
L5
MEAN
3.53
3.71
4.29
4.24
3.47
SD
1.18
0.99
0.69
0.75
1.01
It can be seen from table 6.1 that the policy related to “information security roles and
responsibilities” was perceived to be the most significant policy that should get more attention for
participants with the lower maturity levels policy (level1 and level2). On the other hand,
participants with the higher maturity levels policy (level3, level4, and level5) perceived “password
policy” to be the most significant policy that should get more attention. Consistent results were
drawn from the beta stage. Individuals with the lower maturity levels policy perceived “clean desk
policy” as the most significant policy that should get more attention. Individuals with the higher
maturity levels policy perceived “password policy” and “email policy” as the most significant
policy that should get more attention. Therefore, the maturity level of the information security
policy plays a significant role in the process of shaping the people’s perceptions regarding the
security policy.
Moreover, the results of this study indicate that people’s perceptions regarding security policy
differ according to the age of the individuals. In this study, each SSE-CMM level group was
grouped into three subgroups based on their age range. People from the same age group hold
different perceptions regarding the same security policy. Norms of an individual are typically
affected by age (De Kort, 2008; Morris and Venkatesh, 2000). Siponen and Vance (2010) has a

consistent result. Their study indicates that the age of an individual affects his or her intention to
violate the security policy. Thus, the differences in individuals’ age will be reflected on how those
individuals construe the same security policy.
Similarly, the results of this study indicate that people’s perceptions regarding security policy differ
according to their experience. Here, we had three subgroups of participants within each SSE-CMM
levels group. These subgroups were grouped based on their experience. Individuals who belong to
the same experience group had different perceptions regarding the same security policy. The
experience of an individual can influence the individual’s norms (Venkatesh and Morris, 2000;
Thompson et al., 1996). Consistent with this argument, Siponen and Vance (2010) indicate that the
experience of an individual affects his or her intention to violate the security policy. When the
experience of a person increases, his or her norms will change according to the change in his or
her experience. This change in the individual’s norms will be reflected on how she or he construe
the security policy since an individual construes events around her/him in accordance with his or
her norms and values (Kelly, 1955).
The deviations in people’s perceptions regarding the information security policy reflect the
mismatch between security rules and standards and people’s norms. This mismatch between rules
and norms can be reflected on people’s compliance with the information security policy (Vaast,
2007; Albrecthsen and Hovden, 2009). That is, individuals who have different perceptions
regarding the security policy interpret these policies differently, which in turn will be reflected on
their compliance behavior. It is typically impossible for all individuals to have shared perceptions
regarding the same security policy. However, organizations need to reduce or eliminate the
deviation in the perceptions of their employees through applying various means such as training
and awareness. Indeed, awareness affects the people’s perceptions and beliefs (Bulgurcu et al.,
2010). Some organizations do not have awareness programs. Other organizations have some
awareness programs, but their employees still have a deviation in their perceptions. That deviation
may be attributed to the kind of awareness programs they have.
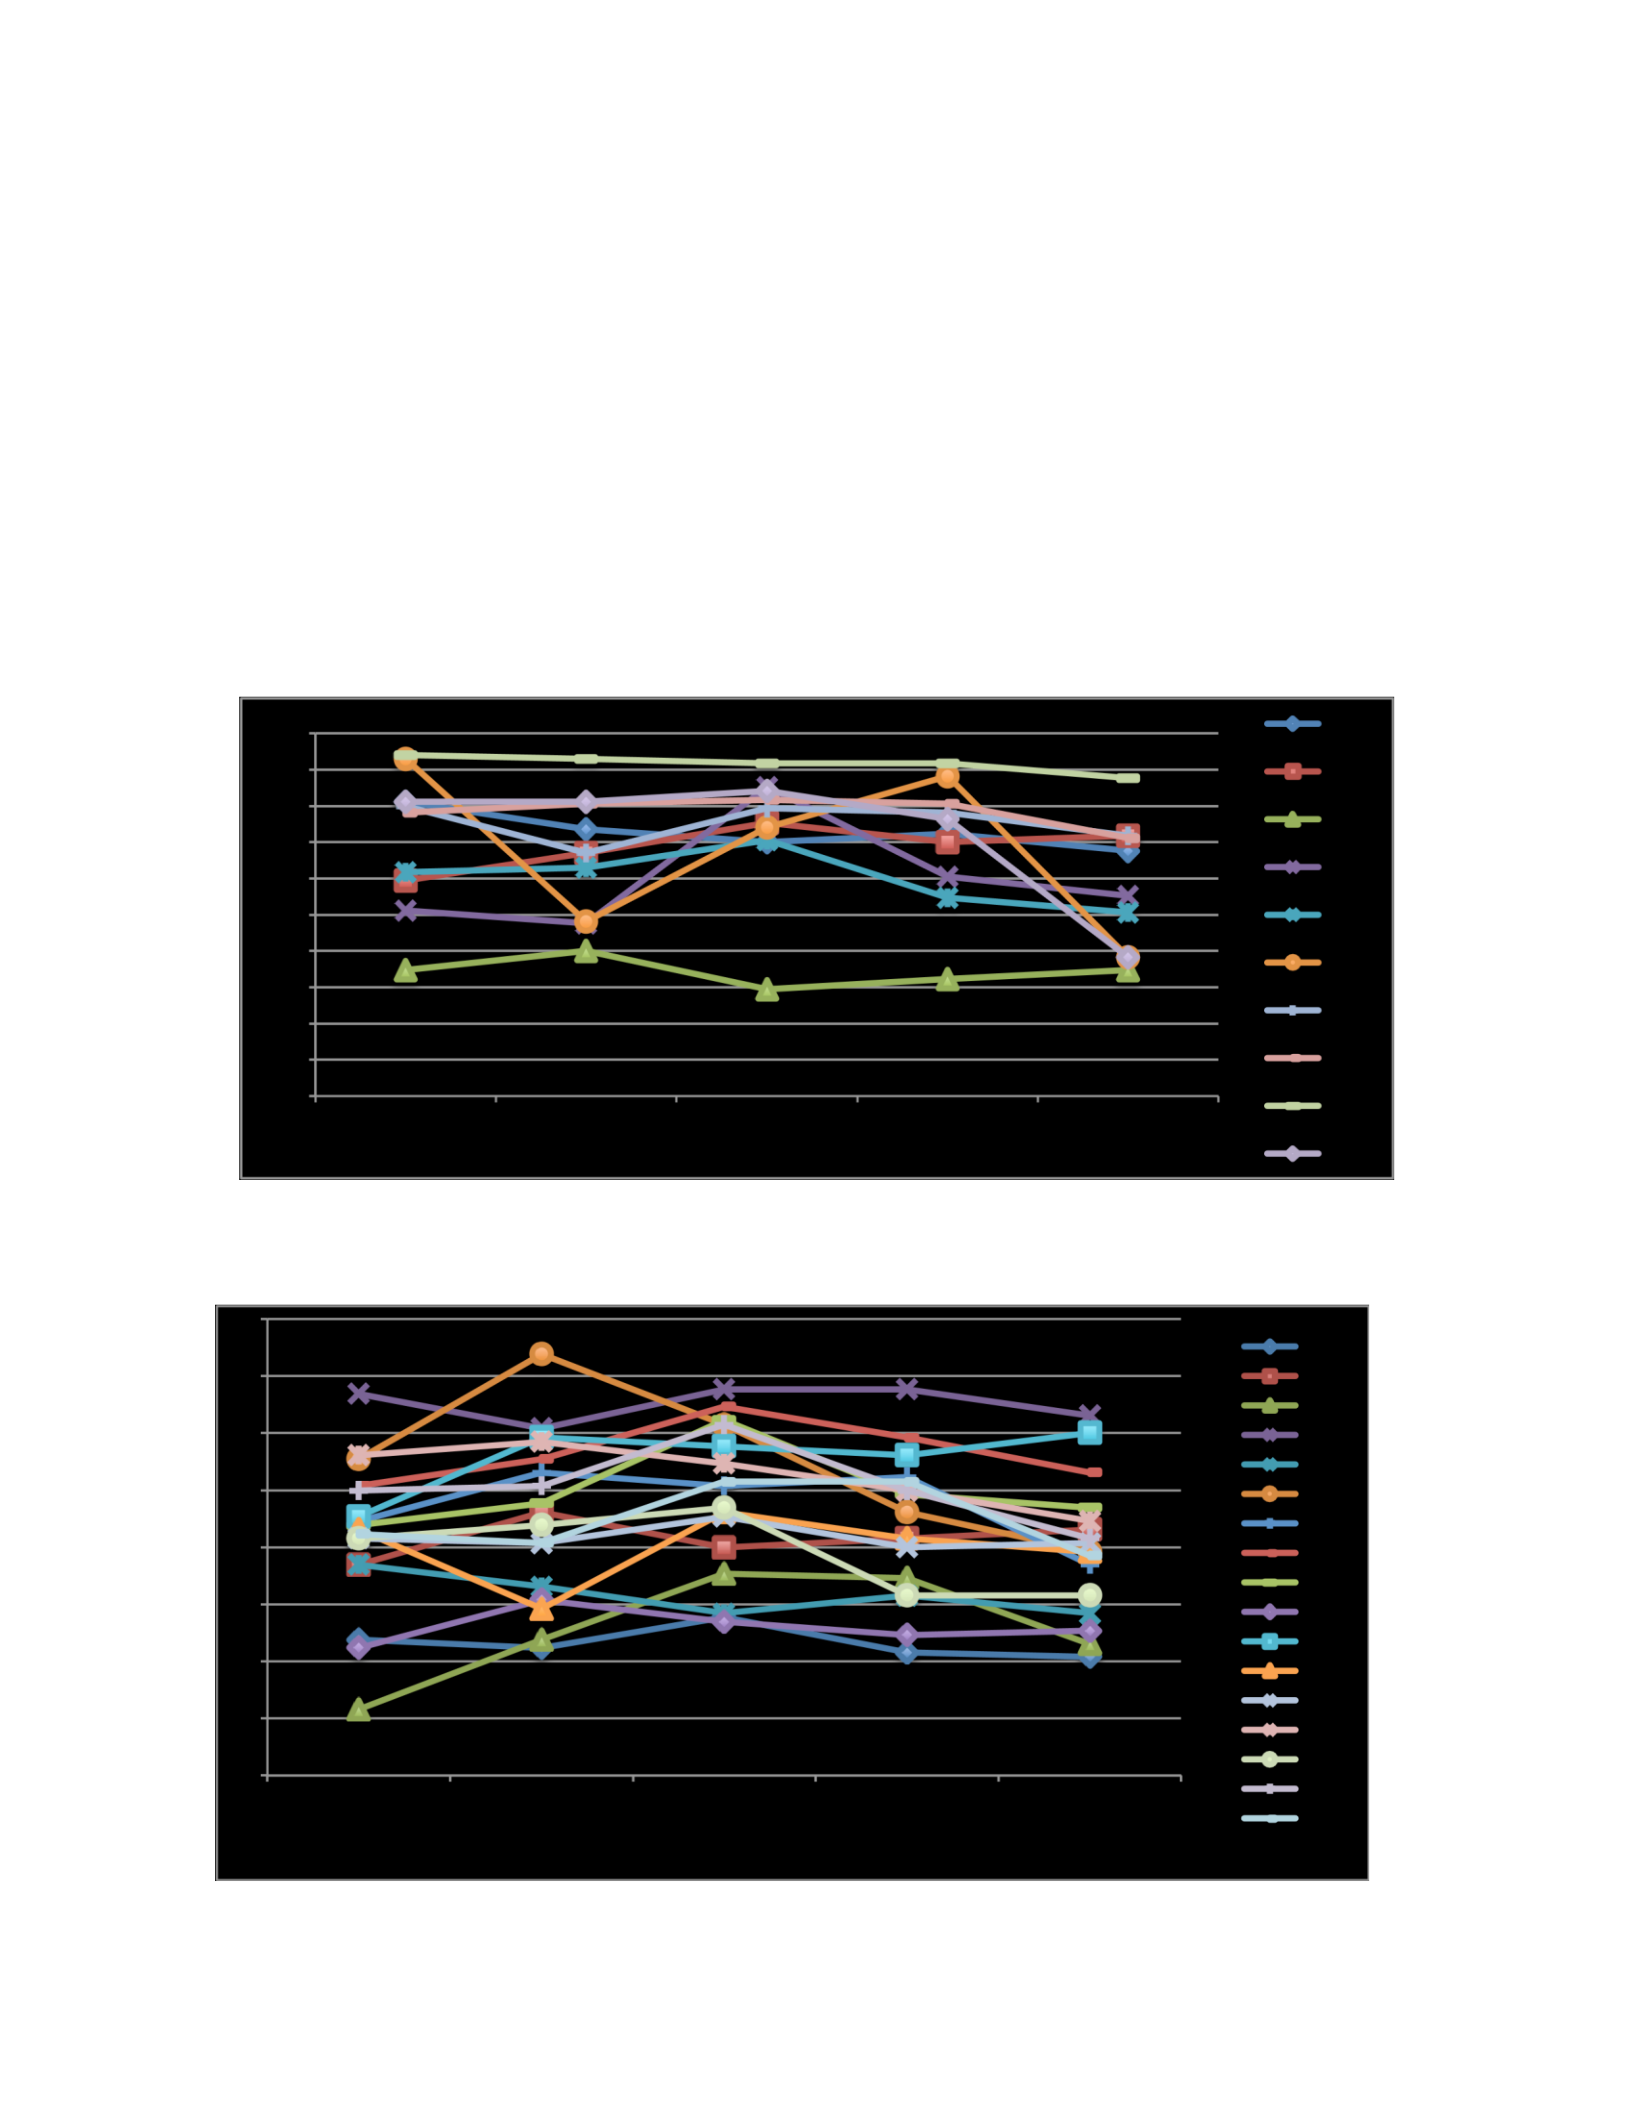
Previous authors have suggested various approaches for developing robust security awareness
(Peltier, 2005).
6.3 Security Breaches Can Influence Individual’s Values
The results of this study show that the differences among people’s perceptions were still available
even after they were exposed to security breaches. Figures 6.3 and 6.4 show differences in both
the alpha stage and the beta stage.
Figure 6.3: Perceptions of the whole participants regarding each security policy before the breach (level five
participants – the alpha stage).
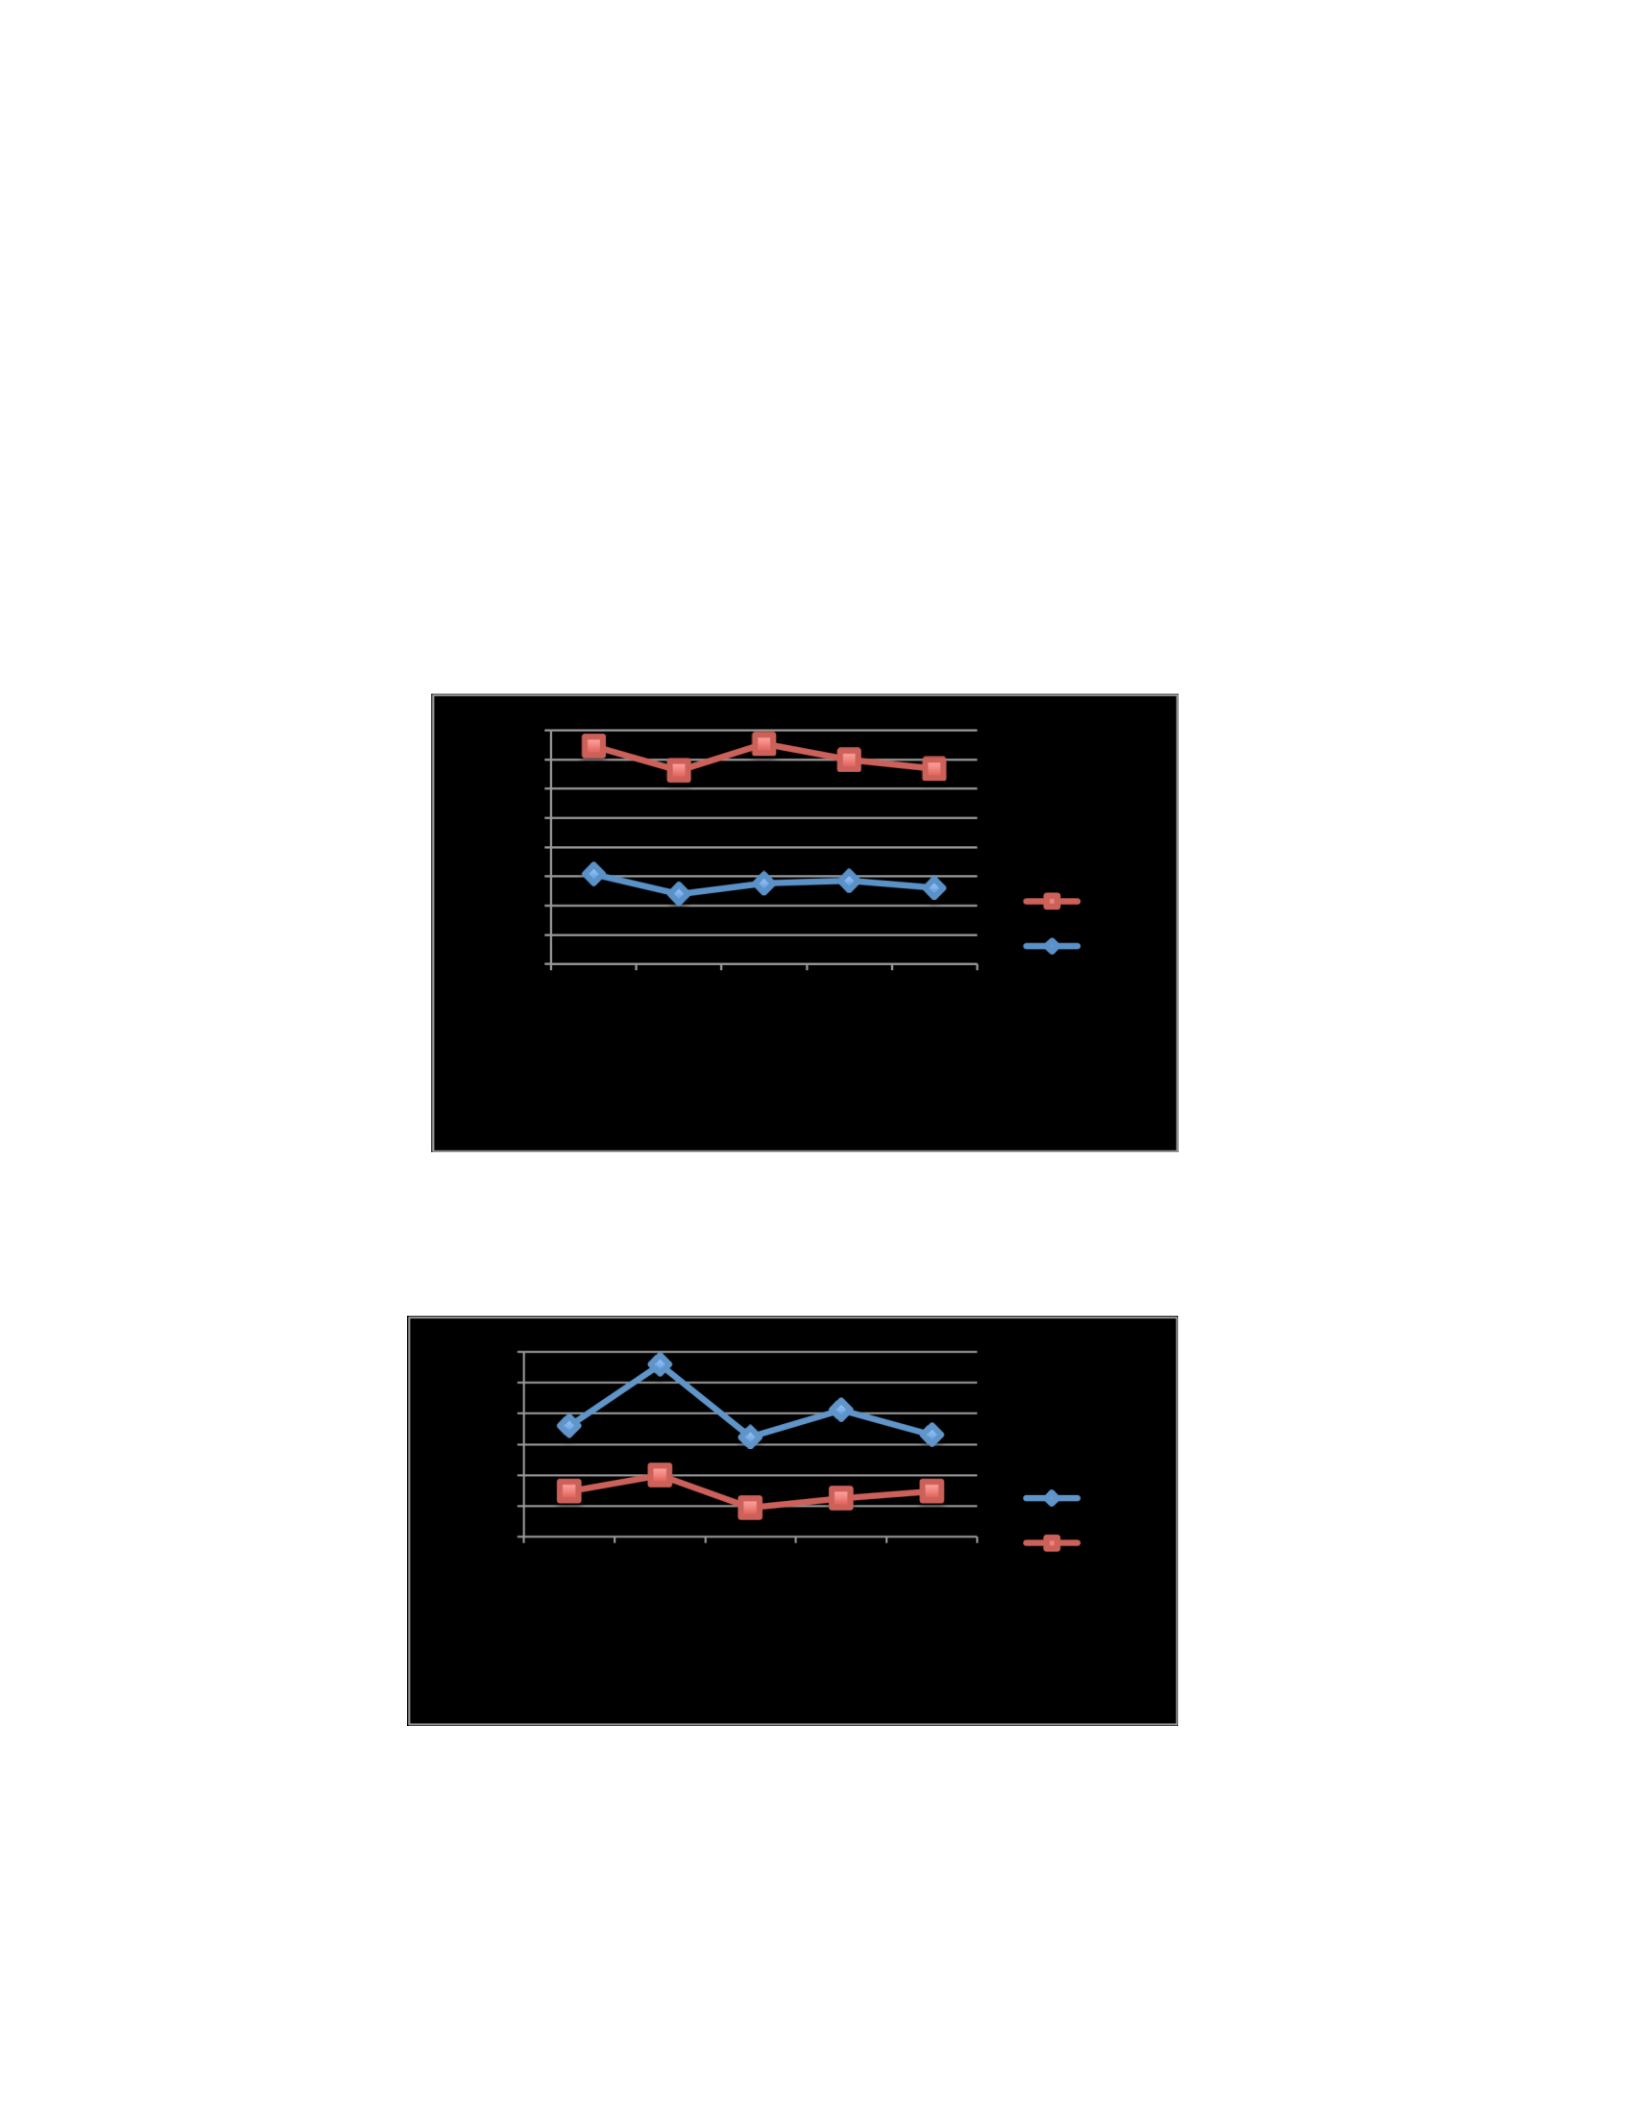
Figure 6.4: Perceptions of the whole participants regarding each security policy before the breach (level five
participants – the beta stage).
The figures above show the big deviations in the perceptions of the individuals regarding the
security policy. Indeed, this security policy does not shape their norms in the same way, even when
they have the same security policy.
Similarly, our results show that there is a deviation between an individual’s perception regarding
the security policy before and after the occurrence of a security breach. The deviation can be big
or small. Figures 6.5 and 6.6 provide examples of the individuals’ perceptions regarding the
security policy before and after the breach and the deviation in their perceptions.
Figure 6.5: An example of an individual’s perception regarding the security policy before and after the breach and
the deviation in his or her perception (the alpha stage).
Figure 6.6: An example of an individual’s perception regarding the security policy before and after the breach and
the deviation in his or her perception (the beta stage).
In some cases, the deviation in an individual’s perception may be in some of the policies, not all
of the five policies. That is, some individuals have the same perception regarding some of the
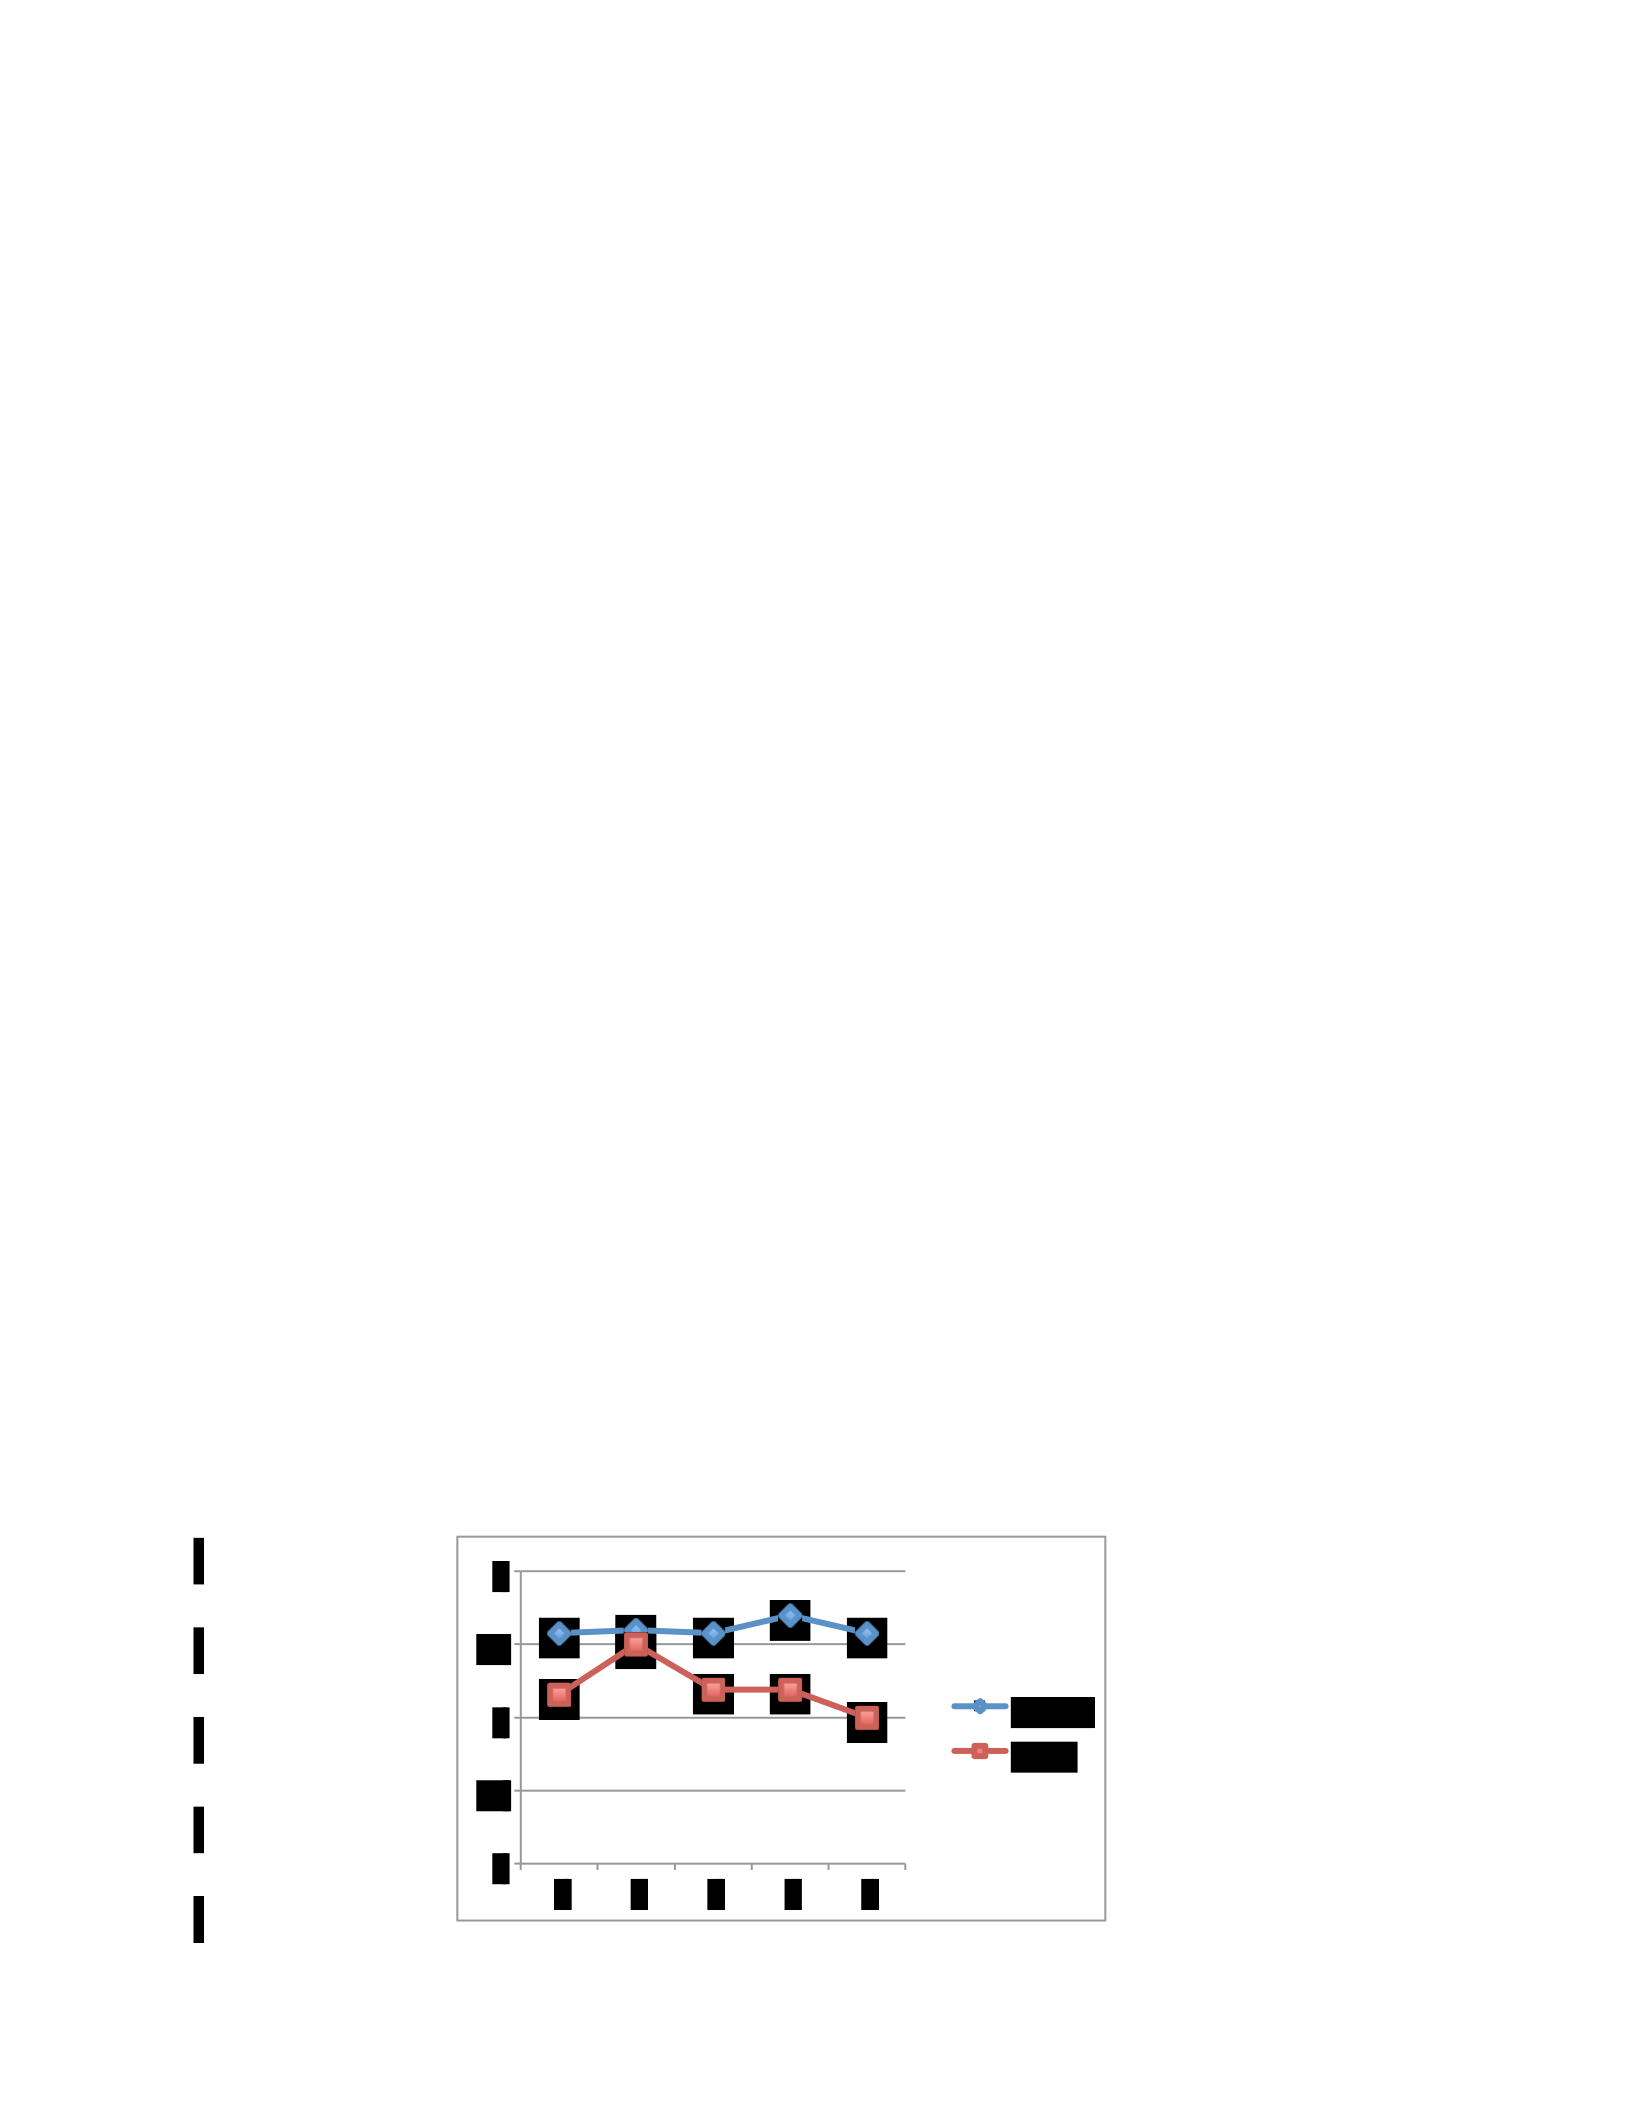
policies before and after the breach. Such cases can be linked to the type of breach the participants
were exposed to during the experiment. If the breach is not related to one (or more) of the five
policies, the perception of participants regarding that policy may be still the same before and after
the breach. For example, level 2 participants from the alpha stage were exposed to a phishing e-
mail security breach. Some of the participants within this group have the same perception
regarding the policy related to “information security roles and responsibilities,” which may have
less or no link to the phishing e-mail security breach. Figure 6.7 shows an example of participant’s
perception from level 2 groups who exposed to phishing e-mail. As can be seen from the figure,
his or her perception regarding “information security roles and responsibilities” policy is mostly
the same before and after the occurrence of the security breach. Also, level 2 participants from the
beta stage were exposed to a phishing e-mail security breach. Some of the participants within this
group have the same perception regarding the password policy, which can have less or no link to
the phishing e-mail security breach. Figure 6.8 shows an example of participant’s perception from
level 2 groups (from the beta stage) who exposed to phishing email in the beta stage. As can be
seen from the figure his or her perception regarding the password policy is mostly the same before
and after the occurrence of the security breach.
2
2.5
3
3.5
4
1
2
3
4
5
Before
After
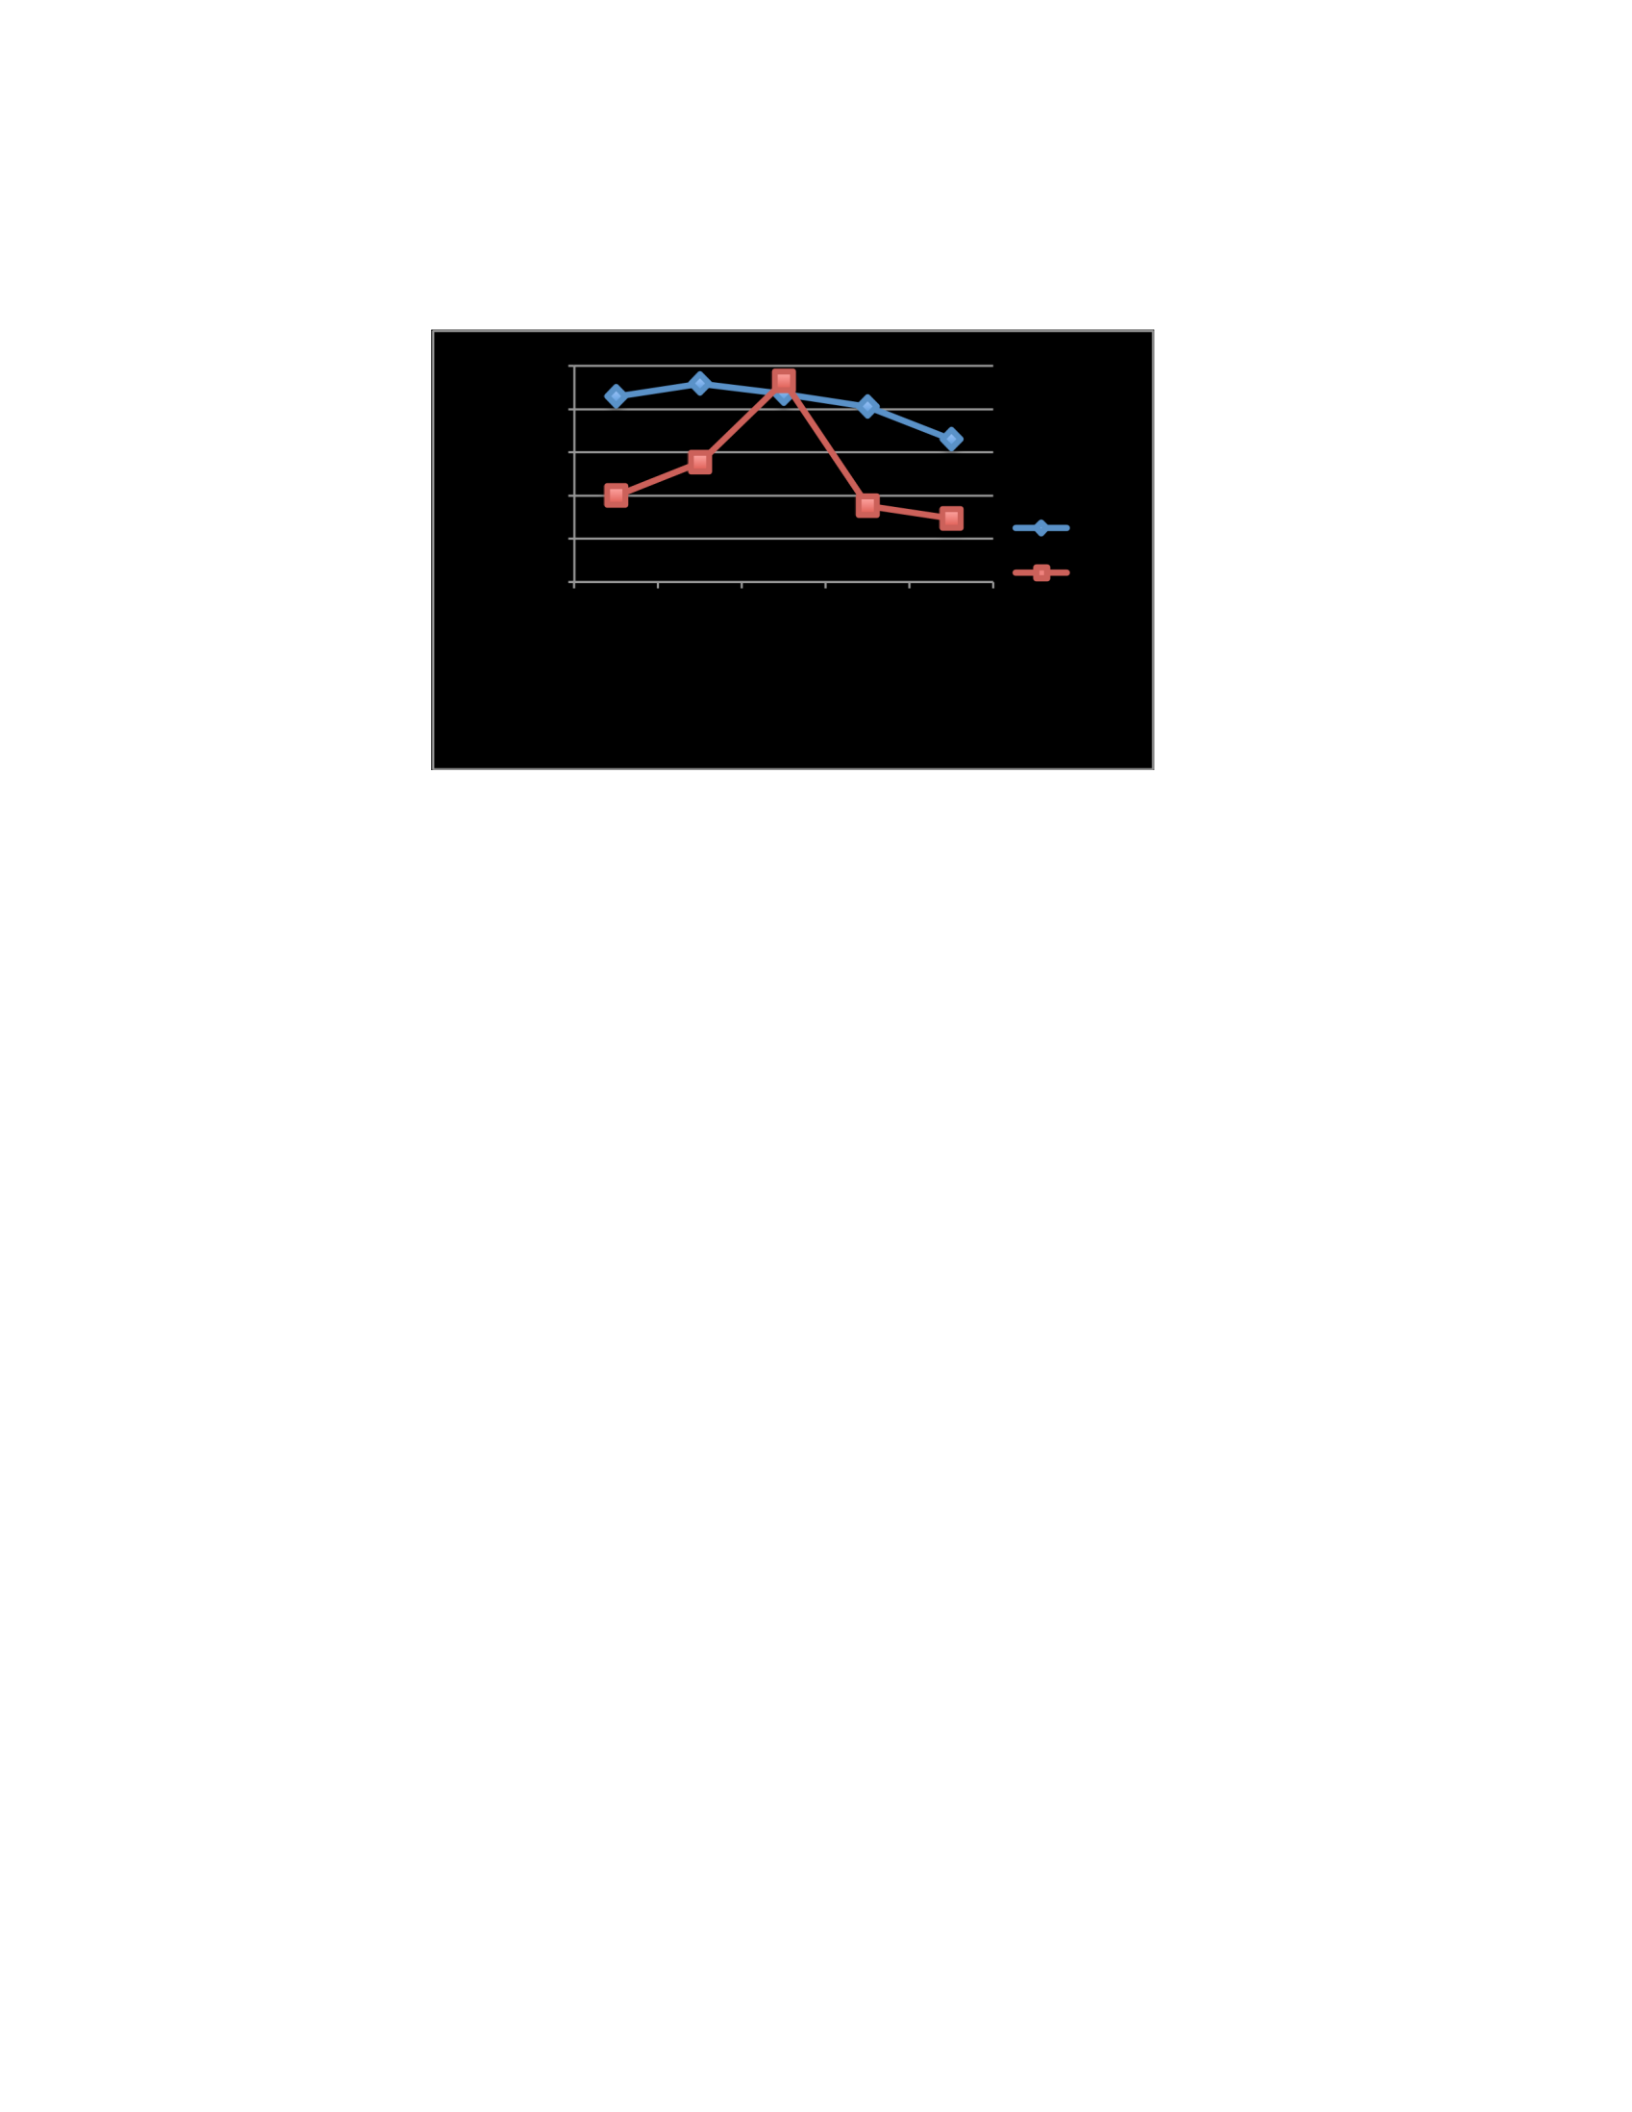
Figure 6.7: Example of participant’s perception from level 2 groups who exposed to phishing e-mail (the alpha
stage).
Figure 6.8: Example of participant’s perception from level 2 groups who exposed to phishing e-mail (the beta stage).
Likewise, other factors such as the experience of the individuals may have a significant influence
on the amount of deviation in an individual’s perception regarding a security policy. In some cases,
perceptions of individuals who have more experience tend to have less deviation than those who
have less experience. Figure 6.9 shows individuals from the same group who has the same security
policy and encountered the same security breach. This figure shows how the deviations between
the perceptions of each one before and after the breach differ in accordance to their experience.
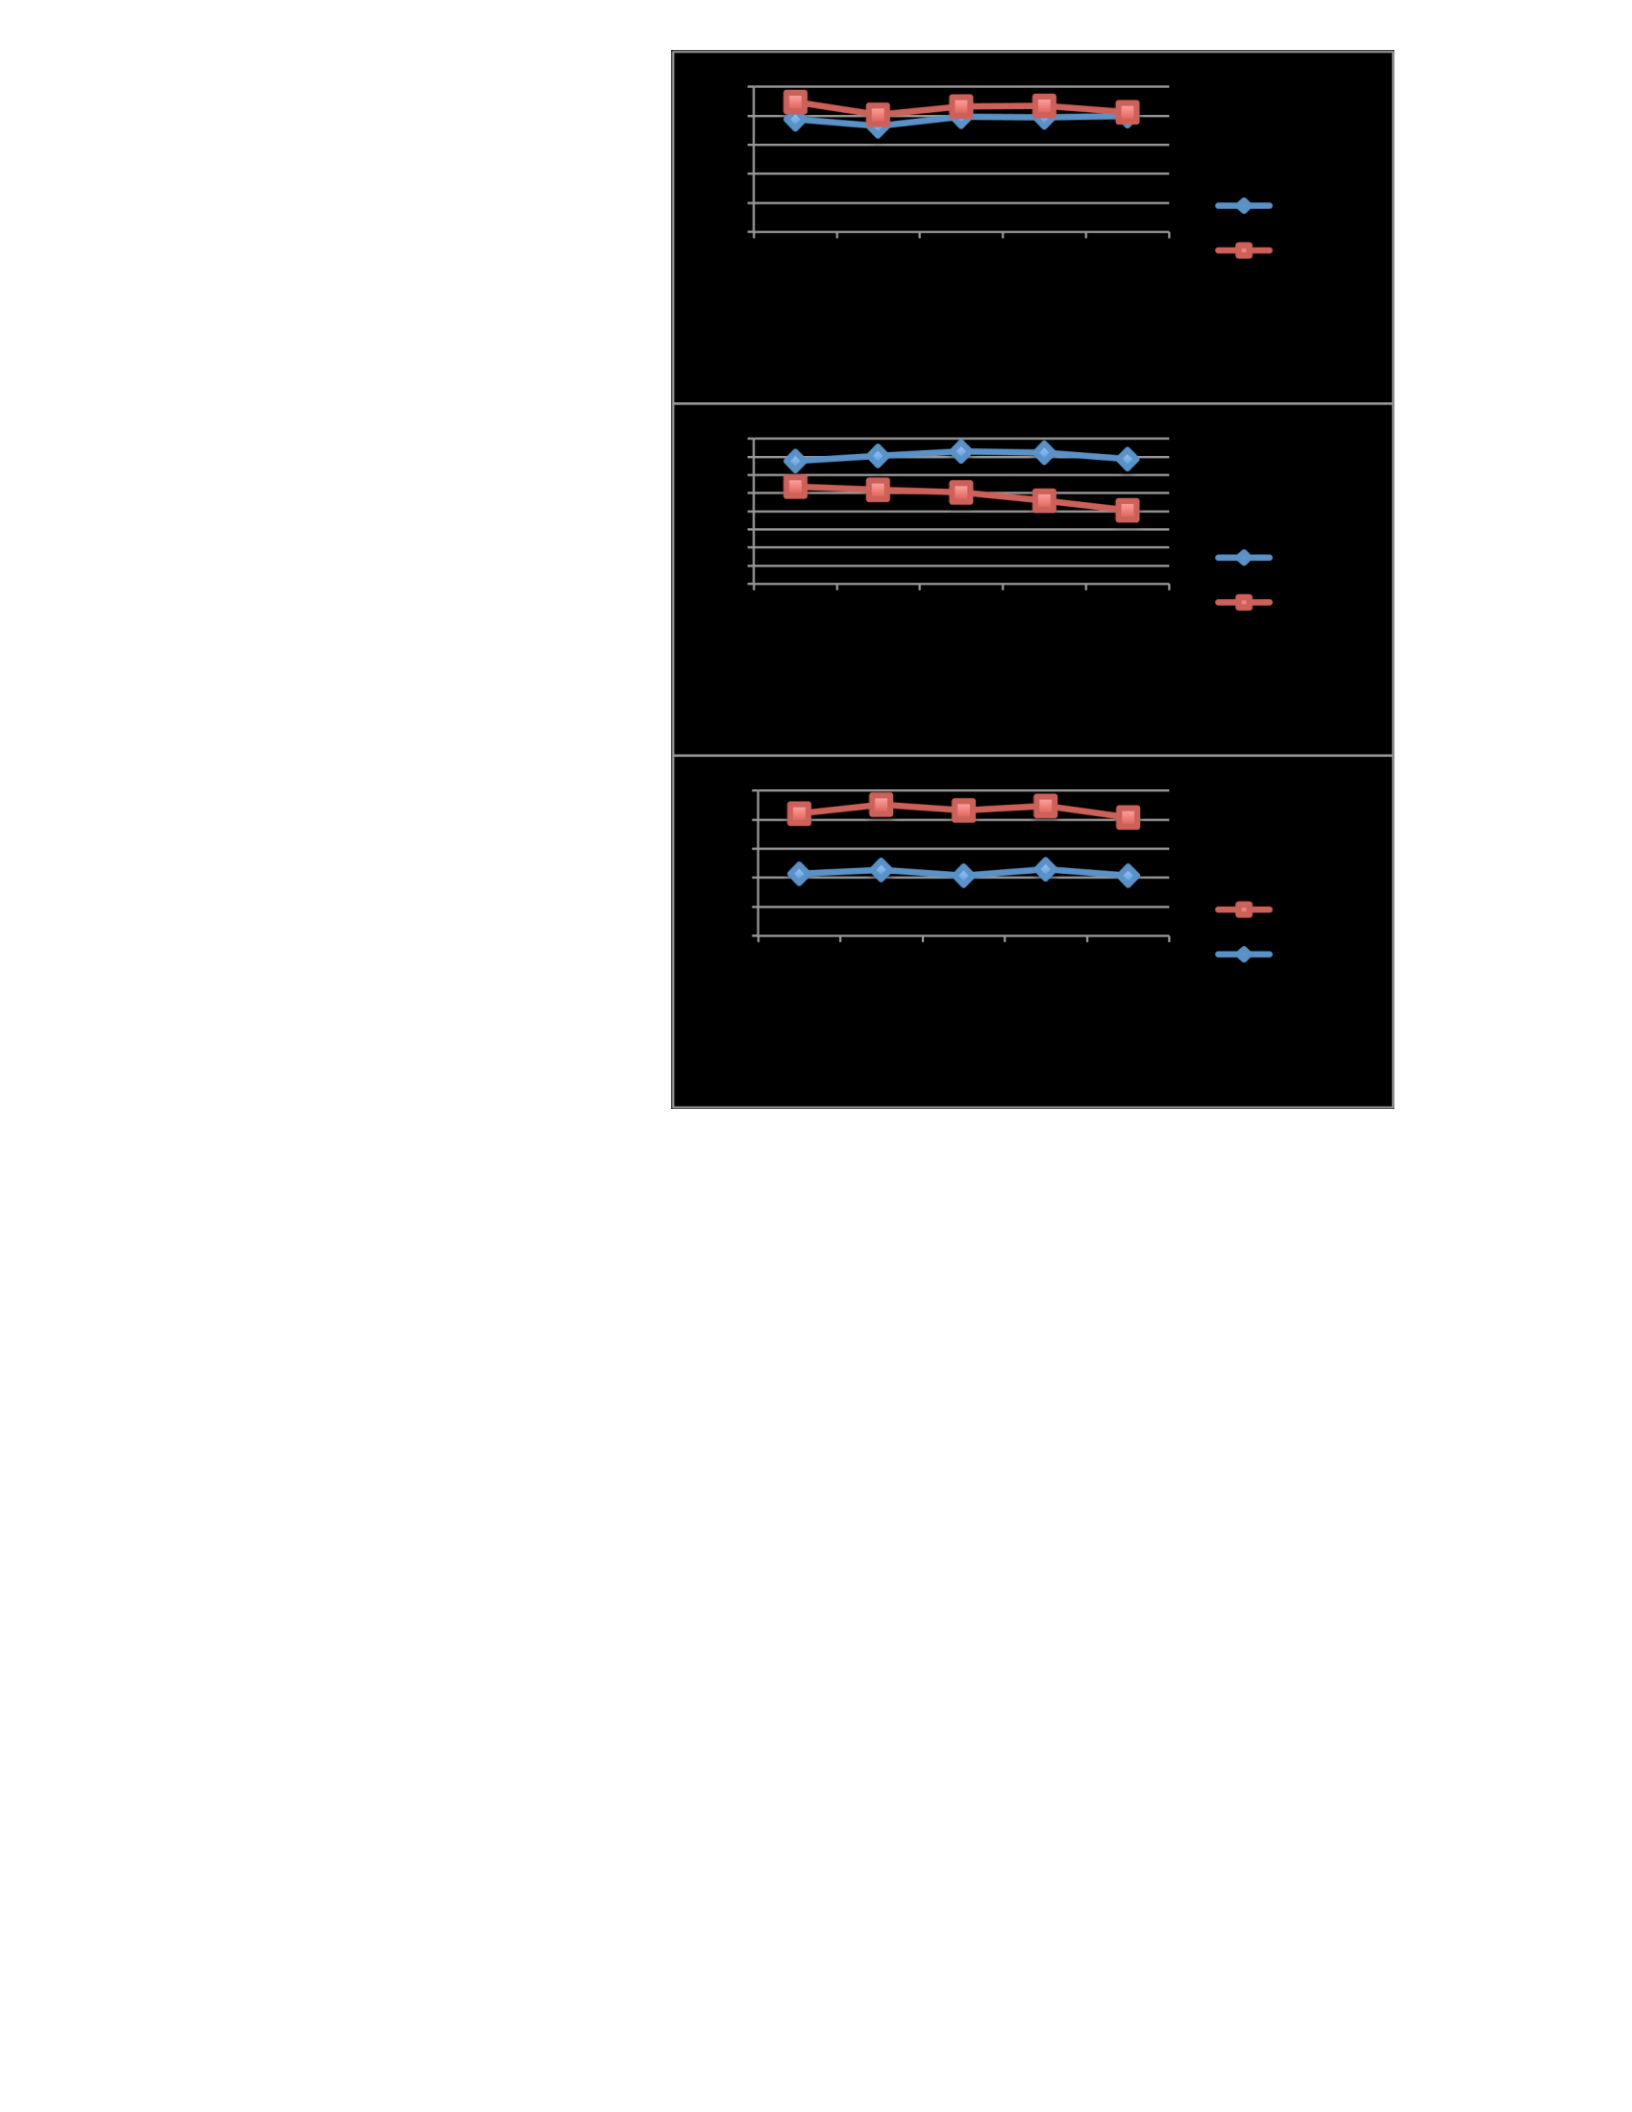
a) A participant with more
than 5 years of experience.
b) A participant with between
3 and 5 years of experience.
c) A participant with less than
3 years of experience.
Figure 6.9: different amount of deviations
in perceptions of individuals from the same group who has the same security policy and encountered the same
security breach.
The experience of an individual has an effect on the people’s norms (Venkatesh and Morris, 2000;
Thompson et al., 1996). When the experience of an individual increase, his or her norms change
in response to the change in his or her experience. Thus, the change in his or her norm will be
reflected on how she or he understand or construe the information security policy (Kelly, 1955).
6.4 Norm and Rule Compliance
As emphasized earlier, the mismatch between people’s perceptions raises the need for increasing
the clarity in understanding the information security policy among individuals to reduce or

eliminate the deviation in their perceptions. Organizations can employ awareness and training
programs to develop the clarity in understanding their information security policy. These programs
educate and inform employees about issues and concerns related to security policy and security
breaches. However, awareness and training programs may not change the way employees
understand or construe the security policy. Therefore, organizations need to design proper
awareness and training programs that can change how individuals construe the security policy.
With the aid of Repertory Grids, organizations can assess their employees’ perceptions through
concretizing, mapping, monitoring, evaluating and configuring their employees norms in order to
identify the relationship between norms and rules.
Organizations can use Repertory Grids as an assessment technique to understand the misalignment
between employees’ norms and security rules. Understanding the misalignment between norms
and rules can help organizations to design appropriate solutions for the problem of norm-rule
compliance. That is, organizations can ensure norm-rule compliance through changing the values
of their employees. Examples of solutions for the norm-rule compliance problem are designing
effective and efficient security policy, awareness and training programs that can change employees’
norms, and change management programs that can help in reducing the risk of norm-rule
compliance problem. Designing change management programs can be done through aligning the
security policy with the business. Thus, security and business can work together to achieve
business goals with little or no risk.
On the other hand, understanding the mismatch between norms and rules can help in ensuring the
effectiveness, efficiency, and efficacy of the information security policy through enhancing the
existing policies or developing new policies.
Using Repertory Grids as an assessment mechanism, which can aid in improving organizations’
security, can have other benefits. By the aid of Repertory Grids, “end-users” of the security policy
can engage in developing better security policy or improving the existing policy. Extensive studies

have emphasized the importance of user engagement (or involvement) and how it can play a
significant role in the success of any project (Lin and Shao, 2000; Wu and Marakas, 2006).
Damodaran (1996) points out that the user involvement helps in improving the quality of the
system, avoiding costly, unwanted system features, enhancing the system acceptance levels, and
allowing for better understanding of the system by the user.
Indeed, using Repertory Grid as an assessment mechanism is highly dependent on the user
involvement. As seen earlier, end-users (i.e. employees) could be interviewed to elicit the elements,
constructs or both to develop the Repertory Grid that can be used for the assessment. Then, after
agreeing on the final version of the Repertory Grid, the end-users rate the constructs against each
element. Also, organizations can use secuirty experts to elicit elements, constructs or both and let
the end-users to rate that grid. Thus, end-users can be involved in developing the
Repertory Grid, rating the grids, or both.
To sum up, the previous three sections answer our research question. The first section explains
how the security policy shapes the individuals norms. The second section clarifies how the security
breach changes and re-shapes the individuals norms. The third section describes how the Repertory
Grid can aid in identifying the relationships among the security rules and individuals, norms, and
how these relationships can help in assessing the norm-rule compliance. Table 6.2 summarizes
how each section addresses a research question through reconsidering the research
questions.
Table 6.2: summary of how each section answers a research question.
Research Questions
The Answers
RQ1
How does security policy
shape individual’s values in
the first place?
•
•
There is a noticeable difference between participants’
values.
Individual’s experience, age and security policy
maturity level govern the shaping of the values.

RQ2
How does a security breach
change an individual’s
values?
•
There is a noticeable difference between participants’
values, and between the value of each participant
before and after the breach.
•
The variance in the values is governed by the type of
breach and security policy maturity level, and other
factors like individual’s experience.
RQ3
What is the relationship
between the security policy
and an individual’s values?
•
RepGrid as a comprehensive assessment mechanism
can be used to concretize, map, monitor, evaluate and
then configure rules and norms.
RQ4
How could assessment of
norm and rule compliance
help in creating better
policy?
•
•
RepGrid can show where is the misalignment between
norms and rules.
By using RepGrid as an assessment mechanism,
endusers can engage in creating better policy or
enhancing the existing policy.
6.5 Summary
The objective of this chapter is to discuss the findings of this study, which was conducted to gain
an understanding of how individuals construe the security policy in their organizations and how
their perceptions may change in light of security incidents. The Repertory Grid technique was used
to analyze the data that were drawn from the two stages of the study.
The results show that employees from the same organization hold different perceptions regarding
the same security policy. Their perceptions also change in response to the occurrence of a security
breach. Other factors may also affect the shaping and re-shaping of employees’ perceptions such
as the type of security breach that individuals encountered and the experience of the individuals.
When the security breach, which individuals faced is related to some policies (and has no relation
to the other policies), the deviations in their perceptions regarding these policies may be greater in
comparison with the perceptions regarding the other policies. Also, this research proposes that
when experience of an individual increases, the deviation between her or his perceptions before
and after the breach decreases.

Accordingly, organizations need to understand the relationship between the norms of employees
and security rules. The Repertory Grid technique can aid in explaining this relationship, so
organizations can develop and design proper techniques to reduce or eliminate deviations among
employees’ perceptions, and between an individual’s perceptions before and after the occurrence
of a security breach.
Chapter 7: Conclusion
7.1 Overview
Information systems security is one of the most important issues that executives and management
deal with. Indeed, most violations to the information systems security are committed by employees
within organizations. Poor compliance with security policies mostly occurs because of the
misunderstanding of the actual meaning of the security policies, which may reflect the mismatch
between organization’s rules and individual’s norms. In fact, employees in the same organization
usually hold different perceptions regarding the security policies of the organization, which may
be reflected on their behavior (Vaast, 2007; Albrecthsen and Hovden, 2009).
This thesis investigates the perceptions of individuals regarding the information security policies
of an organization and how perceptions change in response to the occurrence of a security incident.
This research aims to answer the following research questions:
• How does security policy shape individual’s value in the first place?
• How does a security breach change individual’s value?
• What is the relationship between the security policy and individual’s values?
• How could assessment of norm and rule compliance help in creating better policy?
In order to answer these research questions, this research has employed the Repertory Grid

(RepGrid) technique that is grounded on the Personal Constructs Theory (PCT). The Repertory
Grid technique is a hybrid quantitative and qualitative technique that can be used to study the
people’s perceptions and the changes in their perceptions. This study adopted Sein et al. (2011)
Action Design Research (ADR) method, which depends heavily on the building and continuous
testing of the artifact within an organizational context to generate “prescriptive design knowledge.”
In this research, the Action Design Research method has been used to illustrate how the artifact
can emerge as a result of the interaction between technology and organizational context. Indeed,
ADR tends to solve a problem within an organizational context through building, intervening and
evaluating the artifact. This study involves two stages of the Action Design Research method: the
alpha stage and the beta stage.
The goal of the alpha stage is to build the alpha version of the artifact: the emerging norm-rule
compliance RepGrid that is continuously tested and validated in order to build the beta version of
the artifact. The beta stage aims to develop a beta version of the artifact. Thus, the alpha artifact is
tested and validated in the beta stage to develop the beta artifact; a more mature norm-rule
compliance RepGrid. A full Repertory Grid data collection and analysis was conducted for each
stage. That is, in each stage the constructs were drawn from the participants using RepGrid
interviews and the elements were supplied to the grids. Then, each grid in each stage was analyzed
using content analysis and the Principle Components Analysis (PCA). The results from the two
stages were discussed in chapter 6.
7.2 The Study Contributions
This research fits in the field of Information Systems Security, which falls under the discipline of
Information Systems. In the past, there was continuous growth in the research projects related to
various Information Security issues. However, most of these research projects have targeted

technical and organizational problems and concerns. There is a lack of research focusing on the
human aspects of the Information Security. Therefore, this research makes both research and
practical contributions.
On the research side, this research makes four contributions. First, to our knowledge and from our
literature review, this research is the first study to explore how people’s perceptions are shaped by
the security policy of the organization and how their perceptions changed in response to the
occurrence of any security incident. Thus, understanding the shaping and re-shaping of the people’s
perceptions (and thus people’s norms) in the light of the security policy and security breaches may
contribute to the improvement of the information systems security compliance.
Second, this research has adopted Kelly’s Personal Construct Theory (PCT) and Repertory Grid
technique. Using Kelly’s Personal Construct Theory (PCT) and Repertory Grid technique is a
critical step toward understanding the people’s perceptions and values. Understanding people’s
values through Kelly’s cognitive mapping (Repertory Grid) will open the door to various research
projects that concern about studying one of the most important human aspects, namely personal
values. Adopting Kelly’s Repertory Grid technique is an important methodological improvement
in the field of Information Systems. This technique allows for measuring the cognitive constructs
of the individuals by measuring their perceptions.
Third, this research uses the Repertory Grid technique to investigate the people perceptions
regarding the security policy. Adopting this method in this study demonstrates that the Repertory
Grid is suitable technique to be employed by non-psychological scholars to investigate the people’s
perceptions. Repertory Grid technique is a friendly, easy-to-use technique that motivated
researchers from different disciplines such as information systems, information technology or
engineering to develop research project (or parts of a research project) regarding people’s
perceptions and values.

Fourth, this research adopted a combination of Repertory Grid technique and Action Design
Research (ADR). This combination has allowed the researcher to develop more mature artifact for
assessing people’s perceptions and values.
The main practical contribution for this research is the use of the Repertory Grid technique to
understand the relationship between the individual’s norms and the security rule of the
organization. Understanding such relationship will allow organizations to develop better normrule
compliance through the development of better policy and designing appropriate awareness and
training programs to create a sync between norms and security rules and standards. Thus, with the
aid of Repertory Grid, organizations can investigate and understand how their employees perceive
security policy and how their perceptions change in response to security incidents. Indeed,
organizations can create a simulation evaluation (like what we did in this study) to evaluate the
perceptions of the employees and to identify where is the misalignment between the norms and the
rules instead of applying this assessment after the occurrence of a real security breach.
7.3 Limitations
This research has some limitations. First, this study conducted in the settings that simulate real
organizations. Each session lasted for two to four hours, including the two rounds of the rating and
the introduction of the security breach. The small time difference between the first rating (before
the breach) and the second rating (after the breach) may affect the difference between the
perceptions before and after the breach. This limitation can be avoided in the third stage (not
included in this study) when the experiment is applied to a real organization.
Second, this study points out to the effect of the age and experience on the level of deviation
between an individual’s perceptions before and after the occurrence of the security breach.
However, this research does not consider whether there is a correlation between the individual’s

age and experience, or whether that relation (if valid) has an influence on the divergence between
an individual’s perceptions before and after the security breach.
The third limitation is related to the use of Repertory Grid technique and the difficulty of retesting
the people’s perceptions. Kelly emphasizes that individuals are oriented to the future more than the
past. They behave based on their anticipations of events. Individuals learn and improve from the
experience they get over time (Kelly, 1955). Accordingly, their values and constructs may differ
over time, making the retesting of perceptions difficult.
7.4 Future Research
There are some recommendations for further research to extend the findings of this study. First, a
third round of this study should be conducted following the Action Design research (ADR) method.
In the next round, the experiment should be conducted in a real organizational setting in order to
get the final “conceptual” artifact. The researcher will apply the learning from the previous stages
to real organizational settings in order to design the final artifact, which may be a solution to a
specific problem. Indeed, both the solution and the problem can be generalized (Sein et al., 2011).
Second, this study examines how a security policy shapes perceptions and how perceptions differ
in response to a security breach. It also studies the effect of some factors, such as age and
experience, on people’s perceptions. This study has been conducted on one type of organizations.
Further study may consider applying the artifact on different kinds of organizations to examine the
effect of different factors such as the size of the organization, the culture of the organization, and
the geographical location on the shaping and reshaping of people’s perceptions, and on the
relationship between norms and rules.

7.5 Summary
This dissertation addresses an important issue related to information systems security that can be
considered as one of the major concerns to the security of the organization. It investigates how
security policy shapes the people’s perceptions and how their perceptions change in light of the
occurrence of a security breach. Also, this research suggests an assessment mechanism to assess
the relationship between an individual’s norm and security rules and standards.
This research study contributes to the information security literature through investigating the
shaping and reshaping of the individual’s perceptions and norms, and through understanding the
relationship between norms and rules. The results of this research study do not only offer a starting
point to many research opportunities concerning human aspects within the field of information
systems security but also provide a basis for management to evaluate and understand individual
values in order to develop a more suitable security policy which will ensure more
robust security for their organization.

