


5
Chapter I : Introduction
Continued economic turmoil shapes international trade and influences
international political discourse. States utilize trade in order to increase their international
leverage and promote ideals of economic and political interdependence between states.
For this reason, commerce is fundamental in the promotion of state transparency: it
ensures continued economic discourse and advances economic and political dialogue.
Transparency is crucial in an anarchic international setting, for it allows states to
better engage other state actors, and it eases political dialogue. Moreover, transparency
furthers state goals and allows them to correctly predict the behavior state actors may
take, in such a way an international contract might. However, the risk of transparency
relies on an efficient way to measure and account for corruption and the information
provided. Without an objective means of measure, it is hard to distinguish what the
causes and ramifications of promoting trade between democratic and non-democratic
entities might be.
Increased trade between states promotes the practice of transparency, advancing
on an international level the democratization and, internally, the growth of government
trust and honesty. Trade pushes for economic and political transparency as a way to ease
and facilitate commerce between state actors. Furthermore, it functions as a catalyst: an
increase in trade encourages greater transparency in order to ensure that continued
commercial activity occurs in a manner which is safe and not susceptible to interruption
due to government collapse, corruption, or other factors which nontransparent states

6
face.
The goal of the thesis is to analyze how increased trade with democratic states
affects state transparency. An understanding of the effects of economic means of political
discourse is essential in discussing the evolution of international relations theories. The
evolution and search for peaceful means to achieve state economic expansion promote
the ideals of trade as a means to an end.
A theoretical framework will also be necessary in order to cement core concepts,
which will propose a viable and objective analysis of the information and its sources.
With this in mind, I have chosen to utilize neo-liberal theory, as presented by Friedrich
von Hayek, to help define key concepts necessary to understanding the interplay of trade
and transparency. Economic interdependence, laissez faire policies and other elements of
liberalism will be discussed on a theoretical standpoint, as they shape the current
international market. The goals set forth by neo-liberal ideology support the scope of the
analysis, and in conjunction with classical economic theory, they provide evidence to
support the findings. The uses of concepts emanating from classical economic theory also
serve to better understand the data and to define trade in relation to transparency.
Defining democracy must also be clarified in order to provide an appropriate
context and to differentiate the potential trade agreements and demonstrate the findings of
the thesis. A further theoretical analysis, supported by objective data collected by
international organizations, such as Global Democracy Ranking and Freedom House, will
help to distinguish and organize a compendium of data to support the notion of which
states are to be considered democratic. Identifying which states are and should be

7
considered democratic and what this entails is extremely important in accounting for
errors due to potential selection bias in the examples that will be used. Furthermore, the
theoretical framework will aid in rendering an opinion based on objective evidence
translated into a cross sectional regression analysis.
I will also define trade in accordance to specific qualities: I will analyze both the
overall amount of GDP (Gross Domestic Product) trade and the type of goods in order to
ensure that both value and type are defined. What the thesis will analyze is reliant on
increases or decreases in trade. To ensure the least possible bias, trade will be measured
initially as a comparable currency value, in an effort to facilitate the measurement of
potential flux in the state's exports and imports.
The type of trade will also be relevant as a comparable source of the actual
amount of increase in trade: as certain goods trade for unequal amounts, such as the
difference between the values associated with agricultural and prime resource goods, it is
important to quantify the value of trade to ensure that currency values and currency flow
do not alter the findings of the study.
In defining the criteria to identify transparency, I will address a further concept
crucial to the study: this will use the qualities of government corruption, access to
information and governmental structure to analyze how transparent states act towards one
another. An example of a measure that accounts for these factors can be found in the form
of the International Transparency Index as proposed by Transparency International.
Key examples that I will discuss include the ongoing North American Free Trade
Agreement; United States and Chinese/Japanese economic and political relations; the

8
foundation of the European Union and its promotion of trade and transparency; and the
North African Trade Association. I will further address international treaties; the role of
economic partnerships in ensuring diplomatic means of conduct between states; and the
role of the government in mediating economic discourse, all of which will demonstrate
how state transparency is promoted by trade. The thesis moreover will explore issues the
United States, African States, China, Japan and the European Union face due to factors
such as trade tariffs, quantitative easing, economic treaties and issues of trade with
corrupt states.
Trade in fact can promote political and institutional changes in member states that
choose to participate. The ability to promote democracy, in turn, can advance ideals set
forth by the democratic peace theory, as proposed by Michael W. Doyle, relating to the
cessation of war between states due to their political structure.
The core concepts which will be discussed in the thesis must be defined within
certain parameters if they are to be used as objective variables. For this reason, having
succinct definitions of each is crucial to furthering the study of the interaction between
trade among democracies and transparency.
The concept of international trade derives from the exchange of goods between
states. Much more so, trade can be described in its overall monetary value, its labor
intensity, its gross production and its effect on government GDP (Gross Domestic
Product). Due to these multiple values, I will, for my thesis, focus on trade as overall
monetary value of exports and imports, while using overall production and use
International Production Fragmentation Theory to explain gross production and the

9
technical feasibility of certain states to produce certain goods (Jones, 2000). By using a
specific and modern conception of the international trade market and its underlying
mechanisms, I hope to address biases that may originate from the diverging theories of
trade and better explain the findings within a theoretical and quantitative approach.
Another focal variable within the thesis is transparency, which must be carefully
defined to ensure consistency with the findings. Of the elements which can be used to
measure government transparency, I choose to focus on the parameters set out by
Transparency International. Of these, I will focus mainly on using the Corruption Index
presented by Transparency International. I will use their measurements of access to
government information, form of government and state action visibility as additional
parameters (www.transparency.org, 2014). The use of these features and Transparency
International's corruption index will allow for an objective measurement of the variable
tied to transparency.
The final variable which must be defined clearly and concisely is democracy. Due
to its ancient origin, deriving its meaning from the ancient Greek words demos (people)
and kratos (power), it is understandable to utilize a modern evolution of the terminology
to best incorporate a parameter of objectiveness in its measurement (Wilson, 2006) . I
choose to utilize Tony Smith's definition of democracy, stating democracy as :
a political system institutionalized under the rule of law, wherein
an autonomous civil society, whose individuals join together voluntarily
into groups with self-designated purposes, collaborate with each other
through the mechanisms of political parties and establish through freely

10
contested elections a system of representative government (Smith p.13,
1996).
While other theories of democracy exist, many incorporate an aspect of corruption within
the definition, which may cause a selection bias in the data when analyzed. It is for this
reason that Smith's definition is useful for the argument proposed for the thesis, as it
simply analyzes the structure and intent of a democratic system.

11
Chapter II: Literature Review
To define and arrive at a common understanding of what is meant by
transparency, Kristin Lord's article “The Surprising Logic of Transparency” is used to
provide insight, from an International Affairs framework. In accordance to their study, the
definition which shall be used is : “transparency, defined as mechanisms that facilitate
the release of information about policies, capabilities, and preferences to outside parties”
(Lord 1999, p.315).
Antonio Argandoña's article, "The United Nations Convention against Corruption
and Its Impact on International Companies." provides valuable information relating to
transparency and how it affects corruption in the private sector (Argandoña 2007).
Because my thesis will focus on state entities, the role of NGOs and companies in
international trade will not be discussed here.
Argandoña posits that an international effort to reduce corruption must work to
ensure transparency between companies and investors. While the information at hand
analyzes the necessary framework for companies, Argandoña's work allows for the
importance of the interaction between transparency and corruption.
Kaufman argues in his journal article, “Toward Transparency: New Approaches
and Their Application to Financial Markets,” that transparency is a requisite for
international market expansion and the advancement of policy aimed at increasing
organizational and state transparency is crucial to an increase in trade (Kaufman, 2001).

12
It is important to note that Kaufman’s argument acknowledges that while
transparency is a key facet to increased trade, it faces a limiting factor: the difficulty of
enforcing legislation aimed at increasing transparency sheds light on an issue of national
reform. Kaufman concludes that transparency in relation to NGOs and transnational
organizations alone is not sufficient: rather the government must promote transparency
through regulation and political transparency.
As Kaufman states, “Subsuming more specific recommendations on transparency
in financial markets, made earlier in this article, are therefore broader imperatives to
improve transparency in governance” (Kaufman 2001, p.55).
The fact that transparency is seen as imperative to the discussion of economic
expansion supports the notion that it correlates to trade. While Kaufman proposes that it
does so by promoting trade, the argument can also be made that it is rather increased
trade that leads to transparency. The use of classical economic theory by Kaufman also
provides indispensable insight on the importance of economic theory within this research
topic.
Marcoullier presents further evidence of the negative effects of non-transparency
upon trade in his article “Insecurity and The Pattern of Trade: an Empirical Investigation”
(Marcouiller, 2002). His argument is that insecurity when trading raises the cost of
product, which in turn constrains trade.
He concludes that transparency allows for the lowering of costs, which in turn
provides evidence in support of the causal relationship between trade and transparency.
Similar to Kaufman’s' argument, Marcoullier identifies a strong correlation between the

13
two variables. While Kaufman and Marcoullier attribute transparency as the causal
element relating to trade, the fact of defining what is meant by trade and the effects of it
are crucial to concluding that this may actually be the opposite.
In Francis Hassan paper “Dynamic Relations between International Equity and
Currency Markets: The Role of Currency Order Flow”, the literature review sets out to
demonstrate how information tied to currency markets tends to alter the international
currency market. Their scope is to use various other economic studies in order to prove
their hypothesis:
there are important, yet not well understood dynamic relationships
between international equity and currency markets and that these are
driven by information spillover via the mechanism of currency order flow
(Hassan pg.1 2006).
The article aims to fill in gaps in previous research by using various studies to
identify and label concepts relating to how trade is defined. Currency fluctuation is
important in that it accounts for error. Hassan's article also allows us to see how aspects
of international affairs theory are being used in conjunction with theories presented by
classical economic theory.
The paper in fact “contributes in several ways to the international finance
literature, in general, and, in particular, to the literature that examines the
interdependency between international financial markets” (Hassan pg.6 2006).
The use of Jorion's research on “The exchange-rate exposure of US
multinationals” sets up an empirical approach and promotes a means to measure data

14
quantitatively, which may then be aggregated to findings and previous research (Jorion,
2001). Similar to the ideals set forth by Antonio Argandoña's article, Jordon’s discussion
of the parameters by which multinationals trade helps prove the necessity of transparency
within the international market. While the role of multinationals is fundamental to
international trade, this shall not be discussed within the thesis.
Evans and Lyons (2002) work, “Order flow and exchange rate dynamics,” can
further help us assess the validity of information and the transparency of the data in use.
Their pivotal article explains how currency fluctuation and a lack of transparency affect
trade: “unexpected currency order flow is the vehicle that transmits information between
markets” (Lyon et al pg.175, 2002).
By using the research set forth, Francis B. comes to define currency flow as “the
net purchase of a foreign currency” (Francis pg.170, 2002).
A further study by King, Sentana, and Wadhwani also serves in comparison to
define the effects of shifting currency markets. Criticism of the methods used to gather
information and set up the studies becomes an area of interest, leading to the further
question of:
...how well the linkage(s) from currency to equity markets is understood,
even though considerable effort has been expended in establishing this
relationship(s) (King pg. 22, 1994).
The construction of this paradigm ensures a theoretical framework and explains
the definition chosen for the terminology in relation to the scope of the thesis.

15
A study conducted by Bollerslev in his article “Intra Day and Inter Market
Volatility in Foreign Exchange Rates” is used to create a theoretical foundation to explain
and specify what the effects may be and to begin to define the concept of currency and
trading information transfer. The importance of understanding how economic
transparency may affect political transparency helps explicate the argument that
contradicts the findings suggested by Kaufman. Bollerslev presents data, taken over time,
which suggests that the initial factor which occurs is trade rather than transparency
(Bollerslev 1990).
Rajamaran's article “Fiscal Transparency” demonstrates the effects that the IMF
and large banking industries' regulations may have on a state, in this case India, which
may initially seem transparent (Rajamaran 2002).
The use of technical language to describe the actions national banking industries
and international NGOs take to ensure transparency once again demonstrates the cross
field area of study. As Rajamaran states “The RORB (Reserve Bank of India) correctly
distinguishes between fiscal transparency, macroeconomic fiscal balance, and
microeconomic fiscal efficiency, in the following words:
Fiscal transparency is quite distinct from these two important aspects of
fiscal policy since it focuses on the more limited issue of whether
sufficient information on the fiscal situation is being provided in a timely
fashion to enable observers, including especially financial market
participants, to make an accurate assessment of the under-lying fiscal
position(Rajamaran 2002, p. 4882).

16
By providing a technical definition of transparency in terms of financial and
economic concepts, Rajamaran provides insight into classical economic theory and a
comparable definition to match international affairs theory of government transparency.
In order to prevent a bias caused by tariff barriers, the importance of regional
trade entities must be acknowledged. Rose's article “One Money, One Market” introduces
tariff barriers and the unification of currencies as elements that should be considered
when analyzing trade patterns between states. The existence of trading blocs and other
organizations, such as the IMF, that regulate and create provisions to limit trade are
crucial in understanding how trade distribution may occur on a global scale (Rose pg.133,
2000).
As regional entities must be considered, so must the work of IGOs which impact
how trade and legislation relating to commerce occur. Glennerster and Shin's article
“Does Transparency Pay?” develops a theory which promotes transparency through the
work of the International Monetary Fund (IMF) (Shin pg.211, 2008). Shin et al posit that
countries that face lesser tariffs, and thus lesser costs of trade and facilitation, tend to
become more transparent to continue on benefiting from trade legislation which favors
ease of trade. As their findings suggest,
We further find that there is a diminishing marginal benefit of
transparency; that is, countries that start out the least transparent gain the
most through the reforms. In addition, there is evidence that increased
transparency is particularly beneficial for countries with smaller and less

17
liquid debt markets where, we conjecture, market participants have less
information initially. (Shin 2008, p.206)
The importance of these findings puts forth thought to how developing states must
be treated when analyzing data sets. Due to the fact that they may draw the largest benefit
from transparency due to increasing trade, Shin presents a potential bias to our study.
However, Shin does point out that an initial lack of information in smaller markets may
be a reason for why transparency may initially be a requisite to increase trade.
Xinyuan Dai presents in his article “Political Regimes and International Trade: the
Democratic Difference Revisited” evidence that ideological differences do not dictate
how states choose to trade.
The elimination of governance as a defining factor for the choice states make with
whom to trade is crucial to eliminate possible other factors that may decide why states
choose to trade with each other (Dai 2002). In turn, the fewer factors that decide and
alter trade statistics, the stronger the correlation that can be derived from the effect of
trade on transparency.
Rather than promote government change, the argument that trade promotes
transparency is strengthened by Xinyuan's findings:
Regardless of the preferences of the decision makers, pairs of
democracies tend to agree upon lower trade barriers than pairs comprised
of a democracy and an autocracy. (Dai 2002, pg.163).
These findings point us to Hollyer's study “Democracy and Transparency.” By
assessing the transparency of democracies against other forms of governments using a

18
demonstrative model, Hollier’s findings present the idea that informed decision and an
educated voting procedure tend to correlate positively with transparency. In relation to
Xinyuan's findings, this suggests that transparency affects the increase in trade (Hollier
pg. 33, 2011). Hollier cements the importance of a democratic system, as defined by this
study, to the growth of government transparency.
Attention to the difference between the protocols enacted by the WTO and other
trade blocs is necessary to further the analysis of the difference between developing and
developed states. Hurd, in his book International Organizations (2011), provides a
legislative analysis of how the WTO and regional organizations function on an
international level.
The use of Article I, regarding the ideal of “most favored nation” is crucial to
understanding how the GATT is upheld and acts in relation to the premises set forth by
the WTO (Hurd 2011, pg. 41) Hurd states that
any advantage, favor, privilege or immunity granted by any
contracting party to any product originating in or destined for any other
country shall be accorded immediately and unconditionally to the like
product originating in or destined for the territories of all other contracting
parties(Hurd 2011, pg. 63).
The concept of most favored nation acts as a safeguard to ensure that each nation
trades with member states equally. The notion of equivalence of products from states
allows for each member state to trade with each other indifferent of where the product
originates.

19
However, it is Article III of the World Trade Organization Charter which most
affects developing countries. Declaring that “the products of the territory of any other
contracting party shall not be subject, directly or indirectly, to internal taxes or other
internal charges of any other kind in excess of those applied, directly or indirectly, to like
domestic products” (Hurd 2011, pg. 63), Article III regulates tariffs and sets the amount
which may be charged for the export and import of goods. While these may theoretically
allow for the equal trade of products, developmental costs, industrialization and diversity
of products must be accounted for.
However, as Mitshusita points out in his article, “The World Trade Organization:
Law, practice and policy”(2006), the WTO trade agreements are not necessarily fixed,
allowing for openness of interpretation under strict cases and for favored trades to occur:
“the WTO provides that only the Ministerial Conference and the General Council have
the power to adopt interpretations of the WTO agreements by a three quarters majority of
the Members.” (Matsushita 2006, pg.47) The General Assembly may authorize changes
and bilateral agreements, however these tend to occur when larger members gain value
from such trades. While the system is set out to treat all equally, it grants leeway under
certain conditions.

20
Chapter III: Methodology
Data and Analysis
To test my hypothesis I examine the effects of the independent variable—
increased trade—on the dependent variable—state transparency—in multiple countries
since the turn of the century. The data originates from multiple sources, including the
United Nations Commission on Trade and Development’s trade analysis and information
System (TRAINS); Transparency International's Corruption Index surveys; World Trade
Organization's International Trade and Market Access; World Bank's World Trade
Indicators; and International Trade Center’s Trade Map. The chosen sample size is
ample, as trade information is abundant for the states involved in the research design. The
data is limited by the fact that certain years of trade export were missing; however by
using a cross sectional design, the error originating from this aspect of the research is
mitigated.
I have chosen to analyze democratic and non-democratic states because non-
democratic states, being less transparent, provide inaccurate data. Both systematic bias
and reporting bias by the states would alter the data and cause for inaccurate inferences to
be made. Trade legislation can further skew data. States which use tariff barriers to
regulate and safeguard intra-national and trading block exports pose an issue to the
analysis of incoming mercantile statistics. Although it supports the argument that trade is
favored with transparent states, bias once again limits the relevancy of the data obtained

21
by international organizations. The use of mean averaging of trade and transparency
indexes will allow for a stronger cross sectional analysis and once again will limit errors
present in data collection. Due to the large sample size, the range and standard deviation
of the group helps limit bias by providing a large N value, increasing generalizability and
minimizing error due to small sample size.
For the sake of the thesis, democracy, transparency and trade must be defined to
be able to quantitatively explain these parameters beyond a theoretical framework.
Factors used to define democracy include free press, an electoral process, the structure
and strength of government and civil society. Transparency tends to be closely linked to
democracy: while this may raise a bias, the factor that we are accounting for democratic
states offers a mitigating variable to the selection bias process. To resolve the issue, I
employ a variable to define non-democratic and democratic states.
I will also analyze non-democratic states in order to support the argument that
democratic states’ increased transparency is due to the increased facilitation of trade. This
will help assert that it is not transparency that eases trade. For this reason non-democratic
states will also be analyzed.
The sample size encompasses developed and developing countries, with the
second being largely present due to developing countries being more numerous. The
inclusion of the European Union and its member states as distinctive statistics brought
forth a problem of double counting. To resolve the issue, the European Union will be
analyzed in relation to its member states and its internal trading system. Similarly,
NAFTA and other trading blocks are analyzed in relation to its member states and

22
separately as international trading regimes trading with other external states. While it may
be possible to analyze each element separately, that is beyond the scope of this thesis.
While it may be possible to further reduce counting bias by implementing single
state trade as a measure of intra-state reduction of corruption, it is not necessary for this
thesis. This whoever may present a potential bias in the data and may further reduce the
sample size due to availability of data. However, to account for such a finding is not
necessary for the argument proposed by the thesis due to the sample size and an aspect of
regional analysis.
The use of multiple trade statistics, however, allows the decrease of systematic
bias and countries reporting false claims. Furthermore, the use of multiple sources which
tend to be international organizations—such as the World Bank, the United Nations and
the World Trade organization—allows for better estimates of import and export data. The
issue of transparency is similarly analyzed by using the Transparency International's
Corruption Index, Amnesty International human rights statistics, and United Nation's
country reports. Factors analyzed to assert transparency include government electoral
processes.
Dependent Variables
I employ the dependent variable Y, transparency. Three facets of the variables are
analyzed, which group to form the dependent variable. The first is government
corruption, defined as C, measured as a ranked nominal average and created by a cross

23
reference of rankings of corruption statistics collected by Amnesty International,
Transparency International and the United Nations.
A further measure of transparency is determined by government political strength
and its electorate process. This is measured by a nominal ranking system representing
states, starting from 1 and finishing at 23 states, with information provided by the United
Nations, Transparency International and Amnesty International.
Government human rights, economic legislation and adherence to international
law, labeled as H, are used to further assess the transparency of member states. Special
importance is given to the rights of free speech, free press, and voting procedures as well
as to the adherence to international standards of human rights law. This information,
provided by Amnesty International, is analyzed through a binomial distribution,
indicating with a 1 a state which adheres to human rights, and with a 0 a state that does
not.
Human Rights Watch survey data is also used to cross reference the information.
Due to the fact that the United States is not included within the surveys, Amnesty
International and the European Court of Human rights reports are included relating to the
United States and other countries in the sample group. To avoid complication, a
composite measure will be used to simplify and measure data relating to transparency.
By subdividing the dependent variable of Y, transparency, a definition and process
of identification allows for the mitigation of bias. To further decrease bias and assert the
difference between democratic and non-democratic states, I employ the Global
Democracy Ranking of Democracy Index, which utilizes a nominal ordinal system of

24
states, ranking each in relation to the other in accordance to how democratic they are.
Labeled as D, the use of the democracy variable is a robustness check for
correlating democratic process to my variables and helps to check if the data is relevant
to both democracies and non-democratic states. It is crucial to divide the variable, for
studies demonstrate a strong correlation between corruption, democracy and
transparency.
Independent Variables
I employ multiple independent variables to examine whether a country abides by
trading regulations and to measure the quantity and types of trades which states take part
in. Trade volume is measured by raw quantity of export goods, a continuous sequential
distribution measured in dollars. Due to currency changes, I have chosen to use the
dollar as a counting measure to minimize bias arising from a free floating currency
market. Furthermore, this allows for an efficient organization of data which can be cross-
analyzed through time.
Export and import gross value, represented by X1, is an interval level measure
relating to the amount, in millions of dollars, which states use in the form of trade. It uses
an aggregate sum including yearly export and import values. This will help show a
pattern through time and, in accordance with my thesis, should demonstrate that
transparency increases as a country increases its trade.
The magnitude of data over time is important to note as a cross sectional study, for

25
some data points were lacking due to the failure of states to report accurate measures of
their export during given time periods or due to lack of government transparency. The
choice to use export volume rather than type of export shall be discussed subsequently.
The choice to analyze the type of export as product rather than as service goods is
to ensure continuity in the scope of the study. While service export is an interesting facet
of the international trade, due to its affiliation to non-governmental entities, such as large
profit and non-profit organizations, it may provide bias in the way states directly trade
with one another.
Of further importance this differentiation is to account for the divergent trade
pattern of developed countries in contrast to developing ones. Developing countries, as
suggested by the WTO figures relating to trade profiles, tend to trade in agricultural
products.
This in turn favors lower trade costs in terms of dollar. However the quantity of
trade and the adherence to treaties is not affected. Many states which are developing tend
to score lower in transparency, however this may be due to the factors surrounding the
type of exports. By interpreting this data as separate, this may help prove that even if
trade value is not as high in developing countries, allowing these states to remain
competitive on a global level helps create transparency in governments. Further attention
to the type of export also identifies which forms of trade tend to occur and which
facilitate the greatest increase in transparency and allow for the control group to function
better.

26
Control Variables and Formula
Certain factors affect the way states trade. One such factor is the use of tariffs by
developing countries as a source of revenue. Trading blocks, as an example, uses reduced
tariffs within the region to alleviate costs and allow member states to remain competitive.
Inflation presents a similar issue, as it might affect the overall amount, in millions of
dollars, that states trade.
Rather than focus on currency or quantitative easing, the thesis will instead
disregard these elements due to the difficulty to ascertain and account for the effects these
may have on state transparency.
Similarly, while tariffs and treaty legislation may present potential biases, these
elements are beyond the scope of the thesis. It will, however, be useful to analyze the
effects that regional tariffs may have on the states with which countries choose to trade.
I also consider the important topic of fixed versus fluctuating currency rates.
Certain states may enact stricter tariff legislation and import and export policies to protect
their currency. Furthermore certain states may choose to trade at a fixed rate of exchange,
sometimes even adopting a common currency. While it can be argued that tariff easing
and trading blocs may ease trading prospects, I choose to address these issues within the
regional chapters.
Form of government must also be considered. Findings by Kaufman (2001)
suggest that democracies tend to trade more with other democracies. This factor could
produce a bias towards how states choose to trade. Furthermore, in accordance to the

27
definition of democracy provided, democracies tend to be more transparent due to their
chosen form of government. While this is not universally true, the nominal variable X2
will be used to account for government type.
The importance of identifying the government type is not solely for the sake of
reducing bias, but also helps support the hypothesis by providing a further explanation to
why democratic states may choose to trade with one another more often than with non-
democratic states.
Whether or not a state is a developing country must also be accounted for. As
mentioned in the literature review, developing states may have a greater effect due to
trade. Moreover, state trading volume may be reduced due to the type of export which the
state provides.
Developing states, which tend to focus on agricultural product, may produce as a
whole a lesser amount of revenue from export trade and be unable to import as many
goods as other more developed states. The nominal variable X3 will be used to account
for potential bias arising from the differing economic models of developed versus
developing countries.
Furthermore, developing states may be less transparent due to issues tied to the
process of state formation. It is however, difficult to analyze and objectively measure
how a state forms. While this bias may exist, it is beyond the scope of the proposed
hypothesis and may warrant further study.
In a similar fashion, a counting bias may arise from the use of intra-state trade
within regional blocks rather than externally. For this reason, state trade will be defined

28
as global trade. However, to ensure an appropriate conclusion to the observations, the use
of regional analysis of the data should help determine what effects elements such as state
proximity and membership in trade organizations may have on gross export and import
trade and subsequently transparency.
The final nominal variable, X4 , will account for whether a state faces restrictions
to trade due to political sanctions or other circumstances such as internal governmental
disarray. In asserting the validity of the proposed hypothesis, it is crucial to understand
that certain countries already face legislative action against their ability to trade, such as
North Korea, Cuba and Iran.
It is important to note, however, that many of these states face such action due to
their lack of transparency before the sanctions were enacted or due to breaches to
international covenants.
The study shall take the form of a linear regression model. The formula used will
account for the data over time and take the form of :
Y(h,c,d)=B+BX1 +BX2... BX4+Error
The means of the dependent variable will be described in a nominal ranked chart,
from most transparent to least transparent states. Given the study is a cross sectional one,
the bias of dependence will be dealt with by using trade data originating from a year
before to compare to the outcome variable, transparency, a year after. The use of a
regression model allows us to analyze a large set of data, in this case 23 countries, and to
do so in a manner which is easily comparable between each state.
To ensure that the data is easily comparable, the use of both percentage growth

29
and total volume will be used. Percentage growth will be useful to test robustness of the
data and to facilitate comparison of each states' change in volume of trade in relation to
the CPI score.

30
Chapter IV: Data Analysis and Observation
Analysis of the interaction of the two variable, transparency and trade, is crucial
as a starting point to ensure a proper understanding of the goals set out by the hypothesis.
The data sets utilized for this preliminary analysis will consist of information relating to
the transparency index of states in relation to their increased trade spanning a defined
period of time. The initial use of two separate charts relating to the changes of the two
variable over time is necessary to initially assess causation between the two variable. The
data will also yield information relating to the changes over time which alter the
corruption index and the level of state transparency respectively.
To further test the validity of the hypothesis, states will be subdivided regionally
and case studies will be utilized to explain how the results of certain regions may vary.
The initial chart will account for the case studies being used hereafter. The implications
of state democratic index will be discussed later in accordance with the findings.
Chart A1 shows the Corruption Perception Index of the states selected for the
case study in relation to its development spanning from 2001 to 2013 . The resulting
score of 1 indicates a state which did not allow access to its transparency index, thus
pertaining to states which at the time has decreased access to international information
relating to its actions or data which could not be found by Transparency International.
The choice of using state data which may be lacking scores for specific years is
due to the fact that during those years, a lack of reporting may suggest the state was to be
considered non transparent.

31
The choice to use Transparency International's data set is due to the use of
multiple data sources which the organization uses to aggregate and account for their
corruption index, resulting in a lesser bias and a larger sample pool of data. Furthermore,
by utilizing measures which account for form of government, voting structure and
perceived corruption, Transparency International's Perceived Corruption Index (PCI) also
focuses on the definitions used by this thesis to assess the transparency of states.
Chart A1: State Corruption Perception Index over Time
1
The numeric value assigned to the CPI score is representative of a scale of 1 to
100, with most corrupt states scoring a value of 1. It is a nominal scale measurement of
the results of several studies conducted by different organizations on the perceived
transparency and corruption level of states.
1
http://www.transparency.org/research/cpi/overview
State
Yearly Corruption Perception Index ( Nominal Value)
2013 2012 2011 2010 2009 2008 2007 2006 2005 2004 2003 2002 2001
Germany 78 79 80 79 80 79 78 80 82 82 77 73 74
France 71 71 70 68 69 69 73 74 75 71 69 63 67
Japan 74 74 80 78 77 73 75 76 73 69 70 71 71
Canada 81 84 87 89 87 87 87 85 84 85 87 90 89
United States 73 73 71 71 75 73 72 73 76 75 75 77 76
Spain 59 65 62 61 61 65 67 68 70 71 69 71 70
South Korea 55 56 54 54 55 56 51 51 50 45 43 45 42
Mexico 34 34 30 31 33 36 35 33 35 36 36 36 37
Italy 69 42 39 39 43 48 52 49 50 48 53 52 55
Greece 40 36 34 35 38 47 46 44 43 43 43 42 42
Argentina 36 35 30 29 29 29 29 29 28 25 25 28 35
Portugal 62 63 61 60 58 61 65 66 65 63 66 63 63
India 36 36 31 33 34 34 35 33 29 28 28 27 27
South Africa 42 43 41 45 47 49 51 46 45 46 44 48 48
D.R. Of Congo 22 21 20 20 19 17 19 22 23 23 22 1 1
Morocco 37 37 34 34 33 35 35 32 32 32 33 37 1
Nigeria 25 27 24 24 25 27 22 22 19 16 14 16 10
Brazil 42 43 38 37 37 35 35 33 37 39 39 40 40
Russia 28 28 24 21 22 21 23 25 24 28 27 27 23
Ukraine 25 26 23 24 22 25 27 28 26 22 23 24 21
China 40 39 36 36 36 36 35 33 32 34 34 35 35

32
Chart A1.1 shows the averages for each state's Corruption Perception Index, their
range and their respective standard deviation.
Chart A1.1 : Averages, Range and Standard Deviation of Chart A1
2
Most democratic and transparent states within the data set, for which information was
present and thus a nominal Corruption Perception Index value of 1 was not assigned, do
not have a large range deviation for the nominal values assigned to it. As an example, the
United States values fluctuate between a CPI of 71 and 77, indicating a range of 6 within
the CPI index relating to the years encompassing 2001 to 2013.
The same holds true for the majority of case studies for which data was readily
available. However Italy, as an example, has one of the largest fluctuations with a range
of 30 CPI points. It is for this reason that while the data may indicate certain findings, a
2
http://www.transparency.org/research/cpi/overview
Mean Median Mode STDEV Range
State
Germany 78.5 79 79 2.67 9
France 70 71 71;69 3.14 7
Japan 73.9 74 73 3.25 11
Canada 86.3 87 87 2.46 9
United States 73.8 73 73 1.95 6
Spain 66.1 67 61;71 4.21 12
South Korea 50.5 51 56;55;54;51 5.13 14
Mexico 34.3 35 36 2.1 7
Italy 49.2 48 39;48 7.95 30
Greece 41.0 42 43 4.12 13
Argentina 29.8 29 29 3.52 11
Portugal 62.8 63 63 2.39 8
India 31.6 33 36;34;28;27 3.43 9
South Africa 45.8 45 46;45;48 2.86 10
D.R. Of Congo 17.7 20 22 7.6 22
Morocco 31.7 32 32 9.41 36
Nigeria 20.8 25 27;24;22 5.38 17
Brazil 38.1 37 37 2.84 10
Russia 24.7 27 28 2.66 7
Ukraine 24.3 24 25;24;23;22 2.09 7
China 35.5 36 36 2.18 8

33
check of the democratic index of states is necessary to discern if the findings are being
altered by the form of government the state may have.
Even non-democratic states with a CPI value of 1, as an example the Democratic
Republic of Congo, differ by a range of 21 points on the nominal scale.
The range of that data thus seems to remain stable for most states, with some states
having a larger fluctuation than others, remaining however within a reasonable range. It is
interesting to note that the largest fluctuation is tied to a state member of the European
Union and supposedly democratic, Italy. This will be further discussed in Chapter 5
relating to the form of government of the selected states.
An analysis of the mean of the states' data points and their respective standard
deviations provides useful insight into how the data aggregates over time and the
fluctuation states have had over time of their Perceived Corruption Index. Similar to the
information provided by the range of each data set, the relationship between the mean
and the standard deviation displays strong evidence supporting the lack of CPI fluctuation
in state scores over time for the majority of states.
It shows as mean scores tend to rise, the standard deviation tends to diminish.
What this may initially indicate that transparency within the state may eventually cap,
with minor fluctuations due to other factors. Of these factors, the form of government
may be focal to the discussion and will be further analyzed in Chapter 5. It is interesting
to once again notice that two of the democratic states which have a high standard
deviation are both part of the European Union, in this case Italy and Spain.
Furthermore, states located in Africa and other developing countries tend to also

34
display higher fluctuations with their Corruption Perception Index values. What this may
indicate is that developing countries may be more prone to corruption, leading to issues
with transparency and form of governance.
As an example, Morocco's data has a mean score of 31.7 on its CPI, however it
also has a standard deviation of 9.41. It is important to denote, however, that Morocco
also had a CPI value of 1 in 2001, which may alter the findings and bias the data.
However, in a similar fashion, Nigeria portrays a mean score of 20.8 and has a standard
deviation of 5.38. While the standard deviation for this state is less than that of Morocco,
it is relatively larger than those found in more developed countries.
Important to note is also a reduced mean score for developing states, which tends
to support the concept that form of government and economic growth may be strongly
correlated with the transparency states may have.
The median and the mode provide information relating to the stability of state
corruption over time. States with similar median and modes would show a state that,
during the time period, scored similar values. Not only, but each measure further
complements the statistics tied to standard deviation to demonstrate how the data
subdivides itself between states.
The important facet to delineate is states which have different modes: these states
tend to score similarly in changing time periods. While the range of the scores is not
major for most states, Italy, India, Nigeria and Spain show a dramatic change of scores,
showing either a growth or decay of transparency over time and a continuation of
practices by the states which caused these results.

35
These initial findings will help strengthen the argument within the upcoming
chapters to the effects that trade may have on how a state chooses to act within the
international scene.
The information tied to the Corruption Perception Index over time helps show
which periods of time, for each state, had a decrease or increase in transparency. The next
chart will instead look at trade over time to identify temporal patterns between
transparency and trade.
Chart B1 analyzes increases in export and import trade, in millions of dollars, not
accounting for service trade, between state's trade over time. It does so from a period of
time spanning from 2001 to 2013, using the WTO's import and export statistics to
account for export good trades in the given years.
The choice to exclude data relating to service trade is due to the difficulty of
describing service trade as a state activity and differentiate it from private industry. By
using goods as the main focus, the thesis aims to address inter-state trade and reduce bias
caused by private sector trade.
Furthermore, current US dollar values were used to diminish bias due to currency
change and fluctuation in measuring the trade over time. While changes in currency do
affect trading patterns, that is beyond the scope of this thesis and warrants further study.

36
Chart B1: State Export and Import Trade In Millions of Dollars over time
3
An initial analysis of the data relating to the increase of volume in trade
determines that over time, each state tends to increase positively import and export trade.
While there are years in which certain states trade less, as an example Argentina in 2009,
these periods will be focal to analyzing how the CPI changed during these periods. The
overall trend of increasing trade is also due to elements mentioned in Chapter 4: while the
current value of the dollar was used to account for inflation, currency order flow,
industrialization and mechanization of industry are some factors which may cause for
trade to increase over time.
For this reason it becomes important to analyze which states are developing and
3
World Trade Organization (2014). Time Series Statistics Database
Yearly Product Export and Import Trade (In Millions of Dollars)
2013 2012 2011 2010 2009 2008 2007 2006 2005 2004 2003 2002 2001
States
Germany 2640046 2568326 2728855 2313738 2046388 2631238 2376197 2014791 1747987 1625629 1356170 1106114 1057764
France 1260320 1243123 1316502 1134837 1045654 1333035 1190473 1037787 967552 923051 790879 660981 651987
Japan 1548263 1684411 1678564 1463833 1132700 1543946 1336570 1225789 1110807 1020217 854747 753920 752585
Canada 932489 930160 914975 790171 646001 875482 810881 747178 682886 596693 517760 479893 487149
United States 3910339 3881246 3746184 2661339 3247679 3456929 3168602 2944044 2633788 2340555 2027821 1893333 1908280
Spain 654361 632588 683157 581434 520556 702296 642598 542413 481430 440954 364749 290792 271310
South Korea 1075216 1067454 1079627 891596 686619 857282 728335 634848 545657 478308 372644 314597 291591
Mexico 771154 751120 710637 608510 471227 609569 562067 513437 442447 390240 340435 333769 324664
Italy 994963 989906 1082045 934350 822014 1104667 1011544 859430 757925 709083 596852 502442 481140
Greece 98647 98686 101293 94863 89917 118962 102110 84368 71714 68068 58234 41984 44526
Argentina 157028 149435 157888 124635 94458 127480 100485 80698 69040 57021 43400 34640 46863
Portugal 138066 130311 142064 127155 115874 151553 104964 115434 102659 90735 78957 66064 63598
India 778292 785399 767367 576584 422111 515860 379529 300218 242486 176424 131521 105767 93753
South Africa 222446 227119 233304 188182 301392 182422 158234 136890 113930 99612 76230 58990 57506
Democratic Republic of Congo 12600 12400 12100 9800 7400 8700 6500 5597 5093 4310 2873 2213 1670
Morocco 66912 66318 65926 53152 46935 40690 47350 36724 31980 27747 23028 19713 18182
Nigeria 150000 166000 170000 128235 90648 136225 101436 85249 71221 52795 44865 44716 42983
Brazil 492626 475968 492986 393452 286672 380319 287294 233645 196157 163111 124084 110162 116669
Russia 867610 864701 845842 649264 495191 763467 577889 467832 369232 280589 211999 168267 155648
Ukraine 140276 153171 151054 112389 85269 152489 109914 83407 70364 61663 46087 34934 32040
China 4160009 3867119 3641865 2974001 2207535 2563260 2176572 1760439 1421906 1154555 850988 620766 509651
37
the form of government to ensure an accurate perception of the changes occurring.
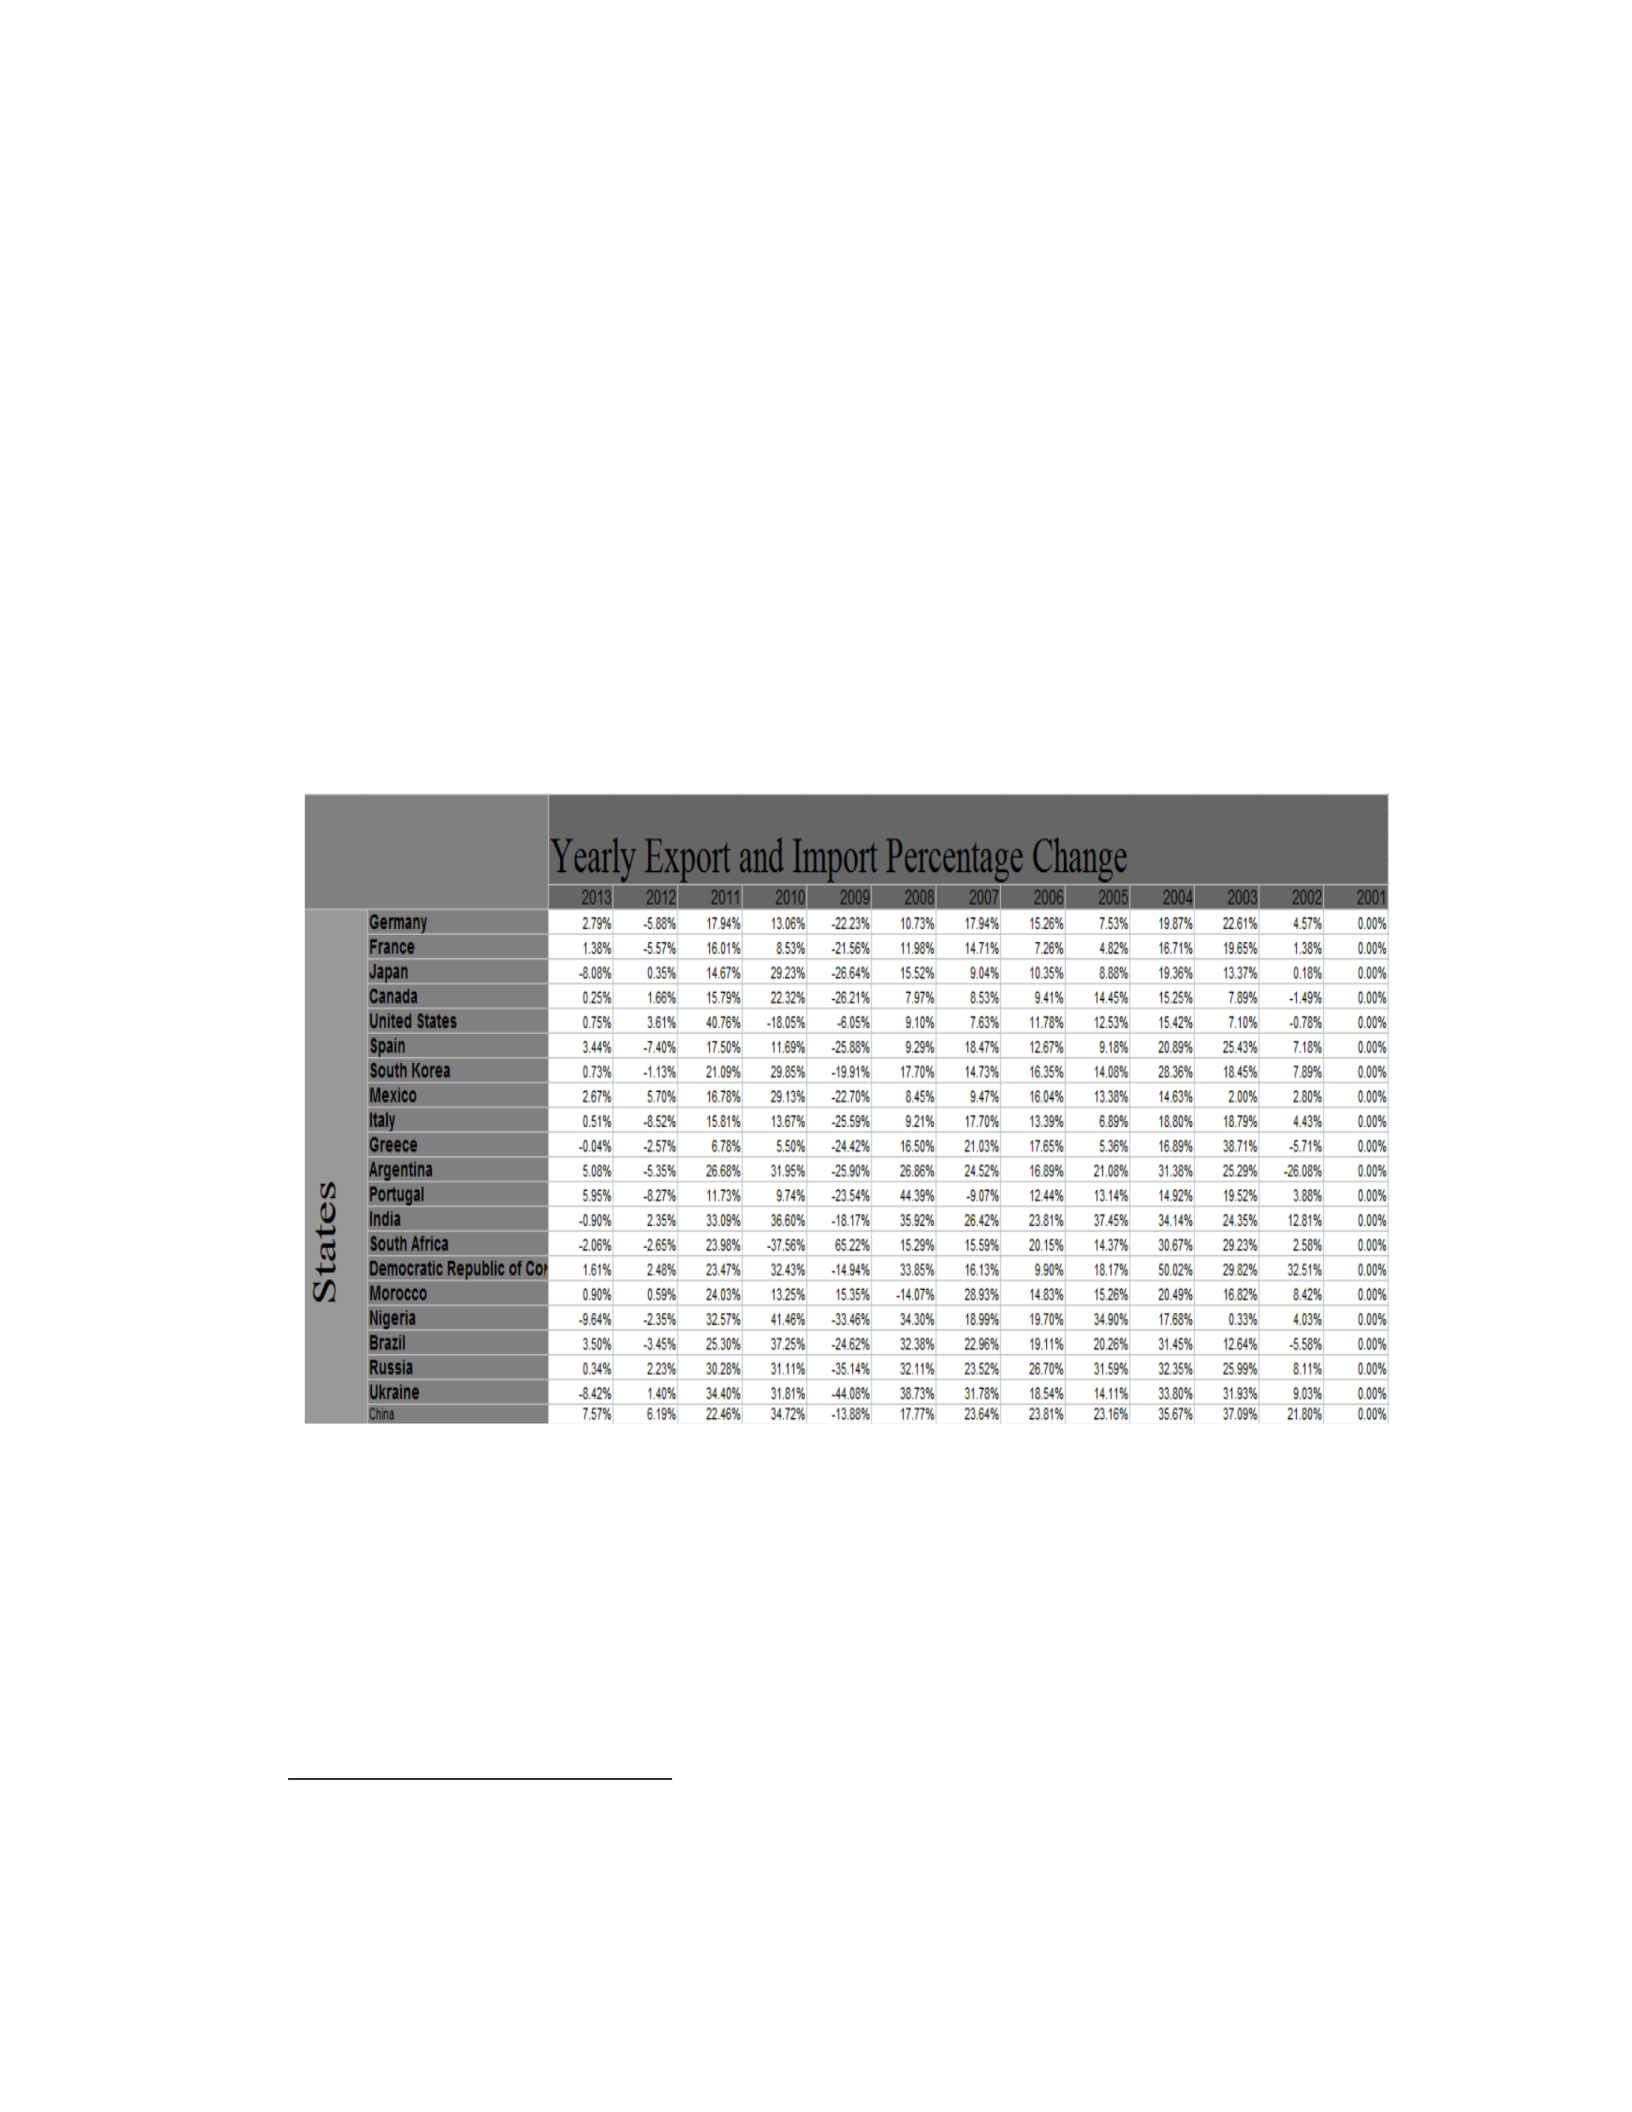
Furthermore, it is important to utilize a percentage growth index, over time, to see
the rate at which different states have increased or decreased trade. The reason for this is
to provide an easier statistic to compare to the growth or decay of the Corruption
Perception Index, rendering the information easier to compare. Chart B1.1 Provides the
percentage increment growth for each state over time.
Chart B1.1 : State Export and Import Percentage Change over time
4
The choice to use a percentage index and to then use the total values is crucial: as
trade tends to increase over time for all states, the value of using a measure of the growth
factor, rather than the raw number, helps to see what trends states have in accordance to
the shift in their Corruption perception index.
The constant growth can be attributed to multiple factors: inflation and
4
World Trade Organization (2014). Time Series Statistics Database
38
quantitative easing are two potential biases which were mentioned. To try and minimize
the systematic bias, the use of a percentage index is used. Furthermore it is also easier to
measure in relation to the corruption index due to a similar unit measurement.
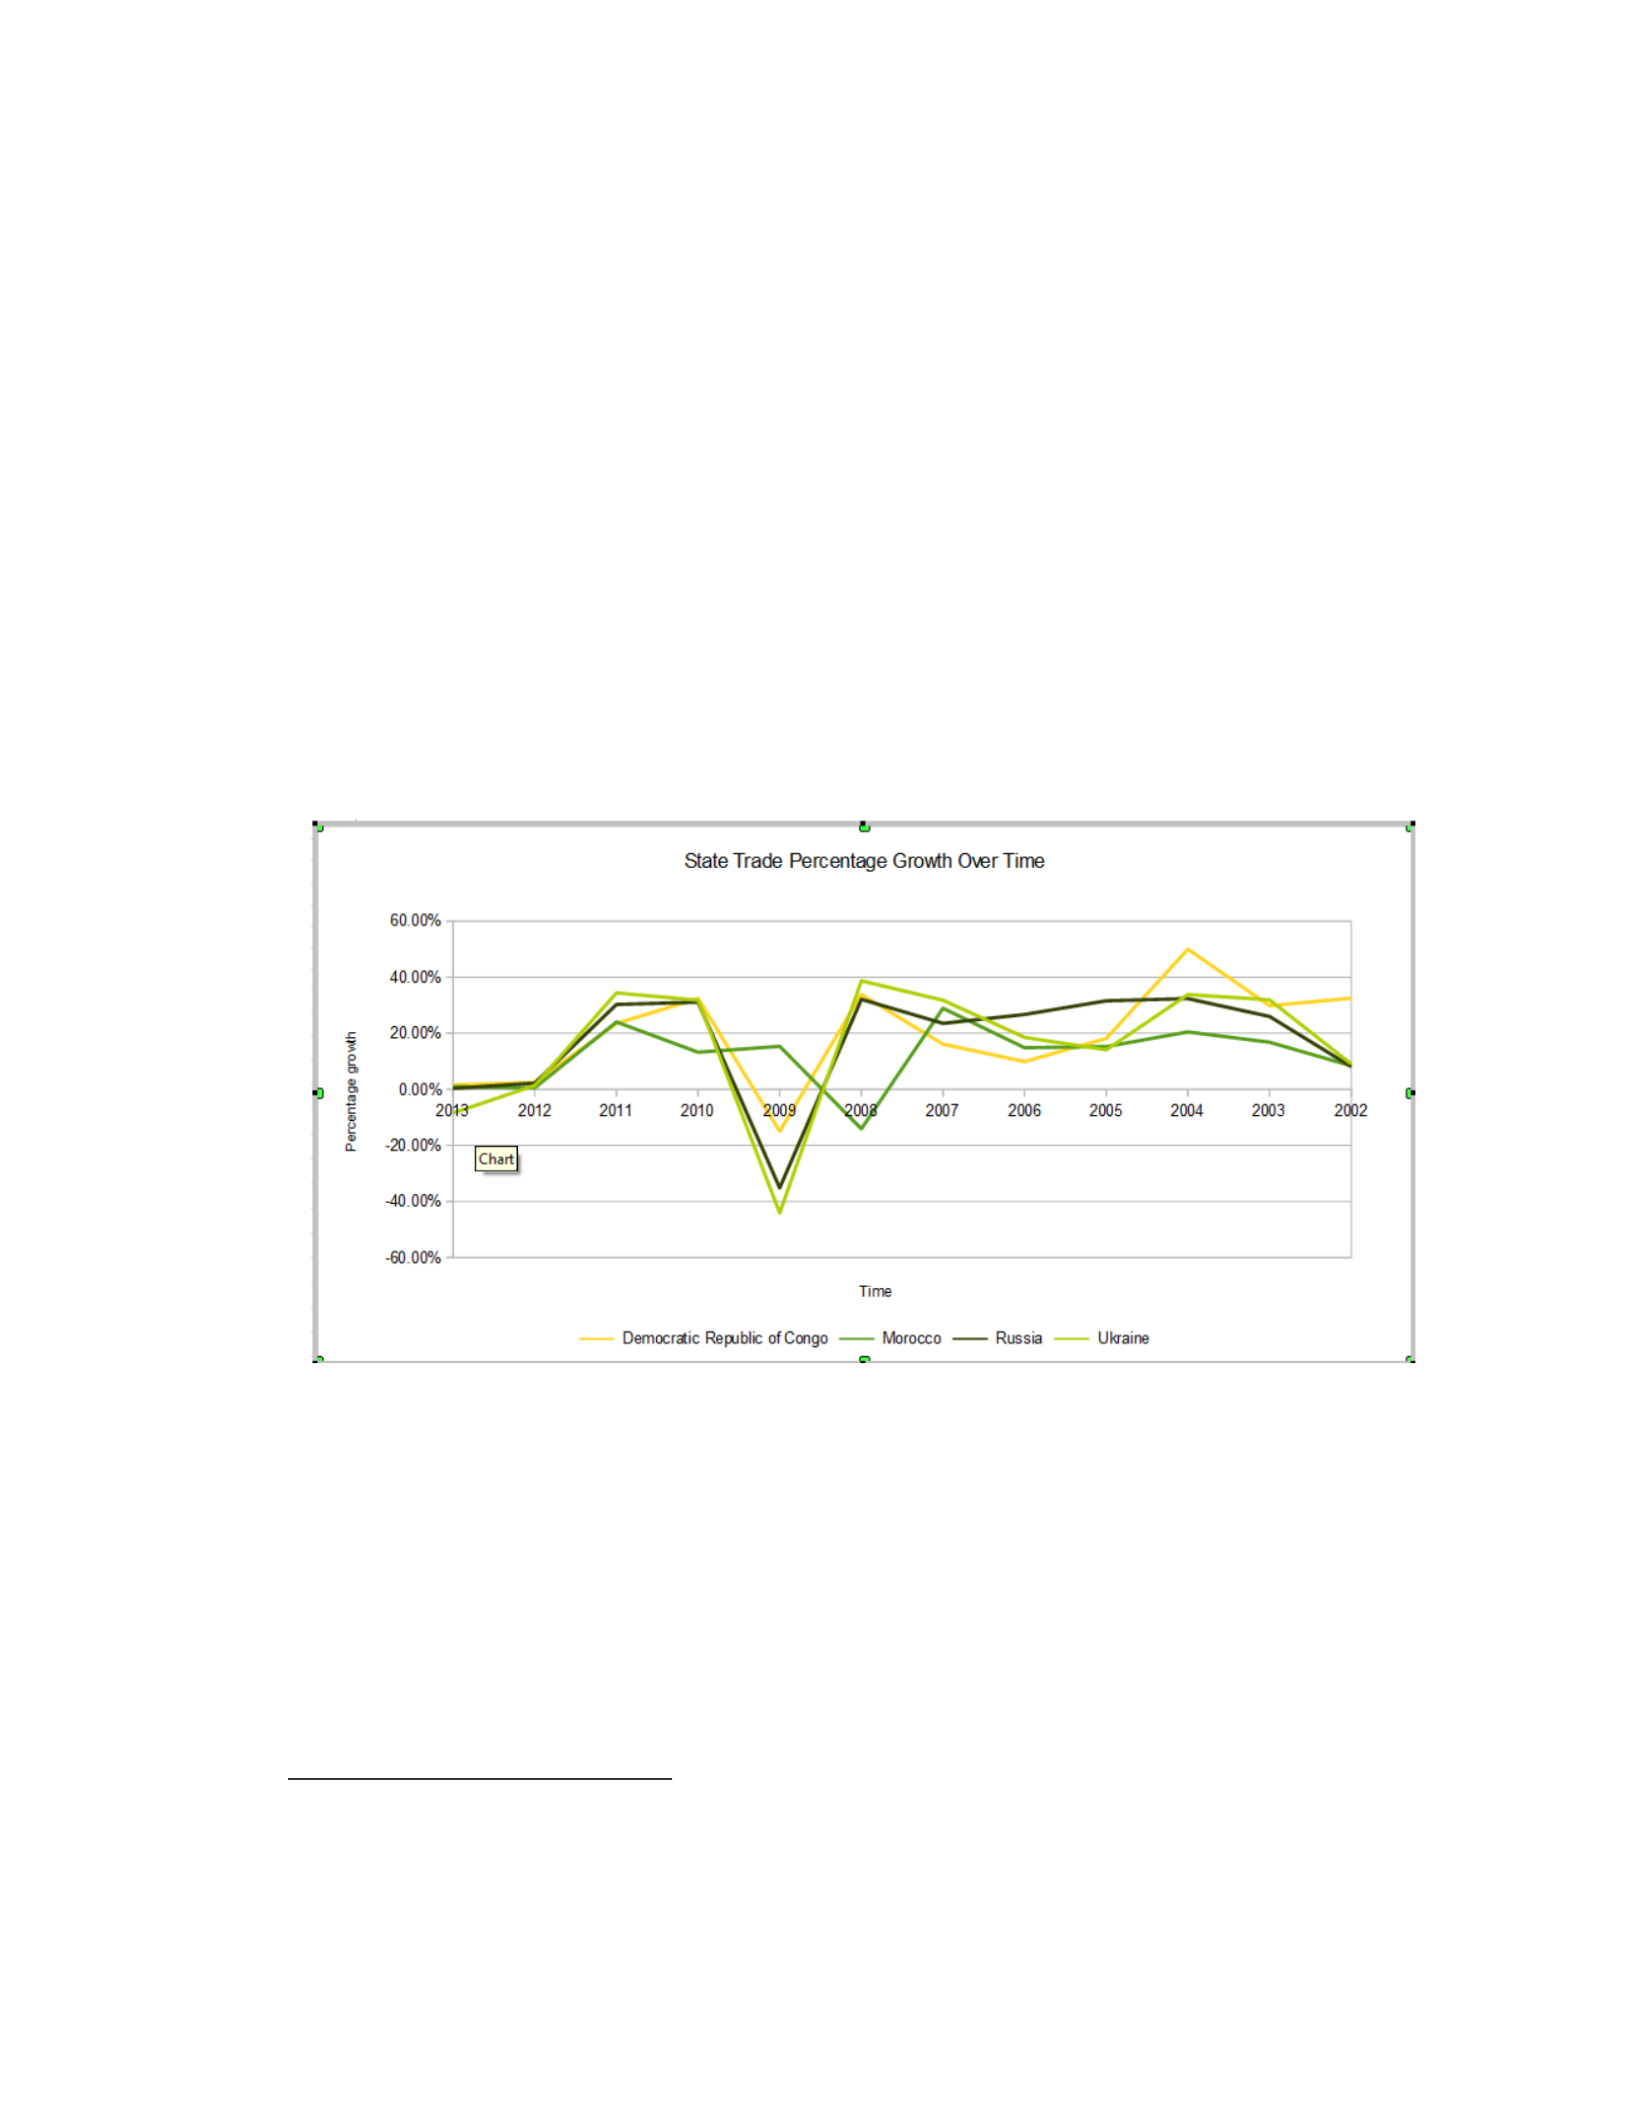
To further the point, Graph B1.2 shows the percentage growth of the four states
with the lowest CPI means. The reason to show this is to show the importance of not
solely accounting for total volume, but to demonstrate the relationship between the
development of economy and CPI.
Graph B1.2: Lower Average CPI State Percentage Growth over time
5
As Graph B1.2 shows, states with similar Corruption Perception Indexes tend to
have a similar trade growth pattern. What this indicates is a correlation between the two
variables for states with similar CPI scores. Each state tends to follow a similar trend of
5
World Trade Organization (2014). Time Series Statistics Database
39
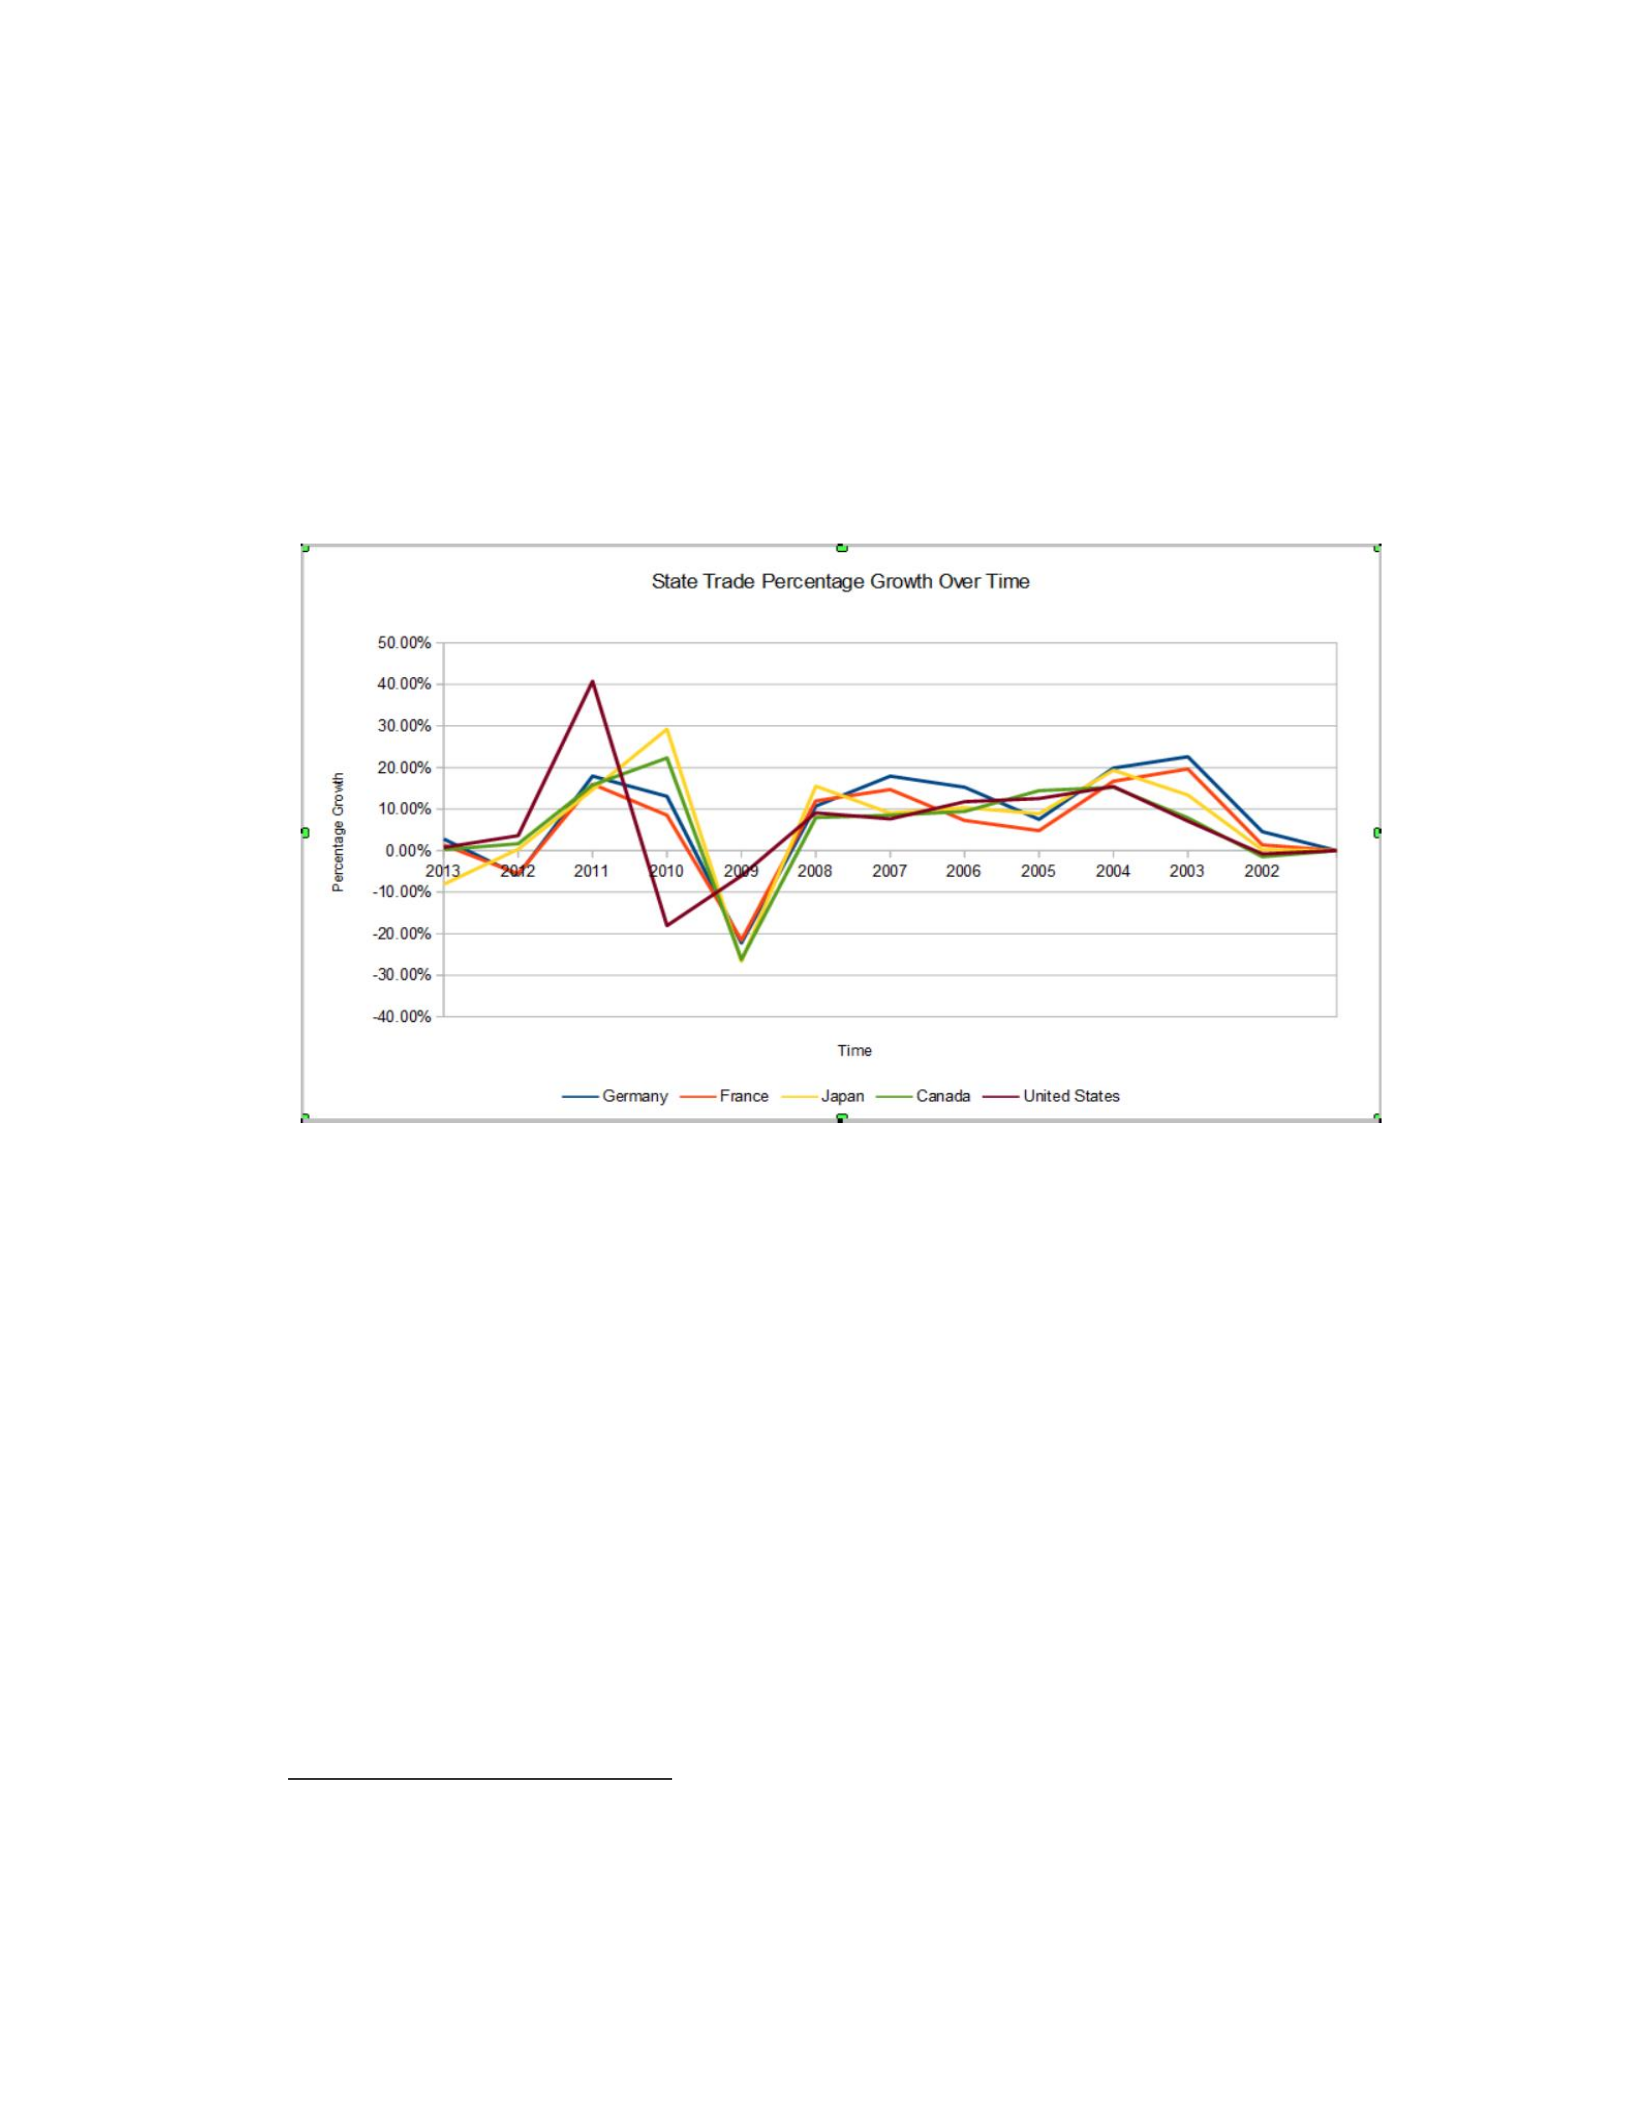
growth and decay. To further the point, an analysis of the states with the highest CPI
ratings is shown in Graph B1.3.
Graph B1.3: Upper Average CPI States Percentage Growth over time
6
The choice to use the least and most transparent states is to demonstrate that trade
varies in a similar fashion between states. Similar trend lines are present in both graphs,
solidifying the concept that trade changes affect state CPI regardless of the score.
It is important to observe that states which are more transparent tend to have
larger growth peaks. The percentage changes in Graph B1.3 tend to be more severe,
suggesting that the effects of economic growth have a smaller effect on transparency,
once again suggesting that as transparency increases, the effects trade has on Corruption
Perception Indexes may decrease.
6
World Trade Organization (2014). Time Series Statistics Database

40
A further point to note is the data values relating to trade for the years of 2009 to
2010. Overall, most states had a negative trade growth within these two years: this may
be due to external factors, highlighted by the fact that the data shows a general global
decline in trade.
It is now necessary to visually represent the two variables to show if a correlation exists.
What the two separate data sets initially suggest is a consistent value of corruption
within states: as time progresses, minor fluctuations between the corruption index tends
to coordinate with consistent trading patterns found in Graph B1.2 and B1.3.
As states increase trade, in a majority of cases transparency tends to increase.
While the rate at which transparency increases seems affected by other factors other than
trade, it is safe to assume that there is a positive correlation between CPI and trade.
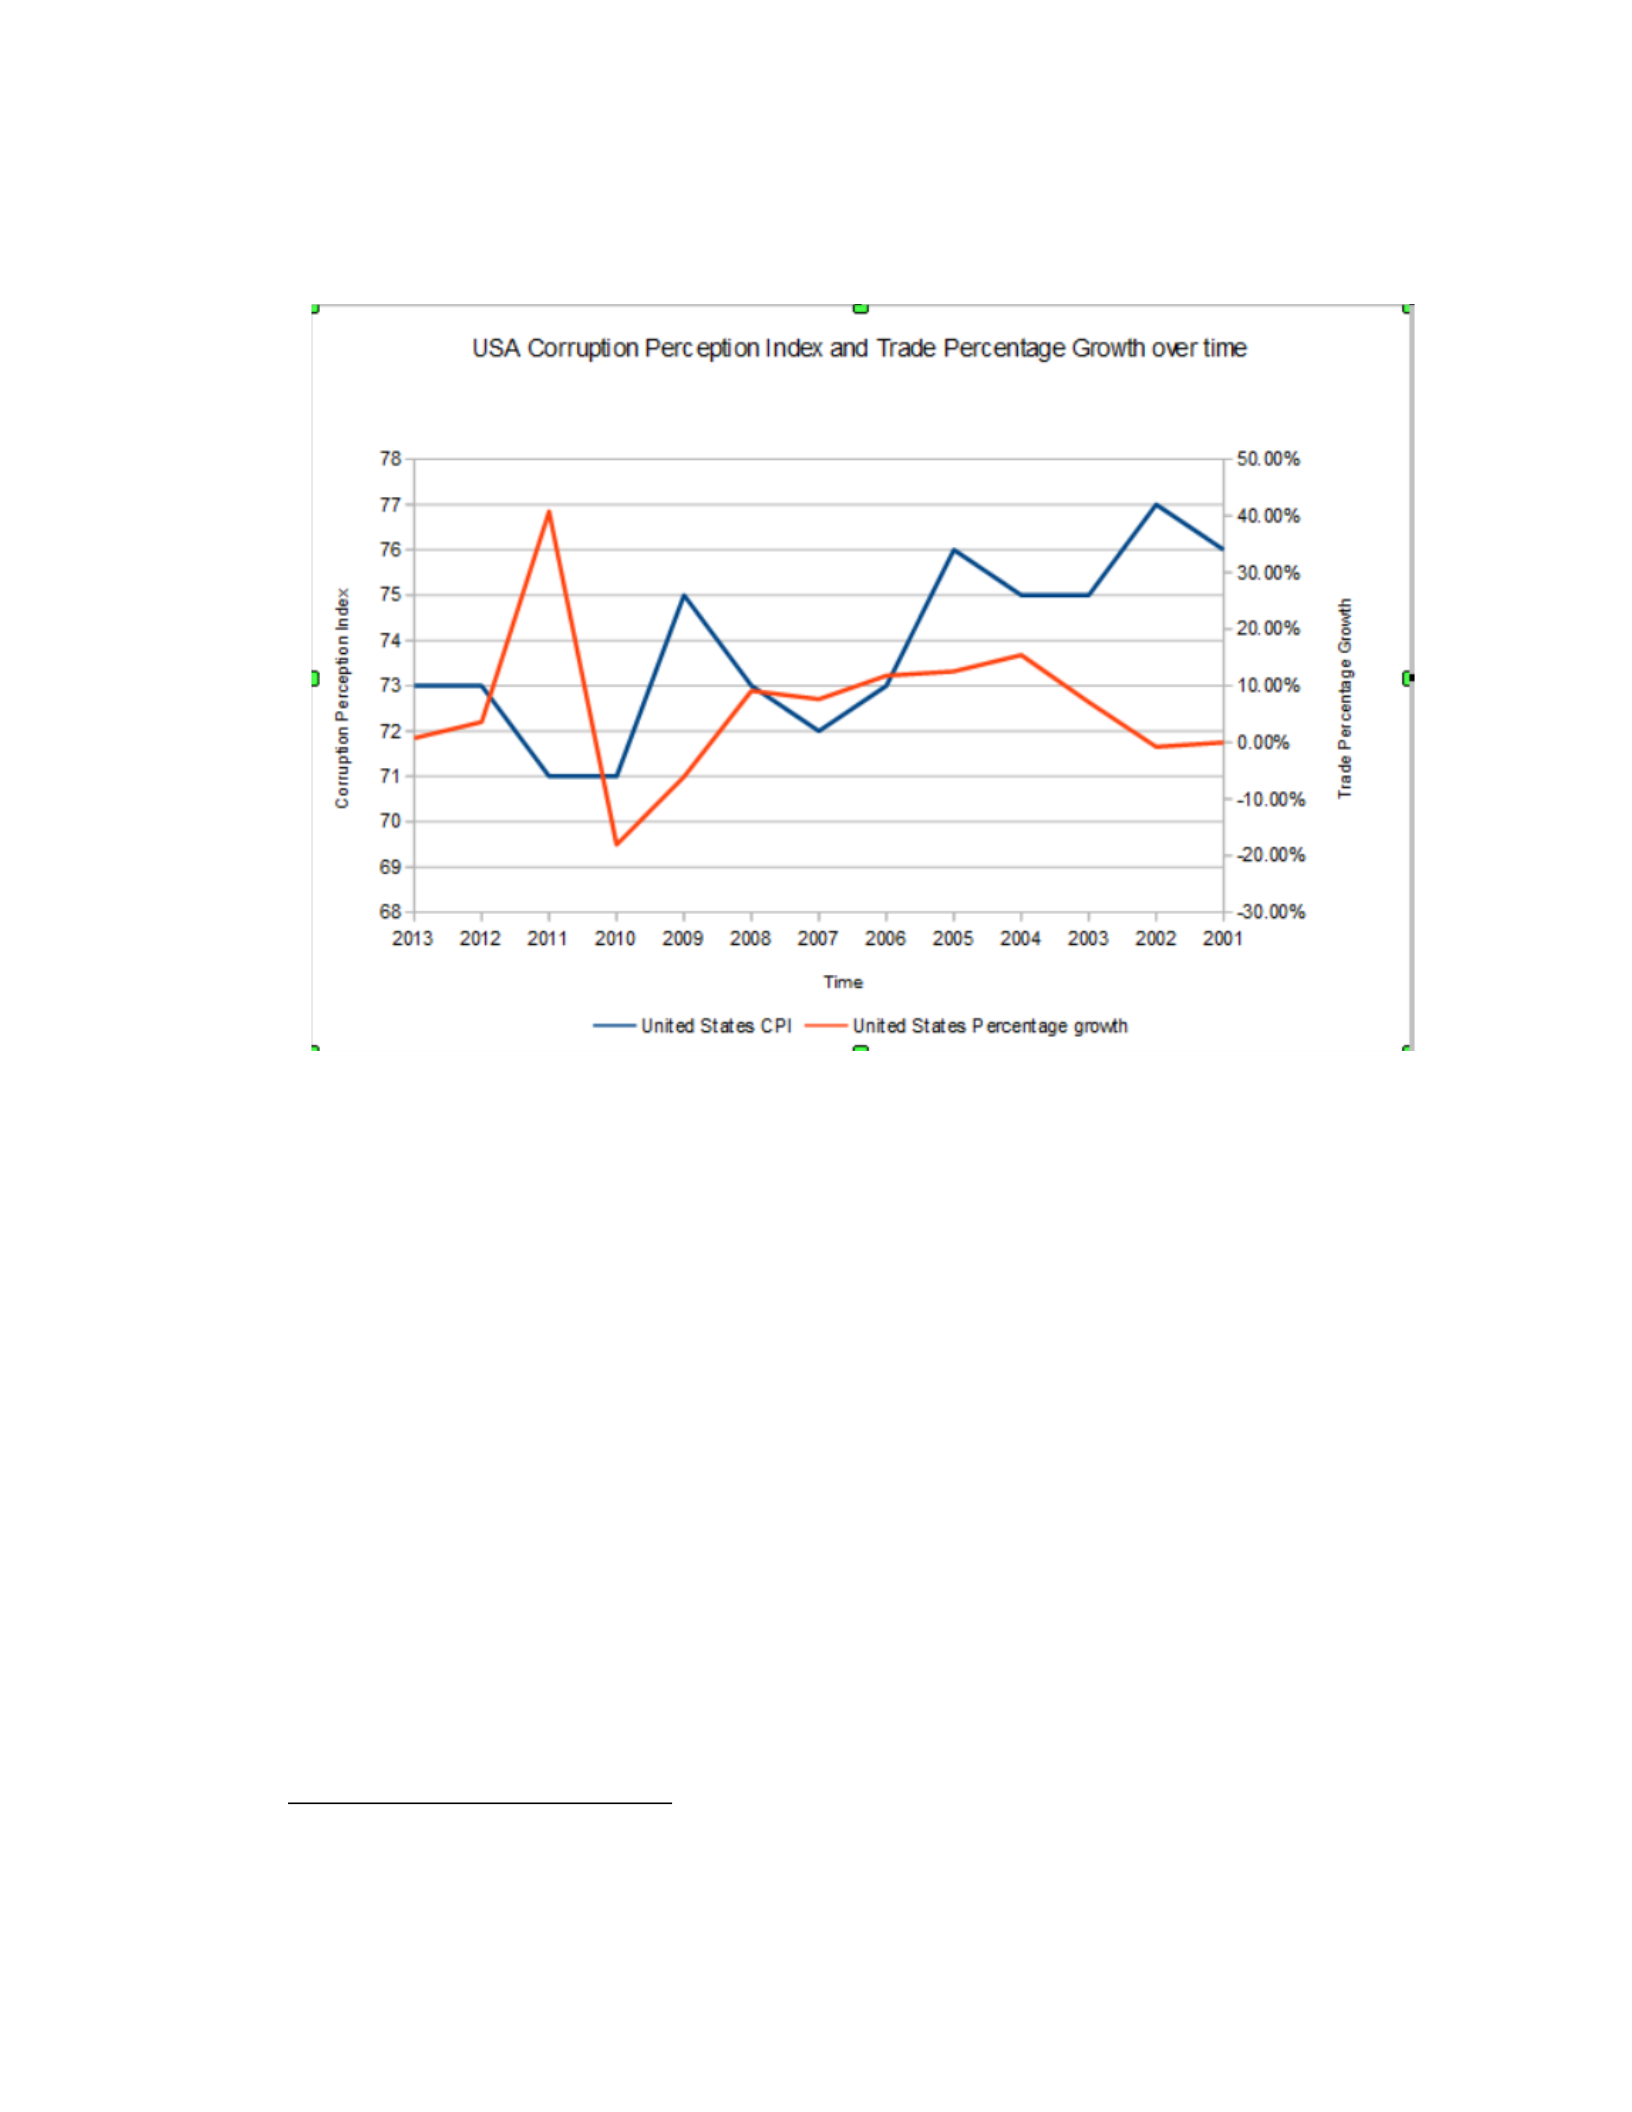
A positive correlation between state transparency and trade will be demonstrated
in Chart C1 using the United States as a sample of evidence, further covered in Chapter 8
relating to the Americas. As the graph will show, trade tends to increase in the United
States while the CPI index tends to stabilize and sway slightly in accordance with the
changes in trade volume.
41
Graph C1: United State CPI Change and Trade Percentage growth over time
7
As mentioned previously, the important facet to look at is at how much US trade
differs from year to year due to an increase or decrease of the CPI index. As an example,
the differential in trade during the 2010 to 2012 period is one of the largest for the USA,
matching with an increase in CPI rating.
Similarly, the period following sees an increase in US production followed by a
consistent growth as transparency increases. It is important to notice that the trend lines
shown by the increase and decrease of CPI changes are due to the effects of trade: as
trade increases, the effects are seen the year afterward, demonstrating the causality of
trade upon transparency.
7
World Trade Organization (2014). Time Series Statistics Database ; http://www.transparency.org/research/cpi/overview
42
Finally it is important to note that while the initial part of the chart tends to show a
decline in transparency as volume of trade increases, this may be due to the difference in
percentage growth: it is in fact the case that during the initial period, negative percentage
growth in 2001 to 2002 and a small growth of 7.89% between 2002 and 2003 differ
amply and may account for a plateauing of the value of corruption within a state.
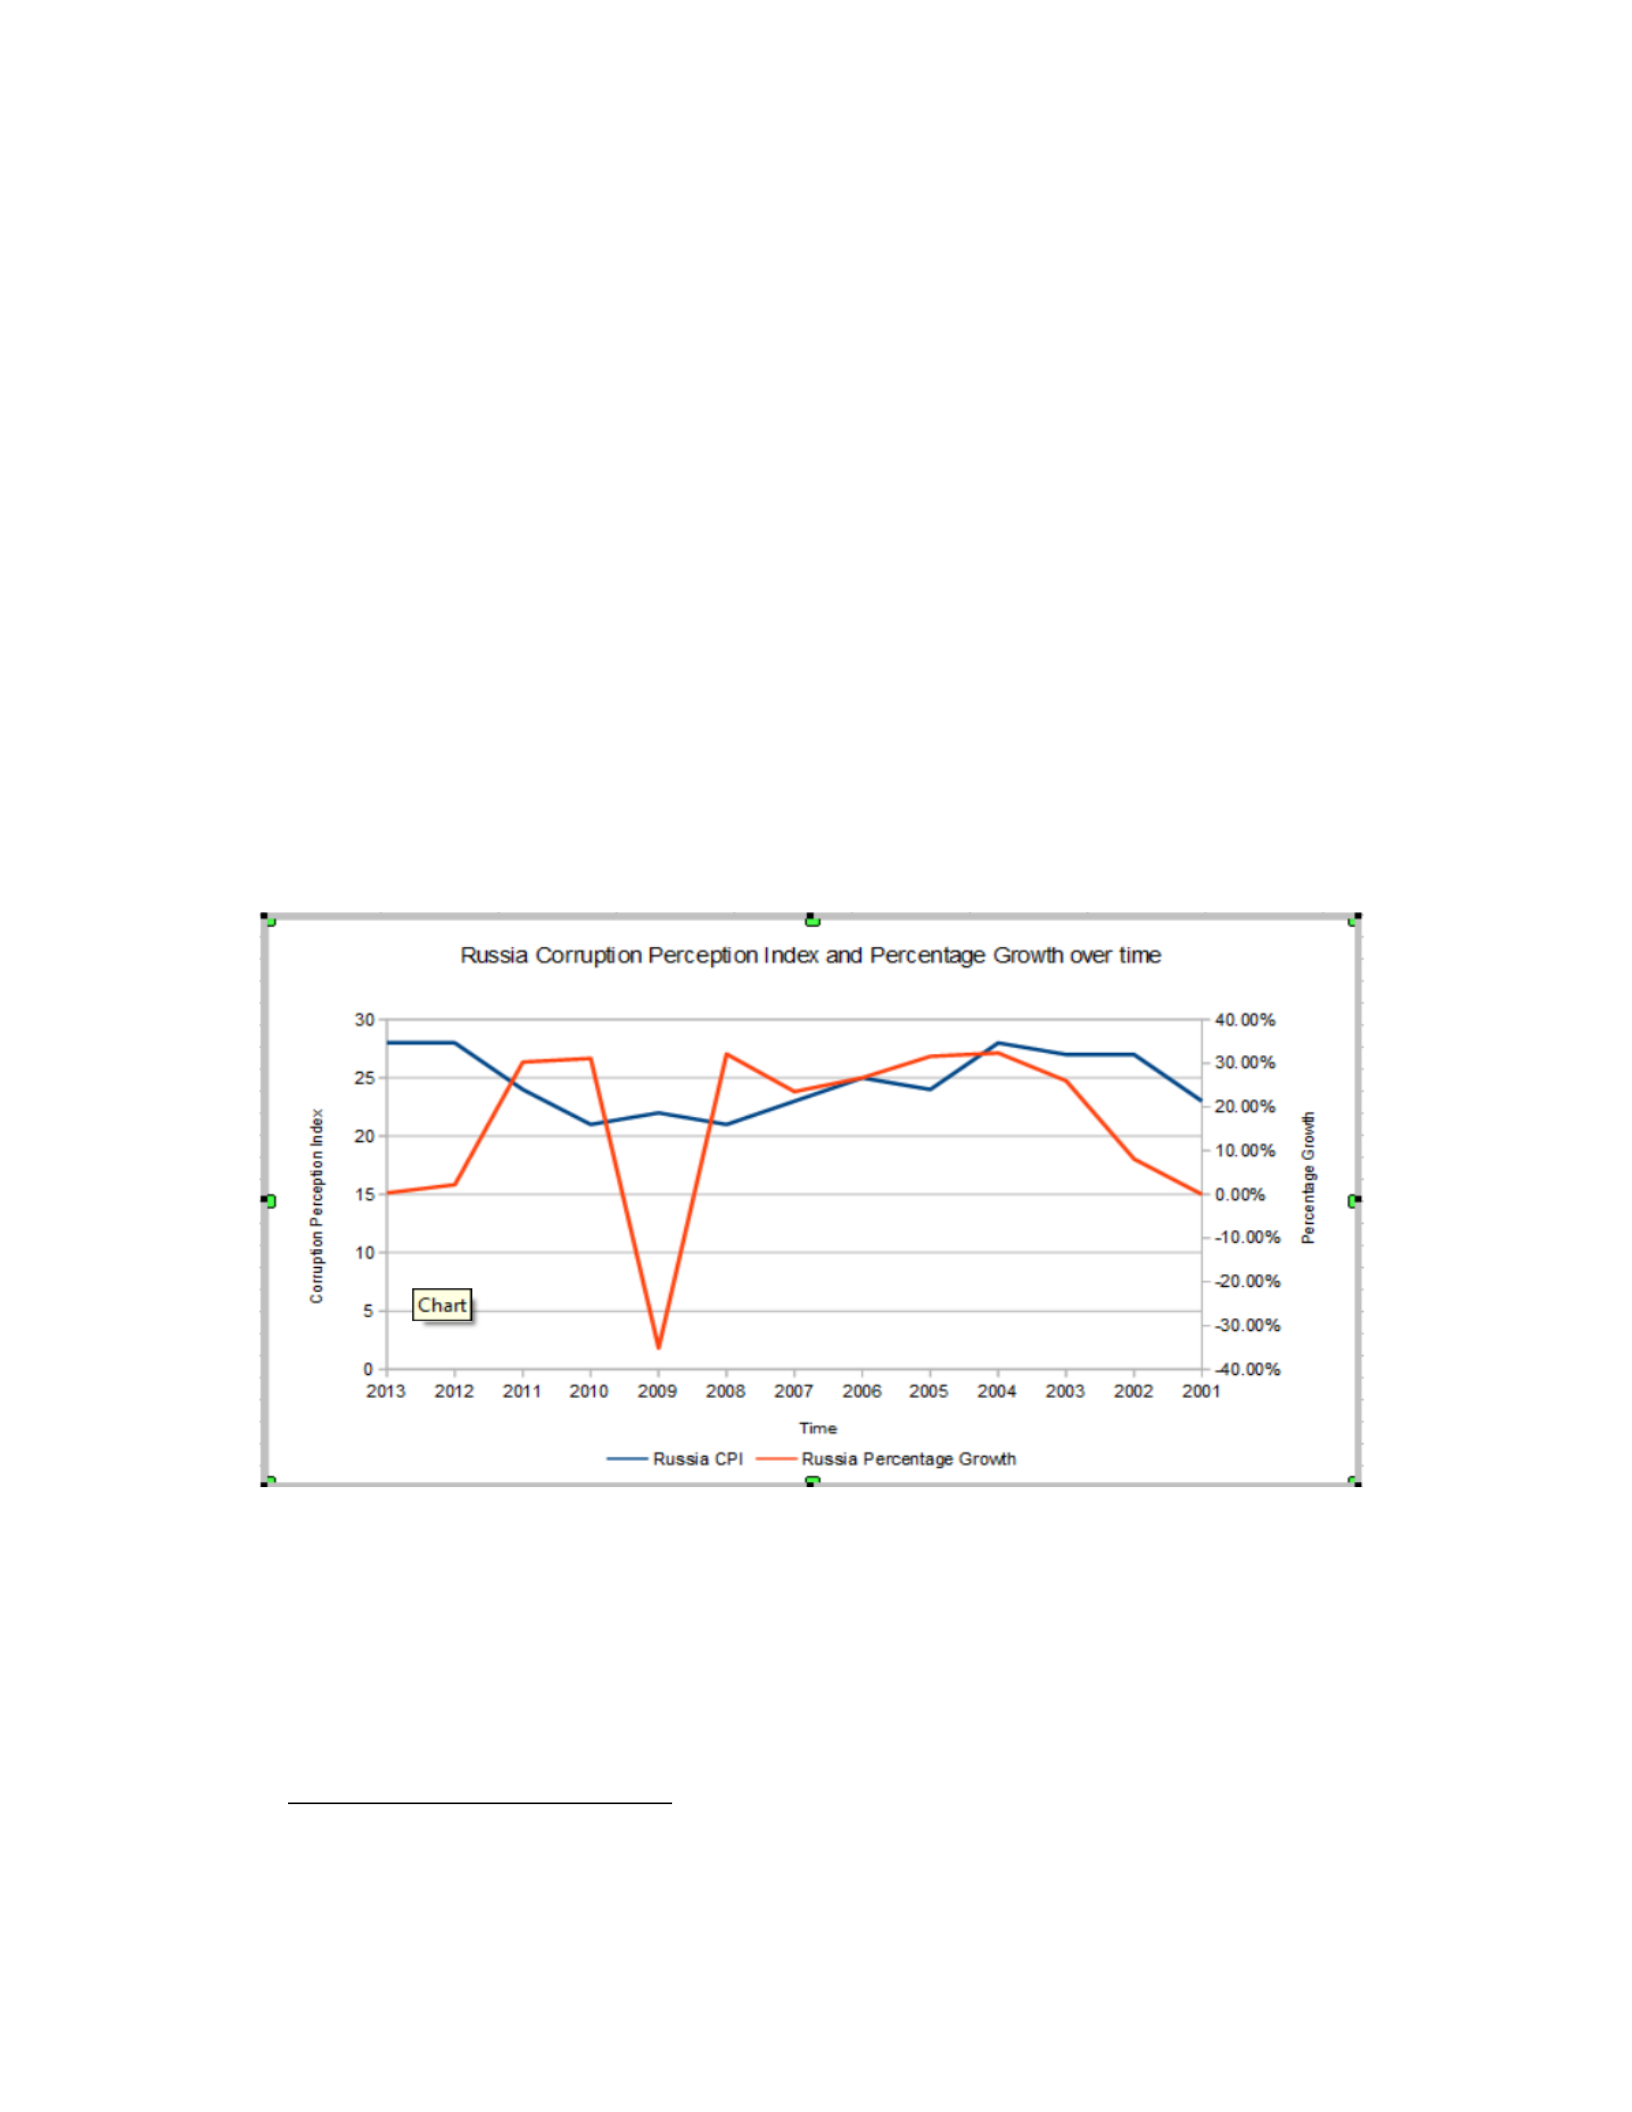
For the purpose of comparing, Graph C1.1 analyzes Russia as a state with a lower overall
average Corruption Perception Index. The choice to do so is to demonstrate consistency
in the findings.
Graph C1.1: Russia CPI Change and Trade Percentage growth over time
8
In a similar fashion, Russia shows a consistent increase of transparency directly
correlated with trade during the 2001 to 2003 period. However, as speculated previously,
the changes Russia has in Corruption Perception Index seem less affected by trade growth
8
World Trade Organization (2014). Time Series Statistics Database ; http://www.transparency.org/research/cpi/overview

43
in Graph C1.1. The United States, on the other hand, has a CPI index graph which has a
larger range of motion in relation to the economic changes over time.
However it is important to note that during period between 2009 and 2010 Russia
and the United States differs immensely. While the United States shows changes which
are consistent with the hypotheses proposed, Russia shows a sharp decline in growth with
no adverse effects on its Corruption Perception Index. What this may point out is that
trade may also have a reduced effects on transparency when states score generally lower
CPIs.
What this might suggest is that there may be a maximum value at which volume
of trade effects can be felt in relation to CPI, after which other factors may take part in
determining the transparency of the state.
This is also supported by the findings shown in graphs B1.2 and B1.3: while trade
growth is similar between states, it seems that the lower the overall CPI score is, the less
it is affected by trade. However form of government and whether a state is considered
developed may play fundamental roles in supporting the proposed hypothesis.
It may also suggest that a determined minimum amount of change in trade is
necessary for the effects of it to be felt on the transparency and CPI of a state, while
larger changes may be due to global situations beyond the scope of the thesis.
As proposed by my hypothesis, a consistent growth in export and import trade
should mean that overall there should be an improvement by states of their perceived
corruption index. An initial comparison of CPI values originating in 2001 to 2013
generally support these findings. Most states tend to improve their CPI rating or remain

44
within a unit or two of standard deviation.
A simple analysis of these first two charts is not sufficient to fully arrive at an
answer to the hypothesis: while the results seem to indicate a level of correlation,
understanding how credible the data is imperative and warrants further study in the
upcoming chapters. The data is reliably showing a correlation between trade volume and
CPI score: as the volume of trade and percentage growth increase, states tend to change
in CPI accordingly. Due to the way the changes are portrayed over time, it is safe to
assume that the changes are due to the alterations in volume of trade rather than by
change in transparency. By being able to define which of the variables is responsible for
the changes in trade, it is possible to show a meaningful correlation.

45
Chapter V: Democratic and Developing States
Chapter 5 covers the concepts of the form of government and economic and
industrial development of the states studied above to provide further information relating
to the states chosen and their interaction with trade. The reason these two variables have
been chosen as potential biases is due to the effect each of these may have on trade and
corruption within the states.
While other factors may also be brought up as points of discussion, such as
quantitative easing and market flows, these are beyond the scope of the hypothesis and
may warrant further study not in line with the scope of the thesis. The use of percentage
growth in Chapter IV helped reduce the potential bias presented by these factors, as it
accounts for the consistent practice by each state of these methods of currency
manipulation.
The first concept which is crucial to the hypothesis is whether a country can be
considered democratic and if it trades with other democratic states. In this section, I shall
present the states which are democratic, while in the upcoming chapters I will cover the
main trade partners of states and whether they too are considered democracies.
Chart D1 uses the Global Democracy Ranking to define each state as democratic
or not. The strength and viability of the data provided is based on the research done by
David Campbell in his work The Basic Concept for the Democratic Ranking of the
Quality of Democracy (Campbell, 2008) and uses specific variables in line with those
chosen to explain democracy in this thesis. Furthermore, Campbell delineates a crucial

46
point to our thesis: as of 1990, the majority form of government in the world has rapidly
become democratic, however the quality of these democracies is a focal issue to the
argument. As Campbell points out,
Currently ( as of 2008) only three governments in the world do not self-
identify themselves in their official de jure understanding as
democracies...Thus the hypothesis can be set up for discussion that
democracy, as of 1990, represents the dominant global regime type
(Campbell 2008, pg. 6).
Due to this fact, rather than argue for there to be trade between a democratic and non-
democratic state on the basis of self-identification, it is rather opportune to utilize a
system of ranking order to determine how democratic a state is and to assess the validity
of the state relating to its form of government. With this in mind, the values which
represent democracies are crucial in narrowing the argument.
Campbell argues that three main elements exist to define democracy in modern
times : freedom, equality and control (Campbell 2008, pg.30). Each of these elements is
directly linked to the way a democracy holds elections and thus to how the democracy
functions. The data is also an aggregate of studies conducted by Freedom House and
analyzes the way democracies treat minorities, women and its other citizens.
Furthermore Democracy Ranking uses a nominal ranking system to delineate the
democratic index of states. Their parameters for this statistic are as follows: 50% of the
weight tied to the ranking is determined by the variable relating to political elements,
with the remaining 50% of the weight subdivided in the variables of gender, economy,

47
knowledge, health and environment (democracyranking.org 2014). These measures
account for the policies which states enact and measure the variables of freedom, equality
and control to determine how a government acts towards its citizens.
Due to the complexity of the data provided, I have chosen to codify the ranking
system into a nominal variable: a 1 indicating a democracy, a 2 indicating a state with
democratic institutions but issues tied to the core concepts provided by the thesis and a 3
indicating a state lacking the requisites to be truly considered a democracy.
The importance of analyzing the form of government is a robustness check to the
hypothesis proposed: given that democracies tend to be more transparent and are more
likely to trade with one another, accounting for the form of government may aid in
reducing bias that may arise and may facilitate an analysis of trade partners in the
upcoming sections. Furthermore it provides additional data to further subdivide the
information present in Chart B1.
Chart D1 will also analyze if states are considered as developed or not in
accordance to information provided by the World Bank and the International Money
Fund (IMF) relating to development. The global indicators the World Bank uses are
complex and based on an analysis of Gross Domestic Product per capita, poverty indexes,
population growth, disease control and infrastructure gross. For the sake of the argument,
the thesis will simplify the findings to ensure that the data is relevant to the scope of the
study.
The importance of acknowledging if a state can be considered developed is crucial
to account for the amount of trade and the propensity the state may have to corruption.

48
States which are developing may in fact be more likely to be corrupt.
Furthermore trade may be diminished due to this fact and due to the industrial
level of their businesses and their trading products. The data will be codified by a value
of Y denominating a developing state and a value of N denoting a state which is
considered developed. Chart D1 will then be used in conjunction with the graphs present
in Chapter 4 to analyze state trade interaction in the upcoming chapters and see if form of
government and development play a crucial role in altering the potential findings of the
thesis.
Chart D1 : Chart of Democratic and Developing States
Country
Democratic
Developed
Germany
1
Yes
France
1
Yes
Japan
1
Yes
Canada
1
Yes
USA
1
Yes
Spain
1
Yes
South Korea
1
Yes
Mexico
2
No
Italy
1
Yes
Greece
2
Yes

49
Country
Democratic
Developed
Argentina
2
No
Portugal
1
Yes
India
3
No
South Africa
2
No
D.R. Of Congo
3
No
Morocco
3
No
Nigeria
3
No
Brazil
2
No
Russia
3
No
Ukraine
3
No
China
3
No
9
The information that can be initially interpreted from Chart D1 suggests that most
states which are developing tend to be either non-democratic or rather somewhat
democratic. What this suggests is that developing states, as a whole, may be considered
less transparent and thus more prone to corruption due to their form of government.
The important facet to take from this is reliant on the concept of the measurements
provided by the IMF and the World Bank: decreased GDP per capita, as an example, is a
9
Democracyranking.org

50
good indicator of poverty but not necessarily a clear identifier of corruption. The main
tool for measurement, as stated by the IMF, is Gross Domestic Capital overall to see if a
state is considered developing or not: while there may be some biases with using a simple
methodology to ascertain the developing state of a country, for the sake of the thesis an
analysis of the data provided by the IMF and the World Bank will be used.
Furthermore, due to their status as developing states, most non-democratic states
may be prone to decreased amounts of trade due to the concepts tied to developing
economies relating to GDP per capita. Poverty and disease may also be further issues
these states face, which may further notions of the developing status of the states
mentioned.
States such as Japan, the United States and Germany tend to support the
hypothesis proposed: as democratic and developed states, their volume of trade and CPI
averages provide some of the highest means and volume of trade. This shows support to
the proposed concept that a democratic form of government aids the improved Corruption
Perception Index of a state, while being developed may increase the volume of trade.
States such as Ukraine, Mexico, India and Argentina present a further interesting
look at states which can be considered somewhat democratic. Each state in charts A1 and
B1 present very different data, which supports the notion that trade with democratic states
may push for economic development. This will be further analyzed in the upcoming
chapters.
It is important to denote, however, that the means of the Corruption Perception
Index of each of these states tends to be, when accounting for each state's region, within

51
the middle of the means of states. What this may point to is the fact that governmental
sway may cause for these states to have larger ranges and standard deviations in relation
to their CPI scores, showing more of a sway in how transparent the state may be over
time.
Not only, but trade interaction with democratic and non-democratic states may
also account for the reason many of these states have oscillating CPI scores.
China, as an example, while being a non-democratic developing state, tends to be
considered a large global trader. However, the means of its transparency index is lower
than other states. Furthermore, China is a large global trader which interacts
economically with other democratic states: due to this reason, a growth of transparency is
to be expected within the state.
What this suggests is that while being non-democratic may not affect trade, it does
affect the Corruption Perception Index of a state. In a similar fashion, it is not definite
that developing states trade at a reduced volume than developed states.
In a similar fashion, many states in the Asian region seem to follow a similar
trend: Russia, India and South Korea are all considered developing economies by the
standards set out by the IMF, while some being large international trade entities.
The importance of beginning to subdivide the information in relation to these
parameters is crucial: by seeing how democracies, developing states and non-democratic
states interact, the correlation between trade and transparency can be shown. For this
reason, a regional approach may allow for a division which bases itself on eliminating
biases due to trading bloc policies and at the same time seeing how each state chooses to

52
trade.
Europe tends to be a developed sectors, with Eastern European states not
members of the European Union being a point of discussion. The closeness to the
developing Asian continent may be a reason for this: furthermore many of these states,
being ex-Soviet bloc states propose an interesting point of analysis for our thesis
regarding the interaction between Russia and Europe.
The Americas tend to divide themselves geographically, with the United States
and Canada as democratic developed states and Mexico, Argentina and Brazil as
developing states. The interplay of developing and developed states will be fundamental
to the analysis and provide information relating to the effects this has on CPI and trade.
However the major point of interest here will focus on the global trading aspect of
each of these states and the interactions of inter-regional trade. The Americas tend to also
be a large trading bloc, accounting for a large percentage of global trade and
characterized by mostly developed democratic states.
African states, overall, tend to be non-democratic in relation to the data collected
by Freedom House and Global Democracy and to be developing states. The importance
of analyzing the region is crucial due to the issues the states face and the fact that most of
these countries tend to have a lower trade volume, as delineated in chapter IV.
Chart D1 helps in providing a division process to analyze data: by providing
nominal values to add onto our analysis provided in chapter IV, the aim of chapter V is to
provide depth and control variables to allow for a regional analysis of how states trade
and the ramifications on transparency these policies have.

53
What this suggests is the importance of analyzing each region and the economic
policies in place to ensure that the data in chapter IV is correctly analyzed in relation to
the practices of the states and their trading patterns. While other factors may exist which
alter the data, a careful look at the trading policies of each region and an analysis of the
global interplay of whom the states choose to trade with will help provide information
relating to the validity of the thesis.

54
Chapter VI : Europe
Chapter VI analyzes the findings relating to the trade data gathered for the States
represented in Chapter IV relating to the state part of the European Union and Eastern
Europe. The goal of the chapter is to show that efforts toward currency, political and
cultural unification have increased internal trade, which, in turn, have led to EU member
states becoming more transparent.
Furthermore Ukraine will be discussed in relation to its trade profile with both
Russia and member states of the EU. In order to assert the point, I use information
relating to the CPI and growth percentages to show a graph which will serve to support
the points set forth in the hypothesis.
However, it is important to account for the existence of the European Union and
the policies it has enacted to ensure that the data provided put in perspective the
economic policies present within the region. Due to the presence of a large trading bloc
with a unified currency, a brief analysis of the policies enacted by the EU and its effects
on the states within the region will help advance the analysis of the data provided in
Chapter IV.
The economic goals of the European Union in accordance to its consolidated
charter, signed in 2003 in Athens, are
to promote economic and social progress and a high level of
employment and to achieve balanced and sustainable development, in
particular through the creation of an area without internal frontiers,

55
through the strengthening of economic and social cohesion and through
the establishment of economic and monetary union, ultimately including a
single currency in accordance with the provisions of this Treaty
(Europa.org 2014).
The creation of a unified currency zone, the abolition of border tariffs and the
creation of the ECB (European Central Bank) have pushed for state transparency and the
formation of regulations relating to trade practices both internal and external to solely
member states.
One of the organizations which has been key to the process of development of the
modern European Union has been the customs union. The customs union grew from the
ECSC. The creation of a customs union has had positive socio-economic effects for
member countries: a better system of welfare, accompanied by increased exporting, has
helped cement and strengthen economies between member countries. However, this in
turn has isolated non-member countries, creating tensions regarding tariff barriers (Neal
2007, pg. 43).
The protectionist system has led Europe to become lenient to nations that lag
behind due to the security awarded them. Neal explains that if a lower cost producer
(such as the U.S., which produced most manufactured goods at the lowest price in the
world in the 1950s) is excluded from the customs union, then the consumers in the
customs union will lose while the producers in the customs union will benefit from being
effectively protected from the lower cost producer ( Neal 2007, pg. 44).
The border customs has led to a dramatic change in the perception of euro-zone

56
countries and their trade: sheltered due to fixed pricing and heavily lowered tariffs, the
successful exporting of products by European countries within the EU has led an
internalized system of trade.
As presented by Marcouiller (2002), the reduction of risk tied to trade in turn
favors the reduction of tariff costs and promotes trade and transparency. This behavior
may help in explaining why the states which adhere to the European Union tend to trade
more and be more transparent. As Marcoullier delineates,
Abundant evidence suggests that transaction costs associated with
insecure exchange significantly impede international trade. Predation by
thieves or by corrupt officials generates a price markup equivalent to a
hidden tax or tariff. These price markups significantly constrain trade
where legal systems poorly enforce commercial contracts and where
economic policy lacks transparency and impartiality (Marcoullier 2002,
pg. 351)
This may also help in analyzing the reasons why Ukraine and Greece suffer both
economically and in their respective CPI scores. Given the issues with volume of trade
and access to information relating to trade, states may not wish to trade with Greece.
Andrew K. Rose's article One Money, One Market (Rose, 2000) provides
supporting evidence to the importance of a unified currency has had on transparency
within the European Union. By promoting trade within the European Union, Rose's
article supports the idea that allowing for a system of increased trade, in this case by a
group of developed democratic states, supports an increase in transparency and a

57
decrease in corruption.
As Rose states, “Even after taking a host of other considerations into account,
countries that share a common currency engage in substantially higher international
trade” (Rose 2000, pg.33). While currency unification is beyond the scope of the thesis, it
is fundamental to account for this variable in describing why EU states may have higher
trade indexes than other countries selected for this study. The increasing unification of
trade within Europe pushes for transparency by instituting further organizations which are
in charge of assuring that trade may occur in a safe manner between member states.
Now that the European Union and its internal systems have been discussed, it is
important to show data from chapter 4 relating to the states that will be discussed in this
section. Ukraine will be included and, as mentioned previously, will be a point of
discussion. Graph E1 represents the data in this case, portraying CPI score and trading
percentage growth over time.
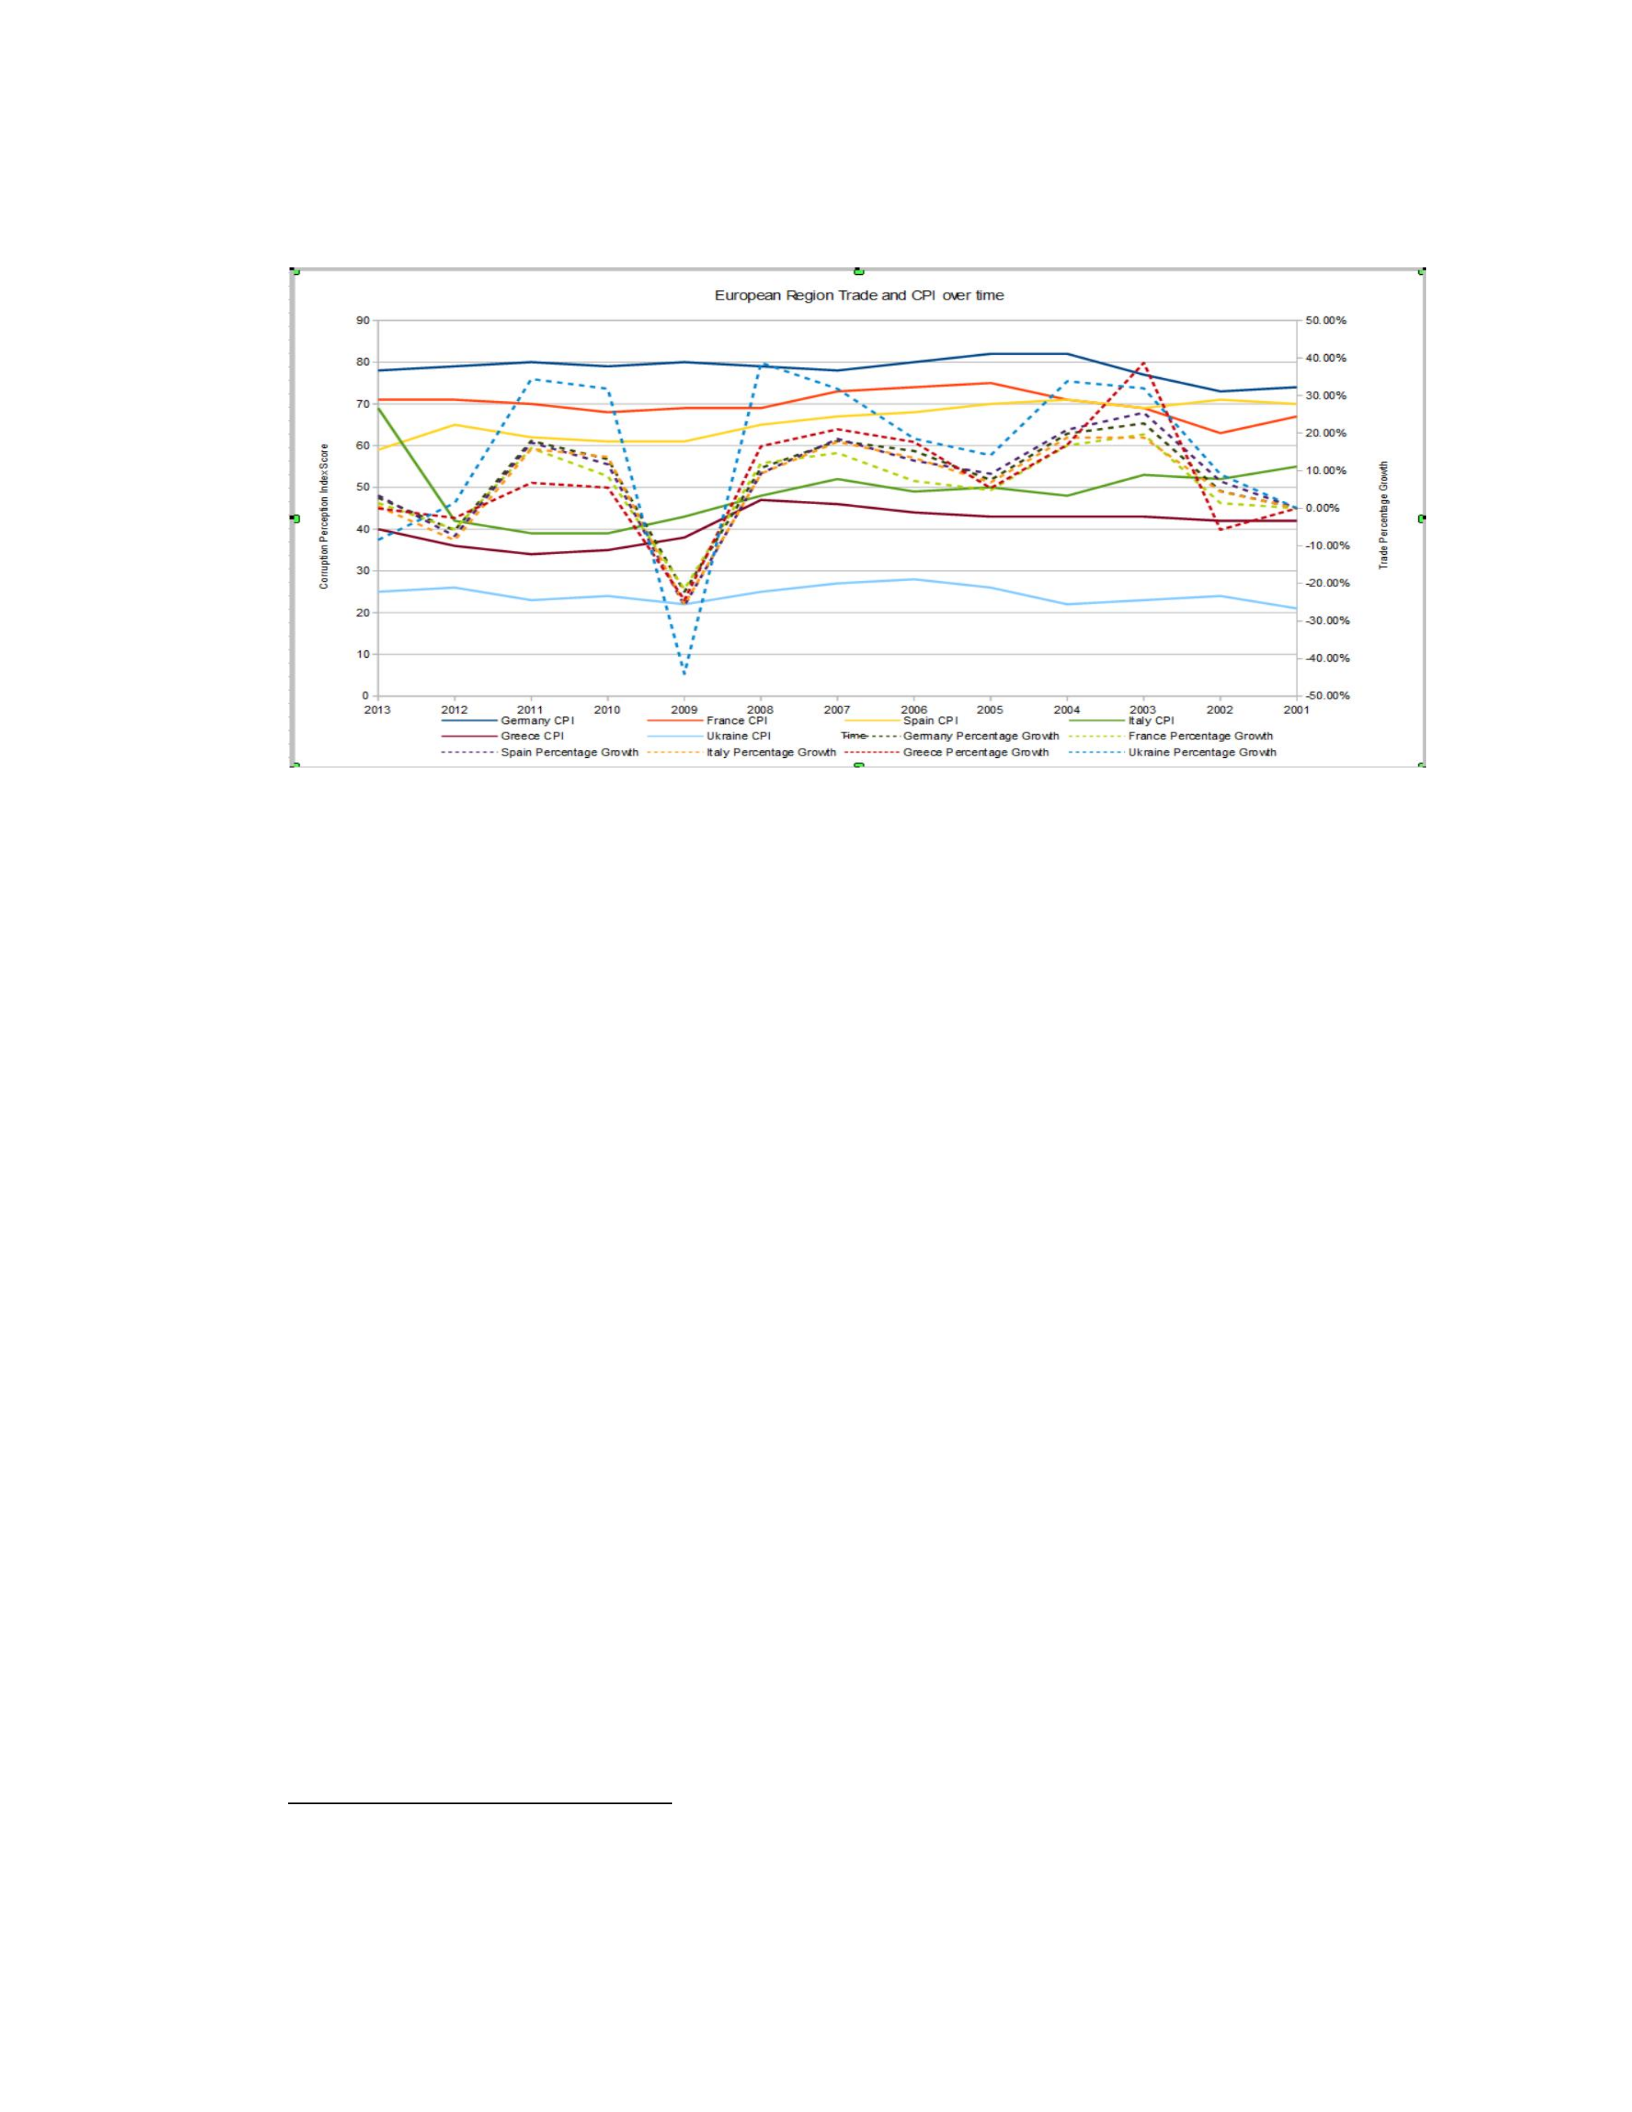
58
Graph E1: European Region Trade and CPI Score over time
10
An initial assessment of the data provides results similar to those found when
subdividing states by their average mean CPI score: states with similar CPI scores tend to
have a similar growth over time. Interesting to note in the data series is Italy in 2013,
which went from a CPI score of 42 to 69. While this data point may be an accountable
error due to internal government changes, in a similar fashion the economic growth of the
state had an increase from its negative growth in the previous year. Graph E1.1 will look
at the gross volume of trade to aid in the analysis: by providing this data, it will offer
insight into which state trades the most overall, aiding in establishing valid points of
analysis.
10
World Trade Organization (2014). Time Series Statistics Database ; http://www.transparency.org/research/cpi/overview
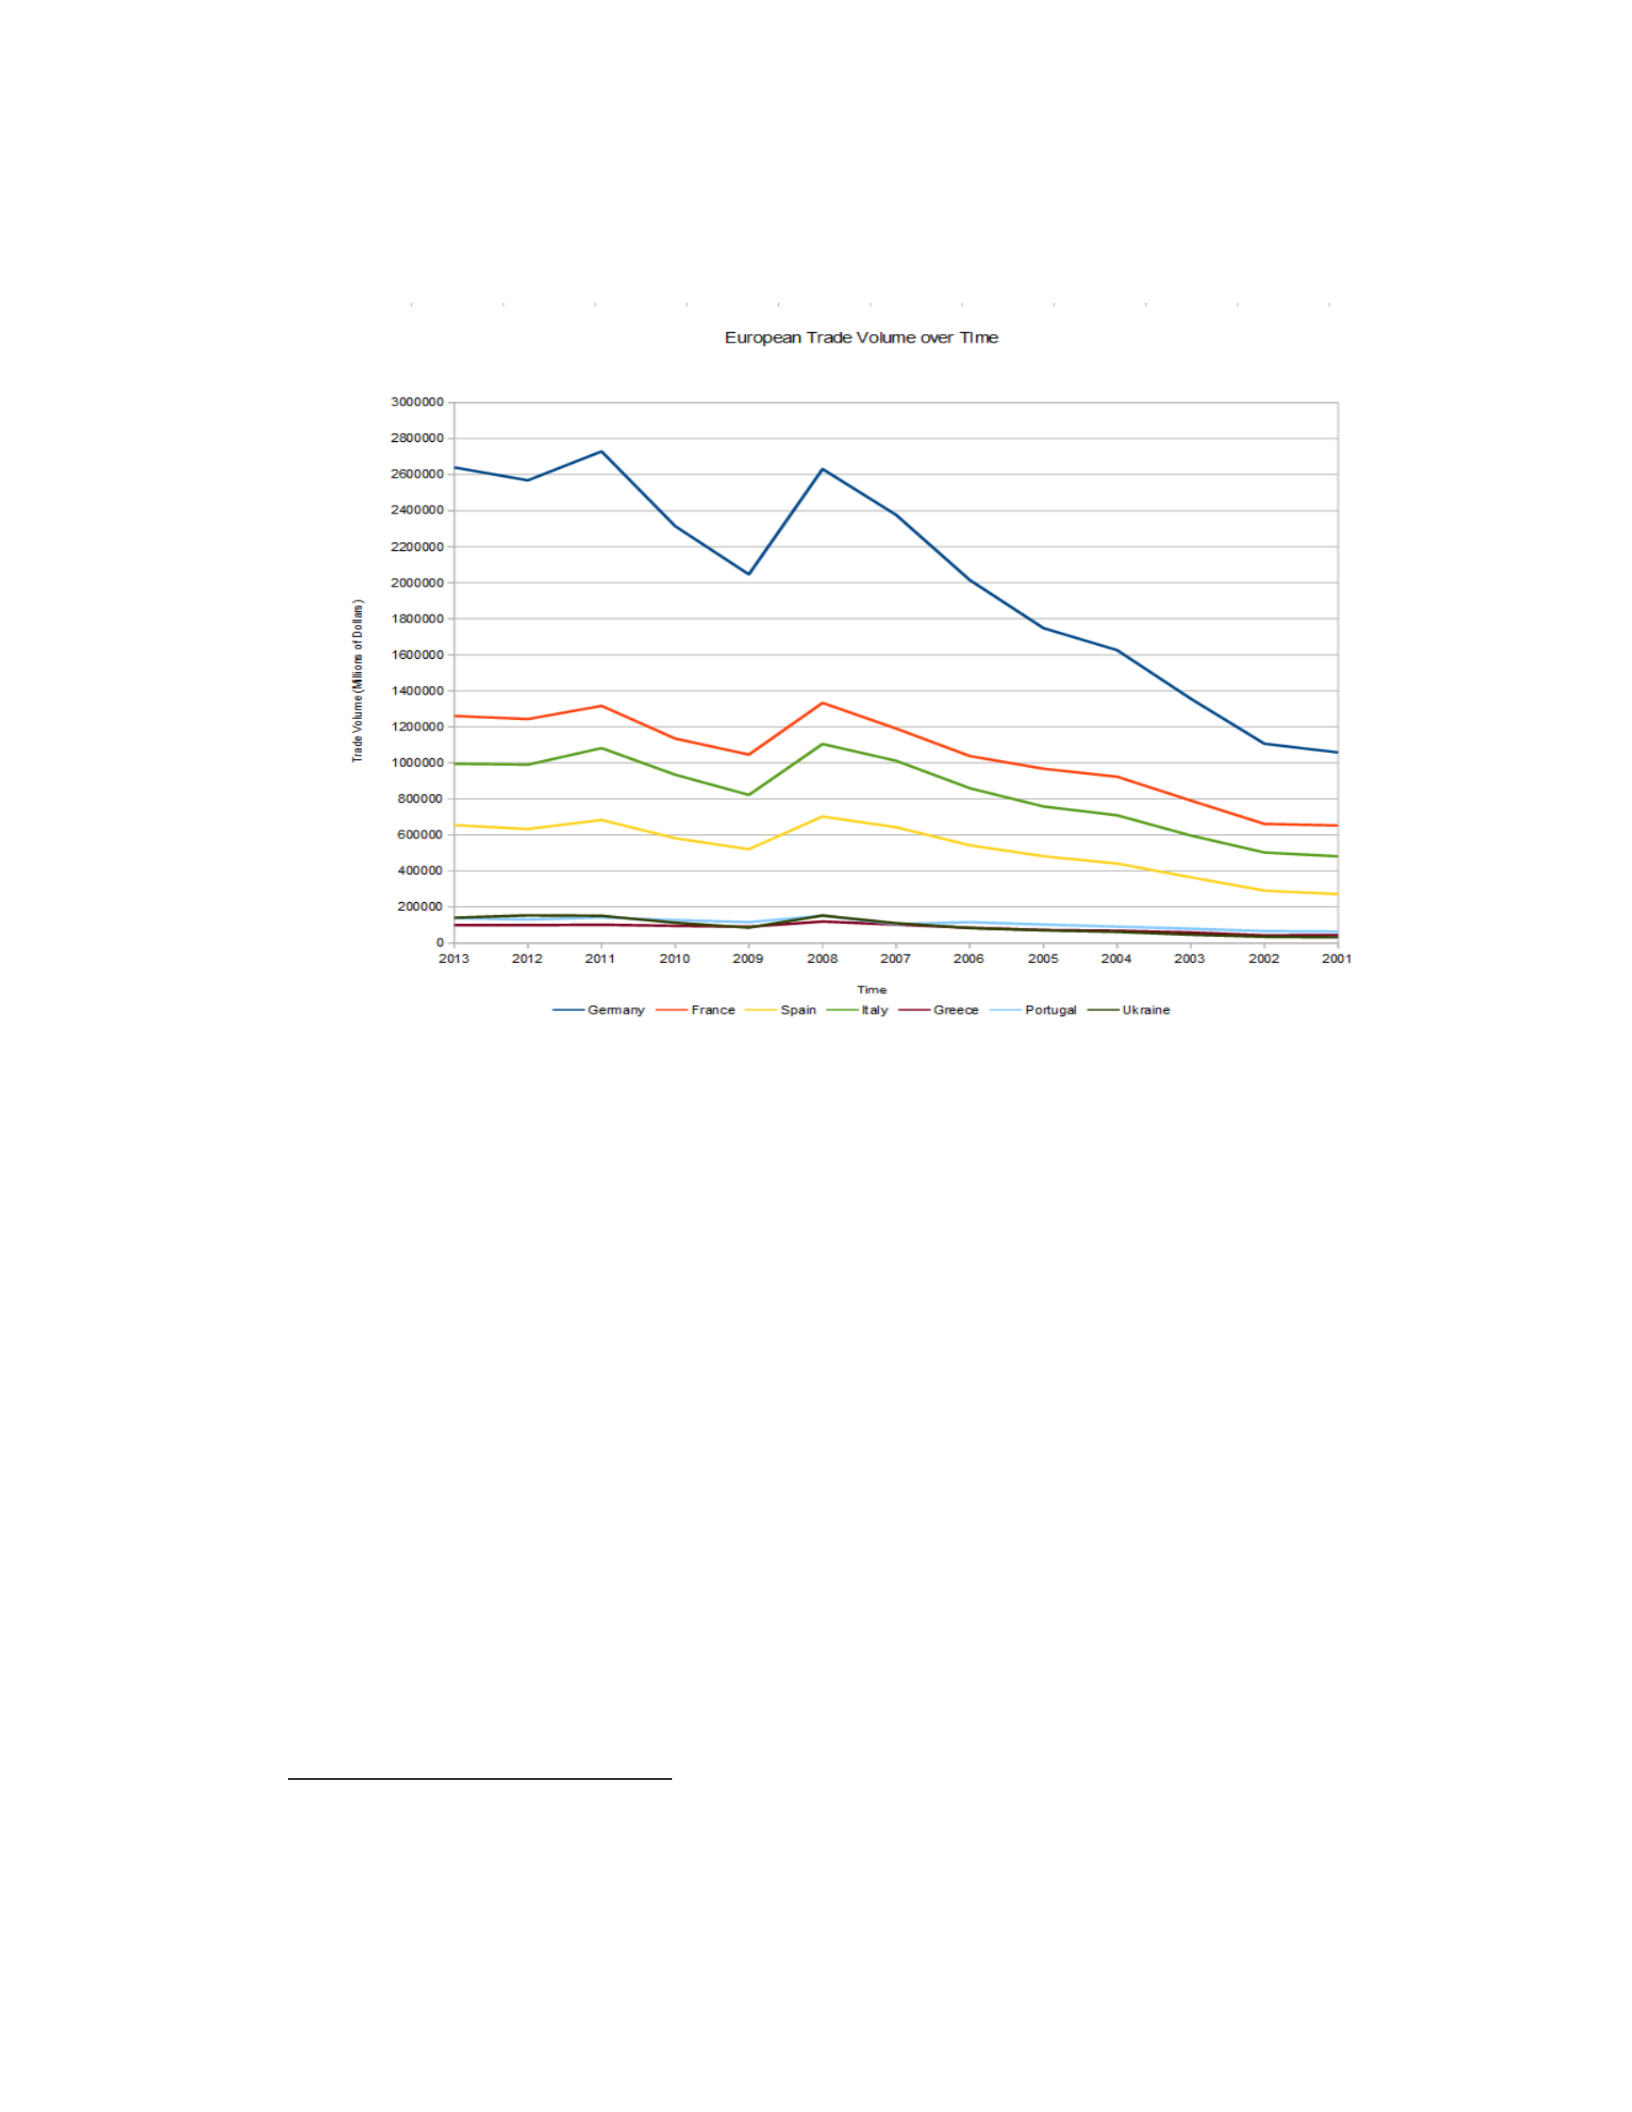
59
Graph E1.1: European Trade volume ( in millions of dollars) over time
11
The two charts allow for the following points to be made: most European Union
states tend to be more transparent than those which are not part. Greece, as an outlier, is
not the case, however it also suffers decreased trading. Ukraine performs as expected: it
has low trading by volume, and while it follows percentage growth patterns similar to
other states, it is also the state with the lowest CPI score overall.
Greece follows a similar pattern: while a member of the European Union, the fact
that his has low trade volume may affect the transparency of the state. The weakness of
the Greek financial and governmental approach has been brought to light by its joining
the EU and having to adhere to standards set by strong democratic and economically
11
World Trade Organization (2014). Time Series Statistics Database ; http://www.transparency.org/research/cpi/overview

60
sound states, such as Germany and France. This has caused the collapse of Greek
infrastructure. However the blame is in allowing Greece to join: a Bloomberg article
quotes former European Central Bank Chief Otmar Issing, stating that,
Greece was only able to join the euro through deception and the currency
bloc’s leaders have been “too polite” ever since to deploy adequate
sanctions that could have averted the region’s debt crisis (Bloomberg,
2011).
Greece, even being within the European Union, has a lower CPI and trade volume
due to the fact that practices of deception have caused insecurity in explaining Greece
has grown over time. Further evidence will be provided to explain why trading partners
whom Greece has chosen may further affect the data shown in Graph E1 and E1.1
Italy presents some interesting information: while its CPI score is not significantly
higher than those of Greece, it has a larger trading volume than states such as Portugal
and Spain, both which present a higher overall CPI score. In 2013, however, its CPI score
rose dramatically: this may due to internal governmental structures, which may bias the
data. For this reason it would make sense that Italy's CPI score may have been negatively
affected due to political instability within the state rather than by trade volume changes.
To further the analysis, I shall use the World Trade Organization's country profile
to see what state each country majorly trades with. This will assist explaining whether
states within Europe tend to trade with democratic entities and if they are considered
developed or not in accordance to our parameters (Appendix A).
Most of the states within Europe favor trading with the European Union as their

61
main import and export of manufactured goods; thus for the states which do so, it would
make sense that their CPI scores tend to deviate accordingly as the majority of trade
occurs with developed democracies.
France and Germany provide a strong correlation to our proposed hypothesis:
both states have increasing trade with a strong CPI score which sways as economic
changes affect the states. While both states strongly trade with China, the amount is
negligible in comparison to the overall focus both states have on trade within the
European Union.
The outlier to this is Ukraine, who tends to trade significantly more with Russia.
Important to note is that while Ukraine has trade agreements with the EU, it is not a
member state. This may help explain the reasons behind why Ukraine has such a low CPI
score: due to trading with a non-democratic entity, it is possible that shared economic
policies with Russia and support from the state may cause its CPI score to decrease.
In a similar fashion, Greece and Italy are major importers from Russia and China:
what this suggests is that trade with non-democratic states may damage the CPI score of
states who engage in large trading volume. Both states tend to have internal fiscal and
political issues which may alter the information and be beyond the scope of the thesis.
Spain and Portugal serve to further this argument: while their trading volume may
be lower than that of Italy, their trade partners tend to focus solely on democratic states
and majorly focus on trade within the European Union. This in turn suggests that while
volume of export and imports is correlated with transparency, the fact that trade partners
are democratic is crucial for a correct analysis of the data.

62
Europe as a region tends to support the hypothesis when applied to member states
of the European Union who tend to trade with democratic states. Italy and Greece are two
points of argument which may provide insight to fundamental factors which should be
analyzed to ensure that correlation between trade growth and transparency is not due to
external factors.

63
Chapter VII: Asia
Chapter VII analyzes the Asian region and assesses some of the focal players in
the region. This chapter will include an analysis of Russia, China, Japan, India and South
Korea.
Similar to Chapter VI, an analysis of the Asia Pacific Trade Agreement is looked
at as a source of information relating to the possible implications that this has on the data.
Furthermore, I analyze the WTO country reports to assess if each state is trading with
developing countries and democratic ones.
The Asia Pacific Trade Agreement, formerly known as the Bangkok Agreement,
was founded in November 2005. Its role, similar to the European Union, was to create
economic tariff concessions to member states and allow for facilitated trade within the
region. Of the states present in the discussion, China, India and South Korea are all part
of the Asia Pacific Trade Agreement (ESCAP, 2005).
The goals, as set out by the agreement, are to:
...promote economic development through a continuous process of trade
expansion among the developing member countries of ESCAP and to
further international economic co-operation through the adoption of
mutually beneficial trade liberalization measures consistent with their
respective present and future development and trade needs (ESCAP 2005,
pg. 4).
One of the fundamental points of the agreement is to promote the growth of the

64
member states which are considered developing economies by facilitating internal trade.
Due to this fact, APTA is fundamentally focused on the promotion of trade rather than
unification of currency, social norms or other facets which were proposed for the EU.
Furthermore, it also promotes external trade with developing states, with concessions
regarding allowance for exclusion of trade tariffs with developing countries. As Article 7,
titled Special Concessions to Least Developed Country Participating States, highlights:
Notwithstanding the provisions of article 5 of this Agreement, any
Participating State may grant to least developed country Participating
States special concessions which shall apply to all least developed country
Participating States and shall not be extended to other Participating States.
These special concessions shall be included in the National List of
Concessions of the preference-giving Participating State (ESCAP 2005,
pg.5)
An initial assessment of the goals of the APTA shows a willingness of member
states to facilitate trade coming from developing states. What this may suggest, in
accordance to our hypothesis, is that increased trade may strengthen CPI scores within
the region.
Furthermore, it is important to note that Russia is not included within the APTA.
This will become a focal point of argument in the upcoming analysis of the data. Not
only is this one point, but the trade relation between the United States and Japan is also
examined.
Having assessed and analyzed the effects that the APTA may have on member
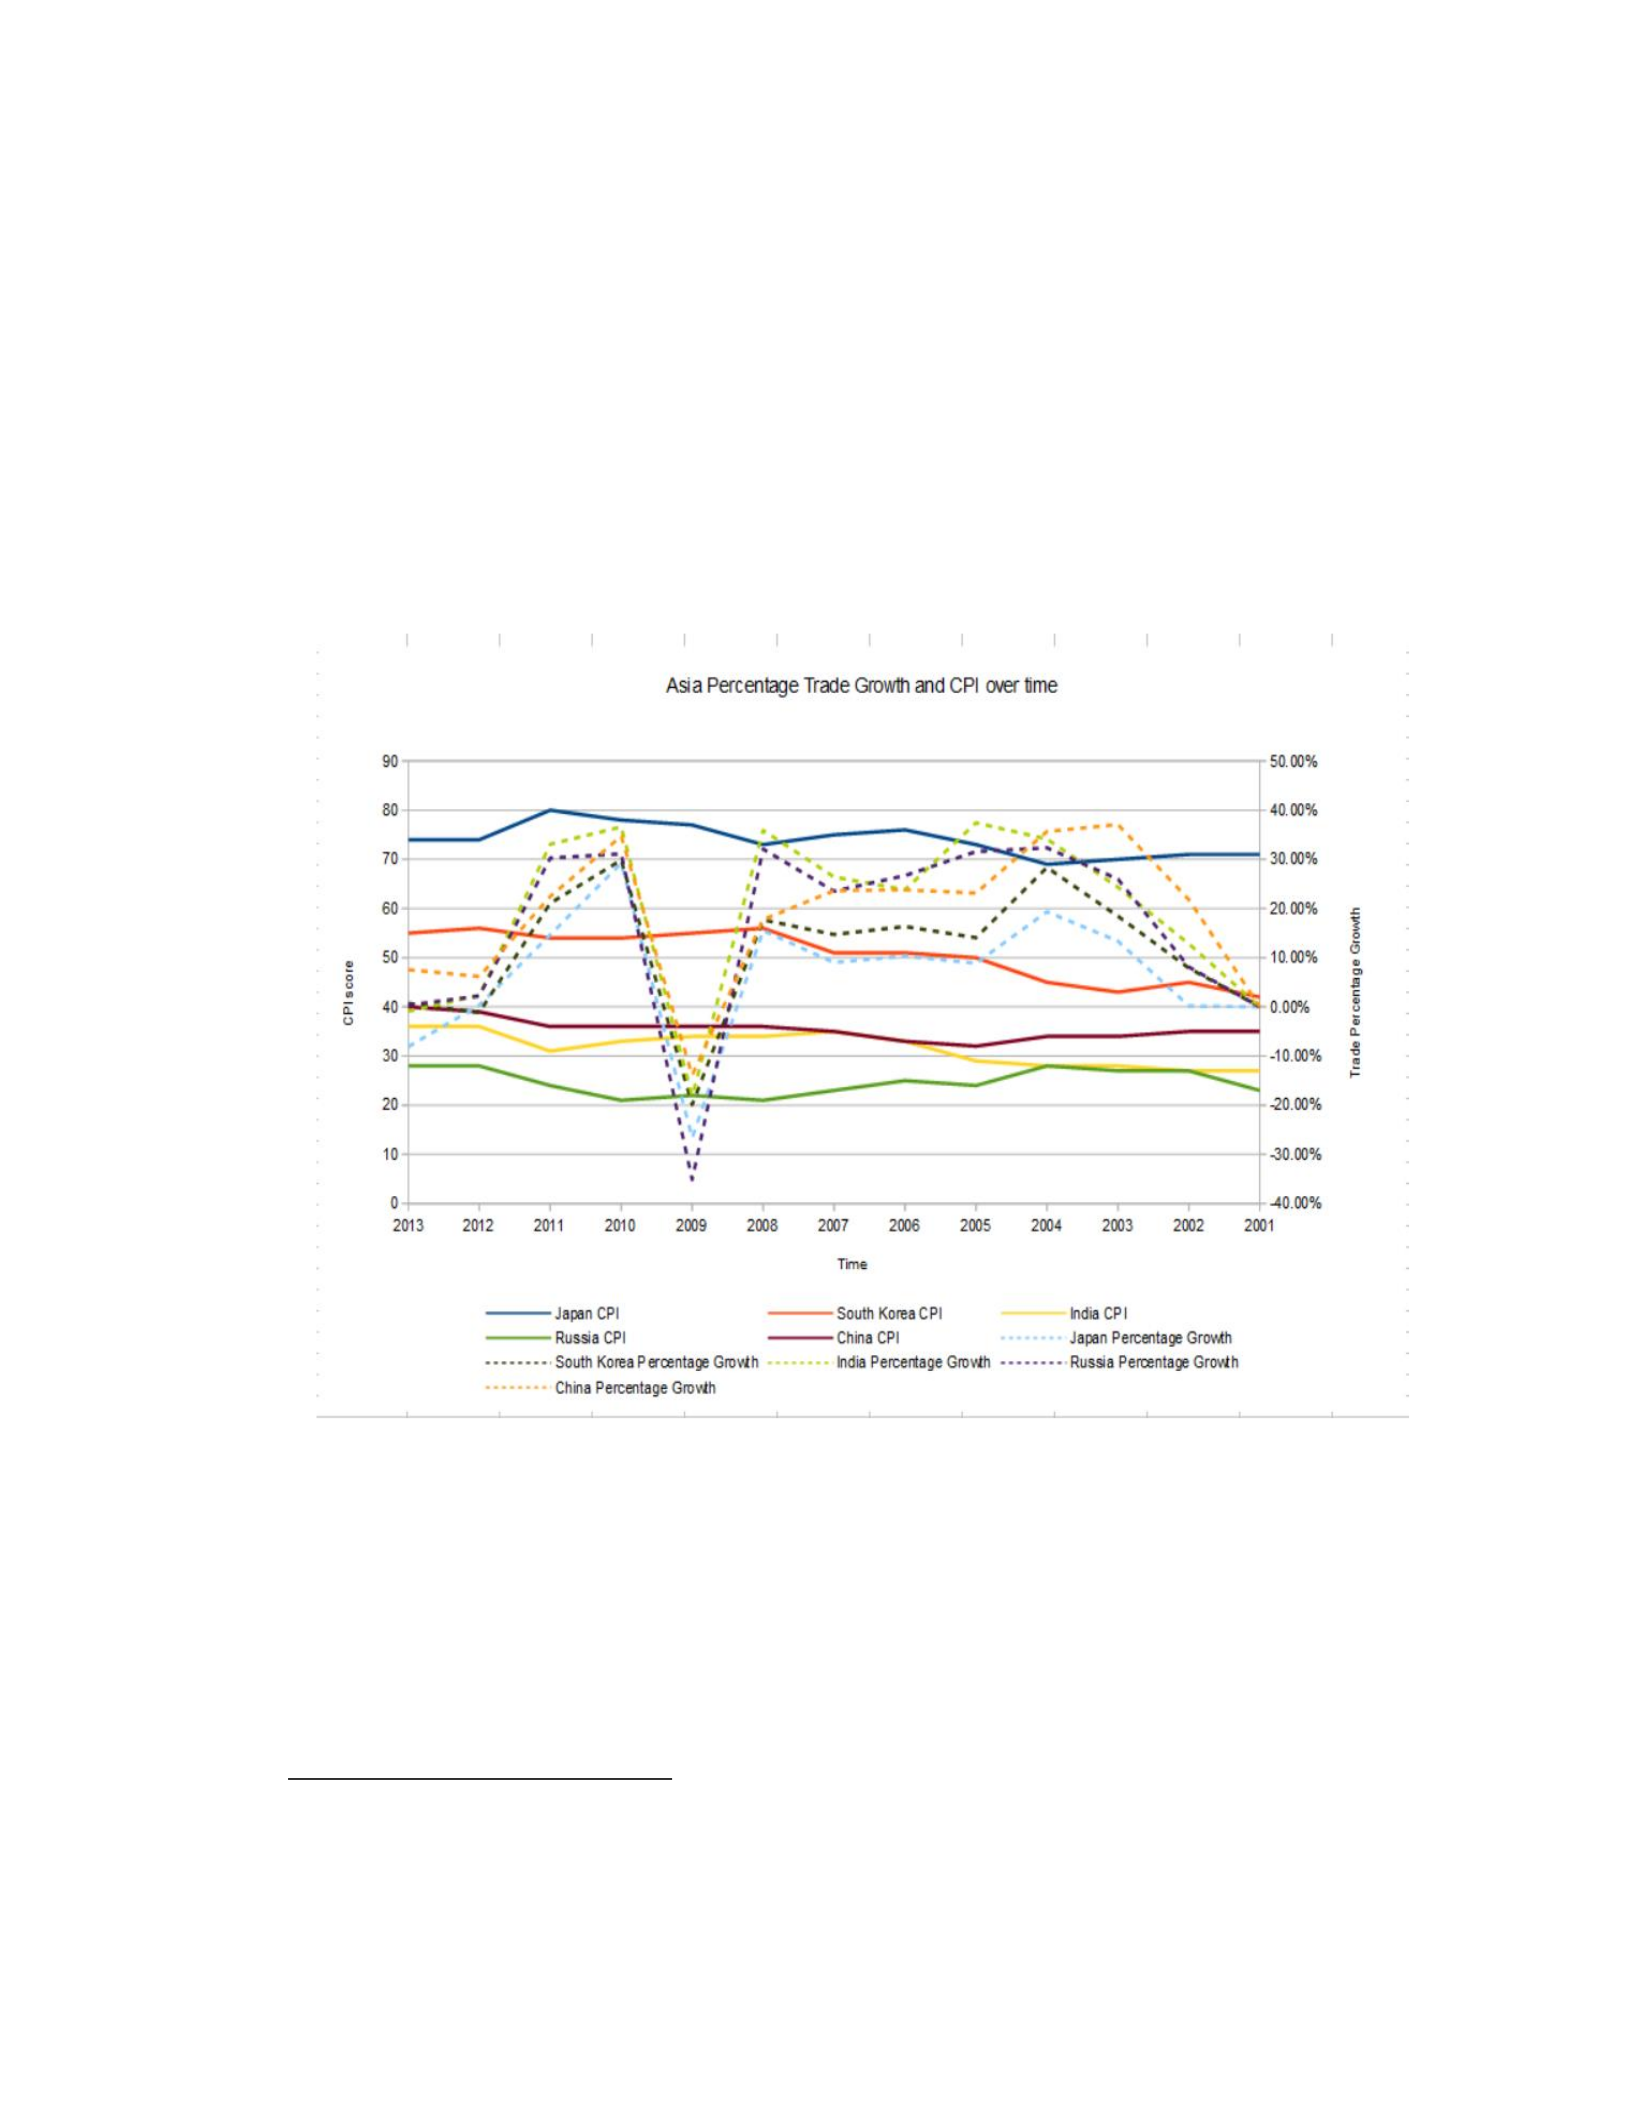
65
states within the region, it is now fundamental to begin an analysis of the data provided in
Chapter IV relating to the Asian region. Graph F1 will portray the data relating to the
percentage trade growth and Corruption Perception Index of states over time. Graph F1.1
supports the data by providing the raw trading volume of the states over time.
Graph F1 : Asia Percentage Trade Growth and CPI score over time
12
12
World Trade Organization (2014). Time Series Statistics Database; http://www.transparency.org/research/cpi/overview
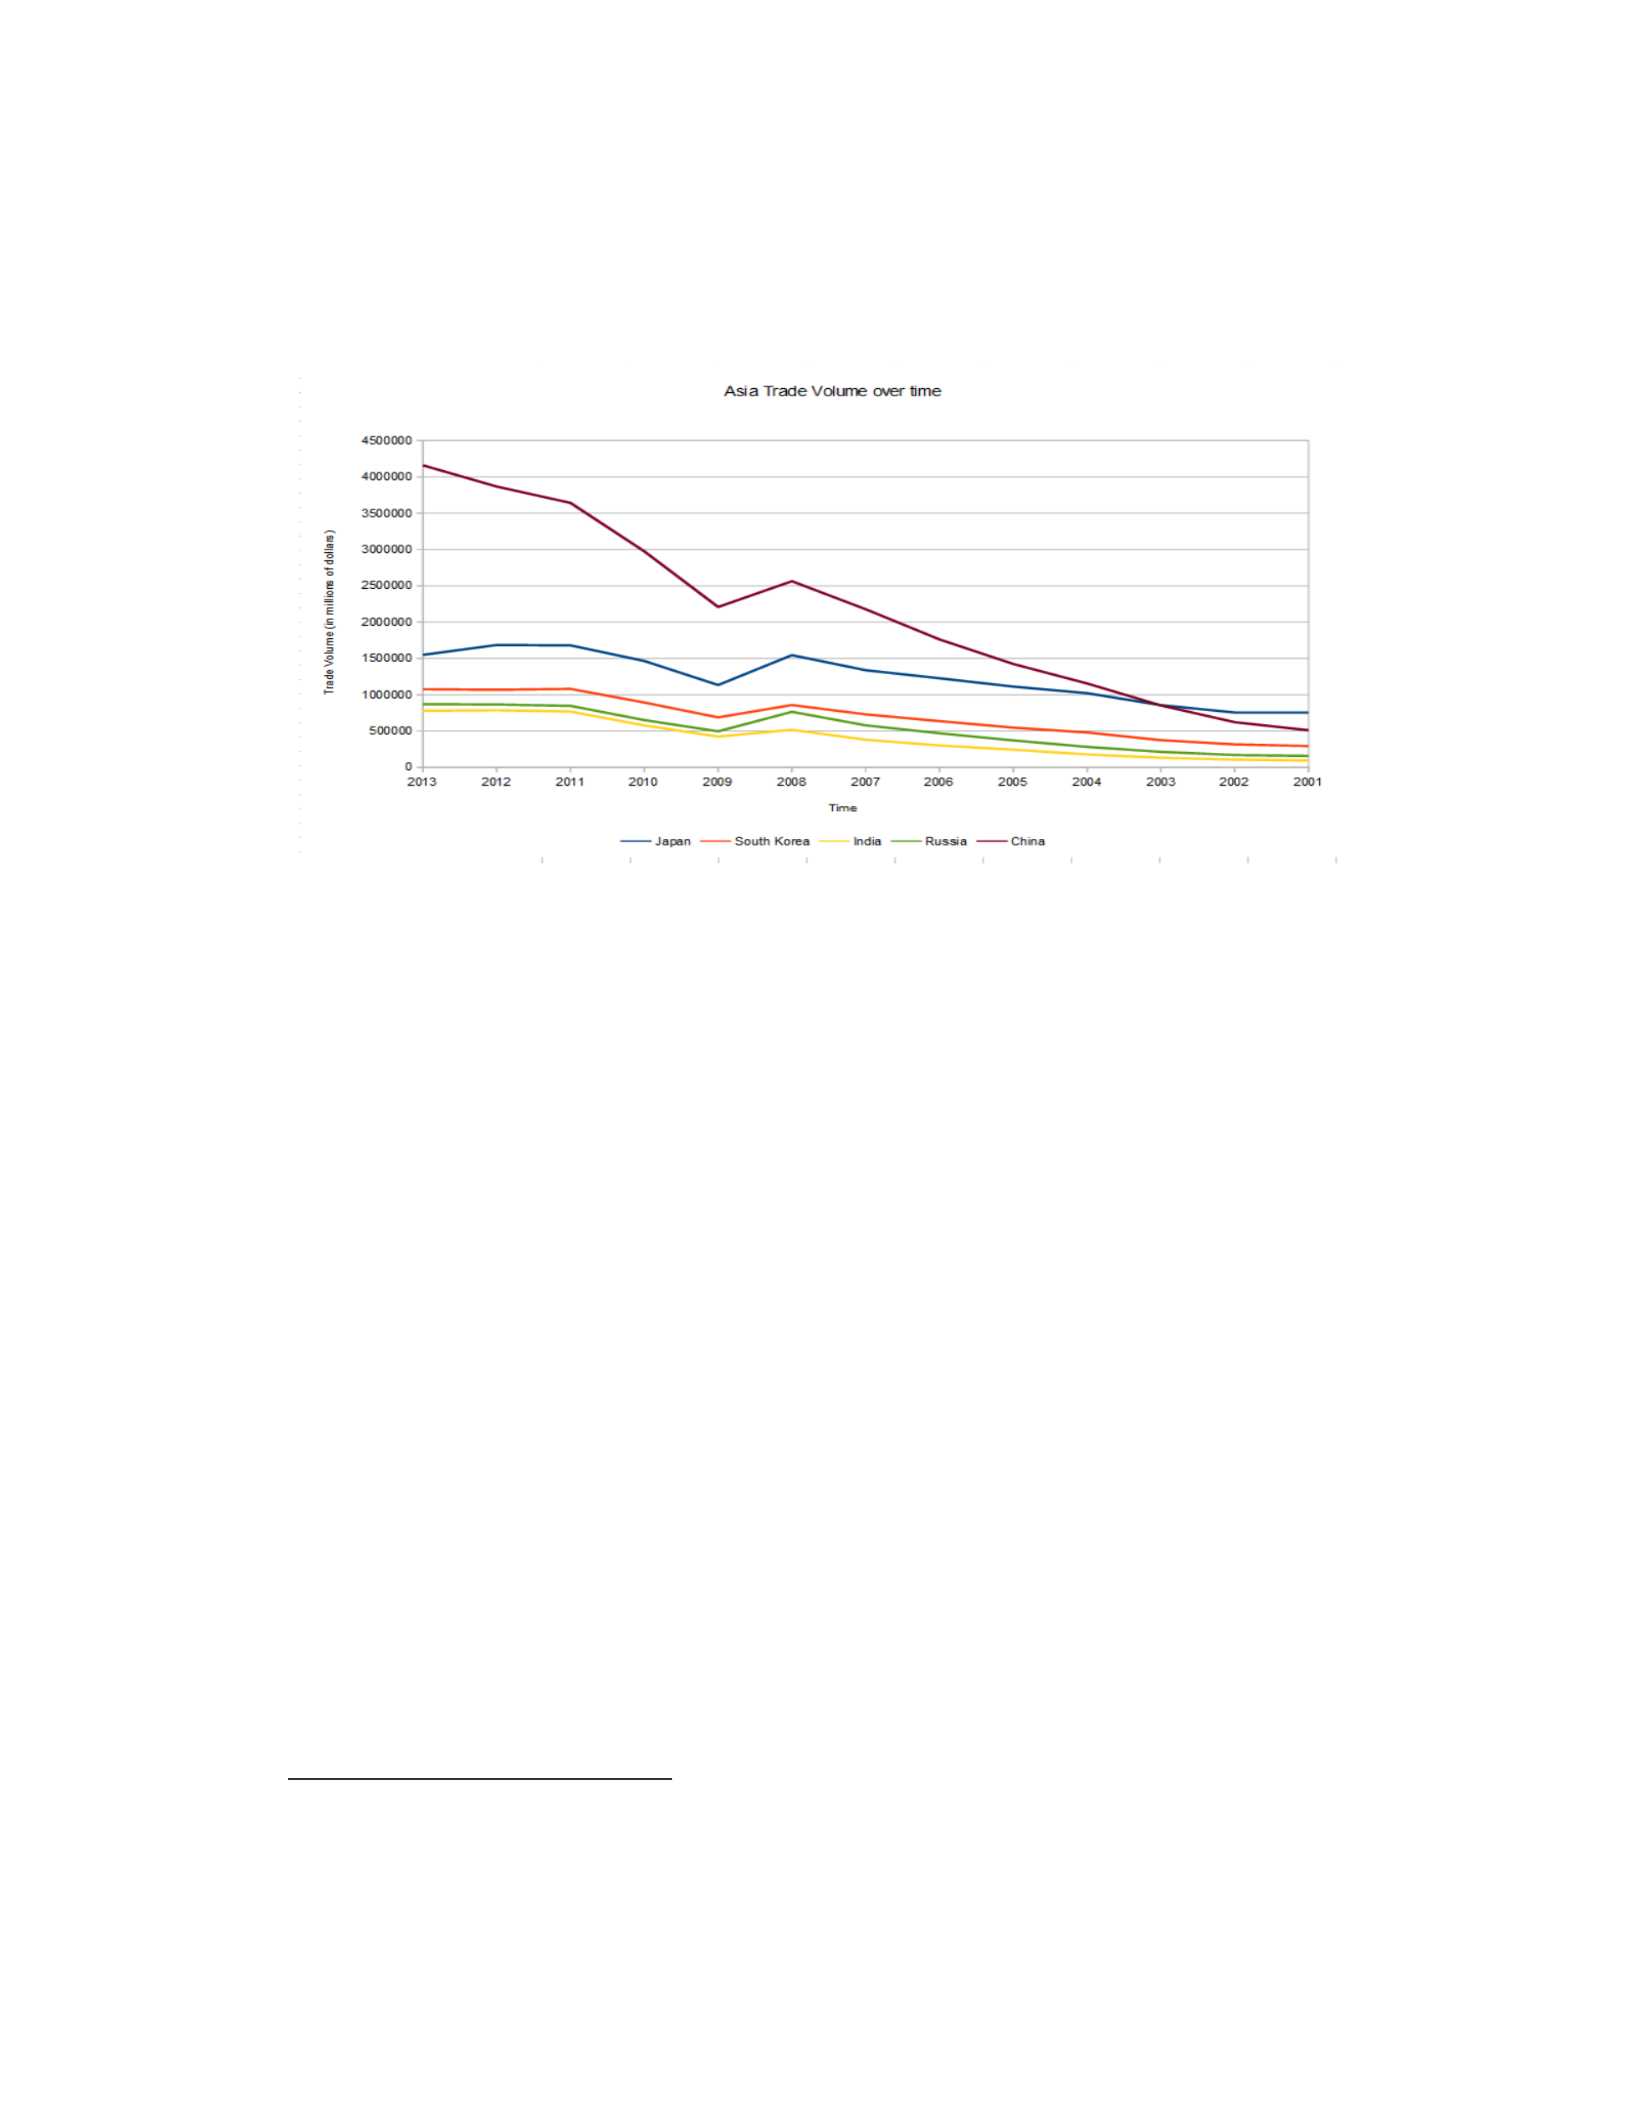
66
Graph F1.1 : Asia Trade Volume Over Time
13
The findings shown in the graphs yield useful information relating to the
correlation between trade and transparency. It is important to start the analysis by
pointing out that of the chosen states, the only developed countries, according to the
World Bank and IMF, are Japan and South Korea.
While Japan has the highest CPI score over time, it is China which shows the
most trade by volume: this posits an interesting point of discussion relating to the effects
the form of government and development status have on transparency. China is in fact
both a non-democratic and developing state, and while data relating to its CPI score seem
indicative of these facts, the fact that it remains one of the largest traders globally goes
against the proposed hypothesis.
While its CPI score is not the lowest in the region, it does not support the
proposed hypothesis. Not only is the fact that by volume China trades the most, but the
13
World Trade Organization (2014). Time Series Statistics Database; http://www.transparency.org/research/cpi/overview

67
economic effects of trade on transparency tend to be less drastic on China than other
states: in 2009, as displayed in Graph F1, China suffered the least negative growth,
decreasing trade by only 13.88%. Similar to findings suggested in chapter IV, it seems
that non-democratic states and developing states suffer less CPI score changes due to
trading volume changes.
This information will be crucial in assessing what effects trade has on states in the
case in which a state is either non-democratic or developing. Russia, as an example, has a
larger trading volume than other states, but the transparency of its government and its
corruption index are not correlated directly with these findings. Russia, similar to China,
is considered a non-democratic developing economy: however one major change is the
fact that, in accordance to information provided by the WTO country profiles, its largest
export and import routes tend to be with the European Union.
While its largest trade partnership is with the European Union, it is also heavily
invested in trade with China: it is interesting to then observe that it is Russia in fact which
has the lowest CPI of the region. Furthermore, Russia's correlation tends to mimic that of
Ukraine: as Mikhail Balaev presents in his work The Effects of International Trade on
Democracy: A Panel Study of the Post-Soviet (2009), Russia utilized its economic
prowess to leverage its international position. Balaev furthers the point by presenting
evidence to the historic actions Russia used to gain such power:
In the 1990s, Russia was occasionally reducing the energy supplies
to Ukraine, thus forcing it to join various security and economic
agreements within the CIS. In 1997, the Russian government forfeited the

68
debt of Belarus in exchange for Belarus’s entering into a formal union
with Russia. The combination of the post-Soviet nations’ economic
dependence on Russia and the frequent political decisions that favor
Russian policy leads to the conclusion that Russia uses its economic ties as
a tool to increase its political power internationally and to rebuild a form
of hegemony in the former Soviet geopolitical space (Balaev 2009,
pg.341)
What this shows is not in support of the hypothesis, as trade with democratic
states does not seem to help Russian transparency. This is in stark contrast to China, who
has had a constant increase of its CPI score as its trade routes with the United States have
increased.
Mikael's article “The Effects of International Trade on Democracy: A Panel Study
of the Post-Soviet World-System”(Mikael 2009) help to show the effects that internal
political dispute and the effects the dismantling of the Soviet Union may have on
explaining the reduced transparency Russia shows world-wide. As Mikael presents,
The problem here is that equal weight is allocated to each dollar
regardless of the origin of the transaction. In this analysis, all economic
ties a priori are considered to have the same effect on the nation’s
domestic politics, which is not true. For example, a one-dollar trade that
Russia executes with the United States may not carry the same theorized
political weight as a one-dollar trade with Bolivia or Guatemala. Such
analytical settings may not be problematic for the analysis of the Western

69
democracies (political equals), but it can create major problems in the
analysis of less developed countries(Mikael 2009, pg.338).
While using a common currency to describe volume of trade may help alleviate
bias tied to currency value changes, it is important to also acknowledge the political
effect currency has on developing countries and their ability to compete in an
international market.
As it has been stated, most states in the analysis of chapter VII are considered
developing states, which, as Mikael points out, may change the way states function
internationally and the rate at which trade can affect internal political decision making.
An analysis of Indian trade patterns will also help to further the concepts Mikael
brings up. A focus on India is crucial as it provides support to the findings relating to the
difference that a developing state has on the legitimacy of the hypothesis. With a large
trading volume and a growing CPI score over time, India is one of the largest regional
entities both politically and economically.
Furthermore, as Rajamaran shows in his work “Fiscal Transparency”, India serves
as an indicator of how transparency may vary internationally due to the work of internal
agencies (Rajamaran, 2002).
Rajamaran argues that one issue developing states in Asia face is due to fiscal
transparency and the regulations set forth by the IMF in defining how states present
information relating to their markets (Rajamaran 2002, pg. 4885).
The issue is that in developing countries, systems of reporting are hard to
formulate and rely on transparency existing between the internal private industry and the

70
efforts of the government to appear fiscally transparent in an international market. This in
turn can affect the perceived perception governments have of other states and alters their
internal political reporting standards.
Similar to the fiscal indiscipline shown by Greece, Italy and Spain in Europe,
developing countries tend to reduce reporting to hide potential negative growth in the
state to better appease international investors (Rajamaran 2002, pg. 4888).
Having identified potential biases tied to developing and non-democratic states, it
is now important to turn the attention of our analysis to Japan and South Korea, the two
democratic states within chapter VII.
It is important to note that Japan is the state with the highest CPI score in the
region and is the second largest exporter and importer. Japan as a state supports our
hypothesis, as both its volume of trade and CPI score have grown positively over time.
However, in the last 2 years Japan has seen both a decrease in volume of trade and CPI
score.
The information provided by the World Bank relating to Japan's trading habits
also point to its largest trade partner being the United States, another developed
democratic state. Not only is Japan a state which predominantly trades with the United
States, but it also shares strong defensive and economic treaties with the country. Such a
strong connection, both economically and socially, to the United States may serve as
evidence to the importance trading is in reinforcing transparency between democratic
states.
Japan is both a democratic and developed state and similar to the evidence

71
provided for European States, it seems to support a correlation between growth of volume
of trade and growth in economic transparency.
Furthermore, it is important to note that even the states which tend to correlate
less than others, as an example China, still have a growth of CPI score as trade increases.
As graph F1.1 demonstrates, it is still possible to show that transparency increases as
trade does, even if the change in growth is something to note. Furthermore, internal
political issues may present a further bias to why transparency may be lower in given
years. In a similar fashion, the recession in 2009 is another phenomenon which alters the
data and is beyond the scope of the thesis.
In a similar fashion, South Korea follows a similar pattern of growth and also has
a decrease in CPI score and volume of trade in 2012 and 2013. One crucial difference is
the fact that, according to IMF and World Bank GPI per capita, South Korea is not
considered to be a developed country as of yet.
Strong political tensions with North Korea have also brought up discussion to the
legitimacy of describing South Korea as democratic. This may be reflected in the fact that
South Korea is within the mid-quartiles of CPI scores both in the region and globally. It
once again shows the importance that both the form of government and status of
economic development may have on determining the transparency of a state.
However, both states support our proposed hypothesis. Yet the divergent
information non-democratic developing states provide may point to potential external
sources which may dictate what factor affect transparency globally for states. An
analysis of Russia and India have helped delineate how volume of trade may not be

72
sufficient a measurement to determine transparency, as described by CPI score. A further
study relating to South Korea and Japan, however, helped to show that form of
government and form of government do matter in assessing the effects volume of trade
has on transparency. It is crucial to acknowledge, however, that as trade increases for the
states discussed, their CPI ratings do tend to generally correlate positively.

73
Chapter VIII : Africa
In this chapter, I analyze how African states are examples of countries with a high
corruption index, low transparency and also have the lowest overall trade. Africa is also
composed mostly of developing countries which deal primarily in raw resource trade.
This renders their condition interesting as their trade volume may be high, but the costs at
which they are selling their product is not. I also define which African states can truly be
considered democracies shall be analyzed. Furthermore, it is important to acknowledge
that the data shows that reduced CPI indexes means that growth in trade may affect states
differently.
Furthermore, various trade treaties and organizations exist in Africa: The
Economic Community of Western African States (ECOWAS), Common Market for
Eastern & Southern Africa (COMESA) and the West African Trade Organization
(WATO). While the relevance of treaties has been ascertained in previous sections, it is
unlikely that this will be relevant in the study of the chosen states.
Each is member of multiple trade agreements and the rules governing each are
beyond the scope of the analysis. Instead, an analysis of the concept of most favored
nation will be provided to explain some of the factors which may affect trade with
developing states.
The existence of a multitude of trade agreements presents an initial divergence
from the other regions we have looked at: most African states in fact do not primarily
trade within the continent, but rather do so globally. In stark contrast to many other states,

74
trade agreements between African states are aimed at aiding international competition
and are generally enforced through the World Trade Organization's most favored nation
clause (Hurd 2011, pg. 41).
A further reason to choose to analyze the WTO here is for a problem with African
states reporting accurate data relating to their economic practices. Due to the low CPI
scores of most countries involved and the fact that the treaties may not be truly enforced,
it may aid the analysis to focus on the policies enacted by the WTO.
The importance of equal opportunity to trade is set forth in Article II, stating that
“each contracting party shall accord to the commerce of the other contracting parties’
treatment no less favorable than that provided for in the appropriate Part of the
appropriate Schedule annexed to this Agreement” (Hurd 2011, pg. 63).
However, it is Article III of the World Trade Organization charter which most
affects developing countries. Declaring that
the products of the territory of any other contracting party shall not be
subject, directly or indirectly, to internal taxes or other internal charges of
any other kind in excess of those applied, directly or indirectly, to like
domestic products (Hurd 2011, pg. 63),
Article III regulates tariffs and sets the amount which may be charged for the
export and import of goods. While these may theoretically allow for the equal trade of
products, developmental costs, industrialization and diversity of products must be
accounted for. The production of goods by states which have a diversified basis of trade
is favored. By equalizing tariffs set for similar products, Article III allows for developed
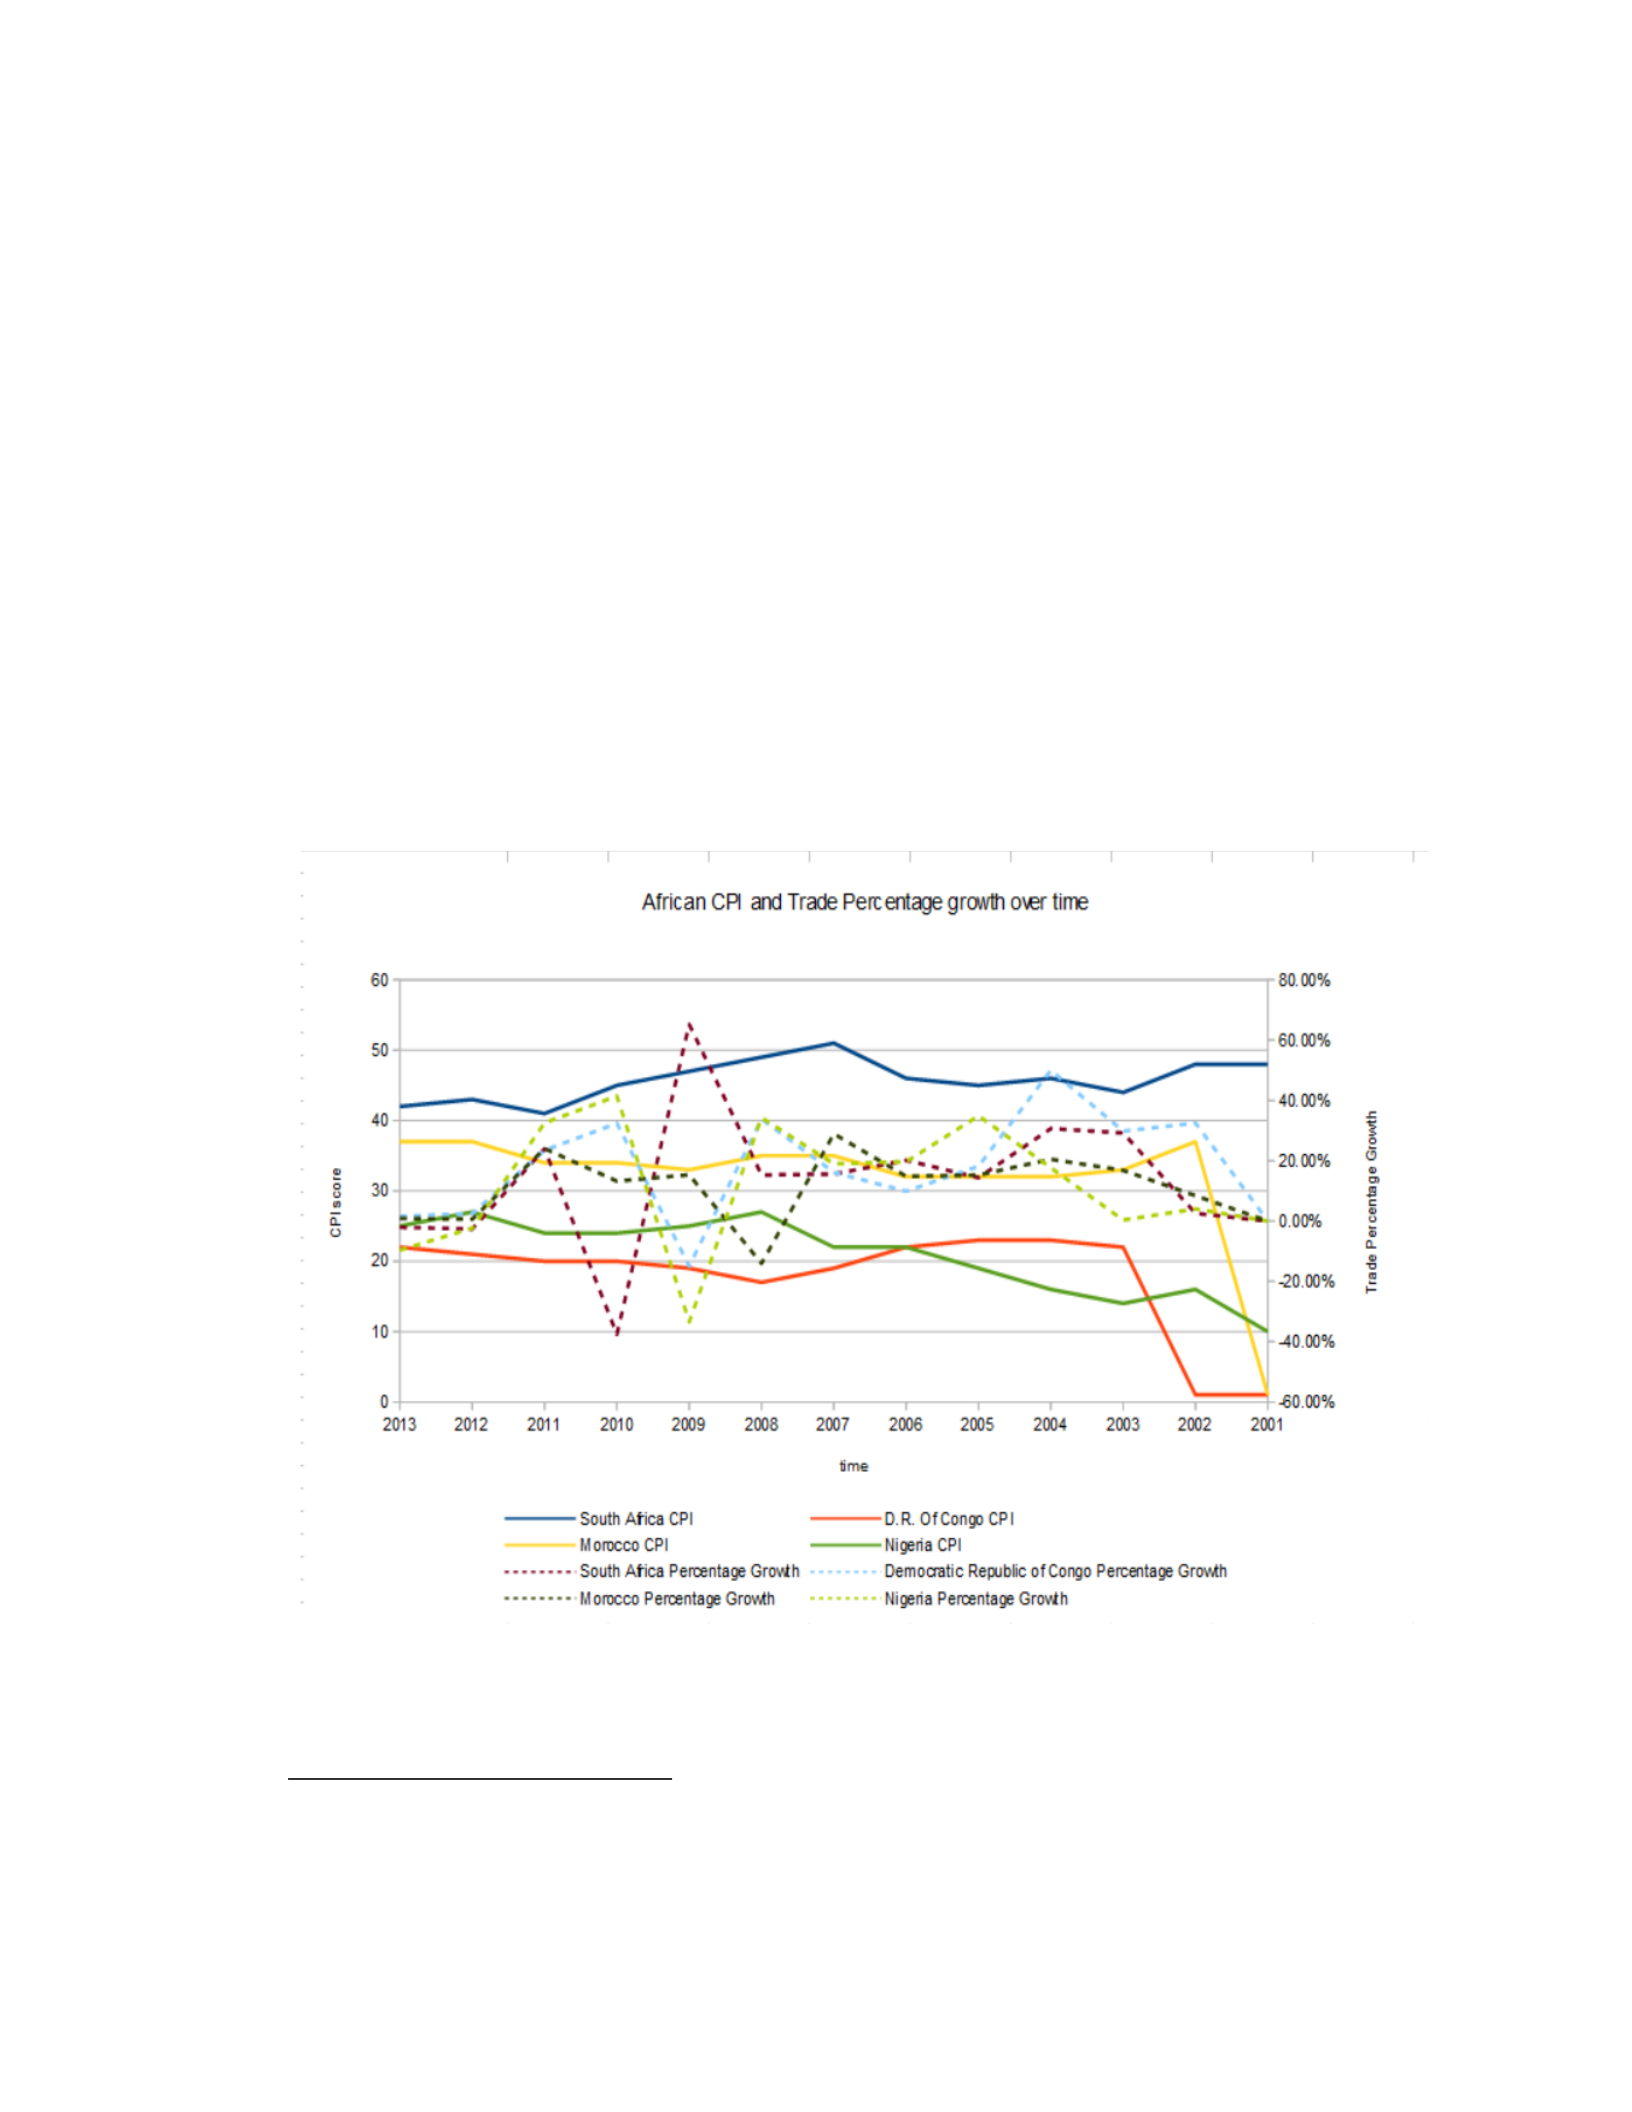
75
economies to not have their prices undermined by cheaper production costs. However, it
also sets forth a barrier for states which specialize in an export, forcing them to have to
sell the product at a price which may not be beneficial to the state.
With a preliminary analysis of the WTO and its effects on trade with most favored
nation, what follows is an analysis of the data presented in chapter VI relating to African
States. Graphs G1 and G1.1 show, respectively, the CPI score and trade percentage
growth over time and the overall trade of product over time.
Graph G1 : African Percentage Trade Growth and CPI score over time
14
14
World Trade Organization (2014). Time Series Statistics Database; http://www.transparency.org/research/cpi/overview
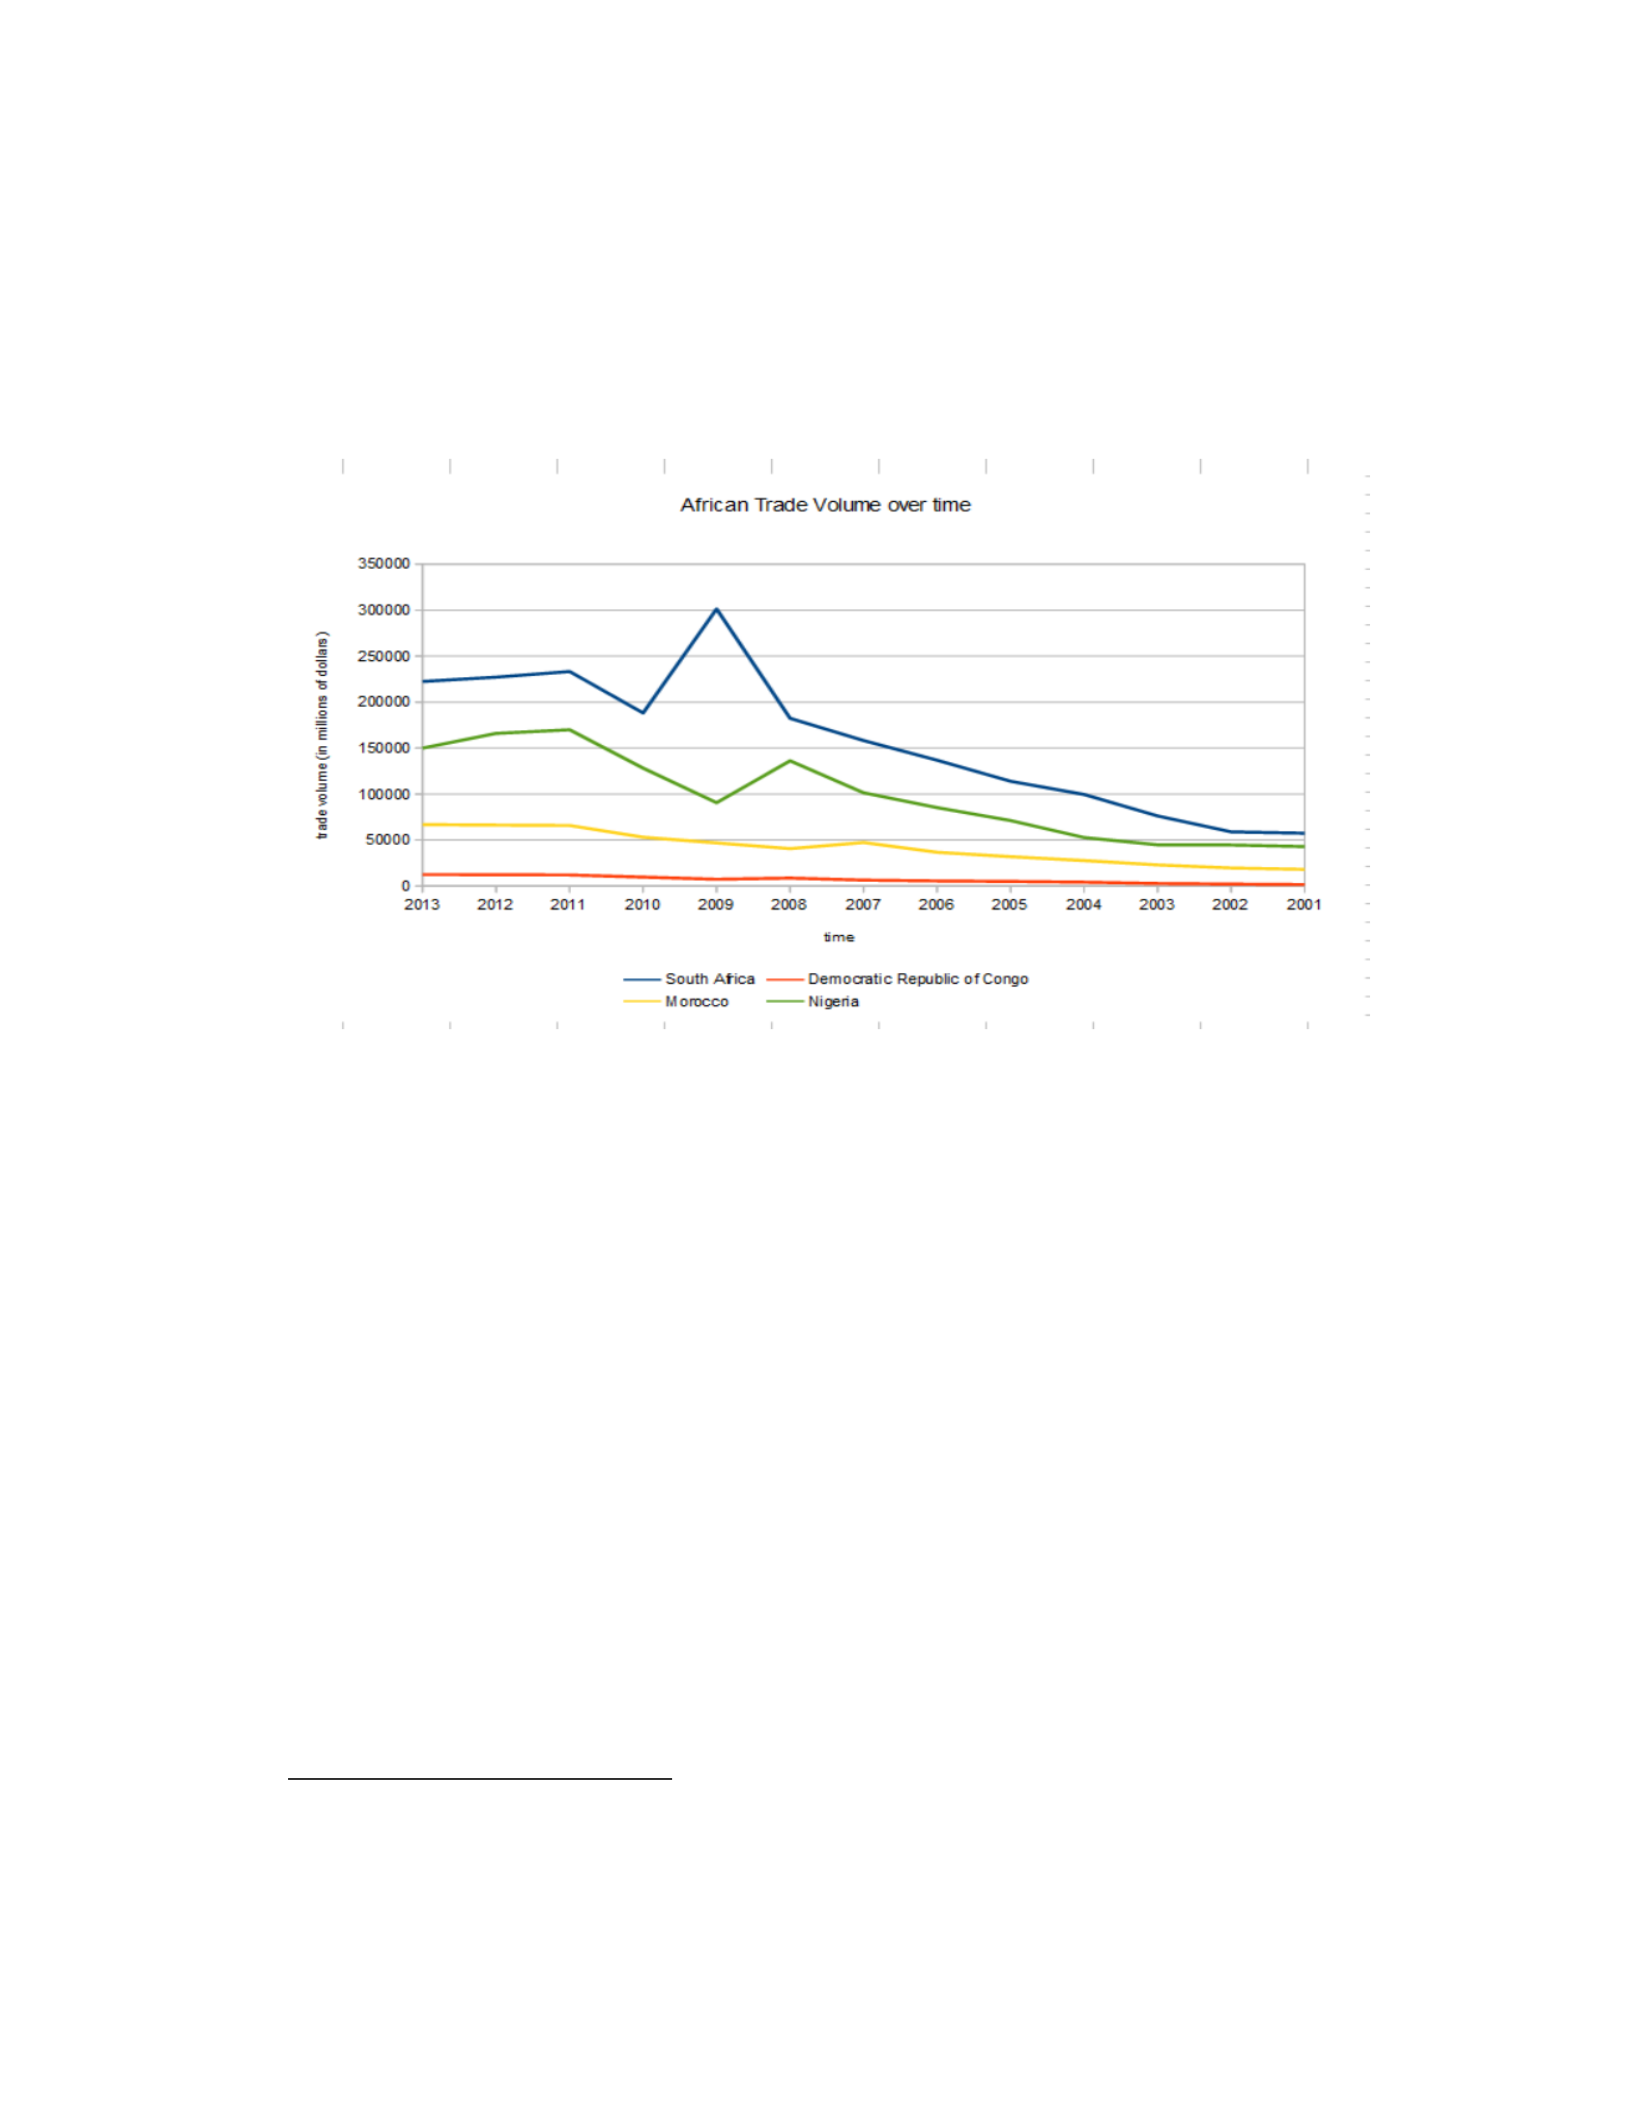
76
Graph G1.1 :African Trade Volume Over Time
15
Of the countries analyzed in Africa, one apparent issue arises: the trade volumes
of Nigeria and the Democratic Republic of Congo, according to the World Trade
Organization, were estimate sums based on other reporting. Of the states analyzed, except
for South Africa, none of the other states met the criteria to be defined as democracies.
Furthermore the African region is composed of mostly developing states. These factors
are crucial in understanding why the data, when applied to African states, does not
correlate as strongly as in other cases.
It is important to note that the Democratic Republic of Congo also lacks CPI
indexes for 2001 and 2002. Furthermore, an analysis of the country profile, as reported
by the WTO, does not show the major trade partners for the state. What this points to is
15
World Trade Organization (2014). Time Series Statistics Database ; http://www.transparency.org/research/cpi/overview

77
issues within the states with reporting. This affects both the volume of trade and the CPI
of the states presented above. A similar issue presents itself with Morocco and Nigeria,
which once again may delineate an issue with the application of the hypothesis.
The difficulty to ascertain if a correlation exists can be caused by a multitude of
factors affecting the states, but for the sake of the thesis, the argument will be put forth
that due to low trade volume, transparency was not a concern of the states at the time.
However both Nigeria and Morocco do show a positive correlation between volume of
trade and CPI index, even if the changes in this case are minimal.
An exception to the rule is the leading state in both CPI and trade in the region,
South Africa. Graph G1 shows interesting patterns of growth for South Africa: while
most other states tend to have a decline in economic prosperity during the 2008 to 2009
period, South Africa shows an increase in growth of import trade. Not only, but during
the same period, the transparency of the country tends to decrease.
An argument can be made that internal activities, such as the setting up for the
World Cup, could have affected the economic and political infrastructure of the country.
Another issue which requires further study is the effects that colonialism has had on the
developments of states within the region. While this issue merits further study, it is
beyond the scope of the thesis.
South Africa is also a large trade partner of the European Union, which may be a
reason for why the state tends to provide better information and have a larger trade
volume. However the data presented does not support the hypothesis presented. As
previously mentioned, states with low CPI scores do not seem affected as much by the

78
volume of trade as they should have.
The importance of analyzing the African region and to point out the difficulties in
determining if a correlation exists provides insight into issues which exist with the thesis.
States which are not transparent do not provide accurate information relating to their
trading behaviors.

79
Chapter IX: The Americas
Chapter IX analyzes the data gathered relating to North and South America. In
this region, I include Canada, the United States, Brazil, Argentina and Mexico. I shall
discuss how the North American Free Trade Association (NAFTA) and the Latin
American Free Trade Association (LAFTA) affect trade and transparency within the
region. Furthermore, an analysis of the differing economic and political models present in
North and South America will be used to present evidence supporting the findings
presented in the previous chapters.
The United States will be a focal part of this chapter. As one of the largest
economies in the world, the United states is a crucial player in pushing for transparency.
Acting as the headquarters of the International Monetary Fund and the World Bank, the
United States is able to influence the way trade agreements and other bloc entities, such
as the European Union, choose to act. Mexico is analyzed as it presents an interesting
case as part of both NAFTA and LAFTA.
The North American Free Trade Association includes Canada, the United States of
America and Mexico. The treaty was set up in 1994 to facilitate commerce. Its goals, as
set out by its charter, are to
eliminate barriers to trade in, and facilitate the cross-border movement of,
goods and services between the territories of the Parties; promote
conditions of fair competition in the free trade area; increase substantially
investment opportunities in the territories of the Parties; provide adequate

80
and effective protection and enforcement of intellectual property rights in
each Party's territory; create effective procedures for the implementation
and application of this Agreement, for its joint administration and for the
resolution of disputes; and establish a framework for further trilateral,
regional and multilateral cooperation to expand and enhance the benefits
of this Agreement (www.ustr.org 2014).
Similar to the guidelines set out in other treaties discussed in the previous
chapters, the aim of the treaty is to ease regional product mobility and facilitate favorable
trading conditions for member states. It is important to note that “...the NAFTA countries
(Canada and Mexico), were the top two purchasers of U.S. exports in 2013. (Canada
$300.3 billion and Mexico $226.2 billion)” (ustr.org 2014).
This delineates is the goal of countries that join the treaty: to have ease of trade
with the United States. However, beyond the favoring of trade, the goals of political and
economic inter-relationship are in no way as closely tied to the agreement as those set
forth by the European Union.
Having looked at NAFTA, it is now fundamental to understand the logic behind
the Latin American Free Trade Association, of which Brazil, Mexico and Argentina are
members. In a similar fashion, the Latin American Free Trade Association functions as a
way to facilitate trade. Originating from the Treaty of Montevideo in 1980, the goals of
LAFTA are to
... pursue the integration process leading to promote the harmonious and
balanced socio-economic development of the region, and to that effect

81
they hereby institute the Latin American Integration Association ( referred
to as the Association), with headquarters in the city of Montevideo,
Eastern Republic of Uruguay. The long-term objective of such process
shall be the gradual and progressive establishment of a Latin American
common market (www.sice.oas.org 1980).
It is important to point out that the treaty, similar to NAFTA, does not account for
any integration beyond easing market accessibility by member states. As Article 10 of the
treaty points out, “Trade agreements are exclusively aimed towards trade promotion
among member countries, and shall be subject to the specific rules to be established for
that purpose” (www.sice.oas.org 1980). The exclusivity clause presented functions as a
way to narrow the scope of the agreement and ensure that it does not affect the internal
functioning of member states.
The goal of both treaties is not based on promotion of transparency, but rather the
promotion of trade: both agreements function in a manner which is solely aimed at
assisting the trade of goods. Not only is this the aim, but NAFTA focuses its attention on
allowing member states ease of trade with the United States specifically. This is
fundamental in analyzing the role the USA takes in relation to the other countries
discussed in the section.
With this in mind, an analysis of the data presented in chapter IV relating to the
Americas is necessary to understand the effects trade has on the selected states. Graphs
H1 and H1.1 show, respectively, the CPI score and trade percentage growth over time and
the overall trade of product over time.
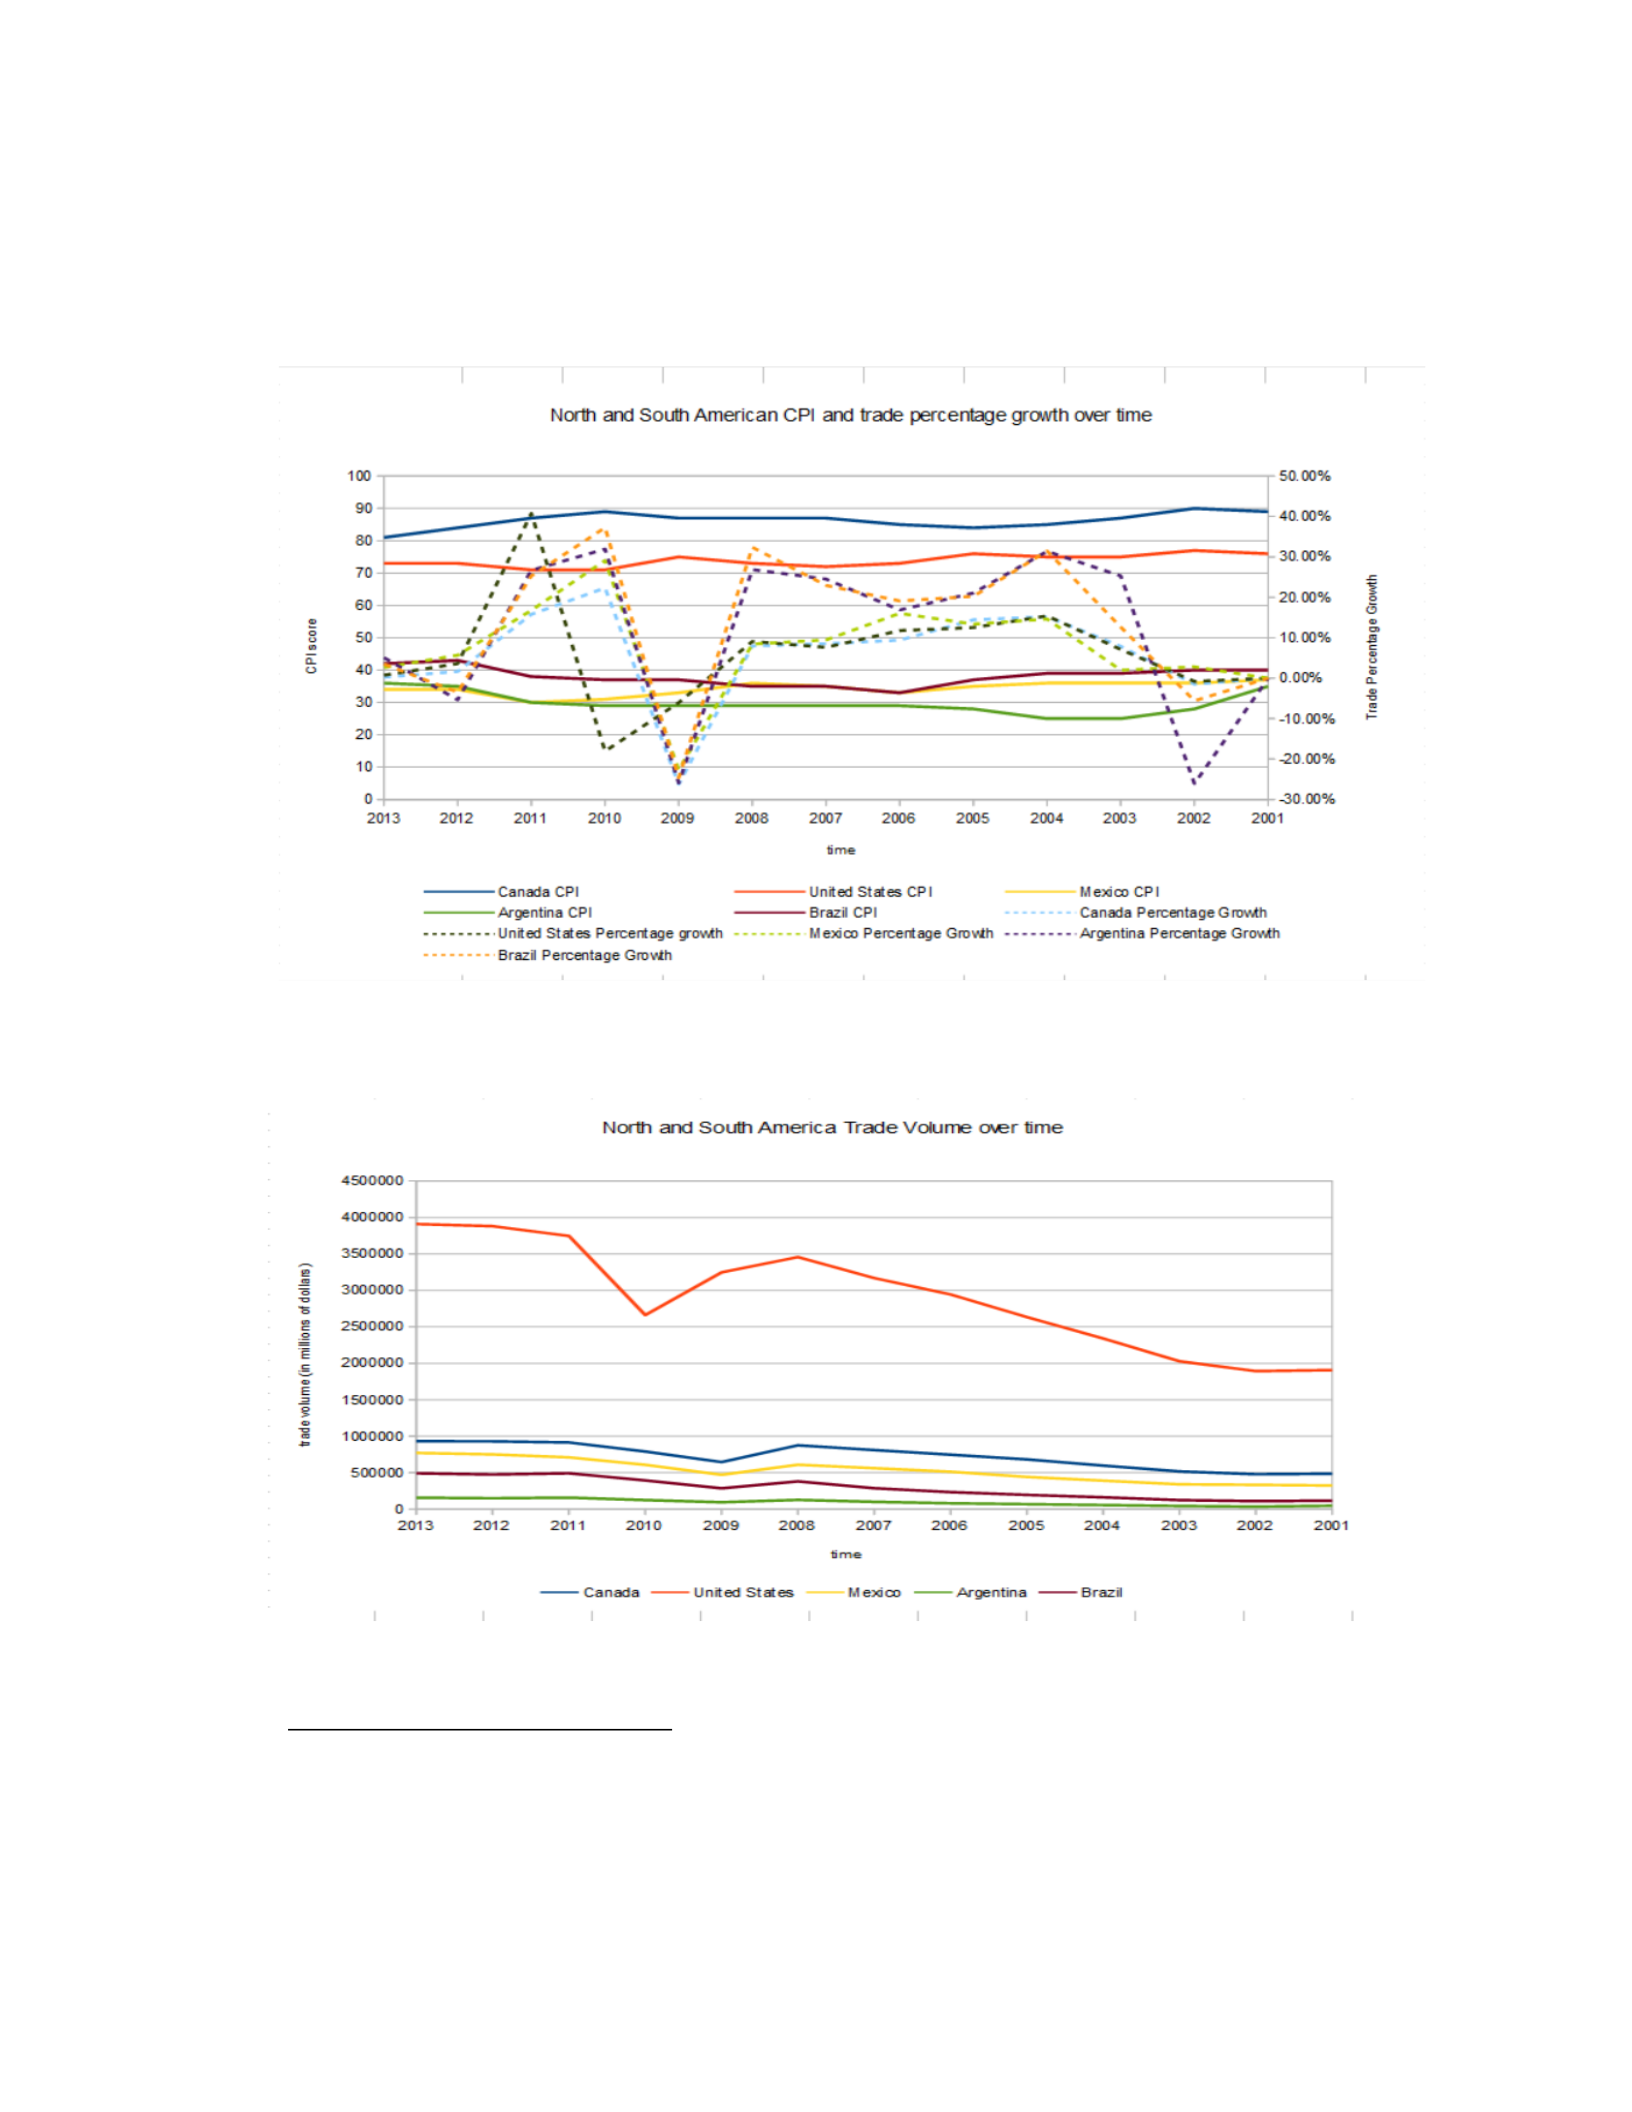
82
Graph H1 : North And South America Percentage Trade Growth and CPI score
over time
16
Graph H1.1: North and South America Trade volume over time
17
16
World Trade Organization (2014). Time Series Statistics Database; http://www.transparency.org/research/cpi/overview
17
World Trade Organization (2014). Time Series Statistics Database; http://www.transparency.org/research/cpi/overview

83
An initial assessment of the graphs provided yields supporting evidence to the
legitimacy of the theory. Almost all states show a growth of CPI score in accordance to
their volume of trade and their economic growth. As an example, Canada has the leading
CPI score and shows economic growth relating to the sways in its score. Furthermore, the
United States shows a decrease of transparency in the period of time during the recession,
which is indicative of a correlation between our two variables.
What is interesting is that states which tend to trade mostly with the United States
in the region tend to follow a similar trend line: both Canada and Mexico show a similar
growth pattern of CPI and of trade volume. This is different from the data provided for
South American states: Argentina and Brazil, while possessing similar economic growth
and volume of trade, have divergent standards relating to their CPI score. What this may
point out is a point made in previous chapters: states which are developing may have a
different correlation due to factors tied into the concept of development.
The divergent line for the data is the subdivision of countries part of NAFTA and
those part of LAFTA, with Mexico being an interesting data point as it is a member of
both. It is noticeable that the CPI scores of Argentina and Mexico are similar, however
their trade pattern is different. The fact that Mexico trades at a substantially higher rate
than Argentina may be a factor: due to this, Mexico's CPI score is slightly higher.
Abraham Benavides (2006) article “Transparency and Public Administration in Mexico:
How the Enactment of a Law Is Changing Culture” provides further evidence to the
reasons why Mexico may be affected by internal facets. As Benavides highlights,

84
Recent elections in Mexico, despite their tumultuous appearance,
have been more participatory and have reflected progress in Mexico's
culture of openness and transparency as opposed to its traditional culture
of secrecy and corruption (Benavides 2006, pg. 462).
The internal state of Mexico is tumultuous and promotes corruption. While the
argument can be made that this is a factor which affects CPI score, an explanation
relating to the possibility is sufficient for the scope of the thesis. This also further
solidifies evidence relating to the goals set out by NAFTA: importance is set on trade and
not the transparency of its member states. This helps reaffirm the causal link that trade
has on transparency, by showing that is volume of commerce which affects CPI.
However Brazil has a higher CPI score than both but trades less than Mexico. In
looking at the percentage growths of these two states, an important piece of data can be
observed: Brazil's growth factor is higher than that of Mexico. What this may suggest is
as a state grows economically and internally, the CPI score will also grow to allow for the
continuation of trade.
Furthermore, the increase in CPI score in 2013 can also, as with South Africa, be
attributed to government policies relating to the FIFA world cup. While the inverse was
true for South Africa, one reason for this might be that Brazil heavily trades with the
United States as presented in the WTO country reports.
Halter et als article, Transparency to Reduce Corruption?: Dropping Hints for
Private Organizations in Brazil, provides an interesting point of view relating to how
internal business ethics may affect the corruption and transparency of Brazil. As

85
presented by Halter,
In the past years, news reports regarding the violation of business
ethics have created doubts about the practical application of principles of
corporate governance in Brazil. Some legal systems seem to be more
effective than others in inducing greater commitment to legal compliance
by the corporation (Halter et al 2009, pg.374).
Internal issues with corruption seem to be prevalent within Central and South
America: what this may suggest is that developing states may be less likely to be truly
democratic and furthermore have a generally lower CPI score.
The United States is a focal state to the argument of the Americas: being the
largest trading force in the block, it is also at the center of the NAFTA agreement and is
one of the major trading partners of most states. The fact that the United States is such an
immense developed democratic economic power is crucial to the proposed hypothesis.
The data relating to its trade patterns tend to correlate economic growth and
transparency, while providing support to the concepts that democratic states tend to be
more transparent. Furthermore, data relating to the United States supports the findings
relating to the difference between developing and developed states. Changes in
transparency of democracies tend to correlate stronger with economic growth.
One of the major effects of this interaction is the political pressure which a state
can exert by promoting trade. As presented by James Morrow et al (1998) in the article
“The Political Determinants of International Trade: The Major Powers”,
..Results indicate that states whose interests are closest to those of

86
the United States, as measured by similarity of voting in the United
Nations, have higher levels of trade with the United States than other
states (Morrow et al 1998, pg.650)
By using trade as a means to an end, Morrow argues that conflict is
avoidable by encouraging commerce. This does explain why countries who tend
to trade with democratic states tend to have an increase in their CPI rating and
overall transparency. The role of the United States in the region is clear: it acts as
a crucial entity in the promotion of transparency, and as such it makes sense that
states that majorly trade with the US tend to have similar CPI fluctuations.
Chapter IX provides crucial information on analyzing the interplay of democratic,
non-democratic states, developing and developed states. Not only, but it presents
information which may help in ascertaining the importance of the question posed by the
hypothesis.

87
Conclusion
A thorough analysis of the data provided has yielded results which are supportive
of the hypothesis proposed. However, it was not possible to ascertain causality, but rather
a correlation between trade and transparency.
Multiple factors exist which affect corruption and transparency in states: form of
government, economic development, internal infrastructure and internal business
activities are just some examples of possible elements which exist that may affect how a
state appears to other states in the international scene. For this reason, caution must be
used when ascertaining if the results of the study are fundamentally true. Potential issues
exist with variables that were not accounted for in the original hypothesis.
Due to the complex nature of economic relations and the existence of non-
governmental actors, it is difficult to fully encompass trade as a single entity. The scope
of the thesis, however, was to argue simply if the increased global trade of goods would
have an effect on transparency. While this may present issues relating to the robustness of
the data, an analysis of the sample states yields information relating to a correlate value
existing between the trade in products and transparency. The difficulty then lies in how to
measure such a value. Due to the enormous possibilities and interplay of economic
elements which exist, it became necessary to conduct the analysis in a simplified form.
However, given the advantages increased trade has, why do states choose not
increase their own transparency? Glennester's (2008) article “Does Transparency Pay?”
proposes the conception that states may choose to become more transparent as a means to

88
continue prosperous trade. As Glennester points out,
..it is natural to ask why all governments do not adopt these (transparency)
reforms. One answer is that a country weighs the benefit of lower trading
costs against the loss of discretion on the part of policymakers that comes
with more transparency (Glennester 2008, pg.206).
As discussed in Chapter VII, Russia is an example of a state which had utilized
the lack of information relating to its political dialogue to enforce favorable economic
treaties with states such as Ukraine. Now, that has appeared to have backfired as Ukraine,
in an attempt to begin trading more with the European Union, has fallen to civil war.
Other countries, such as Italy, face internal issues which render measuring transparency
difficult. This is not to say that other states do not act in a similar fashion: as discussed in
chapter IX, the United States, as an example, uses trade to leverage support within
international organizations such as the United Nations.
However the importance of promoting state transparency through trade is
something which should be considered as a means to further democratization and its
advantages. As Kristin Lord (1999) in his article “The Surprising Logic of Transparency”
argues,
It is possible that both very high transparency, because it accurately
signals intentions, and very low transparency, because it prevents the
"noise" of domestic politics from overwhelming diplomatic signals, allow
states to defuse crises. If accurate, only moderate transparency would
exacerbate crises because it would allow enough information to confuse

89
the opponent, but not enough to clarify peaceful intention (Lord 1999, pg.
335).
The issue of transparency is one which interplays directly with the manner in
which states interact with each other; the fact that trade seems to affect how a state
decides to act has important implications regarding the value of commerce.
By demonstrating a correlation between trade and transparency, it becomes
evident that commerce might be more than a way of growing states economically, but a
tool to aid in the development of stability in the international anarchic system. A push
towards aiding development and promoting commerce facilitate dialogue and may allow
for states to resolve disputes in a peaceful manner. What this implies is that actions, such
as embargoes or economic sanctions, may not be the best recourse to solving
international disputes.

