


GENERAL INTRODUCTION Population genetics and molecular
Population genetics and molecular evolution may be the fields of biology with the
strongest mathematical foundations. Produced through decades of theoretical research, this
robust mathematical framework offers a range of tools from reconstructing phylogenetic
relationships to modelling the effects of natural selection. Only with recent genomic
sequencing tools has it become possible to fully integrate empirical molecular genetic data
into these theoretical frameworks. This integration presents countless opportunities to test
hypotheses about molecular evolution, the results of which can be used to understand how
molecular evolution plays out in natural populations. With technological barriers lifted, the
largest burden for modern geneticists is therefore choosing the proper study systems in
which to address pressing questions in molecular evolution. In this dissertation, I establish
phocid seals as an excellent natural system to address two core topics in molecular
evolution: the effect of population size on genome evolution and the role of molecular
changes in phenotypic adaptations.
Phocid seals (family Phocidae) are marine mammals that rely on both the ocean and land.
This clade split from Otarioidea (i.e. fur seals, sea lions, and walruses) around 26.9 Ma
(Paterson et al. 2020) with the crown group inhabiting the warm waters of the central
Atlantic basic (Fulton & Strobeck 2010; Berta et al. 2018). Within this family are 18 extant
and one recently extinction species, which form two subfamilies: Monachinae and
Phocinae. Across this family are species that range from small, endangered populations like
the Hawaiian monk seal (Neomonachus schauinslandi) and Mediterranean monk seal
(Monachus monachus) to the extremely abundant Weddell seal (Leptonychotes weddellii)
and ringed seal (Pusa hispida). Other species, like the Northern elephant seal, were once

on the verge of extinction but have since recovered to large population sizes (Hoelzel et al.
2002).
These extreme differences in population size across the phocid phylogeny make these
species an excellent natural system to test how population size affects patterns of molecular
evolution. This relationship has been a central question in the field, with increased attention
coming from the development of the nearly neutral theory (Ohta 1972, 1973). This theory
proposed slightly deleterious mutations would drift to high frequencies at a rate inversely
proportional to the effective population size (Ne). Early empirical studies of molecular
substitution rates and molecular clocks attempted to broadly characterize this pattern (e.g.
Yang & Nielsen 1998), while theoretical population genetics work suggested that slightly
deleterious mutation accumulation could be a significant concern for endangered species
(Lynch & Lande 1998, Lande 2003). However, many empirical studies have been unable
to disentangle the effects of population size from other variables such as generation time,
body size, and phylogenetic signal (e.g. Martin & Palumbi 1993, Welch et al. 2008,
Bromham 2009) and other studies conflate long-term population size with recent bottleneck
(e.g Abascal et al. 2016).
In addition, alternative theoretical work has suggested evolutionary models in
which mutation accumulation would have little or no dependence on population size
(Cherry 1998, Gillespie 2001, Goldstein 2013). These alternative models center around the
idea that the distribution of fitness effects (DFE) of new mutations may correlate with
population size. For example, the concave fitness function proposed by Cherry (1998)
suggests that smaller populations may have lower fitness, but that new mutations are
expected to have much larger effects. Labar and Adami (2017) explored a similar idea in
simulations that showed how smaller populations could drift to plateaued fitness peaks,

again shifting the predicted effects of new mutations. In these cases, the mathematical
framework of nearly neutral theory would still hold but purifying selection would still be
able to act in smaller populations given the larger selection coefficients (|s|). Unfortunately,
there is still very little empirical measurement or modelling of the DFE, so these models
cannot be properly parameterized (Whitlock et al. 2003). The extreme differences in
population size among closely related phocid seal species, however, offers the opportunity
to test hypotheses of the relationship between population size and both mutation
accumulation and DFE.
In addition to purifying selection, there are open questions about the role protein evolution
plays in phenotypic adaptation. From the early days of molecular genetics, there has been
a debate about the relative contributions of protein-coding vs. regulatory changes to
phenotypic evolution (Lynch & Wagner 2008). This is particularly true for complex traits,
the evolution of which may be affected by multiple loci in the genome (Glazier et al. 2002).
Fortunately, theoretical population genetics has devised statistical frameworks that can be
used to detect adaptive changes in protein coding genes (Vitti et al. 2013). This originates
with the idea that nonsynonymous changes are fixed through positive selection while
synonymous mutations fix through drift at a rate equal to the neutral mutation rate (Hurst
2002). This idea was further developed in the Poisson Random Field (PRF) theory (Sawyer
& Hartl 1992). This statistical framework derives the expected number of polymorphic or
fixed sites that are synonymous or nonsynonymous in two sister taxa under a given
selection regime. With the observed number of polymorphic and fixed sites available from
molecular sequence data, these expectation equations can be solved to estimate the scaled
selection coefficient for a gene or even an individual amino acid site (Zhao et al. 2017).

Adaptive evolution in marine mammals is a particularly interesting area of evolutionary
biology for two reasons. First, marine mammals have evolved numerous morphological
and physiological adaptations that allow them to inhabit the marine environment, giving
them a suite of unique derived traits compared to terrestrial mammals. Second, marine
mammals—and especially pinnipeds—have evolved adaptations to extreme conditions.
These include extreme environments, such as polar oceans and extreme depths, as well as
extreme life history traits, such as months of fasting and extreme sexual dimorphism (Berta
et al. 2015). In many of these cases, the morphological or physiological adaptations have
been identified but the underlying molecular adaptation is not understood (Foote et al.
2015).
In this dissertation, I generate dozens of whole genome sequences across multiple phocid
seal species and use this clade to study fundamental aspects of purifying and positive
selection in mammalian evolution. In Chapter 1, I start by using whole genomes to
reconstruct the demographic history of eight seal taxa. After showing that these taxa have
dramatic differences in long-term effective population size, I test how purifying selection
has acted on the genomic evolution of these species with long-term differences in
population size. Then in Chapter 2, I sequence additional genomes to generate
polymorphism data for each taxon. I develop a program to transform medium-coverage
genome sequencing data into a format that can be processed in MASS-PRF to detect sites
under positive selection. With these tools, I identify genes that help to explain the molecular
underpinnings of adaptive evolution in various seal lineages. Finally in Chapter 3, I use this
polymorphism data to return to the question of purifying selection, this time by explicitly
modelling the distribution of fitness effects using a population genetics approach. I
compare the DFE in seals with those that have been modelled in other mammalian species

to gain a better understanding of how the shape of the DFE evolves across mammals. In
addressing these questions in this dissertation, I also provide valuable insights into the
history and biology of these species, which will inform the future conservation and
management of these marine mammals.
References
van der Aar AMG, Sylva-Steenland RMR, Bos JD et al. (2007) Cutting Edge: Loss of
TLR2, TLR4, and TLR5 on Langerhans Cells Abolishes Bacterial Recognition. The
Journal of Immunology.

Abadía-Cardoso A, Freimer NB, Deiner K, Garza JC (2017) Molecular Population
Genetics of the Northern Elephant Seal Mirounga angustirostris. Journal of
Heredity.
Abascal F, Corvelo A, Cruz F et al. (2016) Extreme genomic erosion after recurrent
demographic bottlenecks in the highly endangered Iberian lynx. Genome Biology.
Adami C, Ofria C, Collier TC (2000) Evolution of biological complexity. Proceedings of
the National Academy of Sciences of the United States of America.
Alava JJ (2017) Tropical pinnipeds: Bio-ecology, threats and conservation.
Andrews RD, Jones DR, Williams JD et al. (1997) Heart rates of northern elephant seals
diving at sea and resting on the beach. Journal of Experimental Biology.
Ashburner M, Ball CA, Blake JA et al. (2000) Gene ontology: Tool for the unification of
biology. Nature Genetics.
Van der Auwera GA, Carneiro MO, Hartl C et al. (2013) From fastQ data to
highconfidence variant calls: The genome analysis toolkit best practices pipeline.
Current Protocols in Bioinformatics.
Bagchi A, Batten AJ, Levin M et al. (2018) Intrinsic anti-inflammatory properties in the
serum of two species of deep-diving seal. Journal of Experimental Biology.
Baker JD, Barbieri MM, Johanos TC et al. (2020) Conservation translocations of
Hawaiian monk seals: accounting for variability in body condition improves
evaluation of translocation efficacy. Animal Conservation.
Beichman AC, Huerta-Sanchez E, Lohmueller KE (2018) Using genomic data to infer
historic population dynamics of nonmodel organisms. Annual Review of Ecology,
Evolution, and Systematics.
Beichman AC, Phung TN, Lohmueller KE (2017) Comparison of single genome and
allele frequency data reveals discordant demographic histories. G3: Genes,
Genomes, Genetics.
Berta A, Churchill M, Boessenecker RW (2018) The Origin and Evolutionary Biology of
Pinnipeds: Seals, Sea Lions, and Walruses. Annual Review of Earth and Planetary
Sciences.
Berta A, Sumich JL, Kovacs KM (2015) Marine Mammals: Evolutionary Biology: Third
Edition.
Blix AS (2018) Adaptations to deep and prolonged diving in phocid seals. The Journal of
experimental biology.
Boessenecker RW, Churchill M (2016) The origin of elephant seals: implications of a
fragmentary late Pliocene seal (Phocidae: Miroungini) from New Zealand. New
Zealand Journal of Geology and Geophysics.
Le Boeuf BJ, Laws RM (1994) Elephant seals: An introduction to the genus. Elephant
Seals: Population Ecology, Behavior, and Physiology.
Boyko AR, Williamson SH, Indap AR et al. (2008) Assessing the evolutionary impact of
amino acid mutations in the human genome. PLoS Genetics.
Bromham L (2009) Why do species vary in their rate of molecular evolution? Biology
Letters.
Bromham L (2011) The genome as a life-history character: Why rate of molecular
evolution varies between mammal species. Philosophical Transactions of the Royal
Society B: Biological Sciences.

Brown ML, Yui K, Smith JD et al. (2002) The murine macrophage apoB-48 receptor gene
(Apob-48r): Homology to the human receptor. Journal of Lipid Research.
de Bruyn PJN, Tosh CA, Bester MN et al. (2011) Sex at sea: Alternative mating system in
an extremely polygynous mammal. Animal Behaviour.
Busch BC (1985) The war against the seals: a history of the North American seal fishery.
The war against the seals: a history of the North American seal fishery.
Cahill JA, Soares AER, Green RE, Shapiro B (2016) Inferring species divergence times
using pairwise sequential markovian coalescent modelling and low-coverage
genomic data. Philosophical Transactions of the Royal Society B: Biological
Sciences.
Castellano D, MacIà MC, Tataru P, Bataillon T, Munch K (2019) Comparison of the full
distribution of fitness effects of new amino acid mutations across great apes.
Genetics.
Cescon M, Gattazzo F, Chen P, Bonaldo P (2015) Collagen VI at a glance. Journal of Cell
Science.
Chakravarti A (1999) Population genetics-making sense out of sequence. Nature Genetics.
Champagne CD, Crocker DE, Fowler MA, Houser DS (2013) Fasting physiology of the
pinnipeds: The challenges of fasting while maintaining high energy expenditure and
nutrient delivery for lactation. In: Comparative Physiology of Fasting, Starvation,
and Food Limitation
Charlesworth B (2009) Effective population size and patterns of molecular evolution and
variation. Nature Reviews Genetics.
Charlesworth J, Eyre-Walker A (2007) The other side of the nearly neutral theory,
evidence of slightly advantageous back-mutations. Proceedings of the National
Academy of Sciences of the United States of America.
Cherry JL (1998) Should we expect substitution rate to depend on population size?
Genetics.
Chikina M, Robinson JD, Clark NL (2016) Hundreds of Genes Experienced Convergent
Shifts in Selective Pressure in Marine Mammals. Molecular Biology and Evolution.
Cingolani P, Platts A, Wang LL et al. (2012) A program for annotating and predicting the
effects of single nucleotide polymorphisms, SnpEff: SNPs in the genome of
Drosophila melanogaster strain w1118; iso-2; iso-3. Fly.
Clark NL, Swanson WJ (2005) Pervasive adaptive evolution in primate seminal proteins.
PLoS Genetics.
Couce A, Caudwell LV, Feinauer C et al. (2017) Mutator genomes decay, despite
sustained fitness gains, in a long-term experiment with bacteria. Proceedings of the
National Academy of Sciences of the United States of America.
Crawford JE, Amaru R, Song J et al. (2017) Natural Selection on Genes Related to
Cardiovascular Health in High-Altitude Adapted Andeans. American Journal of
Human Genetics.
Curtis C, Stewart BS, Karl SA (2009) Pleistocene population expansions of Antarctic seals.
Molecular Ecology.
Curtis C, Stewart BS, Karl SA (2011) Genetically effective population sizes of Antarctic
seals estimated from nuclear genes. Conservation Genetics.

Danecek P, Auton A, Abecasis G et al. (2011) The variant call format and VCFtools.
Bioinformatics, 27, 2156–2158.
Dapper AL, Wade MJ (2016) The evolution of sperm competition genes: The effect of
mating system on levels of genetic variation within and between species. Evolution.
Dean R, Wright AE, Marsh-Rollo SE et al. (2017) Sperm competition shapes gene
expression and sequence evolution in the ocellated wrasse. Molecular Ecology.
Dendrinos P, Karamanlidis AA, Kotomatas S et al. (2007) Pupping habitat use in the
Mediterranean monk seal: A long-term study. Marine Mammal Science.
Deyarmin JS, McCormley MC, Champagne CD et al. (2019) Blubber transcriptome
responses to repeated ACTH administration in a marine mammal. Scientific Reports.
Do R, Balick D, Li H et al. (2015) No evidence that selection has been less effective at
removing deleterious mutations in Europeans than in Africans. Nature Genetics.
Estes S, Phillips PC, Denver DR, Thomas WK, Lynch M (2004) Mutation Accumulation
in Populations of Varying Size: The Distribution of Mutational Effects for Fitness
Correlates in Caenorhabditis elegans. Genetics.
Eyre-Walker A, Keightley PD (2007) The distribution of fitness effects of new mutations.
Nature Reviews Genetics.
Ferguson SH, Higdon JW (2006) How seals divide up the world: Environment, life history,
and conservation. Oecologia.
Foote AD, Liu Y, Thomas GWC et al. (2015) Convergent evolution of the genomes of
marine mammals. Nature Genetics.
Fowler M, Champagne C, Crocker D (2018) Adiposity and fat metabolism during
combined fasting and lactation in elephant seals. Journal of Experimental Biology.
Fowler MA, Debier C, Mignolet E et al. (2014) Fatty acid mobilization and comparison
to milk fatty acid content in northern elephant seals. Journal of Comparative
Physiology B: Biochemical, Systemic, and Environmental Physiology.
Fujita Y, Ezura Y, Bujo H et al. (2005) Association of nucleotide variations in the
apolipoprotein B48 receptor gene (APOB48R) with hypercholesterolemia. Journal
of Human Genetics.
Fuller ZL, Berg JJ, Mostafavi H, Sella G, Przeworski M (2019) Measuring intolerance to
mutation in human genetics. Nature Genetics.
Fulton TL, Strobeck C (2010) Multiple fossil calibrations, nuclear loci and mitochondrial
genomes provide new insight into biogeography and divergence timing for true seals
(Phocidae, Pinnipedia). Journal of Biogeography.
Fyler CA, Reeder TW, Berta A et al. (2005) Historical biogeography and phylogeny of
monachine seals (Pinnipedia: Phocidae) based on mitochondrial and nuclear DNA
data. Journal of Biogeography.
Galtier N, Rousselle M (2020) How Much Does Ne Vary Among Species? Genetics, 216,
559–572.
Gillespie JH (2001) Is the population size of a species relevant to its evolution? Evolution.
Glazier AM, Nadeau JH, Aitman TJ (2002) Genetics: Finding genes that underline complex
traits. Science.
Goldstein RA (2013) Population size dependence of fitness effect distribution and
substitution rate probed by biophysical model of protein thermostability. Genome
Biology and Evolution.

Gopalakrishnan K, Kumarasamy S, Abdul-Majeed S et al. (2012) Targeted disruption of
Adamts16 gene in a rat genetic model of hypertension. Proceedings of the National
Academy of Sciences of the United States of America.
Grantham R (1974) Amino acid difference formula to help explain protein evolution.
Science.
Gutenkunst RN, Hernandez RD, Williamson SH, Bustamante CD (2009) Inferring the
joint demographic history of multiple populations from multidimensional SNP
frequency data. PLoS Genetics.
Hahn MW (2008) Toward a selection theory of molecular evolution. Evolution.
Hedrick PW (1995) Elephant seals and the estimation of a population bottleneck. Journal
of Heredity.
Henn BM, Botigué LR, Bustamante CD, Clark AG, Gravel S (2015) Estimating the
mutation load in human genomes. Nature Reviews Genetics.
Hill WG, Goddard ME, Visscher PM (2008) Data and theory point to mainly additive
genetic variance for complex traits. PLoS Genetics.
Hindle AG (2020) Diving deep: Understanding the genetic components of hypoxia
tolerance in marine mammals. Journal of Applied Physiology.
Hoelzel AR, Fleischer RC, Campagna C, Le Boeuf BJ, Alvord G (2002) Impact of a
population bottleneck on symmetry and genetic diversity in the northern elephant
seal. Journal of Evolutionary Biology.
Hoelzel AR, Halley J, O’brien SJ et al. (1993) Elephant seal genetic variation and the use
of simulation models to investigate historical population bottlenecks. Journal of
Heredity.
Huang T, Yin Y, Liu C et al. (2020) Absence of murine CFAP61 causes male infertility due
to multiple morphological abnormalities of the flagella. Science Bulletin.
Huber CD, Kim BY, Marsden CD, Lohmueller KE (2017) Determining the factors
driving selective effects of new nonsynonymous mutations. Proceedings of the
National Academy of Sciences of the United States of America.
Hughes AL, Hughes MK (1993) Adaptive evolution in the rat olfactory receptor gene
family. Journal of Molecular Evolution.
Hurst LD (2002) The Ka/Ks ratio: Diagnosing the form of sequence evolution. Trends in
Genetics.
Huzurbazar S, Kolesov G, Massey SE et al. (2010) Lineage-Specific Differences in the
Amino Acid Substitution Process. Journal of Molecular Biology.
Johnson W, Lavigne D (1999) Monk seals in antiquity. Mededelingen.
Johnson KP, Seger J (2001) Elevated rates of nonsynonymous substitution in island birds.
Molecular Biology and Evolution.
Karamanlidis AA, Dendrinos P, de Larrinoa PF et al. (2016a) The Mediterranean monk
seal Monachus monachus: Status, biology, threats, and conservation priorities.
Mammal Review.
Karamanlidis AA, Gaughran S, Aguilar A et al. (2016b) Shaping species conservation
strategies using mtDNA analysis: The case of the elusive Mediterranean monk seal
(Monachus monachus). Biological Conservation.
Keightley PD (1998) Inference of genome-wide mutation rates and distributions of
mutation effects for fitness traits: A simulation study. Genetics.

Keightley PD, Eyre-Walker A (2007) Joint inference of the distribution of fitness effects
of deleterious mutations and population demography based on nucleotide
polymorphism frequencies. Genetics.
Keightley PD, Eyre-Walker A (2010) What can we learn about the distribution of fitness
effects of new mutations from DNA sequence data? Philosophical Transactions of
the Royal Society B: Biological Sciences.
Kern AD, Hahn MW (2018) The neutral theory in light of natural selection. Molecular
Biology and Evolution.
Khudyakov JI, Abdollahi E, Ngo A et al. (2019) Expression of obesity-related adipokine
genes during fasting in a naturally obese marine mammal. American journal of
physiology. Regulatory, integrative and comparative physiology.
Kim BY, Huber CD, Lohmueller KE (2017a) Inference of the distribution of selection
coefficients for new nonsynonymous mutations using large samples. Genetics.
Kim BY, Huber CD, Lohmueller KE (2017b) Inference of the distribution of selection
coefficients for new nonsynonymous mutations using large samples. Genetics.
Kimura M (1968) Evolutionary rate at the molecular level. Nature.
Kimura M (1977) Preponderance of synonymous changes as evidence for the neutral theory
of molecular evolution [33]. Nature.
Kirch P V. (2011) When Did the Polynesians Settle Hawai’i? A Review of 150 Years of
Scholarly Inquiry and a Tentative Answer. Hawaiian Archaeology.
Kittinger JN, Pandolfi JM, Blodgett JH et al. (2011) Historical reconstruction reveals
recovery in Hawaiian coral reefs. PLoS ONE.
Kokko H, Helle E, Lindström J et al. (1999) Backcasting population sizes of ringed and
grey seals in the Baltic and Lake Saimaa during the 20th century. Annales Zoologici
Fennici.
Korneliussen TS, Albrechtsen A, Nielsen R (2014) ANGSD: Analysis of Next Generation
Sequencing Data. BMC Bioinformatics.
Kosiol C, Vinař T, Da Fonseca RR et al. (2008) Patterns of positive selection in six
mammalian genomes. PLoS Genetics.
Kovacs KM, Aguilar A, Aurioles D et al. (2012) Global threats to pinnipeds. Marine
Mammal Science.
Kreitman M (1996) The neutral theory is dead. Long live the neutral theory. BioEssays.
Kreitman M, Akashi H (1995) Molecular evidence for natural selection. Annual Review of
Ecology and Systematics.
Kretzmann MB, Gemmell NJ, Meyer A (2001) Microsatellite analysis of population
structure in the endangered Hawaiian monk seal. Conservation Biology.
Kutschera VE, Poelstra JW, Botero-Castro F et al. (2020) Purifying Selection in Corvids Is
Less Efficient on Islands. Molecular Biology and Evolution.
Kwan HH, Culibrk L, Taylor GA et al. (2019) The genome of the steller sea lion
(Eumetopias jubatus). Genes.
Labar T, Adami C (2017) Evolution of drift robustness in small populations. Nature
Communications.
Lande R (2003) Mutation and Conservation. Conservation Biology.
Leboeuf BJ (1972) Sexual behavior in the northern elephant seal mirounga angustirostris.
Behaviour.

Van Der Lee R, Wiel L, Van Dam TJP, Huynen MA (2017) Genome-scale detection of
positive selection in nine primates predicts human-virus evolutionary conflicts.
Nucleic Acids Research.
Li H (2011) A statistical framework for SNP calling, mutation discovery, association
mapping and population genetical parameter estimation from sequencing data.
Bioinformatics.
Li H (2013) Aligning sequence reads, clone sequences and assembly contigs with
BWAMEM. arXiv preprint arXiv.
Li H, Durbin R (2011) Inference of human population history from individual
wholegenome sequences. Nature.
Li WH, Wu CI, Luo CC (1984) Nonrandomness of point mutation as reflected in
nucleotide substitutions in pseudogenes and its evolutionary implications. Journal of
Molecular Evolution.
Lohmueller KE, Indap AR, Schmidt S et al. (2008) Proportionally more deleterious genetic
variation in European than in African populations. Nature.
Loire E, Chiari Y, Bernard A et al. (2013) Population genomics of the endangered giant
Galapagos tortoise. Genome Biology, 14.
Lourenço J, Galtier N, Glémin S (2011) Complexity, pleiotropy, and the fitness effect of
mutations. Evolution.
Lynch M, Conery JS (2003) The Origins of Genome Complexity. Science.
Lynch M, Conery J, Burger R (1995) Mutation accumulation and the extinction of small
populations. American Naturalist.
Lynch M, Lande R (1998) The critical effective size for a genetically secure population.
Animal Conservation.
Lynch VJ, Wagner GP (2008) Resurrecting the role of transcription factor change in
developmental evolution. Evolution.
Marsden CD, Vecchyo DO Del, O’Brien DP et al. (2016) Bottlenecks and selective
sweeps during domestication have increased deleterious genetic variation in dogs.
Proceedings of the National Academy of Sciences of the United States of America.
Martin AP, Palumbi SR (1993) Body size, metabolic rate, generation time, and the
molecular clock. Proceedings of the National Academy of Sciences of the United
States of America.
Martinez B, Khudyakov J, Rutherford K et al. (2018) Adipose transcriptome analysis
provides novel insights into molecular regulation of prolonged fasting in northern
elephant seal pups. Physiological Genomics.
Martinon F, Burns K, Tschopp J (2002) The Inflammasome: A molecular platform
triggering activation of inflammatory caspases and processing of proIL-β. Molecular
Cell.
Mazet O, Rodríguez W, Grusea S, Boitard S, Chikhi L (2016) On the importance of being
structured: Instantaneous coalescence rates and human evolution-lessons for
ancestral population size inference? Heredity.
McDonald JH, Kreitman M (1991) Adaptive protein evolution at the Adh locus in
Drosophila. Nature.
Mi H, Muruganujan A, Ebert D, Huang X, Thomas PD (2019) PANTHER version 14:
More genomes, a new PANTHER GO-slim and improvements in enrichment

analysis tools. Nucleic Acids Research.
Mohr DW, Naguib A, Weisenfeld NI et al. (2017) Improved de novo genome assembly:
Linked-read sequencing combined with optical mapping produce a high quality
mammalian genome at relatively low cost. bioRxiv.
Morin PA, Archer FI, Avila CD et al. (2020) Reference genome and demographic history
of the most endangered marine mammal, the vaquita. Molecular Ecology Resources.
Nabholz B, Uwimana N, Lartillot N (2013) Reconstructing the phylogenetic history of
long-term effective population size and life-history traits using patterns of amino
acid replacement in mitochondrial genomes of mammals and birds. Genome Biology
and Evolution.
Nagano H, Hashimoto N, Nakayama A et al. (2018) p53-inducible DPYSL4 associates
with mitochondrial supercomplexes and regulates energy metabolism in adipocytes
and cancer cells. Proceedings of the National Academy of Sciences of the United
States of America.
Naqvi S, Godfrey AK, Hughes JF et al. (2019) Conservation, acquisition, and functional
impact of sex-biased gene expression in mammals. Science.
Nei M, Graur D (1984) Extent of Protein Polymorphism and the Neutral Mutation Theory.
In: Evolutionary Biology
Nei M, Tajima F (1981) Genetic drift and estimation of effective population size. Genetics.
Nyman T, Valtonen M, Aspi J et al. (2014) Demographic histories and genetic diversities
of Fennoscandian marine and landlocked ringed seal subspecies. Ecology and
Evolution.
O’Corry-Crowe G (2008) Climate change and the molecular ecology of arctic marine
mammals. Ecological Applications.
Ohta T (1972) Population size and rate of evolution. Journal of Molecular Evolution.
Ohta T (1973) Slightly deleterious mutant substitutions in evolution. Nature.
Ohta T (1992) The nearly neutral theory of molecular evolution. Annual Review of Ecology
and Systematics.
Ohta T, Gillespie JH (1996) Development of neutral nearly neutral theories. Theoretical
Population Biology.
Orr HA (2003) The distribution of fitness effects among beneficial mutations. Genetics.
Osada N, Hettiarachchi N, Babarinde IA, Saitou N, Blancher A (2015) Whole-genome
sequencing of six Mauritian cynomolgus macaques (Macaca fascicularis) reveals a
genome-wide pattern of polymorphisms under extreme population bottleneck.
Genome Biology and Evolution.
Palo JU, Mäkinen HS, Helle E, Stenman O, Väinölä R (2001) Microsatellite variation in
ringed seals (Phoca hispida): Genetic structure and history of the Baltic Sea
population. Heredity.
Papkou A, Guzella T, Yang W et al. (2019) The genomic basis of red queen dynamics
during rapid reciprocal host–pathogen coevolution. Proceedings of the National
Academy of Sciences of the United States of America.
Paterson RS, Rybczynski N, Kohno N, Maddin HC (2020) A Total Evidence
Phylogenetic Analysis of Pinniped Phylogeny and the Possibility of Parallel
Evolution Within a Monophyletic Framework. Frontiers in Ecology and Evolution.

Peart CR, Tusso S, Pophaly SD et al. (2020) Determinants of genetic variation across eco-
evolutionary scales in pinnipeds. Nature Ecology and Evolution.
Pedersen CET, Lohmueller KE, Grarup N et al. (2017) The effect of an extreme and
prolonged population bottleneck on patterns of deleterious variation: Insights from
the Greenlandic Inuit. Genetics.
Poon A, Otto SP (2000) Compensating for our load of mutations: Freezing the meltdown
of small populations. Evolution.
Purcell S, Neale B, Todd-Brown K et al. (2007) PLINK: A tool set for whole-genome
association and population-based linkage analyses. American Journal of Human
Genetics.
Rannikko K, Ortutay C, Vihinen M (2007) Immunity genes and their orthologs: A
multispecies database. International Immunology.
Reeves RR (1998) Distribution, abundance and biology of ringed seals (Phoca hispida): an
overview. NAMMCO Scientific Publications.
Robinson JD, Coffman AJ, Hickerson MJ, Gutenkunst RN (2014) Sampling strategies for
frequency spectrum-based population genomic inference. BMC Evolutionary
Biology.
Robinson JA, Ortega-Del Vecchyo D, Fan Z et al. (2016) Genomic Flatlining in the
Endangered Island Fox. Current Biology.
Rogers RL, Slatkin M (2017) Excess of genomic defects in a woolly mammoth on Wrangel
island. PLoS Genetics.
Sabeti PC, Reich DE, Higgins JM et al. (2002) Detecting recent positive selection in the
human genome from haplotype structure. Nature.
Sabeti PC, Schaffner SF, Fry B et al. (2006) Positive natural selection in the human lineage.
Science, 312, 1614–1620.
Sackton TB, Grayson P, Cloutier A et al. (2019) Convergent regulatory evolution and loss
of flight in paleognathous birds. Science.
Sanjuán R, Moya A, Elena SF (2004) The distribution of fitness effects caused by
singlenucleotide substitutions in an RNA virus. Proceedings of the National
Academy of Sciences of the United States of America.
Der Sarkissian C, Ermini L, Schubert M et al. (2015) Evolutionary genomics and
conservation of the endangered Przewalski’s horse. Current Biology.
Savriama Y, Valtonen M, Kammonen JI et al. (2018) Bracketing phenogenotypic limits of
mammalian hybridization. Royal Society Open Science.
Sawyer SA, Hartl DL (1992) Population genetics of polymorphism and divergence.
Genetics.
Schiffels S, Durbin R (2014) Inferring human population size and separation history from
multiple genome sequences. Nature Genetics.
Schiffels S, Wang K (2020) MSMC and MSMC2: The multiple sequentially Markovian
coalescent. In: Methods in Molecular Biology
Schultz JK, Baker JD, Toonen RJ, Bowen BW (2009) Extremely low genetic diversity in
the endangered Hawaiian monk seal (Monachus schauinslandi). Journal of Heredity.
Schultz ST, Lynch M, Willis JH (1999) Spontaneous deleterious mutation in Arabidopsis
thaliana. Proceedings of the National Academy of Sciences of the United States of
America.

Schultz JK, Marshall AJ, Pfunder M (2010) Genome-wide loss of diversity in the critically
endangered Hawaiian monk seal. Diversity.
Scornavacca C, Belkhir K, Lopez J et al. (2019) OrthoMaM v10: Scaling-up orthologous
coding sequence and exon alignments with more than one hundred mammalian
genomes. Molecular Biology and Evolution.
Shen Y, Zhang F, Li F et al. (2019) Loss-of-function mutations in QRICH2 cause male
infertility with multiple morphological abnormalities of the sperm flagella. Nature
Communications.
Silander OK, Tenaillon O, Chao L (2007) Understanding the evolutionary fate of finite
populations: The dynamics of mutational effects. PLoS Biology.
Simons YB, Sella G (2016) The impact of recent population history on the deleterious
mutation load in humans and close evolutionary relatives. Current Opinion in
Genetics and Development.
Simons YB, Turchin MC, Pritchard JK, Sella G (2014) The deleterious mutation load is
insensitive to recent population history. Nature Genetics.
Slade RW, Moritz C, Hoelzel AR, Burton HR (1998) Molecular population genetics of the
southern elephant seal Mirounga leonina. Genetics.
Smith NGC, Eyre-Walker A (2003) Partitioning the variation in mammalian substitution
rates. Molecular Biology and Evolution.
Soulé ME (1985) What is conservation biology? A new synthetic discipline addresses the
dynamics and problems of perturbed species, communities, and ecosystems.
Bioscience.
Southwell C, Bengtson J, Bester M et al. (2012) A review of data on abundance, trends in
abundance, habitat use and diet of ice-breeding seals in the Southern Ocean.
CCAMLR Science.
Stambler N (2014) The mediterranean sea - Primary Productivity. In: The Mediterranean
Sea: Its History and Present Challenges
Stoffel MA, Humble E, Paijmans AJ et al. (2018) Demographic histories and genetic
diversity across pinnipeds are shaped by human exploitation, ecology and
lifehistory. Nature Communications.
Tataru P, Bataillon T (2019) PolyDFEv2.0: Testing for invariance of the distribution of
fitness effects within and across species. Bioinformatics.
Tenaillon O (2014) The Utility of Fisher’s Geometric Model in Evolutionary Genetics.
Annual Review of Ecology, Evolution, and Systematics.
Tenaillon O, Silander OK, Uzan JP, Chao L (2007) Quantifying organismal complexity
using a population genetic approach. PLoS ONE.
Terhorst J, Kamm JA, Song YS (2017) Robust and scalable inference of population history
from hundreds of unphased whole genomes. Nature Genetics.
Thomas GWC, Hahn MW, Hahn Y (2017) The effects of increasing the number of taxa on
inferences of molecular convergence. Genome Biology and Evolution.
Tift MS, Ponganis PJ (2019) Time domains of hypoxia adaptation-elephant seals stand out
among divers. Frontiers in Physiology.
Valenzuela-Toro AM, Gutstein CS, Suárez ME, Otero R, Pyenson ND (2015) Elephant
seal (Mirounga sp.) from the Pleistocene of the Antofagasta Region, northern Chile.
Journal of Vertebrate Paleontology.

van der Valk T, de Manuel M, Marques-Bonet T, Guschanski K (2019) Estimates of
genetic load in small populations suggest extensive purging of deleterious alleles.
bioRxiv.
Vallender EJ, Lahn BT (2004) Positive selection on the human genome. Human Molecular
Genetics.
Valtonen M, Palo JU, Ruokonen M, Kunnasranta M, Nyman T (2012) Spatial and
temporal variation in genetic diversity of an endangered freshwater seal.
Conservation Genetics.
Varela LM, Ortega-Gomez A, Lopez S et al. (2013) The effects of dietary fatty acids on
the postprandial triglyceride-rich lipoprotein/apoB48 receptor axis in human
monocyte/macrophage cells. Journal of Nutritional Biochemistry.
Vitti JJ, Grossman SR, Sabeti PC (2013) Detecting natural selection in genomic data.
Annual Review of Genetics.
Volckmar AL, Song JY, Jarick I et al. (2015) Fine mapping of a GWAS-derived obesity
candidate region on chromosome 16p11.2. PLoS ONE.
Welch JJ, Bininda-Emonds ORP, Bromham L (2008) Correlates of substitution rate
variation in mammalian protein-coding sequences. BMC Evolutionary Biology.
Westbury M V., Hartmann S, Barlow A et al. (2018) Extended and continuous decline in
effective population size results in low genomic diversity in the world’s rarest hyena
species, the brown Hyena. Molecular Biology and Evolution.
Westbury M V., Petersen B, Garde E, Heide-Jørgensen MP, Lorenzen ED (2019) Narwhal
Genome Reveals Long-Term Low Genetic Diversity despite Current Large
Abundance Size. iScience.
Whitlock MC (2000) Fixation of new alleles and the extinction of small populations:
Drift load, beneficial alleles, and sexual selection. Evolution.
Whitlock MC, Griswold CK, Peters AD (2003) Compensating for the meltdown: {T}he
critical effective size of a population with deleterious and compensatory mutations.
Annales Zoologici Fennici.
Wigby S, Chapman T (2004) Sperm competition. Current biology : CB.
Woolfit M (2009) Effective population size and the rate and pattern of nucleotide
substitutions. Biology Letters.
Woolfit M, Bromham L (2005) Population size and molecular evolution on islands.
Proceedings of the Royal Society B: Biological Sciences.
Wright S (1931) Evolution in mendelian populations. Bulletin of Mathematical Biology.
Yang F, Eckardt S, Leu NA, McLaughlin KJ, Wang PJ (2008) Mouse TEX15 is essential
for DNA double-strand break repair and chromosomal synapsis during male meiosis.
Journal of Cell Biology.
Yang Z, Nielsen R (1998) Synonymous and nonsynonymous rate variation in nuclear genes
of mammals. Journal of Molecular Evolution.
Yoder AD, Poelstra JW, Tiley GP, Williams RC, Kumar S (2018) Neutral theory is the
foundation of conservation genetics. Molecular Biology and Evolution.
Yudin NS, Larkin DM, Ignatieva E V. (2017) A compendium and functional
characterization of mammalian genes involved in adaptation to Arctic or Antarctic
environments. BMC Genetics.

Zhang J (2000) Rates of conservative and radical nonsynonymous nucleotide substitutions
in mammalian nuclear genes. Journal of Molecular Evolution.
Zhao ZM, Campbell MC, Li N et al. (2017) Detection of regional variation in selection
intensity within protein-coding genes using DNA sequence polymorphism and
divergence. Molecular Biology and Evolution.
Zhou X, Sun D, Guang X et al. (2018) Molecular footprints of aquatic adaptation including
bone mass changes in cetaceans. Genome Biology and Evolution.

CHAPTER ONE:
No evidence that purifying selection is less efficient in long-term small populations
of seals
Abstract
A widely accepted principle of population genetics is that the efficiency of purifying
selection is inversely proportional to population size. Given that most new mutations are
assumed to be slightly deleterious, many have proposed that amino acid substitution rates,
or mutation accumulation rates more broadly, will be higher in smaller populations.
Comparative genomics allows a way to empirically measure these rates in natural
populations, but the species comparisons must be done in a way that does not inadvertently
bias the result. Here we compare population genomic evolution across six species and two
subspecies of phocid seals. These species are all closely related (maximum divergence 15
million years), but we should that they have dramatically different long-term effective
population sizes and demographic histories. We use a statistic that is insensitive to
demography to measure differences in the rate of mutation accumulation across species,
thereby testing for differences in the long-term efficacy of purifying selection. Contrary to
expectations, we find no evidence that purifying selection has acted less efficiently in
longterm small populations of seals, many of which are currently endangered. This result
presents a surprisingly optimistic outlook for the genetic health of these species, while

simultaneously requiring a re-examination of commonly held assumptions in the field of
population genetics.
Introduction
From carrying capacity to the probability of allele fixation to an IUCN species
assessment, population size is one of the most important parameters in ecology, evolution,
and conservation biology. In population genetics, population size is usually dealt with in
its idealized form: effective population size (Ne). This parameter, first proposed by Sewall
Wright (1931), represents the number of randomly mating individuals in an idealized
population that would produce a given population genetic pattern (e.g. genetic drift,
diversity, coalescence). As such, Ne has played a central role in everything from
mathematical population genetics to conservation management decisions (e.g. Nei &
Tajima 1981, Soulé 1985, Charlesworth 2009). Importantly, Ne is thought to directly relate
to the interplay of selection and drift in the molecular evolution of natural populations
(Charlesworth 2009).
The fields of population genetics and molecular evolution have widely embraced
the mathematical premise of nearly neutral theory: that the probability of fixation of a
slightly deleterious allele increases with decreasing effective population size (Ohta 1972,
1973). Nearly neutral theory has been championed in all areas of molecular evolution, from
phylogenetic substitution rates (Nabholz et al. 2013) to the evolution of genome
architecture and mutation rates (Lynch & Conery 2003, Lynch 2007) to conservation
genetics (Lynch et al. 1995, Lynch & Lande 1998, Yoder et al. 2018).
Theoretical and experimental evidence suggests that most new nonsynonymous
mutations are expected to be either lethal or slightly deleterious (Ohta 1992, Eyre-Walker

& Keightley 2007). If this is the case, we should expect smaller populations to have higher
amino acid substitution rates compared to larger populations (Ohta 1972), although in
empirical data the pattern could be confounded by differences in mutation rate, generation
time, linkage, and the prevalence of positive or balancing selection (Nei & Graur 1984,
Gillespie 2001, Woolfit 2009, Nabholz et al. 2013).
On the other hand, a few evolutionary models have proposed that substitution rate
and mutation accumulation may be independent of population size for reasons other than
simple confounding factors. Theoretical population genetic (Cherry 1998) and protein
evolution (Goldstein 2013) models that allow for concave fitness functions and epistasis
show that the distribution of fitness effects (DFE) is dependent on population fitness and,
relatedly, population size. In this framework, the substitution rate is nearly insensitive to
absolute population size; instead, sudden bursts of substitutions are expected when
population size changes. Notably, these studies do not contradict the main premise of nearly
neutral theory because they predict that the selection coefficients of new mutations change
in a way that is correlated with population size. More recently, Labar and Adami (2017)
showed how substitution patterns and shifts in the DFE could occur through the evolution
of “drift robustness” in small populations. Their work raises the possibility that smaller
populations can accumulate fewer large-effect mutations by landing on flatter fitness peaks.
A few empirical studies have attempted to find support for these various
evolutionary models, but the results have been mixed. In humans, there is little evidence
for differences in substitution rate or mutational load across populations (Henn et al. 2015).
In other species, studies often compare very distantly related taxa (Kosiol et al. 2008, Huber
et al. 2017), which are substantially confounded by generation time, metabolic rates,
phylogenetic signal, and genomic differentiation. Other studies have examined

islandmainland pairs (Johnson & Seger 2001, Woolfit & Bromham 2005, Charlesworth &
Eyre-
Walker 2007, Kutschera et al. 2020) or recently bottlenecked endangered
populations/species (e.g. Robinson et al. 2016, Rogers & Slatkin 2017, van der Valk et al.
2019). As Goldstein (2013) points out, however, such comparisons conflate changes in Ne
with small Ne. As described above, such population size changes may in themselves
produce different patterns of substitutions, making these poor systems in which to test the
impact of Ne on molecular evolution. In addition, most studies that have found differences
among populations rely on analyses of polymorphic sites, such as the ratio of polymorphic
nonsynonymous sites to polymorphic synonymous sites (pN/pS) or homozygosity rates
(Lohmueller et al. 2008, Loire et al. 2013, Marsden et al. 2016, Robinson et al. 2016).
Through theory and simulations, however, Simons and Sella (2016) demonstrated how
these metrics are strongly influenced by demography and are inappropriate measures of the
efficiency of selection.
In this study, we attempt to overcome these obstacles in two important ways. First,
our comparative genomics approach examines a set of closely related seal species. The
eight phocid species in our study are separated by less than 15 Ma (Fulton & Strobeck
2010), yet they have census population sizes that differ by orders of magnitude. The
Hawaiian (Neomonachus schauinslandi) and Mediterranean (Monachus monachus) monk
seals, for example, are endangered tropical species that sister taxa to the incredibly
abundant Antarctic Weddell seal (Leptonychotes weddellii). The northern elephant seal
(Mirounga angustirostris) experienced a population bottleneck that was much more
extreme than the one faced by the southern elephant seal (M. leonina) (Stoffel et al. 2018).

Finally, the common grey seal (Halichoerus grypus) is closely related to the extremely
abundant arctic ringed seal (Pusa hispida), although the Baltic (P. h. botnica) and Saimaa
(P. h. saimensis) subspecies have both experienced recent declines, the latter of which is
one of the most endangered marine mammals in the world (Valtonen et al. 2012). With our
whole-genome data set, we are able to reconstruct the demographic histories of these
species, in many cases confirming long-term differences in population size.
These extreme differences in demography create a natural experiment to test how
population size affects the rate of amino acid substitution and mutation accumulation in
closely related taxa. To measure this, we use multiple statistical approaches that have been
shown to reflect patterns of selection rather than demographic changes (Simons et al. 2014,
Do et al. 2015, Simons & Sella 2016, Pedersen et al. 2017). Through this framework, we
provide detailed empirical evidence for how population size affects patterns of molecular
evolution in natural populations.
Methods
Samples and sequencing
We generated whole genome sequence data for five samples: 2 Hawaiian monk
seals, 2 Mediterranean monk seals, and 1 southern elephant seal. The additional monk seal
genomes were used to check for the effect of individual samples in our downstream
analyses. All sequencing was paired-end and done on an Illumina HiSeq 2500 or Illumina
HiSeq X.
In addition, we downloaded publicly available sequence data from the NCBI
Sequence Read Archive (SRA) for six other samples (NCBI BioSample ID in parentheses):

1 northern elephant seal (SAMN13072016), 1 Weddell seal (SAMN00672463), 1 grey seal
(SAMEA104712343), 1 Baltic ringed seal (SAMEA104712315), 1 Saimaa ringed seal
(SAMEA104712221), and 1 Steller sea lion (SAMN09402722). Raw reads were
downloaded in FASTQ format from SRA.
Reference genomes, read mapping and filtering
We made use of two different high-quality reference genomes for this study: the
Steller sea lion (ASM402803v1) and the Hawaiian monk seal (ASM220157v1). All species
in our study are phylogenetically most closely related to the Hawaiian monk seal, making
this reference genome the most appropriate reference for demographic modelling through
MSMC and hPSMC. However, we were concerned that using an in-group reference
genome may introduce a bias in our mutation accumulation analyses because the study
species would vary in similarity to the reference. Because the Steller sea lion is an outgroup
to the phocid seals included in our study, the genomes of our study species should share the
same level of similarity to the Steller sea lion genome. We therefore decided to use the
annotated Steller sea lion genome as the reference genome for the mutation accumulation
and variant annotation portion of the study. The same pipeline and quality filters were
applied in both cases, unless otherwise specified.
Raw reads were trimmed for quality and adapter removal using TrimGalore v0.4.2
(https://github.com/FelixKrueger/TrimGalore). Trimmed reads were then mapped to the
reference genome using BWA mem (Li 2013). PCR duplicates were removed and depth of
coverage was assessed with Picard (Van der Auwera et al. 2013).

Heterozygosity, MSMC, and hPSMC
Genome-wide heterozygosity was calculated in ANGSD (Korneliussen et al. 2014),
using BAM files of reads mapped to the Hawaiian monk seal reference genome. All
scaffolds greater than 1Mb and not thought to belong to sex-chromosomes (see
supplemental material) were included in the analysis. For each genome, heterozygosity was
estimated as the single sample SFS across non-overlapping blocks of 20Mb, which were
allowed to span more than one scaffold. Genome-wide heterozygosity for each sample was
calculated by taking the arithmetic mean of heterozygosity across all segments. The
standard deviation (SD) and coefficient of variation (CV) were also calculated.
Genomewide heterozygosities were compared to those calculated for other species in
Robinson et al. (2016), Westbury et al. (2018), Westbury et al. (2019), and Morin et al.
(2020).
Sequentially Markovian Coalescent (SMC) models are a way of using the
distribution of heterozygous sites across a genome to reconstruct deep demographic
histories (typically on the order of 1000-100,000 generations before the present) and
coalescent divergence times. To reconstruct demographic histories, we used MSMC2
(Schiffels & Durbin 2014) and following the protocol provided by Schiffels and Wang
(2020). This included generating a reference genome “mappability” mask file through the
SNPable pipeline (http://lh3lh3.users.sourceforge.net/snpable.shtml), as well as an
individual sample mask file based on the specific depth of coverage of each sample. The
bcftools mpileup + call pipeline (Li 2011) was then used to call variants, filtering out
reads with a map quality of less than 20, bases with base quality less than 20, and the -C50
flag to adjust map quality of reads with excessive mismatches.

hPSMC performs the same SMC model on a pseudo-diploid genome created by
combining haploid versions of genomes from two individuals from different populations.
In unphased genome data like ours, this can be done by either using the X-chromosome
from two males (as described by Li and Durbin (2011) or by randomly selecting one allele
at heterozygous sites throughout the genome of two individuals (Cahill et al. 2016). PSMC
(Li & Durbin 2011) is then run on the resulting pseudo-diploid genome. At times before
the two populations split, the model recovers realistic ancestral population trends. After
divergence, however, the model fails to recover coalescent events and therefore estimates
near infinite population sizes. Divergence can be qualitatively assessed by noting when the
population trend line deviates from a reasonable population size towards an infinite size.
Because both pseudo-diploidization methods have limitations, we ran hPSMC on both the
X-chromosome pseudo-diploid genomes and the random allele pseudo-diploid genomes
for all species pairs.
Both MSMC and hPSMC require user-specified values for generation time and
mutation rate. In the supplementary material we discuss our choices for these parameters.
Variant annotation and load statistics
To avoid biases from using an in-group reference genome, for the mutation
accumulation analyses we used reads mapped to the Steller sea lion reference genome and
annotation (Kwan et al. 2019). The bcftools mpileup + call pipeline was again used
to call variants, with stricter minimum quality filters of 25 map quality and 25 base quality.
The resulting VCF was then filtered to include only bi-allelic sites that intersect with
autosomal protein coding sequence (CDS) from the Steller sea lion genome annotation file.
We created a custom effect annotation database for the Steller sea lion with SNPeff

(Cingolani et al. 2012), with which we annotated the variants in each genome. In addition,
we did a custom annotation of nonsynonymous variants to assign a Grantham distance
score to each derived allele. The Grantham distance score (D), which ranges from 5 to 215,
describes how different the derived amino acid is from the ancestral amino acid based on
biophysical properties like polarity and volume (Grantham 1974). Following the
classification scheme from Li et al. (1984), we categorized amino acid changes as
conservative (D < 50), moderately conservative (50 ≤ D < 100), moderately radical (100
≤ D < 150), or radical (D ≥ 150), with the expectation that radical amino acid changes
have more significant fitness effects than conservative changes (Huzurbazar et al.
2010).We wrote a custom python script to parse the annotated VCF file, assign Grantham
scores, determine homozygous derived sites, and compute a number of statistics that have
been proposed to measure mutational load.
The measures we use rely on identifying the ancestral and derived alleles for any
variant site. We considered the Steller sea lion allele to be ancestral, and did not include
any sites that were heterozygous in the Steller sea lion sample. While this method of
defining ancestral alleles by an outgroup sample can occasionally identify the wrong allele
as ancestral, we expect that error to be unbiased in our analyses.
The first method we used was proposed by Simons et al. (2014). This method
simply counts the number of derived alleles of each type in a single diploid genome.
Genomes with higher counts of derived nonsynonymous alleles should have higher
mutational loads under the assumption that most nonsynonymous alleles are slightly
deleterious and additive. This method also avoids the demographic signal that is known to
confound statistics that consider homozygous and heterozygous sites separately.

However, in our study most species share significant phylogenetic history between
the ancestral split (22.5 Ma) and target species splits (100 ka to 15 Ma). The counting
method cannot distinguish between derived alleles that are shared between lineages and
those that occur after the splits between lineages. To avoid this issue, Do et al. (2015)
proposed a set of R-statistics that count derived alleles while controlling for shared derived
alleles, making this statistic more sensitive to mutation accumulation differences between
species. At each variable site i, 𝑑$% is the number of derived alleles [0, 1, 2] in the diploid
genome of sample X and 𝑑&% is the number of derived alleles [0, 1, 2] in the diploid
genome of sample Y, such that the number of derived alleles found in the genome of sample
X but not sample Y is
𝐿$, ,
and the number of derived alleles found in the genome of sample Y but not sample X is
𝐿&, .
From these counts, a ratio of mutation accumulation in the two genomes can be
calculated as
𝑅$/& = 𝐿$,)*+ &/𝐿&,)*+ $.
When this ratio is greater than 1, the rate of mutation accumulation is higher in sample X,
and if it is less than 1 the rate is higher in sample Y.
However, when comparing distantly related species differences in effective
mutation rate (due to differences in molecular mutation rate, generation time, or other
factors) may confound signals of mutational load. Do et al. (2015) created an additional

statistic, called R´X/Y, that normalizes the rate from a target class (e.g. nonsynonymous)
with that of a neutral class (e.g. synonymous), as
𝑅´$;<=>>/& = (??CDEFFCDEFF17,,@AB@AB 17)/
(??@AGHED2IEB2A@F7@AGHED2IEB2A@1,@AB,@AB 1 7 ) =
𝑅$;<=>>/& / 𝑅$)/*JK=<%L=+%*& ).
In this way, 𝑅´$)*)>M)/& gives a measure of nonsynonymous mutation accumulation
while accounting for non-selective forces. In addition, we use this framework to explore
other aspects of the data, such as
𝑅´$J=0/& = 𝑅$J=0%;=</&
/ 𝑅$>M/&)*)MK*N>,
which shows the rate of the radical amino acid mutation accumulation normalized against
neutral synonymous alleles and
𝑅´$>+/*O& = 𝑅$>+/*O& /𝑅$>M)*)MK*N/& >,
which likewise shows the rate of premature stop codon accumulation normalized against
neutral synonymous alleles. Additionally, we use
𝑅´$J=0/&/;*) =𝑅$J=0%;=</& /𝑅$;*)>PJQ=+%QP/&
to compare the accumulation rates of radical and conservative amino acid mutation
accumulation.
Although previous work by Simons and Sella (2015) showed that measures based
exclusively on homozygous or heterozygous sites do not accurately measure mutational
load, others (e.g. Pedersen et al. 2017) have argued that counting derived homozygous
genotypes in the genome better characterizes recessive, rather than additive, variation. In

addition, we wanted to investigate whether differences in heterozygosity levels per se were
affecting our results. We therefore re-analyzed all above statistics using only homozygous
sites, in which each site is counted as either a homozygous derived genotype [1] or not [0].
Both Do et al. (2015) and Simons and Sella (2015) have pointed out that assessing
significance is not straightforward for these analyses. We followed their general suggestion
to perform resampling across segments of the genome. To do this, we divided our annotated
VCF file into 1000 segments, each with an equal number of contiguous variant sites. We
then performed bootstrapping by resampling with replacement, and calculated all statistics
on the resampled VCF. This bootstrapping was repeated 1000 times, which allowed us to
create 95% confidence intervals for each statistic. R statistics were considered significant
when the confidence interval did not include the null expectation of 1.00.
We felt that using the full set of Steller sea lion annotated genes was most
appropriate for our analyses. To check that including all genes did not bias our results, we
repeated the analysis on a VCF that was filtered for only known one-to-one orthologs in
mammals, which is a more evolutionarily conservative set of genes. To do this, we
downloaded a set of 14,507 genes from OrthoMam v10 (Scornavacca et al. 2019), and used
bedtools (Quinlan et al. 2010) to intersect the CDS of those one-to-one orthologs with our
annotated VCF.
Results
Heterozygosity, demographic histories, and divergence times
All genomes included in this study had an average depth of coverage of at least 20X
after PCR duplicates were removed (Table S1). Among the seal species we analyzed,
genome-wide heterozygosity spanned more than an order of magnitude, from 0.000099 in

the Hawaiian monk seal to 0.002500 in the Baltic ringed seal. As shown in Figure 1, when
viewed in the context of other species, our species data set appears to be a representative
sampling of heterozygosities from other mammalian orders.
The localized patterns of heterozygosity within a genome can also be used to model
the demographic history of a population using SMC methods. Below we report in detail the
historical population trends for each species of seal and coalescent divergence times for the
most recently diverged species.
Compared to most other species in our analysis, both species of monk seal show
population trends that are small and declining, especially in the last 100,000 years (Fig. 2).
Notably, the trend lines for these species end considerably earlier than the lines for most
other seal species, which is due to complete coalescence occurring earlier in these genomes
with low heterozygosity. The long-term effective population sizes are 7,109 for the
Hawaiian monk seal and 13,777 for the Mediterranean monk seal (Table 1). Over just the
last 100,000 years, the Ne is below 5,000 for both species. We recover a split between the
northern elephant seal and southern elephant seal to be ~700-800ka (Supplemental Fig.
S6). After their split, the southern elephant seal population stays relatively steady (mean
Ne: 70,474) while the northern elephant seal population decreases and remains
comparatively smaller (mean Ne: 14,562). Compared to the other species, the Weddell seal
shows a moderate Ne (mean: 43,748), with a significant increase over the last 100,000 years
(Fig. 2).
The ringed and grey seals are estimated to have split around 2 million years ago
(Fulton & Strobeck 2010). The grey seal population is notably smaller than the ringed seal
populations after their split (Fig. 2). The two ringed seal subspecies, Baltic and Saimaa, are
estimated to have split around 100ka (supplementary figure S7). This split is also evident

in the full MSMC plot (Fig. 2), which shows the Saimaa and Baltic ringed seal population
curves aligned before about ~200kya but following separate trends after that time. For at
least one million years before their split, the ringed seal subspecies had larger Ne than the
other seal species examined (Fig. 2).
Mutational load
Through multiple measures, we quantified the rate of mutation accumulation and
proxies for mutational load. The Rxy and R’xy statistics we use were developed by Do et al.
2015 and capture the relative rates of derived mutation accumulation across lineages.
Briefly, the Rxy statistic counts the number of derived alleles in the genome of species X
that are not found in species Y, and compare that to the number of derived alleles in the
genome of species Y that are not found in Species X. To account for the potential variation
in mutation rate and generation time across lineages, we focus on the R’xy statistic. This
statistic normalizes the Rxy of certain functional classes (e.g. nonsynonymous, radical) with
the Rxy of a different functional class (e.g. synonymous, conservative), which is presumed
to be evolving neutrally or near-neutrally. In this way, the ratio can be interpreted similarly
to dN/dS ratios. Significance can be determined by bootstrapping across contiguous regions
of the genome. The Rxy results are presented and discussed in the supplementary material.
Given that R’xy is a pairwise statistic, we focused on pairs of species that showed
clear differences in current population size and/or long-term Ne. For example, our MSMC
analysis showed that the endangered Mediterranean monk seal and Hawaiian monk seal
have had Ne that are smaller than those of the Weddell seal and southern elephant seal for
thousands or tens of thousands of generations (Table 1, Fig. 2). Contrary to expectations,

our analysis shows that R’xy is lower in both monk seal species compared to the Weddell
seal and southern elephant seal (Table 2).
This same pattern emerges in phocine seals. Since the lineages split, the grey seal
has consistently had a smaller population size than the Baltic ringed seal (Table 1, Fig. 2).
The R’xy is significantly lower in the grey seal compared to the Baltic ringed seal,
suggesting that mutations have accumulated faster in the larger ringed seal population.
Notably, the grey seal and monk seal species, which appear to have historical population
trends of similar magnitude and shape, have little or no significant difference in R’xy when
compared to each other.
On the other hand, the northern elephant seal appears to have had a smaller Ne than
the southern elephant seal since their split (Fig. 2), and in this case the R’xy shows higher
mutation accumulation in the northern elephant seal compared to the southern elephant
seal. Notably, though, both elephant seals show significantly higher mutation accumulation
when compared to every other species. In addition, comparisons of species with apparently
similar demographic histories (e.g. Hawaiian monk seal and Mediterranean monk seal, or
Mediterranean monk seal and northern elephant seal) show significantly different rates of
mutation accumulation.
Besides analyzing the rates of nonsynonymous and synonymous mutation
accumulation, we also annotated nonsynonymous variants for how different the derived
amino acid was compared to the ancestral amino acid based on biophysical properties
(Grantham 1974). Following Li et al. 1984, we categorized amino acid changes as
conservative, moderately conservative, moderately radical, or radical, with the expectation
that radical amino acid changes have more significant fitness effects than conservative
changes (Huzurbazar et al. 2010). When we calculated the R’xy statistic with radical amino

acid changes as the functional (nonsynonymous) class and synonymous changes as the
normalizing class, we obtained qualitatively similar results to the overall patterns observed
when the statistic is calculated with all nonsynonymous alleles.
However, a distinct pattern emerges when we calculate R’xy with radical amino acid
changes as the functional class (numerator) and conservative amino acid changes as the
normalizing class (denominator). In this case, many of the pairwise patterns described are
inverted. The taxon with a lower rate of overall nonsynonymous mutation accumulation
instead shows a higher ratio of radical-to-conservative amino acid changes (Table 3).
Notably, this does not happen in all cases (e.g. there is no significant difference between
the northern elephant seal and southern elephant seal, and the pattern does not invert for
the comparison of grey seal and Weddell seal).
To test that heterozygous sites per se were not biasing our analyses, we calculated
all statistics using only homozygous variant sites and found the same qualitative pattern
(Supplemental table S8). In addition, we confirmed these patterns through counts of derived
alleles (Supplemental material). These counts show qualitatively the same pattern, though
to a lesser degree because all shared derived alleles are also included in the counts.
Discussion
A strong relationship between historical climate change and population size across
phocid seals
The Hawaiian monk seal and Mediterranean monk seal are unique among living
phocids in that they inhabit tropical or sub-tropical waters (Alava 2017). Both of these

endangered seal species show long-term small population sizes (i.e. Ne<10,000 for much
of their reconstructed history). Furthermore, we reconstruct both monk seal species as
having effective population sizes of only a few thousand in the most recent time periods
(i.e. the past three thousand generations). This finding is consistent with previous
hypotheses, based on ecological estimates and microsatellite diversity, that the historical
Hawaiian monk seal population never exceeded a few thousand (Schultz et al. 2009, 2010).
Thus, our results confirm that the Hawaiian monk seal was already in low numbers well
before the arrival of Polynesian settlers on the islands less than 1500 years ago (Kirch
2011). This finding fits with archeological evidence and the biocultural knowledge of
native Hawaiians (Kittinger et al. 2011).
On the other hand, the historical abundance of the Mediterranean monk seal is more
controversial. There are few historical records commenting on the number of seals in the
Mediterranean region, although some authors note that references to seals in Classical
European literature serve as evidence of their abundance (Johnson & Lavigne 1999). Our
results suggest that the species was not extremely abundant prior to human contact,
although it is possible that strong population subdivision in this species (Karamanlidis et
al. 2016b) affects our reconstruction of past population size for this species. Despite a
distribution throughout the Mediterranean Sea, factors such as low ecosystem productivity
(Stambler 2014) or limited suitable pupping habitat (e.g. shoreline caves and protected
beaches, Dendrinos et al. (2007) may have kept the overall abundance of seals low. As in
the case of the Hawaiian monk seal, our results suggest that the Mediterranean monk seal
population was already small and vulnerable to extinction prior to the extensive human
colonization of the Mediterranean coast in the last 10,000 years. Both monk seal species
experienced well documented recent population declines due to habitat disruption and

hunting (Johnson & Lavigne 1999, Kittinger et al. 2011, Karamanlidis et al. 2016a), but
these declines are too recent to be captured in our MSMC analysis. Future studies with
genomes from more individuals will help to elucidate the patterns of recent population
decline directly caused by human activities (Terhorst et al. 2017).
The northern elephant seal and the grey seal both inhabit temperate waters for all
or part of the year (Ferguson & Higdon 2006). Both of these species show population sizes
in the recent past that are on the order of those reconstructed for the tropical monk seals.
The northern elephant seal and grey seal were both subject to recent anthropogenic
bottlenecks (Stoffel et al. 2018). The case of the northern elephant seal is especially
notable: from an estimated base population of 100,000 individuals, the species was
intensively hunted for oil from the 1840s to 1860s, after which it was thought to be possibly
extinct (Busch 1985). A remnant population was able to grow over the following century
and now the species numbers many hundreds of thousands. While these bottlenecks are too
recent to recover in our MSMC analysis, our reconstruction gives important insight into
the long-term population size of these species that have recovered from recent bottlenecks,
clarifying uncertainties from previous microsatellite-based work (Hoelzel et al. 1993, 2002,
Hedrick 1995, Abadía-Cardoso et al. 2017, Stoffel et al. 2018).
Contrary to the demographic patterns of warm- and temperate-water species, the
three polar seal species (Weddell seal, southern elephant seal, and ringed seal) all show
significantly larger populations over at least the last million years. The Weddell seal is
known to be extremely abundant, with around 200,000–1,000,000 individuals (Southwell
et al. 2012)) around the coast of Antarctica, and was never subject to extensive hunting or
disturbance from humans (Busch 1985). Previous genetic studies found an increase in

population size for the Weddell seal coinciding with the glaciation of Antarctica around
81,000 years ago and a current effective population size of around 150,000 (Curtis et al.
2009, 2011). Our MSMC analysis is closely aligned with this timing and magnitude (Figure
2), giving independent support to this analysis.
The southern elephant seal, on the other hand, was recorded as very abundant before
it became extensively hunted for oil in the 1800s (Busch 1985). However, the southern
elephant seal population never experienced the extreme bottleneck of the northern species,
and has since recovered to many hundreds of thousands of individuals (Busch 1985). Our
analysis shows this population was relatively stable throughout the distant past, with an
effective population size similar to previous estimates using microsatellites (Slade et al.
1998) and RAD-loci (Peart et al. 2020). As noted above, the genetic impact of industrial
sealing, as described elsewhere (Stoffel et al. 2018), is too recent to be recovered in our
analysis.
Ringed seals are extremely abundant, with a circumarctic distribution of over 1
million individuals (Reeves 1998). The two subspecies analyzed here (Baltic ringed seal
and Saimaa ringed seal) have smaller populations limited to around 11,000 individuals in
the Baltic Sea and 200 individuals in Lake Saimaa, respectively (Kokko et al. 1999, Nyman
et al. 2014). Our MSMC analysis shows historically large effective population sizes for
both of these subspecies, but also precipitous declines starting around 100,000 years ago in
the case of the Saimaa ringed seal and 30,000 years ago in the Baltic ringed seal (Figure
2). This timing suggests that extensive Arctic ice cover during the last glaciation may have
caused a subdivision of and decline in the global ringed seal population. Our results agree
with previous microsatellite studies which have suggested that heterozygosity in the Baltic
ringed seal was at least two times greater than in the Saimaa ringed seal (Nyman et al.

2014), and that the long-term Ne of the Baltic ringed seal was about 1.5X larger than the
grey seal (Palo et al. 2001).
Looking across these species, one clear picture emerges: historical climate change
significantly impacted many phocid seal populations. This finding is not surprising, given
that these coastal marine mammals may be reliant on coastal terrestrial habitats, coastal
ecosystem productivity, ice cover and distribution, and regional storm patterns. On the
other hand, we argue that these specific responses of each species are in fact idiosyncratic
and cannot directly be used for future predictions about a species’ response to climate
change. For example, the warm-water monk seal species both experienced declines during
the last glacial period. However, we cannot say whether this decline is explained by a
cooling climate or rather by a dramatic change in climate. If warm-water carrying capacities
are affected by perturbations to coastal ecosystems, then a rapidly warming climate could
also affect the abundance of these species. Likewise, in the ice-breeding seal species we
see that expanding ice around Antarctica coincides with a dramatically increasing Weddell
seal population, while expanding Arctic ice cover eventually leads to a subdivision and
presumed range restriction of ringed seals. Future in depth modelling is required to better
understand how each of these species may respond to current and future climate change,
but our historical population reconstructions offer a grave warning that seal species are very
susceptible to dramatic changes in climate (O’Corry-Crowe 2008, Kovacs et al. 2012).
Divergence times of species and subspecies
We tested two approaches to dating divergent times through an extension of PSMC.
Both approaches take a haploid genome from two populations and combine them into a
pseudo-diploid genome, on which PSMC is run. The effective population size estimated by

the model runs off to infinity at the time when gene flow stops between the two populations,
but the model gives realistic estimates of Ne prior to the split. For each comparison, we ran
PSMC separately on a pseudo-diploid genome generated by combining the X-chromosome
sequence of two male individuals and on a pseudo-diploid genome generated by randomly
selecting a basepair from the full genomes of each of the two individuals. In every case,
the results from the two methods agreed, which is expected in cases such as ours when
most segregating variation is not shared between the populations.
While most of our divergence time estimates align well with previous estimates
based on fossil-calibrated phylogenies, our analysis provides novel insights into the
divergence of two groups of taxa. First, we find that the two elephant seal species diverged
around 700–800 ka. This estimate is much younger than most phylogenetic studies of these
species (e.g. Fyler et al. 2005, Fulton & Strobeck 2010) but matches closely with an earlier
estimate from Slade et al. 1998. Biogeography based on fossils, however, have supported
a later colonization of the North Pacific, during the Early (2500–770 ka) or Middle (770–
126 ka) Pleistocene (Boessenecker & Churchill 2016). In fact, a fossil from the Middle or
Late Pleistocene was discovered in northern Chile (Valenzuela-Toro et al. 2015), which
could represent the time when the species diverged or when the two species still had a close
enough range to have persistent gene flow. Because pseudo-diploid PSMC is thought to
indicate the cessation of gene flow between populations, it is possible that our younger split
time reflects the end of gene flow even if the species had begun to split substantially before
this time. In our full MSMC graph (Figure 2), at around this time the northern elephant seal
curve appears to start aligning with the SES curve, as would be expected at a time before
the population split. However, this happens to be the same time period that the north

elephant seal genome reaches coalescence and therefore we cannot reconstruct the
alignment of the curves prior to this point.
We also are able to shed light on the previously contentious demographic history of
the Saimaa ringed seal, the world’s most endangered pinniped. It has commonly been
assumed that this subspecies became isolated from other ringed seal populations when Lake
Saimaa was formed around 9500 years ago (Valtonen et al. 2012, Nyman et al. 2014,
Savriama et al. 2018), and previous studies have used this data as a strict prior. For example,
a study of mtDNA diversity in these subspecies (Valtonen et al. 2012) used simulations to
show that under commonly assumed mammalian mutation rates, the Saimaa and Baltic
ringed seal subspecies separated 95,000 years ago, which the authors rejected as impossible
to reconcile with geological data. The authors suggested that mutational hotspots in ringed
seals may explain this older date. However, our MSMC whole-genome analysis (Figure 2)
and the pseudo-diploid PSMC analysis (supplementary figure S7) show that these
subspecies split around 100,000 years ago. In addition, we find no evidence that genome-
wide synonymous mutation rates are higher in ringed seals than other seals (supplementary
table S4). Our results suggest that the evolutionary history of ringed seals is more complex
than a single geographic isolation caused by the formation of Lake Saimaa. More generally,
this demonstrates the usefulness of nonparameterized modelling from genome sequence
data compared to more user-defined demographic model testing.
Mutation accumulation
Through this analysis, we detected statistically significant differences in mutation
accumulation and the rates of molecular evolution in almost all of our pairwise
comparisons. Surprisingly, many of these signals were in the opposite direction as would

be predicted by a classical interpretation of nearly neutral theory. To make sense of this, we
first consider methodological errors/artefacts that could give rise to these results. After
rejecting those, we consider biological explanations and make suggestions for future
empirical studies to further explore these explanations.
One possible explanation is that insufficient time has passed for differences to
accumulate in these lineages. Theory predicts that these processes should play out over
time scales related to fixation time (4N generations) and mutational input (1/2Nu
generations, Simons et al. 2014). In our species, we expect this to be equivalent to tens to
hundreds of thousands of years. Indeed, the fact that we detect no statistically significant
differences between the Baltic ringed seal and the Saimaa ringed seal may be attributable
to the relatively shallow divergence (100–200 ka) and more recent difference in population
size of these species. However, all of our other species split well before 100ka, and we
detect statistically significant differences in the more recently split species (e.g. northern
and southern elephant seals; grey and ringed seals). Therefore, although our results support
the idea that differences in mutation accumulation are long-term processes, our sample of
species clearly allows sufficient evolutionary time for these patterns to emerge.
Another possibility is that our demographic reconstructions are deeply flawed and
that the actual historical population sizes were much different than what we reconstruct.
Indeed, much has been written on the dangers of misinterpreting SMC results (Mazet et al.
2016) as well as the limitations of the method itself (Beichman et al. 2017, 2018). Our
primary concern would be if current small population sizes biased historical estimates (e.g.
through the recent loss of genetic diversity). However, other studies of recently
bottlenecked species have still reconstructed large historical population sizes (e.g. Der
Sarkissian et al. 2015, Osada et al. 2015, Abascal et al. 2016). Through our analysis of the

Saimaa and Baltic ringed seals, we also show that this is unlikely to be a problem. The
Saimaa ringed seal has lost significant genetic diversity through a well-documented
bottleneck, yet we successfully recover a large historical population size that matches
perfectly with the curve of the Baltic ringed seal before the taxa split. While it is possible
that recent demographic events could still have affected the most recent time periods of the
model, our ringed seal results suggest that we can accurately estimate deeper demographic
history even from genomes of severely bottlenecked species. In addition, the patterns we
recover generally match those described in previous genetic studies of these species (e.g.
Schultz et al. 2010, Curtis et al. 2011, Peart et al. 2020).
Finally, it could be that the statistics we use are not measuring mutation
accumulation or are otherwise confounded by artefacts in our data. As mentioned above,
population genetic theory and simulations have shown that comparisons based solely on
polymorphisms (e.g. pN/pS) are strongly influenced by demography because the site
frequency spectra of synonymous and nonsynonymous alleles respond differently to
demographic changes (Simons & Sella 2015). Though using the presence of homozygous
derived alleles has also been rejected (Simons & Sella 2015), we recover the same patterns
in our data when using only homozygous sites (supplementary material). This finding is
expected given that in species that are separated by millions of years, the vast majority of
derived alleles are expected to be fixed or lost. Interpreting our results also requires many
assumptions (e.g. that most mutations are deleterious, that most fixed alleles are not the
result of positive selection, and that mutation is a random process). However, the basic
population genetic theories being tested here make these same assumptions.
Assuming, then, that our results are not artefacts of our study design, we turn to
possible biological explanations for the patterns we observe. The first possibility is that the

population sizes during the time period we have reconstructed (i.e. 10 ka to 1 Ma) are very
different from the sizes further back in time (e.g. 3–6Ma). To explain our observed pattern,
this would require the species that have been smaller population sizes for recent time (<1
Ma) in fact had much larger populations than the recently large populations. It is not
obvious why this should be the case, though it is biologically plausible, especially if species
distributions, climate, and productivity were different in the distant past. In order for this
first biological explanation to be true, our reconstructions would have to be wrong and the
patterns of large and small populations would have had to be swapped for many species.
Such a perfect combination of events seems unlikely.
Another explanation is that positive selection could be a much more pervasive force
than is typically assumed in molecular evolution. If many or most new mutations are
beneficial, then molecular evolution is predicted to occur at a higher rate in larger
populations, as is observed in our study. The prevalence of positive selection in molecular
evolution has been widely debated (Boyko et al. 2008, Keightley & Eyre-Walker 2010,
Huber et al. 2017), and we acknowledge that this may play a role in the signal we observe.
Still, to explain our observed pattern the signal from positive selection would have to
strongly outweigh the reduced efficiency of purifying selection predicted by nearly neutral
theory. This pattern on a genome-wide scale would be surprisingly inconsistent with
fundamental assumptions about patterns of selection and the fitness effects of new
mutations.
In the study of small populations, purging of deleterious alleles is often proposed
as mechanism to prevent the fixation of deleterious alleles. In our case, this seems an
unsatisfactory explanation for a number of reasons. The first is that the pattern we observe
is genome-wide. Purging requires that alleles act in a Mendelian recessive way, rather than

an additive one (Fuller et al. 2019). However, data and theory in molecular population
genetics suggest that additive effect loci make up a substantial portion of the genome (Hill
et al. 2008). Second, if purging were the dominant explanation then we would expect the
highest-effect mutations to be purged most easily in the small populations, leading to a
pattern of lower rates of mutation accumulation for this class of alleles. In fact, the pattern
we observe is the opposite, with relative rates of presumably large-effect mutations (e.g.
premature stop codons and radical amino acid changes) being higher in smaller
populations. Therefore, widespread purging does not fit with the overall pattern we observe.
Instead, we propose two plausible biological explanations that seem to fit the
observed patterns in this study. The first is that rates of molecular evolution and patterns of
mutation accumulation are not affected by population size, or are much more strongly
affected by other factors. For example, shared phylogenetic history, life history traits,
molecular phenotypes, or other biological or ecological factors could strongly affect
molecular evolution in mammals (e.g. Smith & Eyre-Walker 2003, Welch et al. 2008,
Bromham 2011). Although we have tried to minimize these factors by focusing on a single
mammalian family (Phocidae) and looking for repeated patterns across clades within that
family, relevant outlier traits still remain. For example, the elephant seal species have an
extremely polygynous mating system, with some of the most extreme sexual dimorphism
observed in any mammal (Le Boeuf & Laws 1994). Compared to other closely related seal
species, the two species of elephant seals have elevated rates of mutation accumulation of
almost every functional class (Table 2, Supplementary Table S4). It is possible that the
extreme life history traits of this species are causally related to their increased mutation
accumulation. We note, however, that that the only other moderately polygynous species in
our data set (i.e. grey seal) apparently exhibits opposite patterns of molecular evolution.

Notably, we also see clear phylogenetic signal in our analyses, though we cannot tease apart
the proportion of this due to ancestral signal and that relating to lineage
characteristics.
The second plausible explanation is that—contrary to assumptions in the
literature—the distribution of fitness effects (DFE) of new mutations may not be the same
across populations. In fact, the DFE itself may not be independent of population size or
evolutionary history. If this is the case, it would have profound implications for the patterns
we would expect to see in empirical systems, and as well as how we interpret those patterns.
Some theoretical frameworks, themselves consistent with the mathematics of nearly
neutral theory, predict that mutation accumulation patterns should be mostly independent
of population size due to a feedback between molecular evolution and the DFE of new
mutations. These proposals include theoretical models (Cherry 1998), population genetic
simulations (Labar and Adami 2017), protein model simulation (Goldstein 2013), and
empirical studies of DFE across species (Huber et al. 2017). As Silander et al. (2007) argue
based on mutation accumulation experiments, mutational effects are dynamic, depend on
the genetic context in which they arise, and can shift over short timescales. Under these
frameworks, smaller populations have lower fitness than larger populations, but this in turn
makes the smaller populations less tolerant of new mutations. In other words, the
evolutionary history of a population influences the DFE of new mutations.
While not conclusive, we believe that our results may provide empirical support for
this theoretical framework. We find that smaller populations (monk seals, grey seals) have
lower rates of mutation accumulation compared to larger populations. Notably, our larger
populations have gone through recent expansions (Weddell seal, ringed seals) or declines
(elephant seals, ringed seals). This observed pattern appears to be in line with quantitative

genetic and protein evolution models (Cherry 1998, Goldstein 2013) that predict an
elevated rate of molecular evolution when populations change in size, but not from
population size per se.
On the other hand, our smaller populations show higher ratios of radical-
toconservative amino acid changes. This surprising difference could have a number of
explanations. These ratios could suggest a difference in DFE, leading to smaller
populations fixing a greater proportion of large effect mutations. Notably, as predicted by
Labar and Adami (2017), our results show that our smaller populations have fewer
nonsynonymous changes overall and yet a greater proportion of large-effect changes.
Another possibility is that the higher radical-to-conservative ratio is indicative of positive
selection in these populations, as has been proposed at the gene level (Hughes & Hughes
1993, Zhang 2000). Huzurbazar et al. (2010), however, used a simulation framework to
show that selection coefficients decreased with an increasing Grantham score, which
suggests that fixed radical changes may actually be more neutral. This result is similar to a
theoretical argument made by Simons and Sella (2015) that the effect of an amino-acid
change may be unexpectedly low conditional upon that allele reaching a high frequency in
the population. In general, though, we believe that the theoretical (Simons and Sella 2015)
and empirical (Henn et al. 2015, Huber et al. 2020) evidence suggests we should be
skeptical of annotating classes of nonsynonymous variants, especially in non-model
species.
Conservation implications
Our study provides important insight in the evolutionary history of some of the
world’s most endangered marine mammals. As discussed above, demographic

reconstructions indicate that both species of monk seal had relatively small and declining
populations prior to any human interactions. This result suggests that the Mediterranean
and Hawaiian monk seal species were already vulnerable to extinction when human
populations expanded across the Mediterranean region around 5000 years ago and when
Polynesians arrived in Hawaii around 1000 years ago. While both ancient and modern
humans have undoubtedly had an impact on these species, other biological and ecological
factors likely have played a role in their vulnerability to extinction and slow recovery. Our
study will help to establish realistic recovery goals for these species based on historical
population sizes.
The Saimaa ringed seal is another endangered pinniped, with fewer than 200 mature
individuals remaining. Our analysis suggests that the split between Saimaa ringed seals and
other ringed seal subspecies is much older than previously proposed. This divergence
estimate suggests that the evolutionary history of ringed seals, and perhaps other Arctic
pinnipeds, is complex, with unappreciated geological and climatic phenomena likely
playing a role in species’ distribution and evolution. Importantly, this finding also
highlights the evolutionary uniqueness of the Saimaa ringed seal and may warrant a
taxonomic re-examination of this critically endangered taxon.

References
van der Aar AMG, Sylva-Steenland RMR, Bos JD et al. (2007) Cutting Edge: Loss of
TLR2, TLR4, and TLR5 on Langerhans Cells Abolishes Bacterial Recognition. The
Journal of Immunology.
Abadía-Cardoso A, Freimer NB, Deiner K, Garza JC (2017) Molecular Population
Genetics of the Northern Elephant Seal Mirounga angustirostris. Journal of
Heredity.
Abascal F, Corvelo A, Cruz F et al. (2016) Extreme genomic erosion after recurrent
demographic bottlenecks in the highly endangered Iberian lynx. Genome Biology.
Adami C, Ofria C, Collier TC (2000) Evolution of biological complexity. Proceedings of
the National Academy of Sciences of the United States of America.
Alava JJ (2017) Tropical pinnipeds: Bio-ecology, threats and conservation.
Andrews RD, Jones DR, Williams JD et al. (1997) Heart rates of northern elephant seals
diving at sea and resting on the beach. Journal of Experimental Biology.
Ashburner M, Ball CA, Blake JA et al. (2000) Gene ontology: Tool for the unification of
biology. Nature Genetics.
Van der Auwera GA, Carneiro MO, Hartl C et al. (2013) From fastQ data to
highconfidence variant calls: The genome analysis toolkit best practices pipeline.
Current Protocols in Bioinformatics.
Bagchi A, Batten AJ, Levin M et al. (2018) Intrinsic anti-inflammatory properties in the
serum of two species of deep-diving seal. Journal of Experimental Biology.
Baker JD, Barbieri MM, Johanos TC et al. (2020) Conservation translocations of
Hawaiian monk seals: accounting for variability in body condition improves
evaluation of translocation efficacy. Animal Conservation.
Beichman AC, Huerta-Sanchez E, Lohmueller KE (2018) Using genomic data to infer
historic population dynamics of nonmodel organisms. Annual Review of Ecology,
Evolution, and Systematics.
Beichman AC, Phung TN, Lohmueller KE (2017) Comparison of single genome and
allele frequency data reveals discordant demographic histories. G3: Genes,
Genomes, Genetics.
Berta A, Churchill M, Boessenecker RW (2018) The Origin and Evolutionary Biology of
Pinnipeds: Seals, Sea Lions, and Walruses. Annual Review of Earth and Planetary
Sciences.
Berta A, Sumich JL, Kovacs KM (2015) Marine Mammals: Evolutionary Biology: Third
Edition.

Blix AS (2018) Adaptations to deep and prolonged diving in phocid seals. The Journal of
experimental biology.
Boessenecker RW, Churchill M (2016) The origin of elephant seals: implications of a
fragmentary late Pliocene seal (Phocidae: Miroungini) from New Zealand. New
Zealand Journal of Geology and Geophysics.
Le Boeuf BJ, Laws RM (1994) Elephant seals: An introduction to the genus. Elephant
Seals: Population Ecology, Behavior, and Physiology.
Boyko AR, Williamson SH, Indap AR et al. (2008) Assessing the evolutionary impact of
amino acid mutations in the human genome. PLoS Genetics.
Bromham L (2009) Why do species vary in their rate of molecular evolution? Biology
Letters.
Bromham L (2011) The genome as a life-history character: Why rate of molecular
evolution varies between mammal species. Philosophical Transactions of the Royal
Society B: Biological Sciences.
Brown ML, Yui K, Smith JD et al. (2002) The murine macrophage apoB-48 receptor gene
(Apob-48r): Homology to the human receptor. Journal of Lipid Research.
de Bruyn PJN, Tosh CA, Bester MN et al. (2011) Sex at sea: Alternative mating system in
an extremely polygynous mammal. Animal Behaviour.
Busch BC (1985) The war against the seals: a history of the North American seal fishery.
The war against the seals: a history of the North American seal fishery.
Cahill JA, Soares AER, Green RE, Shapiro B (2016) Inferring species divergence times
using pairwise sequential markovian coalescent modelling and low-coverage
genomic data. Philosophical Transactions of the Royal Society B: Biological
Sciences.
Castellano D, MacIà MC, Tataru P, Bataillon T, Munch K (2019) Comparison of the full
distribution of fitness effects of new amino acid mutations across great apes.
Genetics.
Cescon M, Gattazzo F, Chen P, Bonaldo P (2015) Collagen VI at a glance. Journal of Cell
Science.
Chakravarti A (1999) Population genetics-making sense out of sequence. Nature Genetics.
Champagne CD, Crocker DE, Fowler MA, Houser DS (2013) Fasting physiology of the
pinnipeds: The challenges of fasting while maintaining high energy expenditure and
nutrient delivery for lactation. In: Comparative Physiology of Fasting, Starvation,
and Food Limitation
Charlesworth B (2009) Effective population size and patterns of molecular evolution and
variation. Nature Reviews Genetics.
Charlesworth J, Eyre-Walker A (2007) The other side of the nearly neutral theory,
evidence of slightly advantageous back-mutations. Proceedings of the National
Academy of Sciences of the United States of America.
Cherry JL (1998) Should we expect substitution rate to depend on population size?
Genetics.
Chikina M, Robinson JD, Clark NL (2016) Hundreds of Genes Experienced Convergent
Shifts in Selective Pressure in Marine Mammals. Molecular Biology and Evolution.

Cingolani P, Platts A, Wang LL et al. (2012) A program for annotating and predicting the
effects of single nucleotide polymorphisms, SnpEff: SNPs in the genome of
Drosophila melanogaster strain w1118; iso-2; iso-3. Fly.
Clark NL, Swanson WJ (2005) Pervasive adaptive evolution in primate seminal proteins.
PLoS Genetics.
Couce A, Caudwell LV, Feinauer C et al. (2017) Mutator genomes decay, despite
sustained fitness gains, in a long-term experiment with bacteria. Proceedings of the
National Academy of Sciences of the United States of America.
Crawford JE, Amaru R, Song J et al. (2017) Natural Selection on Genes Related to
Cardiovascular Health in High-Altitude Adapted Andeans. American Journal of
Human Genetics.
Curtis C, Stewart BS, Karl SA (2009) Pleistocene population expansions of Antarctic seals.
Molecular Ecology.
Curtis C, Stewart BS, Karl SA (2011) Genetically effective population sizes of Antarctic
seals estimated from nuclear genes. Conservation Genetics.
Danecek P, Auton A, Abecasis G et al. (2011) The variant call format and VCFtools.
Bioinformatics, 27, 2156–2158.
Dapper AL, Wade MJ (2016) The evolution of sperm competition genes: The effect of
mating system on levels of genetic variation within and between species. Evolution.
Dean R, Wright AE, Marsh-Rollo SE et al. (2017) Sperm competition shapes gene
expression and sequence evolution in the ocellated wrasse. Molecular Ecology.
Dendrinos P, Karamanlidis AA, Kotomatas S et al. (2007) Pupping habitat use in the
Mediterranean monk seal: A long-term study. Marine Mammal Science.
Deyarmin JS, McCormley MC, Champagne CD et al. (2019) Blubber transcriptome
responses to repeated ACTH administration in a marine mammal. Scientific Reports.
Do R, Balick D, Li H et al. (2015) No evidence that selection has been less effective at
removing deleterious mutations in Europeans than in Africans. Nature Genetics.
Estes S, Phillips PC, Denver DR, Thomas WK, Lynch M (2004) Mutation Accumulation
in Populations of Varying Size: The Distribution of Mutational Effects for Fitness
Correlates in Caenorhabditis elegans. Genetics.
Eyre-Walker A, Keightley PD (2007) The distribution of fitness effects of new mutations.
Nature Reviews Genetics.
Ferguson SH, Higdon JW (2006) How seals divide up the world: Environment, life history,
and conservation. Oecologia.
Foote AD, Liu Y, Thomas GWC et al. (2015) Convergent evolution of the genomes of
marine mammals. Nature Genetics.
Fowler M, Champagne C, Crocker D (2018) Adiposity and fat metabolism during
combined fasting and lactation in elephant seals. Journal of Experimental Biology.
Fowler MA, Debier C, Mignolet E et al. (2014) Fatty acid mobilization and comparison
to milk fatty acid content in northern elephant seals. Journal of Comparative
Physiology B: Biochemical, Systemic, and Environmental Physiology.
Fujita Y, Ezura Y, Bujo H et al. (2005) Association of nucleotide variations in the
apolipoprotein B48 receptor gene (APOB48R) with hypercholesterolemia. Journal
of Human Genetics.

Fuller ZL, Berg JJ, Mostafavi H, Sella G, Przeworski M (2019) Measuring intolerance to
mutation in human genetics. Nature Genetics.
Fulton TL, Strobeck C (2010) Multiple fossil calibrations, nuclear loci and mitochondrial
genomes provide new insight into biogeography and divergence timing for true seals
(Phocidae, Pinnipedia). Journal of Biogeography.
Fyler CA, Reeder TW, Berta A et al. (2005) Historical biogeography and phylogeny of
monachine seals (Pinnipedia: Phocidae) based on mitochondrial and nuclear DNA
data. Journal of Biogeography.
Galtier N, Rousselle M (2020) How Much Does Ne Vary Among Species? Genetics, 216,
559–572.
Gillespie JH (2001) Is the population size of a species relevant to its evolution? Evolution.
Glazier AM, Nadeau JH, Aitman TJ (2002) Genetics: Finding genes that underline complex
traits. Science.
Goldstein RA (2013) Population size dependence of fitness effect distribution and
substitution rate probed by biophysical model of protein thermostability. Genome
Biology and Evolution.
Gopalakrishnan K, Kumarasamy S, Abdul-Majeed S et al. (2012) Targeted disruption of
Adamts16 gene in a rat genetic model of hypertension. Proceedings of the National
Academy of Sciences of the United States of America.
Grantham R (1974) Amino acid difference formula to help explain protein evolution.
Science.
Gutenkunst RN, Hernandez RD, Williamson SH, Bustamante CD (2009) Inferring the
joint demographic history of multiple populations from multidimensional SNP
frequency data. PLoS Genetics.
Hahn MW (2008) Toward a selection theory of molecular evolution. Evolution.
Hedrick PW (1995) Elephant seals and the estimation of a population bottleneck. Journal
of Heredity.
Henn BM, Botigué LR, Bustamante CD, Clark AG, Gravel S (2015) Estimating the
mutation load in human genomes. Nature Reviews Genetics.
Hill WG, Goddard ME, Visscher PM (2008) Data and theory point to mainly additive
genetic variance for complex traits. PLoS Genetics.
Hindle AG (2020) Diving deep: Understanding the genetic components of hypoxia
tolerance in marine mammals. Journal of Applied Physiology.
Hoelzel AR, Fleischer RC, Campagna C, Le Boeuf BJ, Alvord G (2002) Impact of a
population bottleneck on symmetry and genetic diversity in the northern elephant
seal. Journal of Evolutionary Biology.
Hoelzel AR, Halley J, O’brien SJ et al. (1993) Elephant seal genetic variation and the use
of simulation models to investigate historical population bottlenecks. Journal of
Heredity.
Huang T, Yin Y, Liu C et al. (2020) Absence of murine CFAP61 causes male infertility due
to multiple morphological abnormalities of the flagella. Science Bulletin.
Huber CD, Kim BY, Marsden CD, Lohmueller KE (2017) Determining the factors
driving selective effects of new nonsynonymous mutations. Proceedings of the
National Academy of Sciences of the United States of America.
Hughes AL, Hughes MK (1993) Adaptive evolution in the rat olfactory receptor gene
family. Journal of Molecular Evolution.

Hurst LD (2002) The Ka/Ks ratio: Diagnosing the form of sequence evolution. Trends in
Genetics.
Huzurbazar S, Kolesov G, Massey SE et al. (2010) Lineage-Specific Differences in the
Amino Acid Substitution Process. Journal of Molecular Biology.
Johnson W, Lavigne D (1999) Monk seals in antiquity. Mededelingen.
Johnson KP, Seger J (2001) Elevated rates of nonsynonymous substitution in island birds.
Molecular Biology and Evolution.
Karamanlidis AA, Dendrinos P, de Larrinoa PF et al. (2016a) The Mediterranean monk
seal Monachus monachus: Status, biology, threats, and conservation priorities.
Mammal Review.
Karamanlidis AA, Gaughran S, Aguilar A et al. (2016b) Shaping species conservation
strategies using mtDNA analysis: The case of the elusive Mediterranean monk seal
(Monachus monachus). Biological Conservation.
Keightley PD (1998) Inference of genome-wide mutation rates and distributions of
mutation effects for fitness traits: A simulation study. Genetics.
Keightley PD, Eyre-Walker A (2007) Joint inference of the distribution of fitness effects
of deleterious mutations and population demography based on nucleotide
polymorphism frequencies. Genetics.
Keightley PD, Eyre-Walker A (2010) What can we learn about the distribution of fitness
effects of new mutations from DNA sequence data? Philosophical Transactions of
the Royal Society B: Biological Sciences.
Kern AD, Hahn MW (2018) The neutral theory in light of natural selection. Molecular
Biology and Evolution.
Khudyakov JI, Abdollahi E, Ngo A et al. (2019) Expression of obesity-related adipokine
genes during fasting in a naturally obese marine mammal. American journal of
physiology. Regulatory, integrative and comparative physiology.
Kim BY, Huber CD, Lohmueller KE (2017a) Inference of the distribution of selection
coefficients for new nonsynonymous mutations using large samples. Genetics.
Kim BY, Huber CD, Lohmueller KE (2017b) Inference of the distribution of selection
coefficients for new nonsynonymous mutations using large samples. Genetics.
Kimura M (1968) Evolutionary rate at the molecular level. Nature.
Kimura M (1977) Preponderance of synonymous changes as evidence for the neutral theory
of molecular evolution [33]. Nature.
Kirch P V. (2011) When Did the Polynesians Settle Hawai’i? A Review of 150 Years of
Scholarly Inquiry and a Tentative Answer. Hawaiian Archaeology.
Kittinger JN, Pandolfi JM, Blodgett JH et al. (2011) Historical reconstruction reveals
recovery in Hawaiian coral reefs. PLoS ONE.
Kokko H, Helle E, Lindström J et al. (1999) Backcasting population sizes of ringed and
grey seals in the Baltic and Lake Saimaa during the 20th century. Annales Zoologici
Fennici.
Korneliussen TS, Albrechtsen A, Nielsen R (2014) ANGSD: Analysis of Next Generation
Sequencing Data. BMC Bioinformatics.
Kosiol C, Vinař T, Da Fonseca RR et al. (2008) Patterns of positive selection in six
mammalian genomes. PLoS Genetics.

Kovacs KM, Aguilar A, Aurioles D et al. (2012) Global threats to pinnipeds. Marine
Mammal Science.
Kreitman M (1996) The neutral theory is dead. Long live the neutral theory. BioEssays.
Kreitman M, Akashi H (1995) Molecular evidence for natural selection. Annual Review of
Ecology and Systematics.
Kretzmann MB, Gemmell NJ, Meyer A (2001) Microsatellite analysis of population
structure in the endangered Hawaiian monk seal. Conservation Biology.
Kutschera VE, Poelstra JW, Botero-Castro F et al. (2020) Purifying Selection in Corvids Is
Less Efficient on Islands. Molecular Biology and Evolution.
Kwan HH, Culibrk L, Taylor GA et al. (2019) The genome of the steller sea lion
(Eumetopias jubatus). Genes.
Labar T, Adami C (2017) Evolution of drift robustness in small populations. Nature
Communications.
Lande R (2003) Mutation and Conservation. Conservation Biology.
Leboeuf BJ (1972) Sexual behavior in the northern elephant seal mirounga angustirostris.
Behaviour.
Van Der Lee R, Wiel L, Van Dam TJP, Huynen MA (2017) Genome-scale detection of
positive selection in nine primates predicts human-virus evolutionary conflicts.
Nucleic Acids Research.
Li H (2011) A statistical framework for SNP calling, mutation discovery, association
mapping and population genetical parameter estimation from sequencing data.
Bioinformatics.
Li H (2013) Aligning sequence reads, clone sequences and assembly contigs with
BWAMEM. arXiv preprint arXiv.
Li H, Durbin R (2011) Inference of human population history from individual
wholegenome sequences. Nature.
Li WH, Wu CI, Luo CC (1984) Nonrandomness of point mutation as reflected in
nucleotide substitutions in pseudogenes and its evolutionary implications. Journal of
Molecular Evolution.
Lohmueller KE, Indap AR, Schmidt S et al. (2008) Proportionally more deleterious genetic
variation in European than in African populations. Nature.
Loire E, Chiari Y, Bernard A et al. (2013) Population genomics of the endangered giant
Galapagos tortoise. Genome Biology, 14.
Lourenço J, Galtier N, Glémin S (2011) Complexity, pleiotropy, and the fitness effect of
mutations. Evolution.
Lynch M, Conery JS (2003) The Origins of Genome Complexity. Science.
Lynch M, Conery J, Burger R (1995) Mutation accumulation and the extinction of small
populations. American Naturalist.
Lynch M, Lande R (1998) The critical effective size for a genetically secure population.
Animal Conservation.
Lynch VJ, Wagner GP (2008) Resurrecting the role of transcription factor change in
developmental evolution. Evolution.
Marsden CD, Vecchyo DO Del, O’Brien DP et al. (2016) Bottlenecks and selective
sweeps during domestication have increased deleterious genetic variation in dogs.
Proceedings of the National Academy of Sciences of the United States of America.

Martin AP, Palumbi SR (1993) Body size, metabolic rate, generation time, and the
molecular clock. Proceedings of the National Academy of Sciences of the United
States of America.
Martinez B, Khudyakov J, Rutherford K et al. (2018) Adipose transcriptome analysis
provides novel insights into molecular regulation of prolonged fasting in northern
elephant seal pups. Physiological Genomics.
Martinon F, Burns K, Tschopp J (2002) The Inflammasome: A molecular platform
triggering activation of inflammatory caspases and processing of proIL-β. Molecular
Cell.
Mazet O, Rodríguez W, Grusea S, Boitard S, Chikhi L (2016) On the importance of being
structured: Instantaneous coalescence rates and human evolution-lessons for
ancestral population size inference? Heredity.
McDonald JH, Kreitman M (1991) Adaptive protein evolution at the Adh locus in
Drosophila. Nature.
Mi H, Muruganujan A, Ebert D, Huang X, Thomas PD (2019) PANTHER version 14:
More genomes, a new PANTHER GO-slim and improvements in enrichment
analysis tools. Nucleic Acids Research.
Mohr DW, Naguib A, Weisenfeld NI et al. (2017) Improved de novo genome assembly:
Linked-read sequencing combined with optical mapping produce a high quality
mammalian genome at relatively low cost. bioRxiv.
Morin PA, Archer FI, Avila CD et al. (2020) Reference genome and demographic history
of the most endangered marine mammal, the vaquita. Molecular Ecology Resources.
Nabholz B, Uwimana N, Lartillot N (2013) Reconstructing the phylogenetic history of
long-term effective population size and life-history traits using patterns of amino
acid replacement in mitochondrial genomes of mammals and birds. Genome Biology
and Evolution.
Nagano H, Hashimoto N, Nakayama A et al. (2018) p53-inducible DPYSL4 associates
with mitochondrial supercomplexes and regulates energy metabolism in adipocytes
and cancer cells. Proceedings of the National Academy of Sciences of the United
States of America.
Naqvi S, Godfrey AK, Hughes JF et al. (2019) Conservation, acquisition, and functional
impact of sex-biased gene expression in mammals. Science.
Nei M, Graur D (1984) Extent of Protein Polymorphism and the Neutral Mutation Theory.
In: Evolutionary Biology
Nei M, Tajima F (1981) Genetic drift and estimation of effective population size. Genetics.
Nyman T, Valtonen M, Aspi J et al. (2014) Demographic histories and genetic diversities
of Fennoscandian marine and landlocked ringed seal subspecies. Ecology and
Evolution.
O’Corry-Crowe G (2008) Climate change and the molecular ecology of arctic marine
mammals. Ecological Applications.
Ohta T (1972) Population size and rate of evolution. Journal of Molecular Evolution.
Ohta T (1973) Slightly deleterious mutant substitutions in evolution. Nature.
Ohta T (1992) The nearly neutral theory of molecular evolution. Annual Review of Ecology
and Systematics.

Ohta T, Gillespie JH (1996) Development of neutral nearly neutral theories. Theoretical
Population Biology.
Orr HA (2003) The distribution of fitness effects among beneficial mutations. Genetics.
Osada N, Hettiarachchi N, Babarinde IA, Saitou N, Blancher A (2015) Whole-genome
sequencing of six Mauritian cynomolgus macaques (Macaca fascicularis) reveals a
genome-wide pattern of polymorphisms under extreme population bottleneck.
Genome Biology and Evolution.
Palo JU, Mäkinen HS, Helle E, Stenman O, Väinölä R (2001) Microsatellite variation in
ringed seals (Phoca hispida): Genetic structure and history of the Baltic Sea
population. Heredity.
Papkou A, Guzella T, Yang W et al. (2019) The genomic basis of red queen dynamics
during rapid reciprocal host–pathogen coevolution. Proceedings of the National
Academy of Sciences of the United States of America.
Paterson RS, Rybczynski N, Kohno N, Maddin HC (2020) A Total Evidence
Phylogenetic Analysis of Pinniped Phylogeny and the Possibility of Parallel
Evolution Within a Monophyletic Framework. Frontiers in Ecology and Evolution.
Peart CR, Tusso S, Pophaly SD et al. (2020) Determinants of genetic variation across eco-
evolutionary scales in pinnipeds. Nature Ecology and Evolution.
Pedersen CET, Lohmueller KE, Grarup N et al. (2017) The effect of an extreme and
prolonged population bottleneck on patterns of deleterious variation: Insights from
the Greenlandic Inuit. Genetics.
Poon A, Otto SP (2000) Compensating for our load of mutations: Freezing the meltdown
of small populations. Evolution.
Purcell S, Neale B, Todd-Brown K et al. (2007) PLINK: A tool set for whole-genome
association and population-based linkage analyses. American Journal of Human
Genetics.
Rannikko K, Ortutay C, Vihinen M (2007) Immunity genes and their orthologs: A
multispecies database. International Immunology.
Reeves RR (1998) Distribution, abundance and biology of ringed seals (Phoca hispida): an
overview. NAMMCO Scientific Publications.
Robinson JD, Coffman AJ, Hickerson MJ, Gutenkunst RN (2014) Sampling strategies for
frequency spectrum-based population genomic inference. BMC Evolutionary
Biology.
Robinson JA, Ortega-Del Vecchyo D, Fan Z et al. (2016) Genomic Flatlining in the
Endangered Island Fox. Current Biology.
Rogers RL, Slatkin M (2017) Excess of genomic defects in a woolly mammoth on Wrangel
island. PLoS Genetics.
Sabeti PC, Reich DE, Higgins JM et al. (2002) Detecting recent positive selection in the
human genome from haplotype structure. Nature.
Sabeti PC, Schaffner SF, Fry B et al. (2006) Positive natural selection in the human lineage.
Science, 312, 1614–1620.
Sackton TB, Grayson P, Cloutier A et al. (2019) Convergent regulatory evolution and loss
of flight in paleognathous birds. Science.

Sanjuán R, Moya A, Elena SF (2004) The distribution of fitness effects caused by
singlenucleotide substitutions in an RNA virus. Proceedings of the National
Academy of Sciences of the United States of America.
Der Sarkissian C, Ermini L, Schubert M et al. (2015) Evolutionary genomics and
conservation of the endangered Przewalski’s horse. Current Biology.
Savriama Y, Valtonen M, Kammonen JI et al. (2018) Bracketing phenogenotypic limits of
mammalian hybridization. Royal Society Open Science.
Sawyer SA, Hartl DL (1992) Population genetics of polymorphism and divergence.
Genetics.
Schiffels S, Durbin R (2014) Inferring human population size and separation history from
multiple genome sequences. Nature Genetics.
Schiffels S, Wang K (2020) MSMC and MSMC2: The multiple sequentially Markovian
coalescent. In: Methods in Molecular Biology
Schultz JK, Baker JD, Toonen RJ, Bowen BW (2009) Extremely low genetic diversity in
the endangered Hawaiian monk seal (Monachus schauinslandi). Journal of Heredity.
Schultz ST, Lynch M, Willis JH (1999) Spontaneous deleterious mutation in Arabidopsis
thaliana. Proceedings of the National Academy of Sciences of the United States of
America.
Schultz JK, Marshall AJ, Pfunder M (2010) Genome-wide loss of diversity in the critically
endangered Hawaiian monk seal. Diversity.
Scornavacca C, Belkhir K, Lopez J et al. (2019) OrthoMaM v10: Scaling-up orthologous
coding sequence and exon alignments with more than one hundred mammalian
genomes. Molecular Biology and Evolution.
Shen Y, Zhang F, Li F et al. (2019) Loss-of-function mutations in QRICH2 cause male
infertility with multiple morphological abnormalities of the sperm flagella. Nature
Communications.
Silander OK, Tenaillon O, Chao L (2007) Understanding the evolutionary fate of finite
populations: The dynamics of mutational effects. PLoS Biology.
Simons YB, Sella G (2016) The impact of recent population history on the deleterious
mutation load in humans and close evolutionary relatives. Current Opinion in
Genetics and Development.
Simons YB, Turchin MC, Pritchard JK, Sella G (2014) The deleterious mutation load is
insensitive to recent population history. Nature Genetics.
Slade RW, Moritz C, Hoelzel AR, Burton HR (1998) Molecular population genetics of the
southern elephant seal Mirounga leonina. Genetics.
Smith NGC, Eyre-Walker A (2003) Partitioning the variation in mammalian substitution
rates. Molecular Biology and Evolution.
Soulé ME (1985) What is conservation biology? A new synthetic discipline addresses the
dynamics and problems of perturbed species, communities, and ecosystems.
Bioscience.
Southwell C, Bengtson J, Bester M et al. (2012) A review of data on abundance, trends in
abundance, habitat use and diet of ice-breeding seals in the Southern Ocean.
CCAMLR Science.
Stambler N (2014) The mediterranean sea - Primary Productivity. In: The Mediterranean
Sea: Its History and Present Challenges

Stoffel MA, Humble E, Paijmans AJ et al. (2018) Demographic histories and genetic
diversity across pinnipeds are shaped by human exploitation, ecology and
lifehistory. Nature Communications.
Tataru P, Bataillon T (2019) PolyDFEv2.0: Testing for invariance of the distribution of
fitness effects within and across species. Bioinformatics.
Tenaillon O (2014) The Utility of Fisher’s Geometric Model in Evolutionary Genetics.
Annual Review of Ecology, Evolution, and Systematics.
Tenaillon O, Silander OK, Uzan JP, Chao L (2007) Quantifying organismal complexity
using a population genetic approach. PLoS ONE.
Terhorst J, Kamm JA, Song YS (2017) Robust and scalable inference of population history
from hundreds of unphased whole genomes. Nature Genetics.
Thomas GWC, Hahn MW, Hahn Y (2017) The effects of increasing the number of taxa on
inferences of molecular convergence. Genome Biology and Evolution.
Tift MS, Ponganis PJ (2019) Time domains of hypoxia adaptation-elephant seals stand out
among divers. Frontiers in Physiology.
Valenzuela-Toro AM, Gutstein CS, Suárez ME, Otero R, Pyenson ND (2015) Elephant
seal (Mirounga sp.) from the Pleistocene of the Antofagasta Region, northern Chile.
Journal of Vertebrate Paleontology.
van der Valk T, de Manuel M, Marques-Bonet T, Guschanski K (2019) Estimates of
genetic load in small populations suggest extensive purging of deleterious alleles.
bioRxiv.
Vallender EJ, Lahn BT (2004) Positive selection on the human genome. Human Molecular
Genetics.
Valtonen M, Palo JU, Ruokonen M, Kunnasranta M, Nyman T (2012) Spatial and
temporal variation in genetic diversity of an endangered freshwater seal.
Conservation Genetics.
Varela LM, Ortega-Gomez A, Lopez S et al. (2013) The effects of dietary fatty acids on
the postprandial triglyceride-rich lipoprotein/apoB48 receptor axis in human
monocyte/macrophage cells. Journal of Nutritional Biochemistry.
Vitti JJ, Grossman SR, Sabeti PC (2013) Detecting natural selection in genomic data.
Annual Review of Genetics.
Volckmar AL, Song JY, Jarick I et al. (2015) Fine mapping of a GWAS-derived obesity
candidate region on chromosome 16p11.2. PLoS ONE.
Welch JJ, Bininda-Emonds ORP, Bromham L (2008) Correlates of substitution rate
variation in mammalian protein-coding sequences. BMC Evolutionary Biology.
Westbury M V., Hartmann S, Barlow A et al. (2018) Extended and continuous decline in
effective population size results in low genomic diversity in the world’s rarest hyena
species, the brown Hyena. Molecular Biology and Evolution.
Westbury M V., Petersen B, Garde E, Heide-Jørgensen MP, Lorenzen ED (2019) Narwhal
Genome Reveals Long-Term Low Genetic Diversity despite Current Large
Abundance Size. iScience.
Whitlock MC (2000) Fixation of new alleles and the extinction of small populations:
Drift load, beneficial alleles, and sexual selection. Evolution.

Whitlock MC, Griswold CK, Peters AD (2003) Compensating for the meltdown: {T}he
critical effective size of a population with deleterious and compensatory mutations.
Annales Zoologici Fennici.
Wigby S, Chapman T (2004) Sperm competition. Current biology : CB.
Woolfit M (2009) Effective population size and the rate and pattern of nucleotide
substitutions. Biology Letters.
Woolfit M, Bromham L (2005) Population size and molecular evolution on islands.
Proceedings of the Royal Society B: Biological Sciences.
Wright S (1931) Evolution in mendelian populations. Bulletin of Mathematical Biology.
Yang F, Eckardt S, Leu NA, McLaughlin KJ, Wang PJ (2008) Mouse TEX15 is essential
for DNA double-strand break repair and chromosomal synapsis during male meiosis.
Journal of Cell Biology.
Yang Z, Nielsen R (1998) Synonymous and nonsynonymous rate variation in nuclear genes
of mammals. Journal of Molecular Evolution.
Yoder AD, Poelstra JW, Tiley GP, Williams RC, Kumar S (2018) Neutral theory is the
foundation of conservation genetics. Molecular Biology and Evolution.
Yudin NS, Larkin DM, Ignatieva E V. (2017) A compendium and functional
characterization of mammalian genes involved in adaptation to Arctic or Antarctic
environments. BMC Genetics.
Zhang J (2000) Rates of conservative and radical nonsynonymous nucleotide substitutions
in mammalian nuclear genes. Journal of Molecular Evolution.
Zhao ZM, Campbell MC, Li N et al. (2017) Detection of regional variation in selection
intensity within protein-coding genes using DNA sequence polymorphism and
divergence. Molecular Biology and Evolution.
Zhou X, Sun D, Guang X et al. (2018) Molecular footprints of aquatic adaptation including
bone mass changes in cetaceans. Genome Biology and Evolution.
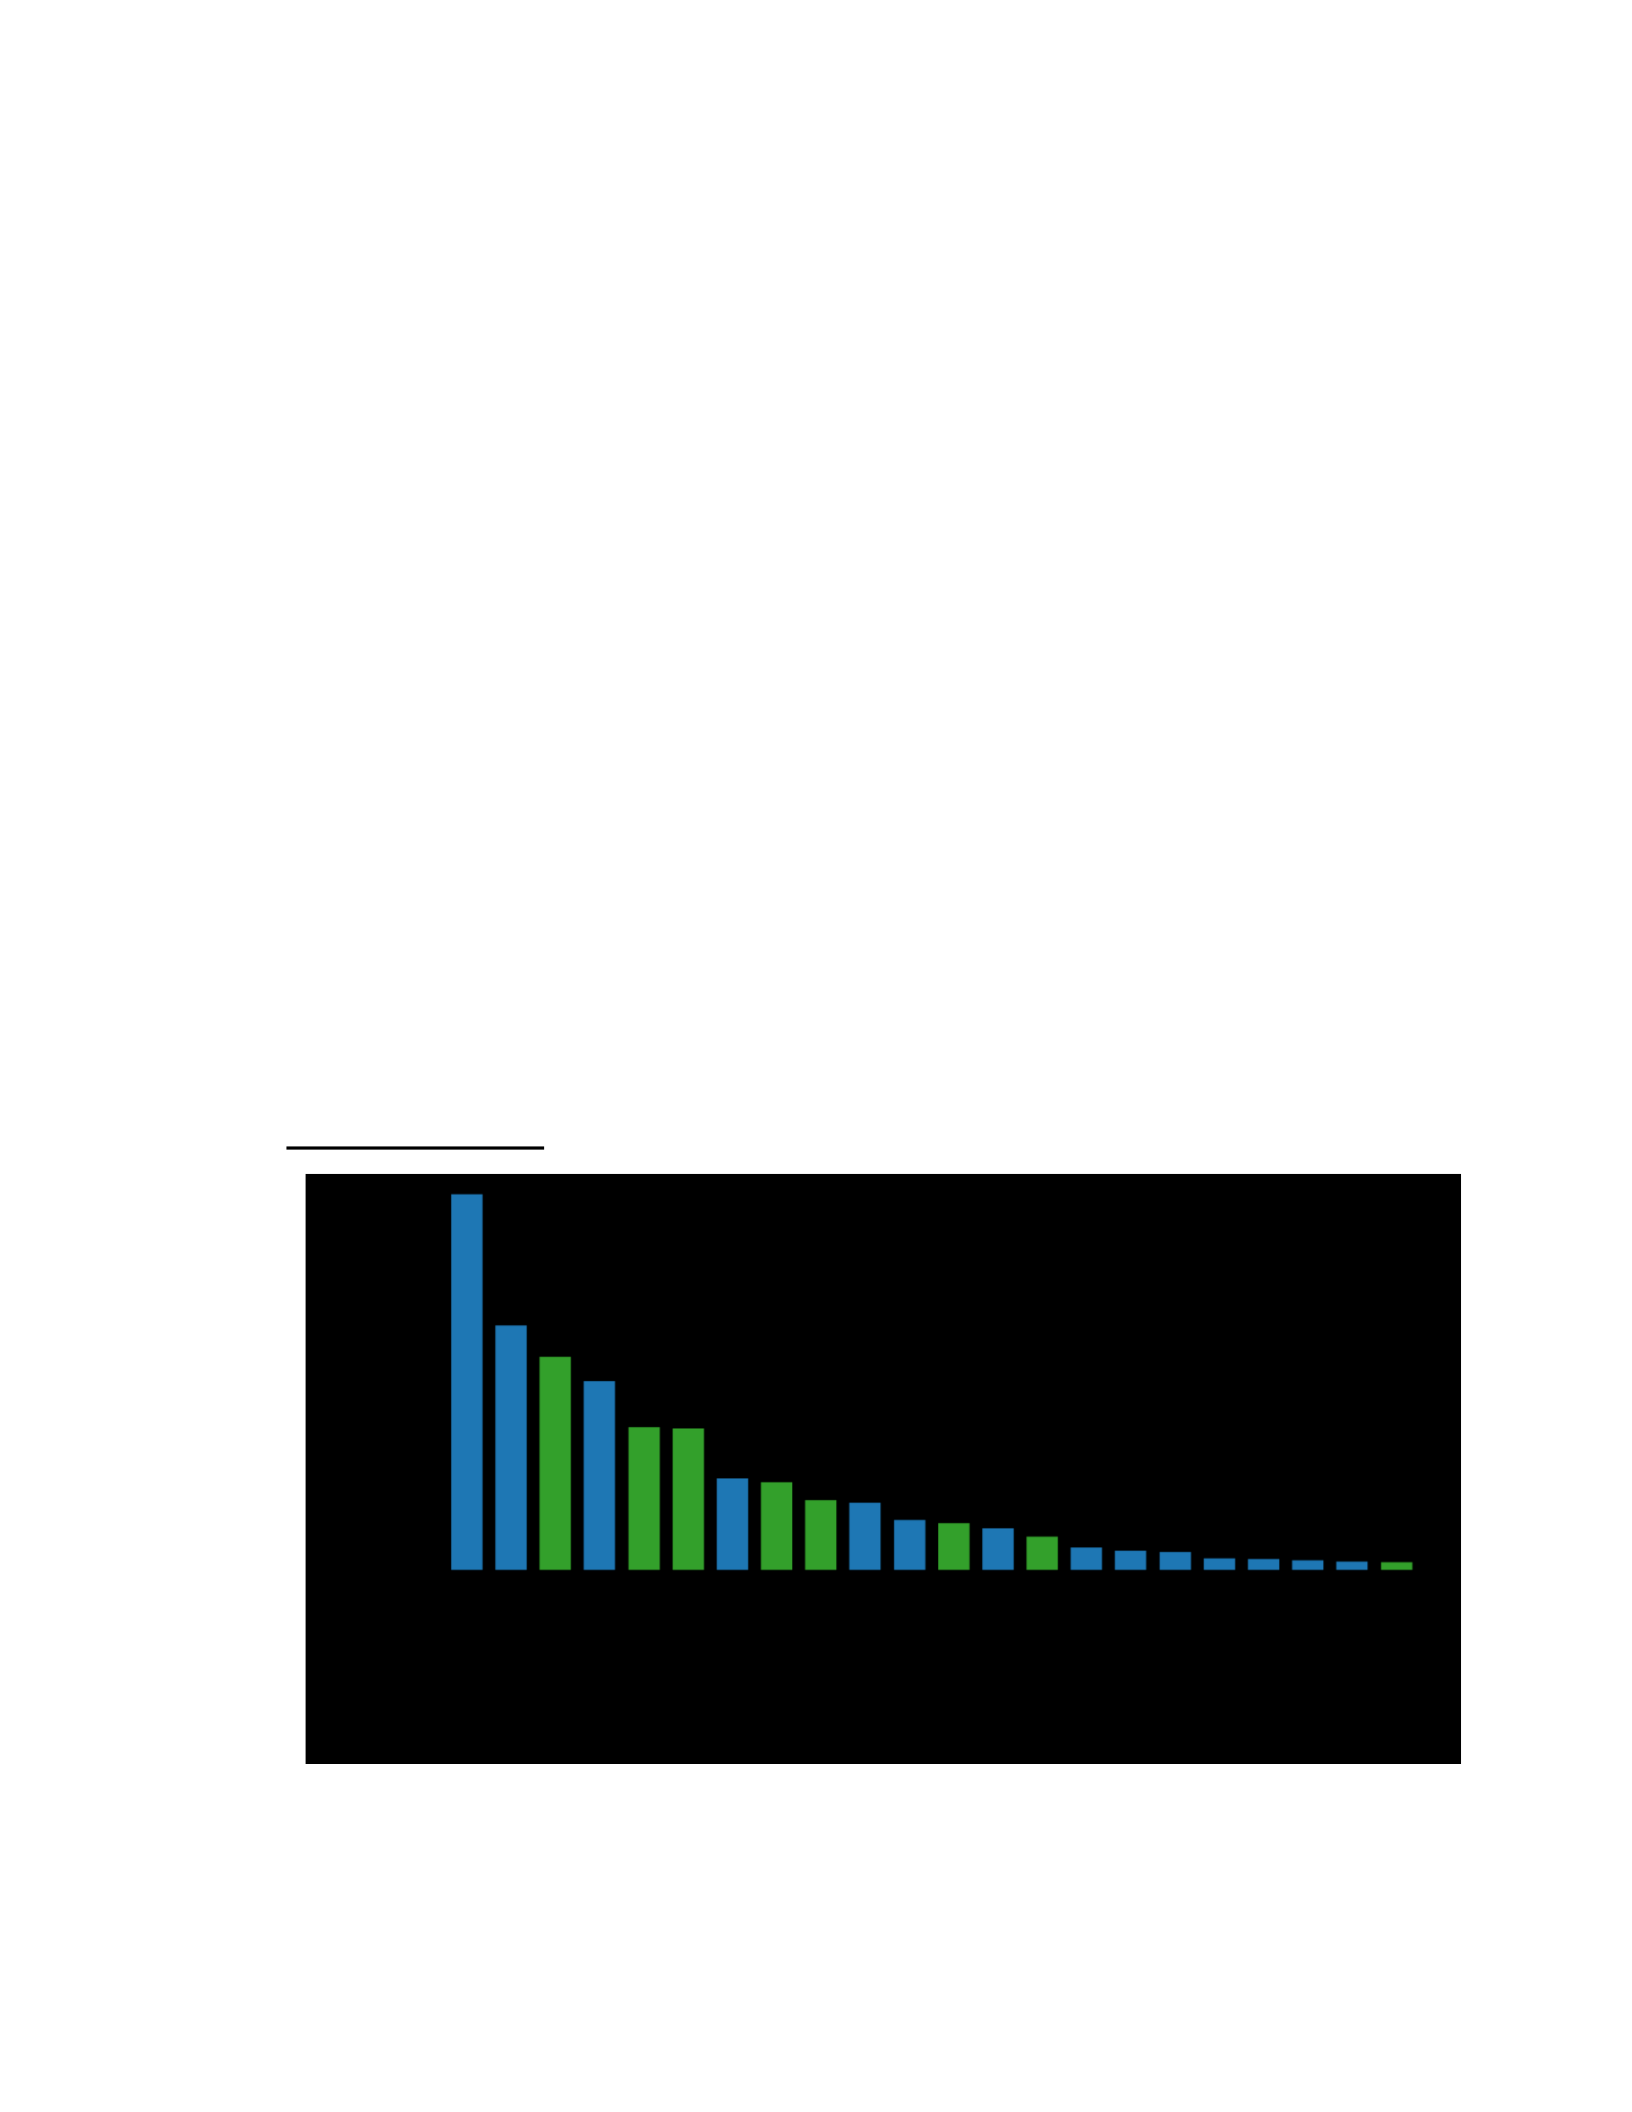
Figures and Tables
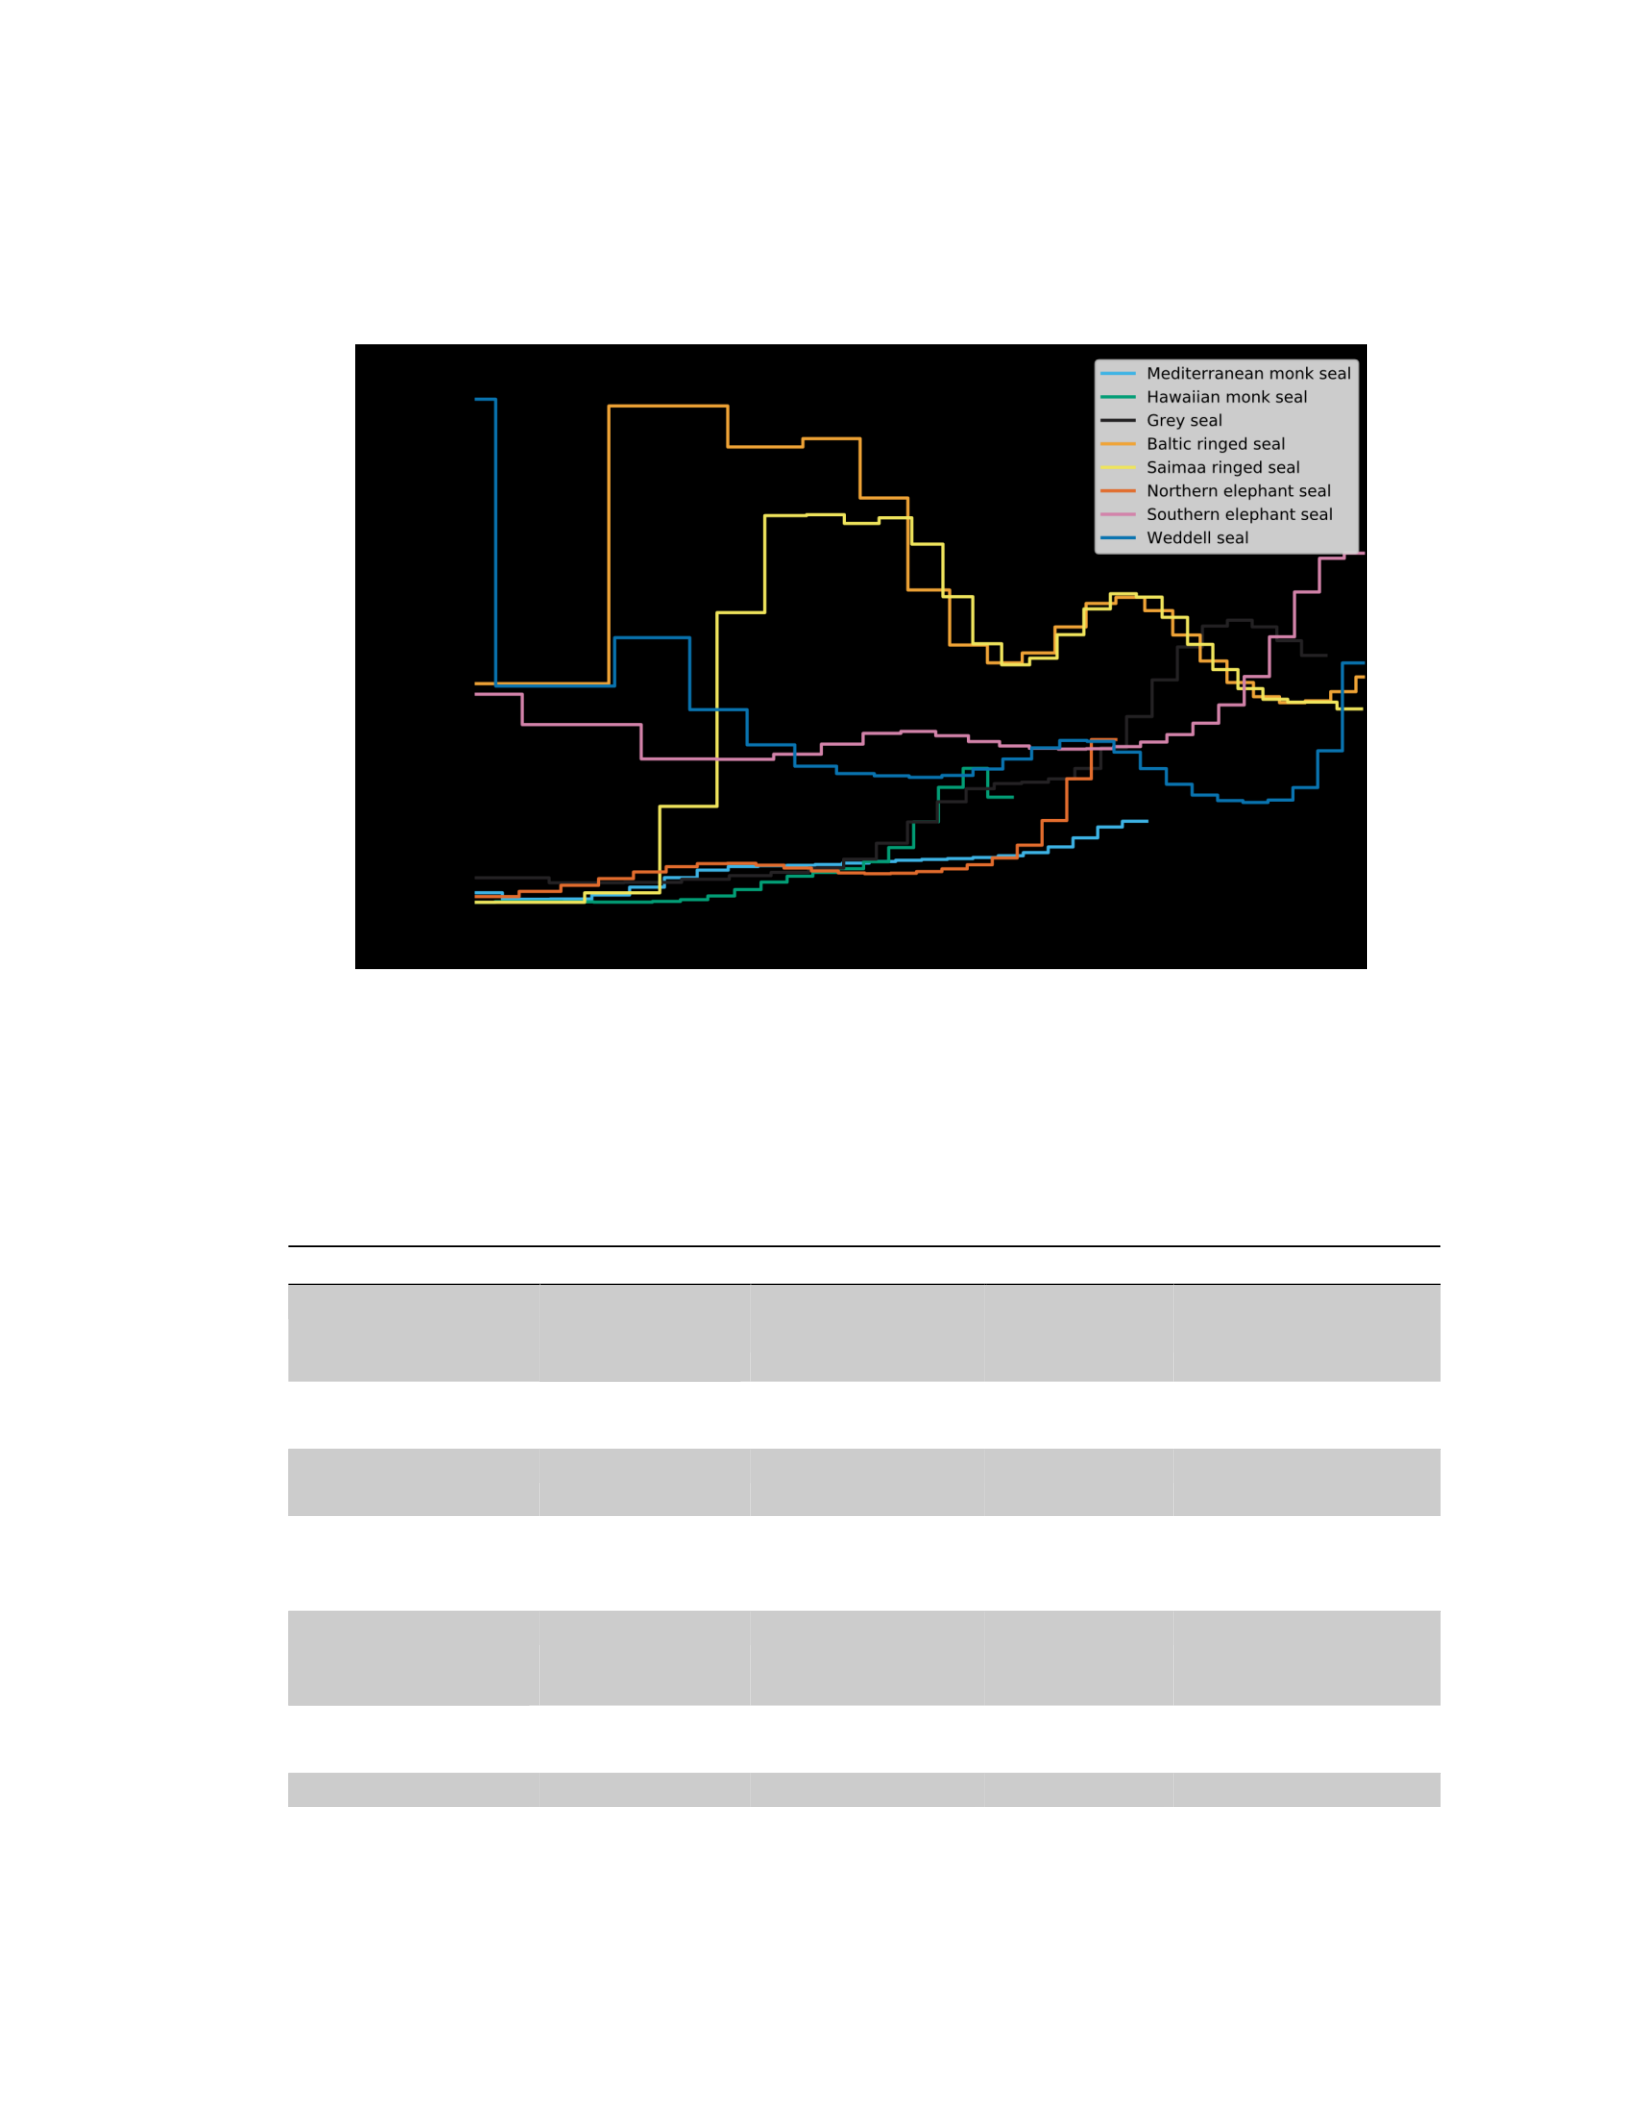
Figure 1. Genome-wide heterozygosity (bp-1) for 25 species of seals (green) and other
mammal species (blue). Data and citations can be found in Table S3.
Figure 2. Reconstructed historical population sizes with MSMC from a single diploid
genome of each species or subspecies.
Table 1. Taxa in this study, with respective heterozygosity and population size estimates.
Species
Census
population size
(Nc)
Genome-wide
heterozygosity
Harmonic
Mean of Ne
Harmonic Mean of Ne
(last 100 ka)
Hawaiian monk
seal (HMS)
632
0.000099
7,109
2,098
Mediterranean
monk seal (MMS)
400
0.000396
13,777
4,267
Northern
elephant seal
(NES)
110,000
0.000552
14,562
5,944
Southern
elephant seal
(SES)
325,000
0.001664
70,474
56,232
Weddell seal
(WED)
300,000
0.001676
43,748
82,621
Grey seal (GRS)
316,000
0.000821
46,286
7,440
Baltic ringed seal
(BRS)
11,500
0.002500
70,497
64,354

Saimaa ringed
seal (SRS)
150
0.001035
52,701
3,508
Table 2. R’xy values in which the column is species X and the row is species Y. R’xy values
> 1.000 show elevated rates of amino-acid mutation accumulation in species X, and R’xy
values < l.000 show lower rates of amino-acid mutation accumulation in species X.
HMS
MMS
NES
SES
WED
GRS
BRS
SRS
HMS
-
MMS
1.045
-
NES
0.925
0.888
-
SES
0.941
0.903
1.068
-
WED
0.971
0.933
1.047
1.027
-
GRS
1.017
NS
1.072
1.059
1.035
-
BRS
NS
0.980
1.060
1.047
1.023
0.958
-
SRS
NS
0.979
1.059
1.045
1.022
0.953
NS
-
Table 3. R’xy values with radical amino acid changes as the functional class and
conservative amino acid changes as the normalizing class. The column is species X and the
row is species Y. R’xy values > 1.000 show elevated rates of amino acid mutation
accumulation in species X, and R’xy values < l.000 show lower rates of amino acid mutation
accumulation in species X.
HMS
MMS
NES
SES
WED
GRS
BRS
SRS
HMS
-
MMS
NS
-
NES
1.080
1.096
-
SES
1.099
1.115
NS
-
WED
NS
NS
0.920
0.902
-
GRS
1.087
1.089
NS
NS
1.082
-
BRS
1.117
1.121
1.070
1.055
1.113
1.088
-
SRS
1.100
1.104
NS
NS
1.096
NS
NS
-
Supplemental Material
I. Genome coverage statistics
Table S1. Sample ID and genome coverage statistics for each sample examined in this
study.
Species
Sample ID
Median depth
SD depth
Hawaiian monk seal1
PJ22
22X
8.2
Hawaiian monk seal1
YE37
21X
8.0
Mediterranean monk seal1
114
57X
17.6

Mediterranean monk seal1
195
20X
8.2
Southern elephant seal1
612
37X
13.6
Northern elephant seal2
NES
81X
23.3
Weddell seal3
WED
65X
21.1
Baltic ringed seal4
PHB03
16X
8.5
Saimaa ringed seal4
PHS1983
16X
9.0
Grey seal4
HG01
21X
15.0
1This study; 2https://www.dnazoo.org/assemblies/Mirounga_angustirostris;
3https://www.ncbi.nlm.nih.gov/assembly/GCF_000349705.1/; 4Savriama et al. 2018
II. Annotating probable sex chromosomes
For many of our analyses, we wanted to include only autosomes or only haploid
Xchromosomes. Because our reference genomes were not chromosome-level assemblies,
we needed to create a list of scaffolds from our assembly that likely belonged on the seal
X and Y chromosomes. As an X chromosome reference, we used the X chromosome from
the dog (Canis familiaris) reference genome (CanFam3.1), which is a high-quality
chromosome-level assembly. We used the Genbank SRY reference sequence for the
Hawaiian monk seal (AY424654.1) as a Y-chromosome reference. Using BLAST, we were
able to find scaffolds in the reference genomes that are likely compromise the sex
chromosomes.
In mammals, the Y chromosome is repetitive and mostly lacking protein coding
sequence, making it difficult to assemble in most genome assembly pipelines. We made the
reasonable assumption that no Y chromosome scaffolds were above 1 Mb, and therefore
were not at risk in being included in our demographic analyses. Still, we were able to
identify that the SRY gene, which is the hallmark Y chromosome gene in mammals, is
located on scaffold NW_018730440.1 in the Hawaiian monk seal reference genome. The

Steller sea lion reference genome is assembled from a female seal and therefore does not
contain Y chromosome sequences.
The X chromosome, on the other hand, is a large chromosome in most mammal
species, including many protein-coding sequences. We were able to identify many scaffolds
in our assemblies that likely correspond to the X chromosome and were therefore excluded
in our MSMC and mutation accumulation analyses. The following scaffolds from the
Hawaiian monk seal reference genome mapped to the dog X chromosome:
NW_018726532.1, NW_018726533.1, NW_018726534.1, NW_018726535.1,
NW_018726536.1, NW_018726537.1, NW_018726538.1, NW_018726539.1,
NW_018726540.1, NW_018726541.1, NW_018726542.1, NW_018726543.1,
NW_018726544.1, NW_018726545.1, NW_018726546.1, NW_018726547.1,
NW_018726548.1, NW_018726549.1, NW_018726550.1, NW_018726551.1,
NW_018726552.1, NW_018726553.1, NW_018727768.1, NW_018729375.1,
NW_018729545.1, NW_018729664.1, NW_018729739.1, NW_018729752.1,
NW_018729761.1, NW_018729802.1, NW_018729916.1, NW_018730077.1,
NW_018730097.1, and NW_018731547.1.
For the Steller sea lion reference genome, the following scaffolds mapped to the dog X
chromosome:
NW_020998626.1, NW_020998672.1, NW_020998679.1, NW_020998694.1,
NW_020998717.1, NW_020998719.1, NW_020998726.1, NW_020998728.1,
NW_020998745.1, NW_020998747.1, NW_020998749.1, NW_020998756.1,
NW_020998762.1, NW_020998765.1, NW_020998777.1, NW_020998785.1,
NW_020998787.1, NW_020998794.1, NW_020998795.1, NW_020998797.1,
NW_020998799.1, NW_020998802.1, NW_020998806.1, NW_020998807.1,
NW_020998811.1, NW_020998814.1, NW_020998821.1, NW_020998824.1,
NW_020998825.1, NW_020998827.1, NW_020998829.1, NW_020998834.1,
NW_020998835.1, NW_020998838.1, NW_020998843.1, NW_020998851.1,
NW_020998853.1, NW_020998858.1, and NW_020998859.1
III. MSMC supplement
A. Scaffolds, mutation rate and generation time

To run MSMC, only scaffolds from the Hawaiian monk seal reference genome that
were larger than 1Mb were used. Scaffolds that mapped to the dog X chromosome were
excluded. In addition, one scaffold (NW_018730126.1) appeared to be monomorphic in
many samples, which could indicate that it is a poorly assembled scaffold or that it is part
of the X chromosome in seals. In either case, this scaffold was removed from the analysis.
In total, 128 scaffolds over 1Mb were used for the MSMC analysis.
MSMC analyses output results that need to be scaled by generation time and
mutation rate in order to be interpretable as Ne and years before present. As others have
noted (Nadachowska-Brzyska et al. 2016, Mather et al. 2020), errors in these parameters
change the scale of the MSMC plots but do not qualitatively change the shape of the plots.
For non-model species, knowing either of these parameters with certainty is currently
impossible. However, a recent study estimated the mutation rate in seals from the neutral
substitution rate, obtaining a per generation mutation rate estimate of ~7 x 10⁻⁹ bp-1 (Peart
et al. 2020). We used this as the mutation rate for this study.
Estimates of generation times differ substantially between species and between
studies of the same species. We used generation times from previously published molecular
work to make our study comparable to previous genetic studies. Errors in the generation
time estimates, as well as inherent biological issues such as overlapping generations and
changes to generation time during the evolution of a lineage, undoubtedly introduce error
into our timing estimates. Table SXX shows the generation times used for each species.
Table S2. Generation-time estimate and reference for each species.
Species
Generation time Reference
Hawaiian monk seal
13 years Schultz et al. 2010
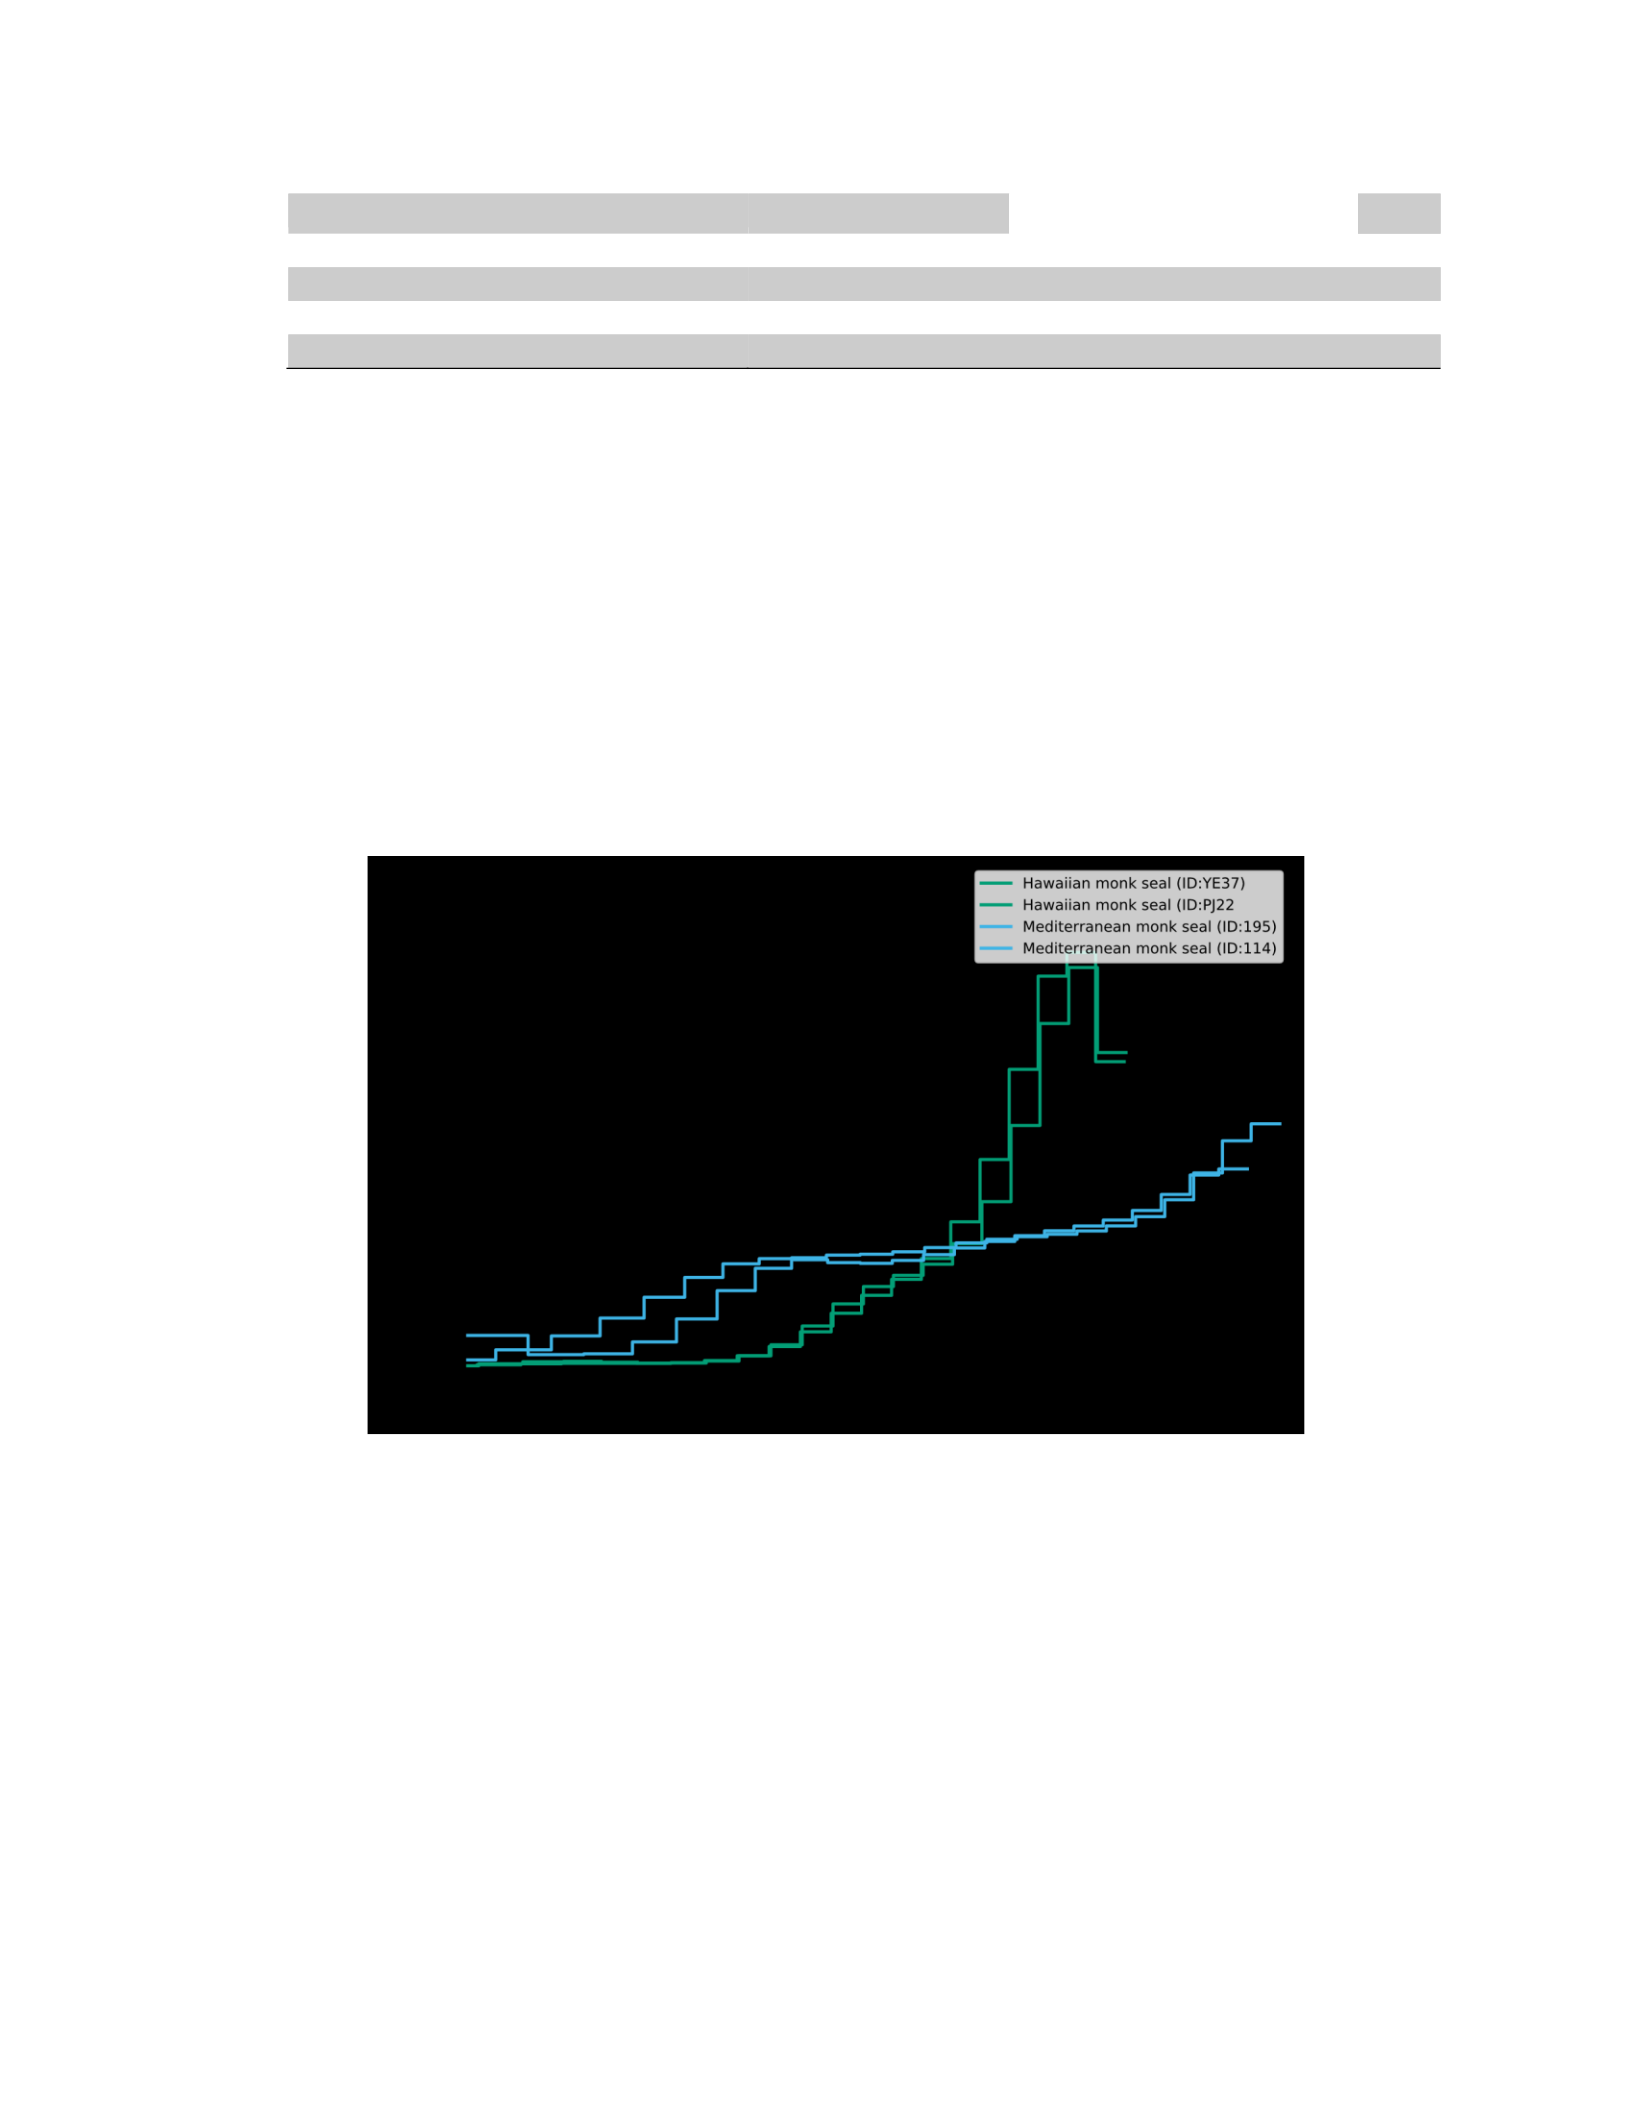
Mediterranean monk seal
11 years
Karamanlidis & Dendrinos 2015
Northern/Southern elephant seal
8 years Slade et al. 1998
Weddell seal
9 years Curtis et al. 2009
Baltic/Saimaa ringed seal
11 years Palo et al. 2001
Grey seal
14 years Kilmova et al. 2014
B. In depth plots
A number of our species share similar habitats, life histories, or IUCN status. Below
are various plots that show the same MSMC demographic reconstructions as in Main
Figure 2, but here grouped into subsets (e.g. clade, climate, threat status) and adjusted to
show time periods and scales of interest.
Figure S1a. Reconstructed historical population sizes with MSMC from the genomes of
two Hawaiian monk seals (ID: YE37 and PJ22) and two Mediterranean monk seals (ID:
114 and 195). The similar trajectories for samples of the same species show that sample
choice does not appear to introduce bias into our demographic analyses.

72
Figure S1b. The same reconstructed demographic histories as in Figure S1a, but focused
on the interval between 10,000 and 100,000 years ago (i.e. the last glacial period).
Figure S2a. Reconstructed historical population sizes with MSMC from the genomes of
tropical and temperate water species (Hawaiian monk seal, Mediterranean monk seal,
northern elephant seal, and grey seal).
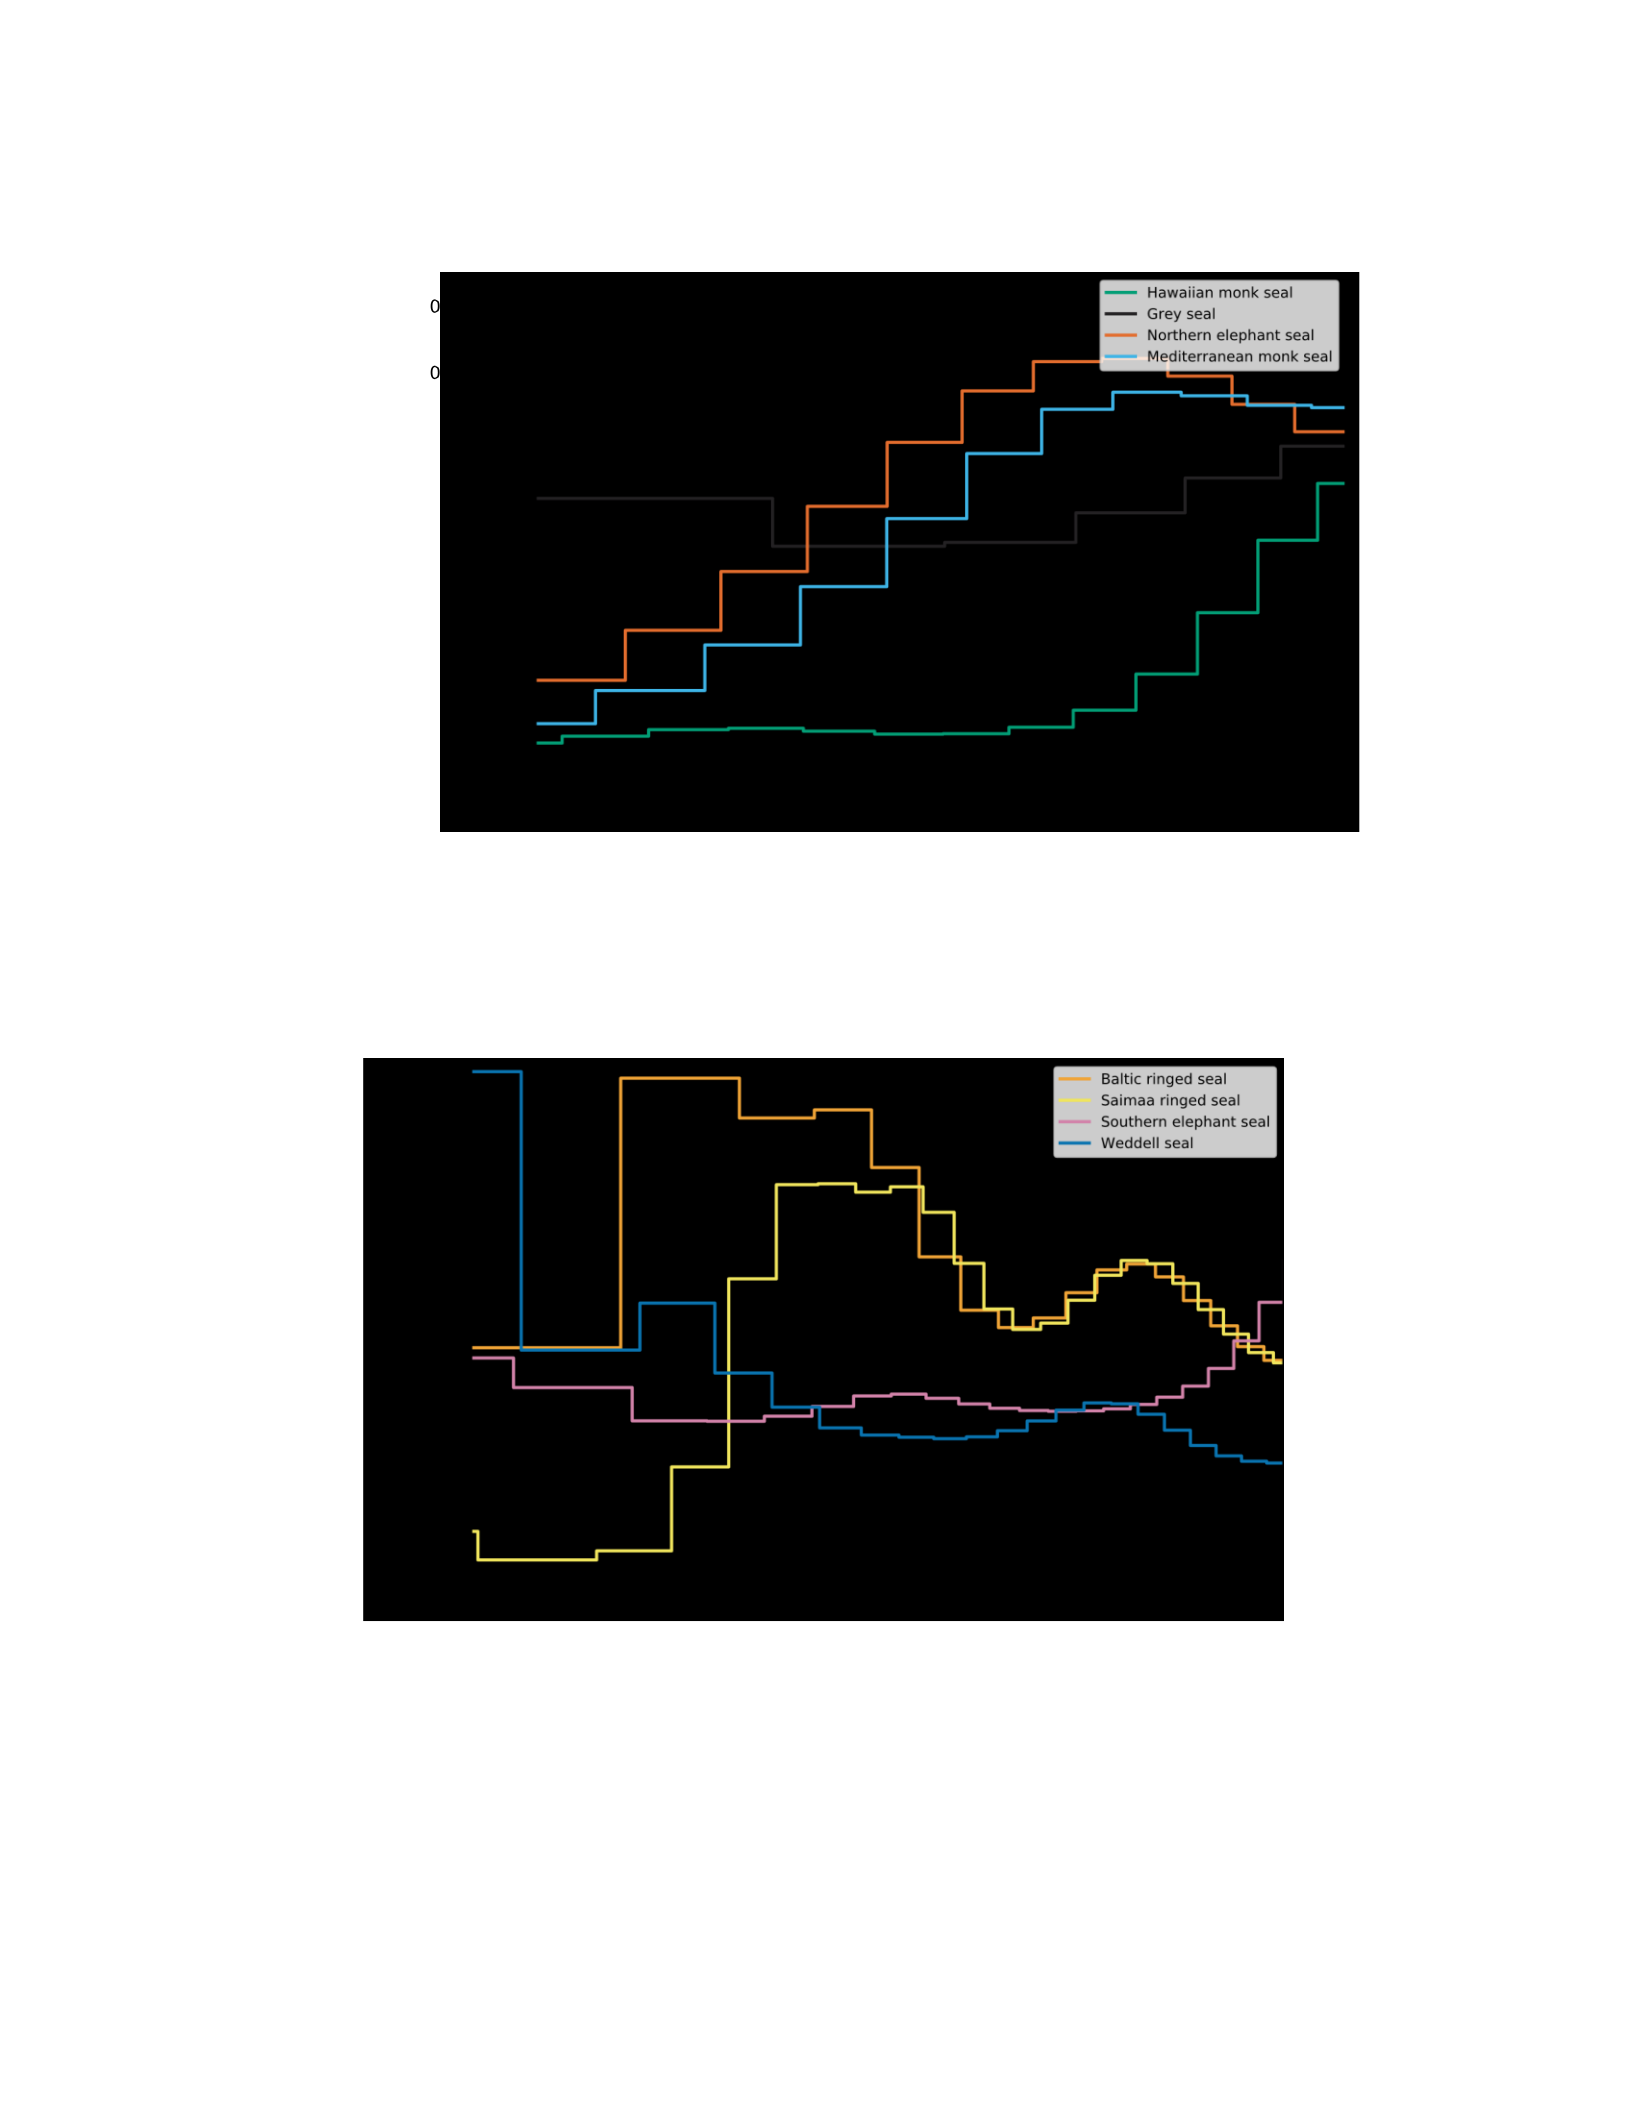
73
Figure S2b. The same reconstructed demographic histories as in Figure S2a, but focused
on the interval between 10,000 and 100,000 years ago (i.e. the last glacial period).
Figure S3a. Reconstructed historical population sizes with MSMC from the genomes of
polar water species (Weddell seal, southern elephant seal, ringed seals).
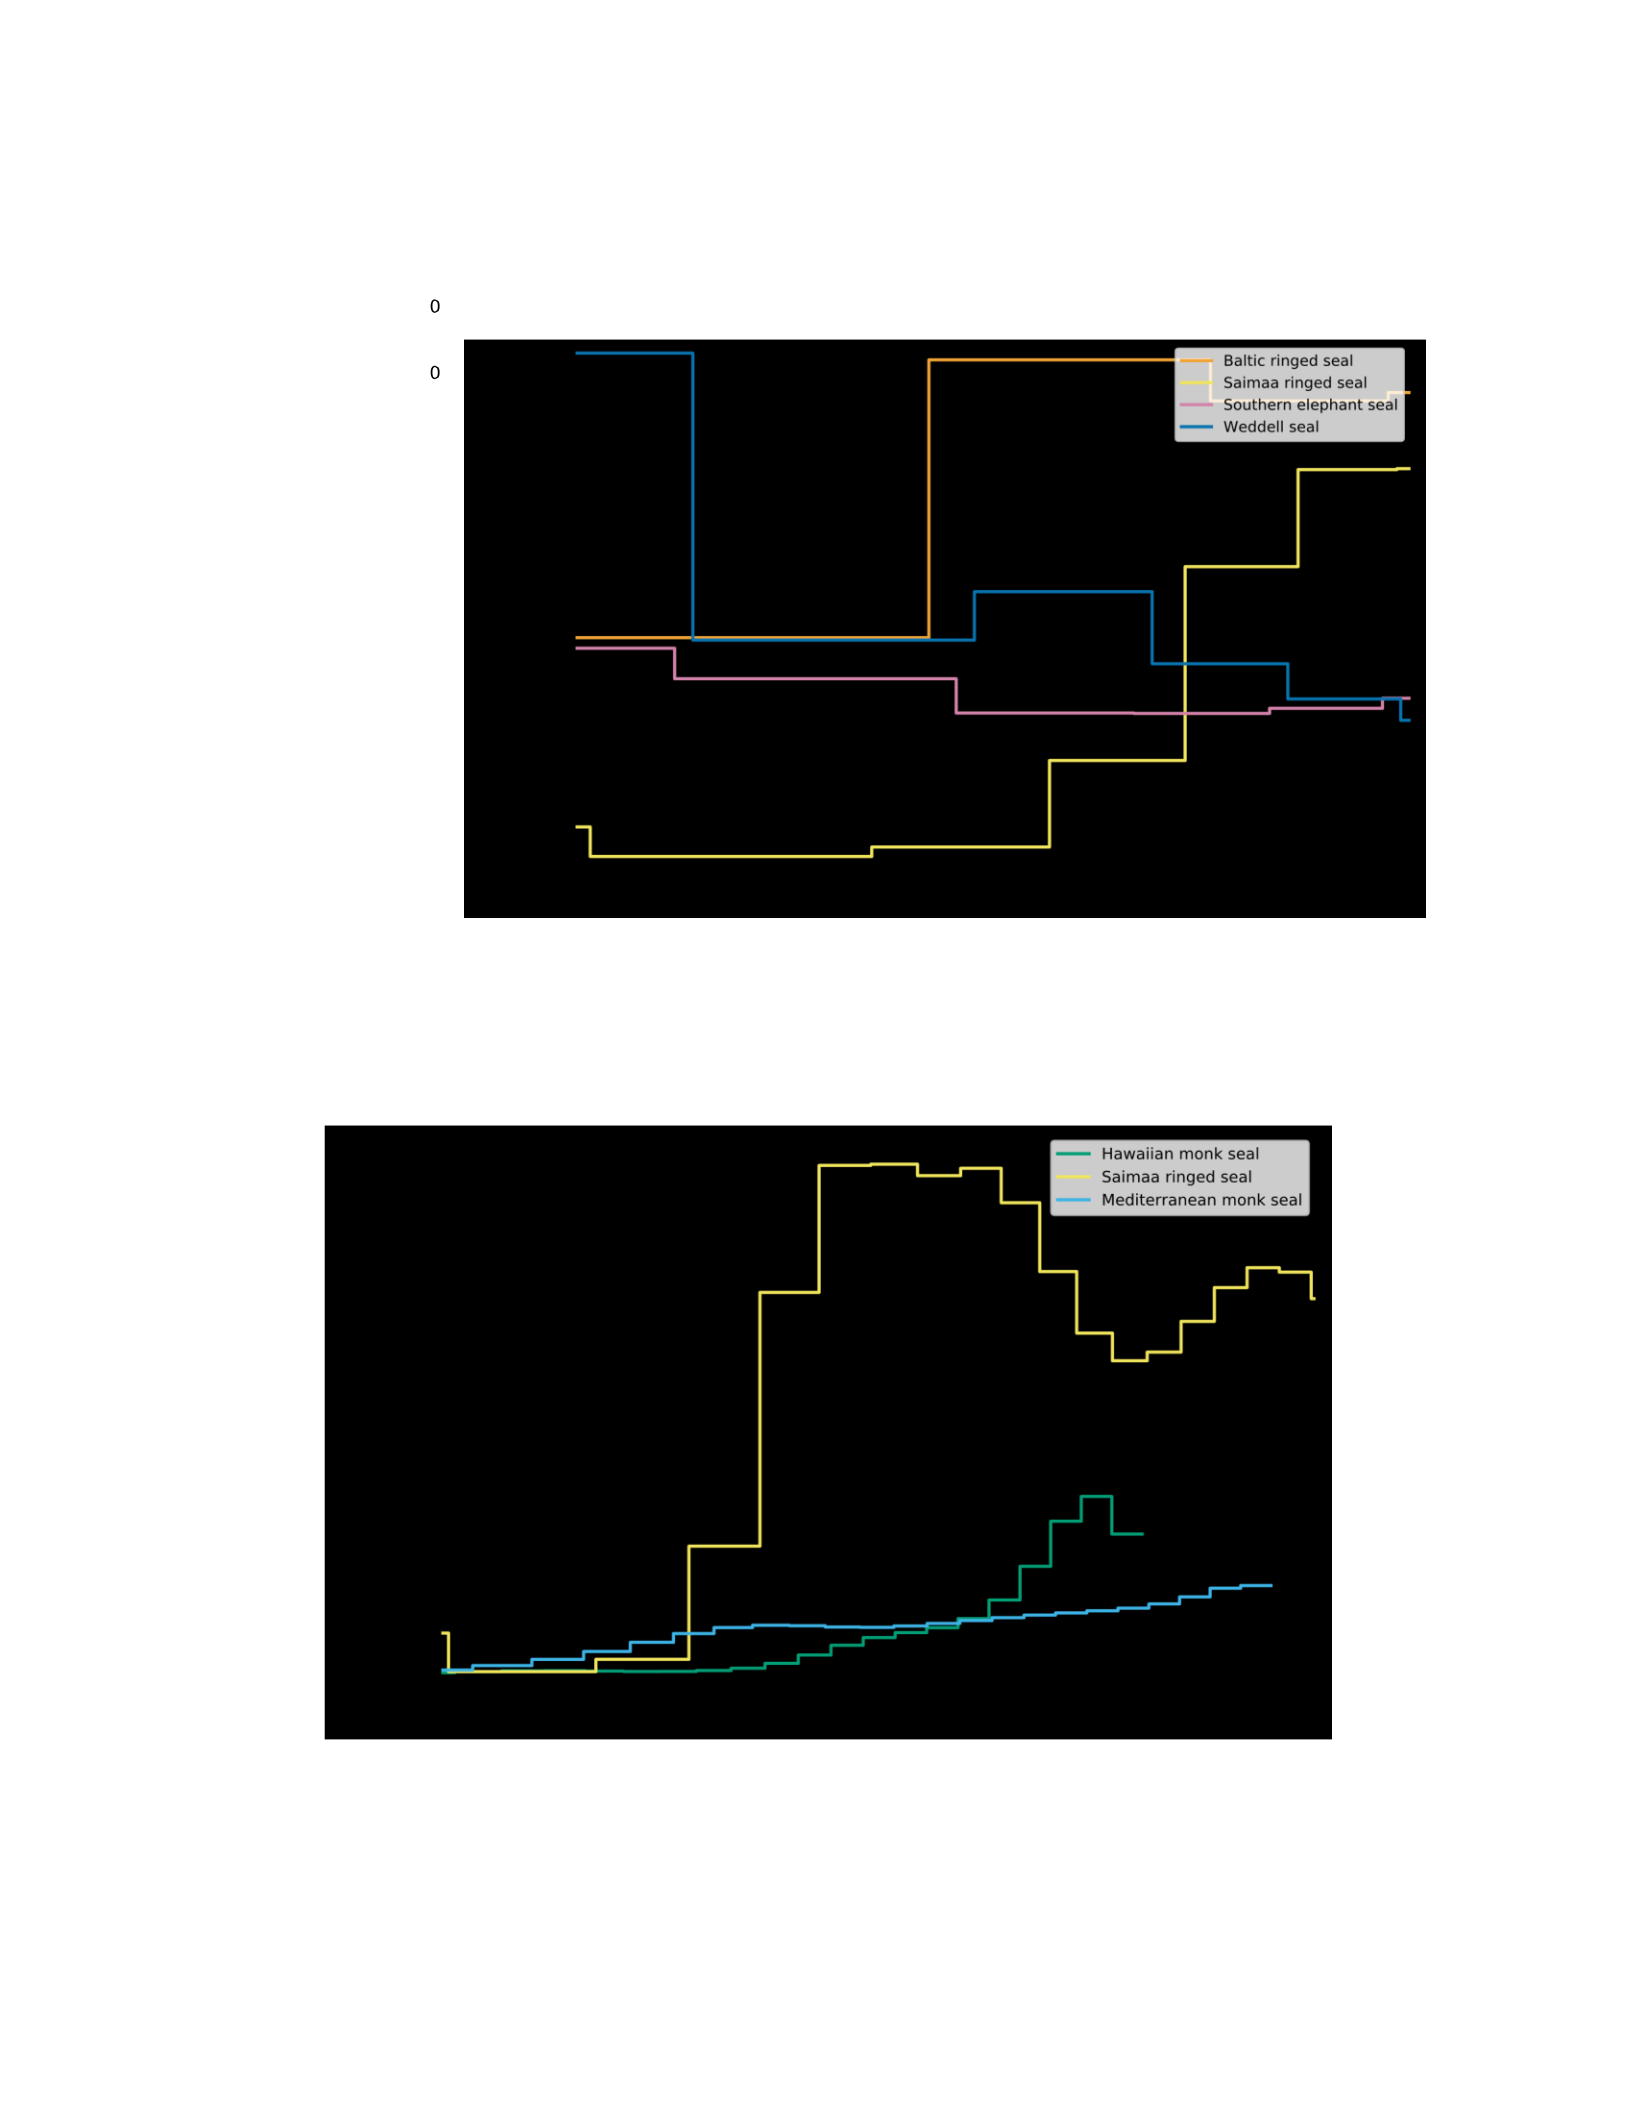
74
Figure S3b. The same reconstructed demographic histories as in Figure S3a, but focused
on the interval between 10,000 and 100,000 years ago (i.e. the last glacial period).
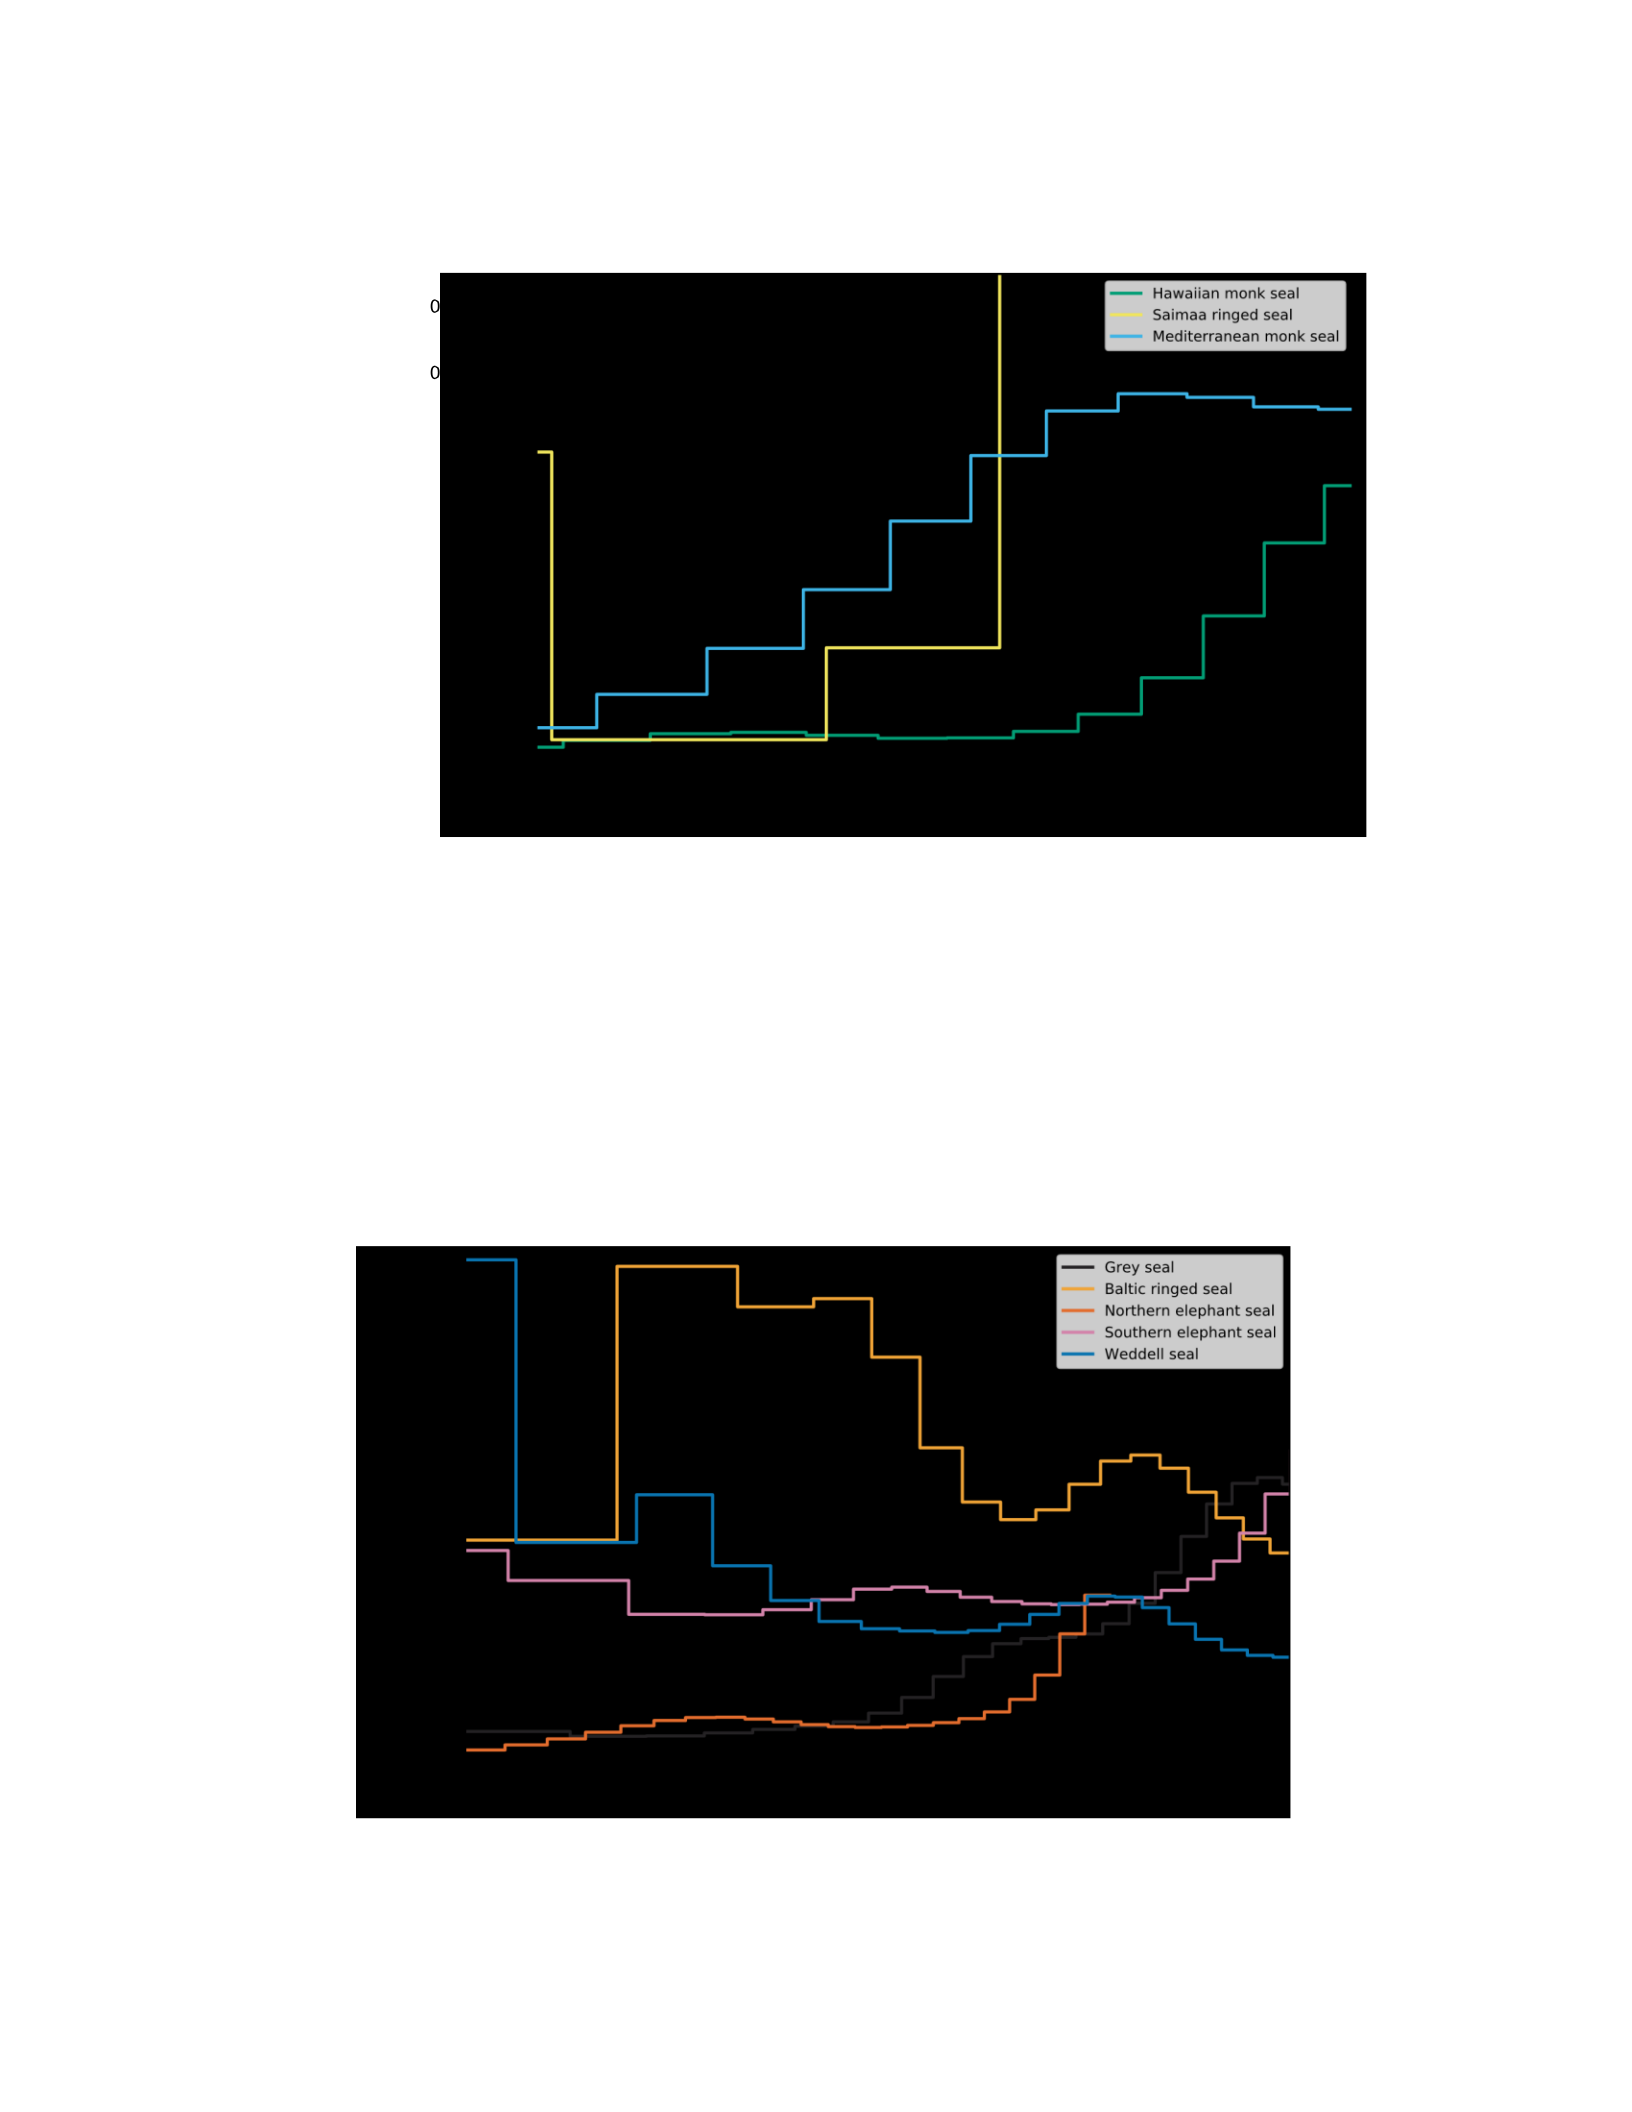
75
Figure S4a. Reconstructed historical population sizes with MSMC from the genomes of
species listed as Endangered by the IUCN (Hawaiian monk seal, Mediterranean monk
seal, Saimaa ringed seal).
Figure S4b. The same reconstructed demographic histories as in Figure S4a, but focused
on the interval between 10,000 and 100,000 years ago (i.e. the last glacial period).

76
Figure S5a. Reconstructed historical population sizes with MSMC from the
genomes of species listed as Least Concern by the IUCN (grey seal, Baltic ringed seal,
northern elephant seal, southern elephant seal, Weddell seal).
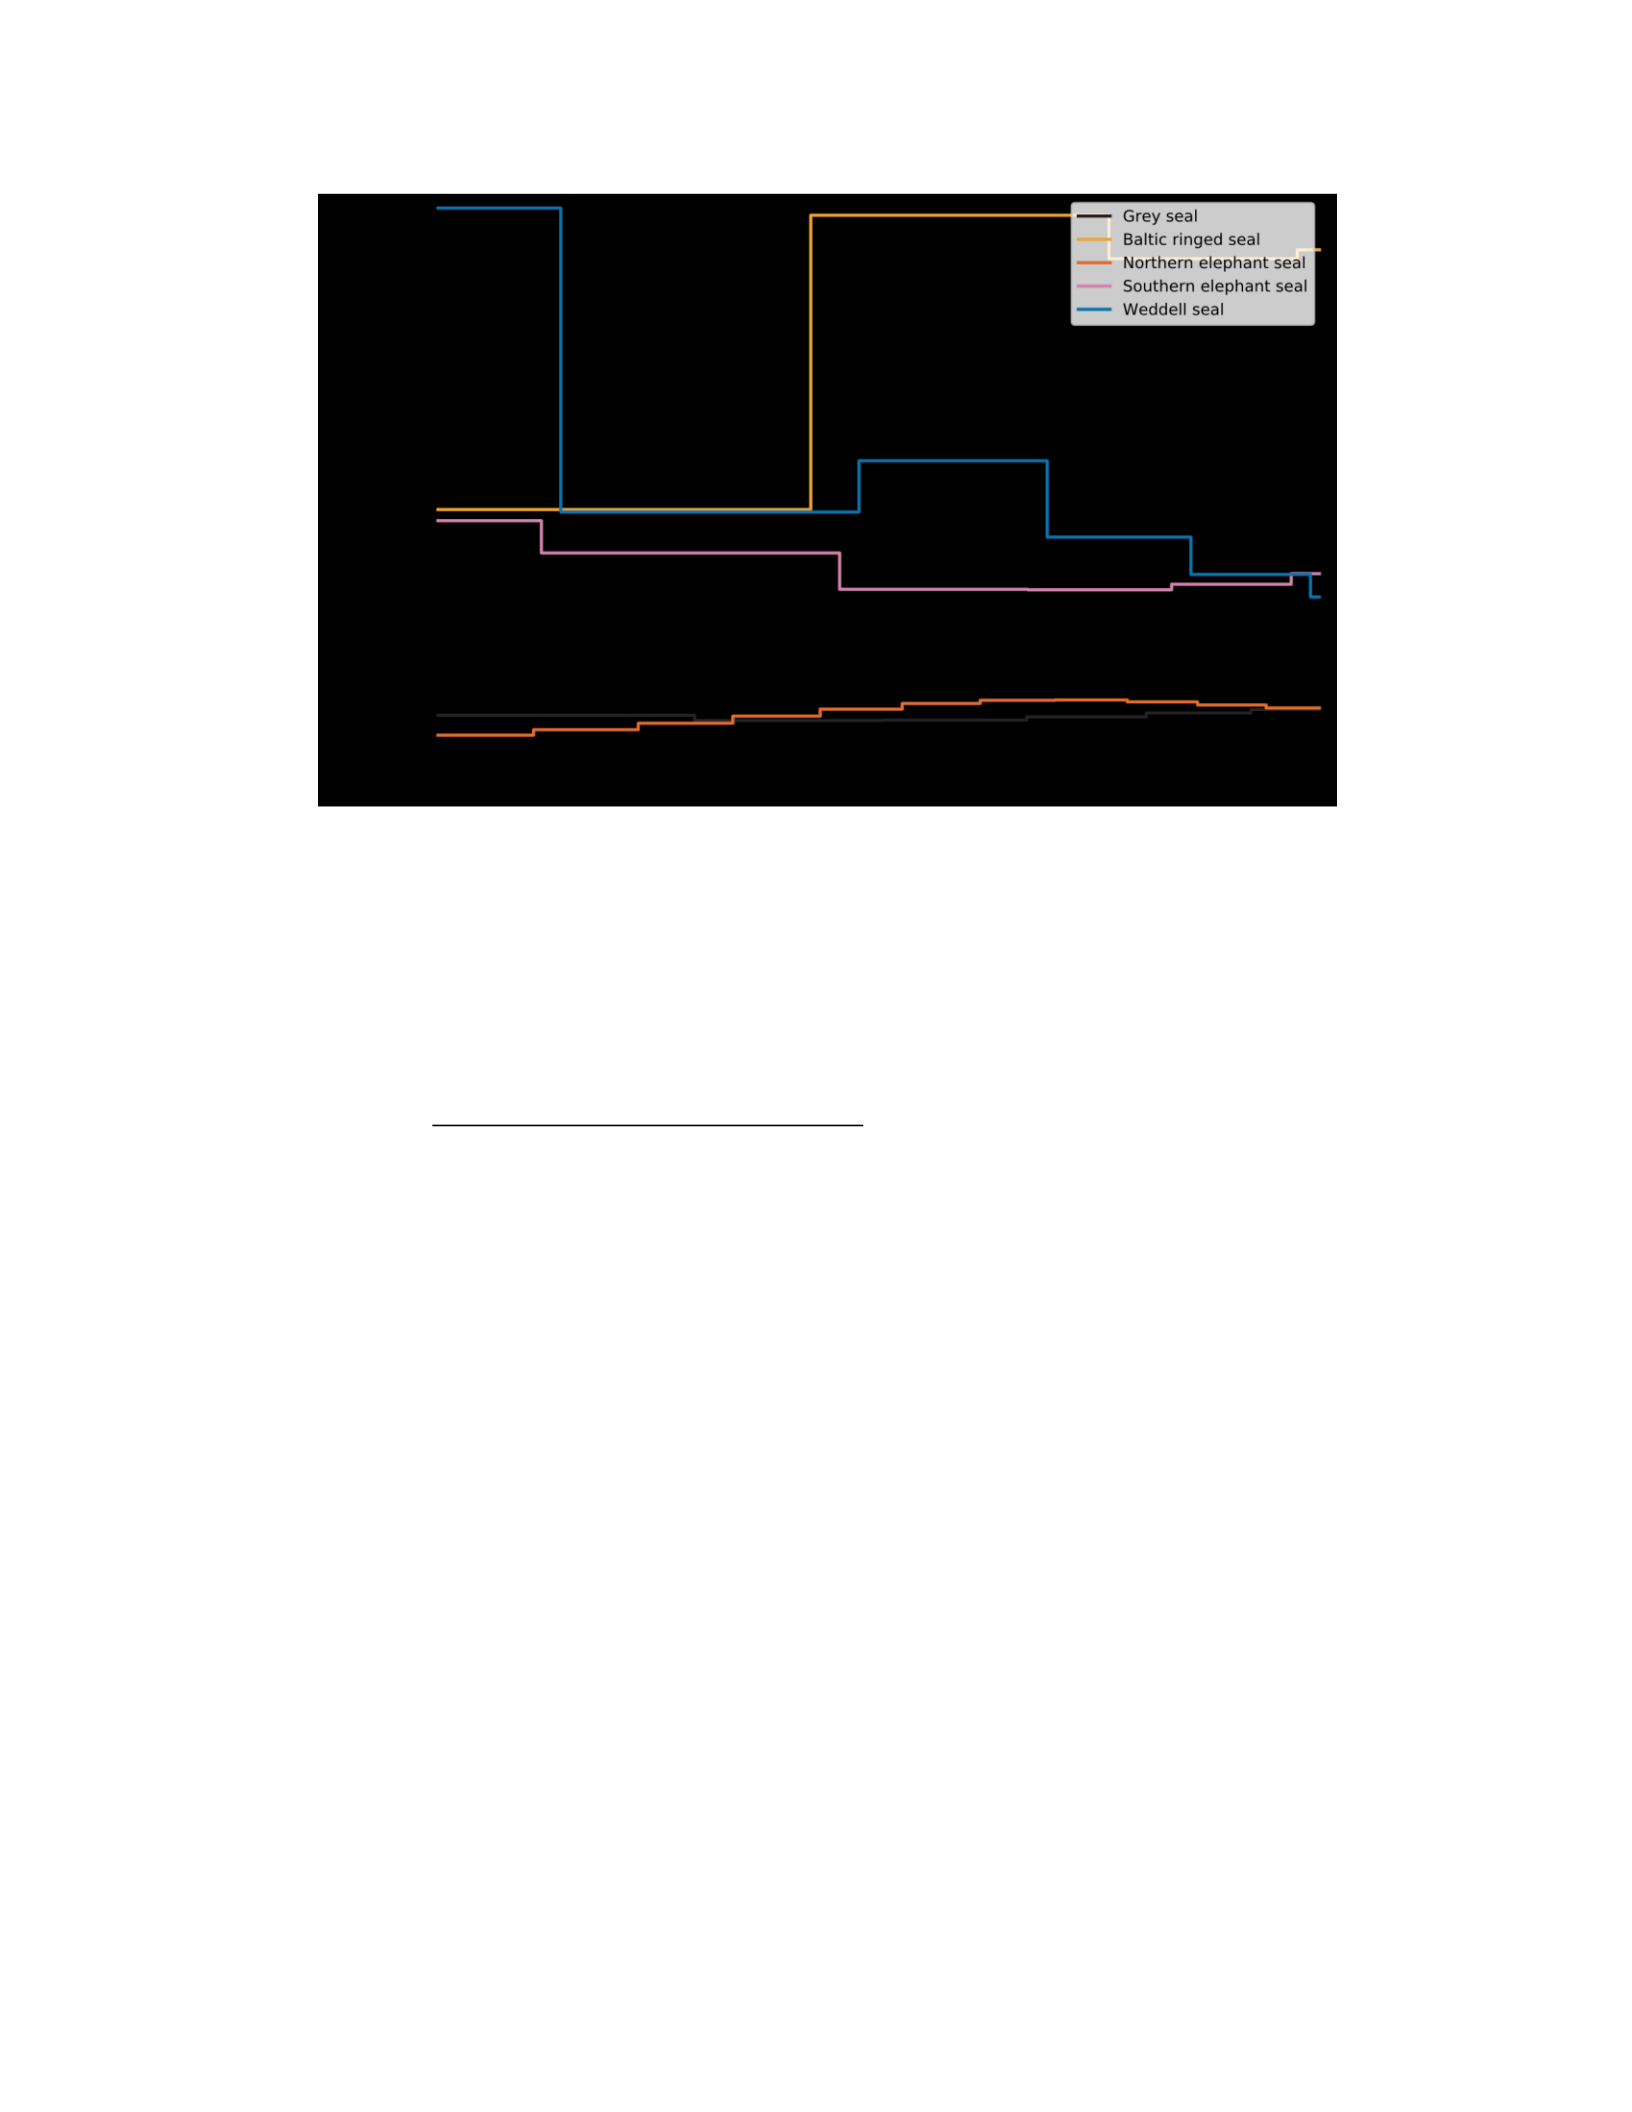
77
Figure S5b. The same reconstructed demographic histories as in Figure S5a, but focused
on the interval between 10,000 and 100,000 years ago (i.e. the last glacial period).
IV. hPSMC and divergence estimates
A. Detailed methods
From its creation, the pairwise sequentially Markovian coalescent (PSMC) model
has been shown to recover divergence times when applied to pseudo-diploid chromosomes
created by combining haploid chromosomes from two populations or species. With
unphased genomes, Li and Durbin (2011) showed this pseudo-diploid chromosome could
be created by combining the haploid X chromosomes from two male samples. Cahill et al.
(2016) alternatively proposed an hPSMC pipeline that creates a full pseudo-diploid genome
by randomly selecting an allele for every site in each sample.
On the one hand, using only X chromosomes is expected to create some error
because the amount of sequence is relatively short and because the X chromosome may

78
have a different demographic and mutational history than the autosomes. On the other, the
hPSMC method introduces some error through the random selection of alleles. This error
is expected to be exacerbated in recently-diverged populations that share many of the same
segregating alleles. In light of this, we applied both methods and compared the resulting
divergence estimates.
We used angsd -doFasta 2 to create a FASTA file from each sample’s bam file. This
method selects the most common base at a site to be included in the FASTA file, which
decreases the likelihood of selecting bases that are due to sequencing error. In addition, we
required a minimum base quality of 35, a minimum MapQ of 20, and a maximum depth of
3X the median sample depth. We discarded reads that had more than one best mapping hit
(-uniqueOnly 1), and applied the -C50 flag to adjust the map quality of reads with excessive
mismatches. We then applied the hPSMC pipeline to combine the haploidized X
chromosomes or full genomes from different populations and ran PSMC on these pseudo-
diploid X chromosomes or genomes. To avoid saturation of heterozygous sites, we binned
sites by 10 rather than the PSMC standard of 100. Because the main northern elephant seal
sample we used in this study was female, we performed additional illumina paired-end
sequencing on a male northern elephant seal sample (ID:3747), resulting in a genome with
a median depth of 38X (SD: 18.1). We used this sample for our haploid X chromosome,
but the main northern elephant seal sample used in the rest of the study was used for the
pseudo-diploid genome hPSMC. For plotting, the X chromosome effective population sizes
were scaled by 4/3 to adjust for the expected 3/4 ratio of autosomal to X chromosome Ne.
In addition, the X chromosome mutation rate was scaled by 0.9, as recommended by Li and
Durbin (2011), to account for the ratio of male-to-female mutation rates.
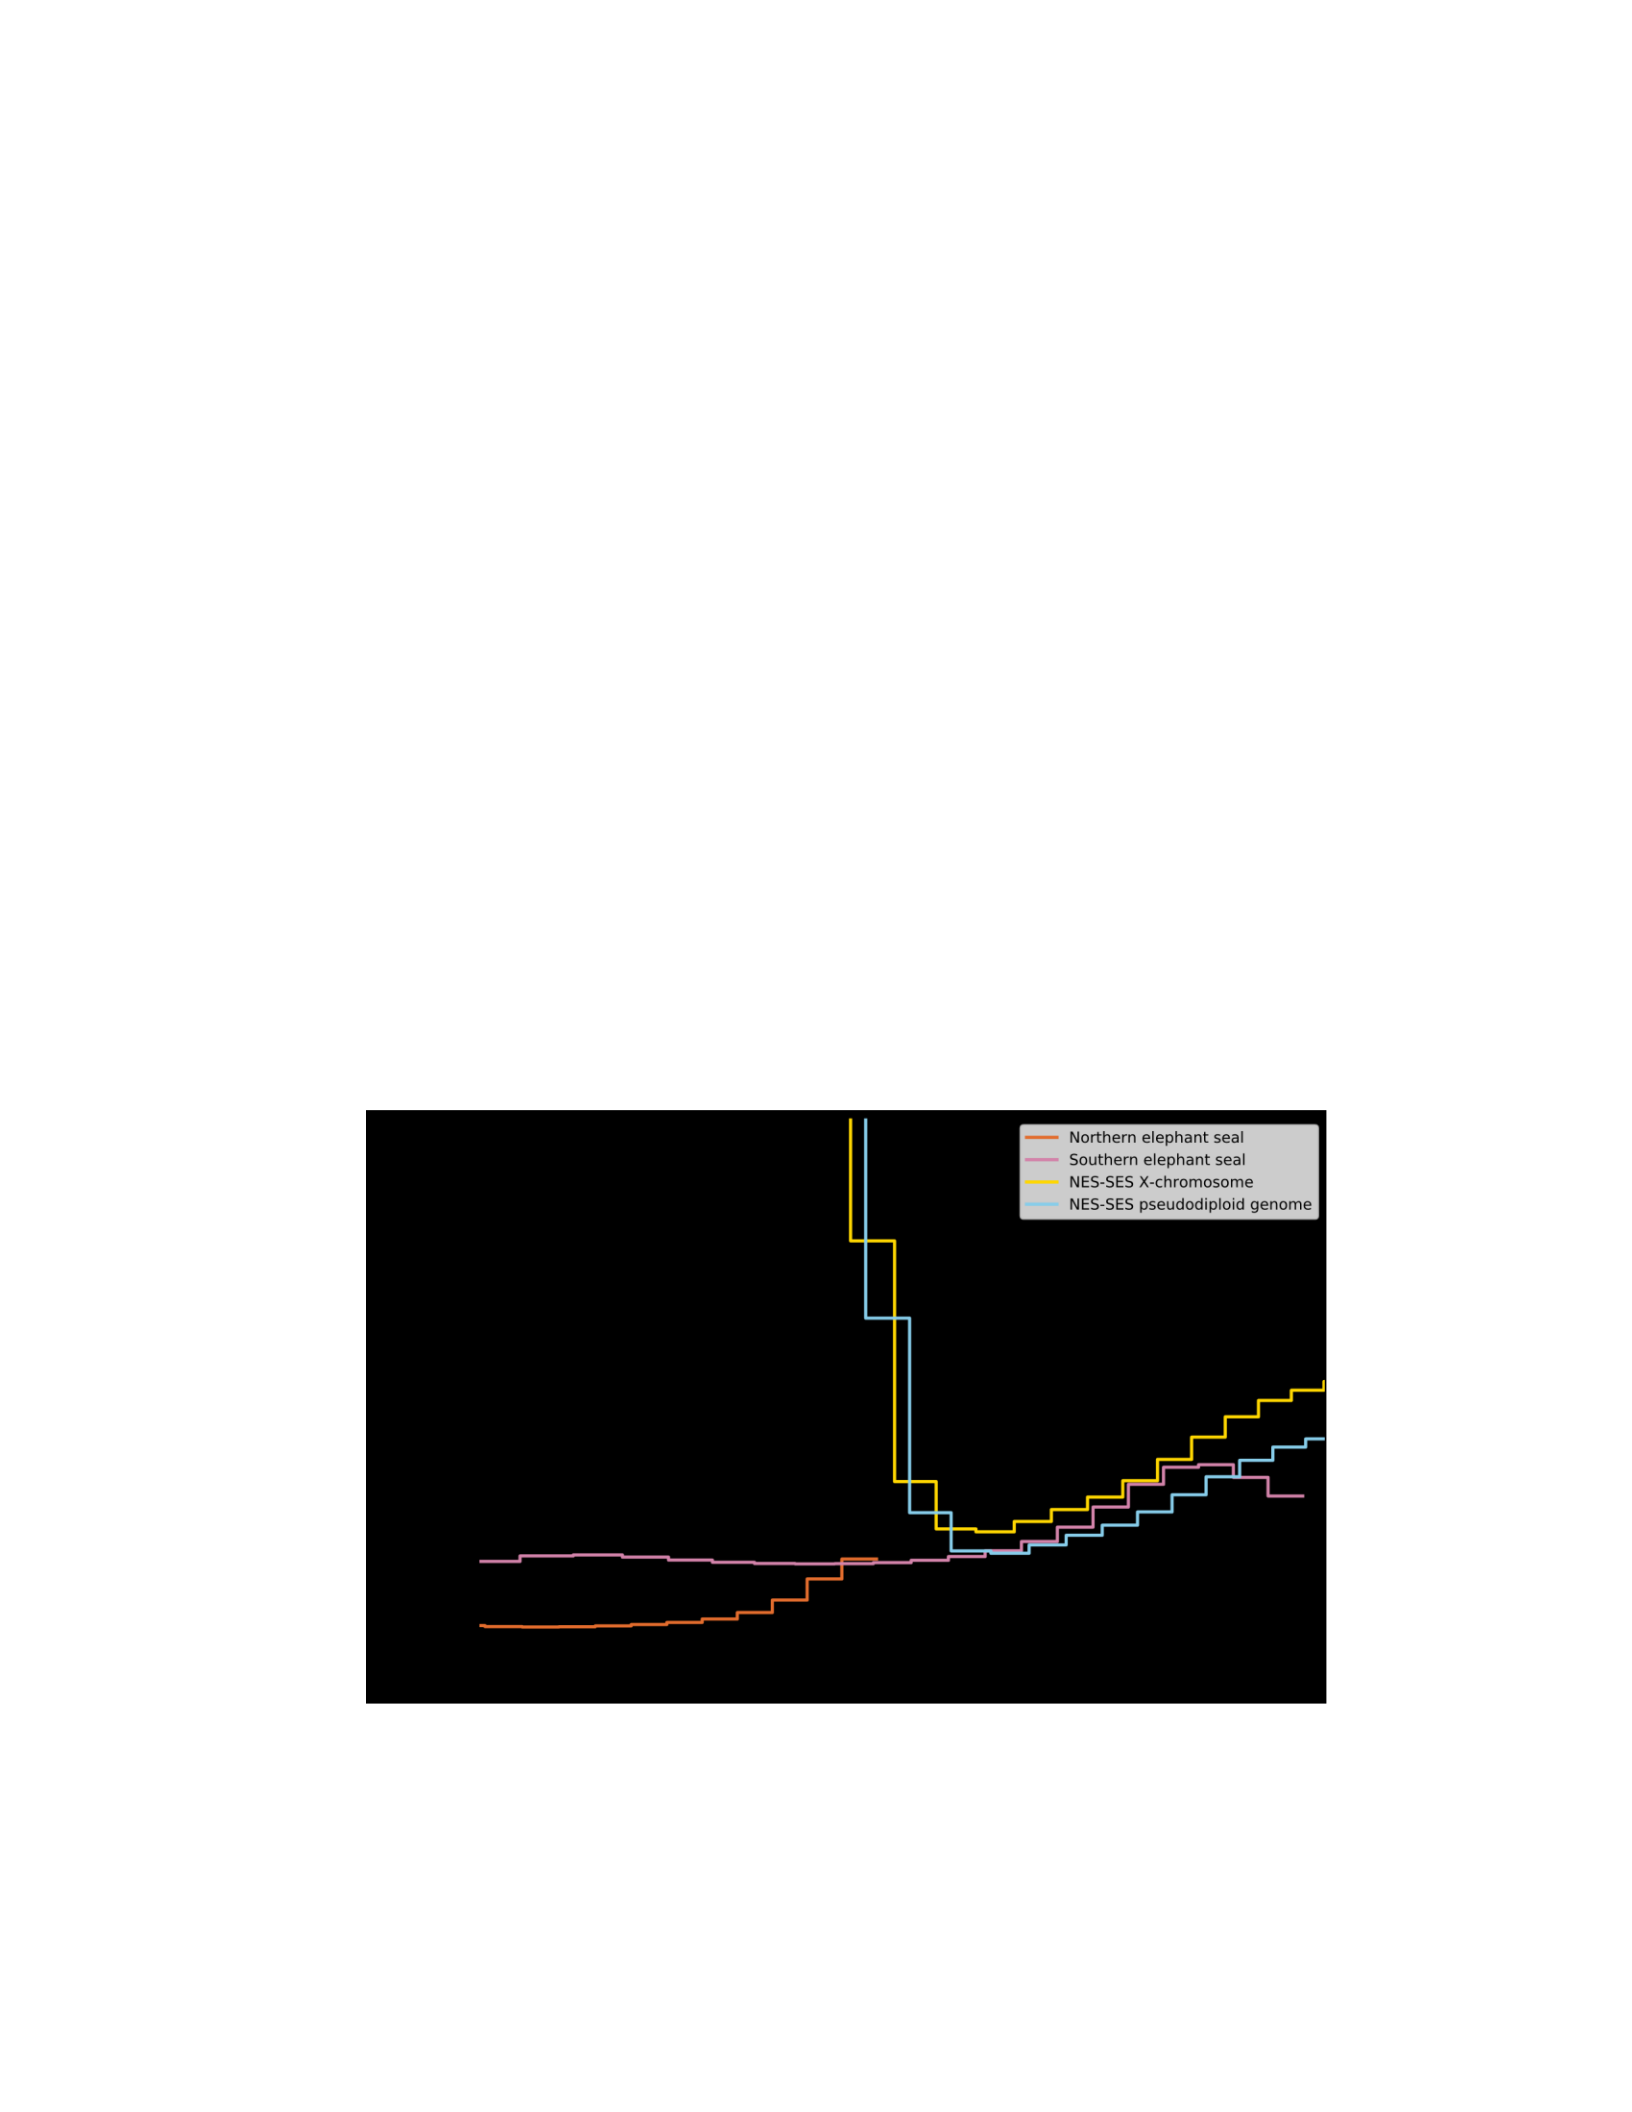
79
As seen in Figure S6, both the X-chromosome and pseudo-diploid genome hPSMC
analyses show that gene flow ceased between the northern and southern elephant seal about
700–800 ka. Prior to divergence, the hPSMC results broadly follow the southern elephant
seal MSMC curve in both magnitude and shape. Figure S7 shows the same analyses from
the ringed seal subspecies. In this case, divergence appears to happen between 100–200 ka.
Again, prior to divergence the hPSMC results appear to generally track the whole genome
MSMC results. We show that in both the elephant seal and ringed seal example, the two
hPSMC methods (X-chromosome or pseudo-diploid genome) are in strong agreement. This
agreement suggests that our estimates are not being strongly influenced by the
abovementioned sources of error.
Figure S6. Reconstructed demographic histories from the whole-genome northern
elephant seal (red) and southern elephant seal (purple) MSMC results, as well as the
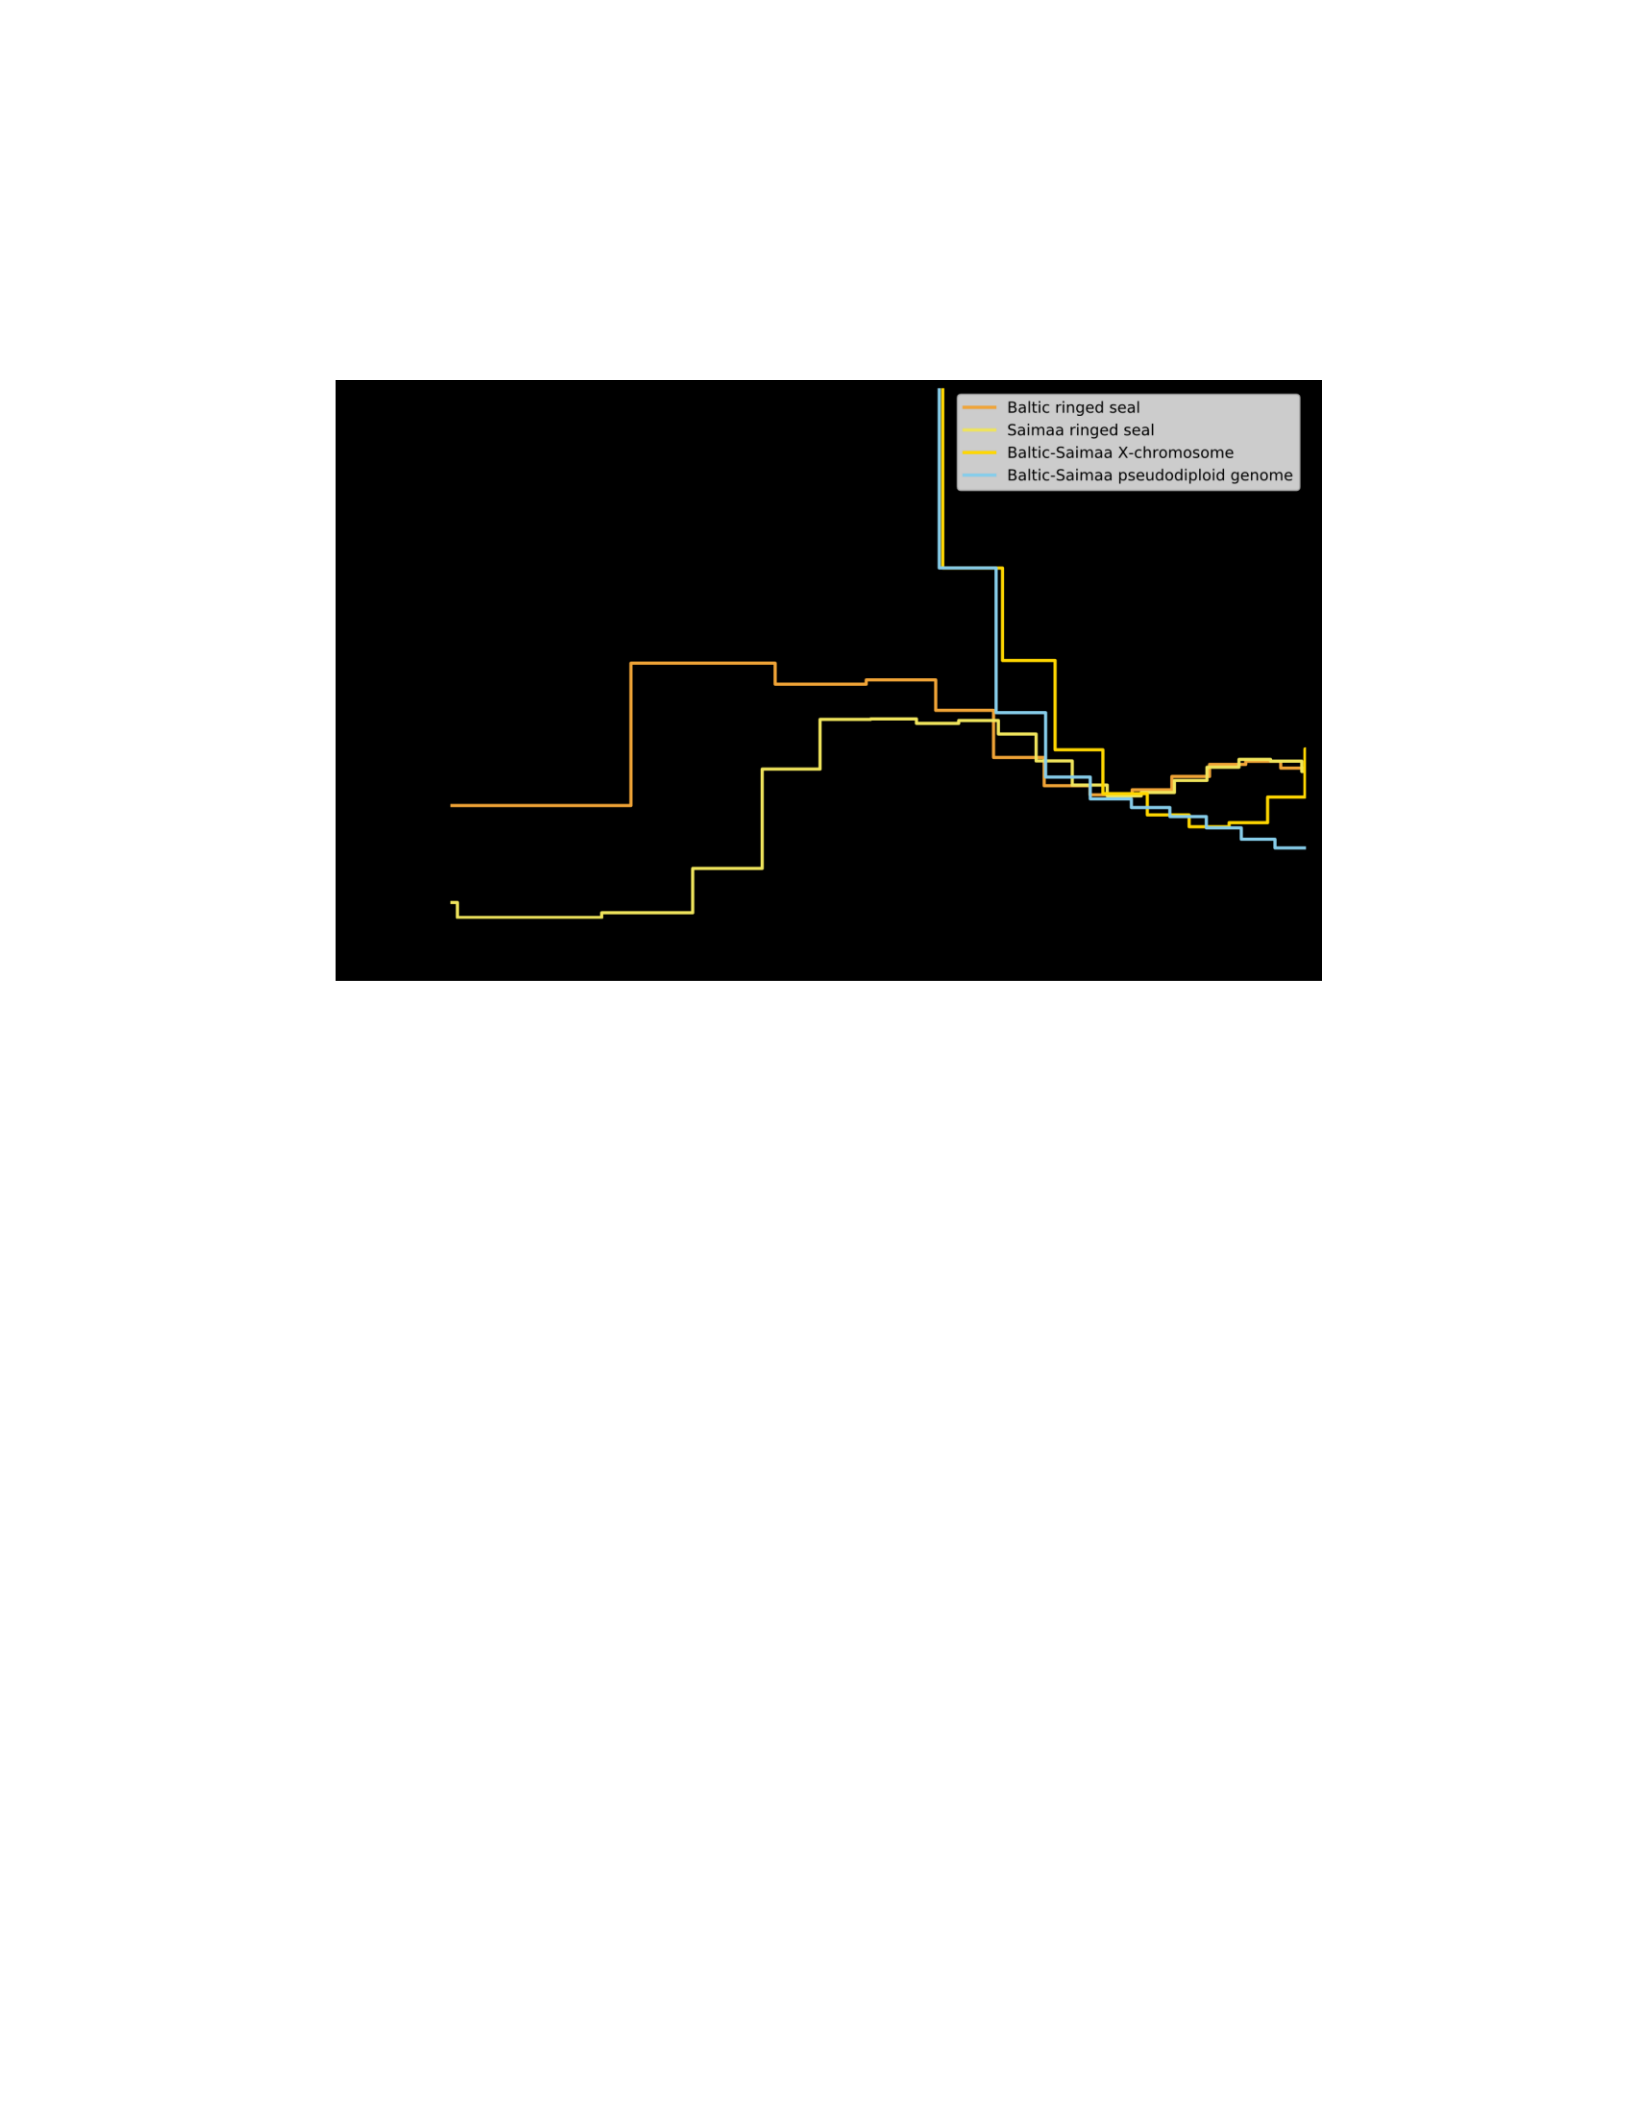
80
divergence hPSMC results derived from X-chromosome (gold) or genome
pseudodiploidization (blue).
Figure S7. Reconstructed demographic histories from the whole-genome Baltic
ringed seal (orange) and Saimaa ringed seal (yellow) MSMC results, as well as the
divergence hPSMC results derived from X-chromosome (gold) or genome
pseudodiploidization (blue).

81
V. Comparative heterozygosity across species
Table S3. Genome-wide heterozygosity (bp-1) for a number of species. Standard deviations,
and therefore coefficients of variation, were only available from this study and Westbury et
al. 2018.
Species
Heterozygosity (bp-1)
CV
SD
Hawaiian monk seal1
0.000099
0.2657
0.000026
Mediterranean monk seal1
0.000396
0.1780
0.000071
Northern elephant seal1
0.000552
0.1525
0.000084
Southern elephant seal1
0.001664
0.1388
0.000231
Weddell seal1
0.001676
0.0937
0.000157
Saimaa ringed seal1
0.001035
0.4320
0.000447
Baltic ringed seal1
0.002500
0.1157
0.000289
Grey seal1
0.000821
0.1410
0.000116
Chimpanzee2
0.00108
0.1667
0.000180
Human (Africa)2
0.000791
0.2351
0.000186
Human (Europe)2
0.000595
0.2857
0.000170
Panda2
0.000497
0.7787
0.000387
Cheetah2
0.000269
0.1673
0.000045
Orca2
0.000214
0.1916
0.000041
San Miguel Island fox2
0.000139
0.5899
0.000082
Brown hyena2
0.000121
0.1900
0.000023
Snow leopard3,4
0.000231
NA
NA
Big horn sheep3,5
0.002218
NA
NA
Rhesus macaque3,5
0.002867
NA
NA
Wild boar3,5
0.004408
NA
NA
Vaquita6
0.000105
NA
NA
Narwhal7
0.000138
NA
NA
1This study; 2Westbury et al. 2018; 3Robinson et al. 2016; 4Cho et al. 2013; 5Corbett-Detig
et al. 2015; 6Morin et al. 2020; 7Westbury et al. 2019
VI. Additional mutation accumulation results and discussion
Table S4. RXY statistic for synonymous sites across phocid species.
HMS
MMS
NES
SES
WED
GRS
BRS
SRS
HMS
-
MMS
0.959
-
NES
0.789
0.819
-
SES
0.795
0.826
1.036
-
WED
NS
1.046
1.317
1.305
-

82
GRS
1.109
1.135
1.292
1.285
1.104
-
BRS
1.114
1.142
1.300
1.294
1.110
NS
-
SRS
1.122
1.149
1.309
1.302
1.117
1.038
1.033
-
Table S5. RXY for nonsynonymous sites across phocid species.
HMS
MMS
NES
SES
WED
GRS
BRS
SRS
HMS
-
MMS
NS
-
NES
0.737
0.731
-
SES
0.752
0.746
1.090
-
WED
NS
0.981
1.381
1.348
-
GRS
1.136
1.132
1.388
1.368
1.144
-
BRS
1.129
1.125
1.381
1.361
1.137
0.978
-
SRS
1.134
1.130
1.388
1.368
1.143
NS
NS
-
The pattern of premature stop codons is hard to interpret, given that the reference
genome is from a species about 30 million years diverged, and loss of function alleles may
have unknown effects. We should be careful about making assumptions about the
distribution of selection coefficients of LOF alleles: given that they are observed as high
frequency or fixed in a population, we might expect that compared to amino acid-changing
alleles, LOF alleles are likely to have s = 0 (i.e. gene become not important to fitness before
LOF allele occurred) or s > 0 (i.e. adaptive). In comparisons of closely related populations,
however, patterns of LOF alleles are often used to assess mutational load. For comparative
purposes, we also assessed R statistics for LOF alleles and found significant differences
across species (Tables S6-8).

83
Table S6. RXY for premature stop codons across phocid species.
HMS
MMS
NES
SES
WED
GRS
BRS
SRS
HMS
-
MMS
NS
-
NES
NS
NS
-
SES
NS
NS
1.280
-
WED
NS
NS
NS
NS
-
GRS
1.431
1.484
1.501
1.376
1.420
-
BRS
1.593
1.652
1.669
1.531
1.572
1.242
-
SRS
1.508
1.570
1.587
1.453
1.499
NS
NS
-
Table S7. R’XY for premature stop codons normalized against synonymous sites.
HMS
MMS
NES
SES
WED
GRS
BRS
SRS
HMS
-
MMS
NS
-
NES
1.193
1.211
-
SES
1.319
1.339
1.235
-
WED
NS
NS
0.816
0.733
-
GRS
1.291
1.307
1.162
NS
1.285
-
BRS
1.429
1.447
1.284
1.183
1.416
1.221
-
SRS
1.344
1.366
1.212
1.116
1.342
NS
0.853
-
Table S8. Rxy for homozygous premature stop codons a
cross pho
cid specie
s.
HMS
MMS
NES
SES
WED
GRS
BRS
SRS
HMS
-
MMS
1.055
-
NES
0.932
0.887
-
SES
0.916
0.872
NS
-
WED
NS
0.940
1.054
1.077
-
GRS
1.044
NS
1.092
1.104
1.054
-
BRS
NS
NS
1.062
1.074
1.025
0.876
-
SRS
1.033
NS
1.080
1.092
1.043
0.959
1.138
-

84
CHAPTER TWO:
Molecular evolution in phocid seals shows adaptations to aquatic
life, polar environments, and hypoxia
Abstract
Pinnipeds are one of the few mammalian lineages that have evolved to rely entirely on the
sea to survive. Seals share many morphological and physiological traits that are adaptations
to marine life, and some features have evolved in parallel as species have independently
colonized similar habitats and evolved similar behaviors and life histories. In this study, we
use population-genomic data sets, a statistically powerful method of detecting positive
selection, and a phylogenetic framework to find positively-selected genes underlying
physiological adaptations in eight seal lineages. We find that all lineages show positive
selection in genes associated with a thick, thermos-insulating blubber layer, with collagen

85
genes being especially overrepresented in the set of positively selected genes. This
ubiquitous signal suggests that the repurposing of mammalian collagen genes in the blubber
layer is an ongoing and complex adaptive walk. Genes relating to sperm flagellar
development and male fertility also show positive selection across all seal lineages,
including in the strongly polygynous elephant seals. Weddell seals and elephant seals, both
of which perform long, deep underwater dives, show an enrichment of positively selected
genes relating to neuronal development and cardiac muscle function, respectively. Cellular
and physiological changes in the heart and brain have been proposed as important
adaptations to hypoxia in deep-diving seals, and our results suggest that these changes are
driven by a suite of amino-acid adaptations in multiple genes. This in-depth study of
molecular adaptations in seals provides novel insight into the process of parallel molecular
evolution in closely related mammalian lineages.
Introduction
Pinnipeds represent one of the few tetrapod lineages that have evolved to rely on
marine habitats (Berta et al. 2015). This extreme shift in habitat was accompanied by a
suite of adaptations. Some gross anatomical adaptations, such as the evolution of
hydrodynamic flippers and the development of an insulating blubber layer, are physically
obvious. More complex traits, such as tolerance of prolonged fasting and of hypoxia during
long dives, likely have numerous underlying adaptive changes at the genetic level.
The main phylogenic relationships of pinniped species have been well-resolved,
with agreement among morphological, mitochondrial, and genomic data sets (Fulton &
Strobeck 2010, Paterson et al. 2020). In addition, a fairly robust fossil record helps to solve
the broad historical biogeography of this clade. For phocids, fossil evidence suggests that
stem phocids inhabited the central Atlantic basin around 15 Ma (Berta et al. 2018). The

86
warm-water affinities of the ancestors to all modern phocids (Berta et al. 2018) is in
contrast to the current distribution of phocids, in which only the monk seals inhabit tropical
and sub-tropical waters while other phocids have anti-tropical distributions (Ferguson &
Higdon 2006). This pattern suggests both that adaptations to warmer water are ancestral,
and that tolerance of polar waters has evolved in parallel in multiple lineages. For example,
the stem phocine seals, a group that includes ringed seals and grey seals, colonized Arctic
polar waters, while the ancestors of Weddell seals and elephant seals diverged in the central
Atlantic basin and independently colonized the Southern Ocean around Antarctica (Fulton
& Strobeck 2010). There are other examples of parallel evolution in phocids, such as the
evolution of extreme polygyny (elephant seals and grey seals) and likely the evolution of
extreme hypoxia (Weddell seals and elephant seals). Individual lineages also have likely
had their own unique adaptations.
Previous comparative genomic studies of terrestrial and marine mammals have
attempted to identify positively selected genes in marine mammals (Foote et al. 2015,
Chikina et al. 2016, Thomas et al. 2017). These analyses, which focused on convergent
substitution rates across marine mammals, found numerous candidate genes that were
positively selected in marine mammals, but were also troubled by a high false positive rate
from methodological artefacts (Thomas et al. 2017). In addition, these analyses assumed
that molecular evolution was taking place in parallel (i.e. acting on the same genes) rather
than convergently (i.e. achieving the same adaptation through distinct molecular changes)
across marine mammal lineages. In this study, we narrow our focus to only phocid seals,
and use a more sensitive and robust statistical framework to detect positive selection in
these lineages.

87
Detecting selection using population genetic concepts in a phylogenetic framework
Numerous statistical tests have been developed to identify signals of selection in
genetic and genomic data. These methods range from phylogenetic-based tests that detect
historical selection by fixed differences in protein-coding genes (dN/dS) or conserved
noncoding sequences (Sackton et al. 2019) to population genetic statistics that detect very
recent selective sweeps (Sabeti et al. 2006, Vitti et al. 2013). In between these extremes are
a set of tests that incorporate polymorphism and divergence data to detect selection in
protein-coding genes. Originally developed by McDonald and Kreitman (1991), this
mathematical framework was expanded by Sawyer and Hartl (1992) in the Poisson Random
Field framework. More recently, Zhao et al. (2017) created the Model-Averaged Site
Selection with Poisson Random Field (MASS-PRF) tool, which uses model averaging and
a site clustering algorithm to estimate the selection intensity (scaled selection coefficient,
or γ) at every site in a gene.
Using this MASS-PRF method on individual species or lineages can give
statistically robust insights into historical and ongoing molecular adaptation, which is of
particular interest in seals given their unique adaptations among mammals to extreme
environments and life history strategies. To extend this framework further, we hypothesized
that in these closely related seal species, the genes underlying independent adaptations to
similar selective pressures—such as polar environments, deep diving, and income
breeding—would show up across multiple lineages as showing signals of positive selection
but would not show positive selection in lineages that do not share the same selective
pressures. By searching for these signals of convergent adaptive evolution, we present a
conservative framework for identifying genes and molecular pathways that drive adaptive
evolution.

88
The unique anatomical and physiological traits of marine mammals have been of
particular interest to the study of adaptation in evolutionary biology (Foote et al. 2015).
Seals offer an additional layer of interesting adaptations because of their radiation of
different environments, extreme physiological conditions, and divergent life histories.
Besides being of interest to evolutionary biologists, comparative results of positive
selection across species can be helpful in understanding gene function in mammals and
may even have implications for human health and disease.
Methods
Sequencing, alignment
We generated low-to-medium coverage shotgun sequence data for Hawaiian monk
seals (n = 15), Mediterranean monk seal (n = 3), Weddell seals (n = 9), northern elephant
seals (n = 10), southern elephant seal (n = 1). In addition, we included publicly available
sequencing data for grey seal (n = 10), Baltic ringed seal (n = 9), and Saimaa ringed seal (n
= 12), and one additional Weddell seal (n = 1).
Shotgun sequencing reads were trimmed using TrimGalore
(https://www.bioinformatics.babraham.ac.uk/projects/trim_galore/) and aligned to the
Hawaiian monk seal reference genome (Mohr et al. 2017) using BWA mem (Li 2013).
Duplicates were removed from bam files using Picard Tools (Van der Auwera et al. 2013).
Identification of polymorphic sites
Polymorphic sites were identified using the Minor Allele Frequency function
(doMaf 1) in ANGSD (Korneliussen et al. 2014). This assesses the probability that a given
site is polymorphic at a P value threshold of 10-6. We fixed the reference allele as the major

89
allele (-doMajorMinor 4), which allowed for the downstream reconstruction of the
ancestral sequences across different seal clades. Minimum map quality (-minMapQ) and
basepair quality (-minQ) were both set to 30 so that only high quality sites were considered,
since the MKT framework can be sensitive to error. Only biallelic sites were kept.
Phylogenetic framework
We used well-resolved phylogenies from Fulton and Strobeck (2010) to guide our
comparisons across lineages. We reasoned that because MASS-PRF does not rely on allele
frequencies, the program can be run on any branch of a tree in which one or more species,
forming a monophyletic clade, for which there is a sister species. If ancestral sequence
reconstruction is used, then an additional outgroup to the two sister taxa is required (Figure
1). Because we were interested in adaptive selection in multiple species and across multiple
branches, we designed a framework combining data from various species that allowed us
to examine adaptation throughout the history of seals. Because some traits have evolved
convergently (e.g. diving, polar adaptations, polygyny, dimorphism), we can also search
for genes that show positive selection in lineages where the adaptation has occurred
independently (Figure 1 and Table 1 for specifics).
Pre-massprf and Massprf
We used the Model-Averaged Site Selection with Poisson Random Field
(MASSPRF) statistical tool to detect regions of protein coding genes that showed
significant positive selection (γ > 4 and lower bound of γ confidence interval above 0). To
prepare MASS-PRF input gene files from raw genomic BAM files, we created two tools:
mafs2vcf and premassprf. Briefly, this pipeline translates an ANGSD .mafs file into a

90
pseudo-VCF file, which encodes population polymorphisms but not sample genotypes. The
pseudo-VCF is then used to 1) identify polymorphic sites within a the target population 2)
reconstruct the ancestral sequence for each gene through simple parsimony 3) identify fixed
(divergent) sites between the target population and the reconstructed ancestral sequence.
Full documentation for these tools can be found at
https://github.com/sjgaughran/massprfpipeline.
We then used the resulting polymorphism and divergence files to run MASS-PRF
with the following command:
massprf -p polymorphism.txt -d ancestral_divergence.txt -o 1 -SCL 1 -a
900 \
-ic 1 -ci_m 1 -sn {sample_size} -s 1 -m 0 -NI 1 -mn 30000 -ssd -n 0
Processing results
We used custom scripts to identify sites in each gene that showed significant positive (γ >
4, lower CI > 0) or negative (γ < 0, upper CI < 0) selection, and to plot the estimated γ and
CI for every site across a gene. We compiled a list of 13,599 one-to-one mammalian
orthologs from the OrthoMamV1.0 database (Scornavacca et al. 2019) to decrease the
probability of paralogous genes biasing our results. Only one-to-one orthologs were kept
for downstream interpretation.
We checked the list of positively selected genes for GO term enrichment using the
PANTHER algorithm with a false discovery rate (FDR) set to P < 0.05 (Ashburner et al.
2000, Mi et al. 2019). We also intersected each list of positively selected genes with curated
lists of genes with functions that were relevant to the phocid phenotypes (e.g. immunity,
sperm motility, hypoxia).

91
Results
Out of 13,599 mammalian orthologs examined in each of eight lineages, our analyses
recovered a total of 2,169 genes that showed statistically significant signs of positive
selection across the lineages, or 1.99% of possible genes. The number of genes with
positive selection in an individual lineage varied from 74 in the Baltic ringed seal to 798 in
elephant seals.
Monachini
In total, 109 genes showed positive selection in the monk seal lineage (Table XX).
This set of genes was enriched for two GO terms: homophilic cell adhesion via plasma
membrane adhesion molecules and anatomical structure morphogenesis. Two collagen
genes (COL6A1 and COL6A3) showed positive selection in monk seals, as did one gene
proposed to be associated with diving and hypoxia (NOTCH1). Despite being a tropical
lineage, the monk seals also showed positive selection for 16 genes that have been proposed
to be associated with polar adaptation (COL6A1, PCNT, TG, ABL1, HIVEP1, MADD,
ALPK2, DNAH11, AHCTF1, URB1, ATP7B, ZDBF2, KIAA1671, ACAN, POM121L2,
APOBR). The monk seals also showed signals of positive selection in three genes
considered to be related to immunity (ITGAL, CD5, IL4R). Finally, this lineage showed
positive selection in three genes thought to be associated with sperm motility and
competition in mammals (DNAH11, NPHP4, ASH1L). The monk seal lineage also had 115
genes that showed negative selection. Of the genes analyzed, 87 showed only neutral
evolution throughout the entire gene.

92
Miroungini
We examined patterns of selection in three separate parts of the Miroungini lineage:
the ancestral branch of elephant seals + Weddell seals, the ancestral branch of northern
elephant seals + southern elephant seals, and Weddell seals.
In the ancestral Miroungini branch, 192 genes showed signals of positive selection
(Table XX). However, this set of genes was not enriched for any particular GO category.
Six collagen genes (COL3A1, COL5A2, COL6A3, COL6A5, COL17A1, COL18A1)
showed positive selection in this lineage, as did a gene associated with collagen secretion
in blubber (MIA3). One gene associated with diving and hypoxia (LOXHD1) showed
positive selection, although this particular gene likely has many other functions. Despite
this lineage not living in the tropics, 23 genes that are associated with polar adaptations
were found to have positive selection (PCNT, DNMBP, BOD1L1, RFWD3, LAMA2,
MADD, CUL9, AHCTF1, DNAH9, ATP7B, ROS1, CEP250, MKI67, AKAP13, DCHS2,
MYO15A, ALPK3, DISP1, PKHD1L1, AKNA, POM121L2, APOBR, PARP14). Three
genes associated with immune function showed positive selection (JAK3, PTPRJ, MUC1).
Four genes associated with sperm motility (ATP1A4, QRICH2, CFAP44, DNAH17) also
showed positive selection. 95 genes showed negative selection, and 78 genes showed only
neutral evolution.
The elephant seal branch had the greatest number of genes with positive selection
(798). This set of genes was significantly enriched for biological function relating to heart
function (e.g. membrane depolarization during AV node cell action potential; regulation of
cardiac muscle cell contraction; regulation of heart rate by cardiac conduction),
extracellular matrix organization (Negative regulation of supramolecular fiber
organization, Extracellular matrix organization, Supramolecular fiber organization),

93
microtubule structure (Regulation of microtubule polymerization, Negative regulation of
microtubule polymerization, Regulation of protein depolymerization, Microtubule
cytoskeleton organization, Tube morphogenesis) cell surface and cell junctions
(Homophilic cell adhesion via plasma membrane adhesion molecules, Calcium ion
transmembrane transport, Calcium ion transport, Cell junction organization, Regulation of
plasma membrane bounded cell projection organization, Phosphatidylinositol metabolic
process), cell movement (Cilium assembly, Cilium movement, Ameboidal-type cell
migration), and developmental processes (Cell morphogenesis involving differentiation,
Anatomical structure formation involved in morphogenesis, Cell cycle, Tissue
development, Nervous system development, Animal organ development).
Nine collagen genes showed positive selection (COL1A2, COL4A2, COL4A3,
COL4A6, COL6A1, COL6A6, COL7A1, COL18A1, COL26A1), as did three other genes
associated with blubber in marine mammals (MIA3, ADAMTS16, DPYSL4). 11 genes
previously associated with diving and hypoxia showed positive selection (LIMD1, TOX1,
ICAM1, DUOX1, MPO, FMN2, CA9, NOS1, MYH7B, ANPEP, PINK1), three of which
have GO associations with reactive oxygen species processing (DUOX1, NOS1, MPO).
Elephant seals also showed positive selection in two genes associated with metabolism and
fasting (CEL and LEPR), both of which are related to lipid metabolism. 21 genes with
positive selection were associated with immune response (CSF3R, ITGA6, SEMA4D,
ICAM1, IGF2R, TCF3, MPO, SLC4A1, IL3RA, PTPRJ, PTPRC, PDGFRB, BLM, LTF,
C5, THBD, CD38, CD96, ANPEP, IL16, IL17RE). 69 genes associated with polar
adaptations showed positive selection. Eight genes associated with sperm motility showed
positive selection (CACNA1I, QRICH2, GAPDHS, DNAH11, VPS13A, CCDC40,
CFAP61, CFAP65). 327 genes showed negative selection, and 606 showed evolution under

94
neutrality.
The Weddell seal branch showed the second highest number of genes with positive
selection (613). This set of genes was significantly enriched for biological function relating
to neurological function (Neuronal action potential, Neuron projection development, Cell
morphogenesis involved in neuron differentiation), extracellular matrix organization
(extracellular matrix organization, supramolecular fiber organization), cell surface and cell
junctions (cell-cell adhesion, cell junction organization, cell matrix adhesion), cell
movement (Cilium movement, Non-motile cilium assembly, Regulation of cell migration),
and cellular and developmental processes (Epithelial cell morphogenesis, Animal organ
morphogenesis, Chemical homeostasis, Regulation of organelle organization, Positive
regulation of cellular component organization, Positive regulation of transport, Centriole
replication, Actin cytoskeleton organization, Regulation of Ras protein signal transduction,
Phospholipid translocation).
Eight collagen genes (COL5A3, COL6A3, COL6A5, COL6A6, COL15A1,
COL20A1, COL27A1, COL28A1) and three other blubber-associated genes (RAB3GAP2,
MIA3 and ADAMTS16) showed positive selection in Weddell seals. Six genes associated
with deep diving showed positive selection (NOTCH1, DUOX2, MYH7B, VASN,
HYOU1, ANPEP). One gene associated with fasting (CEL) showed positive selection. 18
genes showing positive selection were associated with immune response (IL12RB2,
ITGA6, IRAK3, IGF2R, CD177, ITGAX, IL3RA, PTPRJ, ITGAL, NFATC1, IL1R1,
DCLRE1C, LTF, C5, ITGA1, HRH4, ANPEP, ITGA2, IL4R), many of which are
integrinrelated genes. 68 genes related to polar adaptations showed positive selection.
Eleven genes associated with sperm motility showed positive selection (CATSPER2,

95
ATP1A4, CACNA1I, QRICH2, DNAH8, DNAH11, DNAH17, NPHP4, ASH1L, SPEF2,
CFAP65).
180 genes showed negative selection, and 621 were evolving under neutrality.
Phocini
We examined in four lineages of phocini seals: grey seals, ringed seals as a species
(Baltic ringed seals + Saimaa ringed seals), Baltic ringed seal subspecies and Saimaa ringed
seal subspecies.
Grey seals showed positive selection in 124 genes. This set of genes was enriched
for GO terms relating to epithelial cell morphogenesis, cell adhesion, microtubule-based
process, and extracellular matrix organization. Three collagen genes (COL10A1,
COL15A1, and COL18A1) showed positive selection, as did 10 other genes associated
with the extracellular matrix, though none of these have previously been shown to be active
components of seal blubber. One gene associated with diving and hypoxia (NOS2) showed
positive selection. Two genes associated with immune response (SEMA4D and CXCL16)
showed positive selection. 26 genes relating to polar adaptation showed positive selection.
Two genes relating to sperm motility showed positive selection (QRICH2, CFAP65). 48
genes showed negative selection, and 179 were evolving under neutrality.
Ringed seals showed positive selection in 172 genes. This set of genes was
significantly enriched for two GO terms: gland morphogenesis and branching
morphogenesis of an epithelial tube. Four collagen genes (COL5A2, COL6A5, COL27A1,
COL15A1) and two other blubber-associated genes (RAB3GAP2 and MIA3) showed
positive selection. One gene associated with deep diving and hypoxia (USP19) showed

96
positive selection. Six genes associated with immune response showed positive selection
(MST1R, MARCO, PTPRJ, NOD2, INSR, ITGA1). Ringed seals showed positive
selection in 15 genes relating to polar adaptations. Two genes relating to sperm motility
(QRICH2 and VPS13A) showed positive selection. 72 genes showed negative selection,
and 105 were evolving neutrally.
Baltic ringed seals showed positive selection in 74 genes, but they were not
significantly enriched for any GO category. Two collagen genes (COL6A3 and COL6A6)
showed positive selection. Three genes relating to immune response (MST1R, SH2B2, and
A2M) showed positive selection. 13 genes relating to polar adaptation showed positive
selection. Two genes relating to sperm motility (QRICH2, DNAH17) showed positive
selection. 34 genes showed negative selection, and 38 were evolving neutrally.
Saimaa ringed seals showed positive selection in 87 genes, but they were not
significantly enriched for any GO category. Five collagen genes (COL4A3, COL6A6,
COL10A1, COL12A1, COL15A1) and one other blubber-associated gene (MIA3) showed
positive selection. Three genes related to immune function (ITGAL, TLR4, TLR5) showed
positive selection. 18 genes associated with polar adaptation showed positive selection.
Three genes related to sperm motility (CACNA1I, DNAH11, VPS13A) showed positive
selection. 25 genes showed negative selection, and 106 were evolving neutrally.
Phylogenetic comparisons
The ice-breeding Weddell seal and ringed seal both showed positive selection in an
overlapping set of 41 genes. Of those, 16 were found to be under selection in these polar
species but not in monk seals, elephant seals, or grey seals. Conversely, there were 37 genes
that only showed positive selection in the tropical monk seal lineage and not the other

97
coldwater lineages. All species outside of the tropics showed independent positive selection
in only three genes that did not have positive selection in monk seals.
The grey seal and elephant seals are polygynous species that showed positive
selection in an overlapping set of 62 genes. Of those, 22 showed positive selection in these
lineages and not the others.
The deep-diving Weddell seal and elephant seals independently showed positive
selection in the same 209 genes. Of these, 146 showed positive selection in these lineages
and not others.
Seals in the phocini tribe (grey seals and ringed seals) showed positive selection in 17 genes
in common. Of those, only three did not show positive selection in other lineages
(ADAMTS13, ADAMTS7, KIAA1211). Both subspecies of ringed seal independently
showed positive selection in eight genes. However, none were under selection in only the
ringed seal subspecies.
One gene (TNN) showed positive selection in every lineage except WED-ES. Two
other genes (APOBR and TEX15) showed positive selection in all lineages except the most
recent PHB-PHS divergence. Within TNN, the signals of significant positive selection all
fall within nucleotide positions 1500–2500, suggesting that this specific region of TNN is
under strong, ongoing selection. In APOBR and TEX15, on the other hand, there are signals
of positive selection in different parts of the genes in different lineages.
Discussion
Population genetics offers multiple strategies for detecting signals of positive
selection in genomic data. The framework we use in this study, the Poisson Random Field
as implemented in MASS-PRF, provides a robust statistical framework for detecting

98
historical positive selection at individual regions or sites of a gene. Through this, we
identify hundreds of genes across multiple phocid seal lineages that show signs of
significant positive selection.
Phocid-specific and marine mammal-specific genes
We used a number of approaches to identify genes that could be generally related
to marine mammal or phocid adaptive evolution. First, we identified three genes that were
under selection in all phocid lineages examined. A single gene, TNN, showed significant
positive selection in every comparison, including in the short time period of divergence
(~100,000 years) between the Baltic and Saimaa ringed seal subspecies. The exact
nucleotide position of significant selection differed across lineages, but all showed
significant positive selection between positions 1500–2500 of this gene. TNN encodes for
Tenascin N protein, which is associated with many molecular and cellular functions. Most
notably, this protein is associated with collagen-containing extracellular matrix. Given the
apparent importance of the collagen extracellular matrix in the molecular evolution of
phocids, this association suggests that TNN may play a central role in the evolution of
efficient blubber.
APOBR shows positive selection in every lineage except the two ringed seal
subspecies, although it did show positive selection in the ringed seal species overall (Figure
2). APOBR encodes for the apolipoprotein B receptor, and is associated with lipid uptake
in cells. In humans, variants in this gene are
associated with increased

99
hypercholesterolemia (Fujita et al. 2005) and obesity (Volckmar et al. 2015). Expression
studies in mice and humans have shown upregulation of these gene when individuals are
given a high-fat diet (Brown et al. 2002, Varela et al. 2013). Phocids have extremely high
body fat percentages compared to other mammals due to the thick blubber layer. Persistent
positive selection in APOBR could be a key aspect of how phocid physiology has evolved
to regulate and store lipids.
TEX15 also shows positive selection in every lineage except the two ringed seal
subspecies. This gene encodes the testis expressed 15 protein, which is only expressed in
the testis. Studies in mice have shown this protein to be associated with meiosis in male
mice, and is especially relevant in recombination and DNA break repair (Yang et al. 2008).
Given the strong evidence we uncover for adaptation relating to sperm competition in
phocids, TEX15 may be an important gene regulating sperm quality, under consistent
positive selection to keep up with the evolutionary arms race of sperm competition.
We also compared our signals of positive selection against a curated list of genes
that were proposed by Foote et al. (2015) and Chikina et al. (2016) to be under positive
selection in marine mammal lineages. Surprisingly, we found little overlap between this list
of genes and those we recover in phocids. However, the few overlapping genes are likely
evolutionarily informative. Some important examples were DSP in elephant seals, Weddell
seals, and grey seals; ANPEP in elephant seals and Weddell seals (Figure 2a–b);
ZNF582 in elephant seals and Weddell seals; MYH7B in elephant seals and Weddell seal
(Figure 2c–d); GRIN2C in monk seals and Baltic ringed seals; DUSP27 in elephant seals;
and MUC1 in the ancestral Miroungini lineage. As discussed below, ANPEP, DSP, and
MYH7B may be related to adaptations to deep diving. ZNF582 is a tumor suppressor gene,
and may play an anti-cancer role in large body size evolution of marine mammals. Notably,

100
this gene shows positive selection in the two largest seal lineages examined here (elephant
seals and the Weddell seal). The other genes have less clear associations in marine
mammals, but relate to mucin production (MUC1), energy metabolism (DUSP27), and
synaptic transmission (GRIN2C). Chikina et al. (2016) also proposed a number of GO
terms that were enriched in genes under positive selection in marine mammals (especially
related to lung function and muscle contraction), but none of these terms were enriched for
in our results.
Blubber, metabolism, and fasting
Genes involved in blubber composition and lipid processing show some of the most
consistent signals of molecular evolution across the phocid lineages examined here.
Blubber is a specialized, derived trait present in all marine mammals. It consists mainly of
adipocytes (fat cells) embedded in an extracellular matrix of collagen fibers. It serves
primarily as thermal insulation, but is also likely an important source of energy during
fasts.
Many lineages showed GO term enrichment for extracellular matrix organization
and cell-cell adhesion, both of which may relate to the evolution of a thick, collagen-rich
blubber layer in seals. There are more than two dozen collagen genes in mammals, and
collagens are the most abundant proteins in mammalian bodies. In evolving blubber layers,
marine mammals appear to have evolved at least some of these collagen genes under
adaptive evolution. Every phocid lineage examined here, including the ringed seal
subspecies, showed signatures of positive selection in collagen genes, with COL6A1,
COL6A3, and COL6A6, which encode for collagen type VI (ColVI), apparently showing
the most consistent positive selection across lineages (Figure 5). ColVI is found in many

101
tissues, including bone, muscle, nervous, cartilaginous, skin, and adipose tissue (Cescon et
al. 2015). As others have suggested, it is also possible that changes in collagen in marine
mammals could be related to adaptive changes in bone mass (Zhou et al. 2018). As
discussed above, TNN, which shows positive selection in all lineages, encodes for a protein
common in collagen-containing extracellular matrices like blubber.
Previous studies have identified other genes that are actively transcribed in seal
blubber tissue. This includes MIA3, which is involved in collagen secretion and shows
positive selection in the ancestral Miroungini lineage, elephant seals, Weddell seal, ringed
seals, and the Saimaa ringed seal. ADAMTS16, which is associated with regulating blood
pressure (Gopalakrishnan et al. 2012) but is actively transcribed in stressed elephant seal
blubber (Deyarmin et al. 2019), also showed positive selection in the elephant seal and
Weddell seal. Grey seals showed an additional ten genes with positive selection associated
with the extracellular matrix, though not ones that have been previously shown to be
expressed in seal blubber. Because prior transcriptomic and proteomic studies on seal
blubber relied on elephant seals, though, it is possible that these other extracellular matrix
protein genes have been more important in the evolution of blubber in the phocini lineage.
All seal species endure some period of fasting, usually during the winter season
when food is scarce (e.g. ringed seals), as adult males during mating and pupping seasons
(e.g. elephant seals, grey seals), as adult females while lactating and feeding young (e.g.
elephant seals, monk seals, gray seals, Weddell seal), as pups after weaning (e.g. monk
seals, elephant seals), and during molts (e.g. elephant seal, monk seals). These fasts can last
weeks or months, depending on the species and life stage, during which the individuals rely
entirely on fat stores. Individuals can lose between 20–40% of their total mass, which is
almost entirely accounted for by lipid loss (Champagne et al. 2013).

102
However, the vast majority of the genes observed by Martinez et al. (2018) and
Khudyakov et al. (2019) to be differentially regulated in the blubber of seals do not show
signals of positive selection in our results. A few of these candidate genes, however, do
show positive selection. DPYSL4, which shows positive selection in elephant seals, is
upregulated in the blubber of fasting elephant seal pups (Martinez et al. 2018), and is
thought to act as a tumor suppressor by regulating energy metabolism (Nagano et al. 2018).
RAB3GAP2, a GTPase, shows positive selection in ringed seals and the Weddell seal, and
was also observed to be upregulated in the blubber of fasting northern elephant seal pups
(Martinez et al. 2018).
Other studies have assessed molecular changes in fasting seals through proteomic
and enzymatic analyses (Fowler et al. 2014) and through comparative physiology to
discover pathways that are important to survival during fasting (Fowler et al. 2018). Again,
our list of candidate genes curated from these physiological approaches showed very little
overlap with positively selected genes in seals. Elephant seals, which experience long fasts
during multiple life stages, did show positive selection in the leptin receptor gene (LEPR)
and a lipase gene (CEL), both of which could be involved in lipid storage and metabolism.
Weddell seals also showed positive selection in CEL. Other lineages (monk seals, grey
seals, ringed seals), however, did not have positive selection in any of the fasting candidate
genes. As discussed above, though, APOBR does show positive selection in all seal
lineages except the ringed seal subspecies. This gene could play a role in lipid storage and
metabolism, although it was not in our a priori candidate list of genes involved in fasting.
Taken together, these results show that numerous genes putatively relating to
blubber structure and composition show signs of positive selection across seal lineages. In
many cases, this positive selection appears to be ongoing and independently occurring in

103
different species. On the other hand, very few candidate genes relating to fasting appear to
show evidence of positive selection, despite how extreme fasting can be in seal
(Champagne et al. 2013). This difference most likely results from different physiological
needs and constraints in the two cases. Structural adaptations in blubber may adapt through
molecular changes to extracellular matrix proteins, like collagen, that allow the blubber
layer to be constructed for greater thermal efficiency. Physiological changes, like fasting
tolerance and metabolic changes, might be expected to adapt through regulatory changes,
rather than amino acid substitutions, especially given the complexity of metabolism and
the variability in fasting across life stages.
Sperm competition
Sperm competition is a potentially ubiquitous phenomenon among mammals, and
occurs when sperm from two males compete to fertilize the ova of a female (Wigby &
Chapman 2004). Genomic scans for positive selection in other species often recover genes
relating to sperm competition (e.g. Clark & Swanson 2005, Dean et al. 2017). It is thought
to be an especially strong selective pressure in species where females mate
nonmonogamously, and less strong in monogamous or polygynous mating systems (Dapper
& Wade 2016). Given that all seal species examined here range from slightly (i.e. ringed
seals) to extremely (i.e. elephant seals) polygynous, we expected there to be little evidence
of sperm competition. To test this, we curated a list of genes involved in sperm motility and
male fertility based on gene ontologies and reviews (Xu et al. 2020, Huang et al. 2020),
and compared those candidate genes to our results.
Surprisingly, we found evidence of positive selection in sperm-related genes across
seal lineages. As mentioned above, a testis-specific gene (TEX15) relating to meiotic

104
recombination showed positive selection in every lineage except the ringed seal subspecies,
suggesting that this gene has been under consistent positive selection in phocids. In
addition, many lineages showed positive selection in the DNAH gene family, which control
axoneme development in sperm flagella (Huang et al. 2020). All lineages except monk
seals and Saimaa ringed seals showed positive selection in QRICH2, a gene that is crucial
in sperm flagellum development and male fertility (Shen et al. 2019). Likewise, many
lineages (Miroungini ancestors, Weddell seal, elephant seals, grey seals) showed positive
selection in members of the CFAP family, which are also critical to male fertility and
flagellar development (Huang et al. 2020).
It is especially surprising that elephant seals show positive selection in such a large
number of genes relating to sperm development. Northern and southern elephant seals have
the most polygynous mating system of mammals, with a single male thought to mate with
a harem consisting of dozens of females (Leboeuf 1972). In such a system, sperm
competition should be low as male-male competition should be exclusively pre-copulatory.
There are two plausible explanations. One is that the signal of positive selection we pick
up is driven by selection in the elephant seal lineage that occurred prior to the evolution of
extreme polygyny. The second is that female elephant seals may in fact mate with males at
sea, away from their breeding beaches where single males dominate. There is behavioral
data from southern elephant seals suggesting that more than half of females may adopt
alternative mating strategies at least some of the time (de Bruyn et al. 2011), which would
allow for continued sperm competition within this supposedly polygynous mating system.

105
Immunity
Genes involved in immune response are also widely assumed to be under positive
selection in most species (Vallender & Lahn 2004, Sabeti et al. 2006, Van Der Lee et al.
2017). New mutations in host immune genes may be selected by continuously evolving
pathogens in a Red Queen dynamic, or novel pathogens may exert strong selective pressure
on standing variation (Sabeti et al. 2002, Papkou et al. 2019). We used a curated list of
immune gene orthologs, deemed the “immunome” (Rannikko et al. 2007), to identify genes
with immune function in our results. As expected, every lineage showed positive selection
in some genes related to immune function. Interestingly, however, none of the lineages had
sets of positively selected genes that were enriched for GO terms relating to immune
response.
Multiple lineages showed positive selection in genes from the integrin (ITGA) gene
family, although these genes serve many other functions other than immune response.
Many lineages also showed positive selection in interleukin (IL) and interleukin receptor
(ILR) genes, but the exact member of the gene family differed across lineages. There were
also many signals of positive selection in cluster-of-differentiation proteins (CD), though
again they differed across lineages.
Immunological studies in Weddell seals and northern elephant seals have shown
that these species show remarkably low innate immune responses to lipopolysaccharide
(LPS) exposure compared to humans, and in fact their serum may be actively
antiinflammatory (Bagchi et al. 2018). Intriguingly, we find that important innate immune
response genes involved in LPS recognition, like TLR5 and TNFAIP2, appear to be
evolving entirely neutrally in the Weddell seal. On the other hand, the Saimaa ringed seal
showed positive selection in both TLR4 and TLR5 (Figure 4), both of which are important

106
in activating the innate immune response in response to bacterial pathogens (van der Aar
et al. 2007). One possible selective scenario is that the isolation of the Saimaa ringed seal
subspecies in a freshwater lake led to a shift in the bacterial pathogen burden on this
subspecies, providing a strong selective pressure on genes that detect LPS. Future
immunological studies of the Saimaa ringed seal may help to reveal functional changes of
these selected TLR genes, which could provide important information about the threat of
bacterial pathogens to this critically endangered subspecies.
Deep diving and hypoxia
One of the most remarkable adaptations in phocids is their ability to tolerate
hypoxia during long and deep dives. The extent of diving patterns differs across species,
with Weddell seals and elephant seals providing the more extreme cases of deep dives of
long duration. We compiled a list of candidate genes associated with deep diving in marine
mammals from a number of studies of physiological responses to diving in seals (Tift &
Ponganis 2019, Hindle 2020) and hypoxia in humans (Crawford et al. 2017).
Genes from this list that showed up as positively selected included NOS2 in grey
seals, NOTCH1 in monk seals, and USP19 in ringed seals. More hypoxia-associated genes
were positively selected for in the deep-diving Weddell seal (six genes) and elephant seals
(eleven). Among these were ANPEP and MYH7B, which had previously been discussed
by Foote et al. (2015) and Thomas et al. (2017) as being involved in adaptation to deep
diving in marine mammals. Foote et al. (2015) described ANPEP as a glutathione
metabolism pathway gene that could serve an antioxidant capacity and reduce damage from
reactive oxygen species (ROS) in hypoxic conditions. Notably, though, Chikina et al.
(2016) found that positive selection in ANPEP is also found in terrestrial mammal lineages.

107
MYH7B is involved in cardiac muscle development, and has strong evidence for being
positively selected in deep diving cetaceans (Foot et al. 2015, Chikina et al. 2016, Thomas
et al. 2017).
In addition, our study provides a good starting point to identify new genes that are
putatively related to deep-diving adaptations in pinnipeds. For example, deep dives of long
duration are common in elephant seals and Weddell seals, but not the other lineages
examined here. We found 146 genes that show positive selection exclusively in Weddell
seals and elephant seals, which suggests some of these genes could be involved in the
parallel molecular evolution of adaptations to hypoxia. Notably, many of the genes under
positive selection in both elephant seals and Weddell seals relate to cardiac function and
cardiac tissue (e.g. DSP, DSG2, SCN5A, MYH7B). In addition, the subset of genes
showing positive selection in elephant seals was enriched for multiple GO terms relating
to cardiac function (i.e. membrane depolarization during AV node cell action potential;
regulation of cardiac muscle cell contraction; regulation of heart rate by cardiac
conduction). Diving seals are known to experience bradycardia, or low heart rate, with rates
in diving elephant seals recorded to be as low as 2-3 beats per minute (Andrews et al. 1997).
Our GO enrichment results suggest that the elephant seal lineage has experienced
significant molecular adaptation in genes relating to cardiac muscle development and
contraction, which allow its heart muscles to sustain the strain of regular extended
bradycardia.
Besides inflicting extreme physiological stress on the heart, hypoxic dives also
should present a danger to the integrity of the seal nervous system. Thought multiple
physiological and anatomical studies have been done to study potential differences between
seal brain physiology and those of non-diving mammals (reviewed in Blix (2018)), no clear

108
patterns have emerged to explain how seal nervous systems cope with deep dives.
Intriguingly, though, our study suggests that there may be significant molecular adaptation
involved in neuronal cell development that could be involved in protecting Weddell seal
brain cells from hypoxia. The set of genes under positive selection in Weddell seals was
significantly enriched for multiple GO terms related to neuron development (neuronal
action potential, neuron projection development, cell morphogenesis involved in neuron
differentiation).
As mentioned above, the serum of Weddell seals and elephant seals has also been
shown to have extremely low inflammatory responses, and may in fact be antiinflammatory
(Bagchi et al. 2018). Notably, two of the genes showing parallel positive selection in
Weddell and elephant seals (CARD6 and CARD14, Figure2e–h) are important regulators
of inflammatory response (Martinon et al. 2002). Adaptive changes to these cellsurface
proteins may be involved in regulating the innate inflammatory response in these deep-
diving seals.
Polar vs tropical adaptations
Because the seal lineages we examine inhabit tropical, temperate, and polar waters,
we attempted to identify molecular adaptations that correlate with living in these climates.
First, we attempted to use a list of candidate genes compiled by Yudin et al. (2017) that
show apparent positive selection in polar-adapted mammals. However, we found that this
list was relatively uninformative, with many of the genes showing positive selection in the
tropical-water monk seals and temperate-water grey seals. Given that many of the taxa
examined by Yudin et al. (2017) were terrestrial, this could suggest that many of these
genes relate to counteracting heat loss, which is relevant even to tropical marine mammals

109
given the thermodynamic properties of water. Alternatively, this may be a sign that the
criteria used by Yudin et al. (2017) were not strict enough, resulting in genes unrelated to
polar adaptation being included in their list.
Instead, we took a comparative phylogenetic approach. First, we identified genes
that were only positively selected in monk seals but not the other lineages, and identified
37 such genes. These genes were not enriched for any particular GO category, nor did any
provide obvious connections to tropical adaptations such as defenses against UV radiation
damage.
Conversely, we identified genes that were only positively selected in the polar polar,
ice-dependent species (Weddell seal and ringed seals), but not in monk seals, grey seals, or
elephant seals. There were 16 such genes. Notably, two of these genes are collagen proteins
(COL27A1 and COL6A5) and another is an extracellular matrix protein (TNC), suggesting
that genes relating to blubber development may be under particularly strong selection in
polar phocids.
Mating systems and sexual dimorphism
We examined a signal of positive selection driving molecular evolution of genes
related to polygynous mating systems. Although all seals appear to be non-monogamous,
two species in our data set have especially strong polygyny and sexual dimorphism:
elephant seals and grey seals (Ferguson & Higdon 2006). We searched for genes that
showed positive selection in these species but not the less polygynous monk seals, Weddell
seals, and ringed seals. There were 22 genes that showed positive selection in only the
polygynous species. Interestingly, two of these (DNAH7, DNAH9) are expressed in sperm
flagella. As discussed above, the signal of positive selection relating to sperm competition

110
could either reflect selection prior to the emergence of a polygynous mating system (i.e.
that polygyny released the lineage from previously intense sperm competition), or that
sperm competition may be ongoing if females are mating outside of their polygynous harem
structures. We see no genes that would obviously relate to the evolution of sexual
dimorphism, such as cancer susceptibility (due to larger male body size). This lack of signal
is likely because the genetic basis of sexual dimorphism is dominated by differential gene
regulation rather than changes to protein structure (Naqvi et al. 2019).
General patterns of adaptive molecular evolution
Finally, the thousands of examples of positive selection in this study make it possible to
make broad assessments of how adaptive molecular evolution occurs in mammalian
genomes, and how molecular adaptation occurs in parallel across lineages. As discussed
above, we identified many genes that showed independent positive selection in across seal
lineages. This suggests that certain traits (e.g. adaptation to a polar environment, tolerance
of hypoxia during long dives) exhibit parallel evolution at both the phenotypic and
molecular levels. On the one hand, this result may be expected given how closely related
these species are. On the other, such clear parallel evolution of protein coding genes is
surprising given that the adaptive traits examined here are complex physiological traits with
presumably complex developmental and regulatory pathways. Indeed, when compared to
the full results of each lineage, genes showing adaptive parallel evolution make up a small
proportion of positively-selected genes.
Interestingly, we also find that parallel molecular evolution at the gene level does not
necessarily involve parallel molecular evolution at the amino acid level. For example, some
genes have signals of positive selection throughout the gene (e.g. ANPEP, Figure3a–

111
b). Others, such as MYH7B, show very localized signals of positive selection, but at
different sites in different species (Figure 3c–d). Finally some, like APOBR, show positive
selection in the same region of the gene across lineages (Figure 2). In general, these patterns
support the idea that parallel evolution is not common at a convergent amino acid level
(Foote et al. 2015).
Conclusion
In this study, we show how multiple genes and molecular pathways have been subject to
positive selection in phocid seal lineages. Many of these results have obvious connections
to anatomical and physiological adaptations, such as positive selection on many collagen
proteins found in blubber and positive selection on genes involved in sperm motility.
Others, such as an enrichment for cardiac-related genes in elephant seals and neuronal
development genes in Weddell seals, provide intriguing support for the role of adaptive
molecular evolution in protecting cardiac muscle cells and neurons during deep dives, but
do not provide clear mechanistic explanations for how these adaptations work. Future
studies exploring the role of these positively selected genes in seal cardiac and neuron cells
may finally help explain how molecular and cellular adaptations in seals play a role in the
evolution of their extreme phenotypes.

112
References
van der Aar AMG, Sylva-Steenland RMR, Bos JD et al. (2007) Cutting Edge: Loss of
TLR2, TLR4, and TLR5 on Langerhans Cells Abolishes Bacterial Recognition. The
Journal of Immunology.
Abadía-Cardoso A, Freimer NB, Deiner K, Garza JC (2017) Molecular Population
Genetics of the Northern Elephant Seal Mirounga angustirostris. Journal of
Heredity.
Abascal F, Corvelo A, Cruz F et al. (2016) Extreme genomic erosion after recurrent
demographic bottlenecks in the highly endangered Iberian lynx. Genome Biology.
Adami C, Ofria C, Collier TC (2000) Evolution of biological complexity. Proceedings of
the National Academy of Sciences of the United States of America.
Alava JJ (2017) Tropical pinnipeds: Bio-ecology, threats and conservation.
Andrews RD, Jones DR, Williams JD et al. (1997) Heart rates of northern elephant seals
diving at sea and resting on the beach. Journal of Experimental Biology.
Ashburner M, Ball CA, Blake JA et al. (2000) Gene ontology: Tool for the unification of
biology. Nature Genetics.
Van der Auwera GA, Carneiro MO, Hartl C et al. (2013) From fastQ data to
highconfidence variant calls: The genome analysis toolkit best practices pipeline.
Current Protocols in Bioinformatics.
Bagchi A, Batten AJ, Levin M et al. (2018) Intrinsic anti-inflammatory properties in the
serum of two species of deep-diving seal. Journal of Experimental Biology.
Baker JD, Barbieri MM, Johanos TC et al. (2020) Conservation translocations of
Hawaiian monk seals: accounting for variability in body condition improves
evaluation of translocation efficacy. Animal Conservation.
Beichman AC, Huerta-Sanchez E, Lohmueller KE (2018) Using genomic data to infer
historic population dynamics of nonmodel organisms. Annual Review of Ecology,
Evolution, and Systematics.
Beichman AC, Phung TN, Lohmueller KE (2017) Comparison of single genome and
allele frequency data reveals discordant demographic histories. G3: Genes,
Genomes, Genetics.

113
Berta A, Churchill M, Boessenecker RW (2018) The Origin and Evolutionary Biology of
Pinnipeds: Seals, Sea Lions, and Walruses. Annual Review of Earth and Planetary
Sciences.
Berta A, Sumich JL, Kovacs KM (2015) Marine Mammals: Evolutionary Biology: Third
Edition.
Blix AS (2018) Adaptations to deep and prolonged diving in phocid seals. The Journal of
experimental biology.
Boessenecker RW, Churchill M (2016) The origin of elephant seals: implications of a
fragmentary late Pliocene seal (Phocidae: Miroungini) from New Zealand. New
Zealand Journal of Geology and Geophysics.
Le Boeuf BJ, Laws RM (1994) Elephant seals: An introduction to the genus. Elephant
Seals: Population Ecology, Behavior, and Physiology.
Boyko AR, Williamson SH, Indap AR et al. (2008) Assessing the evolutionary impact of
amino acid mutations in the human genome. PLoS Genetics.
Bromham L (2009) Why do species vary in their rate of molecular evolution? Biology
Letters.
Bromham L (2011) The genome as a life-history character: Why rate of molecular
evolution varies between mammal species. Philosophical Transactions of the Royal
Society B: Biological Sciences.
Brown ML, Yui K, Smith JD et al. (2002) The murine macrophage apoB-48 receptor gene
(Apob-48r): Homology to the human receptor. Journal of Lipid Research.
de Bruyn PJN, Tosh CA, Bester MN et al. (2011) Sex at sea: Alternative mating system in
an extremely polygynous mammal. Animal Behaviour.
Busch BC (1985) The war against the seals: a history of the North American seal fishery.
The war against the seals: a history of the North American seal fishery.
Cahill JA, Soares AER, Green RE, Shapiro B (2016) Inferring species divergence times
using pairwise sequential markovian coalescent modelling and low-coverage
genomic data. Philosophical Transactions of the Royal Society B: Biological
Sciences.
Castellano D, MacIà MC, Tataru P, Bataillon T, Munch K (2019) Comparison of the full
distribution of fitness effects of new amino acid mutations across great apes.
Genetics.
Cescon M, Gattazzo F, Chen P, Bonaldo P (2015) Collagen VI at a glance. Journal of Cell
Science.
Chakravarti A (1999) Population genetics-making sense out of sequence. Nature Genetics.
Champagne CD, Crocker DE, Fowler MA, Houser DS (2013) Fasting physiology of the
pinnipeds: The challenges of fasting while maintaining high energy expenditure and
nutrient delivery for lactation. In: Comparative Physiology of Fasting, Starvation,
and Food Limitation
Charlesworth B (2009) Effective population size and patterns of molecular evolution and
variation. Nature Reviews Genetics.
Charlesworth J, Eyre-Walker A (2007) The other side of the nearly neutral theory,
evidence of slightly advantageous back-mutations. Proceedings of the National
Academy of Sciences of the United States of America.
Cherry JL (1998) Should we expect substitution rate to depend on population size?
Genetics.

114
Chikina M, Robinson JD, Clark NL (2016) Hundreds of Genes Experienced Convergent
Shifts in Selective Pressure in Marine Mammals. Molecular Biology and Evolution.
Cingolani P, Platts A, Wang LL et al. (2012) A program for annotating and predicting the
effects of single nucleotide polymorphisms, SnpEff: SNPs in the genome of
Drosophila melanogaster strain w1118; iso-2; iso-3. Fly.
Clark NL, Swanson WJ (2005) Pervasive adaptive evolution in primate seminal proteins.
PLoS Genetics.
Couce A, Caudwell LV, Feinauer C et al. (2017) Mutator genomes decay, despite
sustained fitness gains, in a long-term experiment with bacteria. Proceedings of the
National Academy of Sciences of the United States of America.
Crawford JE, Amaru R, Song J et al. (2017) Natural Selection on Genes Related to
Cardiovascular Health in High-Altitude Adapted Andeans. American Journal of
Human Genetics.
Curtis C, Stewart BS, Karl SA (2009) Pleistocene population expansions of Antarctic seals.
Molecular Ecology.
Curtis C, Stewart BS, Karl SA (2011) Genetically effective population sizes of Antarctic
seals estimated from nuclear genes. Conservation Genetics.
Danecek P, Auton A, Abecasis G et al. (2011) The variant call format and VCFtools.
Bioinformatics, 27, 2156–2158.
Dapper AL, Wade MJ (2016) The evolution of sperm competition genes: The effect of
mating system on levels of genetic variation within and between species. Evolution.
Dean R, Wright AE, Marsh-Rollo SE et al. (2017) Sperm competition shapes gene
expression and sequence evolution in the ocellated wrasse. Molecular Ecology.
Dendrinos P, Karamanlidis AA, Kotomatas S et al. (2007) Pupping habitat use in the
Mediterranean monk seal: A long-term study. Marine Mammal Science.
Deyarmin JS, McCormley MC, Champagne CD et al. (2019) Blubber transcriptome
responses to repeated ACTH administration in a marine mammal. Scientific Reports.
Do R, Balick D, Li H et al. (2015) No evidence that selection has been less effective at
removing deleterious mutations in Europeans than in Africans. Nature Genetics.
Estes S, Phillips PC, Denver DR, Thomas WK, Lynch M (2004) Mutation Accumulation
in Populations of Varying Size: The Distribution of Mutational Effects for Fitness
Correlates in Caenorhabditis elegans. Genetics.
Eyre-Walker A, Keightley PD (2007) The distribution of fitness effects of new mutations.
Nature Reviews Genetics.
Ferguson SH, Higdon JW (2006) How seals divide up the world: Environment, life history,
and conservation. Oecologia.
Foote AD, Liu Y, Thomas GWC et al. (2015) Convergent evolution of the genomes of
marine mammals. Nature Genetics.
Fowler M, Champagne C, Crocker D (2018) Adiposity and fat metabolism during
combined fasting and lactation in elephant seals. Journal of Experimental Biology.
Fowler MA, Debier C, Mignolet E et al. (2014) Fatty acid mobilization and comparison
to milk fatty acid content in northern elephant seals. Journal of Comparative
Physiology B: Biochemical, Systemic, and Environmental Physiology.

115
Fujita Y, Ezura Y, Bujo H et al. (2005) Association of nucleotide variations in the
apolipoprotein B48 receptor gene (APOB48R) with hypercholesterolemia. Journal
of Human Genetics.
Fuller ZL, Berg JJ, Mostafavi H, Sella G, Przeworski M (2019) Measuring intolerance to
mutation in human genetics. Nature Genetics.
Fulton TL, Strobeck C (2010) Multiple fossil calibrations, nuclear loci and mitochondrial
genomes provide new insight into biogeography and divergence timing for true seals
(Phocidae, Pinnipedia). Journal of Biogeography.
Fyler CA, Reeder TW, Berta A et al. (2005) Historical biogeography and phylogeny of
monachine seals (Pinnipedia: Phocidae) based on mitochondrial and nuclear DNA
data. Journal of Biogeography.
Galtier N, Rousselle M (2020) How Much Does Ne Vary Among Species? Genetics, 216,
559–572.
Gillespie JH (2001) Is the population size of a species relevant to its evolution? Evolution.
Glazier AM, Nadeau JH, Aitman TJ (2002) Genetics: Finding genes that underline complex
traits. Science.
Goldstein RA (2013) Population size dependence of fitness effect distribution and
substitution rate probed by biophysical model of protein thermostability. Genome
Biology and Evolution.
Gopalakrishnan K, Kumarasamy S, Abdul-Majeed S et al. (2012) Targeted disruption of
Adamts16 gene in a rat genetic model of hypertension. Proceedings of the National
Academy of Sciences of the United States of America.
Grantham R (1974) Amino acid difference formula to help explain protein evolution.
Science.
Gutenkunst RN, Hernandez RD, Williamson SH, Bustamante CD (2009) Inferring the
joint demographic history of multiple populations from multidimensional SNP
frequency data. PLoS Genetics.
Hahn MW (2008) Toward a selection theory of molecular evolution. Evolution.
Hedrick PW (1995) Elephant seals and the estimation of a population bottleneck. Journal
of Heredity.
Henn BM, Botigué LR, Bustamante CD, Clark AG, Gravel S (2015) Estimating the
mutation load in human genomes. Nature Reviews Genetics.
Hill WG, Goddard ME, Visscher PM (2008) Data and theory point to mainly additive
genetic variance for complex traits. PLoS Genetics.
Hindle AG (2020) Diving deep: Understanding the genetic components of hypoxia
tolerance in marine mammals. Journal of Applied Physiology.
Hoelzel AR, Fleischer RC, Campagna C, Le Boeuf BJ, Alvord G (2002) Impact of a
population bottleneck on symmetry and genetic diversity in the northern elephant
seal. Journal of Evolutionary Biology.
Hoelzel AR, Halley J, O’brien SJ et al. (1993) Elephant seal genetic variation and the use
of simulation models to investigate historical population bottlenecks. Journal of
Heredity.
Huang T, Yin Y, Liu C et al. (2020) Absence of murine CFAP61 causes male infertility due
to multiple morphological abnormalities of the flagella. Science Bulletin.

116
Huber CD, Kim BY, Marsden CD, Lohmueller KE (2017) Determining the factors
driving selective effects of new nonsynonymous mutations. Proceedings of the
National Academy of Sciences of the United States of America.
Hughes AL, Hughes MK (1993) Adaptive evolution in the rat olfactory receptor gene
family. Journal of Molecular Evolution.
Hurst LD (2002) The Ka/Ks ratio: Diagnosing the form of sequence evolution. Trends in
Genetics.
Huzurbazar S, Kolesov G, Massey SE et al. (2010) Lineage-Specific Differences in the
Amino Acid Substitution Process. Journal of Molecular Biology.
Johnson W, Lavigne D (1999) Monk seals in antiquity. Mededelingen.
Johnson KP, Seger J (2001) Elevated rates of nonsynonymous substitution in island birds.
Molecular Biology and Evolution.
Karamanlidis AA, Dendrinos P, de Larrinoa PF et al. (2016a) The Mediterranean monk
seal Monachus monachus: Status, biology, threats, and conservation priorities.
Mammal Review.
Karamanlidis AA, Gaughran S, Aguilar A et al. (2016b) Shaping species conservation
strategies using mtDNA analysis: The case of the elusive Mediterranean monk seal
(Monachus monachus). Biological Conservation.
Keightley PD (1998) Inference of genome-wide mutation rates and distributions of
mutation effects for fitness traits: A simulation study. Genetics.
Keightley PD, Eyre-Walker A (2007) Joint inference of the distribution of fitness effects
of deleterious mutations and population demography based on nucleotide
polymorphism frequencies. Genetics.
Keightley PD, Eyre-Walker A (2010) What can we learn about the distribution of fitness
effects of new mutations from DNA sequence data? Philosophical Transactions of
the Royal Society B: Biological Sciences.
Kern AD, Hahn MW (2018) The neutral theory in light of natural selection. Molecular
Biology and Evolution.
Khudyakov JI, Abdollahi E, Ngo A et al. (2019) Expression of obesity-related adipokine
genes during fasting in a naturally obese marine mammal. American journal of
physiology. Regulatory, integrative and comparative physiology.
Kim BY, Huber CD, Lohmueller KE (2017a) Inference of the distribution of selection
coefficients for new nonsynonymous mutations using large samples. Genetics.
Kim BY, Huber CD, Lohmueller KE (2017b) Inference of the distribution of selection
coefficients for new nonsynonymous mutations using large samples. Genetics.
Kimura M (1968) Evolutionary rate at the molecular level. Nature.
Kimura M (1977) Preponderance of synonymous changes as evidence for the neutral theory
of molecular evolution [33]. Nature.
Kirch P V. (2011) When Did the Polynesians Settle Hawai’i? A Review of 150 Years of
Scholarly Inquiry and a Tentative Answer. Hawaiian Archaeology.
Kittinger JN, Pandolfi JM, Blodgett JH et al. (2011) Historical reconstruction reveals
recovery in Hawaiian coral reefs. PLoS ONE.
Kokko H, Helle E, Lindström J et al. (1999) Backcasting population sizes of ringed and
grey seals in the Baltic and Lake Saimaa during the 20th century. Annales Zoologici
Fennici.

117
Korneliussen TS, Albrechtsen A, Nielsen R (2014) ANGSD: Analysis of Next Generation
Sequencing Data. BMC Bioinformatics.
Kosiol C, Vinař T, Da Fonseca RR et al. (2008) Patterns of positive selection in six
mammalian genomes. PLoS Genetics.
Kovacs KM, Aguilar A, Aurioles D et al. (2012) Global threats to pinnipeds. Marine
Mammal Science.
Kreitman M (1996) The neutral theory is dead. Long live the neutral theory. BioEssays.
Kreitman M, Akashi H (1995) Molecular evidence for natural selection. Annual Review of
Ecology and Systematics.
Kretzmann MB, Gemmell NJ, Meyer A (2001) Microsatellite analysis of population
structure in the endangered Hawaiian monk seal. Conservation Biology.
Kutschera VE, Poelstra JW, Botero-Castro F et al. (2020) Purifying Selection in Corvids Is
Less Efficient on Islands. Molecular Biology and Evolution.
Kwan HH, Culibrk L, Taylor GA et al. (2019) The genome of the steller sea lion
(Eumetopias jubatus). Genes.
Labar T, Adami C (2017) Evolution of drift robustness in small populations. Nature
Communications.
Lande R (2003) Mutation and Conservation. Conservation Biology.
Leboeuf BJ (1972) Sexual behavior in the northern elephant seal mirounga angustirostris.
Behaviour.
Van Der Lee R, Wiel L, Van Dam TJP, Huynen MA (2017) Genome-scale detection of
positive selection in nine primates predicts human-virus evolutionary conflicts.
Nucleic Acids Research.
Li H (2011) A statistical framework for SNP calling, mutation discovery, association
mapping and population genetical parameter estimation from sequencing data.
Bioinformatics.
Li H (2013) Aligning sequence reads, clone sequences and assembly contigs with
BWAMEM. arXiv preprint arXiv.
Li H, Durbin R (2011) Inference of human population history from individual
wholegenome sequences. Nature.
Li WH, Wu CI, Luo CC (1984) Nonrandomness of point mutation as reflected in
nucleotide substitutions in pseudogenes and its evolutionary implications. Journal of
Molecular Evolution.
Lohmueller KE, Indap AR, Schmidt S et al. (2008) Proportionally more deleterious genetic
variation in European than in African populations. Nature.
Loire E, Chiari Y, Bernard A et al. (2013) Population genomics of the endangered giant
Galapagos tortoise. Genome Biology, 14.
Lourenço J, Galtier N, Glémin S (2011) Complexity, pleiotropy, and the fitness effect of
mutations. Evolution.
Lynch M, Conery JS (2003) The Origins of Genome Complexity. Science.
Lynch M, Conery J, Burger R (1995) Mutation accumulation and the extinction of small
populations. American Naturalist.
Lynch M, Lande R (1998) The critical effective size for a genetically secure population.
Animal Conservation.

118
Lynch VJ, Wagner GP (2008) Resurrecting the role of transcription factor change in
developmental evolution. Evolution.
Marsden CD, Vecchyo DO Del, O’Brien DP et al. (2016) Bottlenecks and selective
sweeps during domestication have increased deleterious genetic variation in dogs.
Proceedings of the National Academy of Sciences of the United States of America.
Martin AP, Palumbi SR (1993) Body size, metabolic rate, generation time, and the
molecular clock. Proceedings of the National Academy of Sciences of the United
States of America.
Martinez B, Khudyakov J, Rutherford K et al. (2018) Adipose transcriptome analysis
provides novel insights into molecular regulation of prolonged fasting in northern
elephant seal pups. Physiological Genomics.
Martinon F, Burns K, Tschopp J (2002) The Inflammasome: A molecular platform
triggering activation of inflammatory caspases and processing of proIL-β. Molecular
Cell.
Mazet O, Rodríguez W, Grusea S, Boitard S, Chikhi L (2016) On the importance of being
structured: Instantaneous coalescence rates and human evolution-lessons for
ancestral population size inference? Heredity.
McDonald JH, Kreitman M (1991) Adaptive protein evolution at the Adh locus in
Drosophila. Nature.
Mi H, Muruganujan A, Ebert D, Huang X, Thomas PD (2019) PANTHER version 14:
More genomes, a new PANTHER GO-slim and improvements in enrichment
analysis tools. Nucleic Acids Research.
Mohr DW, Naguib A, Weisenfeld NI et al. (2017) Improved de novo genome assembly:
Linked-read sequencing combined with optical mapping produce a high quality
mammalian genome at relatively low cost. bioRxiv.
Morin PA, Archer FI, Avila CD et al. (2020) Reference genome and demographic history
of the most endangered marine mammal, the vaquita. Molecular Ecology Resources.
Nabholz B, Uwimana N, Lartillot N (2013) Reconstructing the phylogenetic history of
long-term effective population size and life-history traits using patterns of amino
acid replacement in mitochondrial genomes of mammals and birds. Genome Biology
and Evolution.
Nagano H, Hashimoto N, Nakayama A et al. (2018) p53-inducible DPYSL4 associates
with mitochondrial supercomplexes and regulates energy metabolism in adipocytes
and cancer cells. Proceedings of the National Academy of Sciences of the United
States of America.
Naqvi S, Godfrey AK, Hughes JF et al. (2019) Conservation, acquisition, and functional
impact of sex-biased gene expression in mammals. Science.
Nei M, Graur D (1984) Extent of Protein Polymorphism and the Neutral Mutation Theory.
In: Evolutionary Biology
Nei M, Tajima F (1981) Genetic drift and estimation of effective population size. Genetics.
Nyman T, Valtonen M, Aspi J et al. (2014) Demographic histories and genetic diversities
of Fennoscandian marine and landlocked ringed seal subspecies. Ecology and
Evolution.
O’Corry-Crowe G (2008) Climate change and the molecular ecology of arctic marine
mammals. Ecological Applications.
Ohta T (1972) Population size and rate of evolution. Journal of Molecular Evolution.

119
Ohta T (1973) Slightly deleterious mutant substitutions in evolution. Nature.
Ohta T (1992) The nearly neutral theory of molecular evolution. Annual Review of Ecology
and Systematics.
Ohta T, Gillespie JH (1996) Development of neutral nearly neutral theories. Theoretical
Population Biology.
Orr HA (2003) The distribution of fitness effects among beneficial mutations. Genetics.
Osada N, Hettiarachchi N, Babarinde IA, Saitou N, Blancher A (2015) Whole-genome
sequencing of six Mauritian cynomolgus macaques (Macaca fascicularis) reveals a
genome-wide pattern of polymorphisms under extreme population bottleneck.
Genome Biology and Evolution.
Palo JU, Mäkinen HS, Helle E, Stenman O, Väinölä R (2001) Microsatellite variation in
ringed seals (Phoca hispida): Genetic structure and history of the Baltic Sea
population. Heredity.
Papkou A, Guzella T, Yang W et al. (2019) The genomic basis of red queen dynamics
during rapid reciprocal host–pathogen coevolution. Proceedings of the National
Academy of Sciences of the United States of America.
Paterson RS, Rybczynski N, Kohno N, Maddin HC (2020) A Total Evidence
Phylogenetic Analysis of Pinniped Phylogeny and the Possibility of Parallel
Evolution Within a Monophyletic Framework. Frontiers in Ecology and Evolution.
Peart CR, Tusso S, Pophaly SD et al. (2020) Determinants of genetic variation across eco-
evolutionary scales in pinnipeds. Nature Ecology and Evolution.
Pedersen CET, Lohmueller KE, Grarup N et al. (2017) The effect of an extreme and
prolonged population bottleneck on patterns of deleterious variation: Insights from
the Greenlandic Inuit. Genetics.
Poon A, Otto SP (2000) Compensating for our load of mutations: Freezing the meltdown
of small populations. Evolution.
Purcell S, Neale B, Todd-Brown K et al. (2007) PLINK: A tool set for whole-genome
association and population-based linkage analyses. American Journal of Human
Genetics.
Rannikko K, Ortutay C, Vihinen M (2007) Immunity genes and their orthologs: A
multispecies database. International Immunology.
Reeves RR (1998) Distribution, abundance and biology of ringed seals (Phoca hispida): an
overview. NAMMCO Scientific Publications.
Robinson JD, Coffman AJ, Hickerson MJ, Gutenkunst RN (2014) Sampling strategies for
frequency spectrum-based population genomic inference. BMC Evolutionary
Biology.
Robinson JA, Ortega-Del Vecchyo D, Fan Z et al. (2016) Genomic Flatlining in the
Endangered Island Fox. Current Biology.
Rogers RL, Slatkin M (2017) Excess of genomic defects in a woolly mammoth on Wrangel
island. PLoS Genetics.
Sabeti PC, Reich DE, Higgins JM et al. (2002) Detecting recent positive selection in the
human genome from haplotype structure. Nature.
Sabeti PC, Schaffner SF, Fry B et al. (2006) Positive natural selection in the human lineage.
Science, 312, 1614–1620.

120
Sackton TB, Grayson P, Cloutier A et al. (2019) Convergent regulatory evolution and loss
of flight in paleognathous birds. Science.
Sanjuán R, Moya A, Elena SF (2004) The distribution of fitness effects caused by
singlenucleotide substitutions in an RNA virus. Proceedings of the National
Academy of Sciences of the United States of America.
Der Sarkissian C, Ermini L, Schubert M et al. (2015) Evolutionary genomics and
conservation of the endangered Przewalski’s horse. Current Biology.
Savriama Y, Valtonen M, Kammonen JI et al. (2018) Bracketing phenogenotypic limits of
mammalian hybridization. Royal Society Open Science.
Sawyer SA, Hartl DL (1992) Population genetics of polymorphism and divergence.
Genetics.
Schiffels S, Durbin R (2014) Inferring human population size and separation history from
multiple genome sequences. Nature Genetics.
Schiffels S, Wang K (2020) MSMC and MSMC2: The multiple sequentially Markovian
coalescent. In: Methods in Molecular Biology
Schultz JK, Baker JD, Toonen RJ, Bowen BW (2009) Extremely low genetic diversity in
the endangered Hawaiian monk seal (Monachus schauinslandi). Journal of Heredity.
Schultz ST, Lynch M, Willis JH (1999) Spontaneous deleterious mutation in Arabidopsis
thaliana. Proceedings of the National Academy of Sciences of the United States of
America.
Schultz JK, Marshall AJ, Pfunder M (2010) Genome-wide loss of diversity in the critically
endangered Hawaiian monk seal. Diversity.
Scornavacca C, Belkhir K, Lopez J et al. (2019) OrthoMaM v10: Scaling-up orthologous
coding sequence and exon alignments with more than one hundred mammalian
genomes. Molecular Biology and Evolution.
Shen Y, Zhang F, Li F et al. (2019) Loss-of-function mutations in QRICH2 cause male
infertility with multiple morphological abnormalities of the sperm flagella. Nature
Communications.
Silander OK, Tenaillon O, Chao L (2007) Understanding the evolutionary fate of finite
populations: The dynamics of mutational effects. PLoS Biology.
Simons YB, Sella G (2016) The impact of recent population history on the deleterious
mutation load in humans and close evolutionary relatives. Current Opinion in
Genetics and Development.
Simons YB, Turchin MC, Pritchard JK, Sella G (2014) The deleterious mutation load is
insensitive to recent population history. Nature Genetics.
Slade RW, Moritz C, Hoelzel AR, Burton HR (1998) Molecular population genetics of the
southern elephant seal Mirounga leonina. Genetics.
Smith NGC, Eyre-Walker A (2003) Partitioning the variation in mammalian substitution
rates. Molecular Biology and Evolution.
Soulé ME (1985) What is conservation biology? A new synthetic discipline addresses the
dynamics and problems of perturbed species, communities, and ecosystems.
Bioscience.
Southwell C, Bengtson J, Bester M et al. (2012) A review of data on abundance, trends in
abundance, habitat use and diet of ice-breeding seals in the Southern Ocean.
CCAMLR Science.

121
Stambler N (2014) The mediterranean sea - Primary Productivity. In: The Mediterranean
Sea: Its History and Present Challenges
Stoffel MA, Humble E, Paijmans AJ et al. (2018) Demographic histories and genetic
diversity across pinnipeds are shaped by human exploitation, ecology and
lifehistory. Nature Communications.
Tataru P, Bataillon T (2019) PolyDFEv2.0: Testing for invariance of the distribution of
fitness effects within and across species. Bioinformatics.
Tenaillon O (2014) The Utility of Fisher’s Geometric Model in Evolutionary Genetics.
Annual Review of Ecology, Evolution, and Systematics.
Tenaillon O, Silander OK, Uzan JP, Chao L (2007) Quantifying organismal complexity
using a population genetic approach. PLoS ONE.
Terhorst J, Kamm JA, Song YS (2017) Robust and scalable inference of population history
from hundreds of unphased whole genomes. Nature Genetics.
Thomas GWC, Hahn MW, Hahn Y (2017) The effects of increasing the number of taxa on
inferences of molecular convergence. Genome Biology and Evolution.
Tift MS, Ponganis PJ (2019) Time domains of hypoxia adaptation-elephant seals stand out
among divers. Frontiers in Physiology.
Valenzuela-Toro AM, Gutstein CS, Suárez ME, Otero R, Pyenson ND (2015) Elephant
seal (Mirounga sp.) from the Pleistocene of the Antofagasta Region, northern Chile.
Journal of Vertebrate Paleontology.
van der Valk T, de Manuel M, Marques-Bonet T, Guschanski K (2019) Estimates of
genetic load in small populations suggest extensive purging of deleterious alleles.
bioRxiv.
Vallender EJ, Lahn BT (2004) Positive selection on the human genome. Human Molecular
Genetics.
Valtonen M, Palo JU, Ruokonen M, Kunnasranta M, Nyman T (2012) Spatial and
temporal variation in genetic diversity of an endangered freshwater seal.
Conservation Genetics.
Varela LM, Ortega-Gomez A, Lopez S et al. (2013) The effects of dietary fatty acids on
the postprandial triglyceride-rich lipoprotein/apoB48 receptor axis in human
monocyte/macrophage cells. Journal of Nutritional Biochemistry.
Vitti JJ, Grossman SR, Sabeti PC (2013) Detecting natural selection in genomic data.
Annual Review of Genetics.
Volckmar AL, Song JY, Jarick I et al. (2015) Fine mapping of a GWAS-derived obesity
candidate region on chromosome 16p11.2. PLoS ONE.
Welch JJ, Bininda-Emonds ORP, Bromham L (2008) Correlates of substitution rate
variation in mammalian protein-coding sequences. BMC Evolutionary Biology.
Westbury M V., Hartmann S, Barlow A et al. (2018) Extended and continuous decline in
effective population size results in low genomic diversity in the world’s rarest hyena
species, the brown Hyena. Molecular Biology and Evolution.
Westbury M V., Petersen B, Garde E, Heide-Jørgensen MP, Lorenzen ED (2019) Narwhal
Genome Reveals Long-Term Low Genetic Diversity despite Current Large
Abundance Size. iScience.
Whitlock MC (2000) Fixation of new alleles and the extinction of small populations:
Drift load, beneficial alleles, and sexual selection. Evolution.

122
Whitlock MC, Griswold CK, Peters AD (2003) Compensating for the meltdown: {T}he
critical effective size of a population with deleterious and compensatory mutations.
Annales Zoologici Fennici.
Wigby S, Chapman T (2004) Sperm competition. Current biology : CB.
Woolfit M (2009) Effective population size and the rate and pattern of nucleotide
substitutions. Biology Letters.
Woolfit M, Bromham L (2005) Population size and molecular evolution on islands.
Proceedings of the Royal Society B: Biological Sciences.
Wright S (1931) Evolution in mendelian populations. Bulletin of Mathematical Biology.
Yang F, Eckardt S, Leu NA, McLaughlin KJ, Wang PJ (2008) Mouse TEX15 is essential
for DNA double-strand break repair and chromosomal synapsis during male meiosis.
Journal of Cell Biology.
Yang Z, Nielsen R (1998) Synonymous and nonsynonymous rate variation in nuclear genes
of mammals. Journal of Molecular Evolution.
Yoder AD, Poelstra JW, Tiley GP, Williams RC, Kumar S (2018) Neutral theory is the
foundation of conservation genetics. Molecular Biology and Evolution.
Yudin NS, Larkin DM, Ignatieva E V. (2017) A compendium and functional
characterization of mammalian genes involved in adaptation to Arctic or Antarctic
environments. BMC Genetics.
Zhang J (2000) Rates of conservative and radical nonsynonymous nucleotide substitutions
in mammalian nuclear genes. Journal of Molecular Evolution.
Zhao ZM, Campbell MC, Li N et al. (2017) Detection of regional variation in selection
intensity within protein-coding genes using DNA sequence polymorphism and
divergence. Molecular Biology and Evolution.
Zhou X, Sun D, Guang X et al. (2018) Molecular footprints of aquatic adaptation including
bone mass changes in cetaceans. Genome Biology and Evolution.

123
Figures and Tables
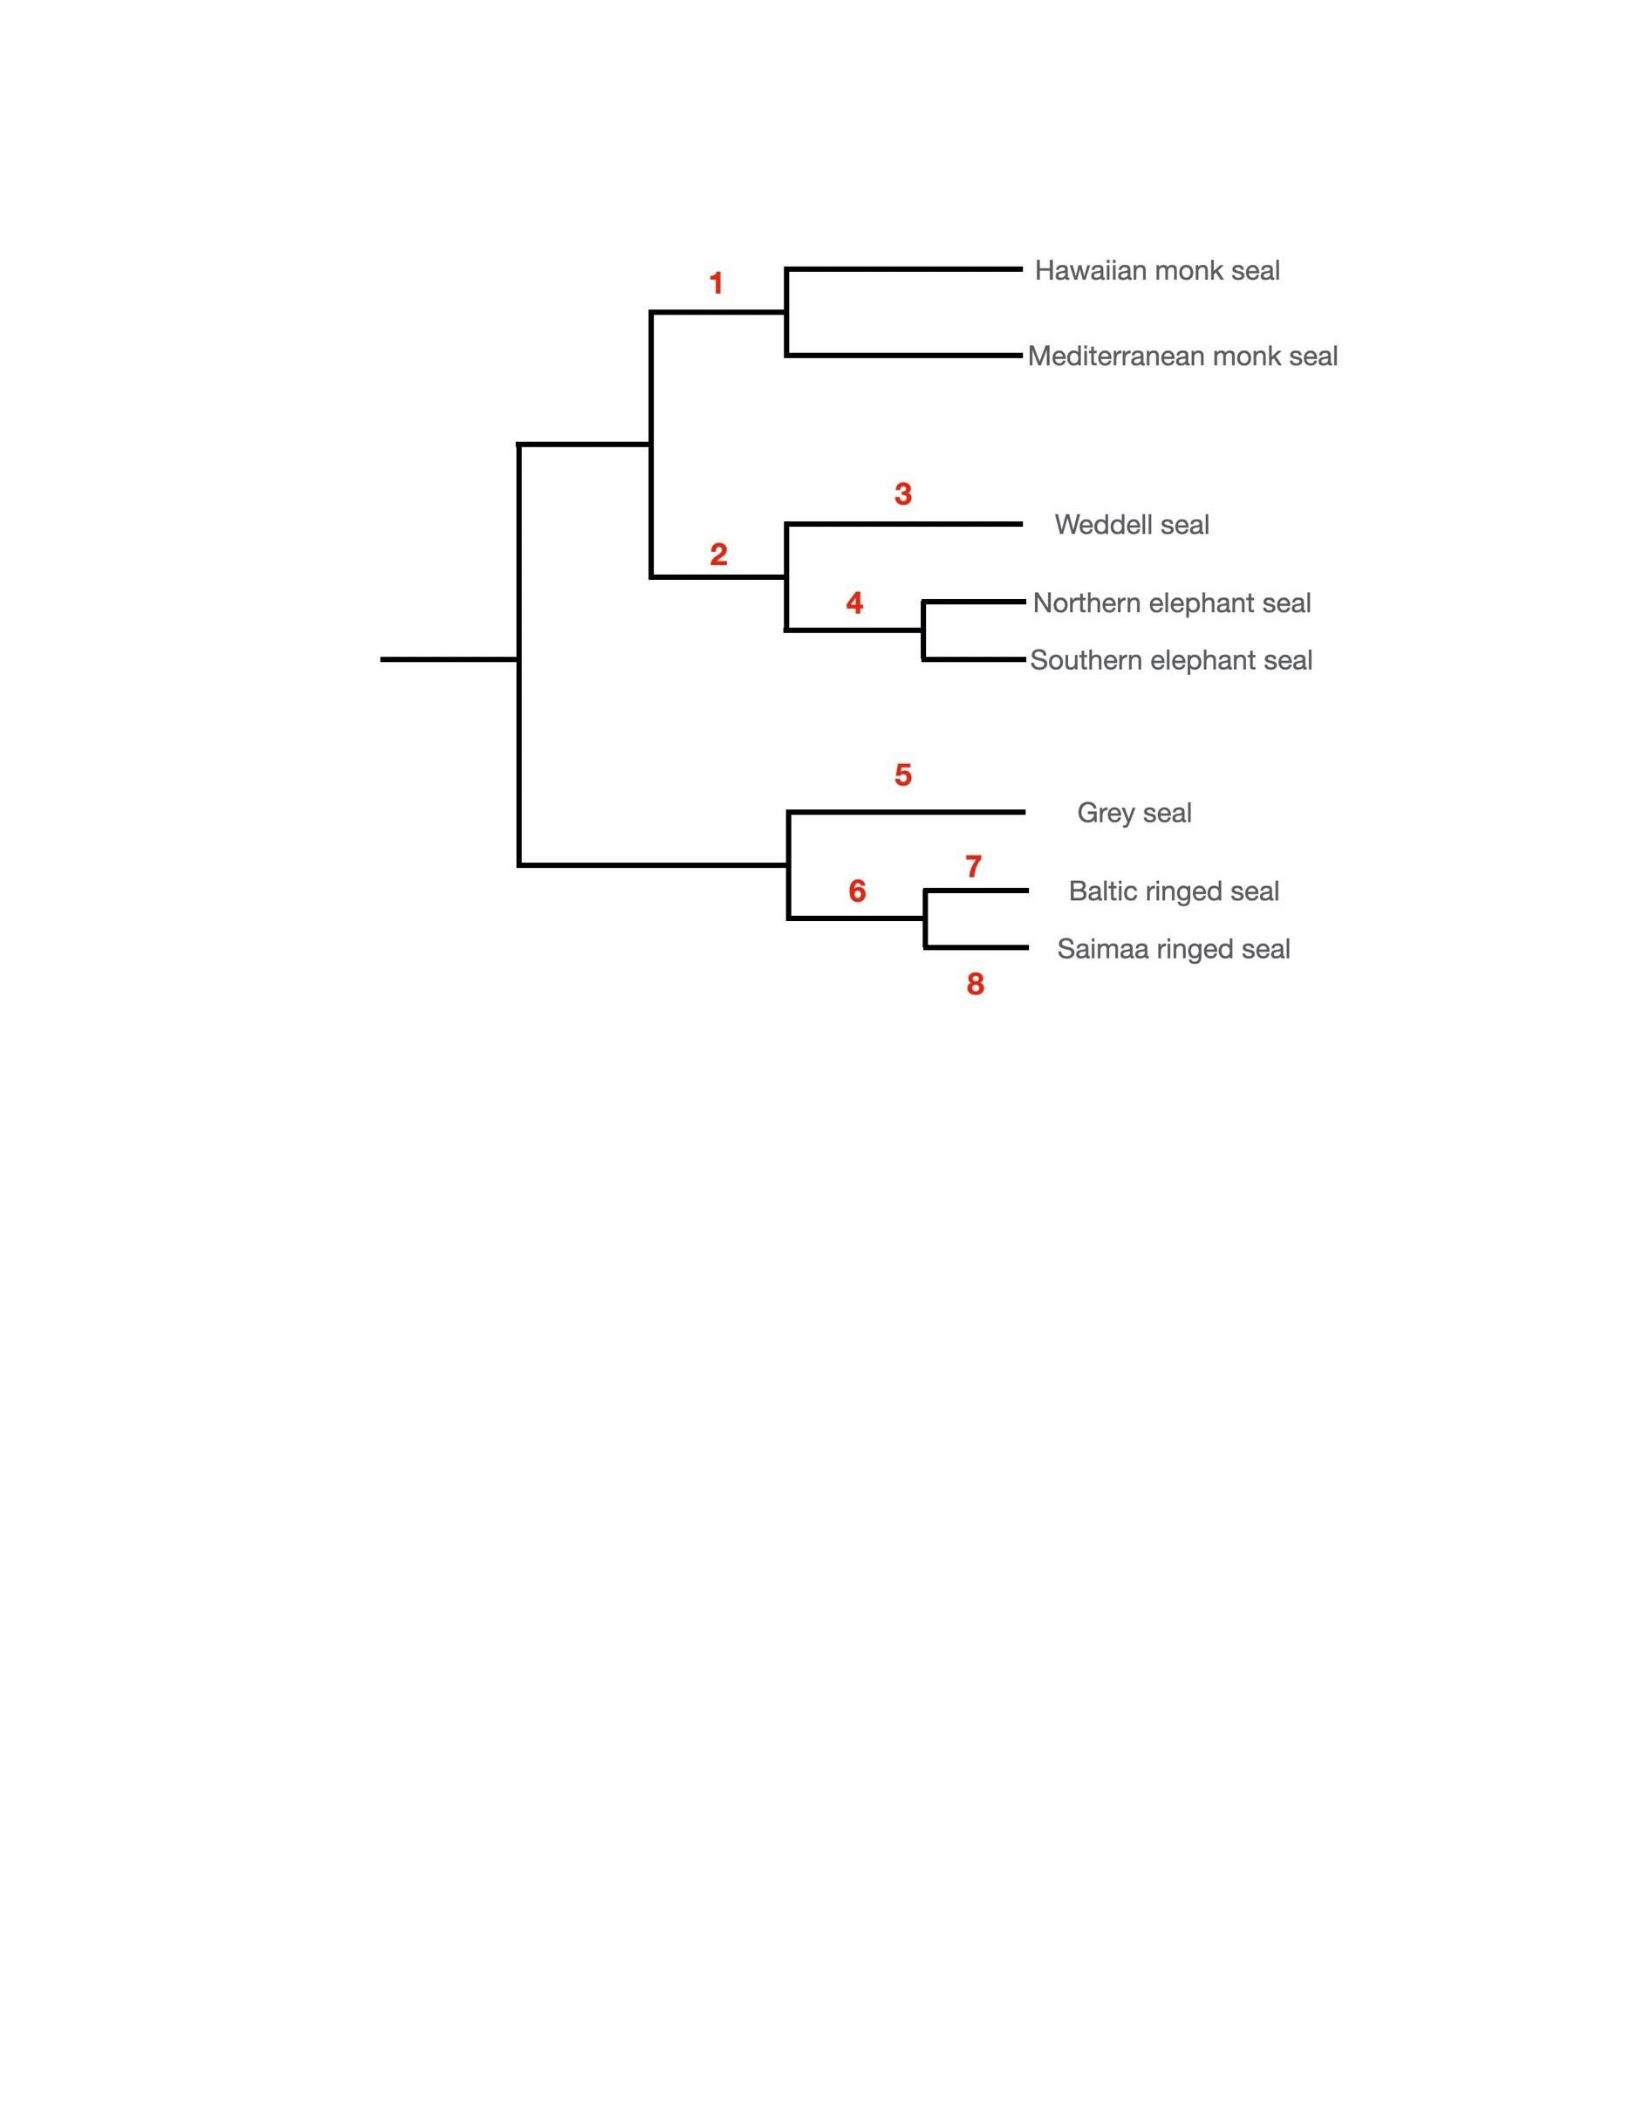
124
Figure 1. Phylogeny of phocid seals included in this study, reproduced from Fulton and
Strobeck (2010). Branches examined in this study are labeled 1–8 and described in Table
1.
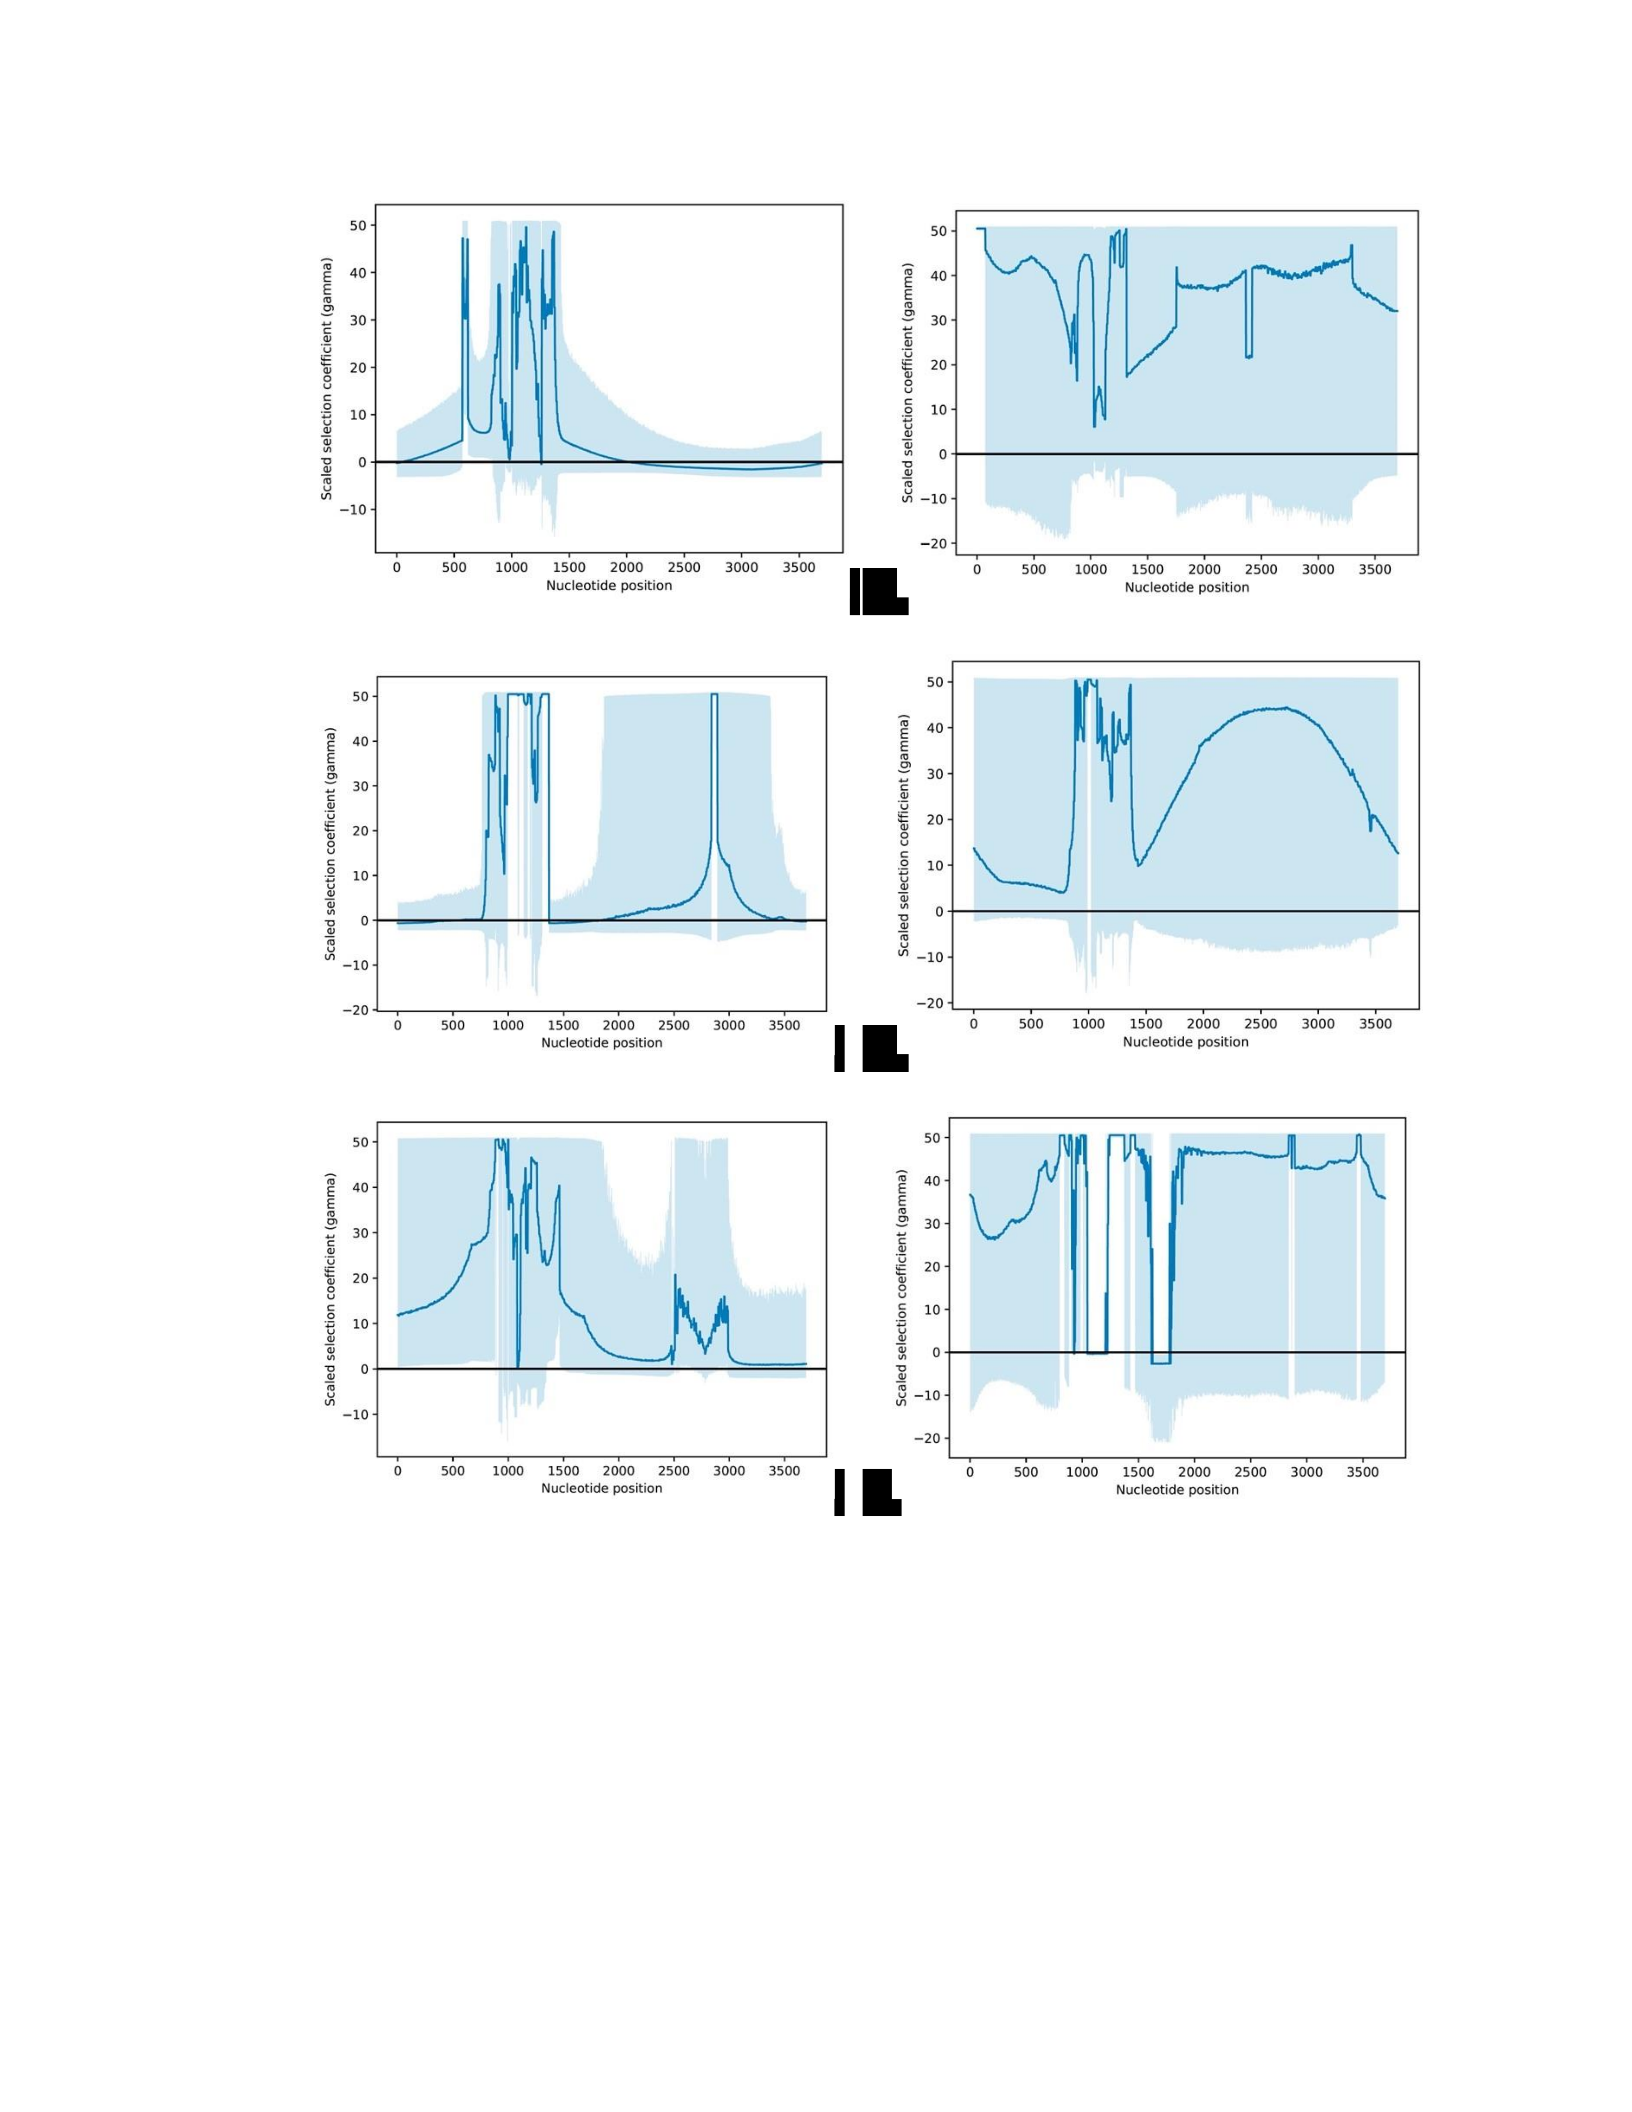
125
a)
c)
e)
Figured 2. Estimate selection intensity (γ, dark blue) and 95% confidence interval (light
blue) across all nucleotides in the APOBR gene in a) grey seal b) monk seals c) elephant
seals d) ringed seals e) Weddell seal f) Miroungini ancestor. The horizontal black line shows
neutrality (i.e. γ = 0). Selection intensities and confidence intervals were estimated through
model-averaging in MASS-PRF.
b)
d)
f)
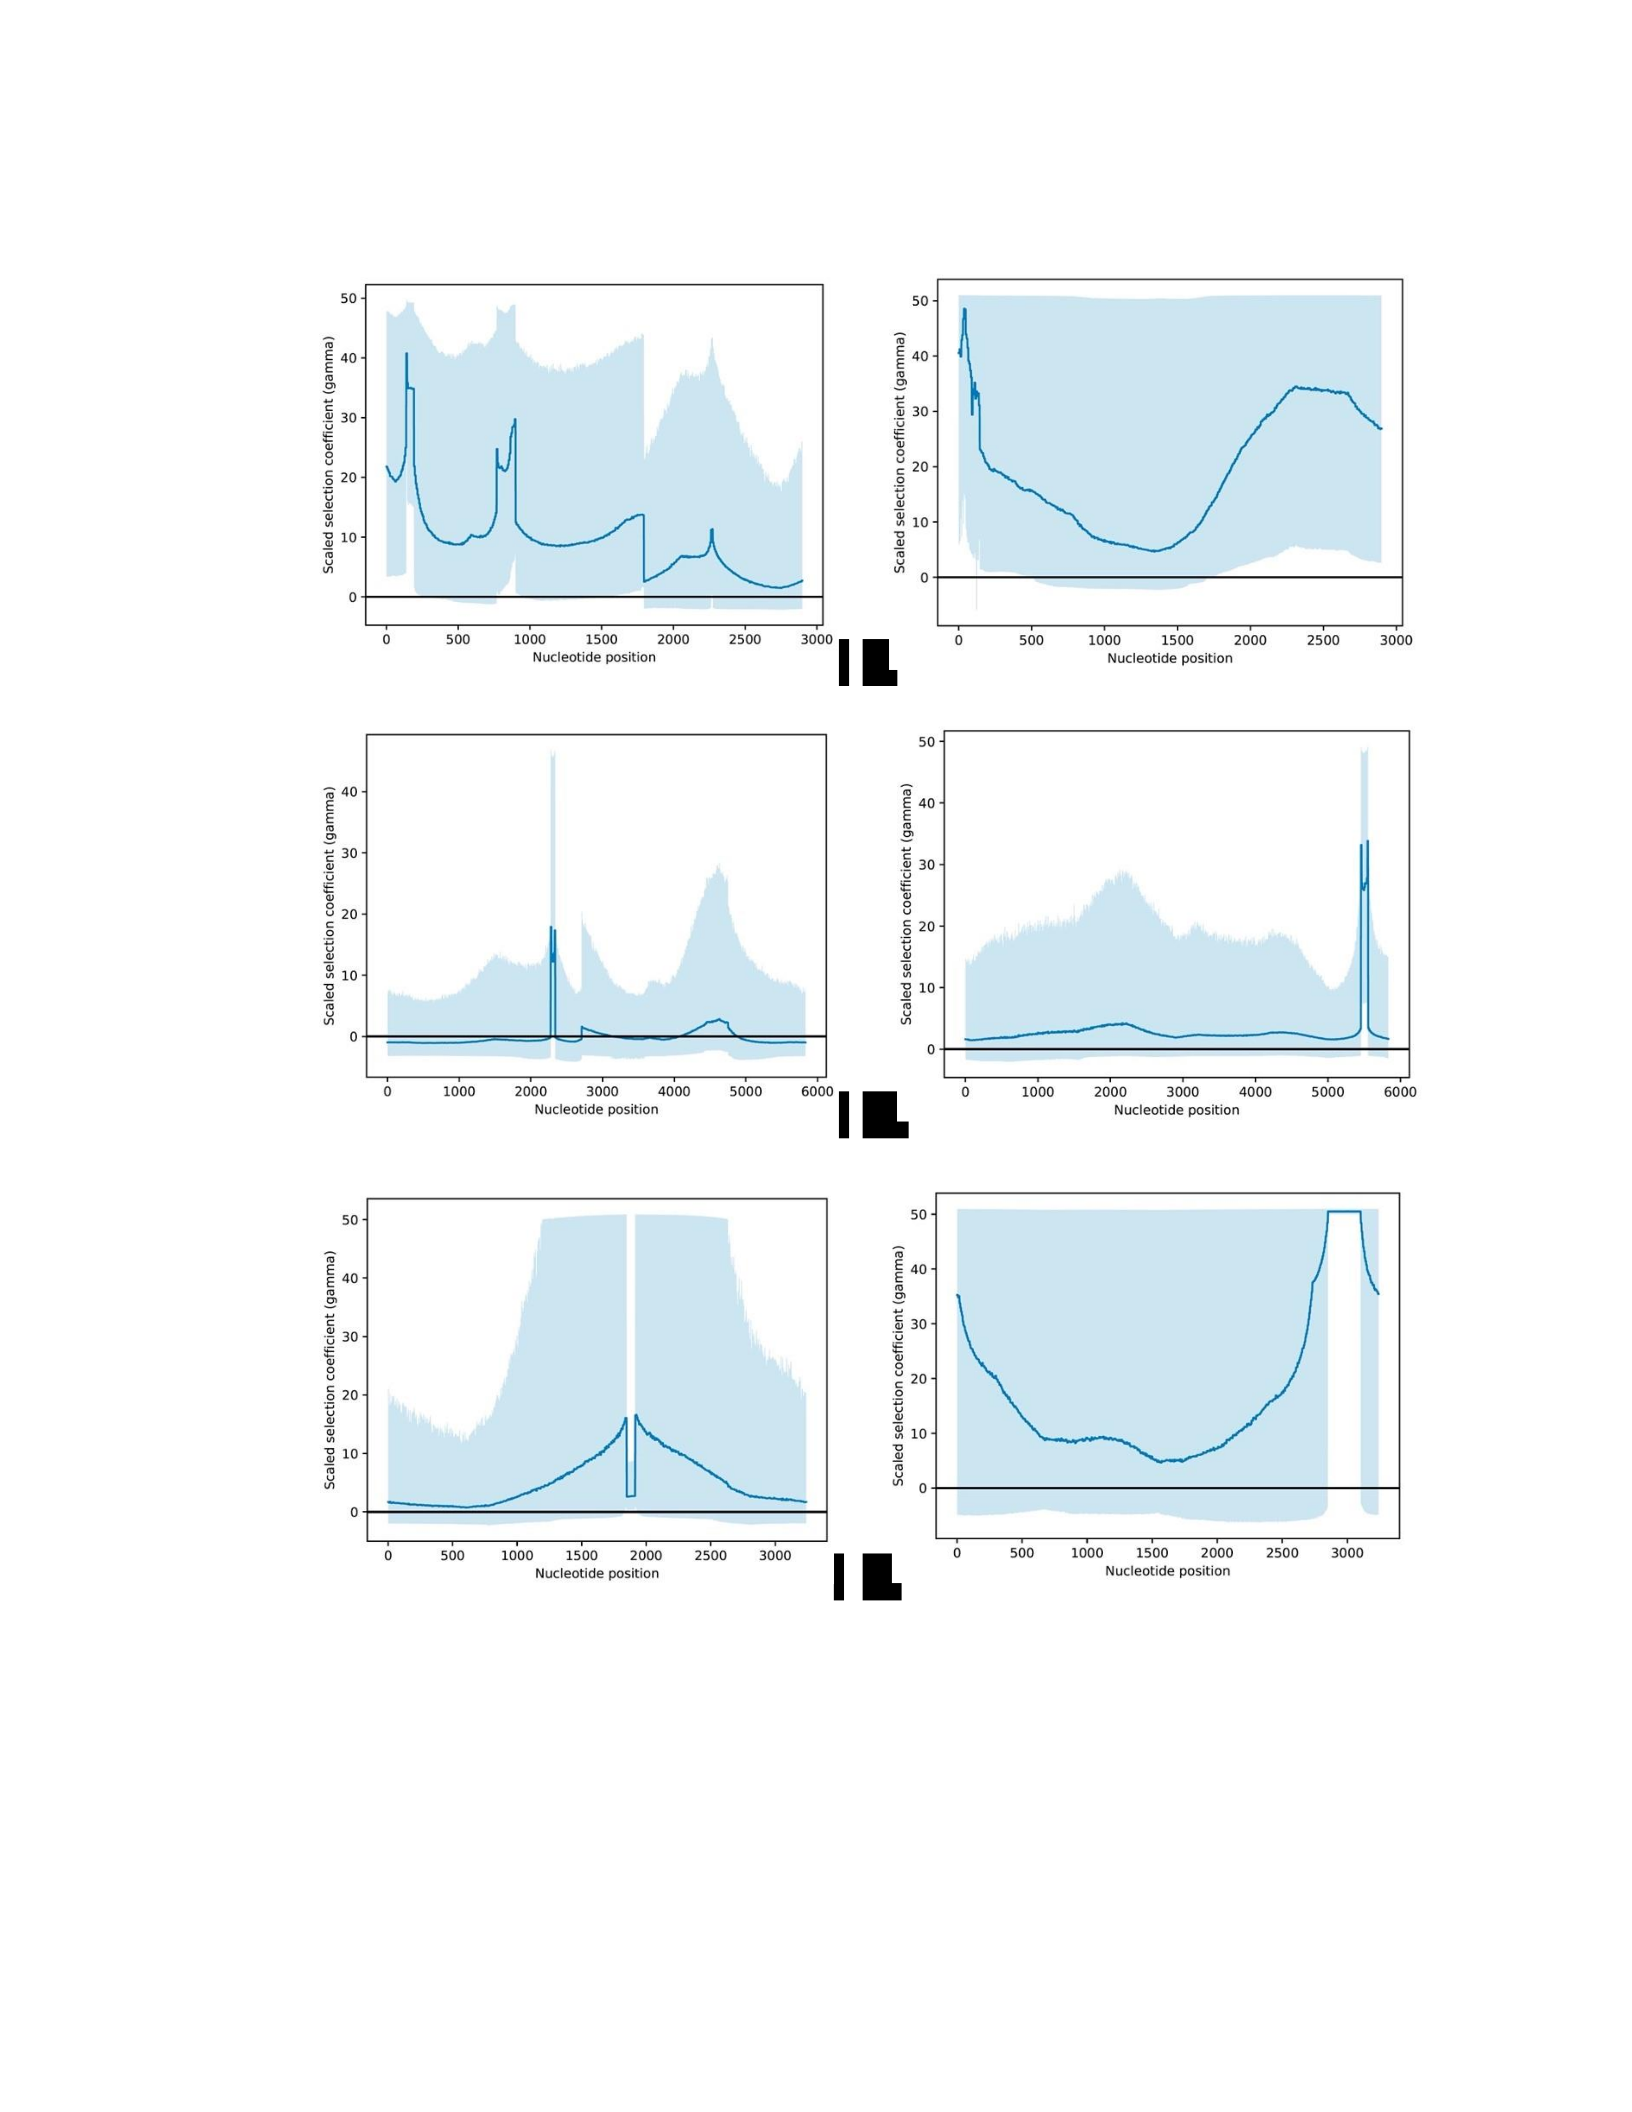
126
a)
c)
e)
b)
d)
f)
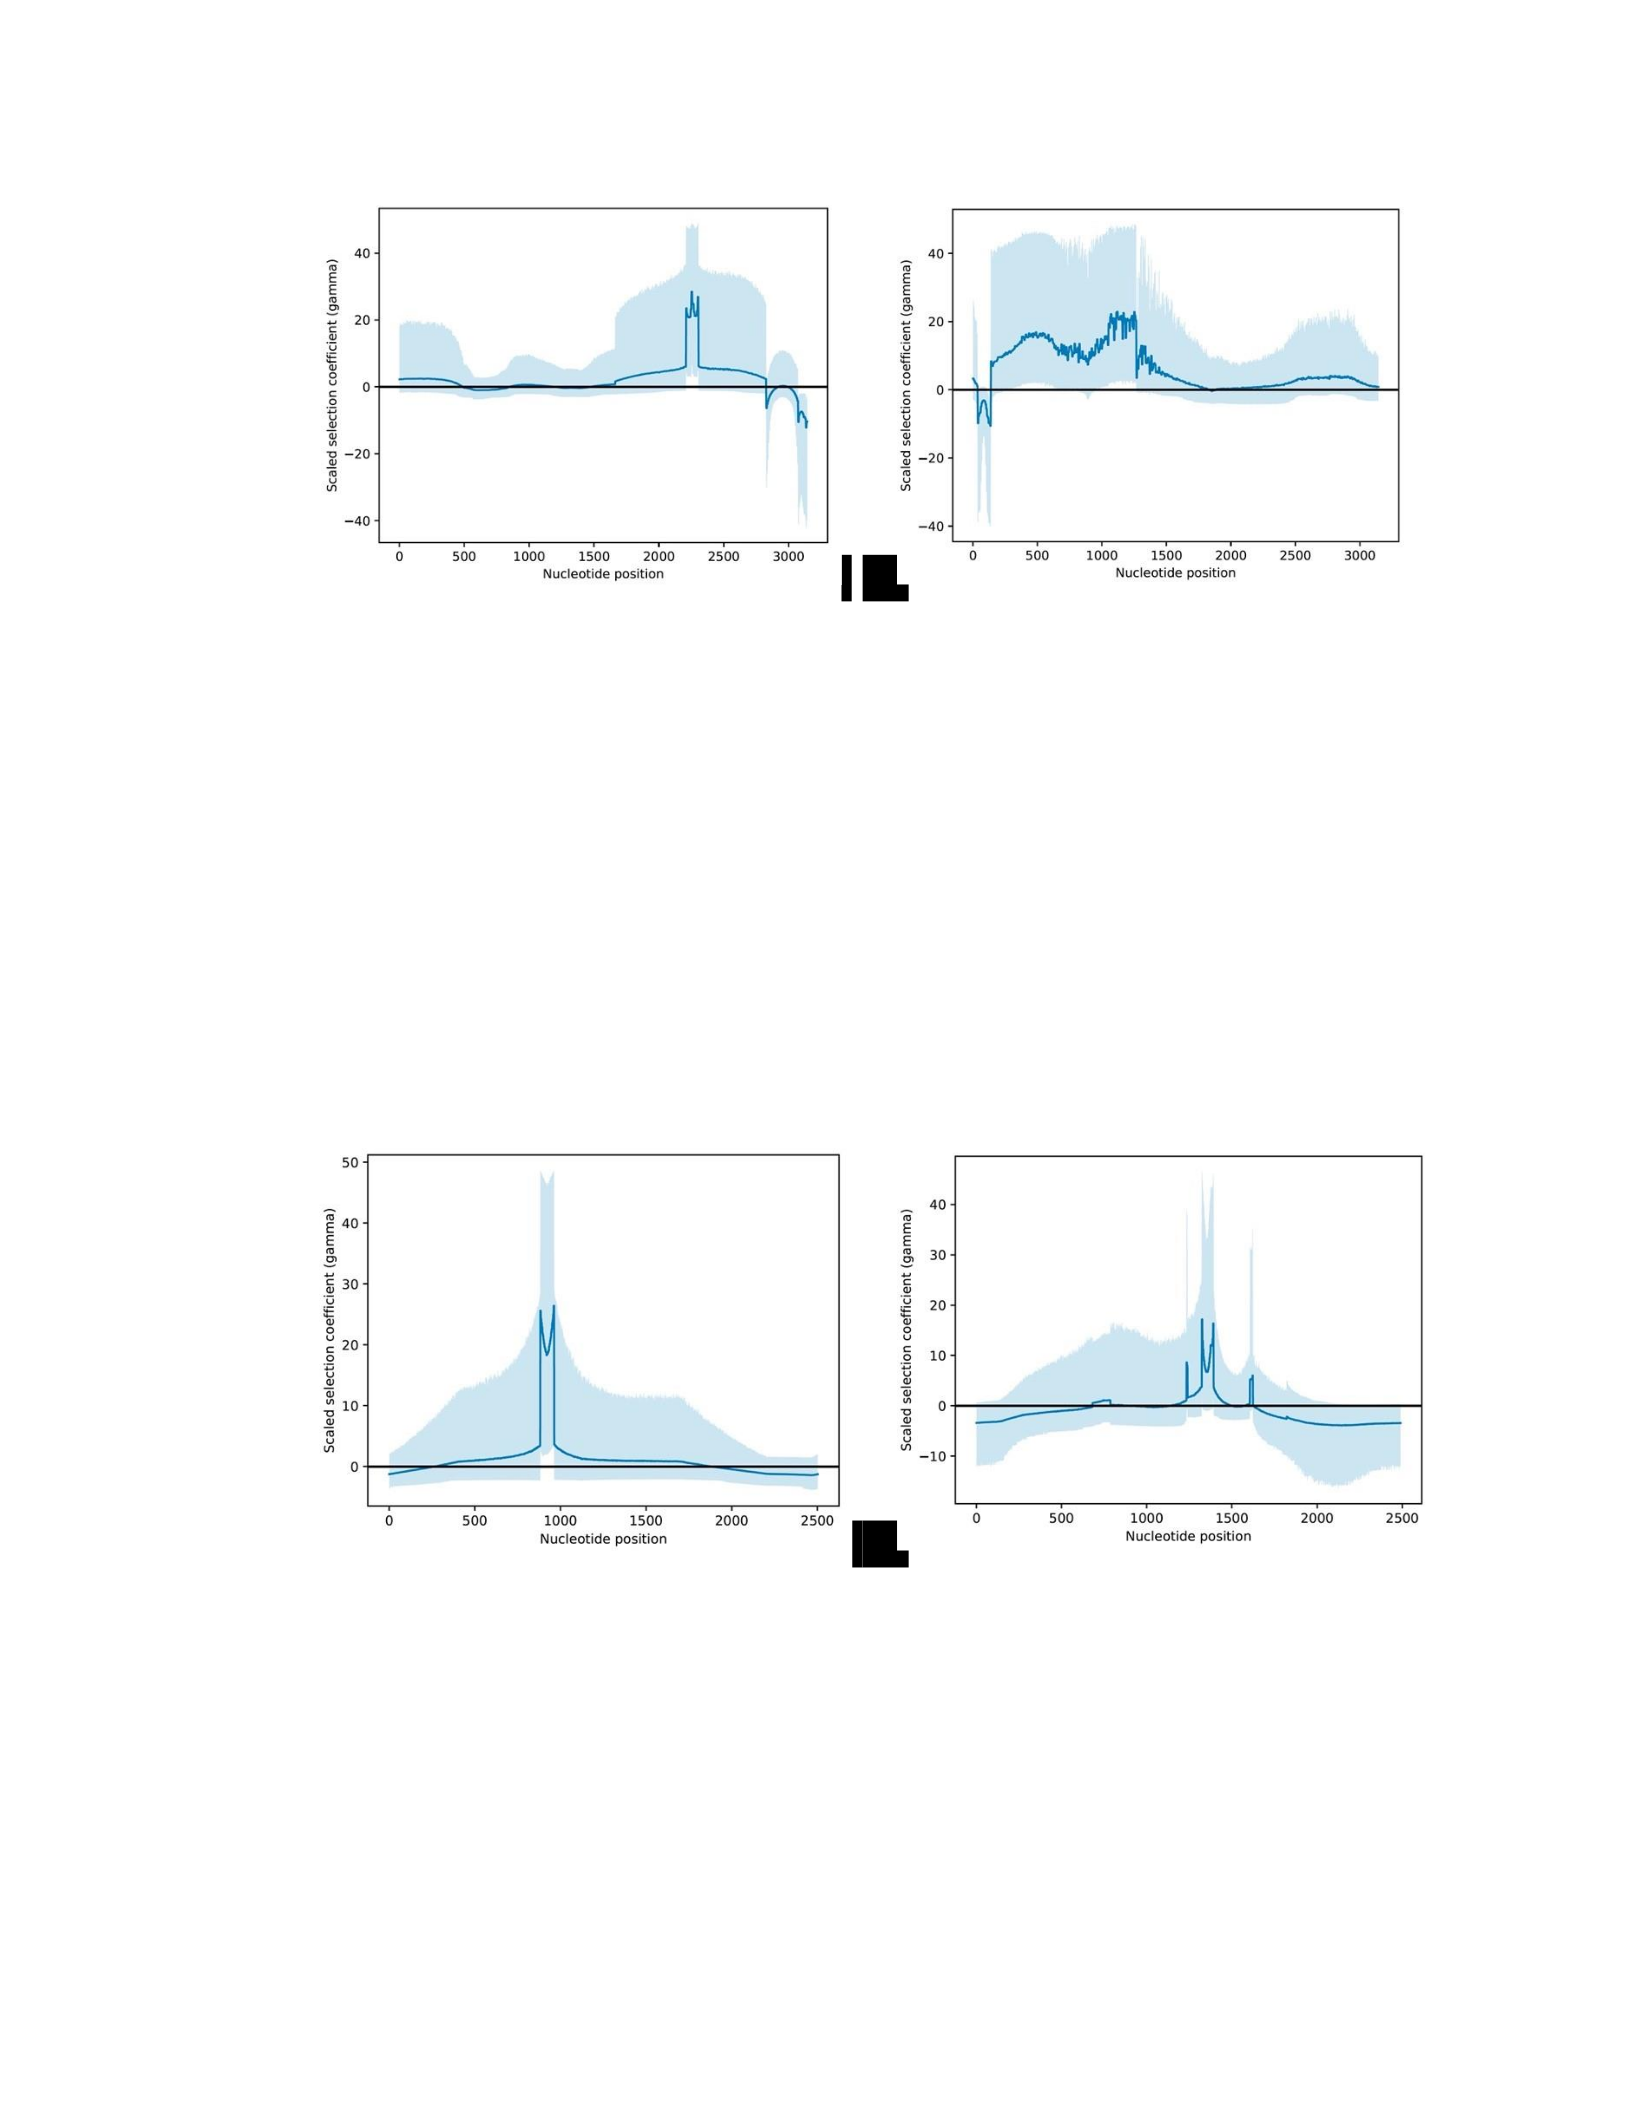
127
g)
Figure 3. Estimate selection intensity (γ, dark blue) and 95% confidence interval (light
blue) across the ANPEP gene in a) elephant seals b) Weddell seal; the MYH7B gene in c)
elephant seals d) Weddell seal; the CARD6 in e) elephant seals and f) Weddell seal; and the
CARD14 in g) elephant seals and h) Weddell seal. The horizontal black line shows
neutrality (i.e. γ = 0). Selection intensities and confidence intervals were estimated through
model-averaging in MASS-PRF.
a)
Figure 4. Estimate selection intensity (γ, dark blue) and 95% confidence interval (light
blue) across the a) TLR4 and b) TLR5 genes in the Saimaa ringed seal. The horizontal black
line shows neutrality (i.e. γ = 0). Selection intensities and confidence intervals were
estimated through model-averaging in MASS-PRF.
h)
b)
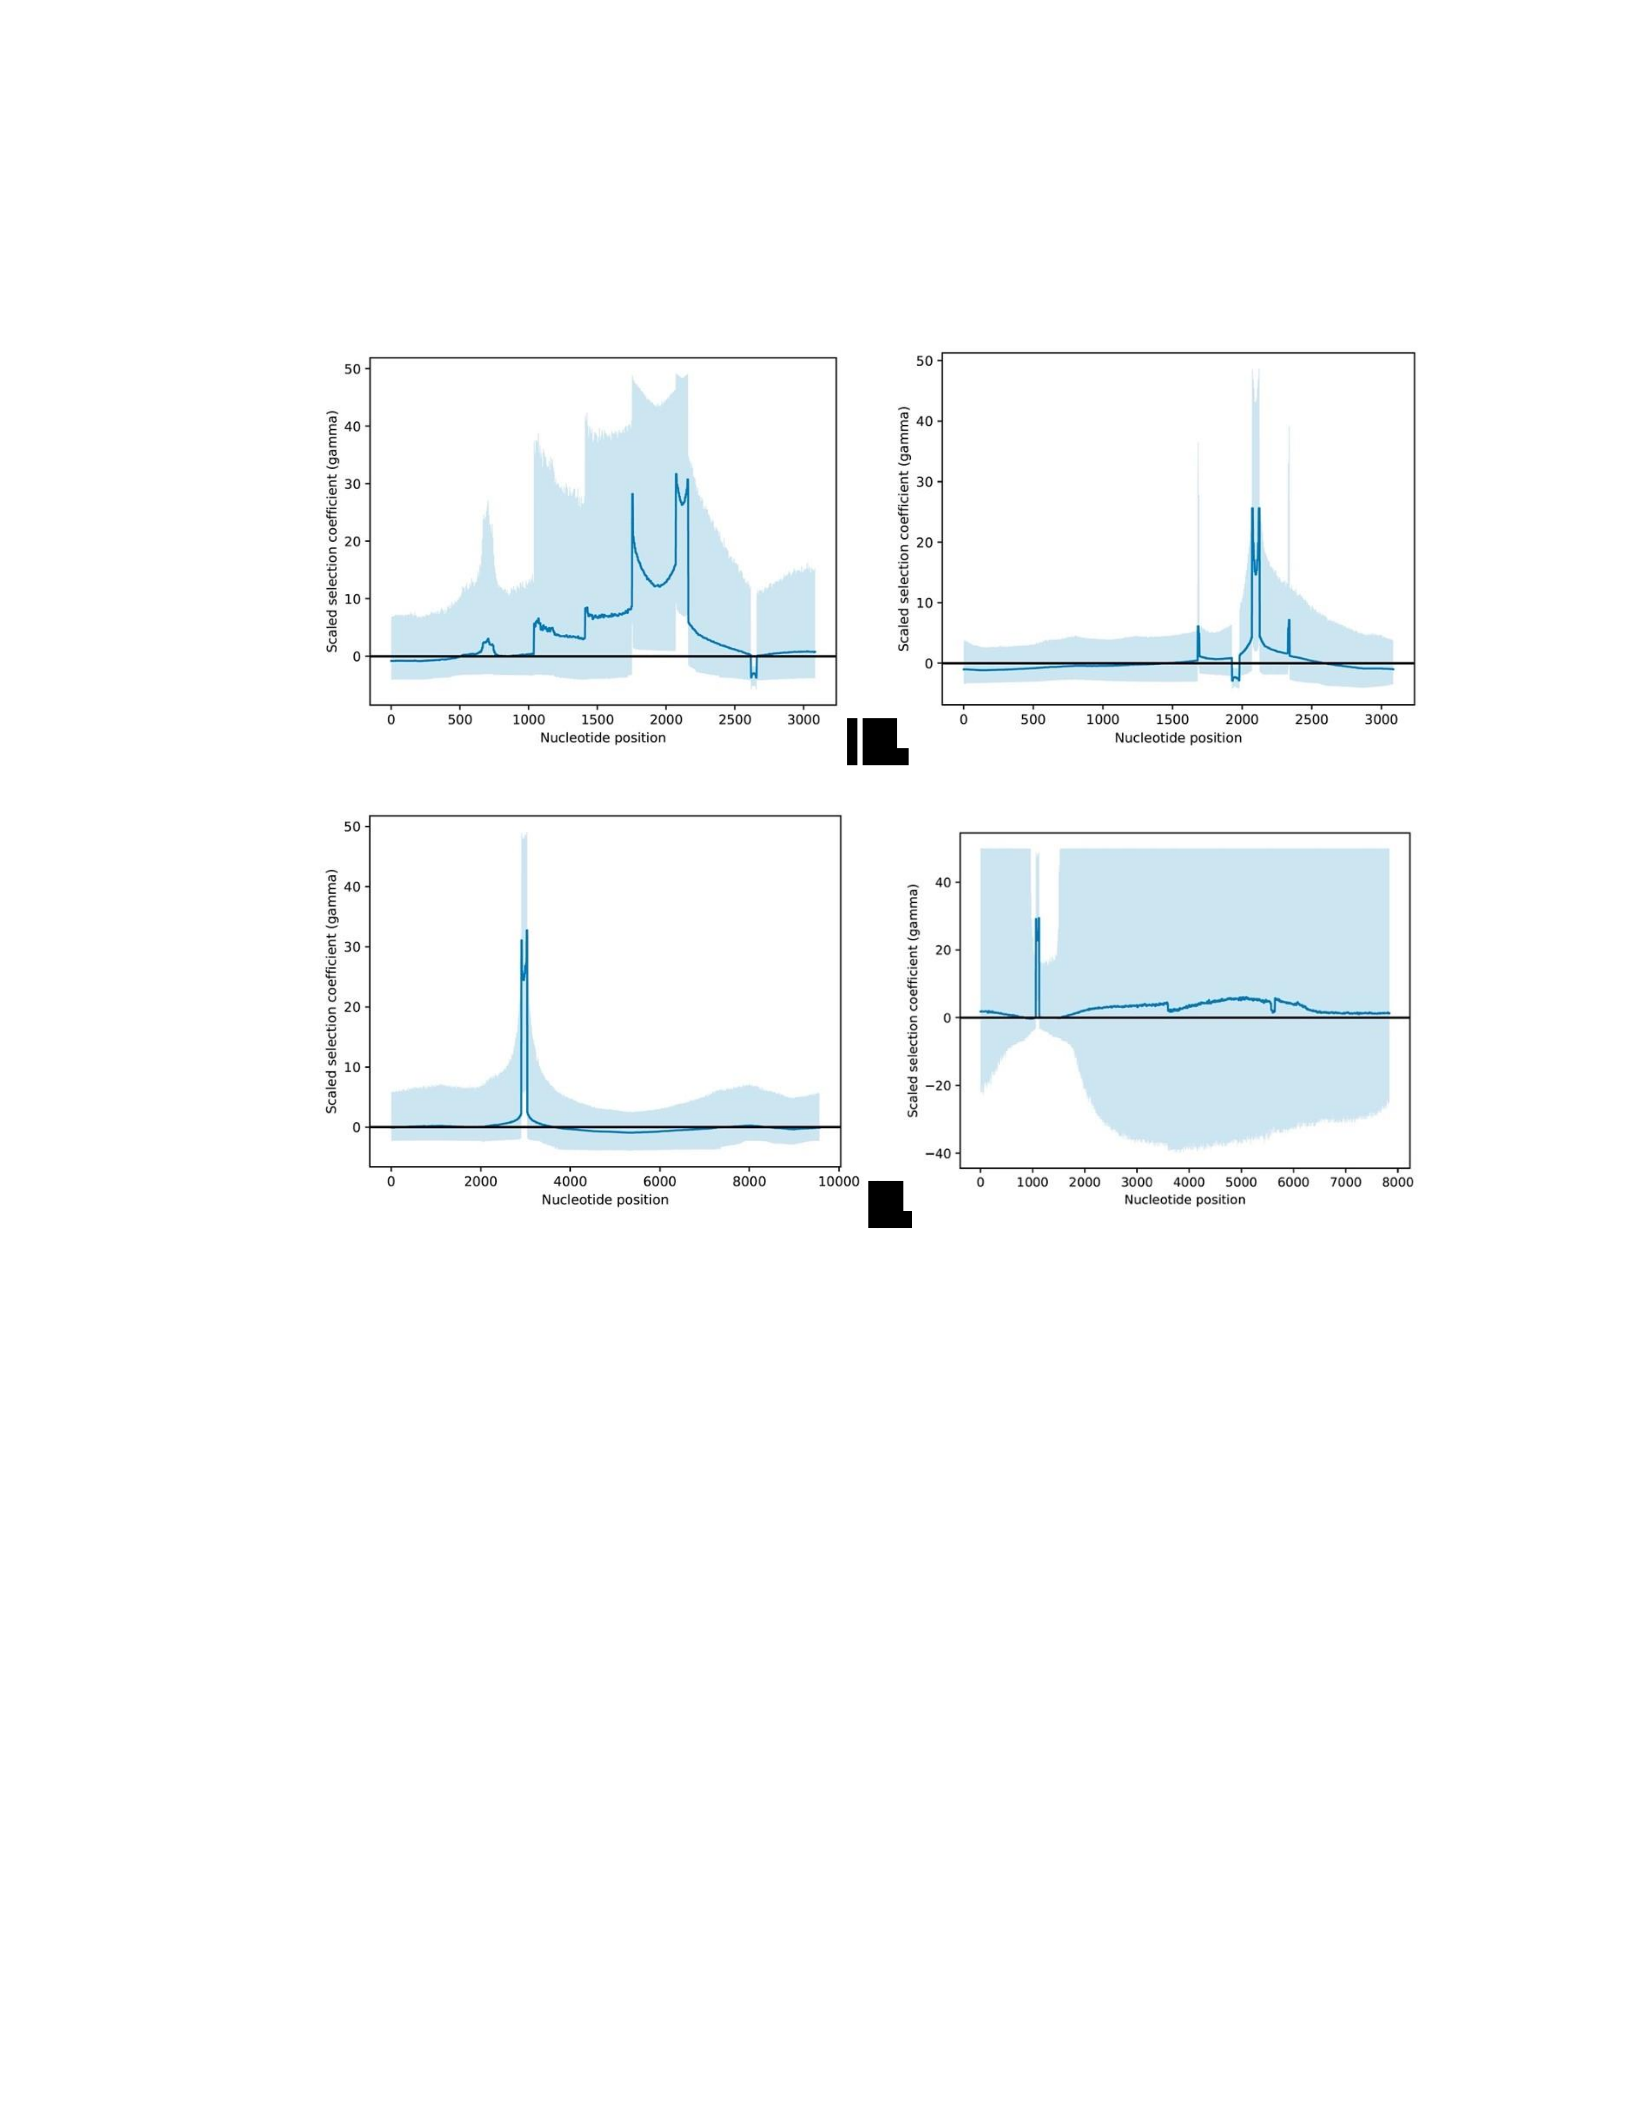
128
a)
c)
Figure 5. Estimate selection intensity (γ, dark blue) and 95% confidence interval (light
blue) across selected collagen genes in phocid seals. a) COL6A1 in monk seals b) COL6A1
in elephant seals c) COL6A3 in the Weddell seal d) COL6A5 in ringed seals. The horizontal
black line shows neutrality (i.e. γ = 0). Selection intensities and confidence intervals were
estimated through model-averaging in MASS-PRF.
b)
d)

129
Branch number
(Fig. 1)
Taxon name
Estimated length of
branch in years
1
Monk seals
1.7 million years
2
Miroungini ancestor
1.2 million years
3
Weddell seal
6.88 million years
4
Elephant seals
6.88 million years
5
Grey seal
2.0 million years
6
Ringed seal (species)
2.0 million years
7
Baltic ringed seal (ssp.)
100,000 years
8
Saimaa ringed seal (ssp.)
100,000 years
Table 1. Lineages examined in this study, as shown in Figure 1. Branch lengths are taken
from Fulton & Strobeck (2010) (monk seals, Miroungini, Weddell seal, elephant seals, grey
seal, ringed seals) or from Chapter 1 of this dissertation (Baltic ringed seal, Saimaa ringed
seal).
Adaptation
Lineages
Excluded
lineages
Overlapping genes (excluding outgroup)
Polar
environment
Weddell seal
Ringed seals
Elephant seals
Monk seals
Grey seal
ALX4, ARHGEF5, COL27A1, COL6A5,
CRYBG2, EGF, ELP1, IRS2, ITGA1, KMT2E,
MAML2, MFSD9, MYO15A, NOC4L, TNC,
WDR27
Warm water
Monk seals
Weddell seal
Elephant seal
Grey seal
Ringed seals
ALDH1B1, CCDC30, CD5, CDH19, DNAH14,
DVL3, FAM135B, GGT6, GRIN2C, IGSF9,
JAG2, KIF26B, LAMC2, LATS2, N4BP2L2,
NFKB1, NLRP5, NOBOX, OAS3, PDGFD,
PPIP5K1, PPP6R1, PRAG1, PRR14, RNF114,
RPS23, SCN10A, SLC6A18, SNAP23, TFB2M,
TOP3A, UGGT2, UTRN, ZBTB44, ZIC3,
ZNF318, ZNF451
Polygyny and
sexual
dimorphism
Elephant
seals Grey
seal
Weddell seal
Monk seal
Ringed seals
ADAMTS18, CELSR3, CNTNAP4, COL18A1,
DNAH7, DNAH9, DOPEY2, F5, FAM186A,
GPR132, GPR179, HEG1, MDC1, PEX1,
PKHD1L1, PTPN21, SEC16B, SEMA4D, SLX4,
SVIL, TTLL4, ZBED4

130
Deep diving
Weddell seals
Elephant seals
Monk seals
Grey seals
Ringed seals
ABCA7, ABCB4, ADAMTS16, AGRN, ANPEP,
ARMCX4, ASB10, ATP13A2, BDP1, BOD1L1,
BRAT1, C5, CACNA1I, CARD14, CARD6,
CARMIL3, CCDC114, CDH1, CDON, CEL,
CELSR2, CEMIP, CNGB1, COL6A6, CORIN,
CUL7, CWF19L2, DIAPH1, DIAPH3, DIDO1,
DNAH6, DSEL, DSG3, EFCAB8, EIF2AK4,
ERMP1, ESPL1, EVPL, EXPH5, FAM198A,
FASN, FAT1, FBF1, FBXL13, FMN1, GUCY2D,
HELZ2, HERC6, HJURP, HPX, IGF2R, IL3RA,
INPP5F, IQGAP3, ITGA6, KANK1, KIAA0753,
KIAA1549, KIAA1549L, KIF13A, KIF26A,
KMT2A, LNX1, LTF, MCM9, MCPH1, MROH1,
MTUS2, MYH7B, NCKAP5, NFASC, NWD1,
OTOL1, PAPPA2, PARP14, PATJ, PER2,
PLEKHG1, PLEKHH2, PLXNB2, PML, POLE,
POLR1A, POLRMT, PPP1R9A, PPP6R2,
PTPN13, PTPN23, PTPRN2, QSOX2,
RAB11FIP5, RAD51AP2, RELN, REV3L,
REXO1, RIF1, RNH1, ROBO4, RRBP1, RTL9,
SALL3, SCN5A, SEL1L3, SEMA4B, SH3TC1,
SI, SIPA1L3, SLIT3, SNAPC4, SPPL2B,
SREBF1, STK36, STRC, SYNM, TBCD,
TCHHL1, TDRD1, TEP1, THAP3, TIAM1, TJP2,
TOGARAM1, TOGARAM2, TRIM66, TRPC3,
TRPM6, TSHZ2, TSHZ3, TTBK1, TTC3, TTI2,
USP16, USP42, UTP20, VCAN, WDR81, WNK1,
ZBTB24, ZFPM1, ZNF316, ZNF462, ZNF541,
ZNF582, ZNF592, ZNF646, ZNF804A
Out-of-
thetropics
Weddell seal
Elephant
seals Grey
seal
Ringed seals
Monk seals
ADGRG4, MKI67, QRICH2
Phocid-
specific trait
Monk seals
Weddell seal
Elephant
seals Grey
seal
Ringed seals
None
APOBR, TEX15, TNN
Table 2. Adaptive traits or conditions that are found in some branches of the phocid
phylogeny but not others. Genes showing positive selection in the lineage(s) with the trait
but not showing positive selection in other lineages.

131
Supplemental Material
Monachini
ZNF318, COL6A1, DOCK1, NOTCH1, MAMLD1, PCNT, LAMC2, SDK1, ZIC3,
CDH19, CCDC30, PAPLN, ANKRD24, COL6A3, TMC5, TEX15, PLCH2, WDR97,
TG, UGGT2, IQSEC3, PRAG1, PPIP5K1, ABL1, SNAP23, FHOD3, FAT3, HIVEP1,
N4BP2L2, NISCH, MADD, RPS23, ABTB2, MYT1, UTRN, GAK, ALPK2, DNAH11,
FAM135B, ITGAL, DVL3, NPHP4, CD5, AHCTF1, NRDE2, PDGFD, CEP290,
SLC6A18, NOTCH4, URB1, NLRP5, PPM1F, IGSF9, STAB1, DNAH14, ATP7B,
PKD1, OAS3, ERICH3, PRR14, NOBOX, FYCO1, SCN10A, ZDBF2, ZBTB44,
COBLL1, RPGRIP1, GGT6, ZCCHC6, TNN, KIAA1671, PRUNE2, OTOG, ZNF407,
FAM83G, PPP6R1, ADAMTS12, KNL1, ABCA13, KIAA2012, NPC1, ALDH1B1,
DSG2, ASH1L, SEC16A, PKDREJ, ZAN, JAG2, GRIN2C, ACAN, WNK2, SDK2,
RIPOR1, ADAD2, LATS2, FHDC1, TFB2M, TOP3A, MISP, ZNF451, KIF26B,
NFKB1, ASXL3, POM121L2, ZNF236, CEP170B, RNF114, APOBR, IL4R
Miroungini
ancestor
ZC3H4, TMEM132C, GPBAR1, FGA, SORBS1, PCNT, SPEG, PIGR, ATP1A4,
NEDD4, SDK1, TACC2, DNMBP, MYO18B, URGCP, MYO15B, ZNF592, AK9,
NHSL2, SNED1, AATK, DDX58, TMEM131, COL6A3, GLI2, GFY, BOD1L1,
MROH1, SEC23IP, SLC12A8, TEX15, DEGS2, MYO16, HSPG2, TMC6, KIF24,
FAM111A, ARHGEF11, TRPM7, FMN1, NWD1, PKD1L3, RFWD3, ANKLE2,
ANK3, IMPG1, LAMA2, ARHGAP39, SNAP23, QRICH2, ZHX3, FHOD3, RUSC2,
SLX4, WDR62, KRT15, PBXIP1, KIAA1549, MADD, TMEM235, ABCA7, ESYT1,
MAP3K19, COL5A2, JAK3, PATJ, COL3A1, CASKIN2, PPFIA4, MGAT1, PTPRJ,
TBRG4, HELZ2, ZCCHC14, MAML3, CUL9, LOXHD1, AHCTF1, CRYBG2,
KIAA1211L, MUC1, ABI3BP, AKAP11, FRMD8, CEP290, CDH23, TTLL4,
PLEKHG3, PCM1, UMODL1, NHSL1, POLRMT, MIA3, NOM1, ADAR, SPG11,
DNAH9, PCNX2, ARMCX4, FNDC1, IQSEC1, FN1, VWDE, NYNRIN, RTTN,
KIAA1551, ATP7B, PCDH12, SETD2, MRGPRG, ICE2, ROS1, CEP250, MROH2A,
MKI67, MEGF6, AKAP6, PRUNE2, AKAP13, FBLN2, OTOG, ZNF407, CELSR1,
GOLGA3, MPDZ, DCHS2, CACNA1H, CUX2, KIAA0556, CFAP44, ADAMTS13,
ARHGAP29, PDE3B, COL6A5, WDFY4, PALB2, MYO15A, ALPK3, DISP1,
DNAH17, PCLO, TEP1, SEC16A, PKDREJ, PKHD1L1, TICRR, SPPL2C, PTPRZ1,
SV2C, GPR149, ABCA2, PALM3, KMT2C, WNK2, COL17A1, AKNA, WDR27,
FASTKD3, USP35, SERPINF2, TMC3, ASPM, TRPM4, KMT5B, KANK4, TLDC1,
TNS1, PLIN4, POM121L2, DNHD1, ZNF236, CEP170B, DNAH6, CARD14, MTMR3,
MYOM1, RBM44, ABCB11, GLI3, CACNA1E, APOBR, PARP14, MROH2B, ICE1,
PTPRN2, COL18A1, SLC44A4, TBC1D9B, TDRD6, ZNF804A, LRRIQ1, OTOL1

132
Weddell
CATSPER2, PPP1R9A, IRS4, HJURP, NES, EPHA1, CUL7, FGA, APOH, P3H1,
ADRA1A, VPS13C, USP36, MAP4, DOCK1, NOTCH1, KCNT1, IRS1, PLEKHG1,
POLE, SNAPC4, SORBS1, FRAS1, PTPRB, MAMLD1, TBC1D2, ZSCAN26,
NUP210L, RIMBP2, RAB11FIP5, PCNT, MAML2, CCDC129, ELP1, ESPL1, CTBP2,
CDH17, NFE2L3, RTN4, SLC22A1, SPEG, IL12RB2, RIN3, ITGA6, BSN, TBC1D2B,
GTDC1, ALDH9A1, ATP1A4, MAP2, ASIC4, SIPA1L3, SBNO2, TTC3, PLEKHM2,
TMPRSS9, TACC2, ABCC2, KRBA1, GNPTAB, UBA7, FRYL, SFI1, CHRNA3,
LNX1, SUN1, TP73, ZNF592, WNK3, HPX, ZNF582, SRRM2, RBBP8NL, PLEKHH2,
KIF26A, RELN, CCDC13, STK36, DUOX2, TUSC5, PHF3, ZBTB24, EPHX2, BDP1,
TMPRSS2, ADCY6, ALS2, SREBF1, BBS10, NLRP6, ATP13A4, POLR1A, ZFPM1,
ROBO3, SLC37A2, BRAT1, ANGPTL8, COL6A3, TRIM68, GLI2, BOD1L1,
KLHDC7A, MROH1, CDON, SULF1, IRAK3, MCPH1, FAM161B, SGPP2, TEX15,
FKBP15, CCDC151, OTOA, ATP8B1, AFF1, HSPG2, THSD7A, RBBP6, P2RX7,
FREM2, ROBO4, RMI1, FANCA, GRASP, KMT2E, PYGL, SHROOM4, MPHOSPH9,
PLA2G6, NCKAP5, SH3TC1, VWA5B2, FMN1, NWD1, WDR81, IQSEC3, CC2D2B,
TIAM1, GUCY2D, TTBK1, ZFHX2, TTF2, CSMD2, FAT1, ANK3, SNTG2,
CACNA1I, MYH14, SEC24A, SYTL3, PTPRF, IGF2R, PHLDB2, WDR6, BRCA1,
ARAP1, MMP8, GPR20, ASB10, TSPAN1, ZNF536, ALOX15B, LRBA, RTL9, FAT2,
CDH1, VWA7, FBRSL1, DIAPH1, QRICH2, COL20A1, GPRIN2, FBXO18, THBS2,

133
HIVEP1, QSOX2, PROSER3, WDR62, LRP4, SYNJ2, THAP3, NLRP3, GPR35,
KRT15, NRK, CENPE, ANO7, MZF1, WDR19, SLC16A1, FLNA, DCDC2C, PBXIP1,
MYBBP1A, TTI2, KIAA1549, RSF1, COL28A1, NISCH, MADD, NEK1, PER3,
SLC45A4, EMC1, TBCD, CCDC57, PCDH15, ABCA7, CD177, DISP3, FER1L6,
PTPN23, PLEKHA7, DSG3, DNER, SPPL2B, LMO7, ITGAX, KIAA0753, ZNF541,
EXPH5, ZC3H3, MEI1, PATJ, PPL, INPP5F, LAMB3, ADAMTSL3, DNAH11,
USP43, WRN, DNAJC6, ZNF608, KIAA1549L, MLXIP, IL3RA, PTPRJ, TBRG4,
SLC14A2, HELZ2, TARBP1, MCTP2, FAAP100, IRS2, TDRD1, LTBP3, COL5A3,
MFSD9, GRK4, MAML3, HS1BP3, ITGAL, ARHGEF5, SEC24B, CCDC177, AEN,
NPHP4, CUL9, DSEL, TRPA1, SYCP2L, AHCTF1, NOC4L, PAPPA, NLRC5,
CRYBG2, CEP295, ECM2, ALDH3A1, SEMA5A, CARMIL3, CEL, CERKL, NRDE2,
BUB1, SRRD, OSGIN1, CEP290, CCDC88C, NFATC1, NOTCH4, TOGARAM2,
AP3B2, BCL9L, WFS1, RAD51AP2, SAMD15, SI, FASN, URB1, PCM1, AGRN,
ACACB, ADCY10, ATP8B3, RAB44, SSC5D, LRP1B, TRPM6, COL27A1, POLRMT,
CCDC8, MIA3, NOM1, SPG11, PCSK5, LAMA5, ST14, COL6A6, RIF1, PRRC2A,
PPM1F, EAF1, ARMCX4, RNF180, ADGRL2, PDE3A, IQSEC1, ASPSCR1, ITGA11,
STAB1, EIF2AK4, VWA3B, NYNRIN, RTTN, TNIP1, KIAA1755, FNIP2, GPRIN1,
ATP7B, ARMCX2, SLC38A10, CYLC1, PPP1R13B, NLRP14, IQGAP3,
TOGARAM1, HENMT1, PUM3, AP5B1, ADCY4, MFSD6L, USPL1, ATP2A3,
RRBP1, FHAD1, MRGPRG, PLCG2, SEL1L3, FHOD1, CORIN, GGN, SETD1B,
HERC6, BAIAP2L2, HTRA4, CNGB1, TJP2, HRC, ERMP1, INSRR, FAM196A,
SCN4A, BRD4, SLIT3, LAMB1, IL1R1, HEATR5A, FYCO1, CEMIP, PPP6R2,
DDX51, EFCAB5, FLNB, MKI67, DCLRE1C, LTF, SYCP2, H6PD, CIZ1, MEGF6,
ABCA1, ADAMTS16, COL15A1, SCN9A, FAM198A, CASS4, IGSF5, SCRIB,
COBLL1, CORO2A, TSPAN15, ZNF462, RPGRIP1, ZBTB40, FBF1, HFE, TRIM66,
ZCCHC6, FAM234B, TNN, LTBP4, KIAA1671, STRC, PRUNE2, AKAP13, CHRNE,
PAPPA2, FUT4, NCAN, OTOG, RNF207, ZNF407, ADGRG4, FAM83G, USF3, BOC,
MPDZ, DCHS2, CARD6, CACNA1H, RP1, CDH15, C5, RAI1, ANK2, EFCAB6,
BPTF, ELP2, ADAMTS12, TEX14, KNL1, ABCA13, PLD4, USP42, PIK3C2G,
ARHGAP29, ADGRF1, USP16, PER2, KIAA2012, PLXNB2, CAMSAP1, ADGRF3,
GNAS, COL6A5, NPC1, PCNX1, RBSN, TENM1, HEATR1, CHD7, ANKAR, PRRT4,
TTC24, KIF13A, DOCK4, MYO15A, BCAN, NID2, RRP1B, CWF19L2, ITGA1,
SLC26A6, MCM9, DISP1, MTUS2, ABCC8, TAS1R3, DNAH17, ADCY1, SLC39A12,
KMT2A, PCLO, INPPL1, DSG2, DSP, TRPC3, ASH1L, THSD4, TEP1, CDC42BPG,
SEC16A, C2CD3, ZAN, NBEAL2, FAM193A, AMOTL2, TCHHL1, SPEF2, ANO2,
PLEKHG2, MYH7B, SEMA4B, EFCAB8, GRIN3A, HRH4, PIMREG, REV3L,
PTPRZ1, DIDO1, PTPN13, ACAN, PLEKHA6, MYBPC3, PALM3, WNK2, CLCA2,
MYO9B, DDI1, ZNF646, ABCB4, THSD1, EGFLAM, RNH1, ESYT3, ZNF316,
PLCE1, SDK2, RNF19B, ANLN, FRMPD1, RIPOR1, VWA8, PRX, CENPJ, WDR27,
TMEM132E, CHRNA4, ATP8B2, TUBGCP6, UTP20, NAT10, EVPL, SETX, VASN,
ACOX3, AGT, FHDC1, DIAPH3, TENM2, KIF18B, TECPR1, STARD13, HYOU1,
TSHZ3, SYNM, HIPK3, WNK1, SCEL, PLB1, MYH15, ALX4, EGF, FAM114A1,
MICALL1, ZHX2, TEX45, ANPEP, TNC, CC2D1A, ATP13A2, WFIKKN2, AP5Z1,
MTTP, POM121L2, KANK1, CCDC114, LPIN3, ARHGEF10L, PNPLA7, CDSN,
TRIP11, DNHD1, ZNF236, CEP162, CEP170B, TTC6, SALL3, TPBG, VCAN,
DNAH6, SLC24A2, PML, LAD1, CARD14, NFASC, RBM20, ZFYVE16, THEMIS2,
CFAP65, ITGA2, FBXL13, TMTC1, APOBR, PARP14, AP3D1, CELSR2, ZNF786,
PTPRN2, RHPN1, TSHZ2, KIAA1217, MMP21, TELO2, ZNF804A, WHAMM,
SCN5A, REXO1, IL4R, SGSM2, AKAP12, OTOL1

134
Elephant
seals
ZC3H4, VRTN, PPP1R9A, CDK5RAP2, USP24, FRMPD3, ADAMTS14, TOP2A,
YBX3, HJURP, ACOX2, CUL7, CSF3R, ATG2A, GRTP1, SYNPO, FAM110C,
COL6A1, SEC31B, LIMD1, PLEKHG1, CACNA1F, SHANK2, POLE, ADGRG7,
SNAPC4, SLC23A3, FAM71A, TJP3, DCLRE1A, DACT2, RAB11FIP5, NRXN2,
HDAC10, PNPLA1, ESPL1, MKL2, PEX10, STOX1, LRRN4, FER1L5, ITGA6, BSN,
TBC1D2B, ZFHX3, DOPEY2, IPO4, CADPS2, CDC42BPB, NPHS1, MYLK2,
DHX57, SASH1, SIPA1L3, TTC3, ZNF532, TANC1, PYROXD2, LAYN, MYO18B,

135
CFAP54, WWP1, DOCK8, LAT, MYO15B, EPHA10, CPD, GPR132, LNX1,
SEMA4D, XPC, ZNF592, CNTRL, FOXRED1, MEGF8, NHSL2, USP26, HPX,
ZNF582, SRRM2, MROH6, ELMO3, PLEKHH2, KIF26A, ALKBH8, GTSE1, RELN,
PAPLN, ANKRD24, HIP1R, SHANK1, DSC3, ANKRD12, STK36, ZBTB24, BDP1,
DGKZ, PLEKHH1, PIEZO1, DMRT3, SPECC1, USP47, MTMR10, TTC28, AATK,
AGL, WDFY3, ARHGAP22, SREBF1, PTPN14, TSC22D1, CDCP2, ARHGAP21,
GPR50, LAMC1, POLR1A, PTPRU, ZFPM1, BRAT1, IFT172, DLG5, SHROOM3,
PROSER1, TMC5, BOD1L1, CDH3, MROH1, CDON, TNIP3, KLF11, MYO19,
MCPH1, DGKI, TONSL, TEX15, FAM186A, HSPG2, TBRG1, PLCH2, GPR39,
COBL, PRAM1, ATP11A, PPP1R3A, THSD7A, F5, ZCCHC7, ROBO4, KIF24,
WDR97, FAM111A, FKBP4, DOT1L, DRC1, PAXIP1, LMF2, NCKAP5, RALGAPA2,
ADAMTS5, SH3TC1, CFAP57, FMN1, NWD1, WDR81, SPHKAP, CAMTA1,
MAN2A1, TIAM1, MYRFL, GUCY2D, CARMIL1, TTBK1, LTBP1, ABCC4, RBM19,
ZFR2, FAT1, CELSR3, CACNA1I, DLK2, ICAM1, PNPLA5, IGF2R, CCDC185,
GALNT6, CRAT, IAH1, CEP104, ARHGAP17, ASB10, ABL1, TCOF1, TCIRG1,
CACNA1S, FSD2, RTL9, PEX1, PAXX, LSS, TCF3, CDH1, TGM5, HELQ, TRIO,
TDRD5, TBC1D4, DIAPH1, QRICH2, NKAPL, SPRTN, SAMD9L, ZHX3, GARNL3,
FAT3, ZNF292, TDRD12, HIVEP1, SLX4, QSOX2, PPP1R32, TRAPPC12, AGAP1,
WDR62, GPR179, SYNJ2, DUSP27, THAP3, KCNV2, DUOX1, ABCC6, PITPNM1,
PBXIP1, ITGB7, MYBBP1A, MORN1, TTI2, GAPDHS, MAPKBP1, KIAA1549,
MPO, NINL, AEBP1, CAMSAP2, SLC4A1, TRMT44, PER3, CDC20B, TBCD,
SLC24A1, ABCA7, CNTNAP4, ZNF518B, ADGRE5, ARID5B, ELMSAN1, FER1L6,
PHLDA1, PTPN23, INPP5J, ZSCAN12, HIVEP3, DSG3, DSE, SPPL2B, FAM35A,
ARSJ, SWAP70, MYT1, DCLK3, PRRT3, ZNF598, ABCG5, ALDH5A1, FAM83F,
KIAA0753, ZNF541, RECQL4, EXPH5, TNKS1BP1, FAM71B, ZC3H3, ALPK2,
HPS1, TLE6, PATJ, APC2, TTC23, FARP2, INPP5F, CLUH, AMOTL1, LAMB3,
CASKIN2, MAMDC4, DNAH11, FAM83A, KAT6A, KIAA1549L, TTLL11,
ARFGEF3, NRDC, FMN2, HELB, IRGQ, HECW1, COL1A2, HEG1, IL3RA, PTPRJ,
HTR3B, HELZ2, FBXO34, ZCCHC14, PDIA4, CCDC80, KIAA2026, TDRD1,
ADGRA3, KRT84, NCKIPSD, MAML3, BNC1, AMIGO3, MAP3K6, APBA1, NAV3,
PHF20, ABCA12, PTPRC, CAGE1, PADI4, RPAP1, MAP1A, CUL9, KIF15, DSEL,
NDUFAF7, KIAA0319, RREB1, TECTA, DNAAF1, PHRF1, DOCK11, NUP214,
FSTL5, ERCC6L, TET2, SIK3, VLDLR, NR1I2, LARS2, TNFRSF25, PDGFRB,
CEP131, ARMC5, RAD51D, AKAP11, FAM221B, SORCS1, CA9, SVEP1,
CARMIL3, CEL, NRDE2, CHRNB1, URB2, XDH, NWD2, MN1, CRTC2, AMBRA1,
CCDC88C, SHH, ACAP3, CDH23, ZC3H12D, MTR, TOGARAM2, PDZD3, TTLL4,
FIGNL1, WFS1, RAD51AP2, F2RL1, PLCB3, MTCL1, TMEM94, SI, TDRD9, FASN,
PLEKHG3, AKAP9, AGRN, ATP8B3, PHLPP2, RPAIN, ARAP3, TRPM6, UMODL1,
CACNB2, NHSL1, POLRMT, TNRC6C, FAP, PIK3R1, ZADH2, MIA3, SPG7, ADAR,
COL4A6, DNAH9, LAMA5, PCNX2, COL6A6, SVIL, ADGRA1, GOLIM4, RIF1,
ARMCX4, AHRR, FNDC1, ANKMY1, ACADVL, EPB41L2, ARHGEF17, EIF2AK4,
BLM, NYNRIN, RTTN, ATP2A1, KIF20B, LRPPRC, MYOF, PNPLA3, PCDH12,
TGM7, PKD1, AFAP1L2, CDHR3, TMEM161A, FAM171B, IQGAP3, TOGARAM1,
BRIP1, ZNF831, BPIFB2, ZFAT, MFSD6L, PLIN3, MED13L, VPS13A, CSMD3,
RRBP1, SNCAIP, PLXNB1, POLI, FPGS, SEL1L3, KNTC1, FAM160A1, ERICH3,
TTI1, AVIL, PARG, CORIN, HERC6, BICRA, TGM2, CNGB1, TJP2, ACOT12,
LCMT2, GPLD1, ERMP1, CPN2, AFF3, SLIT3, CNTLN, KIF3C, FYCO1, MAST1,
CEMIP, PPP6R2, DDX51, EFCAB5, OTUD7A, MAVS, ZDBF2, MKI67, GGACT,
STK11IP, LTF, JCAD, DHX34, KDM6B, MEGF6, TTBK2, ZFP3, ADAMTS16,
FAM198A, PSD4, FNBP4, COBLL1, TSPOAP1, ADGRD1, APOA5, ZNF462,
RPGRIP1, ZMYND8, FBF1, RB1CC1, TTF1, TRIM66, NXPH2, ADNP2, TNN,
KIAA1671, AKAP6, STRC, SYDE2, AKAP13, SLC12A7, ZNF142, PLA2G4F,

136
PAPPA2, NFAT5, SPINT1, POMT2, AKAP1, TTC21B, CEP126, SCMH1, COL7A1,
CASKIN1, ZNF407, ADAMTS18, VWF, ADGRG4, CELSR1, FAM83G, PRRC2B,
ZBED4, BOC, WEE2, OAS2, CARD6, ZSCAN22, C5, PLXND1, DLGAP2, KCNG4,
COL4A2, N4BP1, TMEM132A, IQCA1, LRCH3, KANK2, CHRM3, KNL1, ABCA13,

137
USP42, PER1, COL26A1, THBD, USP16, MYOCD, PER2, SUSD1, MELTF,
PLXNB2, CAMSAP1, PDE3B, HCN4, MDC1, PITPNM2, TGFBRAP1, PLCB2,
EPS8L3, NPC1, LAMA4, WDFY4, NOS1, ECM1, RPH3A, KIF13A, RTL1, CES5A,
VWCE, CWF19L2, CCDC155, MAPK8IP1, SETD6, MCM9, MTUS2, MYBPC2,
RTN1, ADCY1, HAUS5, PCDH18, SLC10A3, KMT2A, PODXL, BRDT, CFAP46,
METTL22, MLH1, CNTROB, TICAM1, DNAH7, DSG2, CCDC116, MRS2, DSP,
TRPC3, NUP153, KIAA1683, TEP1, PASK, SEC16A, LEMD3, PIGM, MYOM3,
CEP164, NUP62, PKDREJ, ZAN, PKHD1L1, DHX33, NBEAL2, STAB2, MYO7A,
ZNF628, APBB1IP, CGN, TCHHL1, SCAF11, MYH7B, SEMA4B, EFCAB8,
TMEM131L, EFL1, KRT2, RADIL, HAS1, GUCY2F, REV3L, DIDO1, PTPN13,
ACAN, F11R, LMTK2, WNK2, HGS, ZNF646, ABCB4, DPYSL4, ACIN1, CERS4,
RNH1, ZNF316, KCNA10, INVS, SDK2, KRT12, SLC26A1, MYT1L, PRX, LEPR,
PPARGC1B, OBSL1, ZNF473, TMEM184B, KLK5, VIPR2, UTP20, TRPS1,
HECTD4, ERAP1, EVPL, ADAD2, TRANK1, PLA2G4E, FHDC1, CHD6, DIAPH3,
FAM155A, GAA, CIC, COL4A3, CDT1, TSHZ3, CD38, FAM208B, MISP, CD96,
MAGEB16, SYNM, ADAMTS20, WNK1, PIGN, TMC3, ZC3HAV1, SNX19, TRPM4,
OTOP1, FAM13A, ZNRF4, TUBGCP2, ZNF277, CCDC88B, KANK4, ANKRD11,
TET3, PLCH1, ANPEP, CBARP, VWA3A, NIN, PTPN21, ATP13A2, PINK1,
ATP2B2, CACNA1A, CAMSAP3, EVC2, POM121L2, CCDC40, SEC16B,
CACNA1G, KANK1, CCDC114, DENND2A, SPAG17, NYAP2, MRPL21, TMC4,
DNHD1, ZNF236, NOLC1, ASXL2, RBPJL, SALL3, TRIM14, ANKRD35,
ST6GALNAC1, VCAN, DNAH6, GPR158, IL16, PML, IL17RE, CARD14, DICER1,
NFASC, MYOM1, CLNK, MAP7D1, ATP9B, CCDC136, CFAP65, CRYBG3,
PLA2G4D, CFAP47, FBXL13, CFAP61, LRRC14B, TMEM132D, PTCD2, NEK4,
TECPR2, APOBR, PARP14, TMX4, CELSR2, GALC, SCUBE2, EXOSC10, PTPRN2,
TSHZ2, COL18A1, TBC1D9B, GALNT12, TDRD6, WDR55, TMTC4, WDR72,
RALGDS, ZNF804A, TTC17, SCN5A, REXO1, ZDHHC1, RINL, SCAPER, PJA2,
TRDN, KIAA1210, OTOL1,
Grey seal
CFTR, IQCH, GREB1, BSN, DOPEY2, SPTB, SDK1, TACC2, WDR11, ABCC2,
KIAA1211, GPR132, SEMA4D, SRRM2, PHF3, AATK, ADAMTS7, SHROOM3,
LYST, TEX15, FAM186A, AFF1, MYO16, HSPG2, PRG4, F5, FREM2, NOP14, TG,
ZFHX2, CELSR3, PEX1, QRICH2, TBC1D31, FHOD3, HIVEP1, SLX4, GPATCH4,
NOS2, WDR62, GPR179, SYNJ2, MYBBP1A, CNTNAP4, FER1L6, PDCD11, GAK,
LAMB3, ADAMTSL3, HEG1, LRIG1, ARHGAP32, VPS13B, MMEL1, CEP295,
PIGT, CXCL16, CCDC88C, TTLL4, DPH7, ATP8B3, CDHR2, DNAH9, LAMA5,
SVIL, FNDC1, NYNRIN, COL10A1, ERICH3, CAPN8, HRC, FYCO1, DDX51,
EFCAB5, MKI67, MEGF6, COL15A1, TNN, PRUNE2, AKAP13, FUT4, ADAMTS18,
SALL2, ADGRG4, CELSR1, ZBED4, BOC, DCHS2, EFCAB6, ADAMTS13, MDC1,
PCNX1, WDR60, CROCC, DISP1, DNAH7, DSP, MMP17, PKDREJ, PKHD1L1,
NBEAL2, LTBP2, ACAN, KMT2C, WNK2, FRMPD1, PRX, TUBGCP6, TRANK1,
DISC1, ASXL3, PTPN21, POM121L2, SEC16B, ZNF236, CEP170B, PKHD1,
CFAP65, APOBR, ICE1, COL18A1, KMT2B, KIAA1614, SGSM2

138
Ringed seal
RAB3GAP2, TBX3, AQP8, MAML2, ELP1, WDR1, TMEM121, GTF3C1, BCR,
TBC1D2B, TRHDE, SNTB1, MTUS1, STAG3, DNMBP, PHLPP1, RRP12, MYO15B,
KIAA1211, BASP1, SHANK1, PGBD1, NEFH, PIEZO1, AATK, ADAMTS7,
SHROOM3, PROSER1, KCNMA1, TEX15, MNX1, RYR1, THSD7A, DSG4, KMT2E,
NHLRC1, TMEM229A, MST1R, VRK3, ATOH1, B3GNT6, CAMTA2, ASCC3,
LACTBL1, CCDC171, QRICH2, TDRD12, CHST11, GLIS1, EXD2, PBXIP1, PER3,
ABTB2, INPP5J, COL5A2, HIVEP3, PGR, RECQL4, AGBL5, ZC3H3, MARCO,
KCNG1, USP19, HECW1, PTPRJ, IRS2, MFSD9, MAML3, ARHGEF5, RNF150,
CUL9, KIAA0319, NOC4L, CRYBG2, MCM5, CHRNB2, CEP350, WFS1, CPA1,
COL27A1, FAM83H, KCTD14, MIA3, WWC2, ADAR, MOCOS, FAM181B,
PCDH17, FNDC1, VWDE, RTTN, LRPPRC, DCAF5, ZNF831, SETD2, MFSD6L,
VPS13A, PLXNB1, NOD2, KCNC2, DISP2, BICRA, MKI67, GRID2IP, FBXL7,
COL15A1, INSR, MAST2, ZNF648, TNN, PRUNE2, ZNF217, CDH6, ZNF407,
ADGRG4, CELSR1, FCRLB, JAG1, HUWE1, CHRM3, CDCA2, ADAMTS13, PEG3,
CAMSAP1, PDE3B, COL6A5, BMP3, LAMA1, MYO15A, UBN2, ITGA1, ZBTB42,
GDF7, ADCY1, CRYBG1, TICAM1, KIAA1683, PIGM, PKDREJ, ZAN, RXFP3,
TBX2, DLGAP1, STAB2, ZNF628, ABCA2, B3GLCT, WDR27, SPAG1, CMPK2,
TRANK1, CHD6, SOX9, FAM208B, IRX2, ALX4, EGF, SLIT2, ANKRD11, SOX11,
TNC, BTBD11, DNHD1, SORL1, ARHGEF40, CFAP47, ABCB11, APOBR, ABCC12,
CSPG4, TBC1D30, KIAA1210
Baltic ringed
seal
XIRP2, DACT2, SPEG, MYO18B, KIAA1211, ZC3H14, DSC3, AATK, ADAMTS7,
GPR50, BRAT1, COL6A3, SHROOM3, BOD1L1, MROH1, TONSL, FAM186A,
FREM2, KIF24, CASZ1, TG, MST1R, SNAP23, FAT2, QRICH2, MYBBP1A, NKX2-
6, TMEM126A, EXPH5, ALPK2, APC2, LAMC3, CRYBG2, IGSF10, ATP8B3,
LAMA5, PCNX2, COL6A6, HTATSF1, ZNF831, FAM160A1, SCN10A, MKI67,
JCAD, TNN, PRUNE2, NTN5, ZNF142, SH2B2, ZNF407, BOC, CACNA1H,
SLC25A43, PPP6R1, KNL1, ABCA13, MDC1, CDC16, LAMA1, ALPK3, DNAH17,
CRYBG1, PCLO, ZAN, GRIN2C, PLEKHA6, FSCN2, SPAG1, A2M, CEP170B, ROR2,
ICE1, PTPRN2, KIAA1210
Saimaa
ringed seal
SNAPC4, ARHGEF10, TACC2, DNMBP, KRBA1, MYO18B, MYO15B, AK9,
EMILIN2, SRRM2, CUBN, SHROOM3, LYST, AFF1, F5, WDR97, NOP14,
ARHGEF11, CACNA1I, DSCAM, SPOCD1, DIAPH1, PER3, ZNF804B, ESYT1,
DENND3, EXPH5, FAM71B, LAMB3, MAMDC4, DNAH11, KIAA1549L, HELZ2,
IRS2, MAML3, ITGAL, TECTA, CEP131, SEMA5A, CDH23, DPH7, URB1, SSC5D,
MIA3, COL6A6, COL10A1, IQGAP3, TIAM2, VPS13A, FHAD1, BICRA, CNGB1,
FYCO1, MKI67, SYCP2, MEGF6, TAS2R40, COL15A1, TNN, KIAA1671, FBLN2,
NPHP3, RAI1, EFCAB6, HCN4, CROCC, PCLO, C2CD3, ZAN, PKHD1L1, NBEAL2,
PLEKHG2, TICRR, TLR4, COL12A1, REV3L, AKNA, ERAP1, COL4A3, TLR5,
CACNA1G, KANK1, SALL3, MAP3K5, PARP14, CELSR2, HLCS
Table S1. All genes with signals of positive selection in each lineage. Gene symbols
correspond to nomenclature used in the Hawaiian monk seal reference annotation.

139
Monachini
SMUG1, COL6A1, NOTCH1, FRAS1, PCNT, ACSF3, HDAC10, ATP1A4, SDK1,
ZIC3, PYROXD2, XKR5, CCDC30, COL6A3, TMC5, BOD1L1, CDH3, KRT4,
HSPG2, ARHGAP45, KIF24, NOP14, VRK3, PHLDB2, LAMA2, BPI, LSS, HIVEP1,
FGG, USHBP1, MADD, RPS23, ABCA7, ABTB2, GTF3C5, UTRN, XRCC3,
EFCAB12, DNAH11, KIAA1549L, DVL3, CD5, LAMC3, TECTA, KLHL33, PDGFD,
SLC6A18, NKD2, URB1, TTLL2, LAMA5, PPM1F, STAB1, NYNRIN, DNAH14,
PKD1, PARP3, PRR14, FYCO1, SCN10A, MAVS, ZDBF2, EVC, H6PD, TOR4A,
TNN, PRUNE2, OASL, AKAP13, OTOG, CEP126, ZNF407, VWF, ADGRG4,
ZSCAN22, MAP3K21, EME1, KNL1, TPO, ADGRF3, KIAA1024, ADCY1, CCR6,
ALDH1B1, CCDC116, ASH1L, KIAA1683, SEC16A, PKDREJ, ZAN, GPRASP1,
JAG2, GRIN2C, FUT7, ACAN, IL18R1, CTU2, TACC3, TOP3A, PIK3R5, SLC15A1,
MISP, ZNF451, WNK1, ASXL3, KNOP1, ANKRD34C, CC2D1A, PLIN4, POM121L2,
ZNF236, CEP170B, FAM120B, TUBB1, HEMGN
Miroungini
ancestor
GPBAR1, FGA, SORBS1, PCNT, PIGR, ATP1A4, NEDD4, DNMBP, MYO18B,
DDX58, COL6A3, GLI2, GFY, BOD1L1, MROH1, SEC23IP, SLC12A8, TEX15,
TMC6, KIF24, FAM111A, FMN1, NWD1, PKD1L3, RFWD3, ANK3, IMPG1,
LAMA2, SNAP23, ZHX3, FHOD3, WDR62, KRT15, PBXIP1, MGAT1, TBRG4,
AHCTF1, CRYBG2, KIAA1211L, MUC1, AKAP11, CEP290, CDH23, PLEKHG3,
PCM1, UMODL1, MIA3, DNAH9, ARMCX4, FNDC1, IQSEC1, RTTN, ICE2, MKI67,
AKAP6, AKAP13, FBLN2, OTOG, ZNF407, DCHS2, CACNA1H, CUX2, PDE3B,
COL6A5, MYO15A, DNAH17, PCLO, PKDREJ, PKHD1L1, SPPL2C, PTPRZ1,
ABCA2, PALM3, KMT2C, WNK2, WDR27, FASTKD3, ASPM, KMT5B, KANK4,
TLDC1, TNS1, PLIN4, POM121L2, DNHD1, CARD14, RBM44, GLI3, APOBR,
PARP14, COL18A1, SLC44A4, TDRD6, ZNF804A, LRRIQ1
Weddell
CATSPER2, IRS4, HJURP, EPHA1, APOH, VPS13C, USP36, DOCK1, KCNT1,
MAMLD1, ZSCAN26, NUP210L, RAB11FIP5, MAML2, SLC22A1, RIN3, BSN,
TBC1D2B, ALDH9A1, ATP1A4, SBNO2, PLEKHM2, TMPRSS9, TP73, HPX,
RBBP8NL, CCDC13, ZBTB24, ADCY6, ZFPM1, TRIM68, SGPP2, OTOA, AFF1,
RMI1, FANCA, GRASP, KMT2E, PLA2G6, FMN1, CSMD2, FAT1, SNTG2, PTPRF,
GPR20, ALOX15B, FBRSL1, GPRIN2, HIVEP1, QSOX2, PROSER3, THAP3, GPR35,
KRT15, MZF1, NISCH, NEK1, PER3, TBCD, PCDH15, EXPH5, ADAMTSL3,
DNAH11, DNAJC6, ZNF608, MLXIP, TARBP1, FAAP100, TDRD1, COL5A3,
MAML3, SEC24B, CCDC177, NOC4L, ECM2, ALDH3A1, SEMA5A, SRRD,
NOTCH4, TOGARAM2, AP3B2, SAMD15, AGRN, LRP1B, TRPM6, POLRMT,
CCDC8, MIA3, EAF1, RNF180, ADGRL2, PDE3A, IQSEC1, FNIP2, GPRIN1,
SLC38A10, IQGAP3, HENMT1, AP5B1, MFSD6L, RRBP1, MRGPRG, PLCG2,
CORIN, GGN, HTRA4, CNGB1, HRC, INSRR, LAMB1, IL1R1, MKI67, MEGF6,
ABCA1, ZNF462, FBF1, HFE, ADGRG4, CDH15, BPTF, ELP2, KNL1, PLD4,
ARHGAP29, USP16, KIAA2012, ADGRF3, GNAS, PCNX1, RBSN, HEATR1, CHD7,
TTC24, CWF19L2, TAS1R3, ADCY1, SLC39A12, KMT2A, INPPL1, ASH1L,
THSD4, TEP1, ZAN, ANO2, SEMA4B, PTPRZ1, DIDO1, PTPN13, PALM3, WNK2,
CLCA2, ZNF316, RNF19B, FRMPD1, UTP20, ACOX3, FHDC1, DIAPH3, KIF18B,
TECPR1, WNK1, TNC, CC2D1A, AP5Z1, MTTP, KANK1, ARHGEF10L, CDSN,
DNHD1, TTC6, SALL3, TPBG, DNAH6, LAD1, CARD14, CELSR2, TSHZ2,
WHAMM, SCN5A, REXO1

140
Elephant
seals
VRTN, CDK5RAP2, ADAMTS14, TOP2A, ATG2A, GRTP1, COL6A1, CACNA1F,
SNAPC4, FAM71A, TJP3, DCLRE1A, DACT2, RAB11FIP5, NRXN2, LRRN4, BSN,
TBC1D2B, ZFHX3, CDC42BPB, MYLK2, DHX57, SASH1, SIPA1L3, PYROXD2,
LAYN, MYO18B, CFAP54, WWP1, DOCK8, LAT, MYO15B, CPD, SEMA4D,
CNTRL, FOXRED1, MEGF8, KIF26A, ALKBH8, HIP1R, SHANK1, ANKRD12,
ZBTB24, DMRT3, SPECC1, TTC28, ARHGAP22, TSC22D1, BRAT1, PROSER1,
BOD1L1, CDH3, MROH1, KLF11, MCPH1, TEX15, HSPG2, COBL, PRAM1,
THSD7A, F5, ROBO4, KIF24, PAXIP1, WDR81, SPHKAP, CAMTA1, GUCY2D,
TTBK1, RBM19, ZFR2, CELSR3, DLK2, ICAM1, CCDC185, GALNT6, CRAT,
CEP104, TCIRG1, CACNA1S, FSD2, RTL9, PEX1, PAXX, LSS, TGM5, TRIO,
TBC1D4, DIAPH1, NKAPL, TDRD12, HIVEP1, QSOX2, AGAP1, WDR62, GPR179,
SYNJ2, THAP3, KCNV2, MORN1, KIAA1549, CAMSAP2, TRMT44, PER3,
ZNF518B, ADGRE5, ARID5B, FER1L6, PHLDA1, ZSCAN12, DSG3, SPPL2B,
FAM35A, SWAP70, ZNF598, ABCG5, EXPH5, FAM71B, ZC3H3, ALPK2, HPS1, PATJ,
FARP2, INPP5F, CLUH, CASKIN2, FAM83A, KAT6A, ARFGEF3, NRDC,
IRGQ, HECW1, ZCCHC14, PDIA4, CCDC80, KIAA2026, KRT84, BNC1, APBA1,
PHF20, CAGE1, MAP1A, CUL9, KIF15, NDUFAF7, KIAA0319, DNAAF1, FSTL5,
SIK3, VLDLR, AKAP11, FAM221B, CA9, SVEP1, CARMIL3, CEL, URB2, NWD2,
CRTC2, AMBRA1, SHH, ZC3H12D, TOGARAM2, RAD51AP2, PLCB3, TDRD9,
FASN, PLEKHG3, AGRN, PHLPP2, CACNB2, FAP, ZADH2, DNAH9, LAMA5,
PCNX2, ARMCX4, FNDC1, ARHGEF17, RTTN, MYOF, PNPLA3, TGM7,
TOGARAM1, ZNF831, MFSD6L, PLIN3, VPS13A, CSMD3, SNCAIP, FAM160A1,
AVIL, BICRA, TJP2, ERMP1, KIF3C, PPP6R2, DDX51, EFCAB5, ZDBF2, MKI67,
GGACT, STK11IP, JCAD, KDM6B, TTBK2, FAM198A, PSD4, FNBP4, COBLL1,
ZNF462, RB1CC1, TTF1, NXPH2, TNN, KIAA1671, AKAP6, AKAP13, PAPPA2,
NFAT5, AKAP1, SCMH1, COL7A1, CASKIN1, ADGRG4, CELSR1, PRRC2B, BOC,
ZSCAN22, C5, PLXND1, KCNG4, N4BP1, TMEM132A, IQCA1, USP42, USP16,
MYOCD, HCN4, TGFBRAP1, RPH3A, KIF13A, CES5A, CCDC155, MAPK8IP1,
SETD6, MTUS2, ADCY1, SLC10A3, KMT2A, PODXL, BRDT, TICAM1, TEP1,
SEC16A, LEMD3, CEP164, ZAN, PKHD1L1, DHX33, NBEAL2, STAB2, ZNF628,
EFCAB8, TMEM131L, HAS1, DIDO1, PTPN13, WNK2, HGS, ABCB4, DPYSL4,
CERS4, KRT12, MYT1L, LEPR, PPARGC1B, KLK5, VIPR2, UTP20, TRPS1,
HECTD4, ERAP1, TRANK1, FAM155A, CIC, COL4A3, MISP, CD96, WNK1, PIGN,
ZC3HAV1, SNX19, TRPM4, VWA3A, PINK1, CACNA1A, CAMSAP3, POM121L2,
NYAP2, DNHD1, ASXL2, SALL3, ANKRD35, ST6GALNAC1, VCAN, DNAH6,
CARD14, DICER1, MYOM1, ATP9B, CCDC136, CFAP65, CRYBG3, LRRC14B,
NEK4, CELSR2, GALC, EXOSC10, TSHZ2, TDRD6, TMTC4, RALGDS, ZNF804A,
TTC17, ZDHHC1, KIAA1210,
Grey seal
CFTR, KIAA1211, PHF3, FAM186A, HSPG2, PRG4, NOP14, TG, QRICH2, NOS2,
CNTNAP4, LAMB3, ARHGAP32, CEP295, CCDC88C, DPH7, CDHR2, LAMA5,
SVIL, NYNRIN, COL10A1, ERICH3, DLEC1, CAPN8, HRC, DDX51, MEGF6,
COL15A1, TNN, FUT4, ADGRG4, ZBED4, EFCAB6, WDR60, CROCC, DNAH7,
PKDREJ, PKHD1L1, LTBP2, KMT2C, PRX, ZNF473, DISC1, POM121L2, CEP170B,
ICE1, KMT2B, SGSM2
Ringed seal
RAB3GAP2, GTF3C1, TBC1D2B, TRHDE, MTUS1, PHLPP1, MYO15B, PGBD1,
NEFH, PIEZO1, SHROOM3, PROSER1, KMT2E, TMEM229A, ATOH1, LACTBL1,
CHST11, GLIS1, EXD2, PBXIP1, ABTB2, INPP5J, PGR, AGBL5, MARCO, KCNG1,
PTPRJ, IRS2, MFSD9, CUL9, KIAA0319, MCM5, MIA3, MOCOS, FAM181B,
PCDH17, MFSD6L, KCNC2, MKI67, FBXL7, ZNF648, ZNF217, CDH6, ADGRG4,
CELSR1, FCRLB, CDCA2, BMP3, LAMA1, ZBTB42, ADCY1, TICAM1, PIGM,
ZAN, RXFP3, TBX2, DLGAP1, STAB2, ZNF628, SPAG1, TRANK1, CHD6, IRX2,
ALX4, ANKRD11, SOX11, TNC, BTBD11, DNHD1, ABCB11, CSPG4, TBC1D30

141
Baltic ringed
seal
XIRP2, DACT2, ZC3H14, ADAMTS7, BRAT1, COL6A3, SHROOM3, FREM2,
CASZ1, TG, SNAP23, FAT2, QRICH2, NKX2-6, EXPH5, LAMA5, PCNX2,
HTATSF1, FAM160A1, SCN10A, MKI67, PRUNE2, SH2B2, ZNF407, CACNA1H,
SLC25A43, CDC16, DNAH17, CRYBG1, PCLO, GRIN2C, FSCN2, SPAG1, A2M
Saimaa
ringed seal
ARHGEF10, TACC2, SRRM2, SHROOM3, F5, WDR97, NOP14, DIAPH1, EXPH5,
LAMB3, DNAH11, IRS2, COL10A1, MKI67, MEGF6, TNN, FBLN2, RAI1, HCN4,
PCLO, C2CD3, PKHD1L1, COL4A3, TLR5, CACNA1G
Table S2. All genes with signals of negative selection in each lineage. Gene symbols
correspond to nomenclature used in the Hawaiian monk seal reference annotation.
Monachini
CFTR, C1QB, SLC4A11, TMPRSS9, KRBA1, MYO18B, SNED1, PIEZO1, ZNF205,
OSBPL7, PLA2R1, SCARF1, CDON, FAM186A, FREM2, LMF2, NWD1, POLR1C,
FAT1, CEP104, ADCY7, LSS, ZC3H13, FBXO18, FHOD3, SLX4, GPR179, DUOX1,
F8, DOK7, MYBBP1A, KIAA1549, NINL, PDCD11, SYNPO2, TNKS1BP1, DHX37,
PATJ, LAMB3, E2F2, HELZ2, ITGAL, AHCTF1, CEP295, SLC9A3, BPIFB1,
PRKDC, AGRN, TTC34, CDHR2, UMODL1, PCSK5, SLC22A15, CEP250,
MROH2A, BAIAP2L2, SCN4A, CEMIP, MEGF6, DCHS2, FAM151A, HTT,
DLGAP2, PRSS16, PLXNB2, NPC1, CFAP46, C2CD3, ZNF628, COL12A1, FUT7,
PTPN13, SLC26A1, TMEM132E, MYOM2, CAMKK2, HYOU1, TIGIT, SYNM, TNC,
CC2D1A, ARHGEF10L, SORL1, KCP, CD300LG, GPRIN3, TMEM132B
Miroungini
ancestor
CACNA1F, GREB1, BTBD6, NEDD4, GLYATL3, MTUS1, ADAMTSL1, CFAP54,
PHF3, DMXL1, ZNF275, LYST, REN, C7, GDF9, HS3ST1, FOCAD, ASCC3, GJB3,
CBFA2T3, GPR179, GPR35, IKBKE, ZNF541, CAND2, SLC19A1, KIAA1549L,
RHBDF2, SCYL1, NPHP4, LAMC3, ERBIN, PHRF1, AHCTF1, ERCC6L, CEP295,
SEMA5A, FOLR2, COL27A1, NEXMIF, COL4A6, FN1, ACADVL, VWA3B,
DNAH14, FHOD1, CNGB1, INSRR, CNTLN, ADGB, OTUD7A, JCAD, KDM6B,
FBF1, TAF3, KIAA1671, ADGRG4, USF3, ZKSCAN8, PER2, LAMA1, ITGA1,
SLC41A3, DISP1, GPRASP1, OTOF, ABCB4, SLC26A1, TLN1, NCOR1, SETX,
DENND4B, TMPRSS7, IQGAP2, NIN, ABCA9, OTUD4, KIAA1210
Weddell
TMEM163, TMEM132C, CDK5RAP2, ADAMTS14, MYLK3, RAB3GAP2, ST18,
NCKAP5L, CCDC18, PIK3CG, NAV2, CSF3R, ZNF318, POLN, SYNPO, FAM110C,
SEC31B, NOTCH1, FDFT1, ULK1, CACNA1F, CNKSR1, KIF21A, DDX27,
ENTPD8, WDR46, PUS1, FAM71A, DCLRE1A, DACT2, EIF2D, MYO1H, STOX1,
IL12RB2, TTC21A, MYRF, WDHD1, ZFHX3, MTO1, DOPEY2, CSPP1, CCDC157,
TRIM67, MAP2, NEDD4, SBF1, PIK3AP1, TTC3, COL14A1, C2CD2, TANC1,
ANKRD53, MTUS1, NCOA6, GNPTAB, PHLPP1, PPP1R26, PYROXD2, FRY,

142
EIF4ENIF1, CFAP54, SGSM3, USP54, RRP12, PIGZ, MAB21L3, MYO15B, RIC1,
KIAA1211, TEKT5, ZNF335, ATM, SUN1, COL4A4, EMILIN2, NHSL2, NCOR2,
AHDC1, SIDT1, MROH6, BBS12, PAPLN, ALDH3A2, HIP1R, SECISBP2, MINPP1,
PKN3, SNED1, CFI, GPC5, ABCA4, SORCS3, MYO3B, BANK1, WHRN, WDFY3,
EPN3, OSBPL5, SREBF1, ASTN1, CUBN, LAMC1, HABP2, TYK2, EFHB,
TMEM131, SLC29A3, TRAK1, SOX13, ZW10, MSH3, FBP1, LYST, MLXIPL,
MROH1, FTSJ3, KIAA0100, ATF7IP, TONSL, FNDC7, ACTN3, COBL, CAPN13,
CNTN5, ATP11A, TMPRSS15, NRIP1, ZNF438, MEP1A, PRRC2C, PRR14L,
MASTL, FAM111A, NCSTN, CASZ1, PHACTR3, EPSTI1, ARHGEF11, ZNF518A,
DCST1, CFAP57, FMN1, PIPOX, PKD1L3, UGGT2, CIPC, FREM1, SPHKAP,
TIAM1, SEC24C, CARMIL1, ELK4, KIAA1109, GCFC2, NAALADL1, ANKLE2,
CELSR3, JAML, SOWAHB, F13A1, ITIH1, ZNF672, ASCC3, KIDINS220, FBXO24,
SLC8B1, SLC45A3, MAP1S, HEPHL1, NOXA1, TNS3, TCOF1, SLC9B2, ZNF710,
TPCN2, HELQ, GLT1D1, GPR31, CARMIL2, ADAM8, NVL, NLRC3, TBC1D31,
IGSF21, RUSC2, POLD1, TDRD12, KIF14, SLX4, TNFRSF11A, GPR179, SPINK5,
AIRE, KIFC2, F8, ABCC6, ERBB3, MICAL2, N4BP2L2, SPICE1, ITGB7,
PPARGC1A, AHSG, THADA, TMEM235, CCDC180, BAZ2A, EMC1, HEATR4,
TTLL5, TRPV6, CNTNAP4, PRSS57, ZNF804B, FAM189A1, SLFN14, PTK7,
ELMSAN1, SLC5A5, DSG3, KIF7, LRSAM1, TBC1D32, SORBS2, NUP155, ARSJ,
DENND3, DSC2, C8B, GAK, ALPK2, DHX37, TLE6, SEZ6L, PCDH7, SCN11A,
MARCO, JMY, LAMB3, MAMDC4, ARFGEF3, VPS13D, HELB, RHBDF2, HEG1,
MAP3K15, TNRC18, ZSCAN20, ESPN, PDIA4, HCAR1, CHRND, KRT84, ADPGK,
ITIH5, ADGRE1, NCKIPSD, KLB, ZNF609, ACOT11, ABCA12, FGD6, ARHGAP32,
CASP8AP2, LRRK1, EPG5, PADI4, ABL2, RPAP1, LAMC3, VPS13B, LOXHD1,
KIAA0319, RREB1, TECTA, DNAAF1, HOXB13, NUP214, SIK3, KRT20,
TNFRSF25, DMXL2, KIF9, FAM129A, PIEZO2, DYSF, KLHL33, TMEM245, VPS16,
COL16A1, XDH, DZIP1, CEP350, MTR, AP3B2, TOMM34, VARS2, DNAH3,
NCOA3, ERCC6, NKD2, PLEKHG3, GSN, AKAP9, PCM1, NLRP5, PRKDC, IGSF10,
TTC34, NOD1, PHLPP2, GRM6, SIK2, TNFAIP2, UMODL1, FAM83H, MMP9,
HIVEP2, MIA3, CCDC73, EHBP1L1, NUP210, CRB1, WDR49, IGSF9, ADGRG6,
TXLNB, TXNDC16, FNDC1, ANKMY1, ADD1, DNAH8, VWDE, ADGRG3, TNIP1,
BFSP1, TROAP, MYOF, TGM7, LONP1, PKD1, CHTF18, ADAM15, CD109, CIT,
ZNF687, OAS3, PUM3, TIAM2, DMRT2, ECD, PLIN3, DLC1, MED13L, PARP3,
PLXNB1, ABCC3, ROS1, FAM160A1, POLG, CEP250, ERICH3, TTI1, TEX2, NOD2,
HHLA1, DISP2, MROH2A, HERC6, RNASEL, TGM2, TTYH2, MYSM1, BRD4,
FAM83C, FBN2, CDH5, ADGB, EPS8L1, SCN10A, EMILIN3, ESX1, EML5, EVC,
JCAD, DHX34, MEGF6, UNC80, SNX29, GDPD4, COBLL1, TSPOAP1, DRC7,
GBGT1, FYB2, KIF1C, ZMYND8, CABIN1, TTF1, MAP9, ZCCHC6, ADNP2,
ADORA3, KCTD8, ACOT6, TTC37, HASPIN, SNX1, TDRP, SLC4A5, SIGLEC1,
AKAP1, DSC1, IARS, PCNX4, ABCC10, ATXN7, CRACR2B, VWF, SCTR,
PRRC2B, MARCH10, KY, ZBED4, ENAM, SCLY, OAS2, DLGAP2, MRC2,
COL4A2, N4BP1, RASEF, TLR1, CFAP44, SMPDL3B, ADAMTS13, PER1, RMND1,
PEG3, TPO, PABPC1L, NBEAL1, MDC1, IRX4, KIF6, EPS8L3, NPC1, LAMA4,
ASPRV1, WDFY4, ATP2C2, PALB2, ATP10A, WDR60, ALPK3, MYO7B, PRTG,
UHRF1BP1, KIF13B, PDE6C, MYBPC2, SKOR1, ASIC5, CHPF2, BPIFB4, TICAM1,
DNAH7, JMJD4, MMRN1, HGFAC, MMP17, RAB20, NUP153, BAHCC1,
KIAA1683, AMBN, PASK, MYOM3, NFAM1, CABS1, TTLL8, PLXNA2, PKHD1L1,
STAB2, DCHS1, MEGF11, MYO7A, ZNF628, CGN, SCAF11, TMEM131L, CGNL1,
LTBP2, RADIL, COL12A1, SPPL2C, GHDC, GHR, OTOF, CDCP1, EFHC2, RAD9B,
FLT1, AKNA, RNH1, B3GALT5, ESYT3, PAPSS2, INVS, TNS2, ATP6V0A4, NRAP,
TTLL10, TMPRSS6, TBC1D12, CHRNA4, MYOM2, PPARGC1B, LRIT2, GPAA1,
ZNF169, NID1, OSMR, MAPK15, IRX3, TRANK1, SOWAHA, CHD6, GCNT1, CIC,

143
ANKFY1, COL4A3, SLFNL1, GPATCH3, DOCK5, TLR5, SAMD7, MISP, CD96,
KIF26B, LMNTD2, WNK1, SCEL, NLRX1, TMC3, FLT4, STAP2, CTC1, TRPM4,
FAM13A, TMPRSS7, PLCZ1, ZNRF4, CCDC88B, DMRTB1, FSTL4, TET3, SLC7A5,
TNS1, LRGUK, PLCH1, CRTC3, VWA3A, GPR108, NIN, EPN2, LARGE2, CCSER2,

144
IGSF11, EVC2, CCDC40, CACNA1G, LNPEP, KANK1, DENND2A, AHI1, SPAG17,
PNPLA7, CTSF, FASTKD1, MMP15, MS4A14, TDRD7, FAM135A, NCAPD2,
ANKRD35, FMO1, HSH2D, ZFYVE26, CLNK, RBM44, PTGDR, CFAP61,
LRRC14B, POMGNT2, GPRIN3, MYPN, TECPR2, WRAP53, ZCCHC4, ABCC12,
MROH2B, DHX58, COL18A1, RASAL3, CSPG4, FAM166A, MAGI2, TBC1D9B,
ZNF366, LIMCH1, TDRD6, WDR72, RALGDS, DENND1C, LRRIQ1, CCDC33,
REXO1, KIAA1614, IL4R, LARP6

145
Elephant
seals
CHRDL2, PAM, COL19A1, ATP10B, TRPV2, GLCCI1, NES, EPHA1, CFTR,
DENND4C, SEC31B, NOTCH1, ITIH4, CLSPN, CNKSR1, UNC13C, CRHR2,
TRPV4, ANKZF1, SORBS1, CALHM1, TRPC7, ARHGEF10, USP31, RAB11FIP5,
PCNT, MAML2, SPTA1, ACSF3, SEPT8, RIMS2, IL12RB2, LAMC2, LRRC24,
DAP3, HTR1A, RPS6KL1, ADGRA2, CSPP1, PLK4, CCRL2, BOP1, MRPL38, SPTB,
ATRNL1, SDK1, ANKRD53, MTUS1, LRP11, NCAPG, DNMBP, KRBA1, PHLDB1,
PHLPP1, PPP1R26, CHRNA5, RRNAD1, FRY, TSHR, SFI1, TRMT1L, RRP12,
GMIP, ST6GALNAC2, KIAA1211, SUN1, XPC, COL4A4, EMILIN2, WNK3,
FOXRED1, SRRM2, MROH6, F7, CPXM1, RNPEPL1, GBA, ALDH3A2, KIF17,
COL11A2, SH3TC2, SECISBP2, PKN3, PHF3, EPHX2, SNED1, LRRC66, MYO3B,
KRT24, SHE, RASAL1, OSBPL5, SREBF1, PTPN14, PIGO, TIMELESS, CUBN,
RUBCN, TYK2, GAL, WDR4, GLI2, DLG5, MSH3, MKKS, LIFR, MYO19, FKBP15,
OTOA, FNDC7, TMCC2, AFF1, CHRNA2, CNTN5, RNPEP, NEO1, NRIP1, TMC6,
PRRC2C, LIG3, KCNH8, CARF, RNF17, NOP14, FMO2, ARHGEF11, CEP68, LMF2,
PADI6, FOXJ2, TG, NDUFA10, FARS2, FREM1, IQSEC3, CC2D2B, DCST2, GCFC2,
ABCC4, TTF2, IARS2, MSTO1, CSMD2, SNTG2, CACTIN, FOCAD, TULP1,
MILR1, MYH14, MMP20, EPRS, CTSO, WDR6, LAMA2, BRCA1, VIT, ARAP1,
BAZ2B, MMP8, CEP104, TNS3, ZNF536, RGS22, LRBA, RABL6, LRRIQ4,
CCDC171, TPCN2, AP4E1, VWA7, DENND2C, ADAM8, TDRD5, AK8, NVL, PFAS,
COL20A1, ZC3H13, FBXO18, FHOD3, ZNF106, DDX54, RUSC2, KLHDC4, NKX1-
2, CILP, SIAE, LRP4, ENGASE, SPINK5, GIPR, FBXO40, KIFC2, STK10, INF2,
KCNH6, TRPM5, ITGA7, TSPYL5, ITGB7, USHBP1, NUBP2, NCAPG2, LSG1,
MADD, PM20D1, PCDH15, PLEKHG6, TRPV6, FBXO43, CNTNAP4, ZNF804B,
ATCAY, MAP3K19, ARID5B, MAML1, GRAMD1C, CARD10, PDCD11, GTF3C5,
KIF7, SPPL2B, TBC1D32, LMO7, CNST, LCT, DENND3, SLC44A3, ALDH5A1,
JAK3, GAK, DRC3, MEI1, DHX37, ANAPC1, APC2, TPRN, SLC39A4, COL3A1,
FMO4, GNL2, DNAJC6, SLC2A4, TBRG4, TARBP1, NCL, IRS2, ITIH5, ADGRE1,
COL5A3, KLB, PDZD7, ARHGAP32, TRMT1, AEN, LAMC3, ERBIN, PDE4A,
KIF11, CHST9, AHCTF1, FGFBP3, PAPPA, PALLD, NLRC5, SLCO2B1, CRYBG2,
CEP295, ABI3BP, FAM129A, OLFML1, MICAL1, KIAA0232, DYSF, COL16A1,
SERPINE1, TANGO6, DZIP1, ACAP1, SLC6A18, GRIN2B, OCSTAMP, PLEKHS1,
CEP350, SLCO4A1, DNAH3, ADAM33, PLOD1, SLF2, VMO1, FANCF, ZNF446,
GSN, INTU, IGSF10, ACACB, ADCY10, RAB44, PARP4, PROB1, LRP1B,
COL27A1, FAM83H, KLHL31, SBF2, CDC25B, NSUN2, FCHO2, EHBP1L1, SPG11,
NUP210, PTPN22, MANSC1, CRB1, WDR49, RMDN3, TXLNB, PDE3A, IQSEC1,
CEP120, TOPBP1, ADCK5, KDM4B, GIMAP8, FAM124B, UACA, RETSAT,
TRMT12, KIAA1755, FNIP2, GPRIN1, GPR45, C5AR1, RUFY4, AFAP1L2, CHTF18,
MYBPC1, COL13A1, NUTM1, PCSK1, ADAMDEC1, CD109, UVSSA, DCBLD2,
PPP1R15B, AFF4, ECD, USPL1, HPS4, ATG16L2, MLIP, FHAD1, ROS1, ADGRG5,
FHOD1, CEP250, CD6, KIF27, VWA2, CFAP69, OPLAH, AMER2, NUP88, ASPDH,
DISP2, ZNF408, BUD13, BRD4, PRSS56, HEATR5A, FLNB, FAM129C, WDR66,
TNR, GRID2IP, TRIM29, CIZ1, MEGF6, CC2D2A, ABCA1, IGHMBP2, COL15A1,
NCKAP1L, CASS4, NBAS, PAK4, FBF1, ATAD5, CABIN1, UCP1, GALNT5,
TTLL6, GGT6, MARVELD3, TTC37, AKAP8, FBLN2, MPP4, PLA2G4F, FBXO46,
TDRP, ITGA8, SIGLEC1, NCAN, IARS, RNF207, ABCC10, CTSZ, PTCH2, SALL2,
OLFML2A, PRRC2B, MARCH10, FAM124A, ENAM, SCLY, FGF21, CACNA1H,
KLK15, CDH15, ANO8, EFCAB6, ADAMTS12, WRAP73, CCDC110, GEMIN4,
CFAP44, ERCC4, SMPDL3B, ADAMTS13, CD68, ADGRF1, ZXDC, NBEAL1,
KIAA2012, MAN2A2, SRMS, RUBCNL, PDLIM3, NPC1, ERCC6L2, ENPP1,

146
QSOX1, MYO15A, OGDHL, AIP, TCF7L2, WDR60, RRP1B, VSIG10L, ITGA1,
CROCC, ADAMTSL4, KIF13B, DISP1, SLC41A1, CRYBG1, GADL1, IL18RAP,
ALDH1B1, PDE1C, PRDM8, SREBF2, ADGRF5, MAP6, FANCI, PPRC1,
CDC42BPG, FAM53A, LEMD3, LUZP1, UMPS, NFAM1, ZFP57, CFAP70,
MAMDC2, DCHS1, PLEKHG2, GRIN2C, PREX1, TICRR, DTX3L, MET, LTBP2,
P2RY6, PIMREG, IP6K3, COL12A1, SPPL2C, ZKSCAN2, ZBP1, OTOF, CDCP1,
NKAIN4, PDE6A, FSCN2, MYO5C, MAPT, RAD9B, CTU2, COL17A1, AKNA,
SIPA1L2, ATAD2, PLCE1, TACC3, ABT1, SLC35G1, TMEM63A, CERCAM,
CCDC141, VWA8, CTTNBP2NL, TLN1, MYOM2, ASTN2, ZFP64, SLC26A2,
NCOR1, SYNE3, VASN, PLA2G4E, TRMT5, MORC1, PANX2, GPAT2, SH3RF1,
LAP3, PIK3R5, PRG3, GAS2L3, AMDHD1, SORBS3, TOM1L1, GCC2, KIF26B,
LRRFIP1, NLRX1, RELT, PALD1, CLSTN2, EGF, EPB42, CUZD1, FSTL4, DUT,
TNS1, CLMN, LRGUK, PCK1, EDN3, ZSWIM3, SLC6A20, CC2D1A, LARGE2,
ERN2, RAB11FIP1, DAGLB, PRDM16, CCT8L2, CACNA1G, PLIN5, ABCA9,
RGMB, SQLE, ZC3H18, CEP162, TMPRSS4, NCAPD2, TPCN1, GALNT10, MYBPH,
GRIP2, ARHGEF40, LIG1, KCP, LRRN4CL, PHC1, ANO1, ITGA2, DAPK1, GLI3,
REPS2, MYPN, GOLGA4, MAN2C1, ALPK1, PODXL2, EREG, TRAF5, TLL2,
PGM2, CEP152, TP53BP2, TSHZ1, LIMCH1, SLC2A9, DHX29, AFM, N4BP2,
SCN5A, ZMYND15, KMT2B, IL4R, CEP97, ZBTB4
Grey seal
FRMPD3, MAP4, CACNA1F, FRAS1, ARHGEF10, SGSM1, RTN4, STARD8, SPEG,
ZFHX3, DOPEY2, ITGA10, MYO15B, TAF1C, NCOR2, SRRM2, KIF26A, PAPLN,
HIP1R, SHANK1, NEFH, LRRC66, PIEZO1, SREBF1, CUBN, GLI2, COBL, AGBL1,
RYR1, FANCA, KIF24, WDR97, FAM111A, CASZ1, NCKAP5, NWD1, MINDY4,
ZFR2, FAT1, ANK3, VRK3, TJP1, TYSND1, TCOF1, FAT2, ABCC6, KIAA1549,
USHBP1, MYCT1, ABCA7, CACNA1B, SLC5A5, UTRN, KIAA0753, ZNF541,
ALPK2, APC2, MARCO, TBRG4, FAAP100, TDRD1, ITGAL, CUL9, LAMC3,
RREB1, BCO2, KIAA0586, PHRF1, NLRC5, SIK3, PRR22, NRDE2, DYSF, ABCG8,
DNAH3, FASN, URB1, AKAP9, DOCK6, LRP1B, TRPM6, UMODL1, POLRMT,
MIA3, SPG11, ARMCX4, STAB1, MMRN2, DNAH14, SLC38A10, CHTF18,
NLRP14, IL12RB1, MYO1G, KNTC1, TTI1, NOD2, ZBTB49, DISP2, SETD1B,
TGM2, FYCO1, FLNB, MAVS, ZDBF2, EVC, JCAD, H6PD, CIZ1, IGHMBP2,
SCRIB, NBAS, FBF1, TRIM66, PLEKHG4, OTOG, SALL2, FAM83G, USF3,
MARCH10, HTT, COL22A1, CACNA1H, MRC2, KIAA0556, TEX14, USP42,
CAMSAP1, GNAS, COL6A5, LAMA4, MYO15A, RTL1, ITGA1, MYO7B, MTUS2,
DNAH17, PIK3C2A, DSP, BAHCC1, KIAA1683, TEP1, SMTNL2, ZAN, MYO7A,
PLEKHG2, TICRR, LTBP2, RADIL, OTOF, COL17A1, NRAP, MYOM2, OBSL1,
UTP20, OSMR, LDLR, FHDC1, INTS1, XIRP1, SYNM, YEATS2, ASPM, MYH15,
CCDC88B, ANKRD11, ANPEP, KANK1, IL16, ZFYVE26, CRYBG3, CFAP47,
PARP14, COL18A1, CSPG4, LIMCH1, SCN5A, AADAC, KIAA1210
Ringed seal
S100PBP, VPS13C, PCNT, LAMC2, GREB1, CHST3, ZNF592, SRRM2, NPAS3,
ANAPC2, DUOX2, BDP1, BARD1, MROH1, COBL, PRR14L, USP53, DOT1L,
IGSF1, TENM4, ZFHX2, VRK3, SNTG2, FOCAD, TIGD5, TRIO, DUOX1, FANCD2,
PBXIP1, MFSD3, MYCT1, CCSER1, SLC15A4, SYNPO2, CNST, GATA5, PCDH7,
COL3A1, DNAH11, LRIG1, FAM84B, NAV3, ERBIN, AHCTF1, NUP214, CRYBG2,
CCDC105, AKAP11, MN1, MOV10L1, ACACB, POLRMT, PIK3R1, COL4A6,
PCSK5, OGFR, DNAH14, DCAF5, HID1, SPATA18, ARHGEF19, PRDM1, ICE2,
KNTC1, CEP250, MAVS, ZDBF2, TOR4A, TRIM66, KCTD8, AKAP13, RASGRF1,
USF3, COL22A1, NOTCH2, ABCA13, THBD, HEATR1, ENPP1, MTUS2, CRYBG1,
HMGCS2, CEP164, REV3L, WNK2, ANLN, NAT10, EVPL, OSMR, FLT4, OTOP1,
MYH15, IQGAP2, ASXL3, POM121L2, FOXI2, DNAH6, DACT1, MAP3K5, EXO1,
TMEM132D, ICE1, FLVCR1, COL18A1, TDRD6

147
Baltic ringed
seal
NES, LRP2, C8A, CFAP54, MROH1, RALGAPA2, ENTPD2, ARAP1, TDRD12,
GPR179, DUOX1, DCDC2C, SLC27A3, ZNF541, MAML3, KIAA0586, KIAA1211L,
DYSF, TRIM17, MOV10L1, PRKDC, PARP4, COL4A6, NOL8, ARHGEF17, ETV5,
CFAP46, COL12A1, PTPRZ1, PRX, TAP1, CIC, FAM208B, ASXL3, ANKRD11,
ZNF236, CRYBG3, REXO1
Saimaa
ringed seal
CDK5RAP2, SNAPC4, TTLL12, ZNF605, SPTA1, GTF3C1, ZFHX3, DNMBP, FLNC,
CFAP54, ATM, TAF1C, ADAMTS7, TSC22D1, ARHGAP21, LRRD1, ACTN3,
SH3TC1, ITPR3, TJP1, MERTK, LAMA2, BRCA1, TNS3, TCOF1, DUOX1, SLC4A1,
PER3, ABCA7, MAP3K19, FER1L6, LCT, JAK3, DSC2, TNKS1BP1, GAK, PATJ,
HEG1, PTPRJ, FAM135B, CEP295, GPATCH8, CEP350, DNAH3, TDRD9, NLRP5,
LRP1B, FAM83H, EHBP1L1, RIF1, KIAA1755, MYOF, FNIP2, DNAH14, BRCA2,
GPRC6A, KNTC1, ROS1, ARHGAP31, TNR, H6PD, IGHMBP2, CASS4, PRUNE2,
AKAP13, TREML1, COL7A1, FAM83G, COL22A1, SERAC1, DLGAP2, ANK2,
ADGRF3, WDFY4, NID2, MYO7B, CROCC, UHRF1BP1, KMT2A, DNAH7,
ANKK1, SEC16A, NBEAL2, LTBP2, COL12A1, PTPRZ1, WNK2, COL17A1,
WDR27, MCM3AP, OSMR, TRANK1, CHD6, RELT, ASPM, ASXL3, MICALL1,
ANPEP, CSF1R, EVC2, KANK1, ARHGEF10L, CFAP47, TLR8, CSPG4, TDRD6
Table S3. All genes that show only neutral evolution in each lineage. Gene symbols
correspond to nomenclature used in the Hawaiian monk seal reference annotation.

148
CHAPTER THREE:
Evidence that the distribution of fitness effects of new mutations evolves in response
to long-term effective population size in mammals
Abstract
The distribution of fitness effects (DFE) is arguably one of the most important parameters
in understanding population genetic dynamics and molecular evolution. Despite this, there
is still relatively little data that provide a framework for parameterizing DFE, and even less
information on how and why the DFE varies across species. In this chapter, I use a large
population genomic data set to model the DFE for multiple species of phocid seal, which
differ dramatically in their long-term population sizes and demographic histories. I find
that in the species with the largest data set (Hawaiian monk seal, n = 14), I am able to
accurately estimate the recent demographic history as well as the shape and scale
parameters for a gamma-distributed DFE. A model of the synonymous site frequency
spectrum for the Hawaiian monk seal shows that this species had a small ancestral effective
population size (Ne = 4343) but that the population has further contracted by 95% since the
arrival of humans in Hawaii. The DFE that I model for the Hawaiian monk seal is very
similar in shape and scale to the DFE previously estimated for humans, but different from
the one estimated for mouse. Although I could not estimate the DFE for other seal species,

149
the comparison of mammal species shows that evolution of the DFE is closely correlated
with long-term effective population size and not with phylogenetic signal or organismal
complexity.
Introduction
New mutations can have one of three effects on the fitness of an organism: positive,
deleterious, or neutral. The proportion of mutations in each category, known as the
distribution of fitness effects (DFE), must play a critical role in population genetics and
molecular evolution. For decades, theoretical and empirical research in population genetics
has worked to describe the DFE (Eyre-Walker & Keightley 2007), and the effect different
distribution shapes and parameters would have on molecular evolution (Whitlock 2000,
Orr 2003, Lourenço et al. 2011, Huber et al. 2017).
For example, if most new mutations are truly neutral then much of molecular
evolution and population genetic dynamics should follow the predictions of the neutral
theory (Kimura 1968, 1977). However, decades of molecular genetic studies show a
preponderance of evidence that the neutral theory cannot adequately explain broad patterns
of molecular evolution (Kreitman & Akashi 1995; Kreitman 1996; Hahn 2008; Thomas et
al. 2017; Kern & Hahn 2018; Yoder et al. 2018). Nearly neutral theory was developed
instead, which proposed that most new mutations had a slightly deleterious effect but
segregated and became fixed as if they were neutral (Ohta 1973, Ohta & Gillespie 1996).
This theory of molecular evolution has become widely accepted and forms the basis of
much of modern theory in population genetics and molecular evolution (Lynch 2007).
Importantly, however, nearly neutral theory only establishes the mathematical
framework through which the fixation probability of a mutation can be assessed, but does

150
not directly propose the parameters of the DFE, aside from the proposal that is gamma- or
exponentially-distributed, with a mean selection coefficient close to zero (Ohta 1992,
Keightley 1998). Many assume that the DFE is a biological universal, with the same
distribution across species (Galtier & Rousselle 2020). Other models, however, predict that
the DFE will shift in response to factors like genome complexity, epistasis, modularity, and
population size (Cherry 1998, Gillespie 2001, Goldstein 2013, Tenaillon 2014).
Among these, the Geometric Model (GM) has received attention recently for its
simplicity and applicability to population genomic data sets. Originally developed by R.A.
Fisher in 1931, this model predicts a DFE of new mutations based on a few simple
parameters like phenotypic complexity and distance of the organism from the fitness
optimum (Tenaillon 2014). Notably, this model provides acceptable solutions to paradoxes
such as the long-term survival of large-bodied mammalian populations with small effective
population sizes (Lynch & Lande 1998; Poon & Otto 2000; Whitlock 2000).
Until recently, the main source of empirical data on the DFE came from mutation
accumulation experiments that directly measured fitness effects in viruses (Sanjuán et al.
2004), bacteria (Couce et al. 2017), Arabidopsis (Schultz et al. 1999), and Caenorhabditis
elegans (Estes et al. 2004). Recent advances in population genetics and genomic
sequencing have now made it possible to model the fitness effects of segregating alleles
from population genomic data. This class of methods, including DFEalpha (Keightley &
Eyre-Walker 2007), polyDFE (Tataru & Bataillon 2019), and fitδaδi (Kim et al. 2017a). All
of these methods use the site frequency spectrum (SFS) of nonsynonymous to model the
parameters of the DFE that would produce such an SFS.
With these computational advances, it is now possible to estimate the DFE for natural
populations. Studies of closely related species have found apparent differences in the DFE

151
between island and mainland species of corvids (Kutschera et al. 2020) but similarly shaped
DFE for all great apes (Castellano et al. 2019). In more distantly related taxa, Huber et al.
(2017) found substantially different DFE for yeast, Drosophila, mouse, and humans, with
the average selection coefficient increasing in that order. The authors proposed that this
pattern fit with the Geometric Model, but attributed the difference to increasing phenotypic
complexity.
In this study, I model the DFE in six taxa of phocid seals for which population
genomic sequence data were available. As described in chapters 1 and 2 of this dissertation,
these taxa are all closely related but have dramatically different long-term population sizes.
These range from the Hawaiian monk seal, which is only found in the Hawaiian
archipelago, to the Weddell seal, which has a circumpolar distribution around Antarctica.
Importantly, these taxa do not suffer from the same population artefacts as island and
mainland taxa pairs (Goldstein 2013), and show much greater variation in population size
compared to great apes (Castellano et al. 2019). As such, these species offer an excellent
way to study the evolution of DFE in response to long-term population size.
Methods
Samples, sequencing, and alignment
In this study, I attempted to analyze six different populations: Hawaiian monk seals
(n = 14), Weddell seals (n = 10), northern elephant seals (n = 10), grey seals (n = 10), Baltic
ringed seals (n = 9), and Saimaa ringed seals (n = 12). As described in Chapter 2 of this
dissertation, I generated the data for the Hawaiian monk seals, Weddell seals, and elephant
seals, while the data for other species came from publicly available datasets. In addition, to
test for the effect of sample size I down-sampled the Hawaiian monk seal data set to 10

152
medium-coverage individuals. Details of sampling and sequencing depth can be found in
Chapter 2.
Variant calling and site frequency spectra
I used the mpileup + call pipeline in BCFtools (Li 2011), including only
basepairs with a quality above 25 and a mapping quality above 25, excluding indels, and
including only variants that were within the coding region of autosomal mammalian
orthologs (see Chapter 2 Methods for ortholog selection). I then used VCFtools (Danecek
et al. 2011) to filter the resulting variants for Hardy-Weinberg equilibrium (--hwe 0.001),
a minimum genotype quality of 40 (--minQ 40), and only biallelic variants. I used custom
SnpEff (Cingolani et al. 2012) database built from the Hawaiian monk seal reference
genome to annotate synonymous and nonsynonymous sites, and split the resulting VCF
into one VCF with only synonymous sites and one VCF with only nonsynonymous sites. I
used easySFS (https://github.com/isaacovercast/easySFS) to generate an SFS for each
functional class.
Principle component analysis (PCA)
I performed a principal components analysis (PCA) on each taxon using the VCF
of synonymous sites. I used Plink v1.9 (Purcell et al. 2007) to perform the PCA, and plotted
the resulting eigenvectors with custom scripts in R.
δaδi neutral synonymous demographic models
The first step in fitting a DFE to population genetic data is to fit a demographic
model to the synonymous SFS, which reflects how neutral processes have affected the

153
shape of the SFS. I used δaδi (Gutenkunst et al. 2009) to fit a two epoch demographic
model, which describes a single historical change in population size, to each population’s
SFS (Figure 1). The model consisted of two parameters: nu (the ratio of current effective
population size to ancestral effective population size) and T (the time ago that population
size changed, measured in 2Ne,Ancestral generations). Nu was constrained to be between
0.0001 and 10, and T was constrained to be between 0.0001 and 5. Starting parameters
were randomly perturbed in δaδi and each model run was started from at least 10 different
starting parameters to ensure that the model was not finding a local optimum from a
particular starting point. The SFS generated by the model was then compared to the SFS
from the data, and the residuals were assessed with simple Poisson residuals as:
𝑟𝑒𝑠𝑖𝑑𝑢𝑎𝑙.
K*0P<
Fitting a DFE with fitδaδi
Once the neutral demographic model of the population has been obtained, fitδaδi
(Kim et al. 2017b) can be used to fit a model incorporating selection to the nonsynonymous
SFS, conditioned upon the established demographic parameters. I attempted to fit two
different models incorporating selection. The first is a simple two epoch model that fixes
the demographic parameters from the neutral model (nu, T), and estimates the shape (α)
and scale (β) parameters for a gamma distributed DFE. In this case, the β parameter is
scaled by 2Ne,Ancestral. α was constrained between 0.001 and 1. β was constrained between
0.001 and a maximum that was calculated as (2Ne-Ancestral *smax), where smax was the
maximum unscaled selection coefficient (i.e. 0.5).
Models were assessed by their Poisson likelihoods, as implemented in δaδi. Poisson
residuals comparing the SFS of the model and real data were assessed.

154
Evaluation of distributions
To evaluate the proportion of segregating alleles in each of different selection
coefficients, I applied the shape (α) and scale (β) parameter estimates for each species in
the formula for a probability density function of a gamma distribution:
c
𝛽Za𝑥aZb𝑒Zd
𝑓(𝑥; 𝛼, 𝛽) =
𝛤(𝛼)
and solved the definite integral for the corresponding range of selection coefficients (e.g.
0, 10-4). This was done for both the scaled and de-scaled parameter in order to describe the
distribution of scaled (γ = |2Ns|) and unscaled (|s|) selection coefficients. The expected
value of a gamma distribution is calculated as:
𝐸[𝑋] = 𝛼𝛽,
And the variance as:
𝑉𝑎𝑟[𝑋] = 𝛼𝛽3 .
Results
Population structure among samples
The PCA analyses showed very little population structure for any of the taxa
examined. In the Hawaiian monk seal, samples were collected from throughout the
Hawaiian archipelago. There appears to be some clusters of samples in the Main Hawaiian
Islands, as well as a possible geographic gradient along the Northwest Hawaiian Islands
(Figure 2a). In the Weddell seal, all samples from Erebus Bay cluster together, with the

155
reference sample of unknown origin showing a separation along PC1 (Figure 2b). There is
no clear clustering of samples in the northern elephant seal (Figure 2c), all of which came
from animals that stranded in northern California.
There is no apparent structure in this sampling of grey seals (Figure 2d), Baltic
ringed seals (1e), or Saimaa ringed seals (Figure 2f). In the grey seal and Baltic ringed seal,
however, there are outlier samples that correspond to samples with much higher depth of
sequencing.
Neutral demographic models
Two-epoch demographic change models successfully converged in the grey seal,
Hawaiian monk seal, down-sampled Hawaiian monk seal, northern elephant seal, Weddell
seal, and Baltic ringed seal. In the Saimaa ringed seal, model fitting consistently pushed
the parameters to their lower bounds, with unrealistically small values of nu and T.
Grey seals, Hawaiian monk seals, and northern elephant seals all showed population
contractions (nu < 1.0) in the relatively recent past (T < 0.05). When scaled by synonymous
sequence length, mutation rate, and generation time, the grey seal had an ancestral Ne of
23,676, a current Ne of 4541, and a change in Ne at 17,814 years ago (Table 1). The northern
elephant seal had a larger ancestral Ne of 55,824, but a smaller current Ne of 798, with the
change in size occurring around 41,131 years ago (Table 1). The Hawaiian monk seal had
the smallest estimates of Ne (ancestral Ne of 4343 and current Ne of 202), with the most
recent size change (1512 years ago). When the Hawaiian monk seal data set was down-
sampled to 10 individuals, ancestral Ne was 5745 and the current Ne was 576, with the size
change taking place 5432 years ago (Table 1).

156
Conversely, Baltic ringed seals and Weddell seals both showed population
expansions (nu > 1.0) in the more distant past (T > 0.5). When scaled, the Baltic ringed seal
had an ancestral Ne of 36,625 and a current Ne of 73,716, with the size change dating to
2.522 million years ago. Weddell seals had an ancestral Ne of 32,576 and a current Ne of
76,957, with the size change occurring 476,452 years ago (Table 1).
Selection models
Using their respective demographic parameters, I fit models of selection to the
nonsynonymous SFS of each species, in which selection coefficients of the DFE were
gamma-distributed with freely varying shape (α) and scale (β) parameters. Models for the
grey seal, Hawaiian monk seal, down-sampled Hawaiian monk seal, and Weddell seal all
converged (Table 2). Models for the northern elephant seal and the Baltic ringed seal did
not converge, with both consistently hugging the upper bound of β, which represents an
unrealistic value of |s| > 0.5. I was not able to run the selection model for the Saimaa ringed
seal because the demographic model did not converge.
The estimates of the shape parameter (α) were similar across populations, ranging
from 0.161077 to 0.18232 (Table 2). The estimates of scale parameters (β) were much more
variable, ranging from 576.01 in the Hawaiian monk seal to 39016.04 in the grey seal. Even
when the scale parameters were de-scaled by diving by 2Ne-Ancestral of the species, β ranged
widely from 0.06631 in Hawaiian monk seal to 0.65916 in the grey seal.
Reflective of these differences in shape and scale parameters, E[|s|], E[|S|], and the
proportion of alleles in each range of selection coefficients differ across species (Table 3).
E[|s|] are larger in the Weddell seals and grey seal than in the Hawaiian monk seal. Var[|s|]
and Var[|S|] were also much larger in the Weddell and grey seal compared to the Hawaiian

157
monk seal (Table 3). Notably, the proportion of alleles with a scaled selection coefficient
of less than 1 (i.e. neutral) is higher in the Hawaiian monk seal than in the grey seal and
Weddell seal.
The parameter estimates of the Hawaiian monk seal data set consisting of only 10
individuals, however, differed substantially from those estimated from the full Hawaiian
monk seal data set. The estimate of α was much smaller (0.112), while β was much larger
(1.288) (Table 2). This resulted in a much higher E[|s|], E[|S|], Var[|s|] and Var[|S|] for the
down-sampled Hawaiian monk seal data set (Table 3). However, the proportion of alleles
with |2Ns| < 1 was nearly identical between the full and down-sampled data set.
Discussion
The effect of sample size
All parameter estimates for the Hawaiian monk seal differed between the full data
set (15 individuals) and the down-sampled data set (10 individuals). The demographic
parameters (nu, T) were of the same order of magnitude, suggesting that a demographic
scenario can be described relatively well from 10 individuals. This is in agreement with
Robinson et al. (2014), who found that recent bottlenecks could accurately be described by
genomic SNP data sets consisting of ten or more individuals. Robinson et al. (2014) also
note, however, that larger sample sizes are required to accurately describe more recent
events, and especially recent expansions. This may explain why a more recent change in
population size was detected in the Hawaiian monk seal (i.e. around 1500 years ago)
compared to in the taxa with smaller sample sizes (> 15,000 years ago). As discussed below,
the parameter estimates from the full data set better align with the known history of this
species, suggesting that increasing the number of individual does increase the accuracy of

158
the parameter estimates, especially if those individuals are associated with higher quality
genome sequencing.
On the other hand, the estimates for the shape and scale parameters of the gamma
distribution in the selection model are dramatically different between the full and
downsampled data sets. The scale parameter in particular differs by two orders of
magnitude. Because the scale parameter describes the spread of the distribution, the larger
scale parameter in the down-sampled data set shifts a greater proportion of the distribution
to larger selection coefficients (Table 3a and 3b). Interestingly, the proportion of nearly
neutral mutations (|2Ns| < 1) is nearly identical in both sample sizes. This may be
coincidental. However, it is also possible that this portion of the distribution is easier to
accurately describe with a reduced sample size because nearly neutral mutations segregate
at higher frequencies than more strongly deleterious mutations. Kim et al. (2017) found a
similar pattern in down-sampling a human population genomic data set to 12 individuals,
although they argued that this sample size allowed them to estimate the parameters of the
gamma distribution with relative accuracy. My results here suggest that further
downsampling to 10 individuals may introduce too much error, or that the necessary sample
size is dependent on the particular SFS and DFE of the population. This latter reason may
explain why the selection models for some species (i.e. northern elephant seal and Baltic
ringed seal) did not converge, despite having 9-10 individuals.
A number of recent studies that model the DFE through the site frequency spectrum
use much smaller sample sizes than 10 individuals, although they fit the model with
methods other than fitδaδi. In a simulation study using DFEalpha (Eyre-Walker &
Keightley 2007), Keightley and Eyre-Walker (2010) attempted to find the optimum
sequencing effort that would result in reliable parameter estimation for the DFE and

159
concluded that 10 alleles (i.e. five diploid individuals) would be the optimum for genomic
data sets. This clearly stands in contrast to the empirical sampling results I found here,
which suggest more than 10 diploid individuals are necessary for accurate estimation.
Notably, the two methods of DFE estimation (DFEalpha vs. fitδaδi) differ in their approach
to model fitting, and in fact have found conflicting estimates of the DFE in Drosophila and
humans (see Eyre-Walker & Keightley (2007) vs. Huber et al. (2017)). Given the empirical
results here, a more thorough comparison of these modelling methods and their required
sample sizes is warranted.
For now, this conflict makes it difficult to compare my results to studies that use
different estimation methods given the differences in both modelling and sample size. For
example, Kutschera et al. (2020) compare the DFE across corvid species living on islands
and mainland using only 4 samples per taxon (implemented in DFEalpha). Galtier and
Rousselle (2020) examine the DFE in 28 animal taxa with sample sizes as low as 5 per
taxon, again using the DFEalpha but with a new “Gamma+Lethal” distribution model.
Castellano et al. (2019) use yet another method, polyDFE (Tataru & Bataillon 2019), to
compare DFE shape and purifying selection efficiency across primates. Comparisons of the
actual shape of the DFE, rather than simply the proportion of nearly neutral mutations, are
therefore likely unreliable across methods and with small sample sizes. Because of this, I
restrict my in-depth comparisons to the few studies that have also used fitδaδi to model the
DFE.
In addition, the difference I found in parameter estimates between the full data set
and down-sampled data set of the Hawaiian monk seal suggests that the results from the
taxa with 10 or fewer individuals (i.e. grey seal, northern elephant seal, Baltic ringed seal,
Saimaa ringed seal, Weddell seal) should be interpreted cautiously. Specifically, the

160
parameter estimates of the demographic model may be accurate, but the parameters of the
selection model should be viewed as inaccurate. The one exception is the estimated
proportion of nearly neutral mutations, which apparently can be accurately estimated even
from a smaller sample size. For the remainder of the discussion, I will therefore mainly
address the models from the full Hawaiian monk seal data set given the uncertainty around
the parameter estimates from the other species.
Population structure and recent demography of Hawaiian monk seals
Using synonymous SNPs, I found only weak evidence of population structure
among monk seals in the Hawaiian Islands. This is in agreement with previous studies using
microsatellite markers, which found inconclusive (Kretzmann et al. 2001) or no structure
(Schultz et al. 2009) in this species. Rather than a true structuring among the islands of the
archipelago, my results suggest a weak isolation-by-distance that forms a gradient along
the length of the Northwest Hawaiian Islands. Notably, the seals from the Main Hawaiian
Islands do not fall along this continuous gradient, which may be evidence of a re-
colonization of the Main Hawaiian Islands.
This weak structure is somewhat surprising, given that the Hawaiian archipelago
spans 2400 kilometers, and the related Mediterranean monk seal shows population
structure at a relatively small scale (Karamanlidis et al. 2016b). In recent years, some
Hawaiian monk seal pups have been translocated from Papahānaumokuākea Marine
National Monument to the Main Hawaiian Islands (Baker et al. 2020), though there were
concerns that this may disrupt natural population structure in the islands (Kretzmann et al.
2001). With only a few seals translocated every year in a population of 1400, the
translocated seals themselves could not have produced the pattern I recover in this analysis.

161
My results show little meaningful population structure exists in Hawaiian monk seals, and
translocations can continue without concerns of disrupting local adaptations.
The results of the demographic modelling in δaδi also offer interesting insight into
the history of this endangered species. The scaled parameters suggest that prior to around
1500 years ago, this species had an ancestral Ne of 4343. This is very similar to my results
from Chapter 1, in which I used pairwise coalescent modelling (MSMC, Schiffels & Durbin
2014) from a single Hawaiian monk seal genome to estimate that the species had declining
population leading to an Ne of around 2000 as recently as 10,000 years ago. Because the
model I fit in this analysis contains only two time period, the ancestral Ne is more accurately
viewed as an average of the Ne during the older time period, which likely explains why the
estimate from δaδi is slightly higher than the final estimate from MSMC.
Around 1500 years ago, the δaδi demographic model recovers dramatic bottleneck
of 95% to an Ne of 202. The timing of this bottleneck is remarkably in line with when
Hawaiian monk seals first interacted with humans. Polynesians most likely settled the
Hawaiian archipelago between 1500-1000 years ago (Kirch 2011), mainly settling in the
Main Hawaiian Islands. Though physical evidence is scarce, archeological evidence
suggests that seals were effectively extirpated from the Main Hawaiian Islands early on
(Kittinger et al. 2011), although European colonizers noted them in the Northwest
Hawaiian Islands (NWHI), with one ship (the Gambia) reportedly collecting 1,500 seal
skins from the NWHI in 1859 (Schultz et al. 2010).
Taken together, the historical and genetic evidence paint a clear picture of the
history of this endangered species. As an island species reliant on coastal waters in an
isolated archipelago, the Hawaiian monk seal had a naturally low carrying capacity in the
Hawaiian islands. When humans first arrived in the islands, they hunted the species and

162
restricted its territory to the NWHI. Finally, significant European seal hunts during the 19th
century further decreased the population of seals in the NWHI. This combination of
longterm small population size and more recent bottlenecks has left the species with the
lowest genetic diversity of any naturally occurring mammalian population.
The evolution of the DFE in mammals
Using the same two epoch demographic and gamma-distributed selection models
in fitδaδi, Huber et al. (2017) found that the DFE for humans (ancestral Ne = 7070) could
be modeled as a gamma distribution with a shape parameter (α) of 0.19 and a scale
parameter (β) of 0.074. They also found that the DFE for mouse (ancestral Ne = 282,800)
was gamma-distributed with α = 0.22 and β = 0.016. The parameters describing the human
DFE are nearly identical to those I found for the DFE of the Hawaiian monk seal. In fact,
the Poisson likelihood of the Hawaiian monk seal model with the human-derived scale and
shape parameters is marginally higher than the likelihood of the model with the parameters
optimized from the Hawaiian monk seal SFS (–69.7782 and –69.83949, respectively). On
the other hand, the likelihood of the Hawaiian monk seal model using the mouse parameters
is slightly lower (–70.0061). Accordingly, the mean selection coefficient for the Hawaiian
monk seal (|s| = 0.01209) is nearly the same as in humans (|s| = 0.01406), both of which are
3–4X smaller in the mouse (|s| = 0.00352).
When alleles are binned into ranges of selection coefficients, the similarity between
the human and Hawaiian monk seal DFEs is also clear. Humans and the Hawaiian monk
seal have fewer mutations of small effect (|s| < 10-4) and many more of large effect (|s| >
10-2) compared to the mouse. In the distribution of scaled selection coefficients, humans

163
and Hawaiian monk seal have many more nearly neutral alleles (|2Ns| < 1), while the mouse
has many more alleles with large scaled selection coefficients (|2Ns| > 100).
In their study, Huber et al. (2017) noted the DFE in mouse is shifted toward smaller
selection coefficients compared to in humans. In addition, they noted that in Drosophila
and yeast the DFE was even more dramatically towards smaller selection coefficients. They
consider four evolutionary theory frameworks that could explain this pattern: a functional
importance model, a protein stability model, a back-mutation model, a
mutationalrobustness model, and the geometric model. Through their analysis, they
conclude that the geometric model (Tenaillon 2014) best fits the observed pattern.
My results similarly support the geometric model, with one crucial difference in
interpretation from Huber et al. (2017). The geometric model has two main parameters that
affect the DFE: the distance a population is from a fitness optimum (d), and the phenotypic
complexity (n). Tenaillon et al. ( 2007) showed that if the distance (d) is determined by the
fixation of slightly deleterious alleles through genetic drift, the equilibrium drift load in the
geometric model can be approximated as:
−) ,
3kl
where n is phenotypic complexity, Q is an epistasis parameter, and N is the effective
population size.
Huber et al. (2017) argue that phenotypic complexity (n) increases from yeast to
Drosophila to mouse to human. Complexity is a fraught term in evolutionary biology,
which lacks a strong definition (Adami et al. 2000, Tenaillon et al. 2007). Intuitive, but
taxonomically biased, views of complexity may invoke aspects such as morphological
diversity, multicellularity, and tissue differentiation in assessments of diversity. Even if this
view of complexity is used, it is difficult to defend the position that a human is more

164
complex than a mouse when the two are compared to all other forms of biodiversity.
Furthermore, to align this hypothesis with my estimate of the DFE in seals, one would have
to argue that Hawaiian monk seals are more complex than mice and about as complex as
humans. In light of my results, invoking complexity is a weak biological argument. In
addition, increasing n is predicted to lead to a smaller proportion of beneficial alleles (Pben)
in the geometric model, which conflicts with pattern of Pben across species as described by
Huber et al. (2017).
As the drift load formula shows, however, distance from the fitness optimum is also
be affected by N. Notably, the effective population sizes of these species decrease from
yeast to drosophila to mouse to humans, with the effective population size of humans being
roughly equivalent to that in Hawaiian monk seals. Effective population size therefore
appears to be a more biologically plausible explanation when the DFE results from the
Hawaiian monk seal are included. As Huber et al. (2017) note, though, the difference in
mean selection coefficient between humans (or Hawaiian monk seal) and mouse is about
an order of magnitude smaller than the difference between their effective population sizes.
While long-term effective population size appears to be an important determinant of the
DFE, other factors are likely to affect this distribution as well.
Conclusion
In summary, I find further evidence that the Hawaiian monk seal population has
always been relatively small, but I add important context by showing that the species
went through a 95% reduction in population size after the arrival of humans in Hawaii.
By modelling the DFE, I show that the shape of the DFE in Hawaiian monk seals is
similar to that in humans, but both are different from the DFE in mouse. Given that mice

165
are phylogenetically closer to humans than to seals, this cannot be due to phylogenetic
signal. There is also not an obvious biological case that seals are more phenotypically
complex than mice. The obvious explanation is that humans and Hawaiian monk seals
have extremely similar long-term effective population sizes, while the long term effective
population size of mice is much larger. The geometric model predicts that the DFE would
evolve in response to population size if smaller populations are less fit through the
accumulation of slightly deleterious mutations.

