


1
INTRODUCTION
Unfortunately, in the forensic context there are cases involving fetal and neonatal
skeletal remains. Accurate age estimation of these remains can be very important to
medicolegal authorities, particularly as it is sometimes necessary to determine if these
skeletal remains are those of a full-term neonate or a pre-term fetus. Age estimation is
usually the primary characteristic for identification and is often the only means of
identification for fetuses and neonates since they do not usually have any other type of
identification with them (Hoffman, 1979; Scheuer et al., 1980; Weaver, 1998). Age
estimation can also play an important role in the prosecution of forensic cases.
According to Schueur (2002) determination of fetal age, specifically if the fetus reached
full-term, can have legal importance in forensic cases. Whether the individual was
liveborn or stillborn is significant to a forensic case. In cases of criminal abortion or
infanticide, the age of the fetus is integral to the prosecution (Fazekas and Kosa, 1978).
Today, forensic anthropologists use prediction models for age estimation based on
fetal skeletal samples from the early to mid-20th century. These were developed by
Fazekas and Kosa (1978). These methods may tend to over-age modern samples given
the trend of increasing fetal body length during the 20th century. Studies have shown an
increase of 1cm in fetal length every two generations (Olivier, 1977). One centimeter
may seem minimal but is actually quite significant. This secular change could potentially
lead to a modern fetus that is actually 7 lunar months aged at 9 lunar months using
standard prediction models. An over-estimation of fetal age such as this would have a

2
significant impact on the identification of an individual and could also affect the outcome
of a forensic case.
There are also age estimation formulae developed using data from ultrasounds
and radiographs. Two of these are Chervenak et al. (1998) and Sherwood et al. (2000).
Neither of these studies used measurements collected directly from the fetal skeleton.
They also did not compare their results with age estimates based on the prediction
formulae of Fazekas and Kosa (1978). None of these studies addressed the secular
change in fetal body size. A comparative look at all three studies that also addresses
secular change is necessary to determine which method produces the most accurate age
estimates for forensic fetal remains. It is clear that a method that can accurately age from
dry bone is necessary. According to Stewart (1979) the soft tissue of fetal remains from
the forensic context are often so deteriorated that accurate estimations of size and age can
only be made after the remains are processed into clean, dry bones.
Problem Statement and Thesis Objective
This research tested the efficacy of the traditional method used in forensic
anthropology for fetal age estimation (Fazekas and Kosa, 1978) and compared it to
prediction formulae derived from ultrasounds of in utero fetuses (Chervenak et al., 1998)
and radiological data on modern fetuses (Sherwood et al., 2000). Two data sets from
known age fetal and neonate skeletons were used for testing the age estimation formulae
for fetal remains. It was expected that the recently developed ultrasound method
(Chervenak et al., 1998) would produce more accurate age estimates for modern fetal
remains recovered from the forensic context. This is because the Chervenak et al. (1998)

3
study utilized normal, healthy pregnancies of modern fetuses. These individuals are
thought to be most like the remains of those found in the forensic context. Fazekas and
Kosa (1978) and Sherwood et al. (2000) both used spontaneously aborted fetuses.
Many studies, past and present, have used spontaneously aborted fetuses which
may show abnormal development whereas forensic cases likely tend to include remains
of a normally developing fetus. It is reasonable to believe that spontaneously aborted
fetuses are not developing normally. According to Sluder and McCollum (2000), 20% of
all conceptions have major chromosomal abnormalities which lead to spontaneous
abortion. Jones et al. (1986) state that it is impossible to determine how the fetal
development was affected in individuals that were spontaneously aborted. They also
cautioned that the normality of the fetus must be taken into account when researching
fetal measurements. Olsen et al. (2002) developed a population based data set of fetal
skeletal measurements from radiographs. Their sample consisted of 495 fetuses in
Norway, 13% of which were aborted the rest were either perinatal or neonatal deaths.
They found that the average bone lengths from their sample were shorter than those from
studies concentrating on healthy fetuses. Olsen (2006) warned against using ultrasound
dating to estimate gestational age in abnormal fetuses due to “a wide range of
fetal/placental/maternal abnormalities are associated with fetal growth restriction, which
in turn influences biometry-based dating” (p 93). Taking into account the possible effects
of pathology on the Fazekas and Kosa (1978) and Sherwood et al. (2000) models, the
prediction formula developed by Chervenak et al. (1998) should produce the most
accurate age estimations for forensic fetal remains.

4
REVIEW OF LITERATURE
The separate study of fetal remains is necessary since morphology is very
different from that of an adult individual. General forensic osteological methods are
either completely useless or are very restricted when applied to fetal remains due to their
lack of development. However, compared to adult individual analysis, when the fetal
remains are complete, aging is relatively easy. The problem arises when only a few
bones are present (Fazekas and Kosa, 1978).
Development
The study of fetal skeletal development has been of interest for centuries. The
first known studies were conducted by Galen (ca. 130-200 A.D.) who recorded seven
ossification centers in the sternum and two in the mandible (Noback, 1944). Since that
time, the process of ossification of fetal bones has been well documented and is relatively
well understood. Fetal skeletal development follows two paths, endochondral and
intramembranous. Intramembranous bones use connective tissue as a model for the
ossification process whereas endochondral bones use a cartilage model. Examples of
intramembranous bones include those of the cranial vault, while bones such as the
humerus and femur, are endochondral in origin (Arey, 1966; Patten, 1968; Hamilton and
Mossman, 1972).
The ossification of fetal endochondral and intramembranous bone begins as early
as the sixth week of gestation. This process happens at a regular rate that is bone specific
(Gray and Gardner, 1969; Gardner and Gray, 1970; Walker, 1991). The process is
similar for both endochondral and intramembranous bones. Endochondral bone

5
ossification has an additional step, the removal of cartilage to make room for the bone
matrix. Inside the bone cartilage cells enlarge and are then destroyed. This creates the
early stage of the marrow cavity. Vascular tissue invades this cavity and creates the
beginning of the marrow. This gives rise to osteoblasts, which begin the ossification
process by laying down the bone matrix. Osteoblasts use the surfaces of cartilage cells to
deposit matrix; this is what gives the internal matrix of long bones a spongy appearance.
As the bone matrix builds, osteoblasts become trapped and remain so. The spaces these
cells, now called osteocytes, occupy are called lacunae. After spongy bone development
begins, compact bone starts to develop on the surface of the long bone. This is a process
of building bone, destroying bone, and then remodeling bone. The result of which is the
formation of concentric cylinders that contain blood vessels, called Haversian systems
(Arey, 1966; Patten, 1968; Hamilton and Mossman, 1972; Valdés-Dapena, 1979). This
system provides the necessary blood supply for continued ossification and bone growth.
Ossification occurs at specific points called ossification centers. Since the
prenatal environment protects the fetus from nutritional deficiencies, the appearance of
ossification centers does not show much variability (Hill, 1939). In particular, the
ossification centers in the long bones appear around the same time (Noback and
Robertson, 1951). While they are temporally close, there is a specific order of
appearance. Ossification centers show up first in the humerus, last in the fibula and
simultaneously in the femur, radius and ulna followed shortly after by the tibia (Bagnall
et al., 1982). Studies have shown that the ossification start points differ between fetuses
an average of 0.3 weeks. The ossification of long bones begins in the center of the
diaphysis and progresses towards the ends of the bones (Deter et al., 1987).

6
The rate of growth differs significantly between the upper and lower limb bones.
In early development, the upper limb bones are longer than the lower limb bones. This is
due to earlier ossification and faster growth rates. Watkins & German (1992) studied
fetuses aged 19-40 weeks gestation. They found that during later development, the
growth rate of the lower limb bones increases and the bones become longer than those of
the upper limb. This gives body proportions closer to that of an adult (Hattori, 1978).
According to Bagnall et al. (1982), who studied early gestation fetuses, this shift between
upper limb and lower limb development can occur as early as 16 weeks gestation.
Moss (1955) stated “The growth of the human fetus is characterized by great
changes in relative proportions that occur simultaneously with absolute increases in
size…These quantitative changes are capable of simplified expression” (p 528). Robb
and Clarke (1934) showed that the long bones in a fetus show linear growth. Deter et al.
(1987) also found that growth during the fetal phase follows a linear pattern right up until
parturition. There is a slight deceleration right before birth, but it is negligible. This
deceleration in length when looking at long bones, such as the femur, may actually be an
increase in the curvature of the bone (Deter et al., 1987). With an established regular
fetal growth pattern the neonate can be seen as representing the end of this pattern
(Weaver, 1998). By 12-13 weeks gestation bones such as the femur are distinct enough
for identification (Scheuer and Black, 2000). However, according to Issel (1985)
measurements prior to 14 weeks gestation are too poor to use to date pregnancies.
Between the 14th and 16th weeks of gestation long bone measurements are more accurate.
The process of ossification is well understood and provides a way for forensic

7
osteologists to estimate the age of fetal remains and discern if they are those of a fetus or
neonate.
While ossification and growth are regulated, environmental influences are
possible. Owsley and Jantz (1985) studied fetal and neonatal bones of Arikara Indians.
They state that prenatal growth is hindered in poor socioeconomic conditions. Maternal
malnutrition or illness can result in fetuses that are small for their gestational age.
Henriksen et al. (1996) state that fetal size can be affected by maternal height and weight,
maternal smoking and nutrition. This should be taken into account when analyzing
remains.
According to Chiarelli (1977) the trend of increase in stature is due to
embryological development, not nutrition received as a fetus, infant or child. Therefore
stature is the result of genetics and is not affected by nutrition. This secular change in
fetal body length was shown in a study of Parisian infants from 1910-1972 by Olivier
(1977). Measurements of body length were taken from healthy single births from 1910,
1930, 1952, and 1972. The results show that while the average birth weight of newborns
had not changed, the average body length gradually increased through the years. This
increase in length was shown to be statistically significant. The secular change in fetal
body length must be considered when aging remains.
Huxley (1998a) states that using the regression formulae of Fazekas and Kosa
(1978) to estimate fetal age in a modern forensic case is problematic. This is due to
secular change. She also states that better maternal nutrition, a decrease in disease and
better access to prenatal care may have an effect on the accuracy of these formulae when
used on current remains. Not only is fetal skeletal development affected by the

8
environment, several studies have documented secular change in adult morphology (Cole,
2000; Meadows and Jantz, 1995; Meadows and Jantz, 1999; Alberman et al., 1991)
Age Estimation
Researchers have looked at several different bones for estimating fetal and
neonate age. Burdi et al. (1979) researched the use of metacarpal and phalangeal bone
lengths to determine crown-rump length. Their sample consisted of 263 fetuses which
were labeled as normal or abnormal using maternal charts. They found that hand bone
lengths had a linear correlation of 0.98 with crown-rump length. Crown-rump length is
commonly used to determine fetal age. The development of the tympanic plate was
studied by Curran and Weaver (1982). They used the Lamb Collection housed at the
National Museum of Natural History, Smithsonian Institute for their sample. It contained
over 300 fetal and infant skeletons collected from 1902-1917. The tympanic plates were
assessed for their level of development and assigned developmental stage of 1, 2, or 3.
They found that the tympanic plate was very useful in determining whether the remains
were those of a fetus or a neonate. Those assigned Stage 1 are generally fetal, Stage 2 are
generally postnatal and not fetal, and Stage 3 are most likely not fetal. Dilmen et al.
(1995) studied the use of ultrasonographic scapula measurements for determining fetal
growth. They used ultrasound information from 343 healthy pregnancies. The
researchers found strong correlations between scapula length and biparietal diameters,
fetal abdominal circumference, and femur length. The strongest correlation was between
scapula length and femur length. Dilmen et al. (1995) suggest that when assessing

9
skeletal development, if the femur length cannot be measured, the scapula length could
be useful.
Most researchers have concentrated on long bone lengths for fetal age estimation.
According to Moss et al. (1955) the postcranial bones are used because the length of the
diaphysis can be measured accurately and the diaphysis is the major contributing factor to
the length of the gross body segment. Fazekas and Kosa (1978) state that the diaphysis
measurements of long bones are the best from a medicolegal point of view because they
can be easily identified from the other skeletal bones and are easier to measure than flat
bones that have curves and angles.
Trotter and Peterson (1968) studied total fetal weight, skeletal weight, and long
bone lengths to determine age. They measured and weighed 29 fetuses as cadavers, then
processed them down to dry bone. Once the processing was complete, they measured the
length of the long bone diaphysis except for the ulna and fibula. These dry bone
measurements were then compared to the soft tissue measurements and correlations were
determined. They found a significant correlations between the variables of cadaver
weight, skeletal weight, long bone length and gestational age. A regression model was
developed using these variables and it proved as accurate as a simple allometric model.
The Trotter and Peterson (1968) formula was not used to compare with the Fazekas and
Kosa (1978), Chervenak et al. (2000), and Sherwood et al. (2001) formulae due to their
use of body weight as a variable.
Mehta and Singh (1972) also compared soft tissue measurements and long bone
measurements to fetal age from 50 fetuses. They first measured crown-rump length and
then processed the cadavers. When the skeleton was dried, humerus and femur

10
diaphyseal lengths were taken. They compared the long bone lengths with crown-rump
length and found a correlation coefficient of 0.9956 for the femur and 0.9893 for the
humerus. Mehta and Singh (1972) stated that crown-rump lengths determined from
humerus or femur diaphyseal lengths can then be used to estimate age on a standard age
and size curve with reasonable accuracy. According to Kosa (1989), long bones are most
useful when determining gestational age. A single bone can give an accurate estimate of
fetal age. This accuracy is fortunate since long bones preserve better as they are more
resistant to decay than other bones of the skeleton. Thus, the fetal remains most likely to
be recovered are also most likely to give accurate age estimates.
Early attempts to generate age estimation formulae for fetal skeletal remains from
the forensic context used skeletal collections where age was based on maternal history or
soft tissue estimates. Fazekas and Kosa (1978) used 138 spontaneously aborted fetuses of
European origin for their sample. In order to obtain the most accurate body length
measurement possible, only fresh cadavers were used. The known ages of these fetuses
were determined from maternal history. The cadavers were measured and then processed
down into dry bones. A linear correlation was found between body length and long bone
length (humerus, ulna, radius, femur, tibia and fibula). This correlation allowed Fazekas
and Kosa (1978) to develop a regression model that used long bone length to estimate
body length. Age was estimated based on the correlation between body length and
gestational age. Using their projection model, Fazekas and Kosa (1978) found when
using femur length, they could estimate age with 1/2 lunar month precision. They found
a R2 of 0.9985 which shows a very strong correlation between the estimated and known

11
ages of the individuals. Overall, they found that their model "showed that the possibility
of error in age determination is remarkably slight, not more than 1/2 lunar month" (p 18).
The work of Fazekas and Kosa (1978) has been tested on other samples by a few
researchers. Ubelaker (1989) tested the utility of the prediction model created by Fazekas
and Kosa (1978) on individual cases. Two fetal skeletons from an archaeological site and
four skeletons from the Smithsonian fetal collections were used. This study found that
the error was much higher than the one-half lunar month found by Fazekas and Kosa
(1978). This was believed to be the result of the application of their method to a different
sample. Ubelaker (1989) stated that the use of poorly preserved specimens from
archaeological and forensic contexts are problematic with this method.
According to Huxley and Jimenez (1996) the findings of Fazekas and Kosa
(1978) have provided standards that are commonly used in forensic anthropology. They
stated that these standards have been accepted with very little criticism of their
techniques. They found that the lack of firm gestational ages in the samples used by
Fazekas and Kosa (1978) was problematic. Huxley and Jimenez (1996) studied the use
of radial diaphyseal length in estimating fetal body length and age. Their results showed
that measurements from the radius estimated an average stature 12-13cm taller than the
ulna, tibia, and fibula. This led to an age estimate two and a half lunar months older than
that derived by the ulna, tibia, and fibula. For this reason, Huxley and Jimenez (1996)
suggest caution when using radial measurements for estimating fetal age.
Fetal skeletal measurements are an important part of ultrasonic gestation
determination in obstetrics. Ultrasound formulae routinely utilize femur diaphyseal
length. Like most age estimation regression formulae, ultrasound formulae use femur

12
diaphyseal length to determine the length of the fetus. Fetal length is then used to
determine the gestational age. Researchers have looked at the validity of such
correlations. Attico et al. (1990) stated that femur lengths determined by ultrasound can
be a very accurate predictor of fetal age with an error of plus or minus one week.
Quinlan et al. (1982) researched femur length measurements collected by ultrasound and
their use to determine age. Femur lengths were measured on 125 pregnancies from 14-36
weeks gestation. Linear regression analysis was performed and they found an accuracy
of plus or minus seven days with 95% confidence. While it has been shown that the
femur is helpful in age estimation, Goldstein, Filly and Simpson (1987) warned about
possible problems using femur length for estimating fetal age. They found that certain
angles with an ultrasound can result in shortening of the femur in the image and thus
underestimation of femur length. They did state that when the femur is accurately
measured, it can be a valuable piece of information.
Jeanty et al. (1984) studied the estimation of gestational age of fetuses from long
bone lengths taken by ultrasound. They looked at the humerus, femur, tibia and ulna
lengths in 220 healthy fetuses from 12-40 weeks gestation. The results showed that each
bone was reliable at estimating gestational age; however, Jeanty et al (1984) suggested
using a combination of bones, e.g. humerus and femur, when possible to increase
accuracy. Hadlock et al (1987) also found that using multiple parameters was more
accurate for fetal age estimation using ultrasound measurements.
Chervenak et al. (1998) studied the accuracy of aging in-utero fetuses by
ultrasound. The sample consisted of 152 pregnancies from 1990-1996 at The New York
Hospital-Cornell Medical Center. Head circumference, biparietal diameter, femur length,

13
and abdominal circumference measurements were taken. They developed several
regression formula and tested them to see which was the most accurate at estimating age.
These regression formulae used single measurements as well as combinations of different
measurements. Several formulae were found to be accurate in estimating fetal age. They
found that head circumference was the most accurate, however, femur length increased
accuracy when added as a variable to a regression formula. Chervenak et al. (1998)
found that the formula based on femur length produced age estimates that had strong,
statistically significant correlations with the known ages of the individuals used in their
study. The regression formula for femur length had an R² of 0.914 with an error of 4.35
days.
Researchers have also attempted to develop age estimation formulae from
radiographic measurements. Scheuer et al. (1980) took long bone measurements from
radiographs of 82 individuals. The femur, tibia, humerus, radius, and ulna were used.
They developed logarithmic and linear regression models to estimate age. Data from four
archaeological fetal remains were run through these regression formulae and the resulting
age estimates were compared to those produced using formulae developed by other
authors. Scheuer et al. (1980) found that the estimated ages from their research coincided
with those of the other formulae. They note that the radiographs were most likely those
of fetuses with abnormal development and they would not be representative of “normal”
fetuses. Scheuer et al. (1980) thought that this might not be problematic since fetal
remains that an archeologist or anthropologist would work with would most likely be
those of a developmentally abnormal fetus. Falkner and Roche (1987) used radiographic
measurements of femur diaphyses and compared those to the recumbent length in 238

14
neonates. They found a highly significant correlation between femur length and
recumbent length.
Huxley (1998a) compared the results of three different regression formulae,
Olivier and Pineau (1958; 1960), Fazekas and Kosa (1978), and Weaver (1986), using
measurements from a single fetus. Diaphyseal lengths were taken from radiographs and
were corrected for shrinkage before running the data through the formulae. She found
that the different ages generated were comparable. Huxley (1998a) also looked at foot
length to estimate gestational age and found that it corresponded with ages from
diaphyseal lengths.
Warren (1999) used radiographic long bone measurements to estimate ages in 398
spontaneously aborted and aborted fetuses from 4 lunar months gestation to neonate.
These were used to develop a regression formula to calculate crown heel length. Age
estimates derived from this formula were compared with those derived using Fazekas and
Kosa (1978) formulae. The results were corresponded closely with Fazekas and Kosa’s
(1978) results. Warren (1999) suggested that radiographic measurements be used when
dry bone measurements are unavailable or undesirable.
Bareggi et al. (1994) researched the accuracy of total length of developing arm
long bones versus ossified length as corresponding to developmental age. Their sample
included 58 aborted embryos and fetuses. They found that the total length, which
included cartilage that had not been ossified yet, did not have a reliable correlation with
age. Bareggi et al. (1994) found that the ossified portion of long bones showed a much
stronger correlation with developmental age.

15
Recent work in fetal age estimation has looked at a mixture of soft tissue
measurements and measurements from radiographs. Sherwood et al. (2000) used this
technique on a sample of 136 fetuses. These fetuses had been spontaneously aborted and
the known ages were based on maternal history. Seventy-two of the fetuses were
determined to be the result of an acute mechanism of fetal loss such as intra-uterine
infection or acute placental-cord compromise. These individuals comprised the core
group for age estimation. The rest of the fetuses were diagnosed with pathological
conditions such as trisomy 18, trisomy 21, Turner's syndrome, anencephaly, spina bifida,
renal dysgenesis, miscellaneous chromosomal anomalies, and uterovascular
insufficiency. Soft tissue measurements were taken, and then the cadavers were
autopsied and radiographed. Long bone measurements were taken from these
radiographs and regression formulae were developed. The estimated ages generated by
Sherwood et al. (2000) were compared with ages generated by the Chevernak et al.
(1998) model. Fetuses were consistently under-aged 2 to 4 weeks by the Chevernak et al.
(1998) method. They found that radiological measurements were more accurate but
noted that the difference could be due to the difference between aborted fetuses versus
healthy in utero fetuses. It was also found that skeletal measurements from the femur,
tibia, and ulna were the best predictors of age with the femur length being the best
overall.
Problems with Fetal Age Estimation
It should be noted that there are some inherent problems with aging fetal remains.
Probably the most significant is that the exact age of the fetus can never be known

16
without some discrepancy. This is due to potential error in calculating the gestational age
of the fetus based off of LMP or Last Menstrual Period (Roche 1980). According to
Jones et al. (1986), there is an error of at least +/- 1 week when determining gestational
age by LMP dates, even if the dates are known with accuracy. They found that even in
women who knew the exact day of copulation that resulted in pregnancy; it was difficult
to determine an exact gestational age. Therefore, it is difficult to develop a completely
accurate aging methodology. According to Roche (1980) there is no way to solve this
problem but the effects can be lessened by using data with more reliable gestational ages.
Sexual dimorphism has been posed as an issue in fetal development. Researchers
have found conflicting results. It has been postulated that female fetuses begin
ossification earlier than male fetuses (Cope and Murdoch, 1958). Some studies have
found that females did seem to be more advanced in their ossification after 21 weeks
gestation, but it was not statistically significant (Bagnall et al., 1978; Bagnall et al.,
1982). An early study by Hill (1939) showed that female fetuses were advanced for a
period of time and that male fetuses caught up by birth. Burdi (1979) found that female
fetuses had more bones developed than males of the same age and the bones of females
were longer. According to Weaver (1998) the bones of male fetuses are generally
heavier and longer than those of females of the same chronological age. Other studies
have shown that the sex of the fetus does not change the ossification rate or growth
velocity (Hesdorffer and Scammon, 1928; Panattoni et al, 1999). Research by Birbeck
(1976) did not show any evidence of sexual dimorphism when evaluating limb bones for
gestational age. According to Deter et al. (1987) and Sherwood et al. (2000), the growth
of the femur does not show any difference between male and female fetuses.

17
Asymmetry in limb bone ossification of the human fetus has could create
potential problems with fetal age estimation. Research has shown that there is a
difference in the growth rate in an individual between the left and right side (Bagnall et
al., 1978; Bagnall et al., 1982). However, when averaged throughout a sample of
individuals, the difference in the growth rate was not significant and would therefore not
be an issue skewing data.
Another potential problem with estimating the age of fetuses is ancestry
(Henriksen et al., 1996). Jakobovits et al. (1972) studied crown rump lengths in embryos
and found the differences between American, half of which were of African ancestry, and
Danish individuals were not significant. However, they stated that separate standards
should be developed for each due to the bias in their data. Hungarian individuals
established the early stages, Danish the middle stages, and American the highest
developmental stages. This makes it difficult to compare to show ancestry differences.
Fetal femur lengths from ultrasound measurements in Hispanic, Black, Oriental,
and Caucasian fetuses were compared by Ruvolo et al (1987). Femur length
measurements were taken from 314 fetuses where the last known menstrual period was
between 19 and 32 weeks prior to the study. Ruvolo et al (1987) used ultrasound
regression formulae to estimate gestational age from these femur lengths. There was no
statistically significant difference found between the four groups.
Davis et al. (1993) compared several ultrasound fetal measurements by ancestry.
Biparietal diameter, head circumference, abdominal circumference and femur length
were the variables studied. Their sample included 2,831 pregnancies where 70% were
black and 30% were white. All participants were below the US Federal poverty level.

18
They found that black fetuses had significantly longer femurs than white fetuses. Their
study evaluated fetuses from 16-40 weeks gestation. This difference in femur length was
shown to be true in almost every gestational age. Davis et al. (1993) stated that while
they did find differences, it did not significantly impact the ultrasound determination of
gestational age. They thought that this may be to their use of a formula with multiple
parameters.
The effect of ancestry on fetal measurements was researched by Lim et al (2000).
Their study included 450 neonates born to Malaysian, Chinese, and Indian women. All
were healthy pregnancies with live births. Femur length was measured using ultrasound
within 48 hours of birth. The mean femur length of Indian neonates was significantly
longer than that of the Malaysian and Chinese neonates. They concluded that there are
differing body proportions in various Asian populations. This supported the results of
previous research by Yeo et al. (1994).
Shipp et al. (2001) took femoral measurements by ultrasound from 39 Asian, 31
black, and 100 white pregnancies from 15 to 20 weeks gestation. They found that the
femur lengths of Asian fetuses were shorter than expected and those of black fetuses were
longer than expected. Shipp et al. (2001) concluded that there were slight differences
between races. While this is a small difference, they believed that it could have an effect
when using fetal biometry charts.
Prenatal growth differences between ethnicities were studied by Drooger et al
(2005). This study included 1494 pregnancies of Dutch, Turkish, Moroccan, Cape
Verdian, Dutch Antillian/Aruban, and Surinamese women. Ultrasound measurements
were collected at 12, 20, and 30 weeks gestation. Femur lengths were found to be

19
relatively similar across the groups except for the Dutch Antilian/Aruban group. These
fetuses had much longer femurs, however due to the small number of individuals
representing this group the researchers did not feel that it was statistically significant.
Overall, there were no significant differences in femur length among these ethnic groups.
According to Weaver (1998) researchers had hoped that some of the traits used to
determine biological affinity in adult skeletal material would be found in fetal and
neonatal skeletons. Controlled study of this question has not been done and so far there
are no standards for determining ancestry for fetal remains (Rhine 1995).

20
METHODS AND MATERIALS
This research tested the efficacy of the traditional method used in forensic
anthropology for fetal age estimation (Fazekas and Kosa, 1978) and compared it to
prediction formulae derived from radiological data on modern fetuses (Sherwood et al.,
2000) and ultrasounds of modern in utero fetuses (Chervenak et al., 1998). Two data
sets, a historical sample and a forensic sample, from known age fetal and neonate
skeletons were used for testing the age estimation formulae for fetal remains.
Test Samples
Historical Sample: The first data set consists of measurements from the Lamb
collection that is housed by the National Museum of Natural History, Smithsonian
Institution in Washington DC. Measurements of the Lamb collection were recorded by
Mary Herbert-Ray (1997); this data set was made available for this study by Dr. David
Hunt, curator in the Department of Anthropology, National Museum of Natural History,
Smithsonian Institution.
This collection consists of known age fetal remains collected between 1902 and
1917 (Curran and Weaver, 1982). The age range of this collection is 12 weeks gestation
to neonates. The majority of this collection consists of spontaneously aborted fetuses.
Therefore, it may be biased towards abnormal or pathological conditions (Huxley, 2005).
Seventy-six individuals from this collection were used. The rest were excluded due to
lack of known age.
Forensic Sample: The second data set consists of fetal remains of known ages
from modern forensic cases. Individuals in this sample were from the Forensic Data

21
Bank, which contains data from forensic cases from across the United States, and the
William M. Bass III Donated Collection both maintained by the Department of
Anthropology, University of Tennessee, Knoxville. Measurements from 20 individuals
in the Bass Collection were collected personally, 11 of which were used in this study.
The others were removed due to a lack of known age. This data set also included
measurements from forensic cases obtained by surveying medical examiners across the
country. Data from 7 individuals were sent to me by the Office of the Chief Medical
Examiner in Chapel Hill, NC. All 7 were included for a total of 18 individuals in the data
set. This sample was used to show which of the three methods of age estimation is most
accurate for modern, potentially healthy fetuses recovered from the forensic context.
Measurements
The individuals from the Forensic Data Bank were measured in the following
manner. Long bone lengths and widths were observed for the humerus, ulna, radius,
femur, tibia and fibula using digital calipers (Table 1) (Figure 1). All possible
measurements were taken, however only femoral diaphyseal length was utilized in this
research (Figure 2) (Table 2).
Table 1: Definitions of measurements taken
Diaphysis
length Measurement of the longest point from the proximal end to the distal end of the
long bone
Distal
width Measurement of the widest point from medial to lateral on the distal end of the
long bone
Proximal
width Measurement of the widest point from medial to lateral on the proximal end of the
long bone
Midshaft
width Measurement of the width of the long bone at the midshaft point

22
Figure 1: Example of Femur Measurements: A) Diaphysis length B) Distal width C)
Proximal width D) Midshaft Width
A
C
D
B

T
D
K
F
T
able 2: Exa
m
D
onated Col
l
K
noxville.
ID
number
UT30-
00D
Humerus
Right
Left
Ulna
Right
Left
Radius
Right
Left
Femur
Right
Left
Tibia
Right
Left
Fibula
Right
Left
igure 2: Ex
a
m
ple of me
a
l
ection hous
e
collection
UTK
donated
Diaph
y
si
s
length
60.06m
m
59.58m
m
57.88m
m
57.31m
m
48.97m
m
49.22m
m
69.56m
m
70.41m
m
60.20m
m
60.70m
m
56.96m
m
56.68m
m
a
mple of fet
a
a
surements t
a
e
d in the De
p
known
age
1 day
s
Distal
width
m
13.98m
m
m
14.64m
m
m
4.31m
m
m
3.83m
m
m
7.90m
m
m
8.31m
m
m
16.54m
m
m
17.37m
m
m
9.72m
m
m
9.90m
m
m
5.07m
m
m
5.21m
m
a
l leg bone
d
23
a
ken of indi
v
p
artment of
sex
hispanic
Proxim
a
width
m
10.34
m
m
10.28
m
m
5.40
m
m
5.45
m
m
4.70
m
m
5.25
m
m
12.33
m
m
11.81
m
m
12.19
m
m
13.15
m
m
4.40
m
m
4.47
m
d
iaphyses U
T
v
iduals in t
h
Anthropolo
g
race
female
a
l Midsh
width
m
m4.49
m
m
m4.46
m
m
m3.18
m
m
m2.93
m
m
m3.61
m
m
m3.69
m
m
m5.45
m
m
m5.30
m
m
m5.21
m
m
m5.10
m
m
m2.08
m
m
m2.13
m
T
K 16-95D
h
e William
M
g
y, Univers
i
year
2000
aft
m
m
Notes:
m
m
erode
d
prox e
m
m
m
m
m
m
m
m
m
m
m
m
m
m
m
m
m
m
m
m
M
. Bass III
i
ty of Tenne
Left humeru
d
on
nd
ssee,
s

24
Analysis
Age estimation formulae were tested using left femoral diaphyseal lengths from
the two test samples. The regression formulae of Fazekas and Kosa (1978), Chervenak et
al. (1998), and Sherwood et al. (2000) were programmed into Microsoft Excel (Table 3).
Femur measurements from the two test samples were used with all three of the formulae.
The product of Fazekas and Kosa’s (1978) formula is body length. These lengths were
then compared with the published chart (p 266) to determine lunar month age. The
Sherwood et al. (2000) formula resulted in age estimated in weeks, while the Chervenak
et al. (1998) estimated age in days. Results from the estimation formula of Fazekas and
Kosa (1978) and Chervenak et al. (1998) were converted to weeks so they could be
compared easily with the results from the Sherwood et al. (2000) formula. Chervenak et
al. (1998) age estimates in days were divided by 7 to obtain an age in weeks. Fazekas
and Kosa (1978) age estimates in lunar months were multiplied by 4. The Fazekas and
Kosa (1978) model gives a lunar age range, for example 7-71/2 lunar months which is
28-30 weeks. The average was taken, in this example it would be 29 weeks, to make for
easy comparison with the other age estimates. Known ages of the individuals in the
samples were also converted to weeks for comparison. It should be noted that the
Forensic Sample included neonates ranging from 1 day old to a few weeks old. These
individuals were given the age of 40 weeks.

25
Table 3: Regression Formulae using the variable Femur Length (FL)
AuthorFormulaProduct
FazekasandKosa
(1978)FL*6.44+4.51
body
length
Chervenaketal.
(1998)70.62+21.78*FL days
Sherwoodetal.
(2000)10.91+0.38*FLweeks
Huxley and Angevine (1998) showed that lunar months and gestational months
are not directly comparable. The deviation between the two increases as the pregnancy
progresses. For this reason, the known ages from the data sets were converted from
gestational months or lunar months to weeks. Gestational age is based on a gestation
term of 40 weeks (Attico et al., 1990). Lunar age is based on a gestation term of 10 lunar
months (ten months of four weeks or 28 days each, for a total of 280 days)
(Krogman,1972). This conversion allowed for comparison between the known and
estimated ages.
The estimated ages were compared to the known ages of the fetuses. Regression
analysis and ANOVA tests were run to test the strength of the relationship between
known age and estimated age. The known age was the independent variable and the
estimated age was the dependent variable. Error was calculated by subtracting the known
age (KA) from the estimated age (EA). This resulted in either a positive or negative
number which represents the bias, ie. underestimation or overestimation of the age. For
example, an individual with a known age of 28 weeks was aged 30.328 weeks by the
Sherwood et al. (2001) formula, 25.98797 weeks by the Chervenak et al. (1999) formula,
and 29 weeks by the Fazekas and Kosa (1978) formula. To see the accuracy of these
estimations, the error and bias was calculated. When the error and bias was calculated

26
for the age estimate produced by the Sherwood et al. (2000) model, an error of 2.328 with
a positive bias was found. The error and bias for the Chervenak et al. (1998) model's
estimate showed an error of 2.012 with a negative bias while the estimated age calculated
by the Fazekas and Kosa (1978) model had an error of 1 with a positive bias (Table 4).
Table 4: Error and bias determination for an individual with a known age of 28 weeks.
Estimated
age Error
(EA - KA) Bias
Sherwood
et al (2000)
30.328 2.328 positive/over-age
Chervenak
et al (1998)
25.98797 -2.012 negative/under-
age
Fazekas
and Kosa
(1978)
29 1 positive/over-age
Considerations
The comparison of regression formulae for ultrasound, radiographs and dry bone
might be questioned. However, it has been shown that femur lengths derived from
ultrasound and later from radiographs of the same individual fall within the same range.
Therefore, measurements taken from radiographs can be plotted with accuracy onto
ultrasound growth curves (van der Harten et al., 1990). Since both ultrasound and
radiographic measurements are of the diaphysis only (Deter et al., 1987; van der Harten
et al., 1990) it may be possible to use dry bone measurements in these formulae. There
are potential issues comparing radiographs to skeletal material. Weaver (1998) warned
that corrections are needed when using radiographic data to determine skeletal age. This

27
was due to “parallax errors and varying tissue thickness” (p 192). Weaver (1998) stated
that these corrections would be made easier with the use of standard radiographic
techniques. However, there is evidence that it may not be a significant issue. Goldstein
et al. (1987) compared radiographic, ultrasound and skeletal measurements from a fetus
to determine accuracy. They found a perfect correlation between the three methods of
data collection. According to Jeanty et al. (1982), ultrasound formulae could be valuable
to archaeologists and medicolegal authorities. Jeanty et al. (1981) and Jeanty et al.
(1982) was a two part study observing fetal limb growth ultrasonically. Jeanty et al.
(1981) looked at the humerus and femur, while Jeanty et al. (1982) looked at the ulna,
radius, tibia, and fibula. They developed regression formulae after collecting
measurements from 450 fetuses. Gestational age was determined by crown-rump length.
Jeanty et al. (1982) then took measurements from archaeological fetuses and estimated
ages with their ultrasound charts. The age estimations that they derived were in the range
of what had been previously recorded by archaeologists.
It should be noted that there is some shrinkage from green bone to dry bone.
Huxley (1998a) used radiographs to measure diaphyseal length and then corrected for
shrinkage before using the measurements in regression formulae. This was applicable
since it was a case review of a single fetus. According to Huxley (1998b) the percent of
shrinkage is highest in early development, and is less significant in older fetuses.
Therefore, the correction is dependent on age. Correcting for shrinkage in this research
would have biased the data.
As mentioned earlier, sexual dimorphism can have an effect on skeletal
development in fetuses. Therefore, sexual dimorphism is definitely something that

28
should be considered when choosing an element of the skeleton for aging. For this
research, the formulae used only utilize the measurement for femur length. According to
Deter et al. (1987) and Sherwood et al. (2000) the femur does not show evidence of
sexual dimorphism.

29
RESULTS
The following results are divided into two sections. The first section states the
results for the Historical Data Set, the second section states those for the Forensic Data
Set. Each section is broken down into three parts; results for the Fazekas and Kosa
(1978) formula, the Chervenak et al. (1998) formula, and the Sherwood et al. (2000)
formula.
Historical Data Set
Fazekas and Kosa (1978) Historical Data Set Results
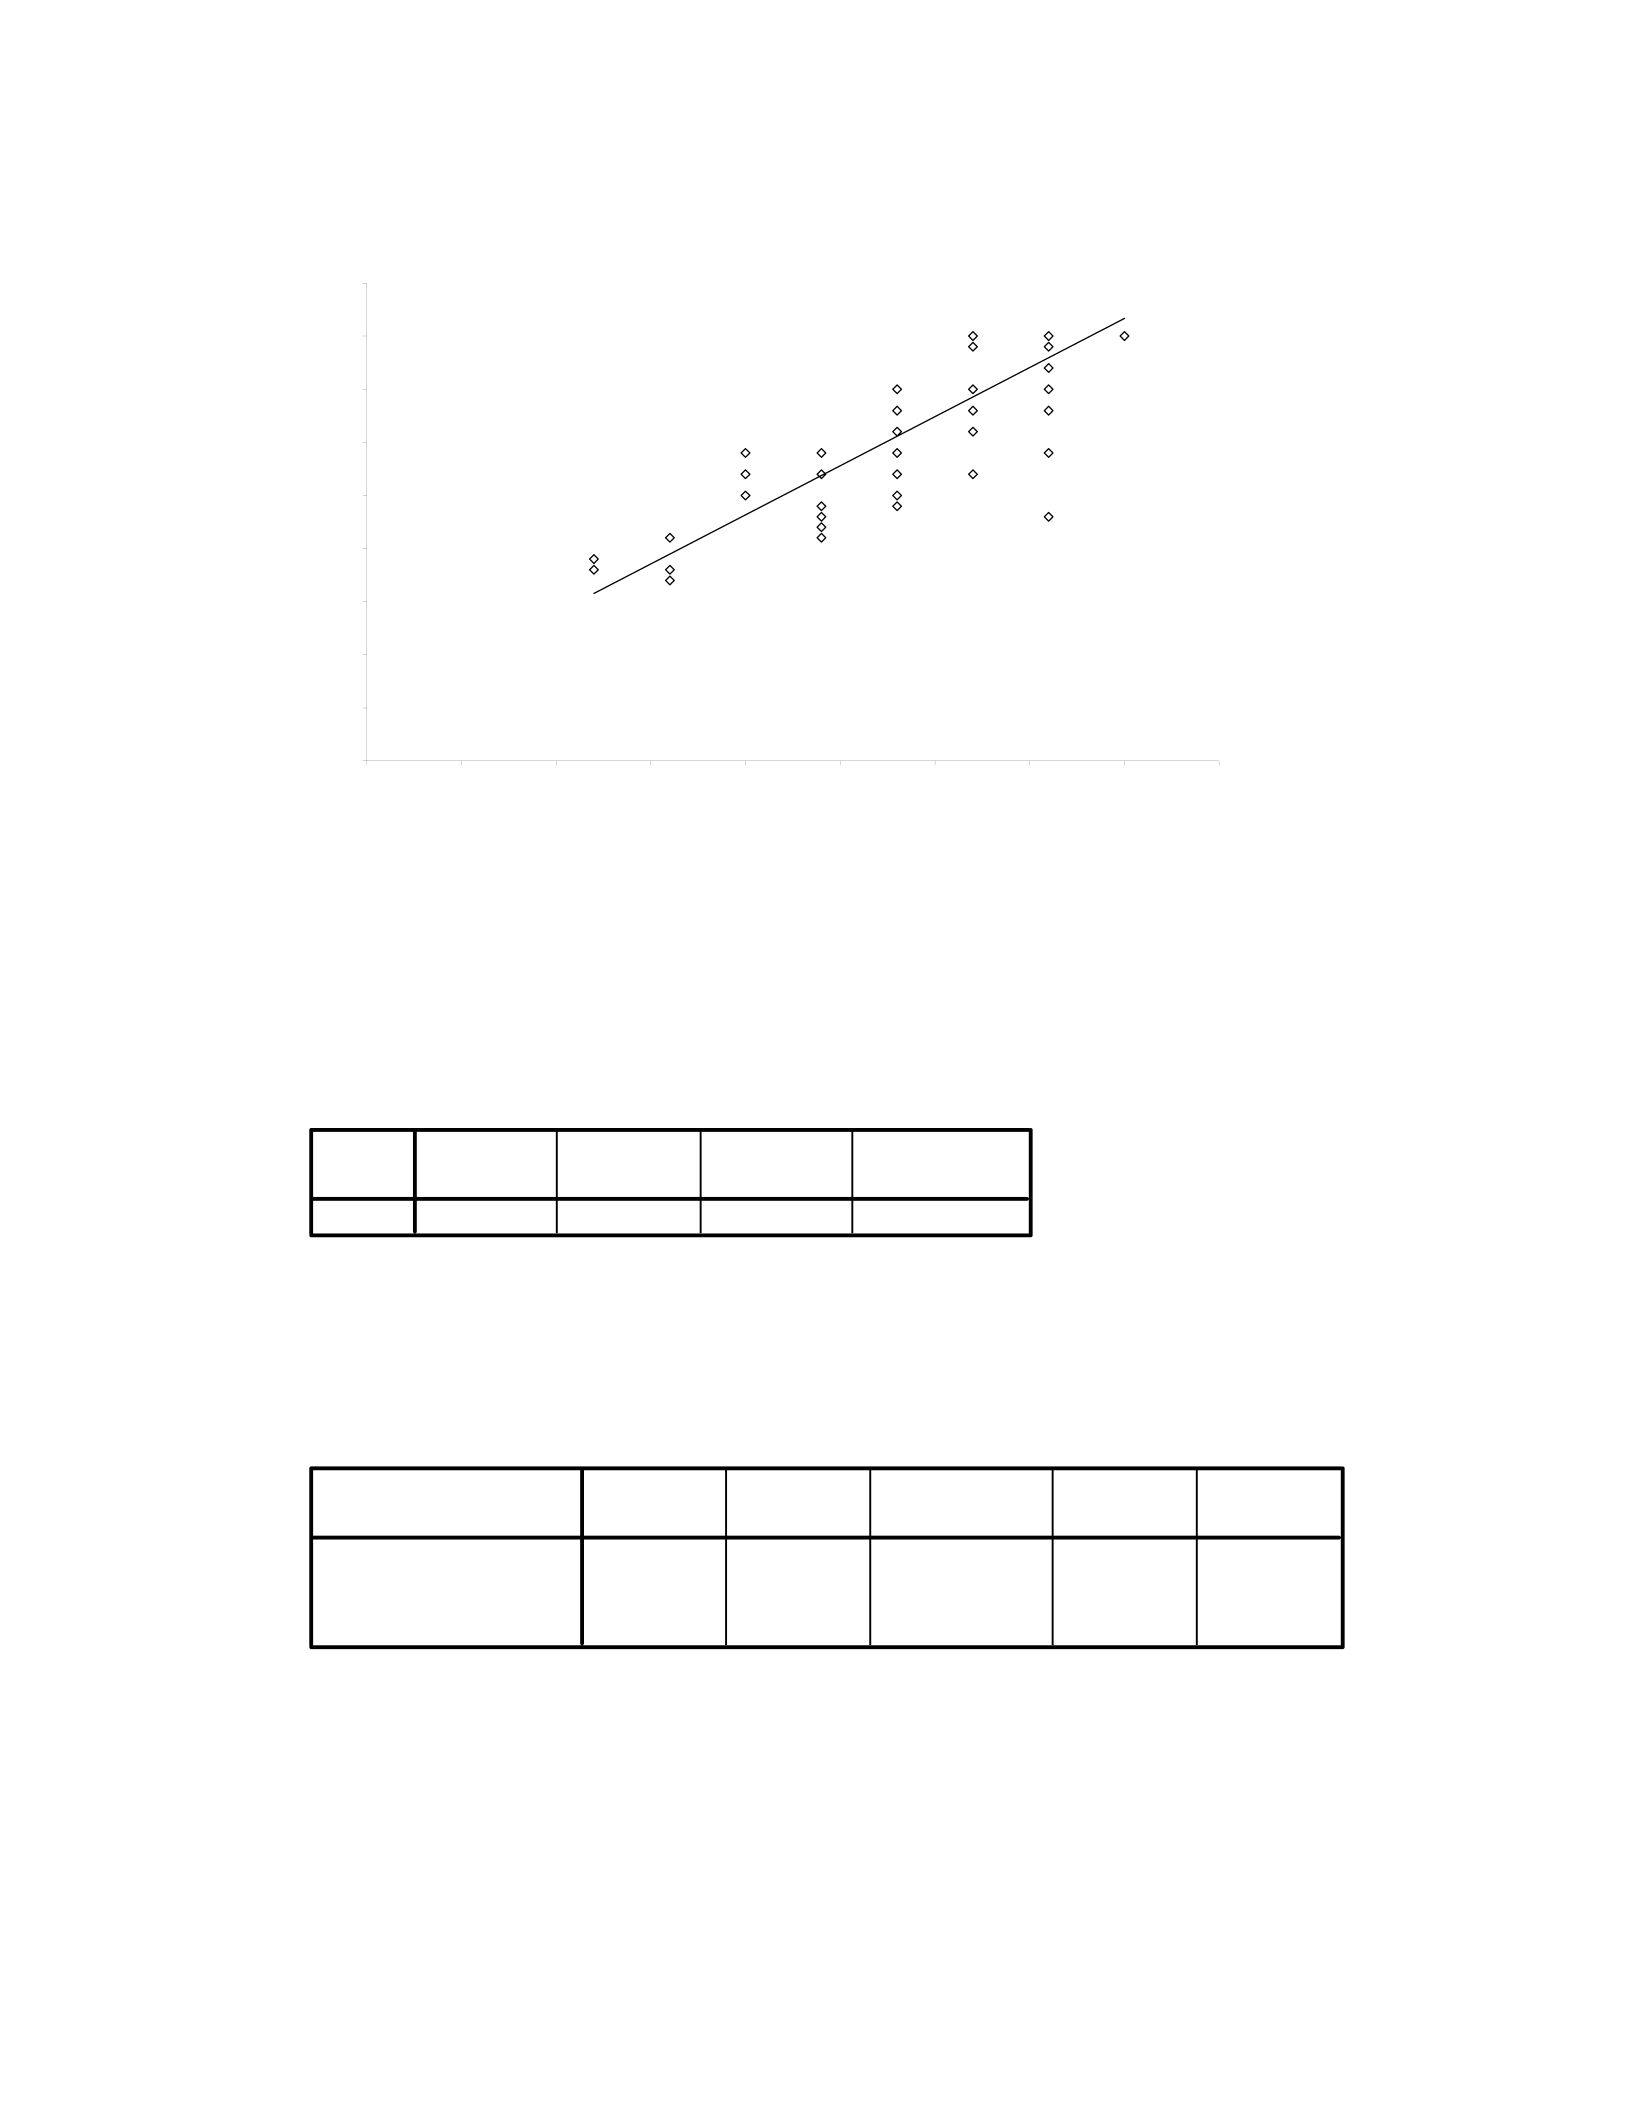
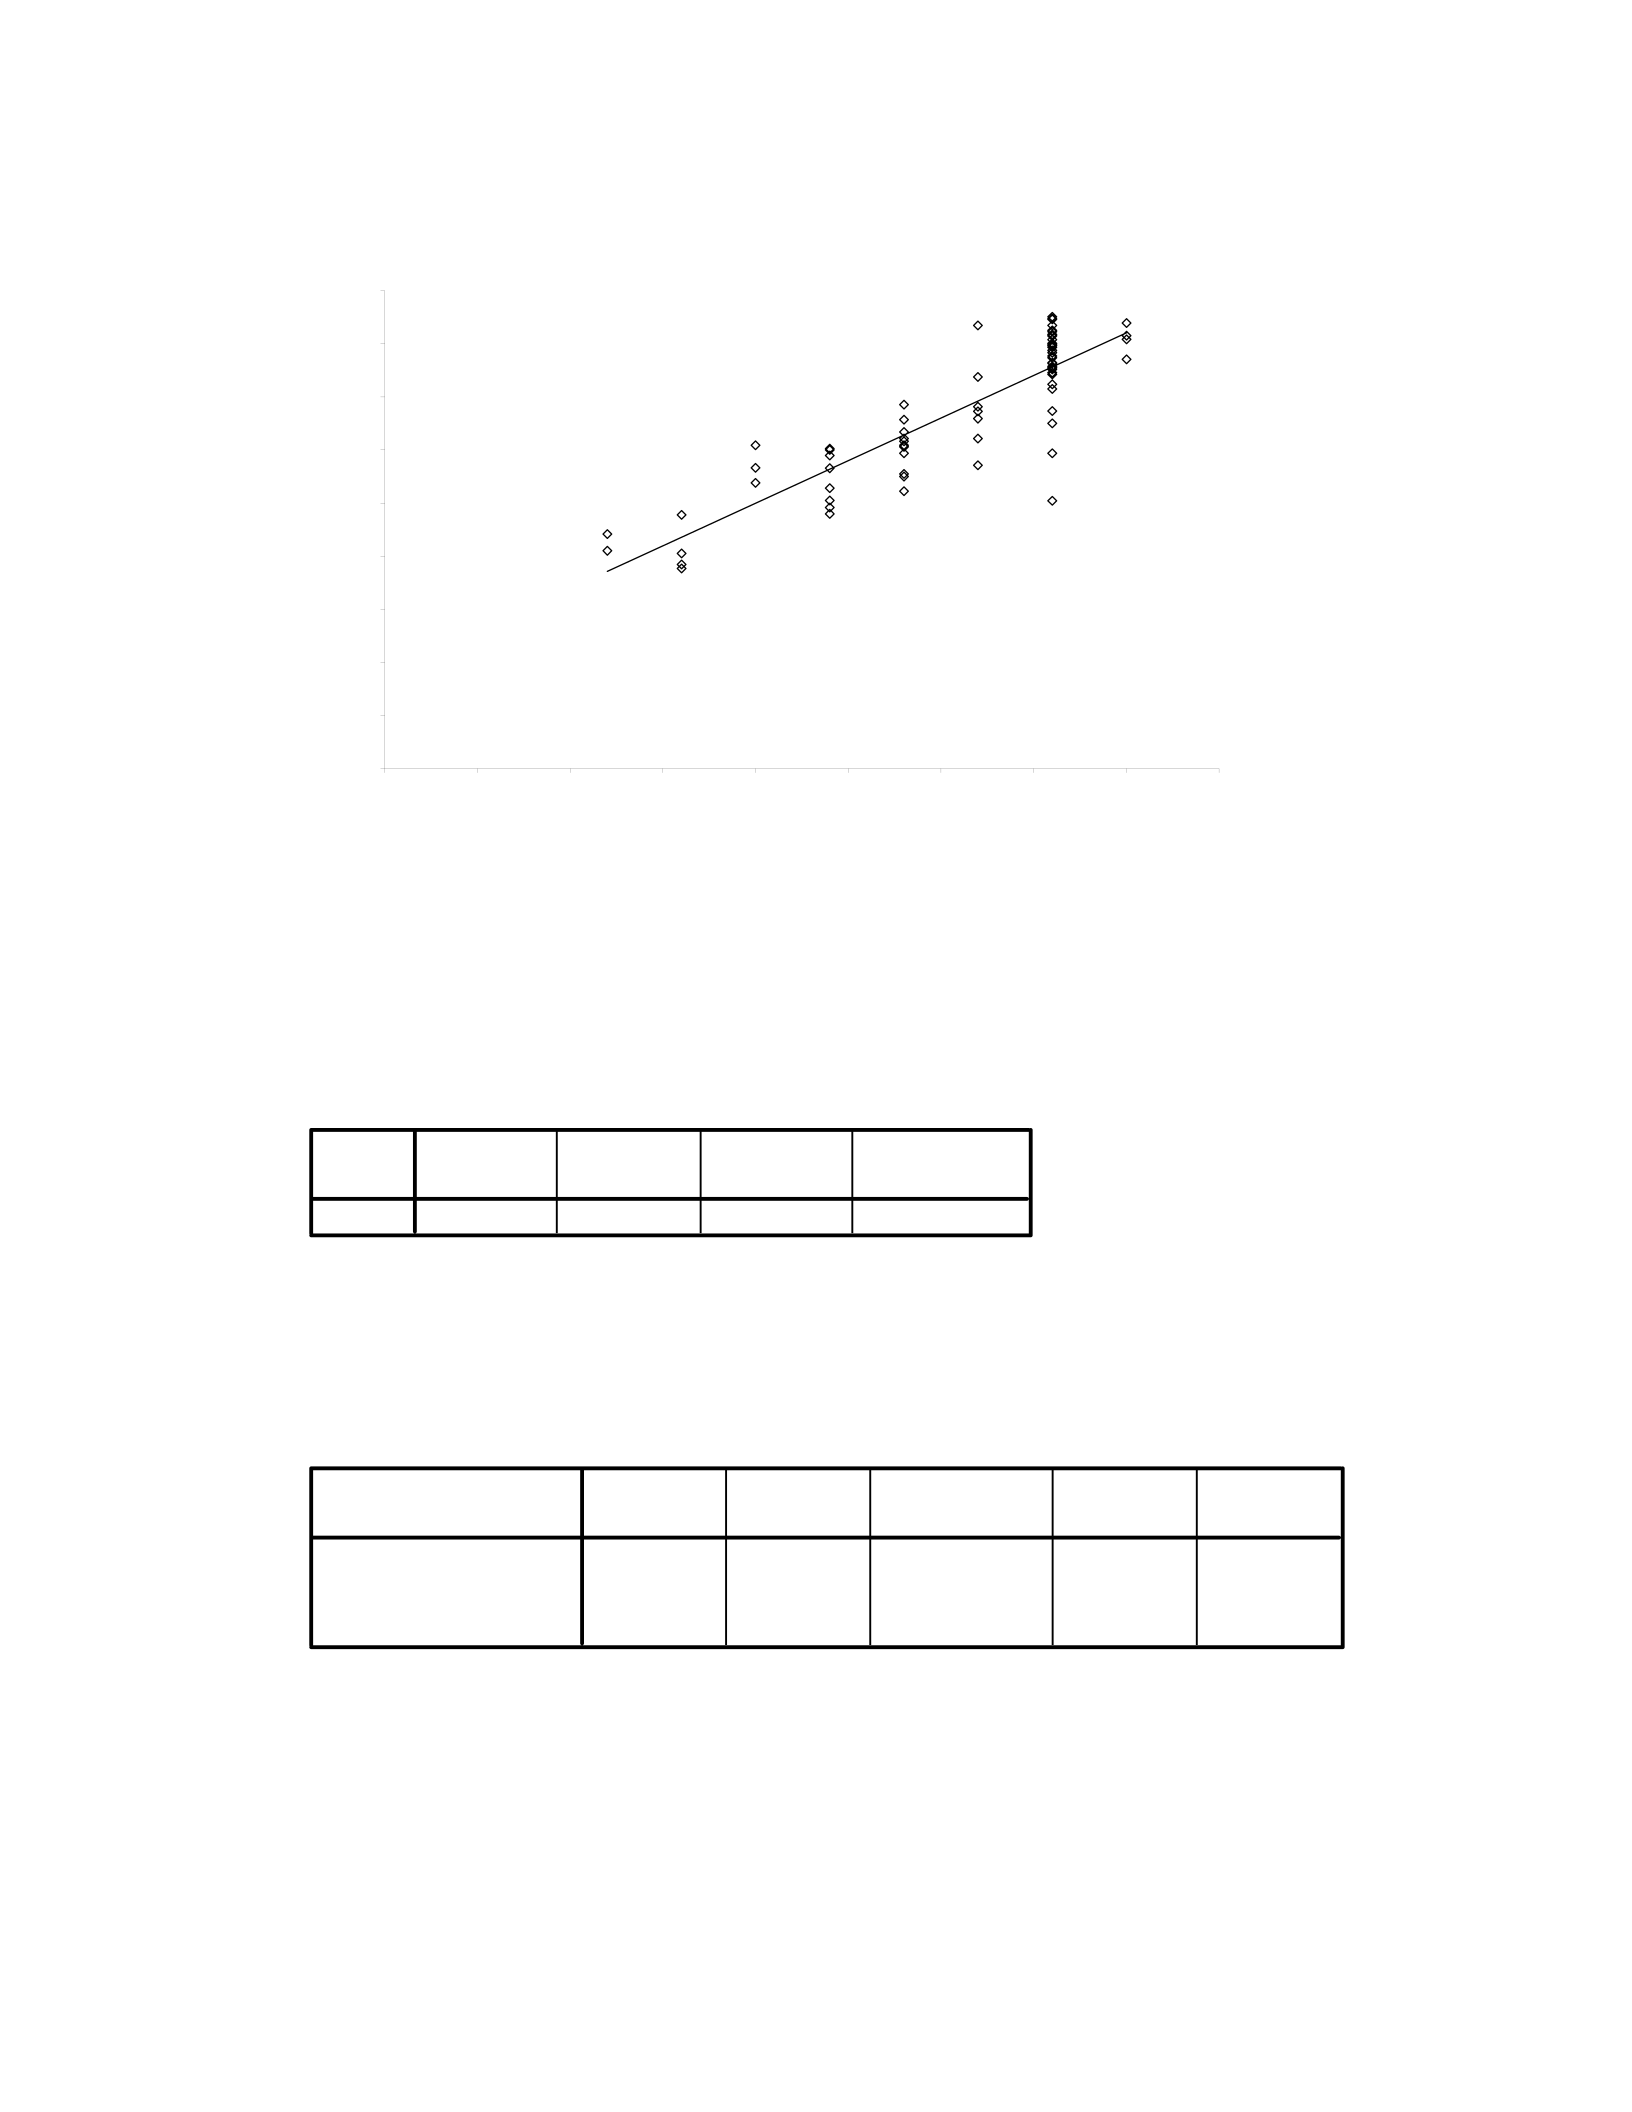
A comparison of the estimated ages from the Fazekas and Kosa (1978) formula to
the known ages of the historical individuals showed a wide range of variation (Figure 3).
When regression was applied using SPSS an R² of 0.7802 and an adjusted R² of 0.777
was found (Table 5). ANOVA analysis showed a F-value of 262.630 and a p-value of
<0.01 (Table 6). This shows a strong correlation between the estimated and the known
ages which is also statistically significant. This shows that the Fazekas and Kosa (1978)
model produced estimated ages similar to the known ages of the individuals in the
Historical Data Set.
30
Figure 3: Comparison of estimated age using Fazekas and Kosa (1978) to known age
with linear regression applied
Table 5: R² results from SPSS for Fazekas and Kosa (1978) age estimations on historical
data set
Table 6: ANOVA results for Fazekas and Kosa (1978) age estimations on historical data
set
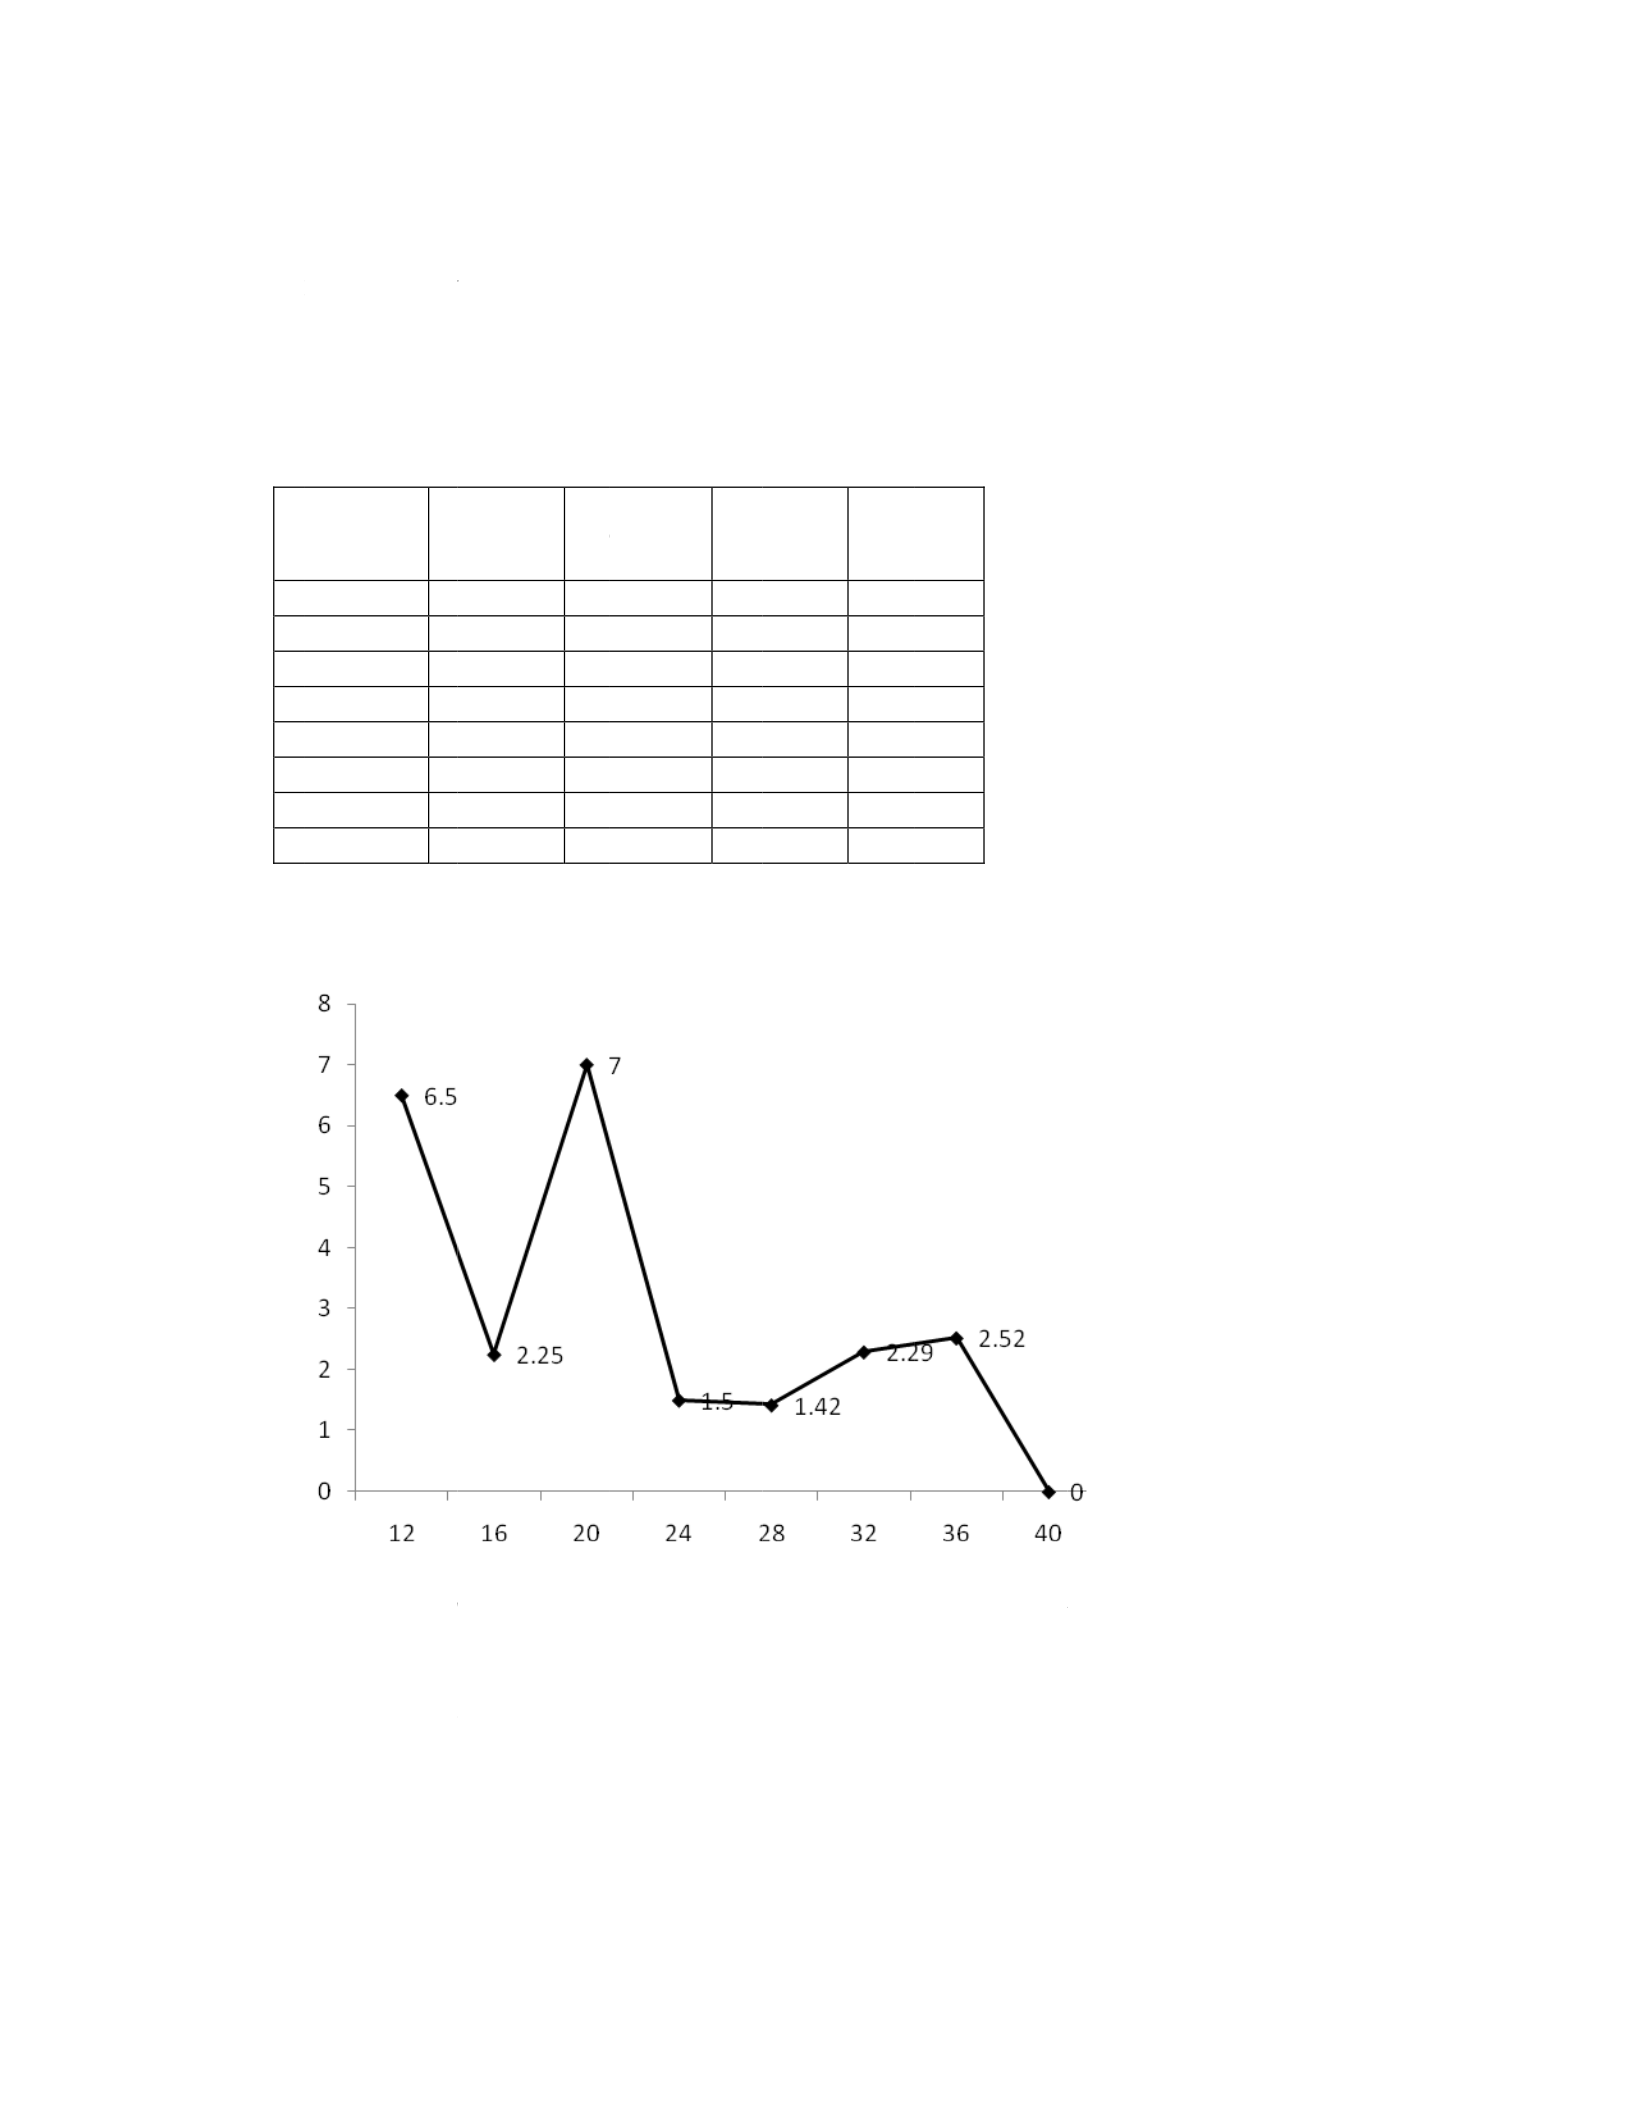
The Fazekas and Kosa (1978) formula over-aged individuals in the Historical
Data Set an average of 2.355 weeks. The most accurate age estimation was of
Estimated vs Known Age
y = 0.9255x + 4.6661
R2 = 0.7802
0
5
10
15
20
25
30
35
40
45
0 5 10 15 20 25 30 35 40 45
Known
Estimated F & K
Model Summary
.883a.780 .777 3.32247
Model
1RR Square
Adjusted
R Square
Std. Error of
the Estimate
Predictors: (Constant), VAR00003
a.
ANOVA
b
2899.127 12899.127 262.630 .000a
816.873 74 11.039
3716.000 75
Regression
Residual
Total
Model
1
Sum of
Squares df Mean Square FSig.
Predictors: (Constant), VAR00003
a.
Dependent Variable: VAR00004
b.
i
n
k
n
T
f
o
N
I
n
F
C
t
h
n
dividuals a
t
n
own age
w
T
able 7: Ran
g
o
rmula on h
i
N
o. of
n
dividuals
K
A
2
4
3
8
12
7
36
4
igure 4: Fa
z
C
hervenak e
t
A co
m
h
e known a
g
t
40 weeks.
w
as seen in t
h
g
e of estima
i
storical ind
i
K
nown
A
ge
Es
ag
e
ra
n
12
16
20
24
28
32
36
40
z
ekas and K
o
t
al. (1998)
H
m
parison of
t
g
es of the hi
s
The most si
h
e youngest
ted ages an
d
i
viduals by
a
timated
e
n
ge
A
v
e
Err
18-19
17-21
25-29
21-29
24-35
27-40
23-40
40
o
sa (1978)
E
H
istorical D
a
t
he estimate
d
s
torical indi
v
31
gnificant di
f
individuals
(
d
breakdow
n
a
ge in week
s
e
rage
or Bias
6.5 over
2.25 over
7over
1.5 over
1.42 over
2.29 over
2.52 over
0 no b
E
rror and Bi
a
a
ta Set Resu
l
d
ages from
v
iduals sho
w
f
ference bet
w
(
Table 7) (F
n
of bias of t
h
s
.
-age
-age
-age
-age
-age
-age
-age
ias
a
s on Histor
i
l
ts
the Cherve
n
w
ed a wide r
a
w
een estim
a
igure 4).
h
e Fazekas
a
i
cal Data Se
t
n
ak et al. (1
9
a
nge of vari
a
a
ted age and
a
nd Kosa (1
9
t
9
98) formul
a
a
tion (Figur
e
9
78)
a
to
e
5).
32
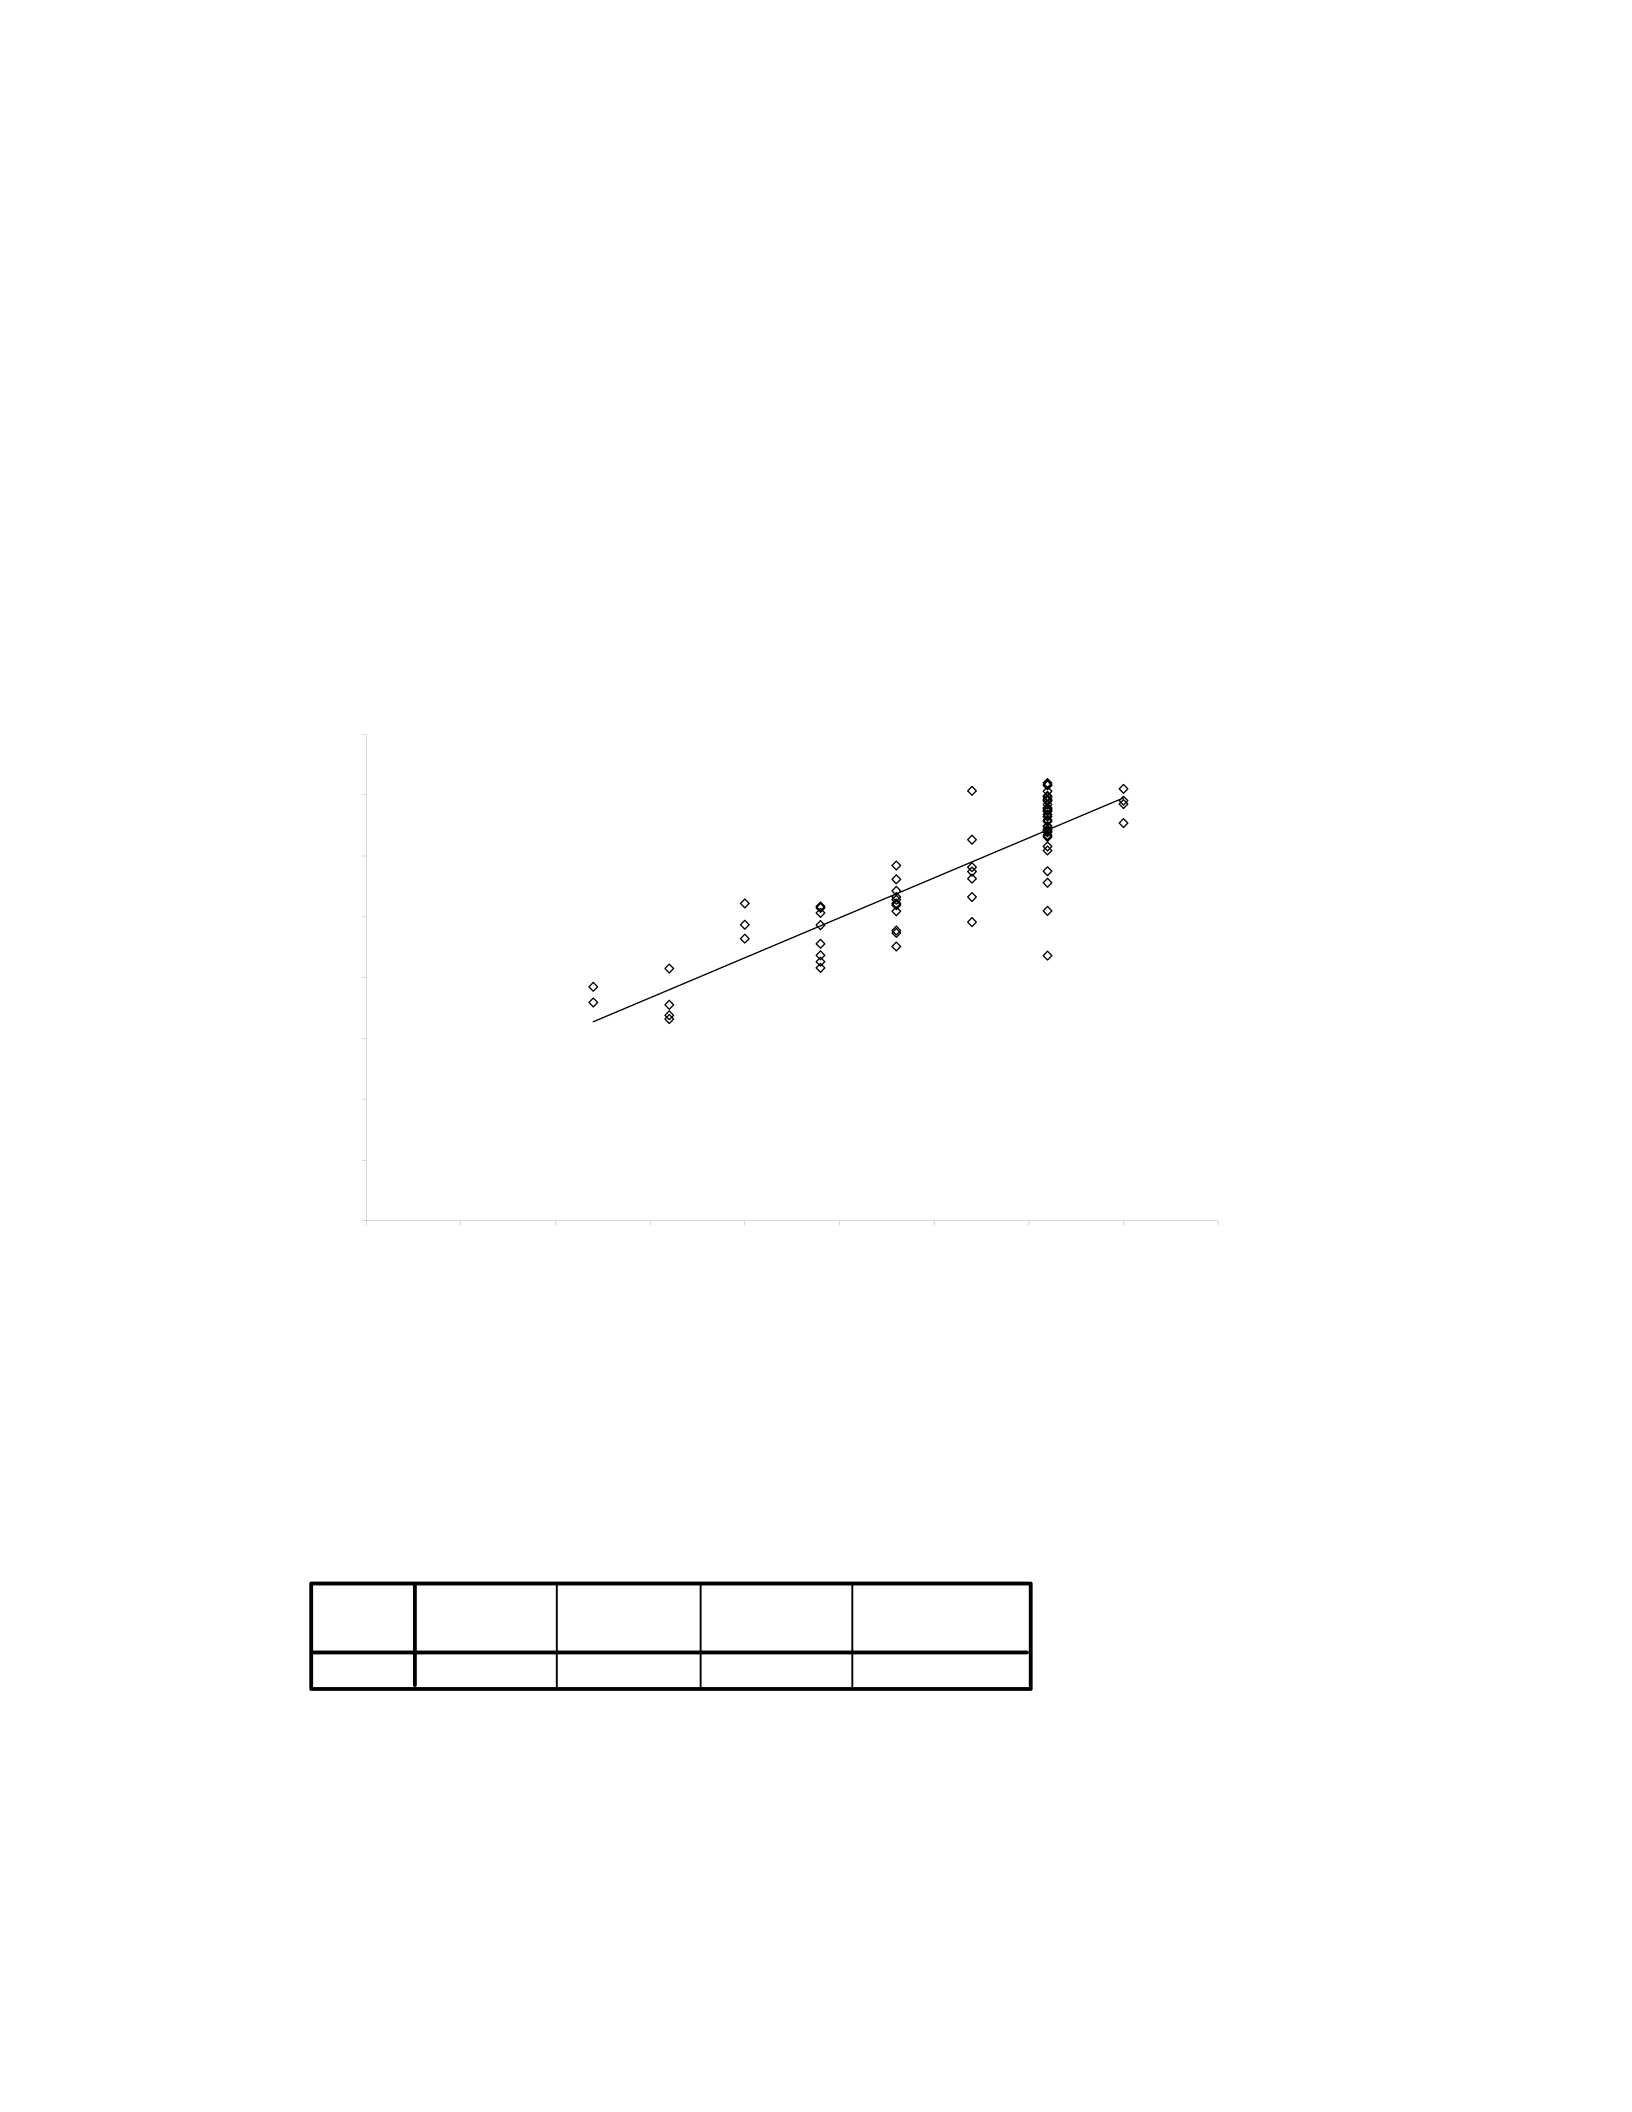
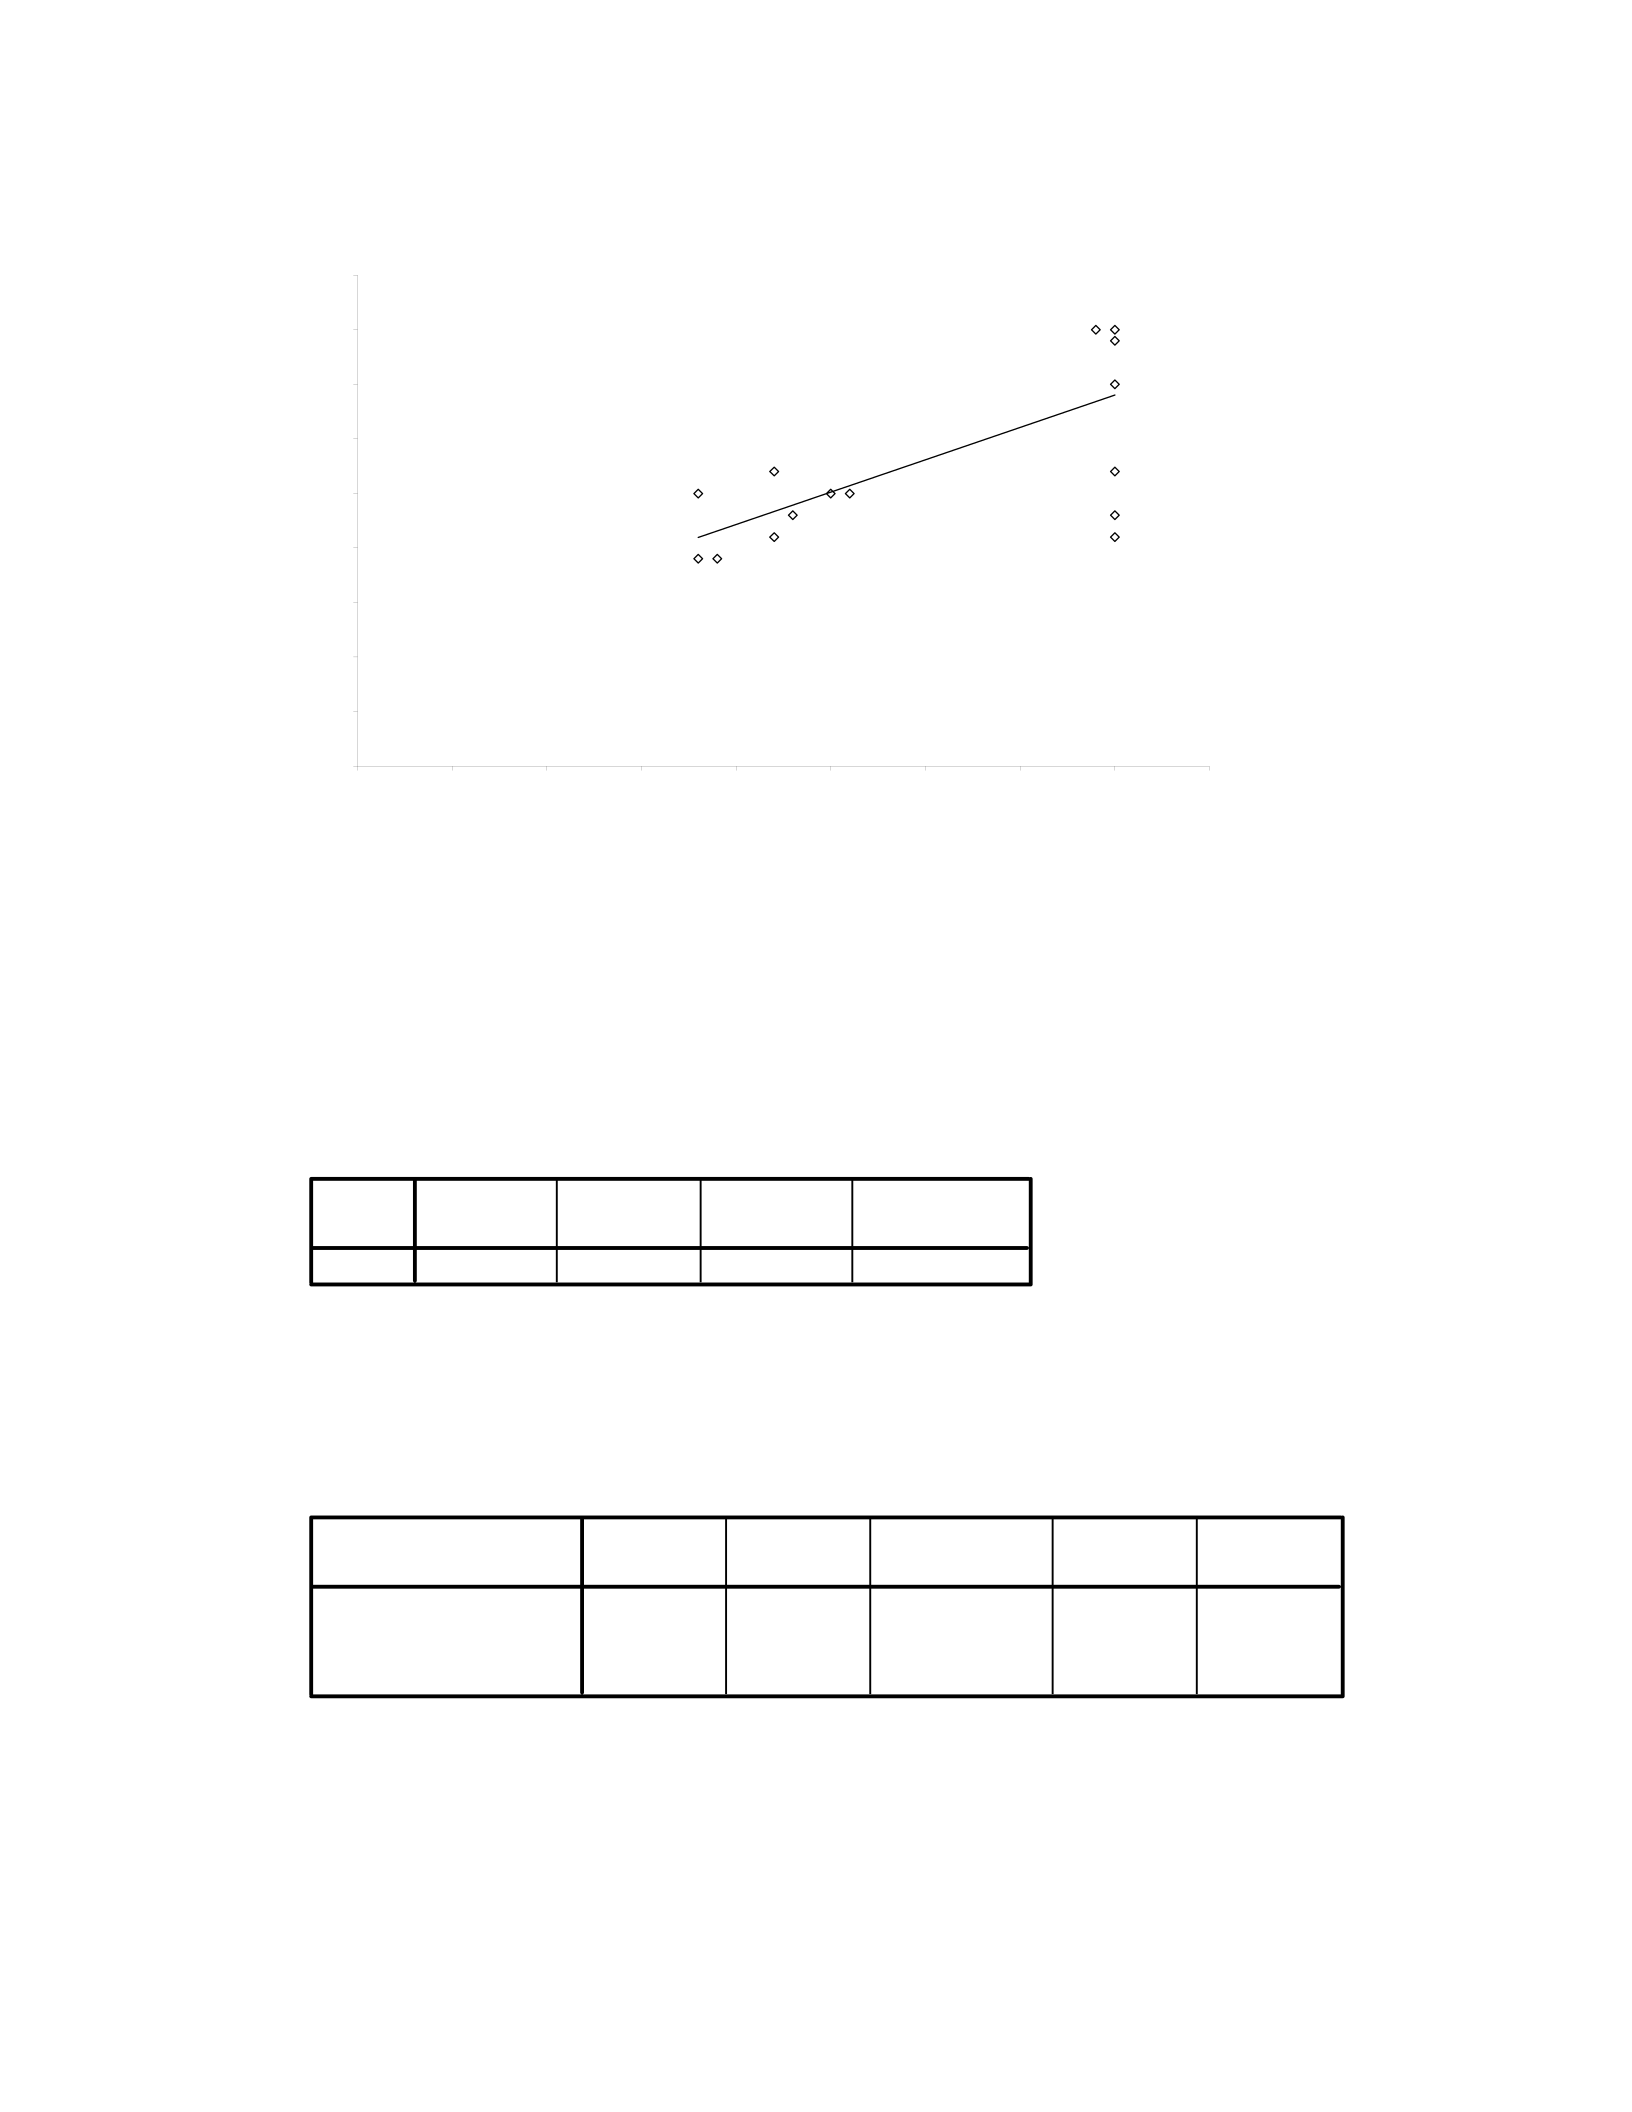
When regression was applied using SPSS an R² of 0.752 and an adjusted R² of 0.748 was
found (Table 8). ANOVA analysis showed a F-value of 224.127 and a p-value of < 0.01
(Table 9). This shows a strong correlation between the estimated and the known ages
which is also statistically significant. This shows that the Chervenak et al. (1998) model
produced estimated ages similar to the known ages of the individuals in the Historical
Data Set.
Figure 5: Comparison of estimated age using Chervenak et al. (1998) to known age with
linear regression applied
Table 8: R² results from SPSS for Chervenak et al. (1998) age estimations on historical
data set
Estimated vs Known Age
y = 0.6572x + 8.4722
R
2
= 0.7518
0
5
10
15
20
25
30
35
40
0 5 10 15 20 25 30 35 40 45
Known
Estimated C et al
Model Summary
.867a.752 .748 3.53051
Model
1RR Square
Adjusted
R Square
Std. Error of
the Estimate
Predictors: (Constant), VAR00002
a.

33
Table 9: ANOVA results for Chervenak et al. (1998) age estimations on historical data
set
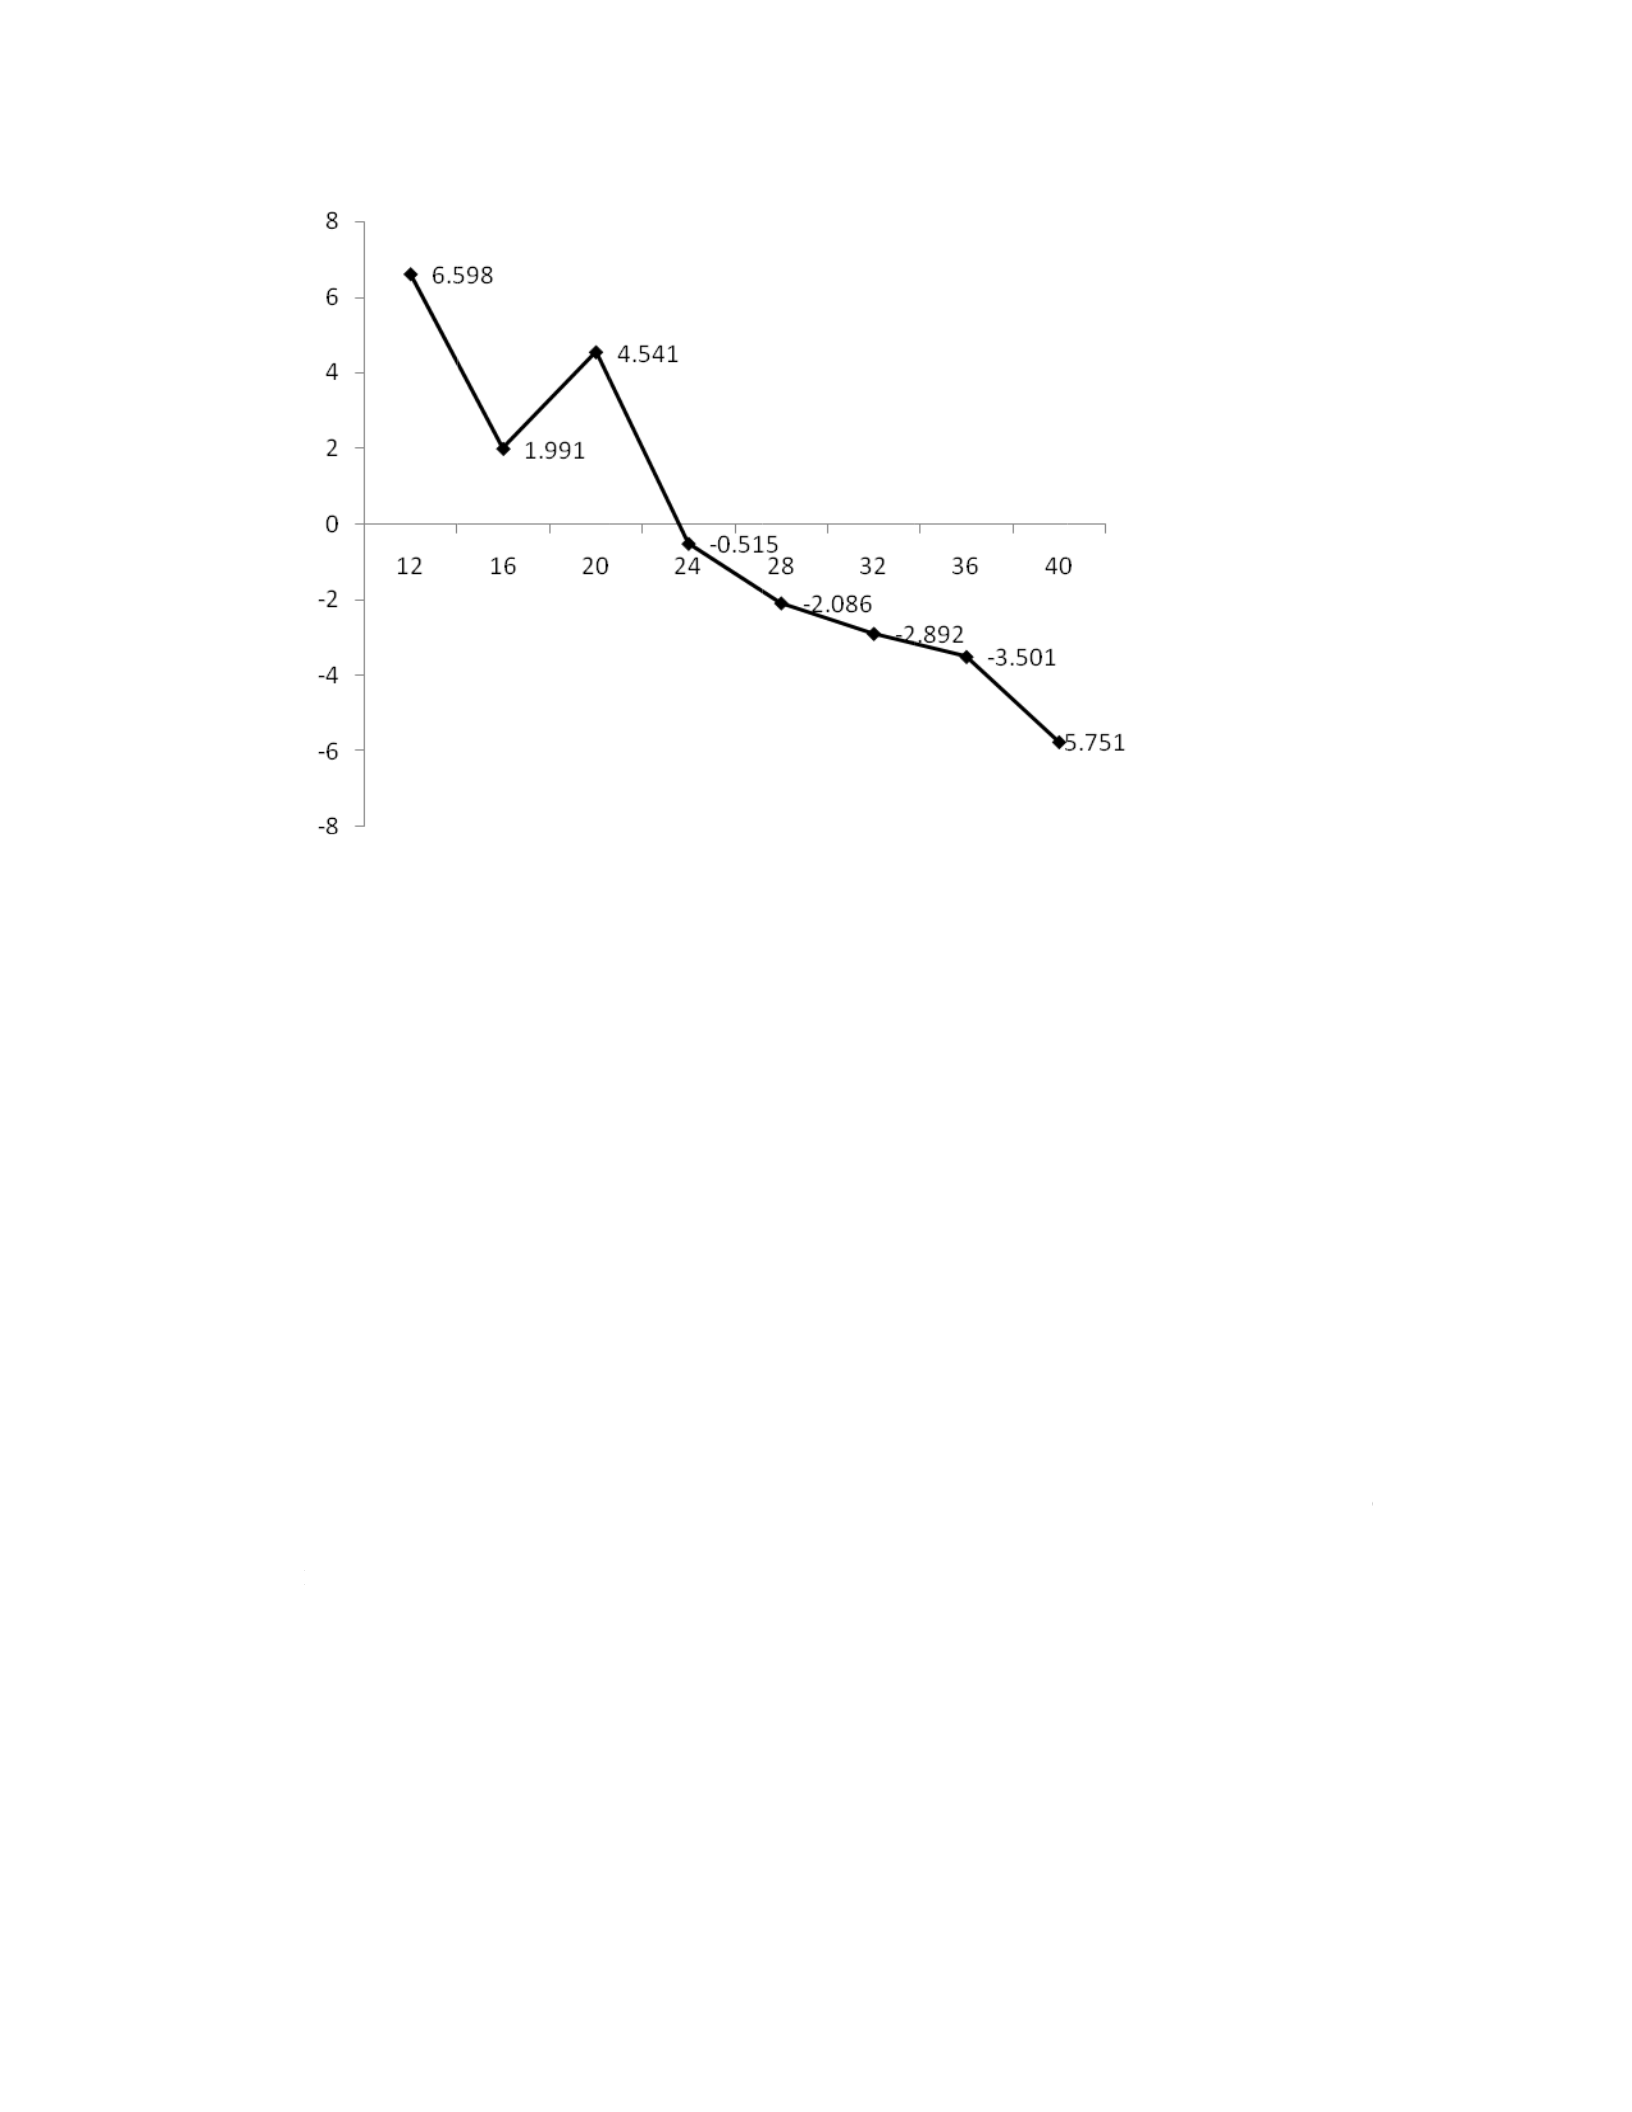
The Chervenak et al. (1998) formula under-aged individuals in the Historical Data
Set an average of 2.153 weeks. This formula over aged younger individuals and under
aged older individuals (Table 10) (Figure 6).
Table 10: Range of estimated ages and breakdown of bias of the Chervenak et al. (1998)
formula on historical individuals by age in weeks.
No. of
Individuals Known
Age Estimated
age range Average
Error Bias
2 12
17.96-
19.24 6.598 over-age
4 16
16.59-
20.73 1.991 over-age
3 20
23.19-
26.096 4.541 over-age
8 24
20.79-
25.83 0.515 under-
age
12 28
22.55-
29.22 2.086 under-
age
7 32
24.56-
35.34 2.892 under-
age
36 36 21.8-35.99 3.501 under-
age
4 40
32.71-
35.51 5.751 under-
age
ANOVA
b
2793.628 12793.628 224.127 .000a
922.372 74 12.464
3716.000 75
Regression
Residual
Total
Model
1
Sum of
Squares df Mean Square FSig.
Predictors: (Constant), VAR00002
a.
Dependent Variable: VAR00004
b.
F
S
t
h
W
f
o
(
T
w
p
r
D
igure 6: Ch
e
herwood et
A co
m
h
e known a
g
W
hen regres
s
o
und (Table
T
able 12).
T
w
hich is also
r
oduced est
i
D
ata Set.
e
rvenak et a
l
al. (2000)
H
m
parison of
t
g
es of the hi
s
s
ion was ap
p
11). ANO
V
T
his shows
a
statistically
i
mated ages
l
. (1998) Er
r
H
istorical Da
t
t
he estimate
d
s
torical indi
v
p
lied using
S
V
A analysis
s
a
strong corr
e
significant.
similar to t
h
34
r
or and Bias
t
a Set Resul
t
d
ages from
v
iduals sho
w
S
PSS an R²
o
s
howed a F-
v
e
lation bet
w
This show
s
h
e known ag
e
on Historic
a
t
s
the Sherwo
o
w
ed a wide r
a
o
f 0.752 and
v
alue of 22
4
w
een the esti
m
s
that the Sh
e
e
s of the in
d
a
l Data Set
o
d et al. (20
0
a
nge of vari
a
an adjusted
4
.127 and a
p
m
ated and t
h
e
rwood et a
l
d
ividuals in
t
0
0) formula
a
tion (Figur
e
R² of 0.748
p
-value of <
0
h
e known a
g
l
. (2000) m
o
t
he Historic
a
to
e
7).
was
0
.01
g
es
o
del
a
l
35
Figure 7: Comparison of estimated age using Sherwood et al. (2000) to known age with
linear regression applied
Table 11: R² results from SPSS for Sherwood et al. (2000) age estimations on historical
data set
Table 12: ANOVA results for Sherwood et al. (2000) age estimations on historical data
set
Estimated vs Known Age
y = 0.8027x + 8.9359
R2 = 0.7518
0
5
10
15
20
25
30
35
40
45
0 5 10 15 20 25 30 35 40 45
Known
Estimated S et al
Model Summary
.867a.752 .748 3.53051
Model
1RR Square
Adjusted
R Square
Std. Error of
the Estimate
Predictors: (Constant), VAR00001
a.
ANOVA
b
2793.628 12793.628 224.127 .000a
922.372 74 12.464
3716.000 75
Regression
Residual
Total
Model
1
Sum of
Squares df Mean Square FSig.
Predictors: (Constant), VAR00001
a.
Dependent Variable: VAR00004
b.

36
The Sherwood et al. (2000) formula over-aged individuals in the Historical Data
Set an average of 2.819 weeks. This formula over-aged individuals of all ages (Table 13)
(Figure 8).
Table 13: Range of estimated ages and breakdown of bias of the Sherwood et al. (2000)
formula on historical individuals by age in weeks.
No. of
Individuals Known
Age
Estimated
age
range Average
Error Bias
2 12
20.52-
22.08 9.303 over-age
4 16
18.85-
23.91 4.562 over-age
3 20
26.91-
30.46 8.561 over-age
8 24
23.98-
30.14 3.271 over-age
12 28
26.13-
34.28 2.238 over-age
7 32
28.58-
41.75 2.101 over-age
36 36
25.22-
42.55 2.279 over-age
4 40
38.54-
41.96 0.417 over-age

F
F
F
o
r
e
(
T
1
s
e
igure 8: Sh
e
orensic Dat
a
azekas and
K
A co
m
f the moder
n
e
gression w
a
T
able 14).
A
5). This sh
o
e
en with the
e
rwood et al
.
a
Set
K
osa (1978
)
m
parison of
t
n
forensic i
n
a
s applied u
s
A
NOVA ana
l
o
ws a much
w
Historical
D
.
(2000) Err
o
)
Forensic D
t
he Fazekas
n
dividuals s
h
s
ing SPSS a
n
l
ysis showe
d
w
eaker corr
e
D
ata Set, bu
t
37
o
r and Bias
o
ata Set Res
u
and Kosa (
1
h
owed a wid
e
n
R² of 0.48
6
d
a F-value
o
e
lation bet
w
t
it is still st
a
o
n Historica
l
u
lts
1
978) estim
a
e
range of v
a
6
and an adj
u
o
f 15.107 an
w
een the esti
m
a
tistically si
g
l
Data Set
a
ted ages to
t
a
riation (Fi
g
u
sted R² of
0
d a p-value
o
m
ated and k
n
g
nificant.
t
he known a
g
g
ure 9). Wh
e
0
.453 was f
o
o
f <0.01 (T
a
n
own ages t
h
g
es
e
n
o
und
a
ble
h
an
38
Figure 9: Comparison of estimated age using Fazekas and Kosa (1978) to known age
with linear regression applied
Table 14: R² results from SPSS for Fazekas and Kosa (1978) age estimations on modern
forensic data set
Table 15: ANOVA results for Fazekas and Kosa (1978) age estimations on modern
forensic data set
Known vs Fazekas & Kosa Age
y = 0.593x + 10.301
R2 = 0.4856
0
5
10
15
20
25
30
35
40
45
0 5 10 15 20 25 30 35 40 45
Known
Estimated
Model Summary
.697a.486 .453 7.02610
Model
1RR Square
Adjusted
R Square
Std. Error of
the Estimate
Predictors: (Constant), VAR00002
a.
ANOVA
b
745.753 1 745.753 15.107 .001a
789.858 16 49.366
1535.611 17
Regression
Residual
Total
Model
1
Sum of
Squares df Mean Square FSig.
Predictors: (Constant), VAR00002
a.
Dependent Variable: VAR00001
b.
f
o
e
s
t
e
T
(
1
N
I
n
F
The
F
o
rensic set a
n
s
timated ag
e
e
ndency to
o
T
able 16: Ra
n
1
978) form
u
N
o. of
n
dividuals
K
A
2
1
2
1
1
1
2
8
igure 10 : F
a
F
azekas and
K
n
average o
f
e
and know
n
o
ve
r
-age the
n
ge of esti
m
u
la on mode
r
K
nown
A
ge
Es
ag
e
ra
n
18
19
22
23
25
26
39
40
a
zekas and
K
K
osa (1978
)
f
2.611 wee
k
n
age was se
e
younger an
d
m
ated ages a
n
r
n forensic i
n
timated
e
n
ge
A
v
e
Err
19-25
19
21-27
23
25
25
40
21-40
K
osa (1978)
39
)
formula u
n
k
s. The mos
t
e
n in the 18
d
unde
r
-age
t
n
d breakdo
w
n
dividuals b
y
e
rage
or Bias
4ove
r
0 no
2ove
r
0 no
0 no
1u
n
1ove
r
7.5 u
n
Error and
B
n
de
r
-aged in
d
t
significant
week and 4
0
t
he older (T
a
w
n of bias of
y
age in we
e
r
-age
bias
r
-age
bias
bias
n
der-
age
r
-age
n
der-
age
B
ias on Fore
n
d
ividuals in
t
difference
b
0
week old i
n
a
ble 16) (Fi
g
the Fazekas
e
ks.
n
sic Data S
e
t
he modern
b
etween
n
dividuals
w
g
ure 10).
and Kosa
e
t
w
ith a
40
Chervenak et al (1998) Forensic Data Set Results
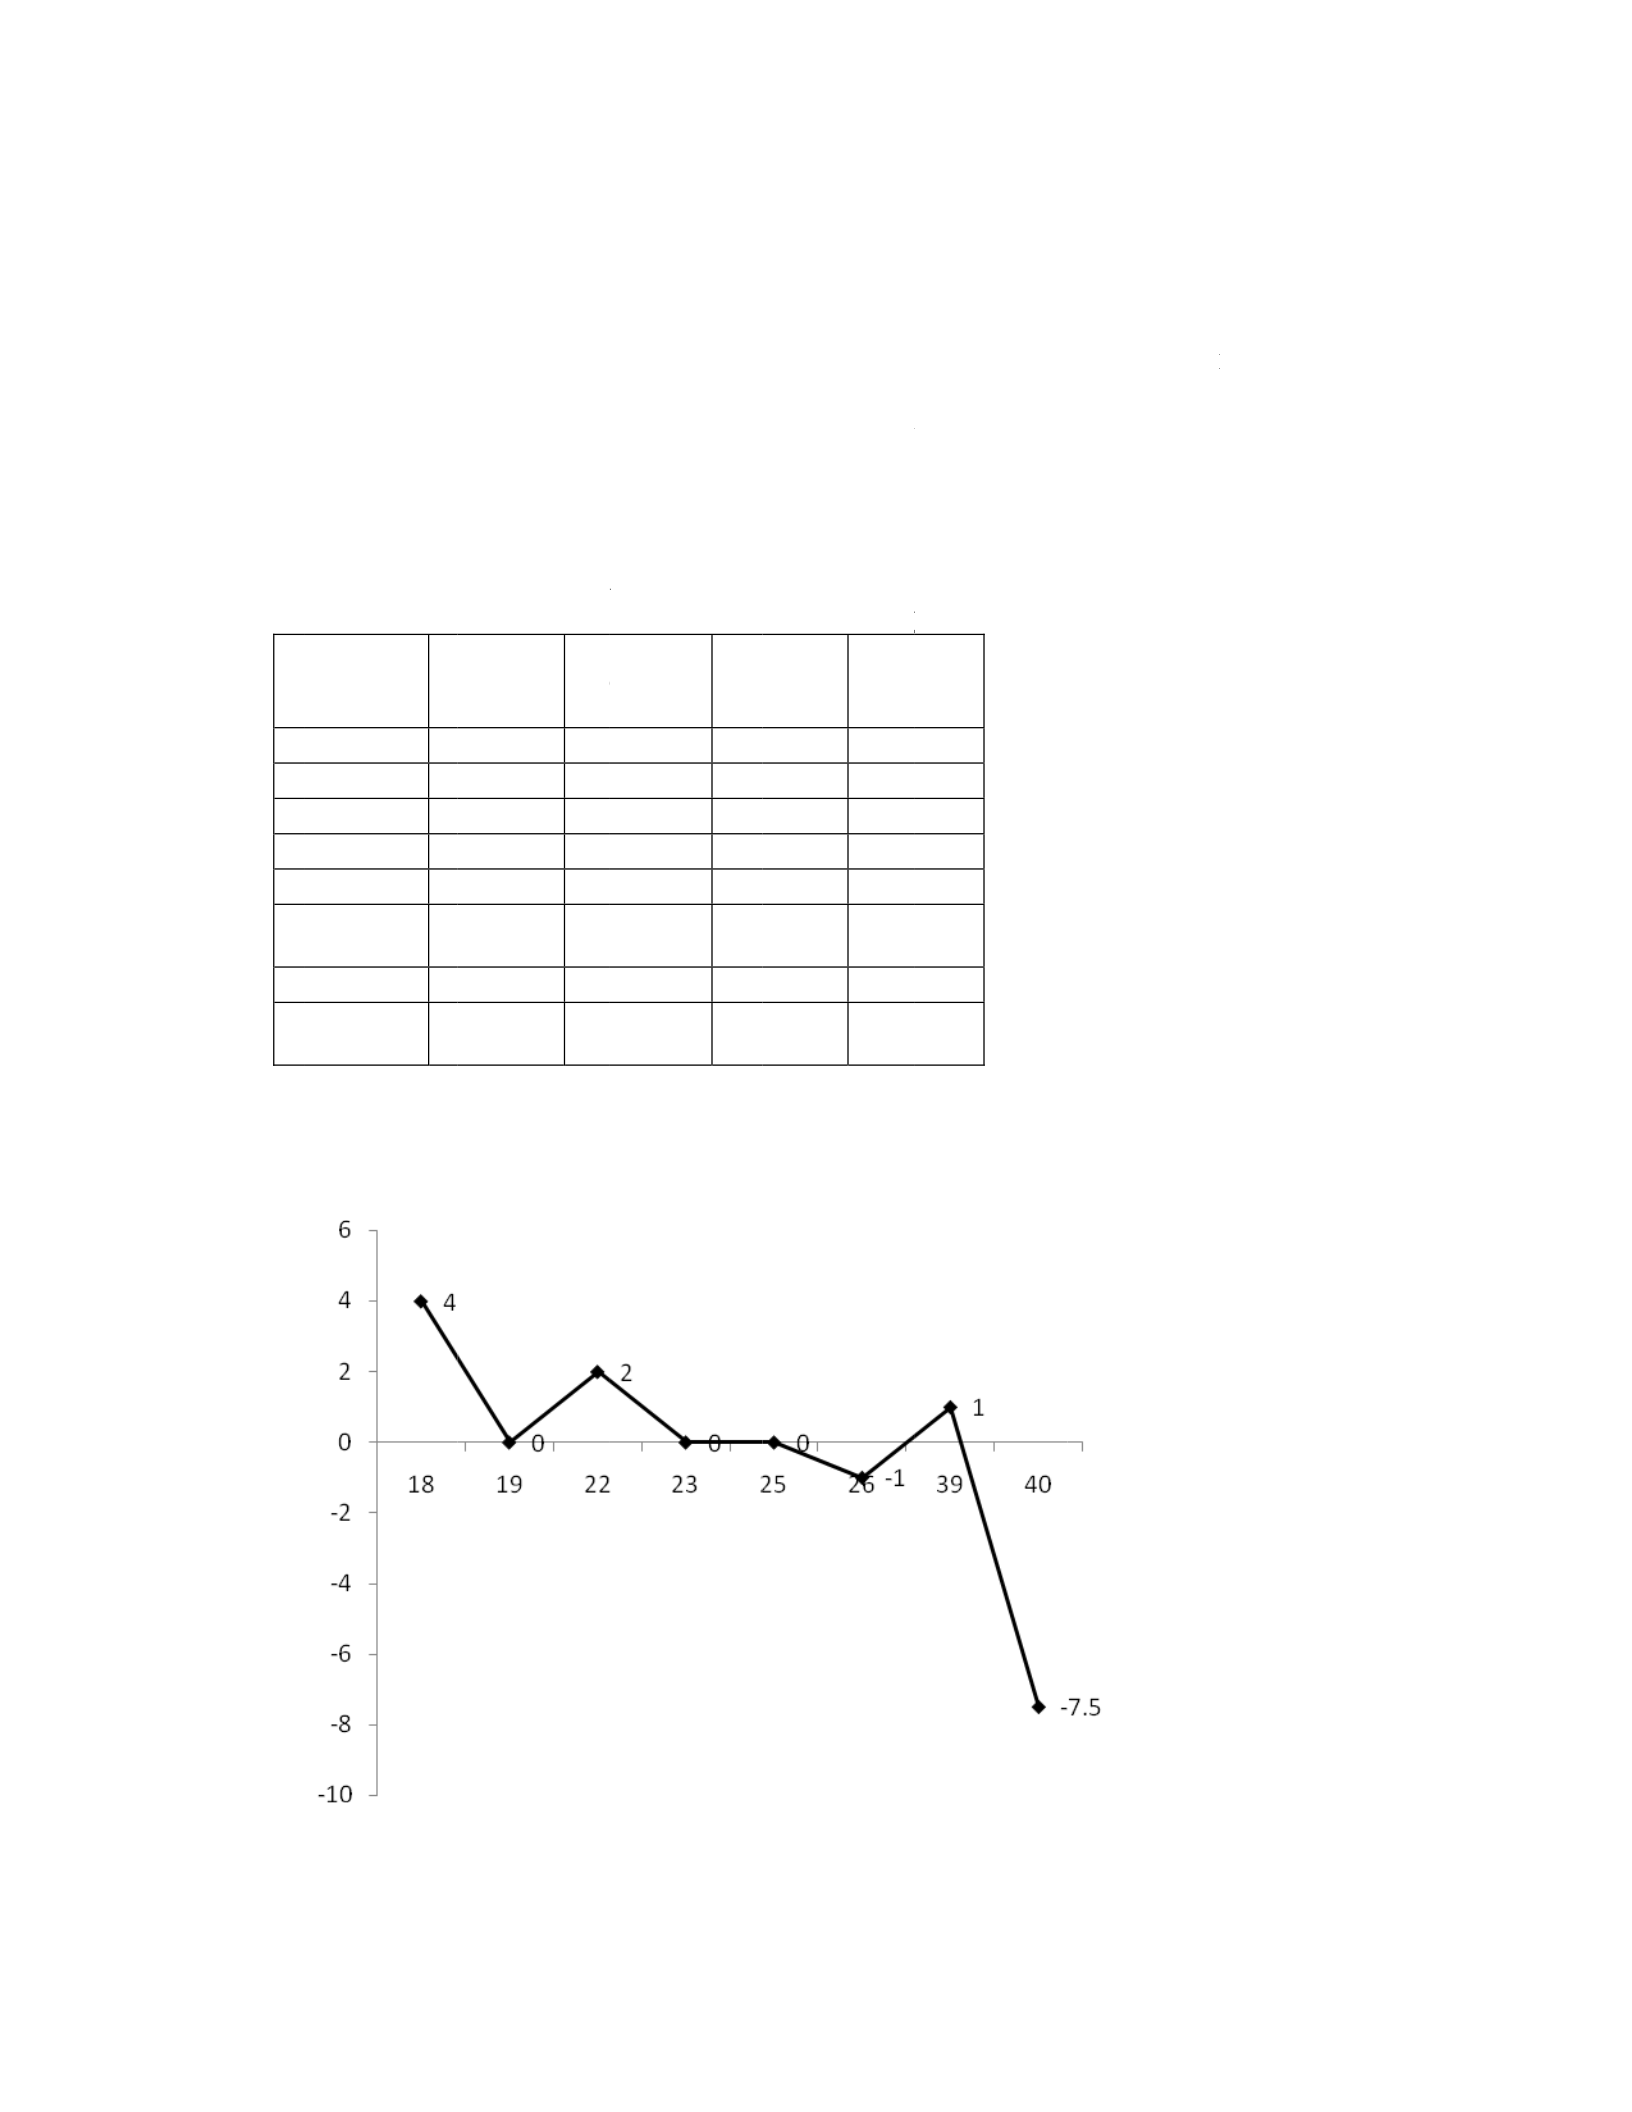
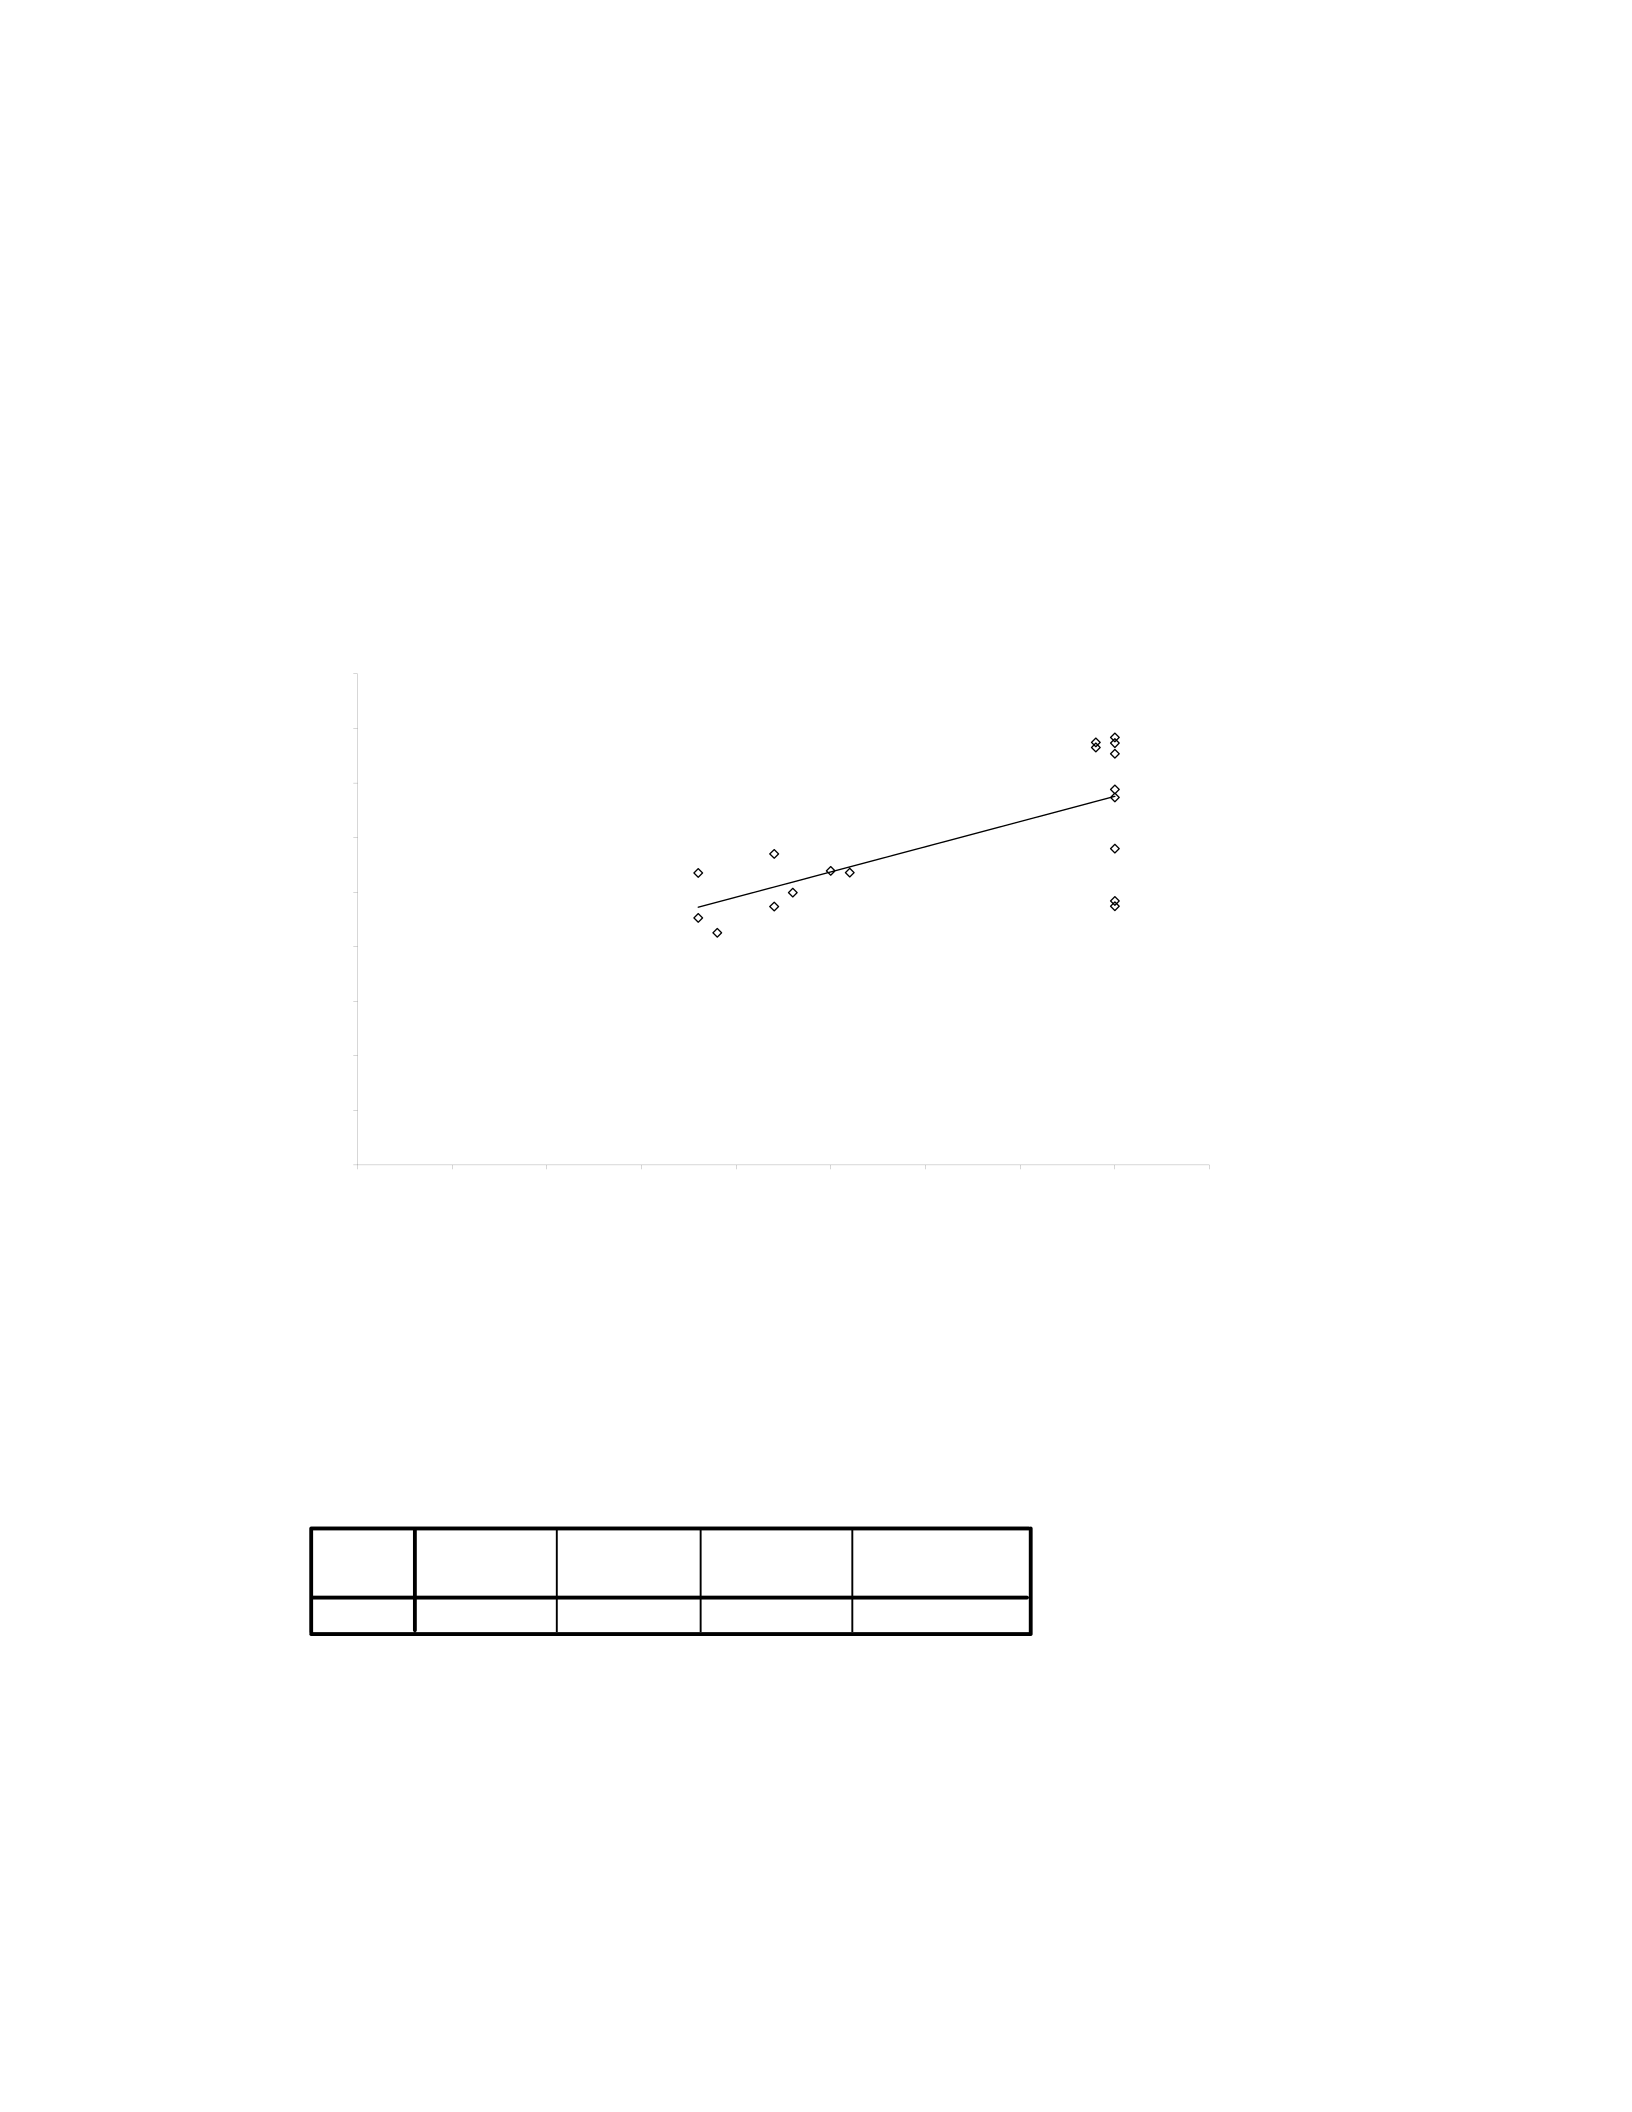
A comparison of the estimated ages from the Chervenak et al. (1998) formula to
the known ages of the modern forensic individuals showed a wide range of variation
(Figure 11). When regression was applied using SPSS an R² of 0.468 and an adjusted R²
of 0.435 was found (Table 17). ANOVA analysis showed a F-value of 14.085 and a p-
value of <0.01 (Table 18). This shows a much weaker correlation between the estimated
and known ages than seen with the Historical Data Set, but it is still statistically
significant.
Figure 11: Comparison of estimated age using Chervenak et al. (1998) to known age with
linear regression applied
Known vs Chevernak et al. Age
y = 0.3777x + 13.692
R2 = 0.4682
0
5
10
15
20
25
30
35
0 5 10 15 20 25 30 35 40 45
Known
Estimated

41
Table 17: R² results from SPSS for Chervenak et al. (1998) age estimations on modern
forensic data set
Table 18: ANOVA results for Chervenak et al. (1998) age estimations on modern
forensic data set
The Chervenak et al. (1998) formula under-aged individuals in the modern
forensic set an average of 6.050 weeks. The most significant difference between
estimated age and known age was seen in the older individuals (Table 19) (Figure 12).
Model Summary
.684a.468 .435 7.14437
Model
1RR Square
Adjusted
R Square
Std. Error of
the Estimate
Predictors: (Constant), VAR00003
a.
ANOVA
b
718.939 1718.939 14.085 .002a
816.673 16 51.042
1535.611 17
Regression
Residual
Total
Model
1
Sum of
Squares df Mean Square FSig.
Predictors: (Constant), VAR00003
a.
Dependent Variable: VAR00001
b.
T
f
o
N
I
n
F
S
t
h
T
able 19: Ra
n
o
rmula on
m
N
o. of
n
dividuals
K
A
2
1
2
1
1
1
2
8
igure 12: C
h
herwood et
A co
m
h
e known a
g
n
ge of esti
m
m
odern fore
n
K
nown
A
ge Es
ag
e
18
19
22
23
25
26
39
40
h
ervenak et
a
al. (2000) F
o
m
parison of
t
g
es of the m
o
m
ated ages a
n
n
sic individu
a
timated
e
range
A
E
19.69-
23.069
18.57
20.552-
24.476
21.601
23.222
23.079
32.491-
32.861
20.555-
33.225
a
l. (1998) E
r
o
rensic Dat
a
t
he estimate
d
o
dern forens
42
n
d breakdo
w
a
ls by age i
n
A
verage
E
rror Bi
a
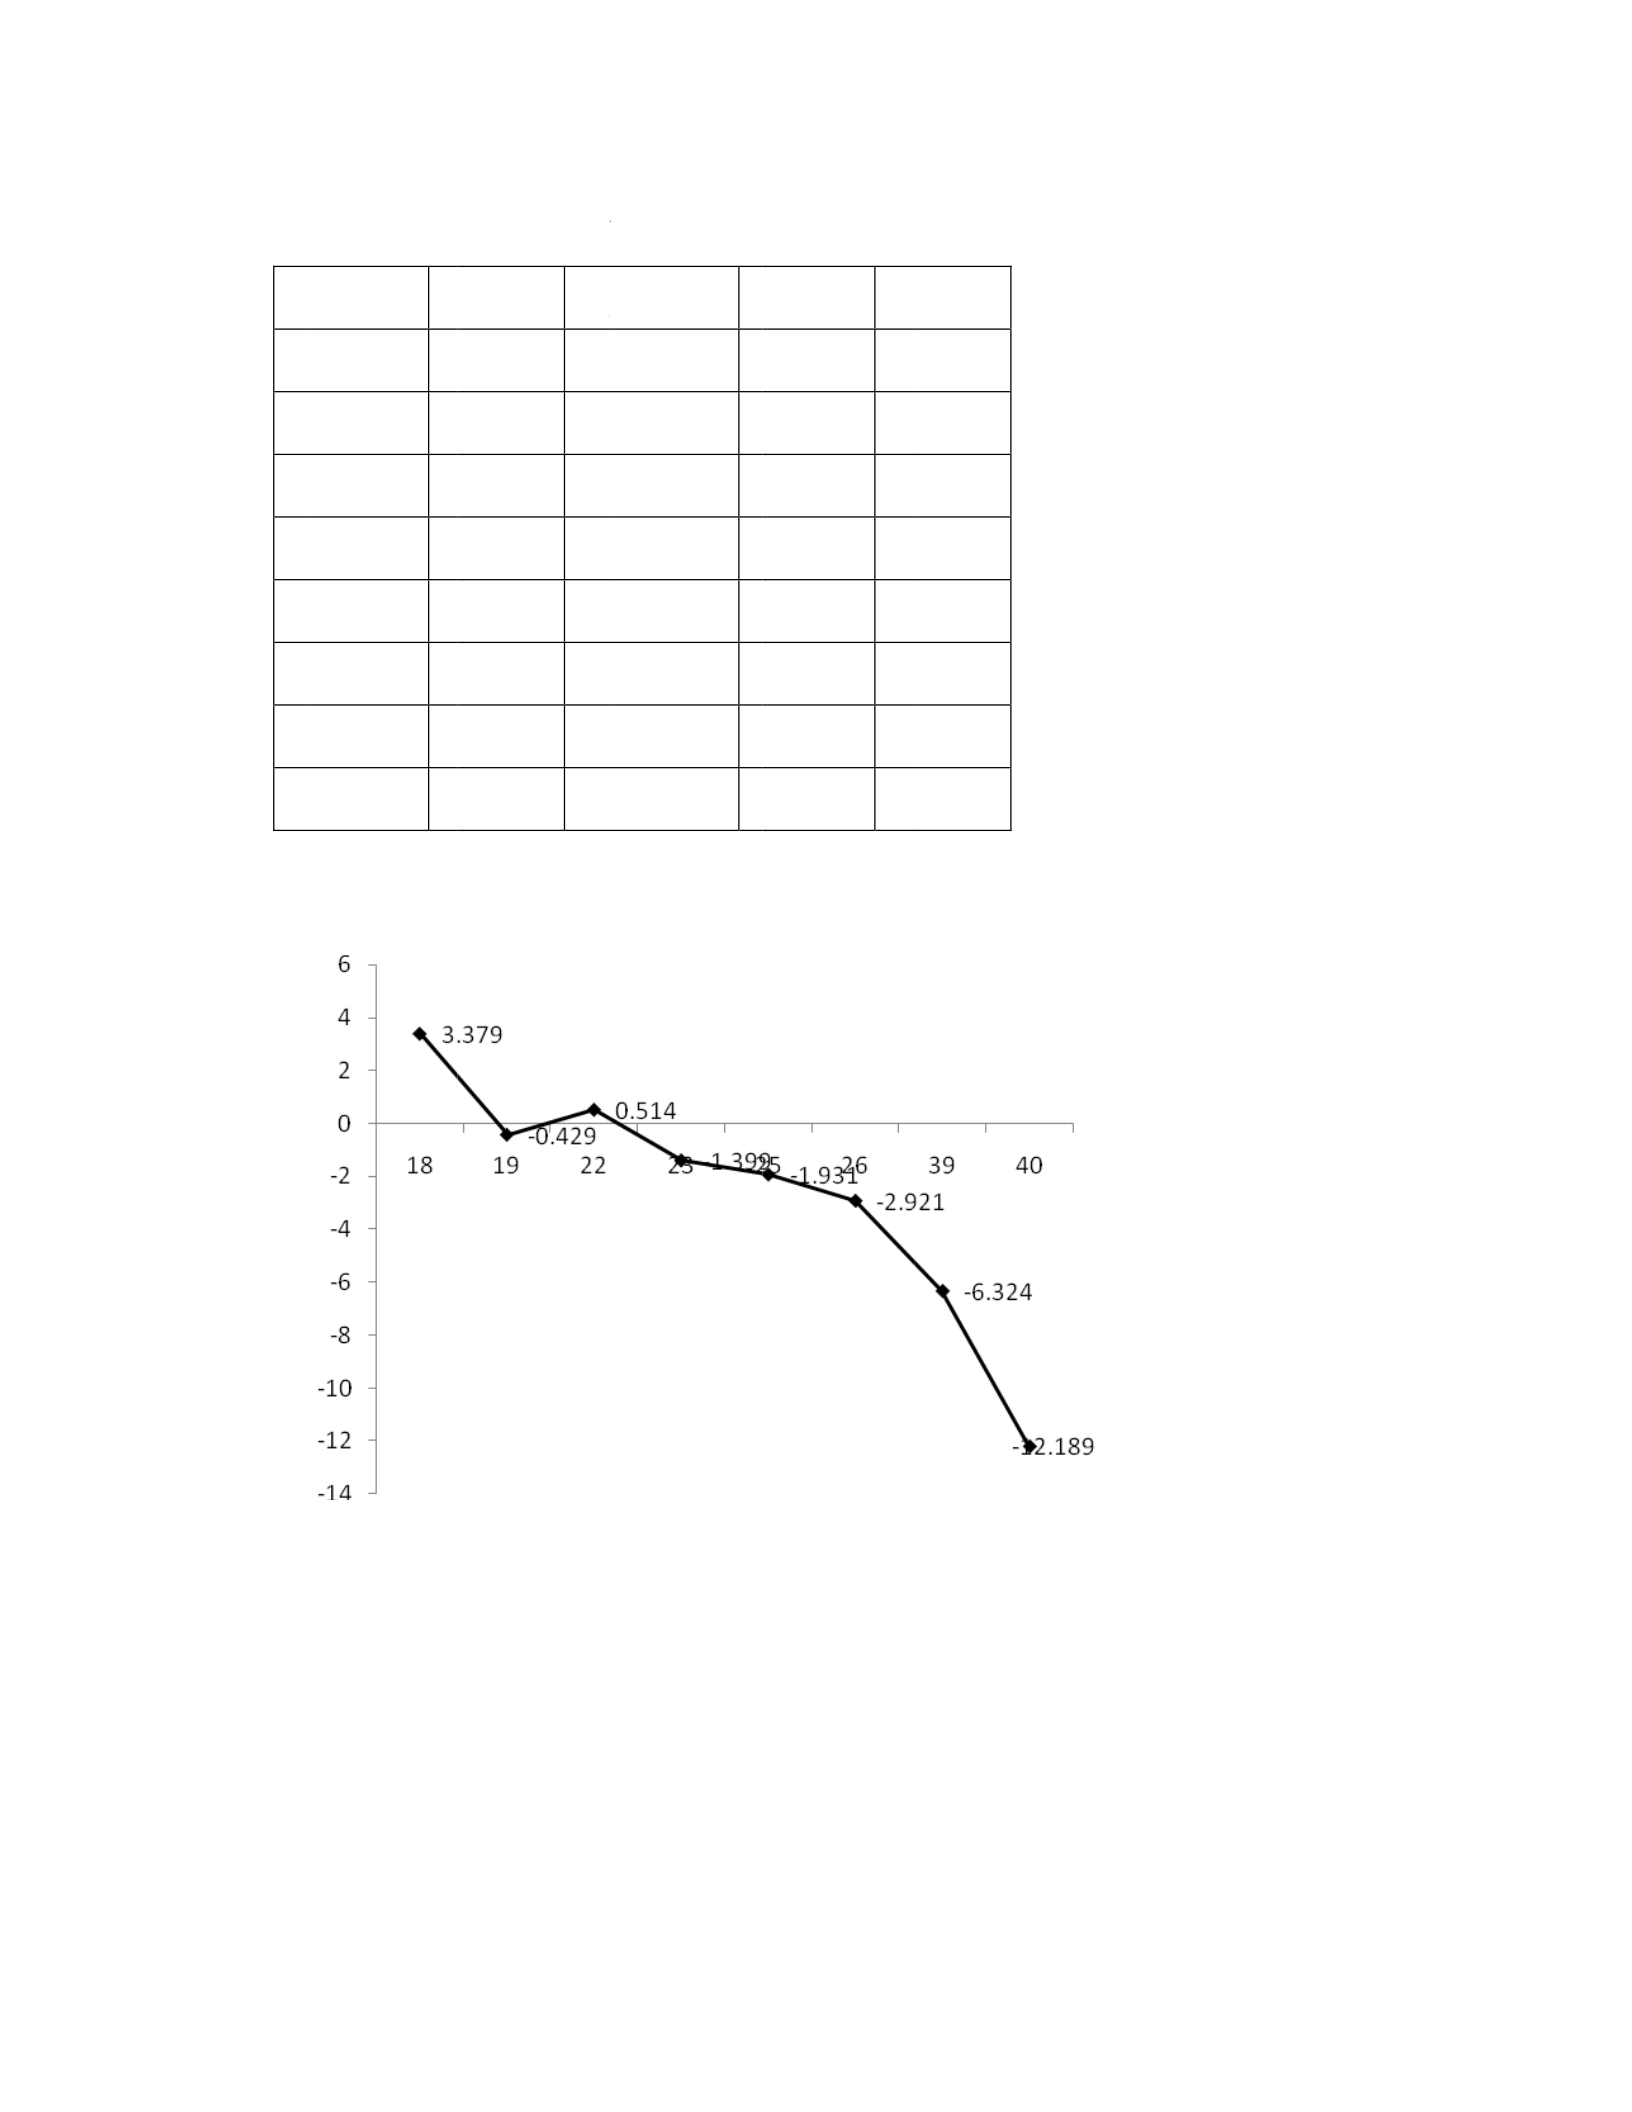
3.379 o
v
0.429
0.514 o
v
1.399
1.931
2.921
6.324
12.189
r
ror and Bia
s
a
Set Result
s
d
ages from
ic individua
w
n of bias of
n
weeks.
a
s
v
er-age
under-
age
v
er-age
under-
age
under-
age
under-
age
under-
age
under-
age
s
on Forens
i
s
the Sherwo
o
ls showed a
the Cherve
n
i
c Data Set
o
d et al. (20
0
wide range
n
ak et al. (1
9
0
0) formula
of variation
9
98)
to
43
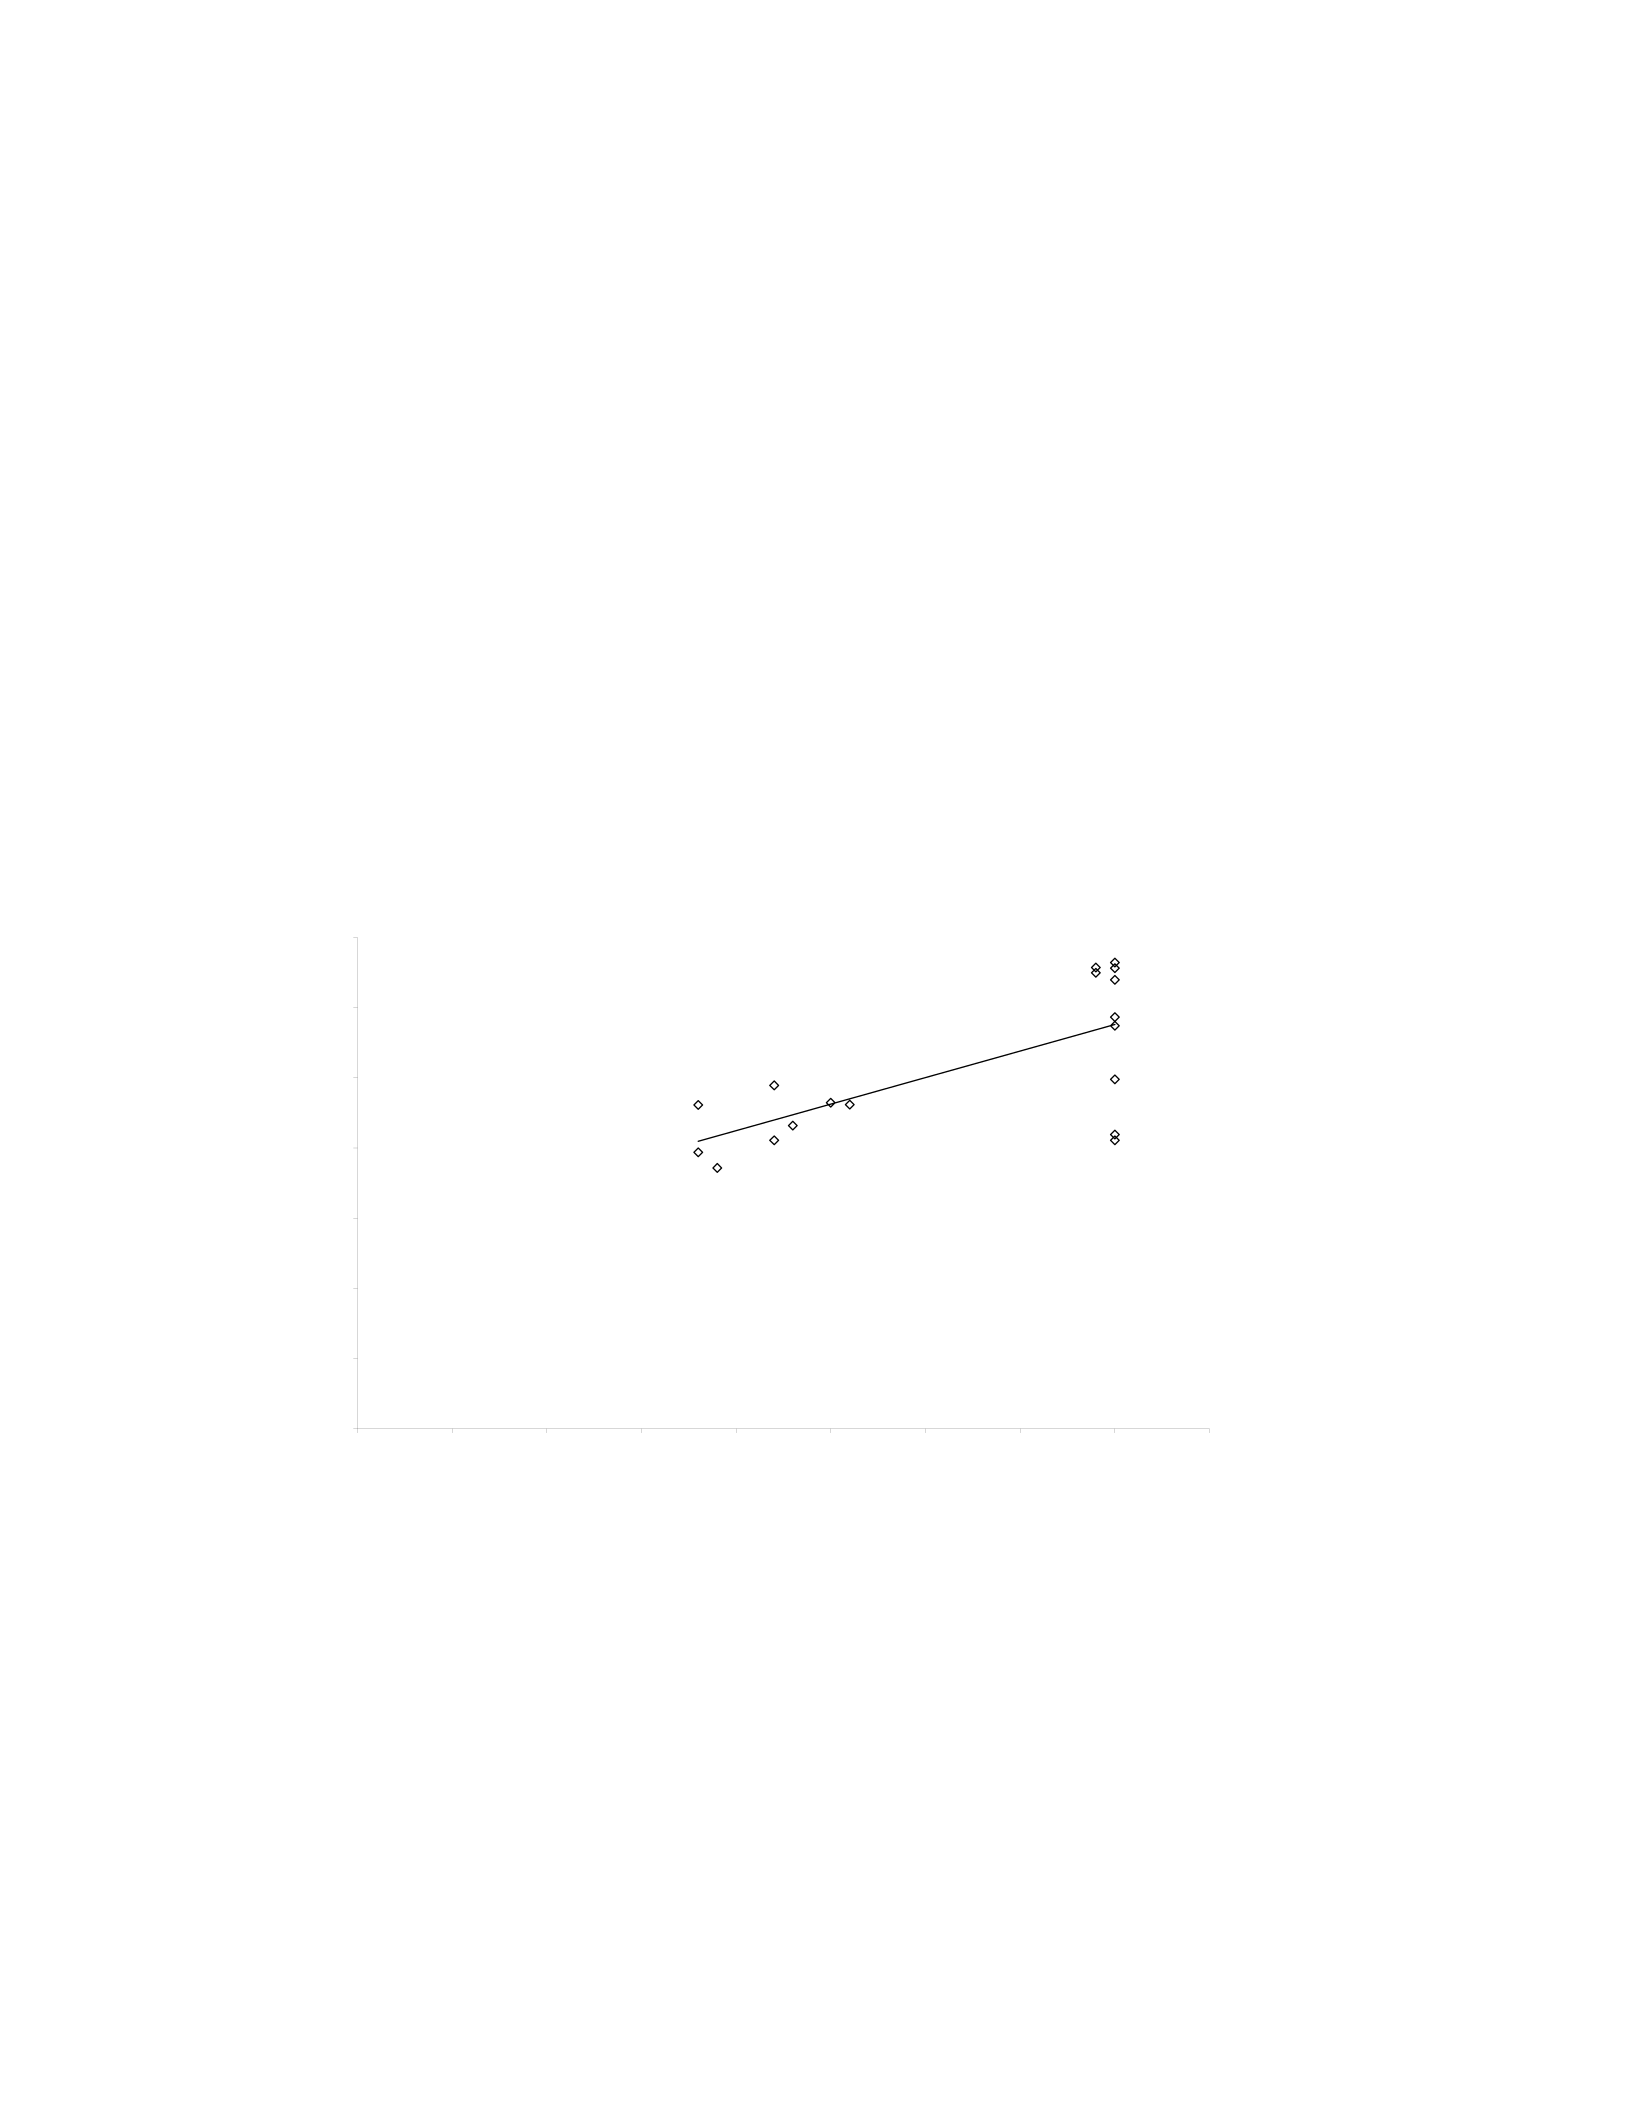
(Figure 13). When regression was applied using SPSS an R² of 0.468 and an adjusted R²
of 0.435 was found (Table 20). ANOVA analysis showed a F-value of 14.085 and a p-
value of <0.01 (Table 21). This shows a much weaker correlation between the estimated
and known ages than seen with the Historical Data Set, but it is still statistically
significant.
Figure 13: Comparison of estimated age using Sherwood et al. (2000) to known age with
linear regression applied
Table 20: R² results from SPSS for Sherwood et al. (2000) age estimations on modern
forensic data set
Known vs Sherwood et al. Age
y = 0.4612x + 15.311
R2 = 0.4682
0
5
10
15
20
25
30
35
40
45
0 5 10 15 20 25 30 35 40 45
Known
Estimated
Model Summary
.684a.468 .435 7.14437
Model
1RR Square
Adjusted
R Square
Std. Error of
the Estimate
Predictors: (Constant), VAR00004
a.

44
Table 21: ANOVA results for Sherwood et al. (2000) age estimations on modern forensic
data set
The Sherwood et al. (2000) formula under-aged individuals in the modern
forensic set an average of 1.780 weeks. This formula over-aged younger individuals and
under-aged older individuals (Table 22) (Figure 14).
Table 22: Range of estimated ages and breakdown of bias of the Sherwood et al. (2000)
formula on modern forensic individuals by age in weeks.
No. of
Individuals Known
Age Estimated
age range Average
Error Bias
2 18 22.637-
26.764 6.7002 over-age
1 19 21.269 2.269 over-age
2 22 23.689-
28.481 4.085 over-age
1 23 24.97 1.97 over-age
1 25 26.949 1.949 over-age
1 26 26.775 0.775 over-age
2 39 38.27-
38.722 0.504 under-
age
8 40
23.693-
39.167 7.446 under-
age
ANOVA
b
718.939 1718.939 14.085 .002a
816.673 16 51.042
1535.611 17
Regression
Residual
Total
Model
1
Sum of
Squares df Mean Square FSig.
Predictors: (Constant), VAR00004
a.
Dependent Variable: VAR00001
b.

Figure 14: S
h
h
erwood et
a
a
l. (2000) Er
r
45
r
or and Bia
s
s
on Forensi
c
c
Data Set

46
DISCUSSION
Historical Data Set
The estimated ages produced by the Fazekas and Kosa (1978) formula proved to
be accurate for the historical data set. The R² of 0.780 and p-value of <0.01 show a
statistically significant relationship between the estimated ages and the known ages of the
individuals. The closer the R² value is to 1, the stronger the correlation is between the
independent (known age) and dependent (estimated age) variables. P-value shows the
likelihood that the relationship between the variables is due to chance. Therefore, a p-
value of <0.01 means that less than 1% of the correlation between the known ages of the
Historical Data Set and the estimated ages produced by the Fazekas and Kosa (1978)
model is the result of chance. While the formula did tend to overage, the error was
minimal and averaged 2.355 weeks. This is similar to the error of one-half lunar month
as reported by Fazekas and Kosa (1978) for their model.
The Fazekas and Kosa (1978) formula produced the most inaccurate age estimates
for the 12-week-old individuals and the 20-week-old individuals. The error of the 12
week-old estimations is most likely due to the level of ossification. Issel (1985) stated
that measurements taken prior to 14 weeks gestation were not reliable to date
pregnancies. The error of the 20 week-old individuals is slightly more difficult to
explain. There is the possibility that these individuals have some unusual development
that resulted in them being over-aged so drastically. The average bias of the age
estimates derived by the Fazekas and Kosa (1978) formula for the remaining individuals
remained close to the one-half lunar month error reported by the authors.

47
The Chervenak et al. (1998) formula also produced accurate age estimates for the
Historical Data Set. The R² of 0.752 and p-value of <0.01 shows a statistically
significant relationship between the estimated ages and the known ages of the
individuals. This method tended to over-age individuals in the Historical Data Set. An
average positive error of 2.153 weeks was found.
The Chervenak et al. (1998) formula was off by over 3 weeks on age estimates for
the 12, 20, 36, and 40 week-old individuals with the most error seen for the 12 week-old
and 40 week-old individuals. The 12 week-old individuals were over-aged an average of
6.598 weeks. Once again, the error of the 12 week-old age estimation is most likely due
to the ossification process and reliable measurements for age estimation not being
possible until 14 weeks gestation (Issel, 1985). The 40 week-old individuals were under-
aged an average of 5.751 weeks. Interestingly, this method over-aged individuals from
12-20 weeks gestational age and under-aged those from 20-40 weeks gestation age.
These results are similar to the results that Sherwood et al. (2000) reported when they
utilized the Chervenak et al. (1998) formula. Sherwood et al. (2000) found that fetuses
were consistently under-aged 2 to 4 weeks by the Chervenak et al. (1998) method. The
results of the 40 week-old individuals in the Historical Data Set are in line with previous
bias found with the Chervenak et al. (1998) formula.
The age estimates produced by Sherwood et al. (2000) proved to be accurate for
the Historical Data Set. The R² of 0.752 and p-value of <0.01 show a statistically
significant relationship between the estimated ages and the known ages of the
individuals. This method tended to over-age individuals by an average of 2.189 weeks.

48
The most error for age estimates produced by the Sherwood et al. (2000) formula
were for the 12 week-old individuals and the 20 week-old individuals. The results for the
12 week-old individuals can once again be explained by the ossification process making
measurements unreliable for age estimation until 14 weeks gestation (Issel, 1985). It is
difficult to determine the cause of the error in the age estimates for the 20 week-old
individuals. It is possible that these individuals have some unusual development that
resulted in them being over-aged so drastically. This is the most likely cause rather than
a fault in the method since these individuals were also over-aged by the Fazekas and
Kosa (1978) formula as well as the Chervenak et al. (1998).
Results show that all three methods; Fazekas and Kosa (1978), Chervenak et al.
(1998), and Sherwood et al. (2000) produced age estimates that showed a strong
correlation with the known ages that were statistically significant for the Historical Data
Set. The question then arises, which is the most accurate? Looking at R² values alone,
the Fazekas and Kosa (1978) method shows a stronger correlation between estimated
ages and known ages. The Fazekas and Kosa (1978) formula also had the most evenly
distributed error across the different gestational ages, roughly one-half lunar month as
reported by the authors. For individuals similar to those from the Historic Data Set, the
Fazekas and Kosa (1978) method would be the preferred method for age estimation.
Forensic Data Set
The age estimates produced by the Fazekas and Kosa (1978) formula for
individuals in the Forensic Data Set showed a weak correlation with the known ages. The

49
R² of 0.486 and p-value of <0.01 is evidence that while the relationship between the
estimated ages and the known ages of the individuals is weak, it is statistically
significant. Generally a R² less than 0.50 is evidence of a weak correlation. This was
unexpected since the Fazekas and Kosa (1978) formula is the traditional method used by
forensic scientists in the determination of fetal skeletal age.
The Fazekas and Kosa (1978) model tended to under-age individuals an average
of 2.611 weeks. The most error in the age estimations were for the 18 week-old and 40
week-old individuals. The 18 week-old individuals were over-aged an average of 4
weeks, whereas the 40 week-old individuals were under-aged an average of 7.5 weeks.
While the average error is close to the one-half lunar month error expected, the error for
the 40 week-old individuals is much higher. The error of the age estimates for the 18
and 40 week-old individuals being much higher than the other gestational ages could be
the result of unusual development in these particular individuals or it may be evidence
that this model is not proficient at estimating ages in this particular group.
The age estimates produced by the Chervenak et al. (1998) formula for the
Forensic Data Set also showed a weak correlation. The R² of 0.468 and p-value of <0.01
are evidence that while the relationship between the estimated ages and known ages is
weak, it is still statistically significant.
The Chervenak et al. (1998) model tended to under-age individuals in the
Forensic Data Set an average of 6.050 weeks. The age estimates had the most error for
the 18, 39, and 40 week-old individuals with the highest error being the 39 and 40 week-
old individuals. The 39 week-old individuals were under-aged an average of 6.324

50
weeks and the 40 week-old individuals were under-aged an average of 12.189 weeks.
The 40 week-old individuals once again had the most error in age estimations produced
for them.
The age estimates produced by the Sherwood et al. (2000) formula for the
Forensic Data Set showed a weak correlation. The R² of 0.468 and p-value of <0.01 are
evidence that the relationship between the estimated ages and known ages is weak
although statistically significant.
The Sherwood et al. (2000) method under-aged individuals an average of 1.780
weeks. The most error in the age estimates were for the 18, 22, and 40 week-old
individuals. The 18 week-old individuals were over-aged an average of 6.7002 weeks,
the 22 week-old individuals were over-aged an average of 4.085 weeks, and the 40 week-
old individuals were under-aged an average of 7.446 weeks. It is interesting that once
again the 40 week-old individuals had the greatest error. These individuals had the most
error in age estimates produced by all three of the regression models. This may point to
some unusual development in this group or it may be evidence that these regression
models are not accurate for estimating ages of these individuals in the Forensic Data Set.
The overall results are still interesting even if the correlations are weak. The
Forensic Data Set was under-aged by each of the regression formulae. It was expected
that the Chervenak et al. (1998) method would be the most accurate at estimating ages for
the Forensic Data Set due to their use of normal healthy pregnancies in the development
of their method. It was thought that the Forensic Data Set would contain healthy normal
individuals. Looking at the average error for each formula, 2.611 weeks for Fazekas and

51
Kosa (1978) and 1.780 weeks for Sherwood et al. (2000) versus 6.050 weeks for
Chervenak et al. (1998), it is possible that the Forensic Data Set is not comprised of
healthy individuals. The Fazekas and Kosa (1978) and Sherwood et al. (2000) formulae
were both created using spontaneously aborted fetuses. These methods were far more
accurate at estimating ages for the Forensic Data Set than the Chervenak et al. (1998)
method. This may be evidence of the health of the Forensic Data Set individuals. It
would take further study to determine this and the answer cannot be found within this
research. However, this is something that should definitely be explored. Determining the
health of modern forensic fetal remains would be a crucial step in the process of
developing an accurate age estimation regression formula. It is also possible that the
Chervenak et al. (1998) model produced higher error due to it being ultrasound derived.
This may be evidence that ultrasound derived regression formula are not useful when
using dry bone measurements. This is also something to explore with further research.
The age estimates produced by each of the three regression formulae for the
Forensic Data Set showed a weak correlation. Deciding which of the models is the
preferred method for estimating age in modern forensic fetal skeletal material is not
straightforward. The Chervenak et al. (1998) method produced the most error and is not
perhaps the best method for estimating age in modern forensic fetuses. The Sherwood et
al. (2000) model showed the least amount of error, however the Fazekas & Kosa (1978)
model had the strongest correlation and an expected level of error. Therefore it would
seem that until a better model is developed, the Fazekas and Kosa (1978) model should
continue to be used by forensic osteologists for estimating age on modern forensic fetal
skeletal material.
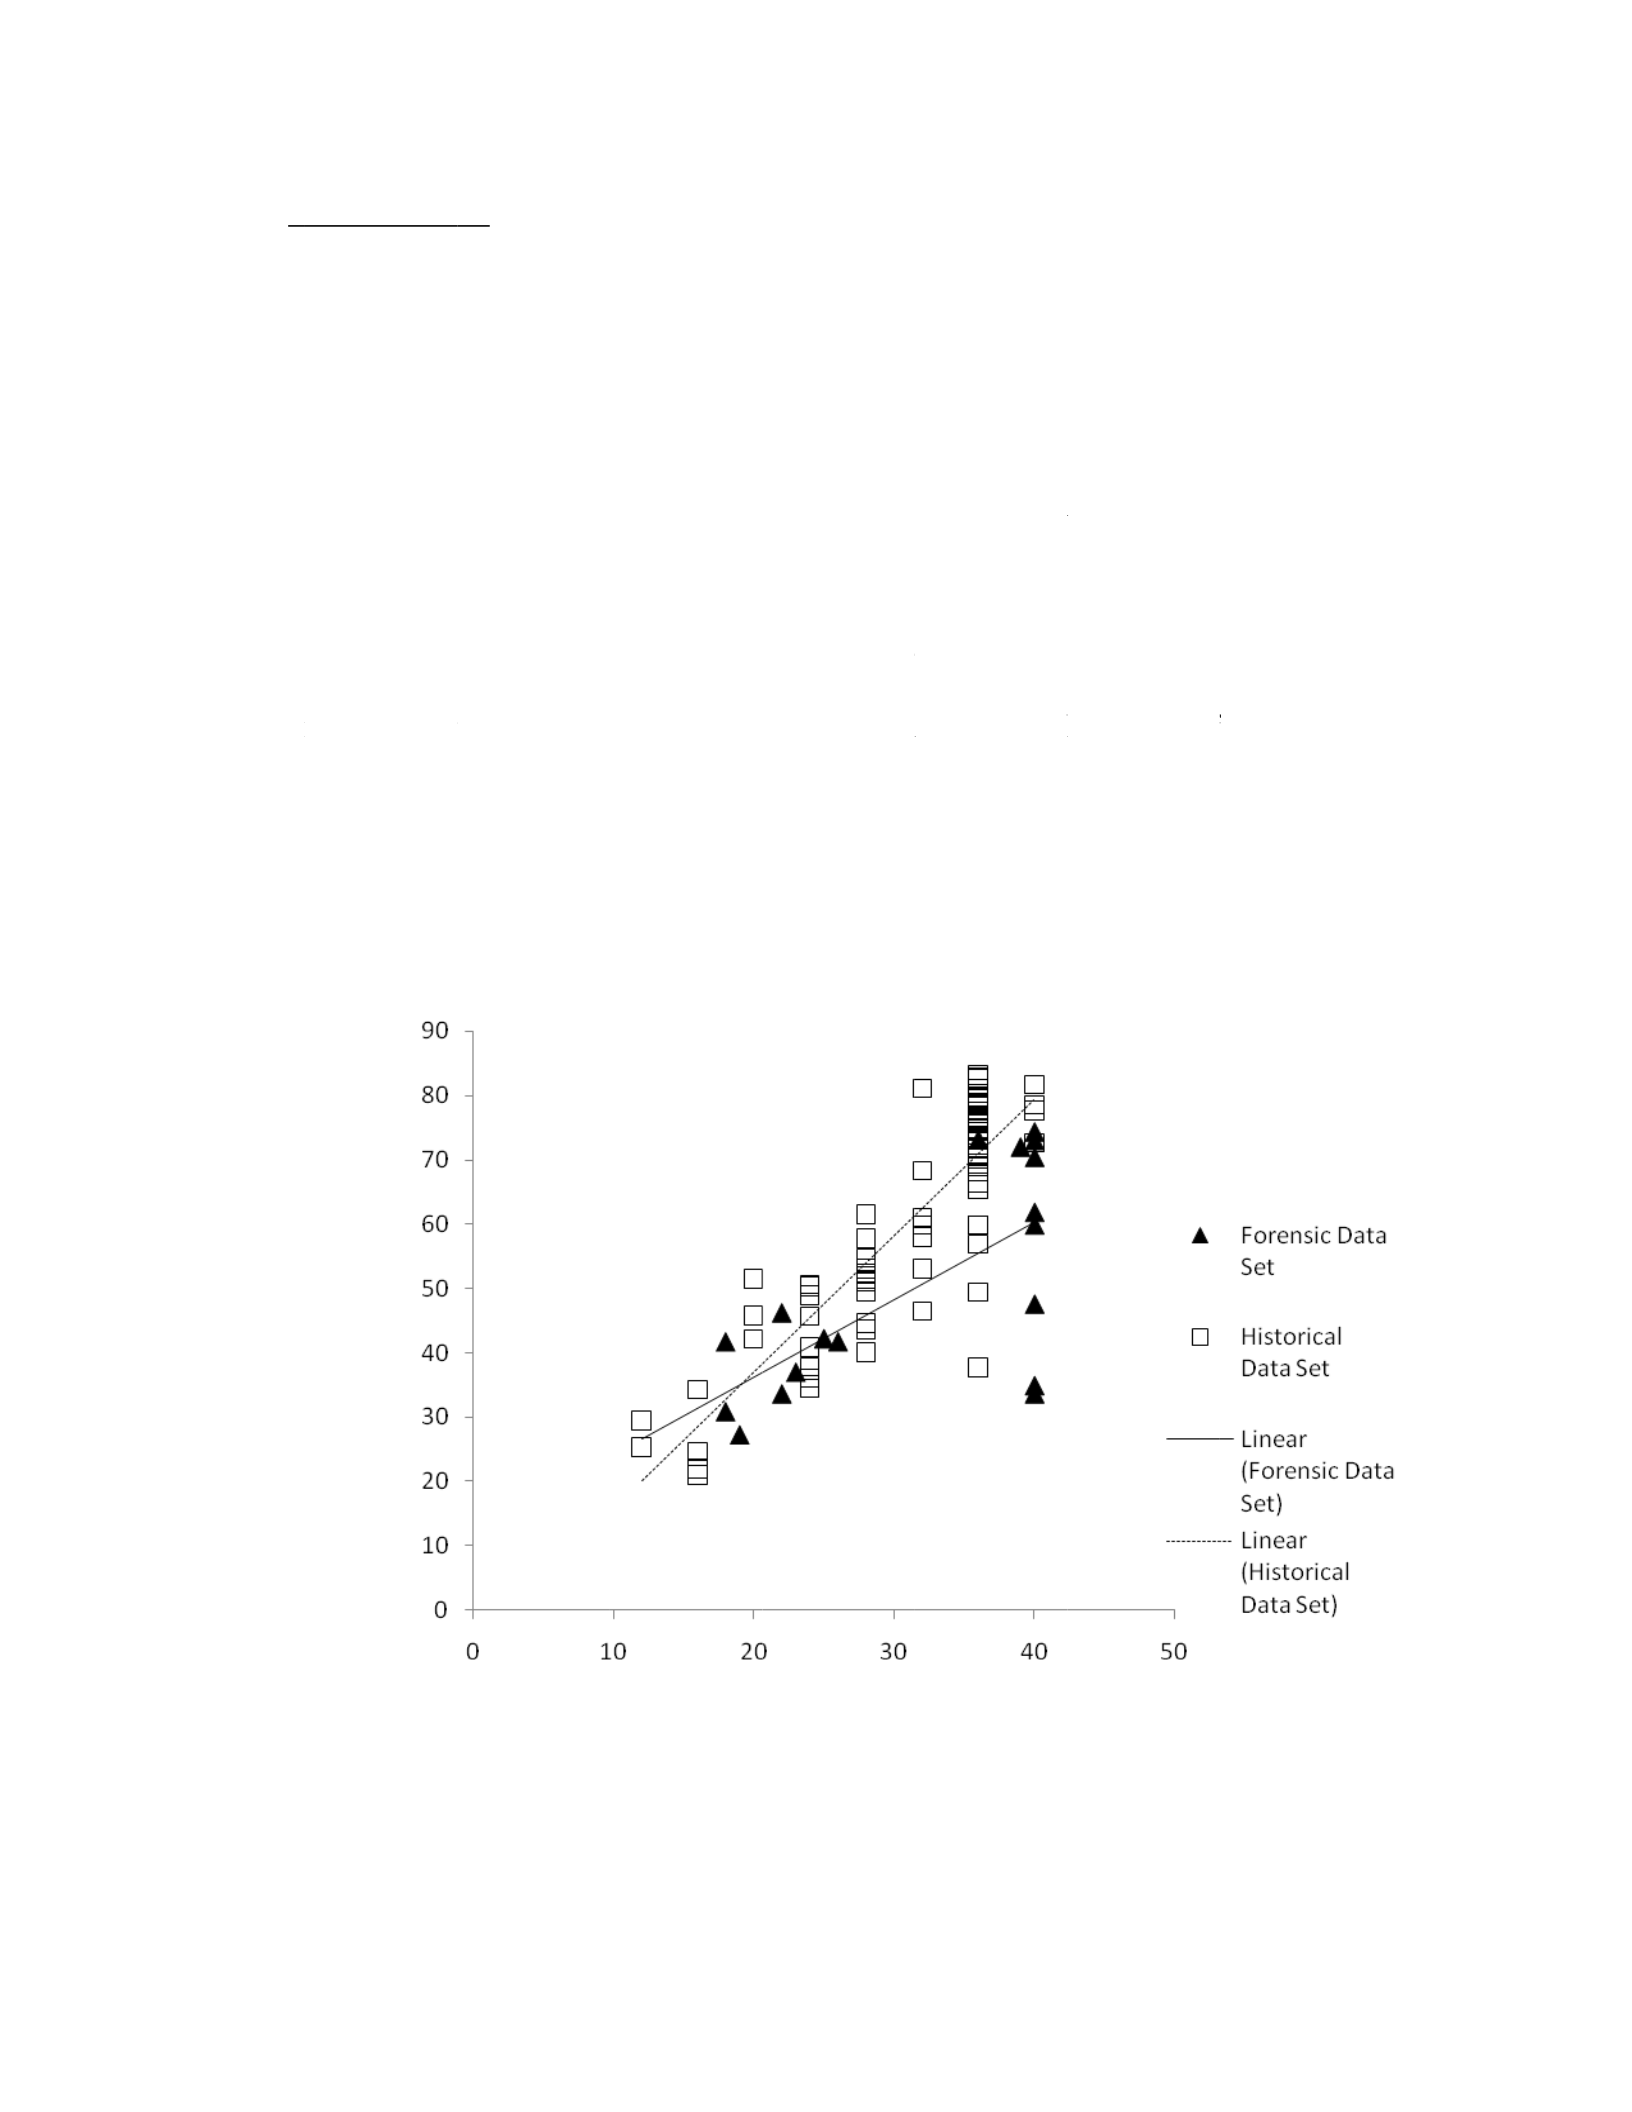
S
t
h
i
n
m
a
n
o
g
r
g
g
F
Femur Length
i
ecular Cha
n
This
s
h
e estimate
d
n
dividuals i
n
m
odel actual
l
n
d femur le
n
f an increas
e
r
aph shows
t
enerally sh
o
estation, se
e
igure 15: C
o
i
n mm
n
ge
s
tudy was al
s
d
ages produ
c
n
the Forens
i
l
y tended to
n
gths of bot
h
e
in femur l
e
t
hat at 40 w
e
o
rter than th
e
e
m to have s
i
o
mparison o
s
o looking
fo
c
ed by the F
i
c Data Set.
unde
r
-age t
h
h
sample set
e
ngth in the
m
e
eks gestati
o
e
historical
fe
i
milar femu
r
f the Histo
r
Know
n
52
fo
r evidence
azekas and
K
This was n
o
h
ese individ
u
s were grap
h
m
odern for
e
o
n, the fem
u
fe
tuses. The
r
lengths in
b
r
ical Data S
e
n
Age in Weeks
of secular c
h
K
osa (1978
)
o
t the case,
t
u
als. In ad
d
h
ed, the tre
n
e
nsic fetuses
u
r length of t
h
younger in
d
b
oth sample
e
t and the F
o
h
ange. It w
a
)
formula w
o
t
he Fazekas
a
d
ition, when
n
dlines show
overall (Fi
g
h
e modern
f
d
ividuals, fr
o
sets.
o
rensic Data
a
s expected
t
o
uld ove
r
-ag
a
nd Kosa (1
the known
a
ed no evide
n
g
ure 15). T
h
f
orensic fetu
o
m 18-28 w
e
Set
t
hat
e the
978)
a
ges
n
ce
h
e
ses is
e
eks

53
CONCLUSION
This research tested the efficacy of the Fazekas and Kosa (1978) method for fetal
age estimation and compared it to the Chervenak et al. (1998) method and the Sherwood
et al. (2000) method for age estimation. Two data sets from known age fetal and neonate
skeletons were used for testing the age estimation formulae for fetal remains, one
comprised of historical individuals and one comprised of modern forensic individuals.
All three of the regression formulae tested derived estimated ages with a strong
correlation to the known ages in the Historical Data Set. It was determined that the
Fazekas and Kosa (1978) method produced estimated ages closest to the known ages for
the Historical Data Set. None of the regression formulae proved to have a strong
correlation between the estimated ages derived and the known ages of the individuals in
the Forensic Data Set, although the results were statistically significant. It was
determined that the Fazekas and Kosa (1978) formulae produced estimated ages closest
to the known ages of modern forensic fetal skeletal material. This is due to the model
producing an error similar to that acknowledged by Fazekas and Kosa (1978) and it
showing the strongest correlation between the estimated and known ages of individuals.
The results of this research were unable to show any evidence of a secular change in the
body length of fetuses.
This research has shown that the methods readily used by forensic scientists in the
estimation of modern fetal age are not as accurate as one would expect. The use of an
method that produces age estimates without a strong correlation to known age in forensic
cases is alarming since this would have a significant impact on identification and

54
prosecution. A new fetal age estimation regression formula needs to be developed from a
sample of modern fetal skeletal measurements. Meadows and Jantz (1995) called for
“up-to-date stature estimation formulae derived from the contemporary population from
which modern forensic cases are drawn” for adult stature estimation (p 766). The same is
required for fetal remains. A meticulous study with the detail and precision like that of
the Fazekas and Kosa (1978) researchers would be an amazing asset to forensic
osteologists.
A continued effort, such as those at the Forensic Data Bank and the William M.
Bass III Donated Collection, should be made to develop a database of measurements of
modern fetal skeletal remains. An adequate data set is necessary for any research with
forensic fetal skeletons and would be a benefit to researchers everywhere. It would be
fascinating to re-study these regression models if more data could be added to the sample
set for modern forensic individuals.

