


Introduction Critical Infrastructure
Critical Infrastructure (CI) is categorized into 16 sectors of physical or virtual
assets that are so important that their damage or destruction would have a devastating
effect on national economic security, public health, safety or security [DHS, 2016].
Because of the importance of CI, securing these assets against adversaries is imperative.
The primary contribution of this research is developing an approach that allows the
vulnerabilities of these assets to be identified so they can be secured against attack. In this
dissertation, a model based approach to perform vulnerability assessment (VA) on system
and human architectures of CI systems is developed. The human and system architectures
can result in executable architectures, which will be shown in the human analysis portion
of the case study, or in data that can be used for other types of modeling and analysis. In
general, the approach results in data that can be analyzed to aid decision makers in
making tradeoffs on how to use security resources. In addition, the approach allows the
architectures developed to be analyzed using various analysis techniques. While
operations research (OR) methodologies (Integer Linear Program (ILP) and Bi-level
Mixed Integer Program (BLMIP)), social network analysis (SNA) and time to
compromise (TTC) analysis is used in the case study in this research, other modeling and
simulation tools such as discrete event simulation could be used for the analysis portion
of the approach presented. These methods will help decision makers to determine the best
investments to mitigate security risks in CI. This is the first research that links model
based systems engineering concepts and human and system architectures to CI VA in a
methodical way that leads to a quantitative analysis.
The approach developed in this research also provides a method for systems
engineers to use common tools and approaches to contribute to CI VA at the architecture

level without having detailed data. This will provide more engineers that can contribute to
assessing and mitigating vulnerabilities in CI.
Figure 1.1 provides an overview of the scope of this research, showing how the CI
VA uses human and system architectures and the types of quantitative analysis that can be
performed on each.
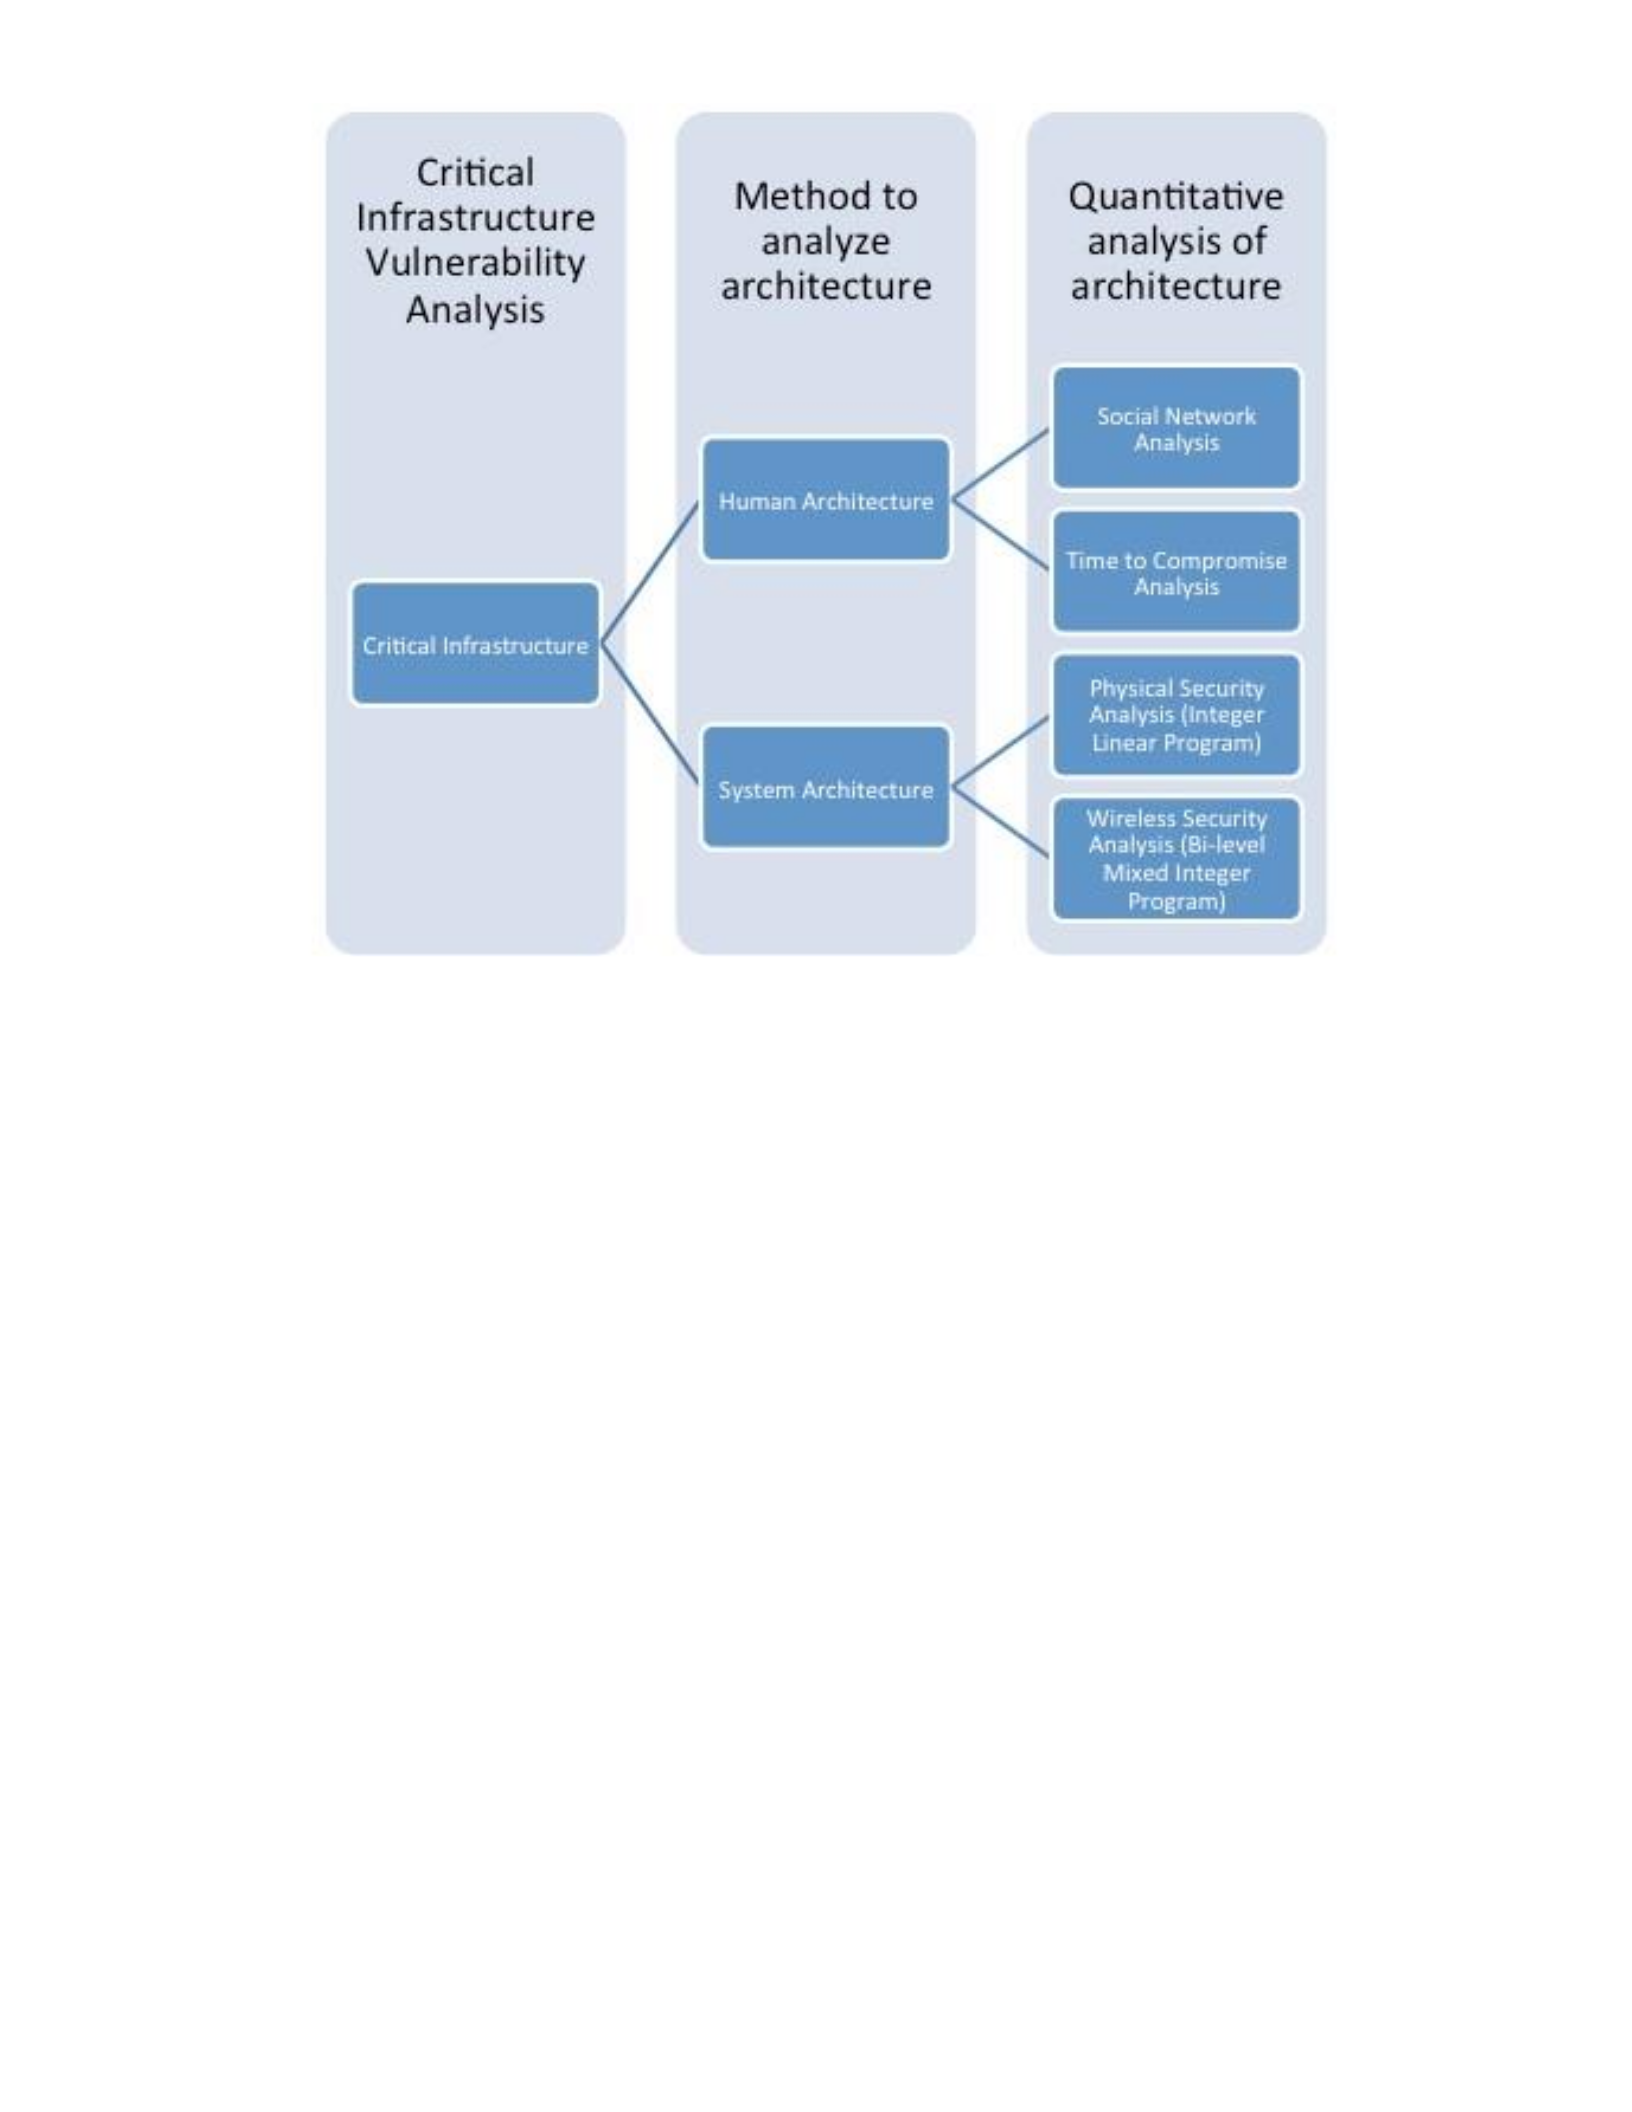
Figure 1.1 Dissertation overview
This research develops approaches to analyze system and human architectures of
CI. Once the analysis of these approaches is developed, the data in the architecture that is
collected is used to create models to perform quantitative analysis, which allows decision
makers determine how to invest security resources. The quantitative analysis methods
represent the type of analysis that can be performed once the architecture is fully
developed.
1.1.1 Background and motivation
There have been many examples of both cyber and physical attacks on CI
systems. Two examples of such attacks that impact both the human and systems

components of CI are the Metcalf electrical substation attack in 2013 and the Stuxnet
cyber-attack that was discovered in 2010.
Securing electrical substations has become an increasingly important topic since
the Metcalf attack in 2013. The attack occurred in April 2013 at the Pacific Gas and
Electric Corporation Metcalf substation; gunmen fired bullets at the substation, damaging
17 transformers and 6 circuit breakers and causing an estimated $15.4 million in damage
[Brinkman et al., 2015]. Although this attack was not catastrophic, a potential exists for a
major impact to national security if there is a coordinated attack on substations. The Wall
Street Journal reported that the “U.S. could suffer a coast-to-coast blackout if saboteurs
knocked out just nine of the country’s 55,000 electric transmission substations on a
scorching summer day, according to a previously unreported federal analysis” [Smith,
“US Risks” 2014]. These numbers have not been confirmed by the federal government,
but the then-chairman of the Federal Energy Regulatory Commission (FERC) noted that
“there are probably less than 100 critical high voltage substations on our grid in this
country that need to be protected from physical attack” [Smith, “US Risks” 2014]. This
substation example demonstrates clear human to system interaction, which shows that
both system and human aspects would need to be evaluated to determine all of the
system’s vulnerabilities.
In addition to the physical security aspects in the substation case study, cyber
security is another area of concern in human-system integration. The discovery of
Stuxnet, a highly publicized cyber weapon, changed the conversation about
cybersecurity; it highlighted the vulnerabilities in human-system integration points
because it was spread via USB and local networks [Langer, 2011] by humans connecting
USB devices to systems. The malware infected any Windows PC with which it came in

contact, but its targets were specific programmable logic controllers (PLCs) manufactured
by Siemens [Langer, 2011]. A PLC is used in industrial control systems to control devices
such as pumps, valves and motors. Once the code had found a target controller, it would
cause damage to physical equipment; one example of the code’s effect is the sabotage of
centrifuges at the Natanz uranium enrichment plant in Iran [Langer, 2011; Zetter, 2014].
This is just one example of vulnerabilities that can be exploited in human to system
interfaces, such as USB.
In these attacks, both the systems and human-system interfaces were vulnerable.
These vulnerabilities, if exploited, can have levels of severity from damaged equipment
to loss of life in the case of loss of electrical power. As new infrastructure is built and
existing infrastructure is maintained, a method to evaluate vulnerabilities and allow
decision makers to determine the best use of security resources is needed. The approach
presented in this research will allow system architects and decision makers to construct a
comprehensive model for evaluating CI systems.
1.1.2 Method for evaluating CI systems
The goal of this research is to provide a new method for using system and human
architectures to perform VA for CI systems; the data from the VA will be used by decision
makers to determine how to invest security resources. The method for evaluating systems
developed in this research targets a general class of systems that have operations and
cyber-physical system of systems components. The operations component consists of
humans who operate the system and the system of systems component is the hardware
and software parts of the CI. Examples of these types of systems include electrical power
systems that include both electric system control centers and the cyber-physical grid,
aviation systems that include both air traffic control and aircraft, and mass transportation

systems that include transportation command centers and rail transportation, buses and
trolleys. While there are many systems that can be analyzed using the proposed method,
systems that this method would not be suitable for are systems that cannot be analyzed
using a high level architecture. For example, firmware VA, a VA of a circuit or other
subsystems would not be good candidates for using this method. The research performed
can help answer the following sample list of questions about these systems. Note that
other questions could be answered by the method as well and these are only meant to
provide an illustrative set of questions.
• What vulnerabilities do employees introduce based on their skill level at
performing certain tasks?
• How long would it take for an employee with a certain skill level to
damage the system if they became a malicious insider?
• What employees should receive more extensive background checks based
on their level of influence within the organization?
• How should a decision maker invest security resources based on the cost
of the resources and the level of risk associated with the mitigated
vulnerability?
• Does my system meet regulatory requirements and industry
recommendations for security?
• Where do subject matter experts believe that my primary security
investments should be made and what is the optimal selection of those
investments based on my budget?
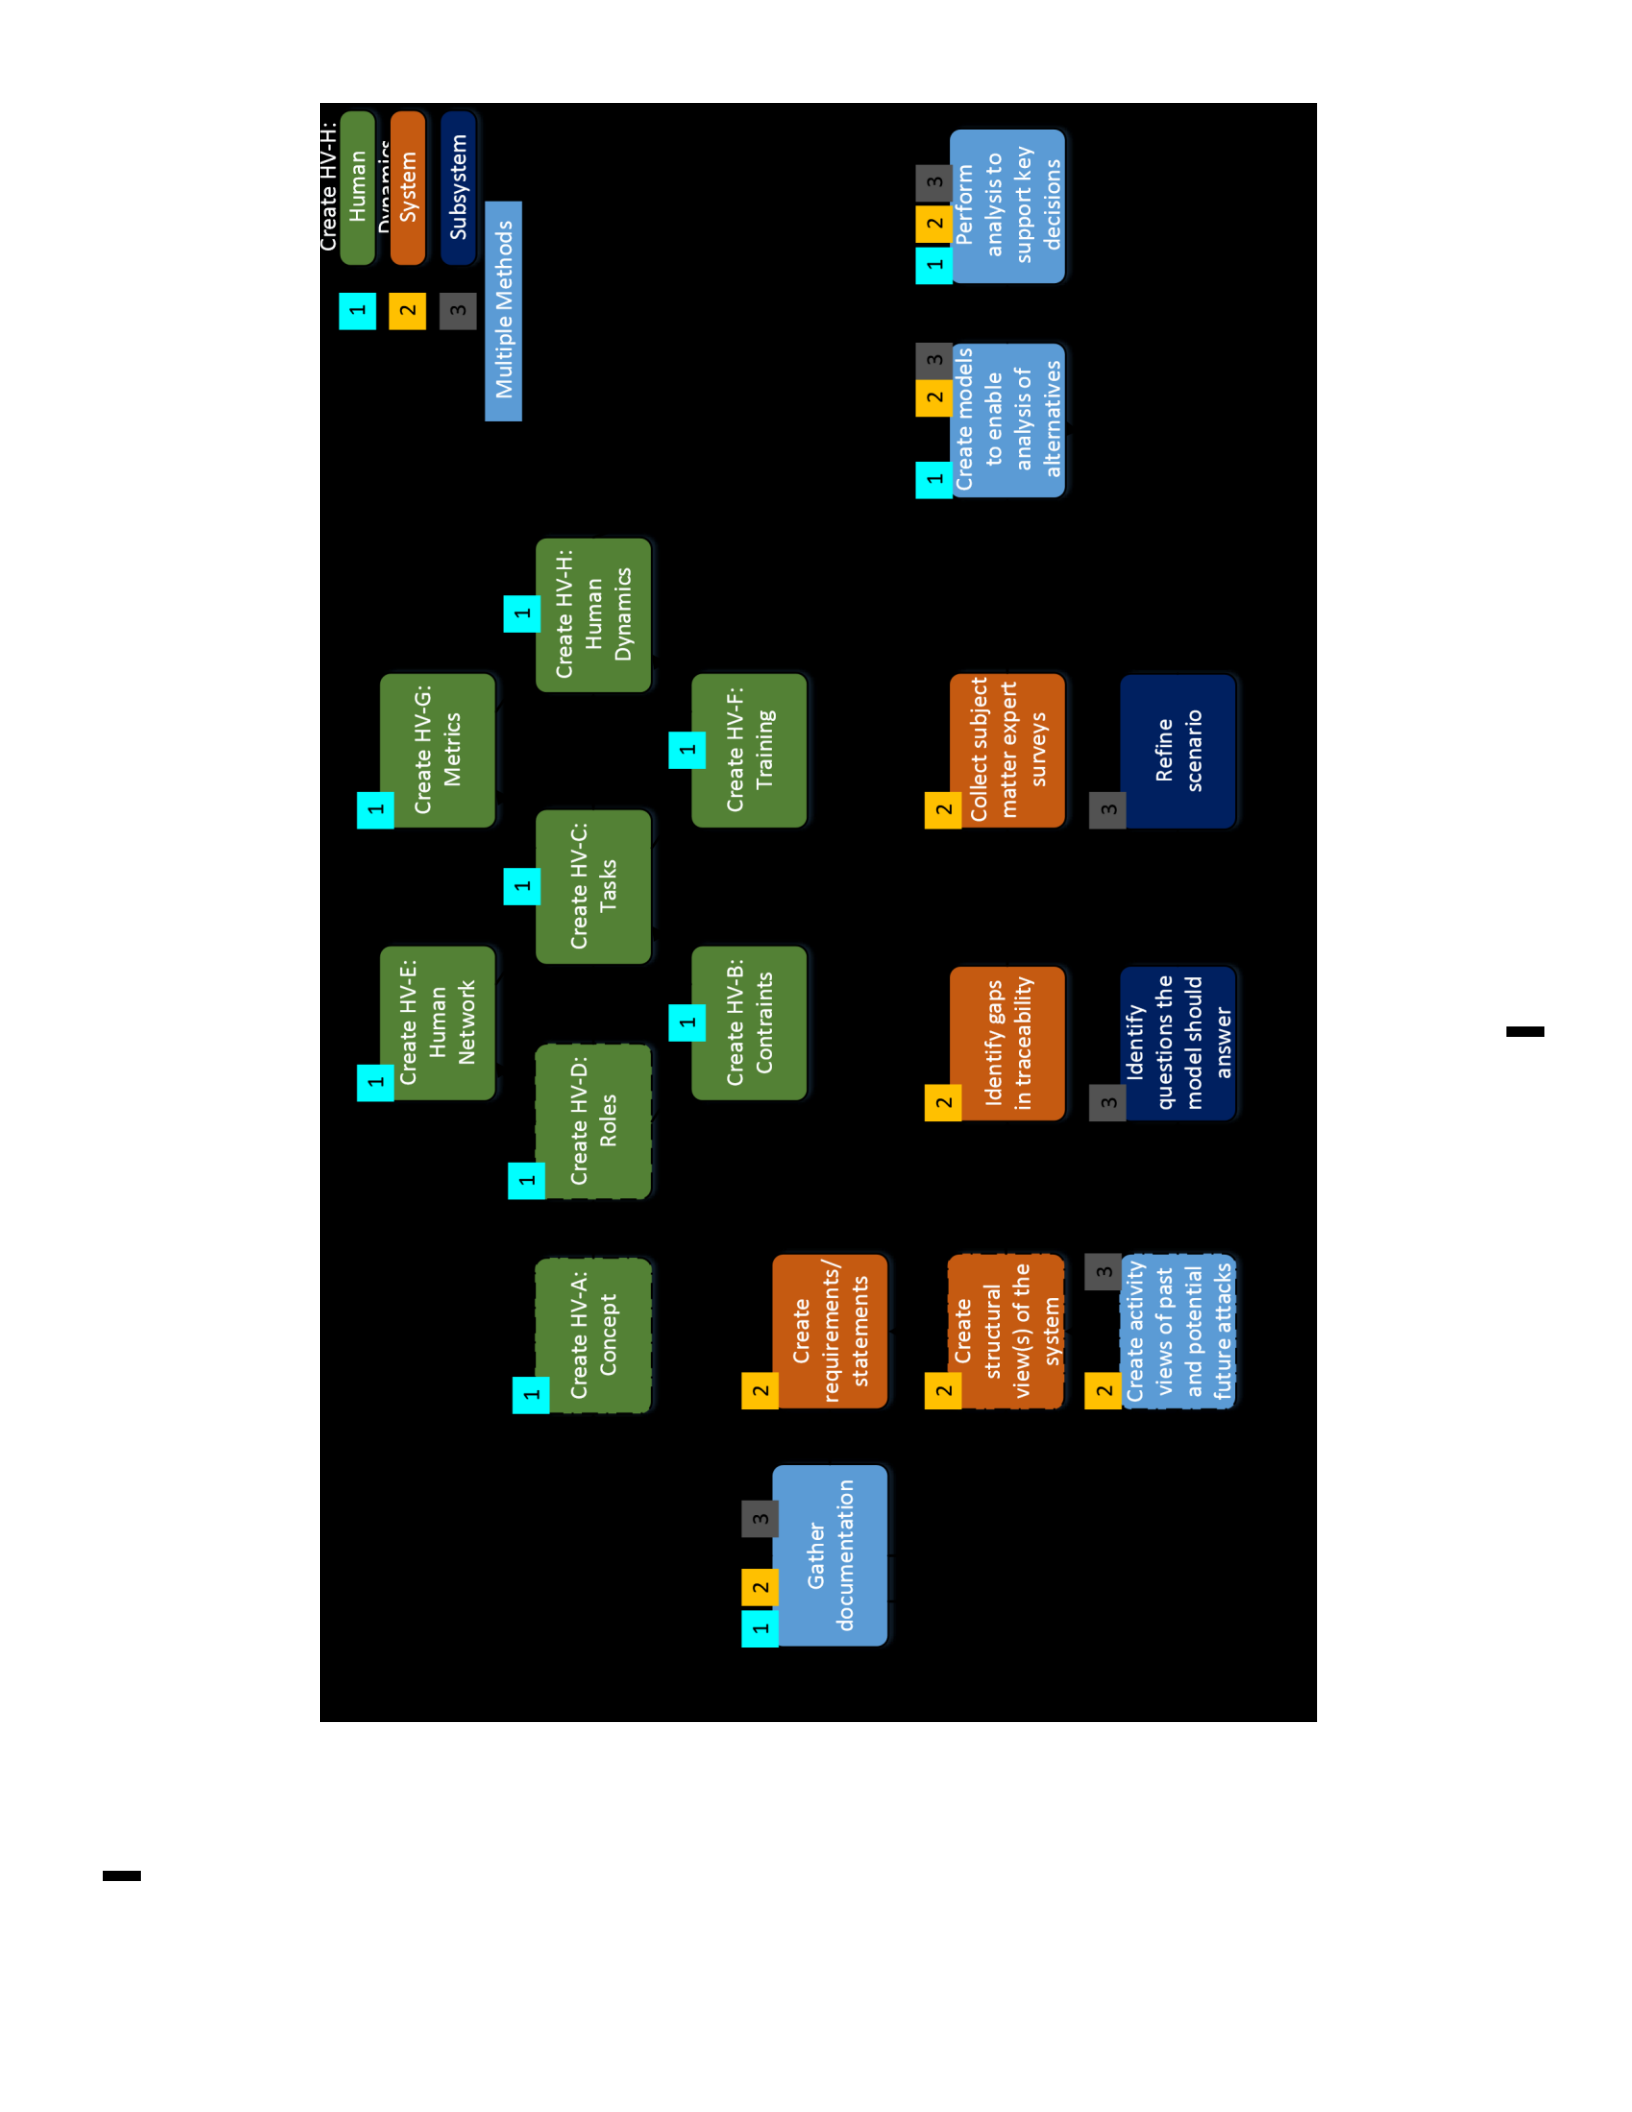
The specific approach for evaluating CI developed in this research is shown in
Figure 1.2. The type of analysis is denoted by numbers on the boxes. The boxes with a 1,
indicating analysis path 1, shows the evaluation of the human view of the CI system.
Within the system view, two paths exist to perform analysis; analysis path 2 is at the
system level and analysis path 3 is at the subsystem level. These path references will be
used throughout the dissertation as a reference for the type of analysis being performed.
The analysis performed in each of these paths will be detailed in Chapter 3 and applied to

an electric power system in Chapter 4, but the general approach for each of these paths
can be applied in multiple domains. The human path can be applied to the operations part
of the system where humans send commands and receive status from the system and the
system and subsystem paths can be applied to the cyber-physical system of systems
component of the system where the core hardware and software components are captured
in the architecture.
EPs
|
ARIEL
ajqeua
07
Et)
Xe
y
le)
Biterprys)
Aa
yoddns
Ce
[VUB
(YB
E
ye]
Pci
xm
e-..
CD
fH
---
Dawe)
ETE]
CIV
BULYop
Cry
el
-100
pet)
(elated)
oJ0)
Va
PSE»
Je)
ee)
Bet
T/T
“AH
232219
Eye
Pinoys
japow
EXO
pmo
Loy
n
tT]
0)
Lar
Aqyiqeaces)
ul
Sole
)o)]
ESTP
Tole)
eR
Le)
fey
DTT
VE)\]
UTA
‘AH
9383815,
sajoy
Bald
yoeoidde
VAIO
7
I
ons
Beier
eral
Jeljuajod
pue
ysed
Jo
smaIA
PAN
1-11-30)
waysAs
SER
OLAILS
TSP
ely
BC
a}e
219
SUL
OLSaLy
/sjuawasinbes
a,b
aD
LeTo]
Bla
LeU
plete)
o}
eT)
Boll
Vlojo)
ee)

In the first component of this research, indicated by path 1 in Figure 1.2, a VA of
the human component of the system will be performed using the NATO Human View to
address the problem of determining what security risks humans introduce to CI and how
to mitigate those risks. While the NATO Human View is used as an example for this
research because the NATO Human View was designed to supplement DoDAF, another
human view framework could be used in the method as long as the views allow the
collection of data to answer the questions needed by the decision maker. This research
develops an analysis approach that allows decision makers to determine where to make
CI investments in training, physical security, cyber security and other areas to mitigate
vulnerabilities that can be exploited by human actors. SNA and TTC analysis will be used
to demonstrate the value of the NATO Human View in CI analysis. The SNA
demonstrates how an architecture can be executed directly for analysis, which is the
executable architecture component of this research. In the case study, the human views
with organizational structures are used to determine key influencers that could be serious
threats if they became malicious insiders. Note that these analysis methods are used to
demonstrate the utility of the approach developed in this research, but other approaches
such as discrete event simulation could also be used depending on the question the
decision maker wants answered.
Whereas in the first component of this research, the human view is evaluated, the
next step is to evaluate the hardware and software of the system. In the second part of this
research, indicated by path 2 in Figure 1.2, a VA of the system architecture is performed
to address the problem of determining vulnerabilities in CI. Once the vulnerabilities are
identified, a model is developed to enable decision makers to answer questions about the
optimal use of security resources. While there are many types of models that can be

developed based on the decision maker interests, in the case study presented in this
research, a model is developed to minimize cost while maintaining a desired level of
security effectiveness against adversaries who would exploit those vulnerabilities. To
accomplish this analysis, the general approach presented develops a comprehensive
model based approach that allows architects to link regulatory requirements, subject
matter expert opinion, system architecture, and attack vectors to an model that allows
decision makers to determine alternatives to securing their systems. The DoDAF is used
for the architecture framework and an ILP is used for the analysis, but these are used as
examples of approaches that can be used and can be replaced with other frameworks and
analysis methods as needed to answer the decision maker’s questions.
In the third component of this research, indicated by subsystem analysis path 3 in
Figure 1.2, the past and future attack scenarios developed are used to develop a detailed
mathematical model. This provides an alternative to the approach developed in the system
path that does not require subject matter expert opinion surveys. In addition, the
subsystem path allows attack scenarios to be used to develop detailed models at the
subsystem level that aid decision makers and engineers in determining where to invest
security resources during the design and development of CI systems.
Overall, the result of using each of these paths to analyze a system results in a VA
of the system at the architecture level that allows decision makers to understand the
security investments that need to be made based on their budget to mitigate
vulnerabilities. The NATO Human View and DoDAF are used in this research because
the NATO Human View was designed to augment the DoDAF views [NATO, 2010], but
other human and system views or architecture frameworks could be used to accomplish
the VA goals. To demonstrate the general method that could be applied to CI systems with
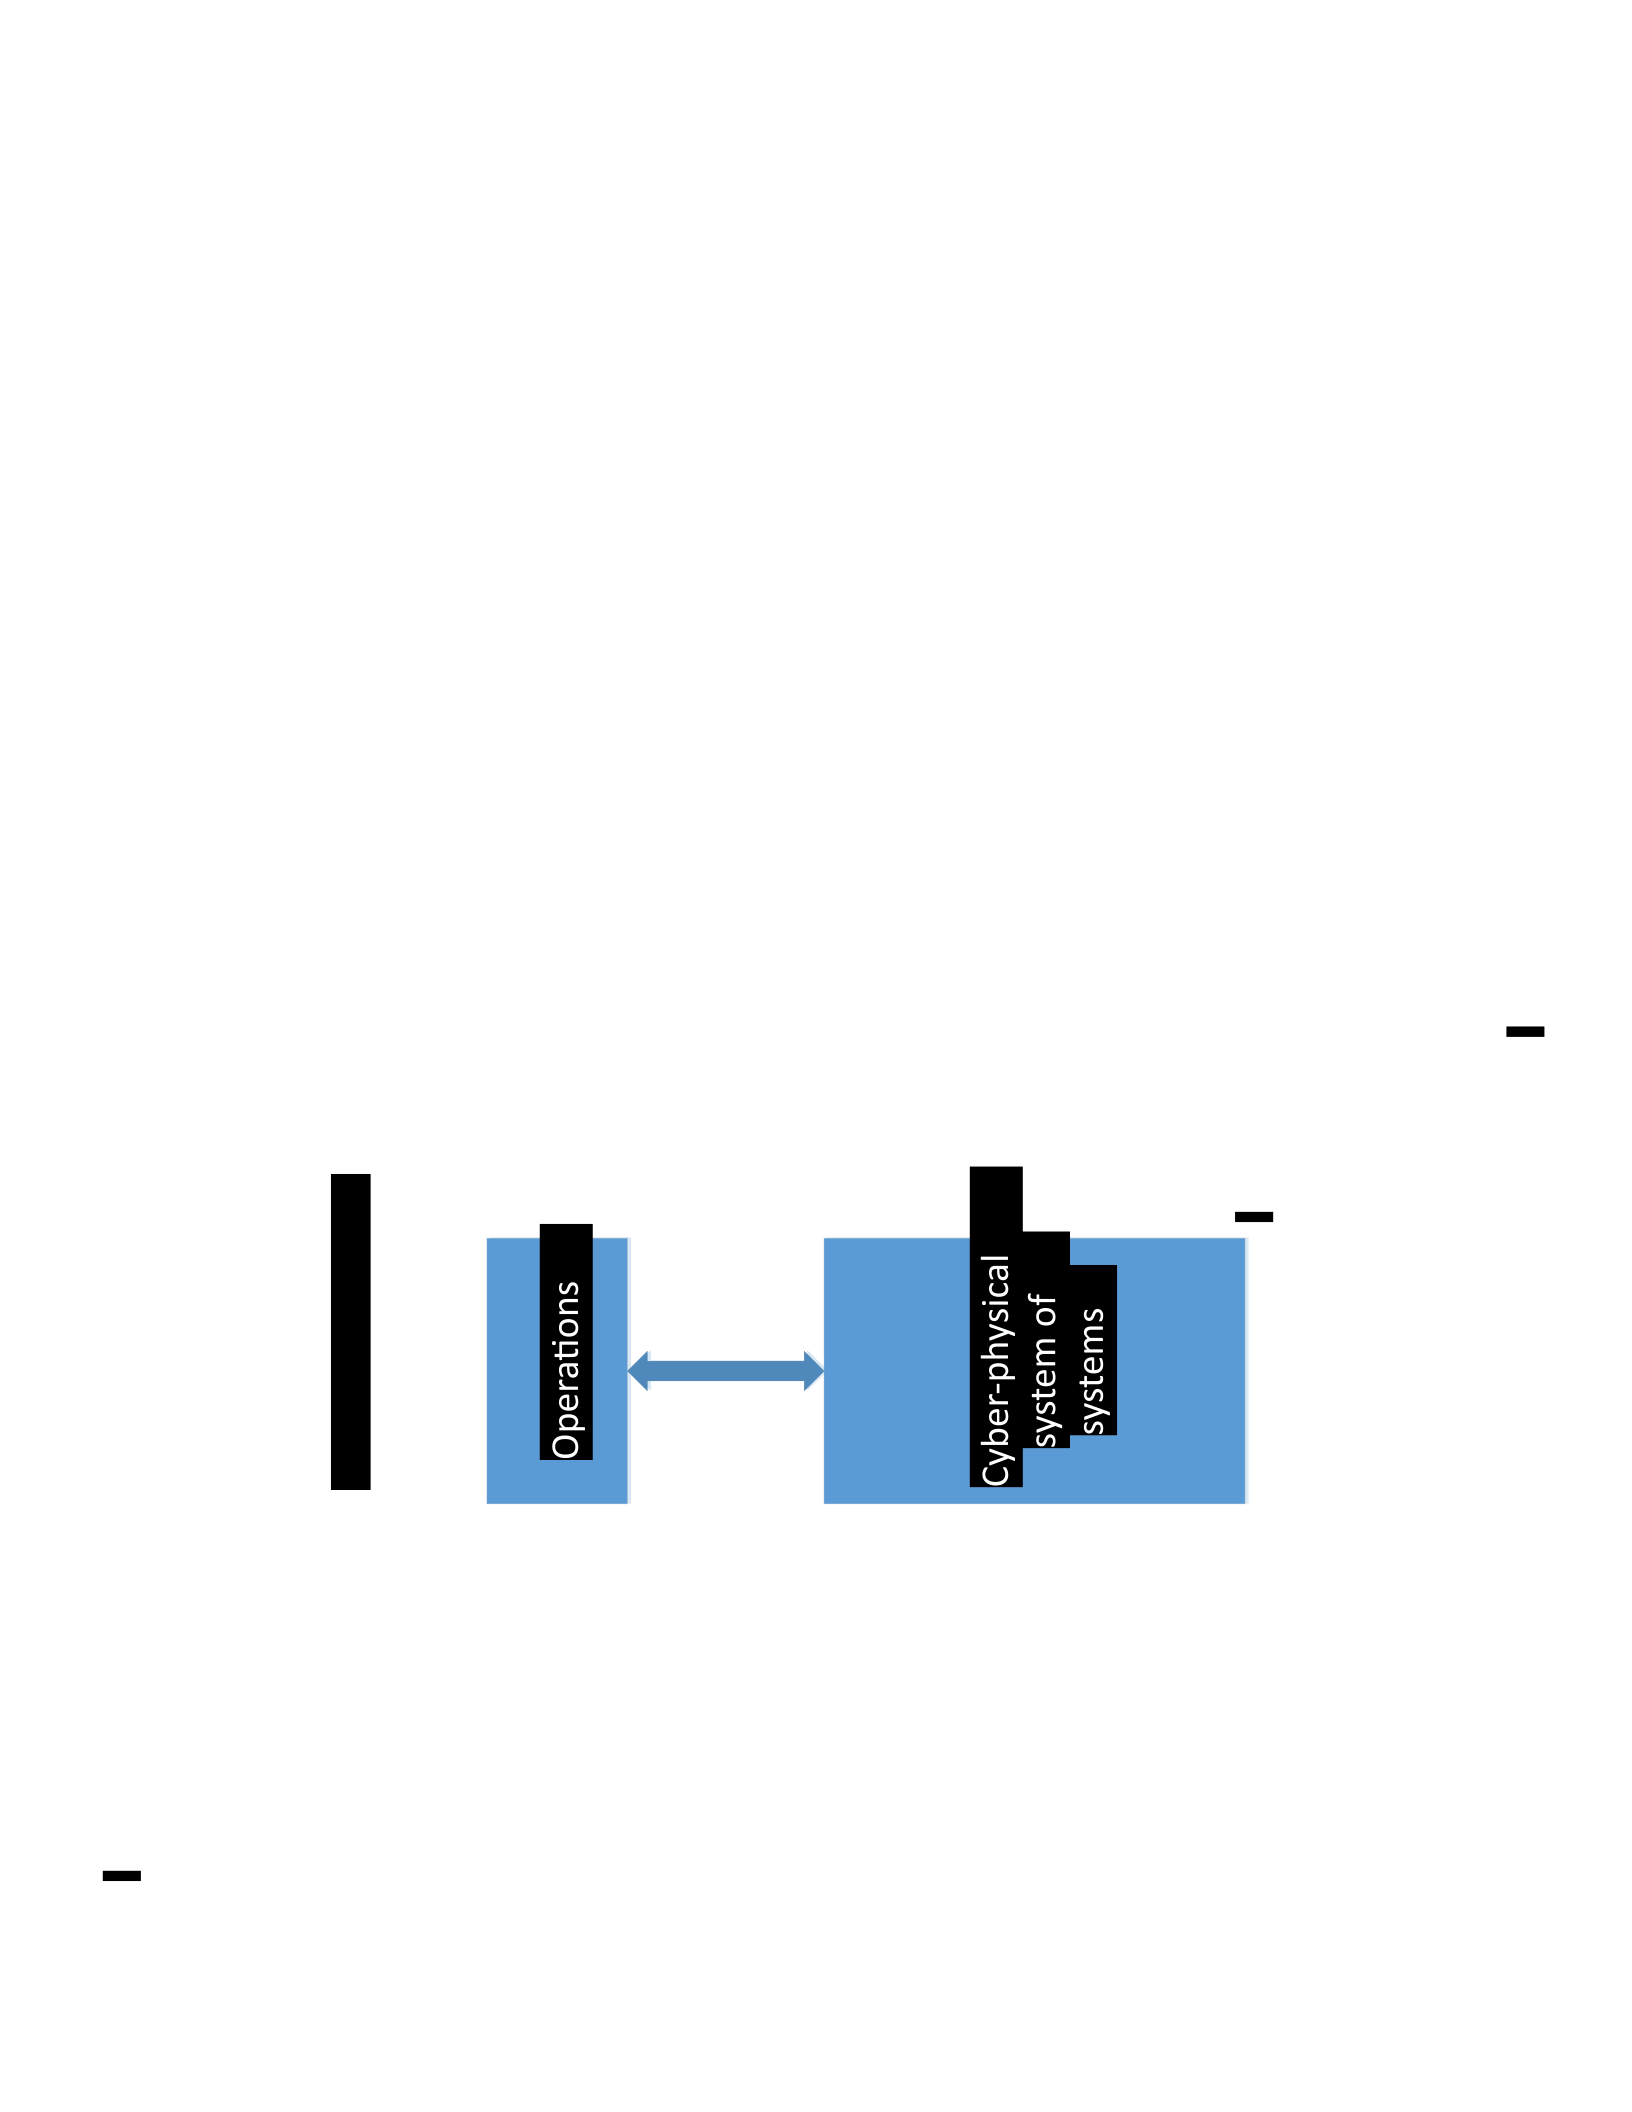
operations and cyber-physical system of system components as previously described, an
illustrative case study of a VA of an electric power system will demonstrate how the
method can be used.
1.1.3 Illustrative case study: Electric power system VA
The case study that is used to illustrate the method developed will be an electric
power system. The electric power system was selected because it not only has operations
and cyber-physical components, but as discussed in earlier in the introduction, is a key
component of our everyday lives. Figure 1.3 shows how the power system maps to the
generic system that this method targets. The human architecture will be used to analyze
the operations component of the system which is the electrical power operations center
denoted by a one in Figure 1.3. The system architecture will be used to analyze the
cyberphysical system of systems portion of the system, which is shown as the electrical
substations (dotted purple) and the wireless video surveillance subsystem.
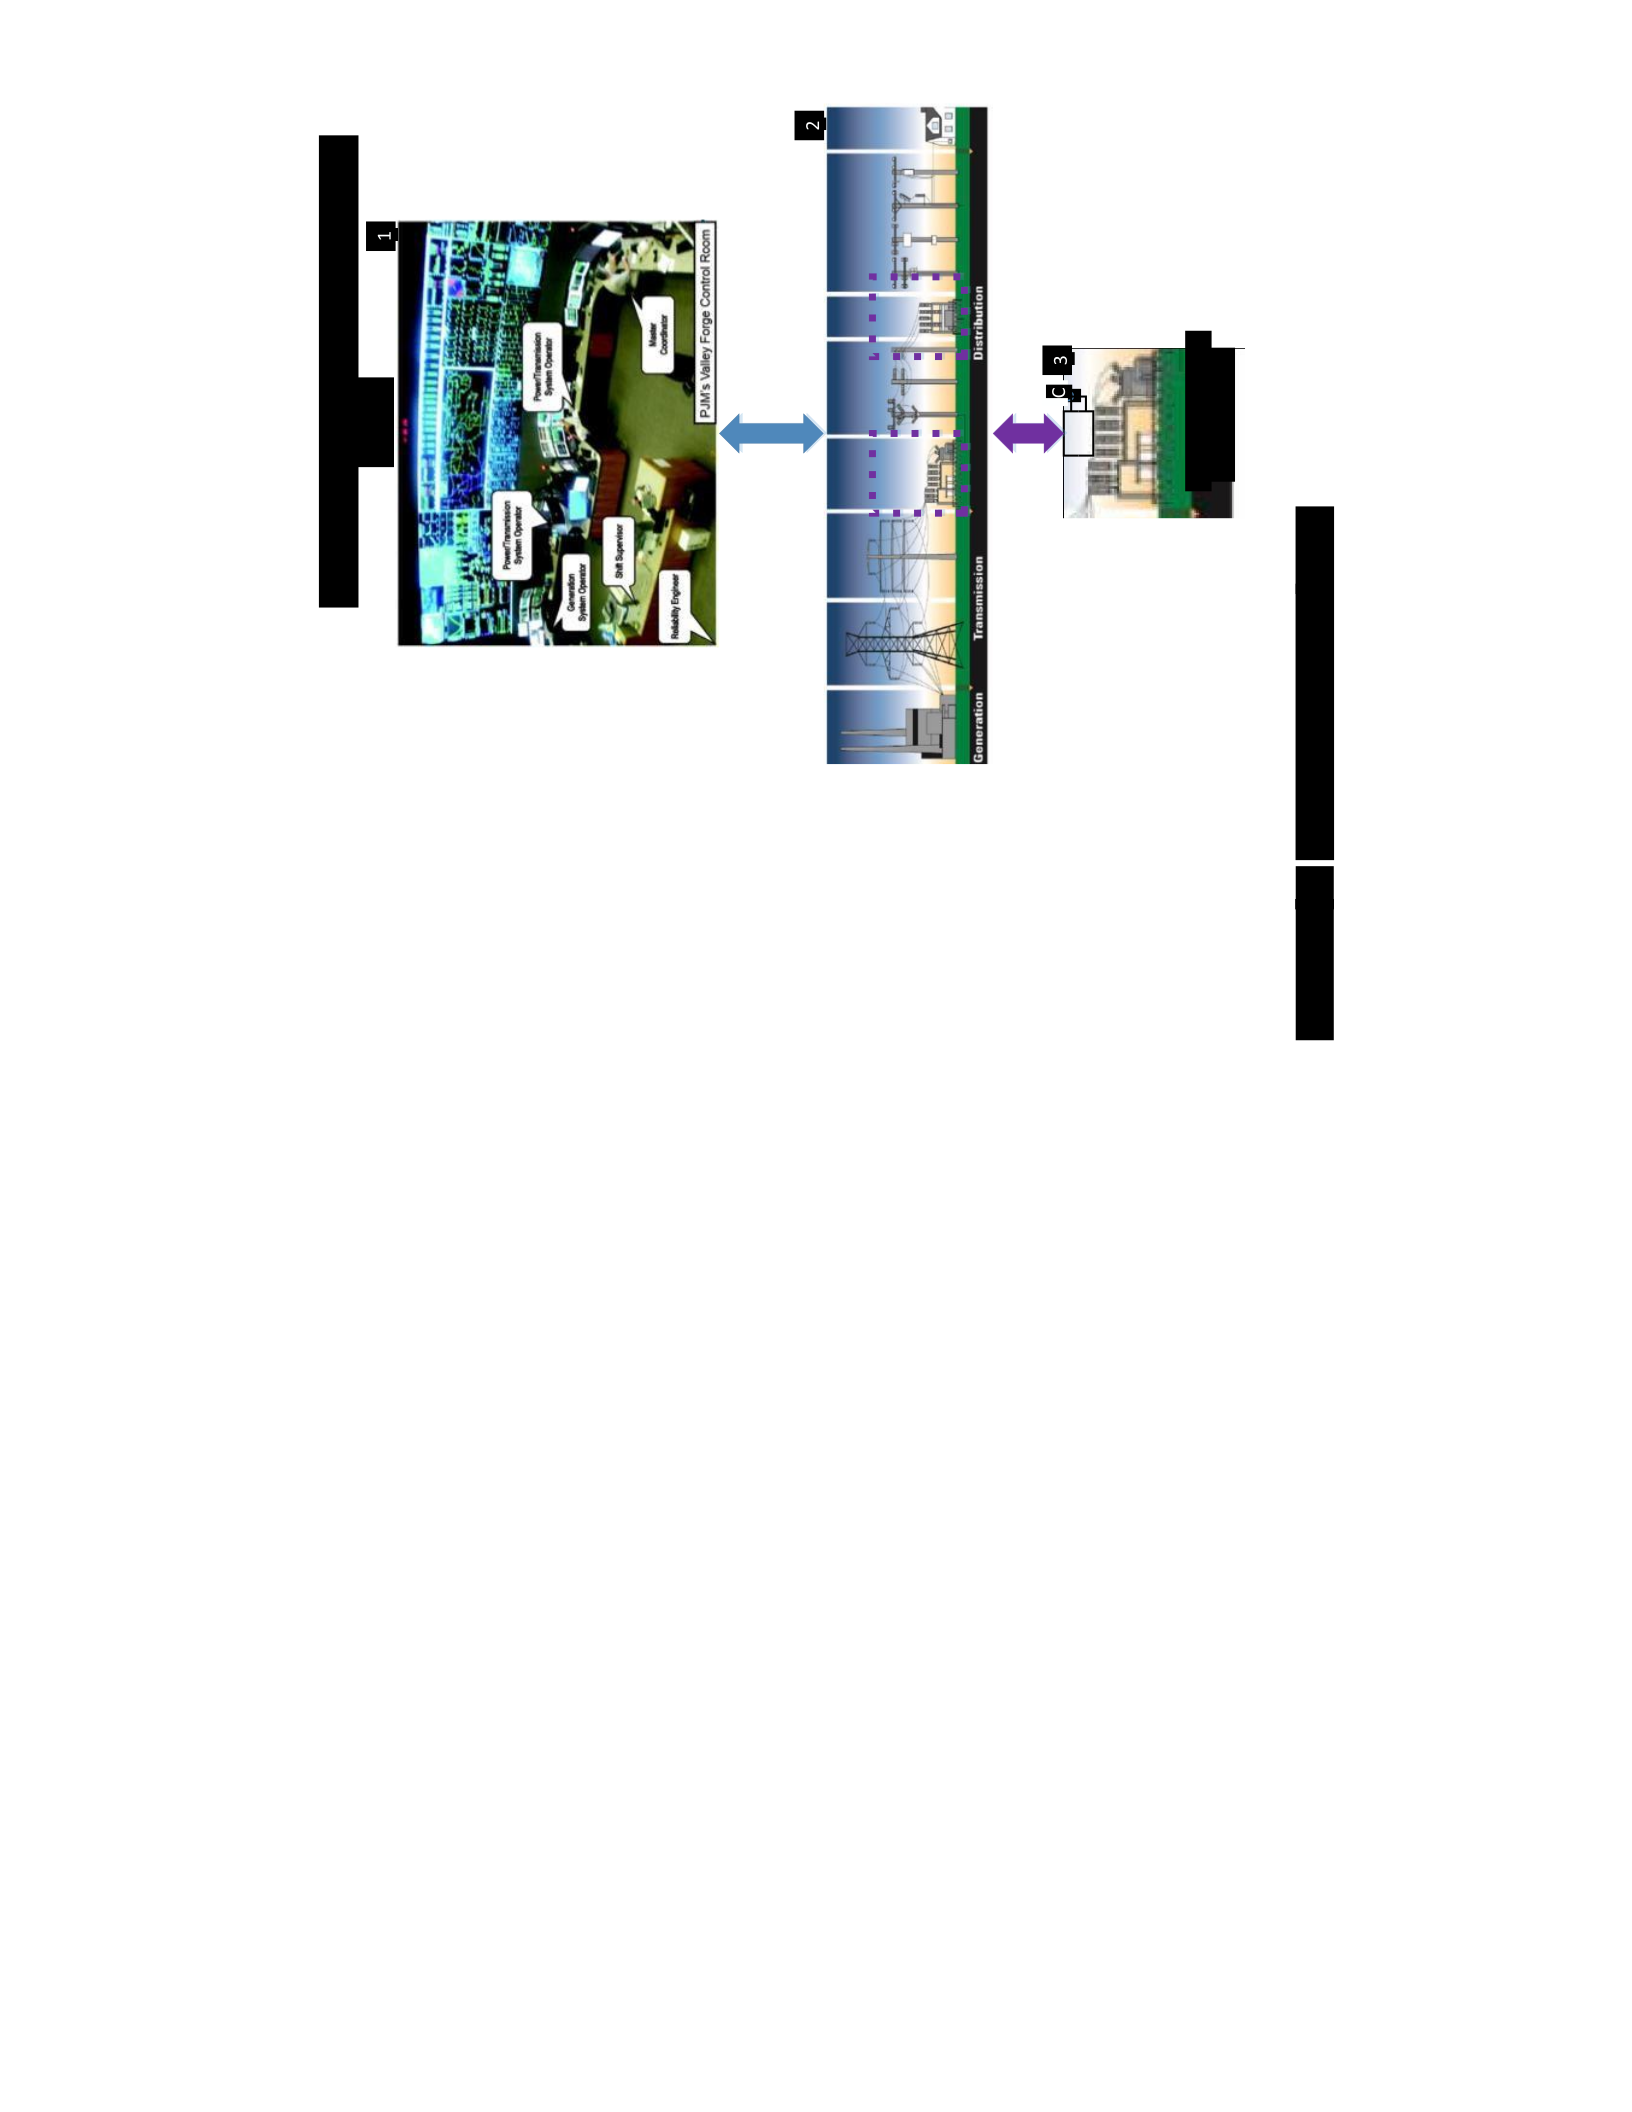
The labels on each part of the electrical power system in Figure 1.3 indicate the
path that the analysis corresponds to in Figure 1.2. For example, the operation center
figure is labeled with a one and will be analyzed using path 1 in Figure 1.2. Once the case
study analysis is complete, it demonstrates how the method developed in this research can
be used for an analysis of a real system.
The remainder of the dissertation is organized as follows. Chapter 2 presents a
literature review of the work that has been done and how this work fills gaps in current
research. Chapter 3 presents the details of the methodology for evaluating CI as shown in
Figure 1.2. Chapter 4 presents the use of the CI VA approach to evaluate an electric
power system. Finally, Chapter 5 contains the conclusions of the research and potential
areas for future work.

LITERATURE REVIEW
2.1 Introduction
This literature review explores the following major topics of this research:
Security analysis of human architecture, security analysis of system architecture, optimal
placement of jammers in ad hoc wireless networks, and the integration of DoDAF and
OR. Human architectures, represented by the NATO Human view are used to evaluate the
operations side of CI. System Architectures, represented by the DoDAF are integrated
with OR to evaluate the system of systems side of CI. Lastly, since an optimal jammer
placement model is extended as part the illustrative case study, the gap in literature to
support that extension is included here. All of these areas are reviewed to understand the
current literature, where the gaps are and how this research fills those gaps.
2.2 Security analysis of human architecture
Although a review of scholarly literature reveals little discussion of human roles
in the context of CI systems’ security, there exists a wide variety of information related to
the analysis of human beings in systems in general. Human architectures and
humansystem integration, as discussed in other literature, have proven useful when
applied in various contexts outside of the security domain.
In 2008, the NATO Research and Technology Panel on Human Factors and
Medicine Human View workshop convened to develop an architectural view that
captures the human aspects of a system [Handley and Smillie]. While there were many
efforts in other architecture frameworks such as the DoDAF and the Ministry of Defence
Architecture Framework (MoDAF), there was a need to develop a standard approach to
represent the human view of a system [Handley and Smillie, 2008]. The NATO Human
View products that were developed provide the following: a link from the engineering to
the human factors community, a way to integrate human system integration early into the
systems engineering processes, and an approach for the coordination of task analysis by
systems engineering and human factors teams [Handley and Smillie, 2008]. The purpose
of the NATO Human View is to “define the role of the human in the system and to
capture the human operator activities, tasks, communications and collaborations required
to accomplish mission operations and support operational requirements” [Handley and
Smillie, 2008]. The Human View products are as follows in Table 2.1. While the views
are used for comprehensive general human behavior analysis, they do not include a
method to perform VA, which is critical for the threat employees and employers face in
the workplace today.
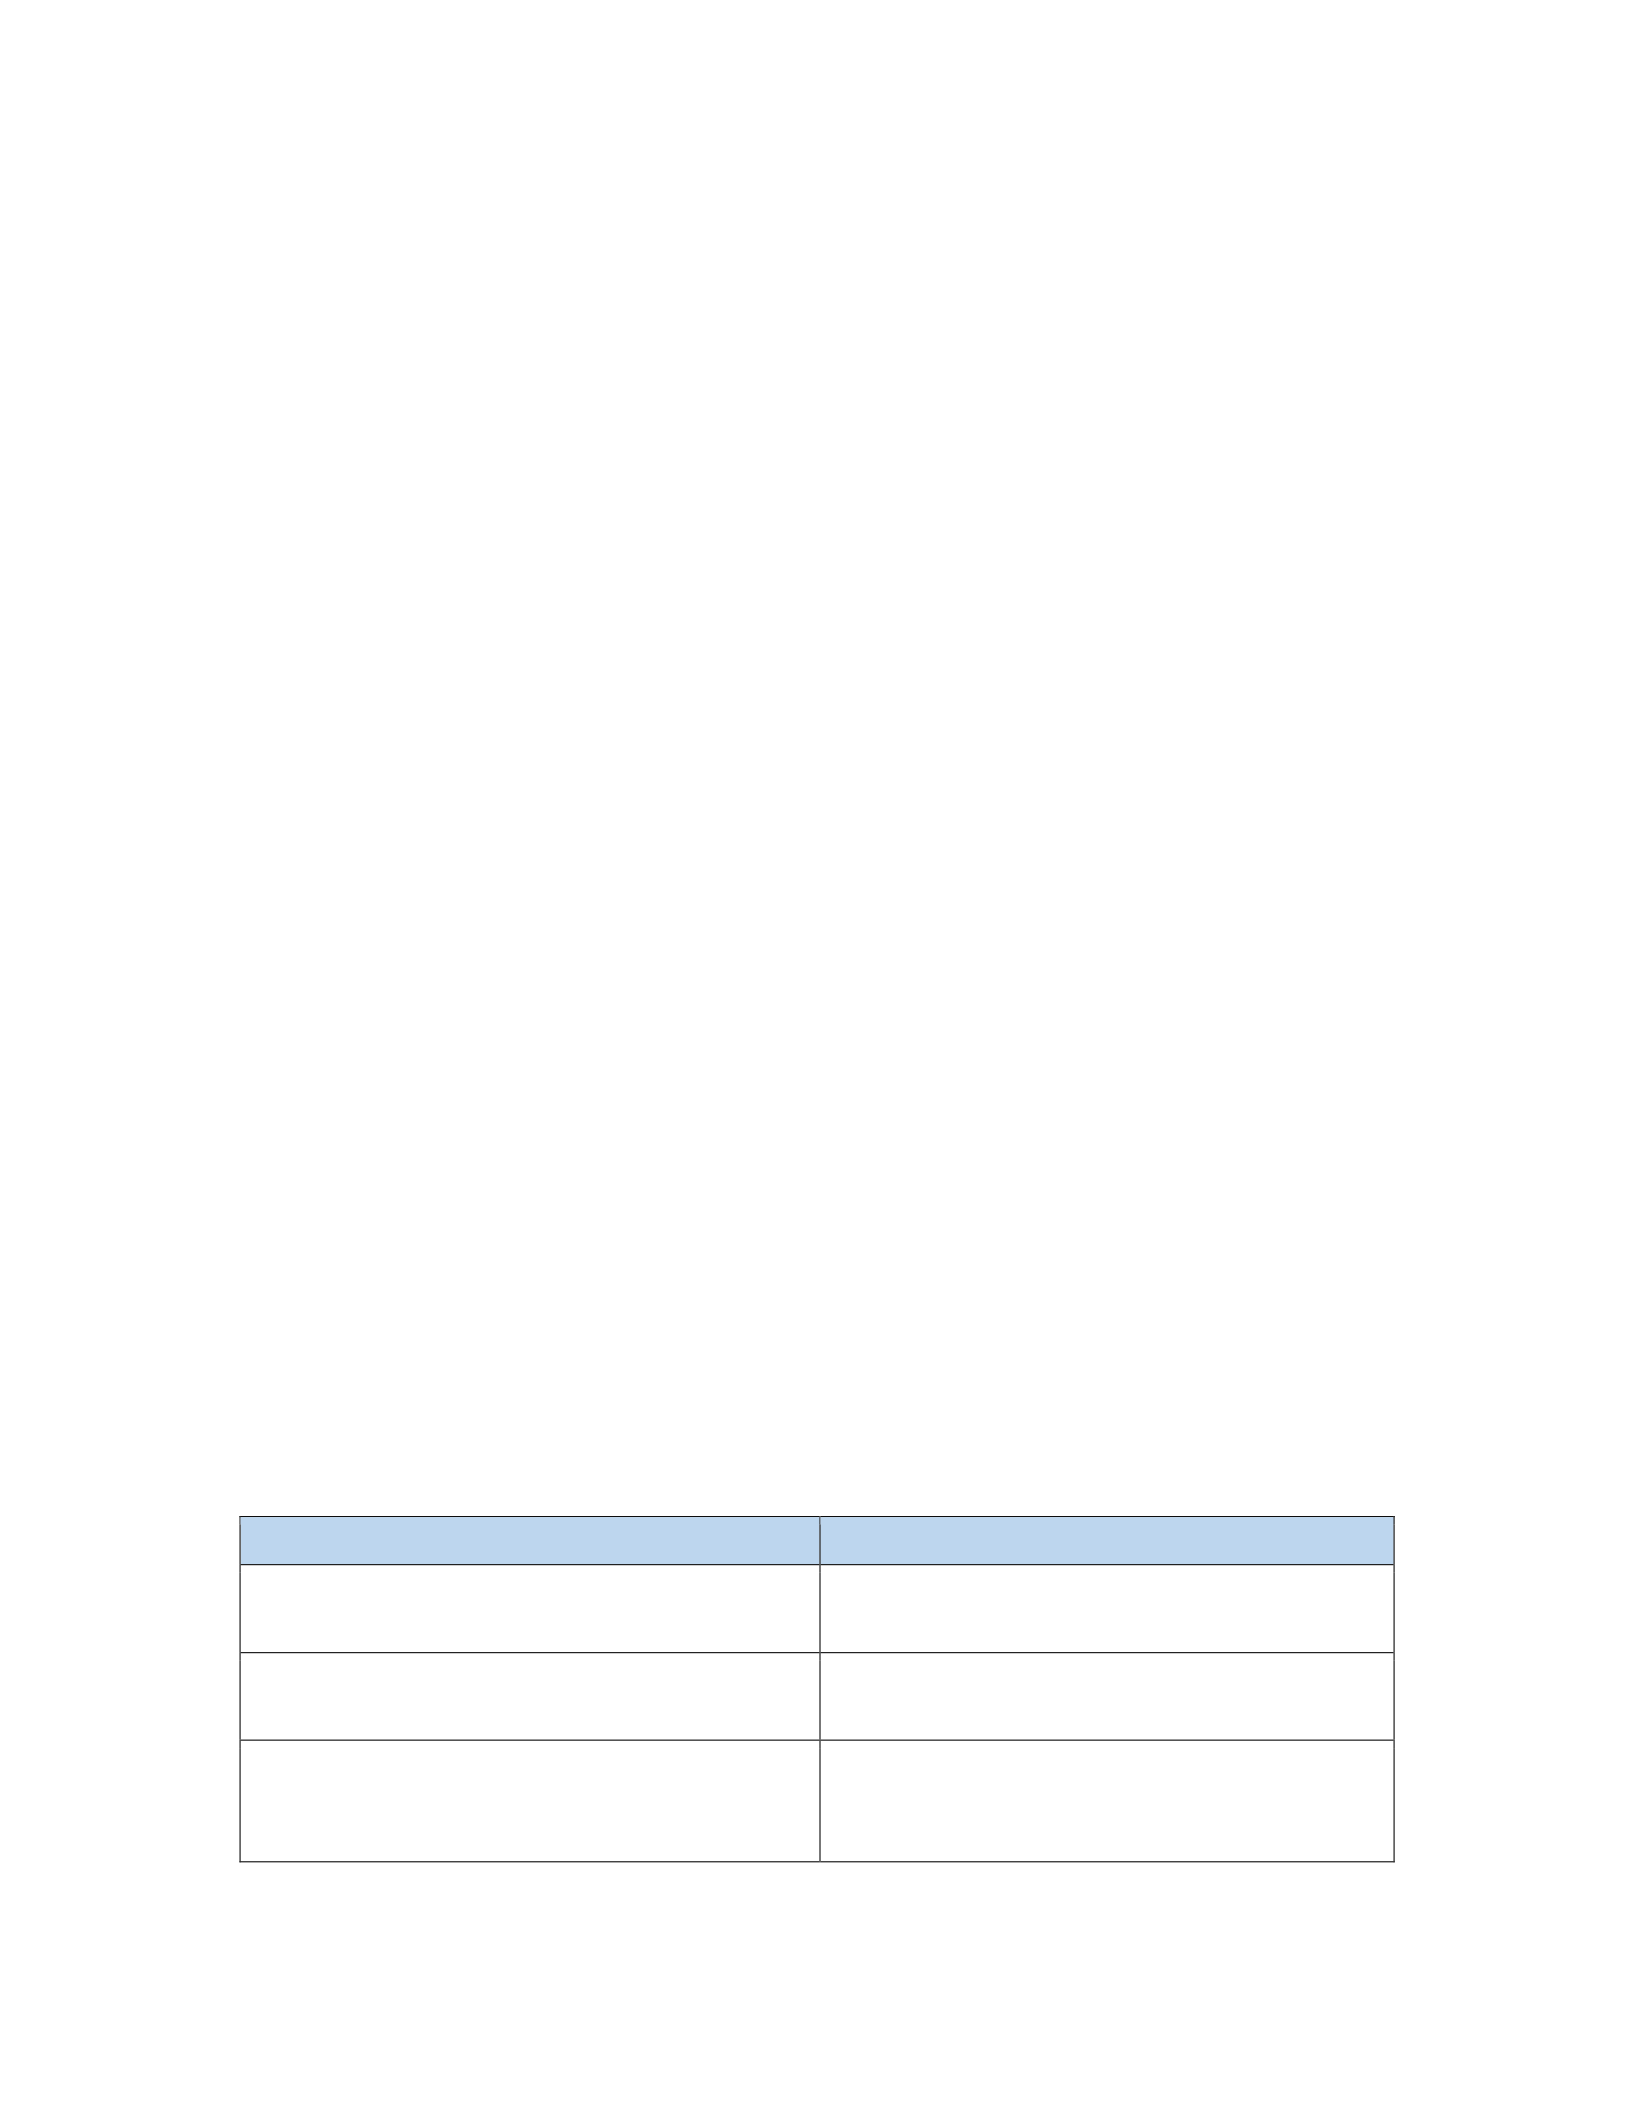
Table 2.1 NATO Human View products [Handley and Smillie, 2008]
View
Description
HV-A Concept
A high level representation of the human
component of the system
HV-B Human Factors Constraint
Operator capabilities and limitations under
various conditions
HV-C Task Decomposition and
Interdependencies
Generation of the network diagram
composed of tasks and subtasks;
Assignment of system interfaces to tasks

HV-D Roles
List of roles and assigned task
responsibilities
HV-E Human Network
Role groupings or teams formed;
interaction types between roles and teams
HV-F Training
Training required to obtain the necessary
knowledge, skills and abilities to perform
assigned tasks.
HV-G Metrics
Performance parameters and standards
HV-H Human Dynamics
Uses information from the other human
views to provide the basis for developing
executable models
As a follow-on to Handley and Smillie’s [2008] work, the NATO Human View
coupled with the U.S. Army Research Laboratory Improved Performance Research
Integration Tool (IMPRINT) was used to create a simulation model and capture task
performance results that ultimately can show the impact of high workload, poor training,
and inadequate communications on system performance [Handley and Smillie, 2008].
Colombi et al. [2012] continued the use of IMPRINT by using the MoDAF
Handbook of Human Views to represent remotely piloted aircraft operations. The
operations were simulated using the professional version of IMPRINT (IMPRINT PRO)
to evaluate the mental workload of operators. The model proved successful in providing
insight into mental workload of the operator during system operation. In another use of
IMPRINT for human analysis, Goodman et al. [2015] used SysML activity diagrams and
IMPRINT to determine how human workload is impacted by reliance on automation. The
researchers used SysML to provide the basis for task networks within IMPRINT showing
that re-allocating tasks from humans to machines results in additional tasks for which
workload modeling must account so as to be truly accurate. Although this research shows
that human architectures can be executable, no previous research accounts for the
vulnerabilities humans introduce into the system and how to evaluate those vulnerabilities.

In addition to using IMPRINT to execute human architectures of the system,
researchers have recognized the need for system views that represent human-system
integration points and proposed methods to create executable architectures from these
views of the system. Bodenhamer [2012] used the case study of a handheld mine detector
to demonstrate that not including the system architecture with human system integration
elements in place can result in missed requirements which will negatively impact system
performance. Bodenhamer [2012] also proposed using genetic algorithms to optimize the
Manpower, Personnel, Training, Safety, Health Hazards, Human Factors and
Survivability factors of the overall system architecture. Following this work, Handley and
Knapp [2014] discussed human views being used to evaluate multi-sensor systems
operations. Intelligence crews that support these systems were evaluated based on their
roles, tasks, and work processes. A simulation model was used to demonstrate their
effectiveness.
In summary, while parameters such as mental workload, training, and
communications have been considered in the analysis and simulation of human views of
systems, no work has been done to examine how these views can create architectures that
allow architects and decision makers to evaluate human system integration risks related to
system security vulnerabilities.
2.3 Security analysis of system architecture
In addition to the NATO Human View, the DoDAF is also used to represent CI
systems in the model based systems engineering approach presented in this research. The
ability to execute architecture and use the architecture meta-data for analysis has been
researched in the literature. The DoDAF has been used extensively to develop
architectures for analysis and its relationship to MSBE has been studied [Piaszczyk,

2011]. Research has been conducted in the area of DoDAF executable architectures
[Griendling et al., 2008; Griendling and Mavris, 2011; Mittal, 2006], which provide links
from DoDAF architectures to various simulation and modeling tools.
Griendling and Mavris [2011] use DoDAF to create Markov chains, petri nets,
systems dynamics models and mathematical graphs. The use of a stochastic petri net to
implement discrete event simulation is also discussed. Other literature has proposed using
colored petri nets [AbuSharekh et al., 2007; Wagenhals and Levis, 2009], hierarchical
colored petri nets [Griendling and Mavris, 2011], and SysML colored petri net
transformation [Wang and Dagli, 2008] for characterization and execution of DoDAF
products. Griendling et al. [2008] also used a modeling process that selects the DoDAF
architecture that best meets mission needs by using agent-based modeling and simulation,
artificial neural networks and optimization and decision support.
Mittal [2006] proposes to add two new Operational Views to DoDAF, version 1.0
in order to model and simulate DoDAF architectures within a development environment
based on Discrete Event System Specification (DEVS). Xia et al. [2013] propose using
Simulink models to evaluate a command, control, communications, computers,
intelligence, surveillance and reconnaissance architecture. Recently, researchers have
proposed using the DoDAF DM2 data model for creating executable architectures [Ge et
al., “Novel” 2013; “Data-centric” 2013]. The DoDAF DM2 is a push towards a more
data-centric approach to the analysis. While the research discussed provides various ways
to create executable architectures, the methods do not provide a way to link resources
identified in system architectures to an OR model for determining the best use of those
scarce resources. This type of analysis is useful to CI asset owners who seek to minimize
cost while providing as much security as possible for their assets.

In addition to the execution of DoDAF products, using DoDAF to aid in the
evaluation of the security level of a system has also been an area of increasing interest
because the inclusion of DoDAF architectures as part of new system developments is
mandated in Department of Defense (DoD) acquisition regulations [Hamilton, 2006].
Hamilton [2006] and O’Farrell et al. [2010] proposed methods to add information
assurance data to DoDAF architectures to support security analysis.
Building on this previous work, Hamilton [2013] later discusses using
architecture-based network simulation for visualization of security requirements and auto
generation of network architecture artifacts. Farroha and Farroha [2011] present several
concepts utilizing DoDAF to achieve a higher level of security in information sharing
systems. The focus is on adding agility and assurance to current enterprise systems
engineering processes. As the volume of research has increased in the representation of
security measures in DoDAF architectures, one of the gaps in this research is a method to
represent past and future attacks that can be used in a model for traceability to the system
architecture to ensure that the system contains the appropriate security resources to
protect or mitigate against attacks. As attacks on CI happen more often, the ability to
identify the lack of traceability will help in VA.
While DoDAF is used to represent the system in this research, the final product is
a complete model that can be used to evaluate the system for vulnerabilities and help
decision makers determine the best use of security resources. This work most closely
builds on the work by Shin et al. [2015] and Kerzhner et al. [2015]. Shin et al. [2015]
developed a reference model for CI protection using SysML. A nuclear power plant
protection system’s operations are analyzed to determine which model would meet
constraints such as accuracy of detection, object recognition, and cost. Models were then

analyzed to see which models met the requirements for protecting the power plant in the
event of an attack. In their approach to developing a reference model, Shin et al. [2015]
do not discuss incorporating subject matter expert opinion in their analysis of protection
schemes and do not consider the mapping of the system being protected to the CI
regulations, policy or requirements. The use of subject matter expert opinion and
mapping to regulations, policy or requirements is one of the contributions of this
research, however. This is important because such requirements, regulations and
recommendations change to accommodate newly identified threats, and asset owners
would want to know if their current system is protected from those threats.
Kerzhner et al. [2015] extend this work by creating a tool for analysis of
cyberphysical systems; the tool includes physical elements, network, topology, software
applications, system functions and usage scenarios [Kerzhner et al., 2015]. To capture
vulnerabilities and possible attacks, an algorithm in the tool works from a starting point to
the attacker goal and outputs if the attacker will be successful and what vulnerabilities
could be exploited [Kerzhner et al., 2015]. The focus of Kerzhner et al. [2015] is analysis
of potential attacks based on an existing system model, but their work does not consider
the analysis of the use of specific security resources based on cost or how the system
meets regulatory requirements and policies. The analysis of the use of security resources
based on cost is demonstrated in this research and would be important to CI asset owners
who need to determine the best use of potentially limited funds to invest in security.
2.3.1 Using an OV-5b to develop an OR model
At the subsystem level, this work covers the intersection of two major areas of
research: systems architecture and wireless network jamming. In the approach developed,
the DoDAF OV-5b Operational activity model is used to represent a future attack

scenario and a decision analysis model is developed based on this scenario. As a case
study, an attack scenario is used to create a wireless network jamming decision analysis
model.
While research has been conducted on executing and implementing security in
DoDAF architectures, there has not been a case study that demonstrates how a DoDAF
OV-5b can be used to develop a detailed OR model. Specifically, in the illustrative case
study, the subject will be a wireless network subject to jamming.
Wireless networks have been researched extensively for use in both civilian and
military applications. For example, with respect to CI, researchers have explored using
wireless sensor networks for substation monitoring and control [Matta et al., 2012], and
they have researched the various design challenges associated with hardening the network
architecture that supports CI to prevent exploits such as traffic analysis and jamming
attacks [Buttyan et al., 2010]. Wireless networks have also been used for structural health
monitoring on the Golden gate bridge [Kim et al., 2007]. In military applications,
wireless networks have been researched for use for communication of tanks in hostile
environments [Halvardsson and Lindberg, 2004], and there has been work performed to
connect independent mobile ad-hoc networks that are used for military tactical operations
both on the ground and in the air [Wang et al., 2015]. The security of these ad hoc
networks using secure routing, key management and intrusion detection has also been
explored [Zhou and Haas, 1999; Zhang and Lee, 2000]. Specifically, some literature has
examined how to respond to jamming attacks [Jiang and Xue, 2009; Ma et al., 2005] and
how to determine the location of a jammer during an attack [Pelechrinis et al., 2009].
While there have been studies on how an attacker allocates their resources [Tague
et al., 2008] and the struggle between operators and attackers [Li et al., 2007], only

Commander et al. [2008], Commander et al. [2007] and Noubir [2004] have examined the
placement of jammers. The jammer location problem is a perfect application for the field
of network interdiction, in which device placement to disrupt a network has been
researched extensively. Wood [1993] introduced interdicting networks to minimize the
maximum flow, Israeli and Wood [2002] maximized the shortest path, and Arulselvan et
al. [2009] minimized the network connectivity. Researchers have continued this work by
studying networks with multiple commodities [Lim and Smith, 2007], time periods
[Malaviya and Sharkey, 2012], changing attacker-defender relationships [Lunday and
Sherali, 2010], as well as random interdiction [Cormican et al., 1998], network topology
[Held and Woodruff, “Decomposition” 2005; “Heuristics” 2005], and attacker attributes
[Morton et al., 2007; Pan and Morton, 2008].
Medal [2016] expanded on previous work that minimized connectivity by
optimally placing jammers [Commander et al., 2008; Commander et al., 2007; Noubir,
2004] by contributing a mixed-integer programming formulation that showed how to
design a network to be secure against jamming attacks and how to place nodes to increase
the interruptions caused by a jamming attack. In Medal’s [2016] work, omnidirectional
antennas were used for the target and the jamming attack nodes. Based on the field test of
an ad hoc network performed by Ramanathan et al. [2005], in which the authors found
that directional antennas offer improved capacity and connectivity improvement in an ad
hoc network, Medal’s [2016] work should be extended to include directional antennas.
This will allow network designers more fidelity when using the model to evaluate key
parameters to make a network robust against jamming attacks. Although the work by Gao
et al. [2007] uses slices to simulate the directional radiation pattern, Ramanathan et al.
[2005] found in their field test that real antenna patterns were more complex than slices
or cone models; therefore, this work will use data that is representative of real radiation

patterns. Finally, the extended model will also consider the energy consumed by the
nodes and how that impacts both the communications and jamming capabilities.
2.3.2 Integration of DoDAF and OR
In the approach developed, DoDAF is used for the structural and behavioral views
of the system, and OR, specifically integer linear programming, is used for the system
analysis. In light of this, it is important to understand the intersection between DoDAF
and OR.
The DoDAF Version 2.0 is used by the DoD to enable DoD managers at all levels
to make decisions more effectively by using this standard of information sharing
[DoDAFBG, 2014]. The focus of DoDAF 2.0 is on architectural “data that can be
collected and organized using commercial tools” [DoDAFBG, 2014]. Because it is data
centric, the content can be “Fit-for-Purpose,” which means the architecture can be
developed to address specific applications to support a specific decision [DoDAFBG,
2014].
OR is a “scientific approach to decision making that seeks to best design and
operate a system, usually under conditions requiring the allocation of scarce resources.
This scientific approach to decision making usually involves the use of one or more
mathematical models” [Winston and Goldberg, 2004]. A mathematical model is a
“mathematical representation of an actual situation that may be used to make better
decisions or simply to understand the actual situation better” [Winston and Goldberg,
2004]. The first formal OR activity occurred during World War II when a team of
scientists in England were called upon to determine the most effective use of limited
military resources [Taha, 1971]. Due to the success of the OR team in World War II, OR
has continued to be used in various military and industrial applications. In the

methodology presented, the scarce resources will be security related – such as lights,
motion sensors, and manned patrols.
Since DoDAF Version 2.0 is data centric and OR is based on building
mathematical models, it follows that OR may be a good fit for analysis of the data
produced from the DoDAF architecture development process. Next, the development
process for DoDAF and OR will be discussed to show how they integrate.
2.3.2.1 DoDAF architecture development process
A summary of the steps in the DoDAF Architecture Development Process is
shown in Table 2.2. These steps are performed by the process owner, architect and
development team. Note that the first step in the process is to determine the intended use
of the architecture. In applying DoDAF to VA, we use the ability to make DoDAF
“Fitfor-Purpose” in assigning the use of the OV-5b to describe attack scenarios and
modifying the development process to fit the analysis needs.

Table 2.2 Summary of DoDAF development process [DoDAF202, 2014]
Step
Number
Name
Description
1
Determine intended use of
architecture
Defines the purpose (“Fit-for-Purpose”) and
intended use of the architecture. It includes
the data needed, the impact of the system on
others, and the process by which the success
of the effort will be measured.
Information typically provided by the
process owner.
2
Determine scope of
architecture
Make sure there is clarity of scope for the
effort defined for the nature of the project
that enables an expected result.
Define and describe the data to be used in
the proposed architectural description in
advance of the creation of view(s) that
present desired data in a format useful to
managers.
3
Determine data required to
support architecture
development
The level of detail of data required is
determined by the scope established in step
2. This data could be data previously
collected or new data.
This step is completed in conjunction with
step 4. Organized data collection and
architecture development iterate over these
two steps.
4
Collect, organize, correlate
and store architecture data
Architects typically collect and organize
data in the best way to present it to decision
makers. Architecture data should be stored
in a recognized commercial or government
architecture tool.
5
Conduct analyses in support
of architecture objectives
Validates that the architecture meets the
requirements established by the process
owner.

6
Document results in
accordance with decision
maker needs
Transform architectural data into
presentations that meet the decision maker
needs.
2.3.2.2 Operations research seven step model building process
The next step is to understand the OR model development process as shown in
Table 2.3. As the problem is formulated there is an iterative relationship with the
architecture and this problem formulation. As the architecture develops and more
information is gathered, the problem formulation and the fidelity of the mathematical
model can increase to more closely match the question that a decision maker would like
to answer.
Table 2.3 Summary of OR model building process [DoDAF202, 2014]
Step
Number
Name
Description
1
Formulate the problem
Define the organization’s problem. This
includes specifying the organization’s
objectives and the parts of the organization
that must be studied before the problem is
solved.
2
Observe the system
Collect data to estimate the parameter values
that affect the organizations problem.
3
Formulate a mathematical
model of the problem
Develop a mathematical model of the
problem (e.g., linear program).
4
Verify the model and use the
model for prediction
Is the mathematical model developed an
accurate representation of reality?
5
Select a suitable alternative
Based on the model and set of alternatives,
the best alternative is selected.
6
Present the results and
conclusion of the study to the
organization
Present the model and recommendations to
the decision making individual or group.
7
Implement and evaluate
recommendations
The recommendations are implemented and
the system is monitored to ensure the
organization meets its objectives.
2.3.2.3 Mapping OR model to DoDAF model
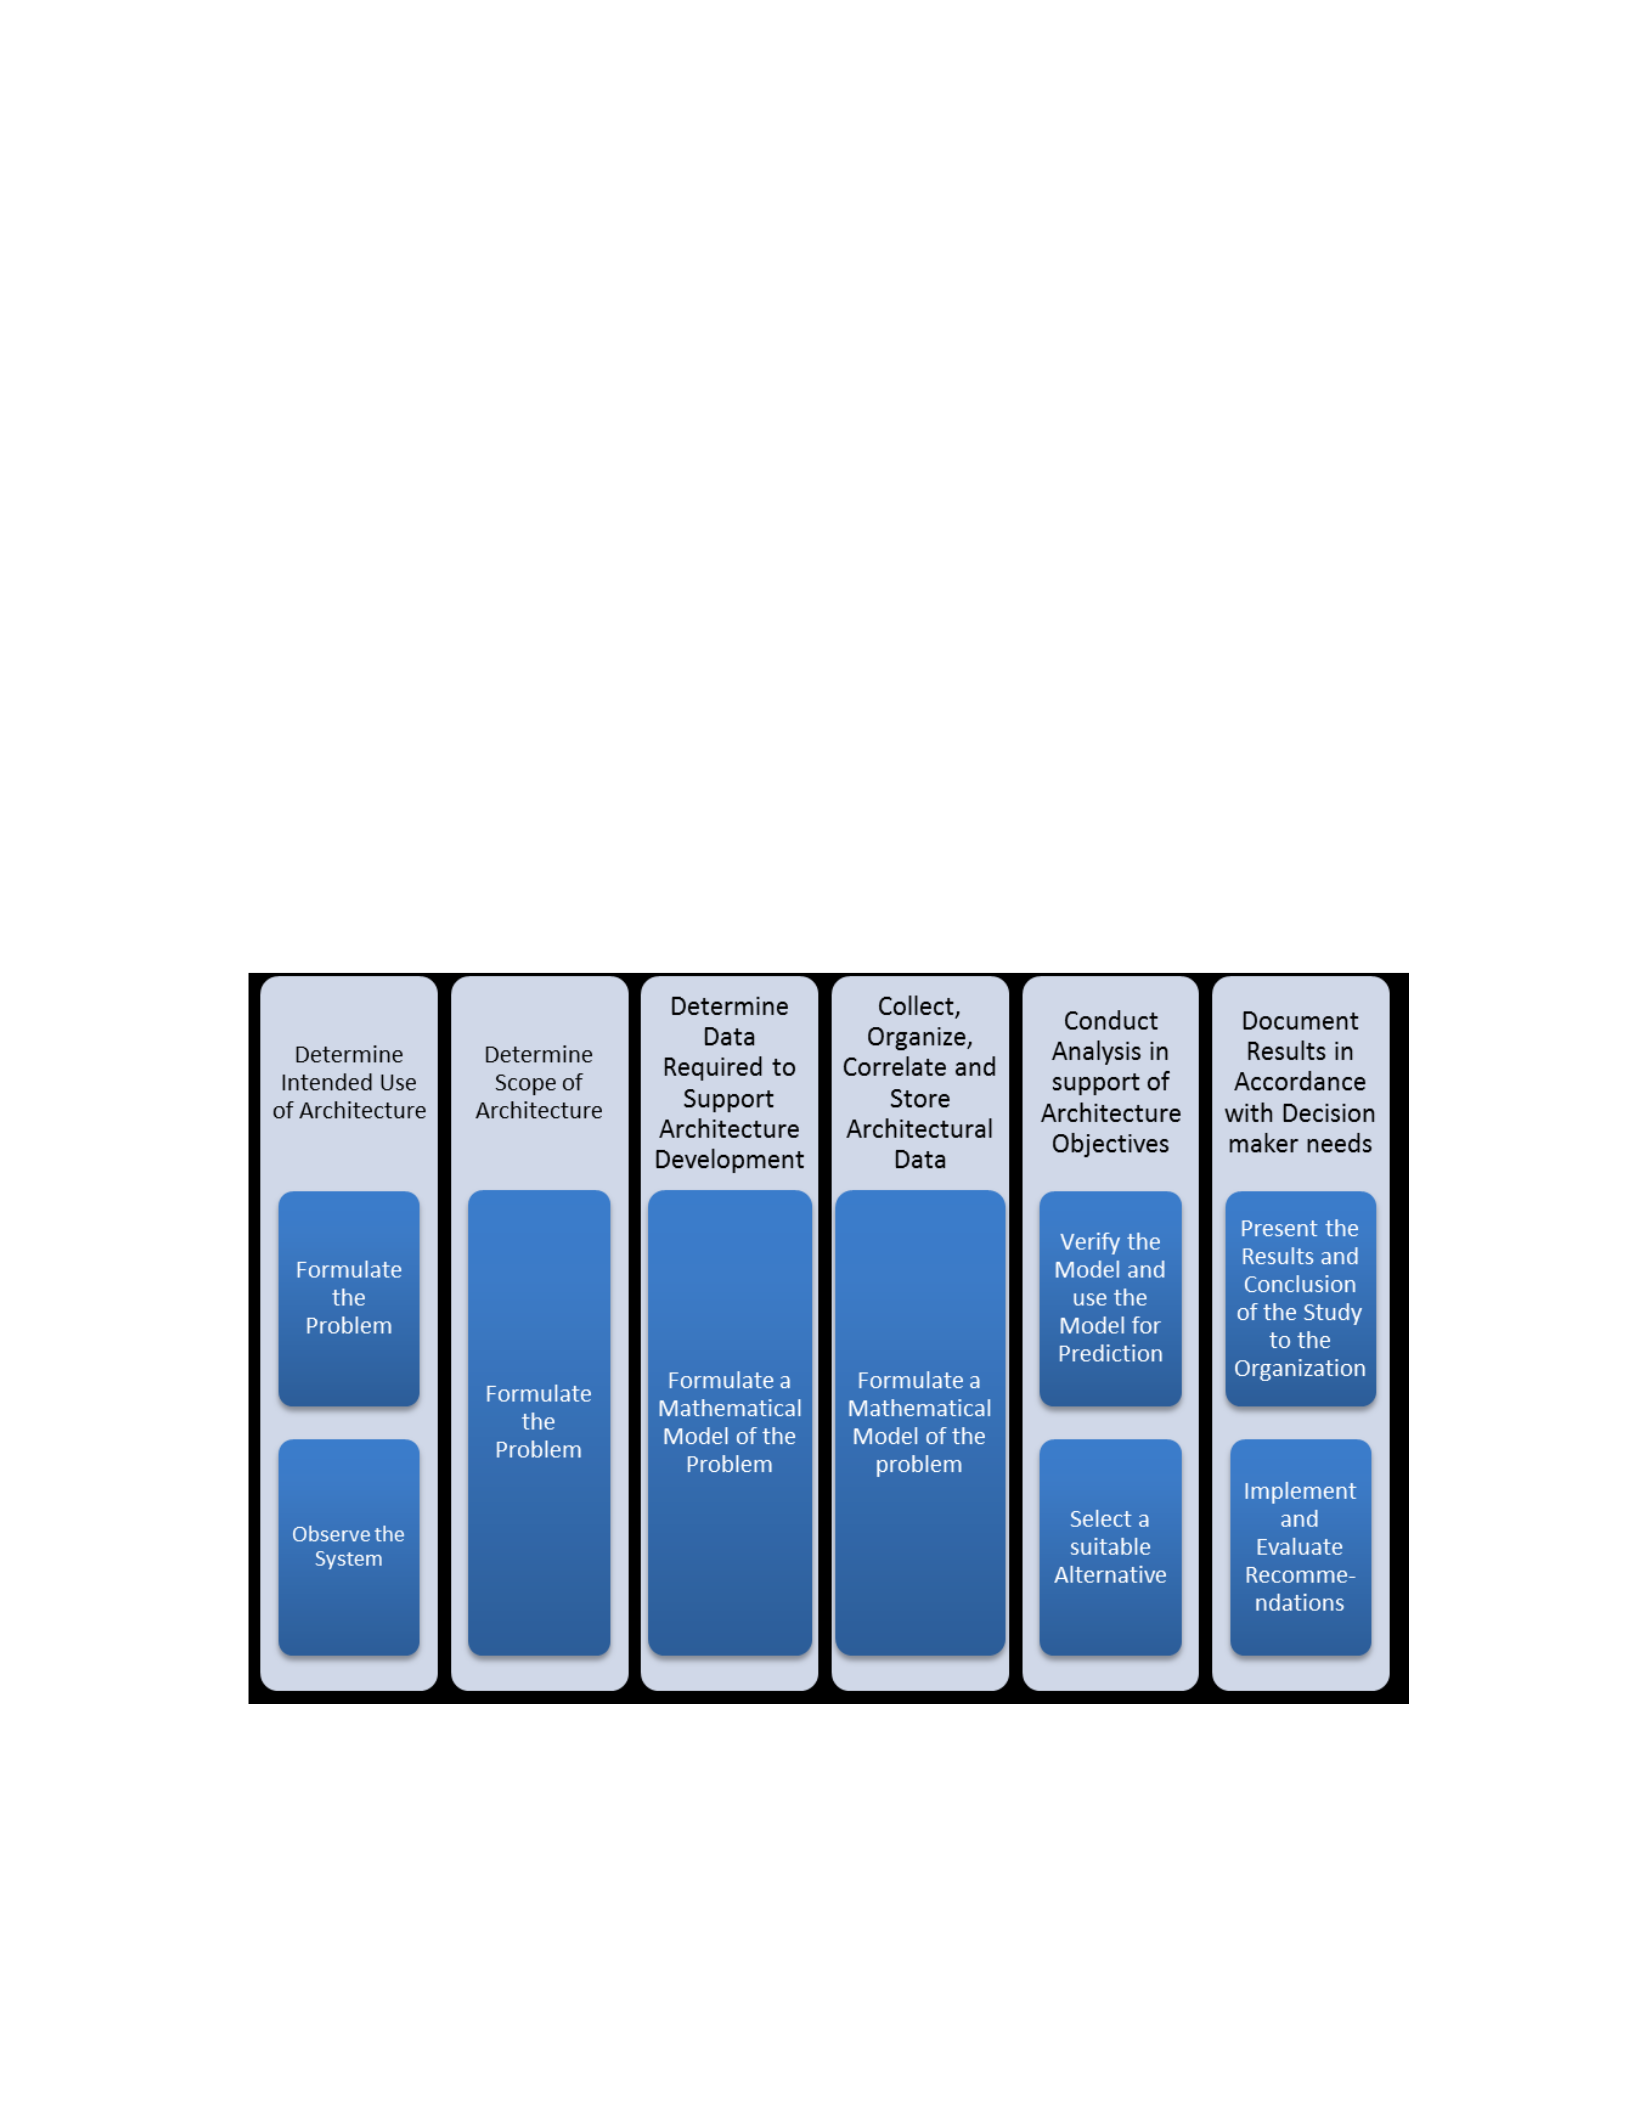
The mapping of the two processes is shown below in Figure 2.1. While the
architecture team is determining the intended use of the architecture, the OR team
members are starting to formulate the problem based on the intended use. As the scope
becomes more clear and data is collected, OR is used to formulate a mathematical model
of the system. Once the model is developed, the model is solved and the results are
documented based on the decision maker’s needs.
This research does not change the fundamentals of the current DoDAF process as
just described; rather, it includes OR modeling in the analysis in a tailored way to meet
the VA and decision analysis objective. OR (specifically, an integer linear program) will
be used to determine the best use of security resources while minimizing cost.
Figure 2.1 Integrated DoDAF and OR processes

2.4 Contributions
The primary contribution to the literature made by this dissertation is a model
based approach for the VA of CI human and system architectures. By using common tools
and framework, this research allows systems engineers to contribute to CI VA efforts at
the architecture level. The analysis of the architectures provides results to aid decision
makers in making tradeoffs between security resource investments. This type of analysis
is needed because of the importance of CI systems to our everyday lives. If these systems
are not adequately protected and are damaged, the impacts could range from complete
electric power system outage to causing financial markets to close. An electrical system
outage could result in loss of life and markets closing unexpectedly for long periods of
time could cause a meltdown of the financial system. These are unacceptable
consequences and therefore continuous VA of CI systems is needed to ensure that they are
robust against attacks.
This research extends the application of the simulation of human processes by
adapting the NATO Human View to create NATO Human View executable architectures
for SNA and to provide inputs for TTC analysis. The human views are used directly for
the SNA, making the architecture created executable. The multi-sensor systems example
discussed by Handley and Knapp [2014] is expanded upon by using SNA to understand
the interaction between roles. The work of Handley and Smillie [2010] on Human View
dynamics is expanded because task performance is based on skills, and, in this research,
skill levels are used to determine how long it would take an insider to compromise the
system. Past research has not used human views for security analysis.
Furthermore, this research applies human views to CI systems for the first time.
These systems have complex human interactions across a large footprint of infrastructure,

so the analysis of these systems should include not only hardware and software but also
people within the system. By performing SNA and TTC analysis, which is
straightforward to accomplish with information provided in standards documents and
other documentation readily available to the asset owners, system architects will be able
to identify the interfaces where human vulnerabilities can have the most impact.
This research also extends the application of system architectures by directly
using the resources identified in a DoDAF SV-1 System Interface Description in the
objective function of an integer linear program to minimize the cost of allocating security
resources. This is important because the funds available to support security are limited,
and, therefore, the best mix of security resources based on cost and effectiveness would
allow asset owners to understand what level of security effectiveness they can afford
based on their budgets. Additionally, Hamilton’s work on the intersection of information
assurance and DoDAF is expanded in this research by using the DoDAF OV-5b
Operational Activity Model to model historical and potential future attacks on CI; past
research has not used an OV-5b for this purpose. By using the OV-5b to describe attacks,
it provides a method to trace parts of an attack back to the system architecture and
industry regulations, recommendations and policies, which ensures that the security of CI
is always based on the latest standards or identifies areas in which it is not.
Finally, this research extends the model based analysis of CI protection systems
by considering the requirements that not only involve protection from potential threats
but also industry standards and recommendations. CI is heavily regulations and
standards-driven, so capturing what the standards are and how they apply to the system is
an important facet that is not discussed in previous models. In addition, activity diagrams
are modeled from the view of the attacker, not the protection system. Doing so allows a

model user to easily evaluate specific nuances to various attacks when they occur and
make changes to the architecture as vulnerabilities are exploited.
At the subsystem level, this research shows how activity diagrams can be linked
to detailed OR models and provides decision makers with critical information for
determining the best use of security resources. Another contribution is the expansion of
the bi-level model by Medal [2016] to include directional antennas and power to provide
more fidelity in the model for our application. The original work by Medal [2016] used
omnidirectional antennas to represent both the communication and jammer nodes in an ad
hoc wireless network and did not consider the power available for each node. In this
work, directional antennas are used for the communication nodes, which allows for a
reduced chance of jamming within the network. Also, the battery capacity available for
each node is considered for the communication nodes. This is an important extension to
make because it allows network designers a more realistic model for determining network
parameters that make their designs more robust against jamming attacks.
In summary, the primary contribution to the literature is an approach for VA of human and
system CI architectures that can be used by decision makers to determine the best use of
security resources. In addition, by using standard systems engineering frameworks and
tools, this method allows systems engineers to do CI VA at the architecture level. The
next chapter explains the generic approach in detail.
METHOD FOR CRITICAL INFRASTRUCTURE VULNERABILITY ASSESSMENT
3.1 Introduction
This chapter explains the new step by step approach for CI VA developed in this
research. Once the method is described in this chapter, it will be executed in chapter 4

with an illustrative example. The process for VA begins with a decision maker
determining that a VA needs to be done and the questions that they would like answered.
After that is determined, the method developed is used to for CI VA. The complete
approach is shown in Figure 1.2. Each of the paths in Figure 1.2, when executed and the
result obtained, provide data for decision makers to make tradeoffs between multiple
options for security resource investments. In this section, path 1(human) is presented in
section 3.2, path 2 (system) is presented in section 3.3, path 3 (subsystem) is presented in
section 3.4, and the summary of how all the data is aggregated for decision making is
discussed in section 3.5.
3.2 Path 1: Human architecture analysis method
Using the NATO Human View for security analysis is a new research area that has
not been explored in spite of the fact that human threats such as insiders (e.g., malicious
employees) and external actors (e.g., terrorists) have been active in exploiting security
vulnerabilities. As a result of these risks, the development of a general approach to
understanding how each NATO Human View product can be used for security analysis is
warranted to enable early evaluation of the security aspects of the system by system
architects and decision makers. Architects and decision makers should note that analysis
of these views is only one indicator of a potential insider, and other indicators should be
used to understand an individual’s potential for malicious activity.
The NATO Human View is a means for analyzing the interactions,
responsibilities, and other attributes of human beings within a system [NATO, 2010]. The
approach presented in this section provides security analysts, architects, decision makers
and others a view into the functions that are performed and skills that are present in an
organization. This overview does not repeat the overviews and examples presented by

Handley and Smillie [2008] and the NATO Research and Technology Organisation
[2010]; rather, it presents a method for how to expand on the views to include the
descriptions appropriate for security analysis. Although the content of the views presented
by Handley and Smillie [2008] and NATO [2010] is the same, some of the numbers of the
views differ, a distinction that will be noted in the applicable sections.
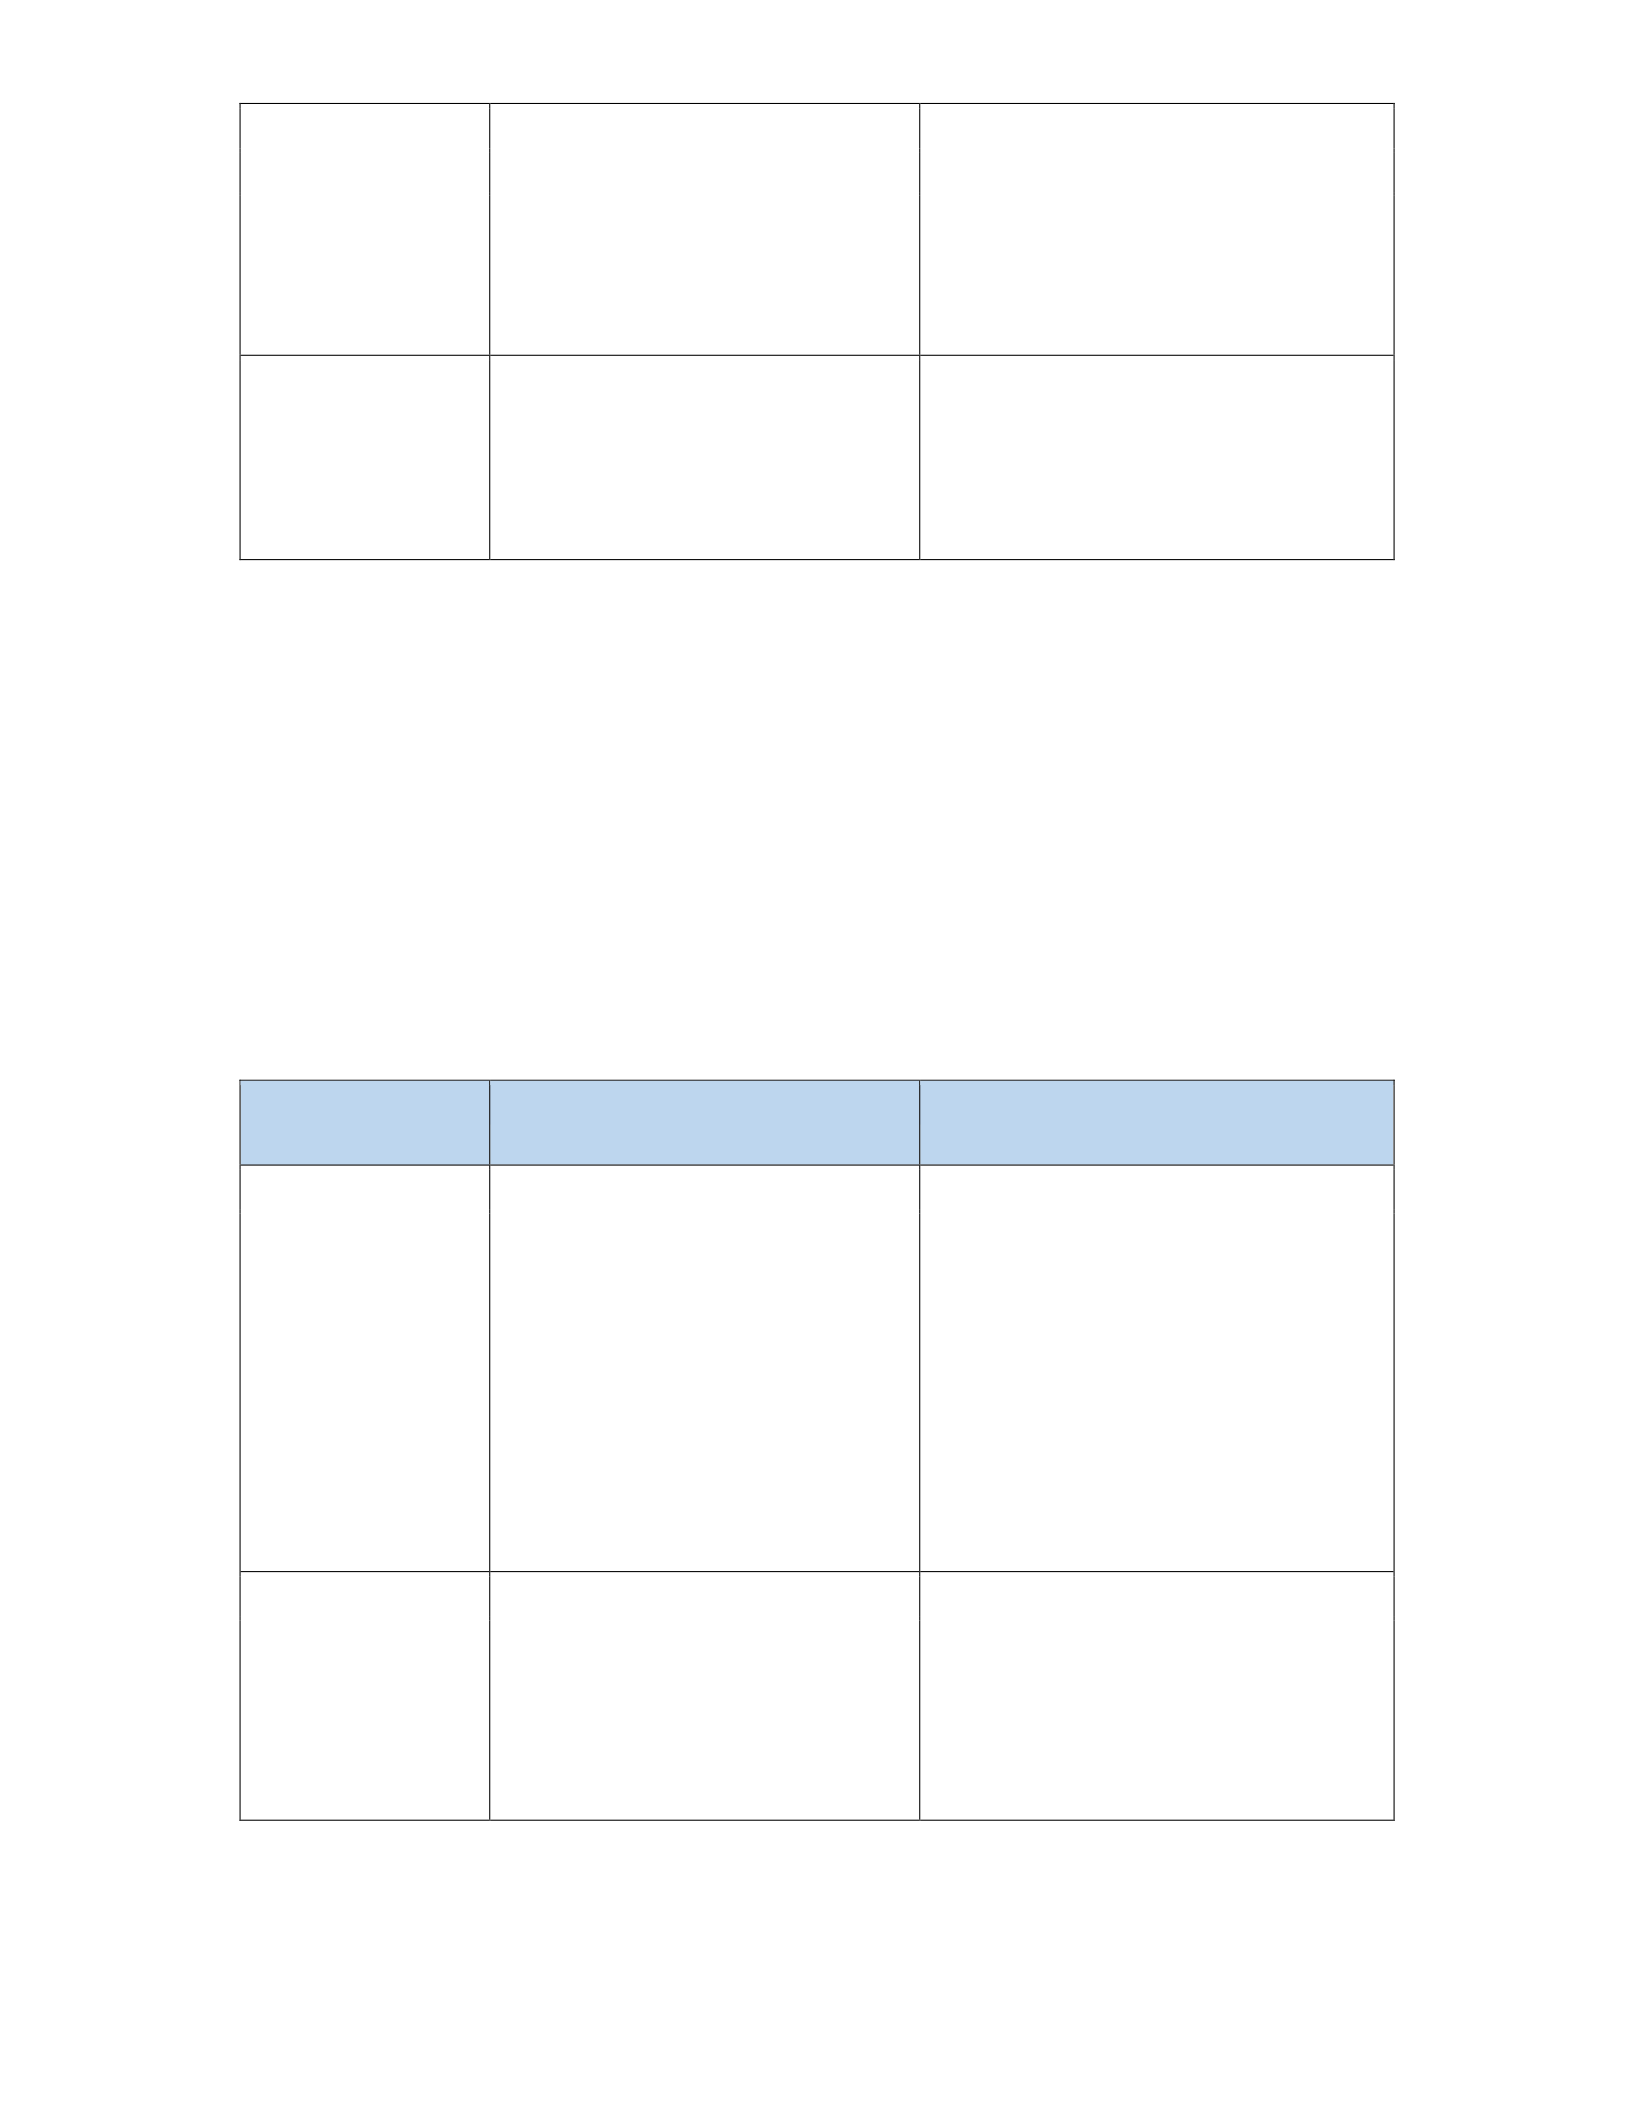
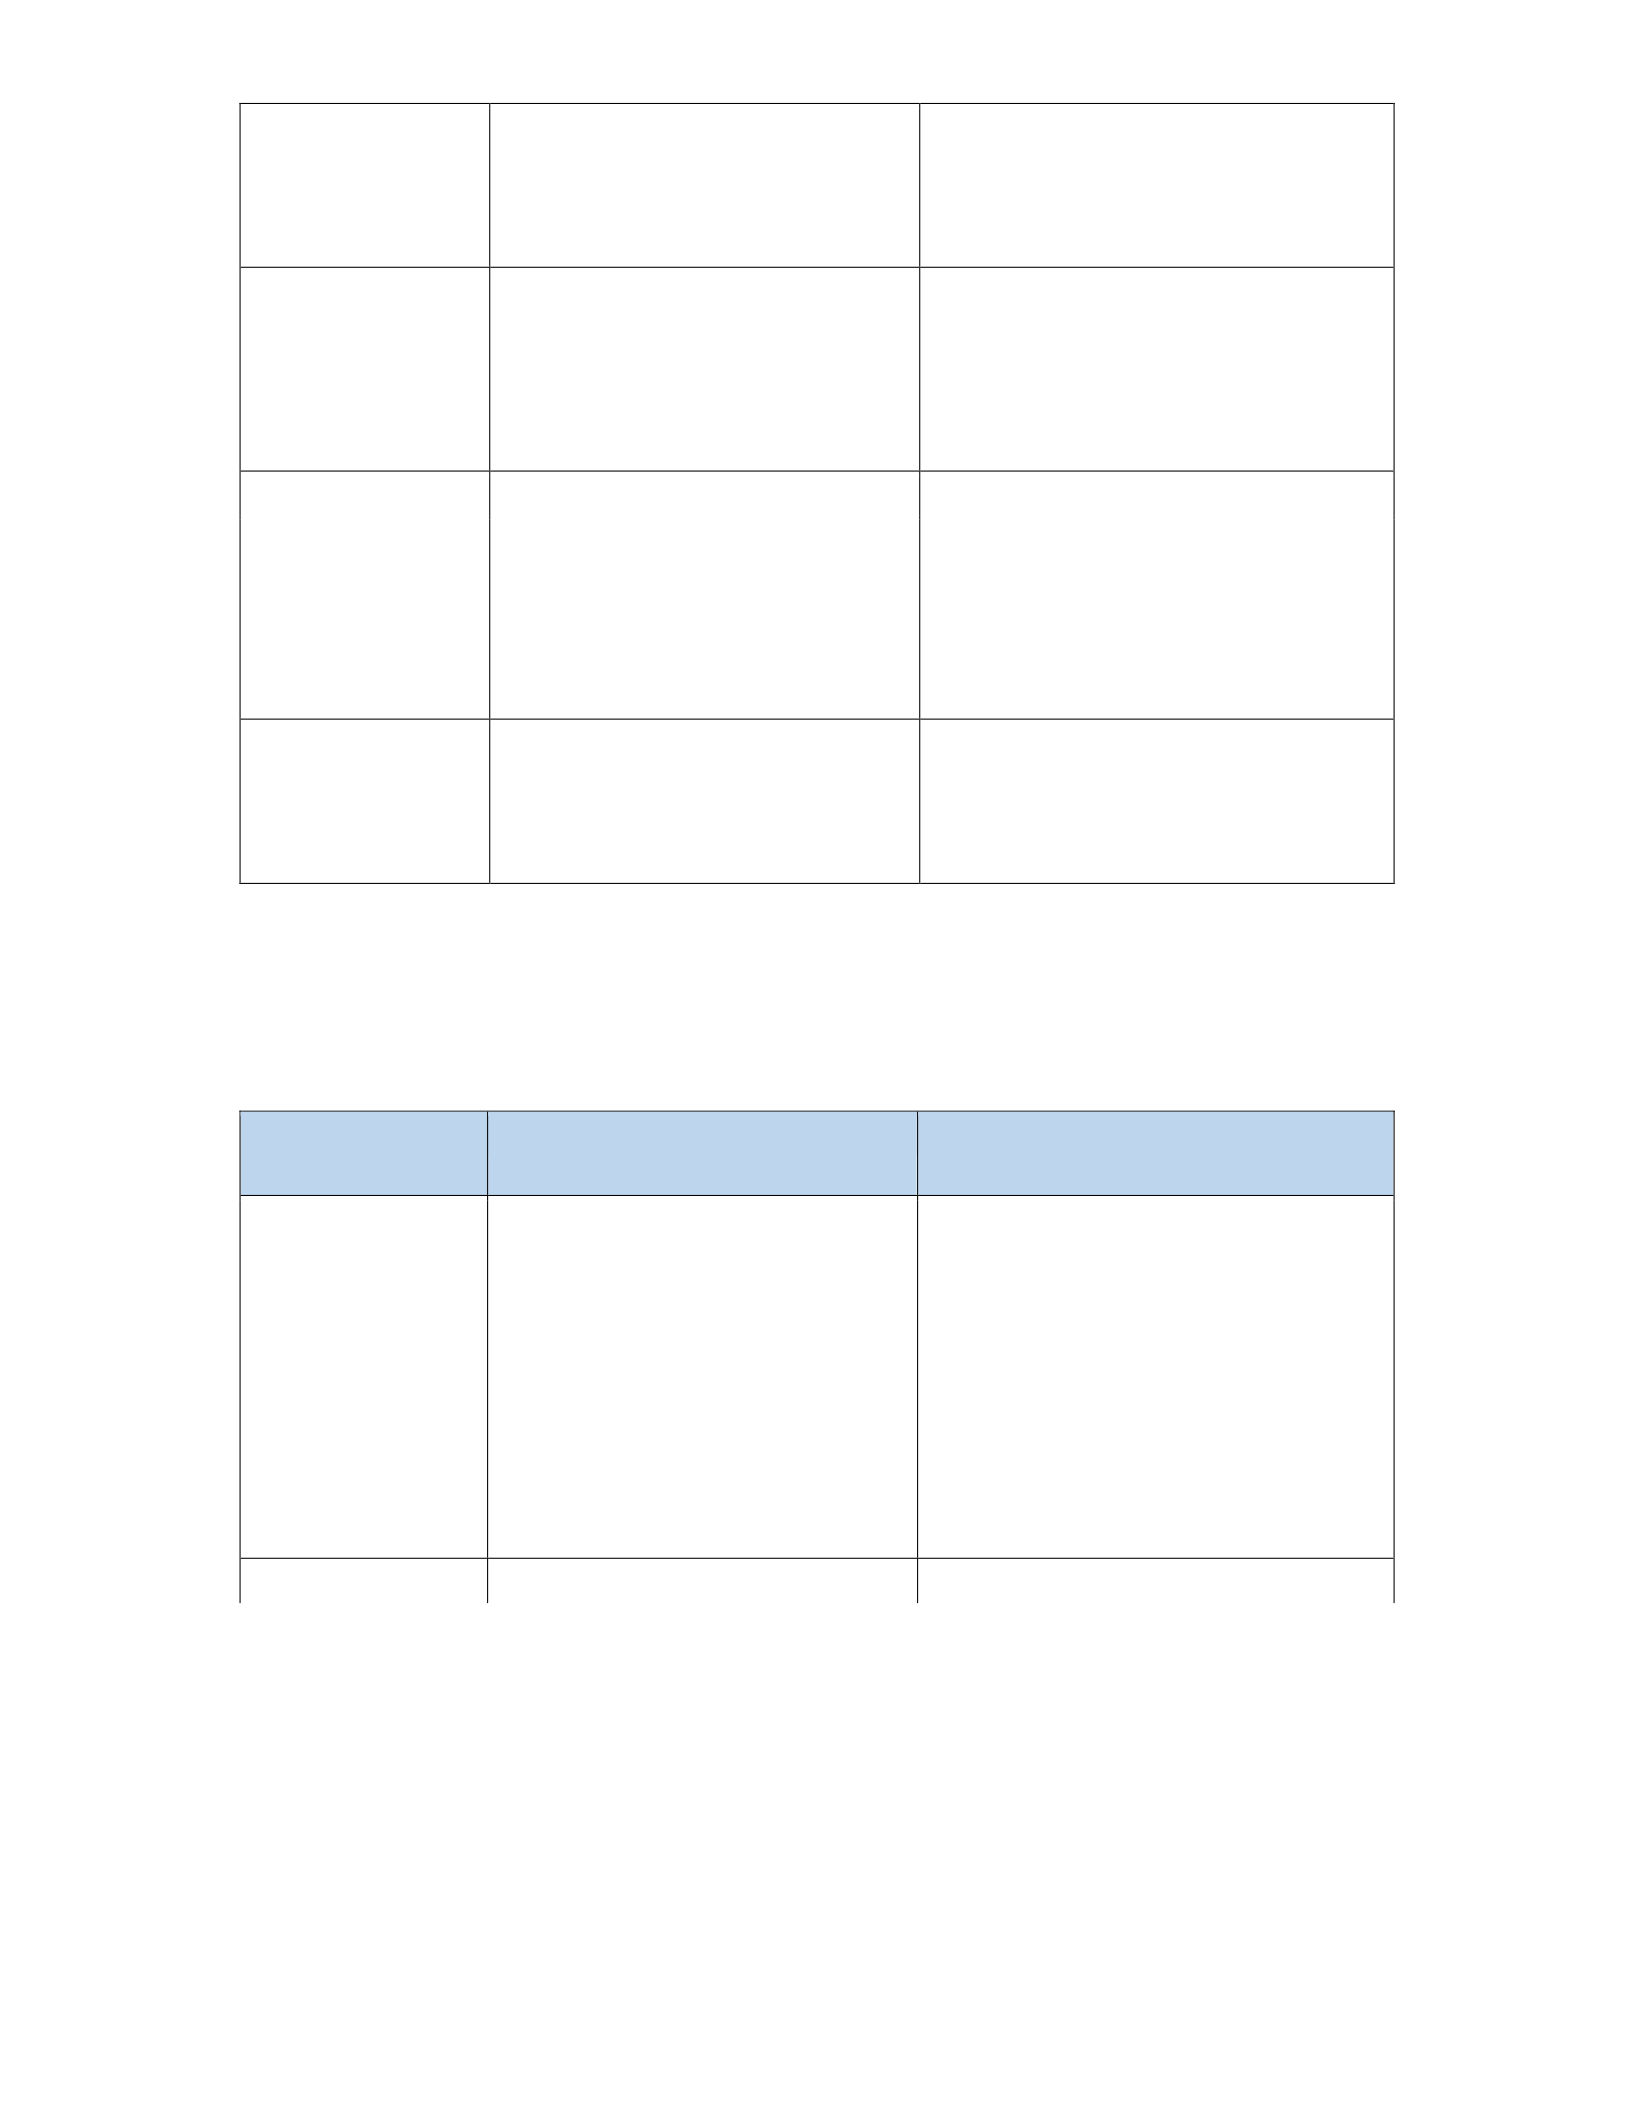
The security features each view provides are summarized in Table 3.1.
Table 3.1 Summary of analysis of the NATO Human View and its products
Human View
Product
Description
Security Features
HV-A: Concept
Conceptual view that shows a
“high-level representation of the
human component” of the
system [NATO, 2010; 4]
Identification of human system
interfaces and initial questions about
vulnerabilities based on high level
architectural view
HV-B1:
Personnel-related view that
Times during the day, week, month
Manpower
determines the needed number of
or year that the system is most
projections
individuals to be present at the
organization at a specific time
for the organization to function
[NATO, 2010]
vulnerable based on the number of
employees present in the work place
HV-B2: Career
Personnel-related view that
Skills employees gain that can be
progression
indicates the competencies
necessary for members of an
organization to perform their
jobs and advance in the job
hierarchy [NATO, 2010]
used to exploit the system
HV-B3:
Shows the current and future
The number of employees in a
Establishment
number of employees expected
specific job category that will be
inventory
to be needed in a specific job
category [NATO, 2010]
needed in the future coupled with
outside information can help
determine how employees will react
to layoffs
HV-B4: Personnel
policy
Enables the user to determine the
rules, policies, and procedures
that each employee is subject to
during their time in the
workplace [NATO, 2010]
Which personnel policies (e.g.,
security clearances) apply to
particular employees to find
potential hazards
Table 3.1 (continued)
Human View
Product
Description
Security Features
HV-B5: Health
Captures potential health hazards
Identification of hazards that could
Hazards
toward humans [NATO, 2010]
affect individuals’ lives, health, and
ability to complete required work.
Overexertion could cause mental
fatigue that terrorists could exploit
through social engineering and
exposing employees to health
hazards could play a psychological
role in causing resentment among
employees to cause sabotage
HV-B6: Human
Product related to human factors
The proportion of jobs subject to
characteristics
and ergonomics that consider
what an operator is able to
accomplish in various settings
under various operating
conditions [NATO, 2010]
security requirements (e.g., security
clearances)
HV-C: Tasks
Illustrates the tasks and activities
that humans fulfill within a
system [NATO, 2010]
Identification of available
competencies of employees and the
relative security threat of knowledge
of each one
HV-D: Roles
Demonstrates the relationships
of authority between tasks and
roles in a system [NATO, 2010]
Hierarchy of responsibility for
completion of tasks, with which one
can determine the tasks that a job
positions affects if the holder of that
positions acts maliciously
HV-E: Human
“Human Network” that
The listing of individuals to whom
Network
investigates the interactions
among humans within a system
[NATO, 2010; 35]
an employee reports, so that one can
determine those affected if an
employee is determined to have
spread dangerous material (e.g.,
malicious computer code)
HV-F: Training
Considers training, including
requirements, risks, and the role
of career progression for training
[NATO, 2010]
Identification of the minimum level
of training needed for an employee
(with malicious intent) to affect a
given facet of the system
Table 3.1 (continued)
Human View
Product
Description
Security Features
HV-G: Metrics
Provides a method of measuring
human performance based on the
completion of tasks, courses and
pre-set objectives for a particular
job category [NATO, 2010].
A straightforward, metrical
(pass/fail) determination of how to
meet standards required to work in
the system, which can show whether
or not employees have shown
competencies needed to affect a
given part of the system, which is
useful if that part is subject to
malicious actions
HV-H: Human
This view “provides the basis for
A comprehensive view that (1) in

Dynamics
human behavior and executable
models that may be supported by
simulation tools” [Handley and
Smillie; 2008].
the case of SNA, shows the
interrelationships among positions
and tasks to indicate measures of
centrality and identify the most
important jobs, and (2) in the case of
TTC analysis, shows the correlation
between increased skill level and
decreased TTC the functioning of
the system
The HV-A starts the security analysis at a high level by showing the security
analysts the key system interfaces and allowing identification of key questions or
observations about the security of the human system interfaces. At a more detailed level,
the HV-B products allow the identification of specific times of the day when the system is
most vulnerable based on employee work schedules and the skill sets of the employees.
Questions such as “which personnel need security clearances?” or “which employees are
risks for malicious activity due to a future layoff?” are also answered by the HV-B.
After looking at employees and their job categories, the next step is to evaluate the
security risks based on an employee’s specific competency (HV-C), and, based on this
level of competency, to determine the minimum training an employee needs to affect the
system (HV-D, F). The employee’s impact on the system is not only impacted by what the
employee knows, but also by who the employee interacts with on the job or his or her
human network (HV-E). One question that might be posed is the following: does an
employee have access to people with more influence in the company or a higher level of
permissions on the CI system? This information from the previous views can be used to
develop a metric that can determine whether or not employees should be able to work on
the system based on the security risk they impose (HV-G). Finally, all the previous

products discussed can be used to create simulations and do analysis (HV-H). In the
illustrative example in the next section, the HV-H will be used for social network and
TTC analysis, but it can also be used for other analysis such as discrete event simulation.
The outcome of this view is focused on answering the questions that architects need to
answer for a decision maker, and that determines what modeling and simulation is done.
In the context of SNA, an HV-H diagram should fulfill the dual purposes of
showing which people are responsible for fulfilling which tasks and providing additional
information relevant to the social network that cannot be discerned from just one Human
View. For example, a software program involving SNA, such as NodeXL, Gephi, or
UCINET, could be used to organize the data in the form of nodes and edges [Choudhary
and Singh, 2015]. Nodes could include positions or tasks that are subject to linkages that
could be represented by edges. After identifying these nodes and edges, the analyst can
run an analysis on the available data to gather information relevant for insider threat
analysis. Such information might include centrality, so that the user could discover which
positions are the most well-connected and have the easiest access to others in the
organization.
Another application is time to compromise (TTC) analysis. TTC analysis
determines how long it would take an individual with certain skillsets, training, and
abilities to exploit a vulnerability. TTC information is relevant because it is another
metric for how susceptible an organization’s systematic layout might be to internal and
external malicious actors. SNA and TTC analysis are merely two forms of analysis, but
there are other forms of analysis that can use the data in the Human Views, such as
discrete event simulation.
In the next section, the approach for systems analysis will be discussed.

3.3 Path 2: System architecture analysis method
In the approach to system architecture VA and decision analysis, a combination of
DoDAF and OR will be used. DoDAF will form the basis of a model that includes
industry standards and best practices, attack scenarios, and expert opinion. By using a
model based approach, users of this approach can easily understand the traceability
between vulnerabilities, system components and industry standards. Ultimately, a model
is developed that allows decision makers to make tradeoffs between cost and the level of
security effectiveness desired.
Figure 1.2, path 2 shows the overall approach. First, standards and requirements
are gathered for the system. Next, reference documents and subject matter expert opinion
are used to create a structural view of the system that is being evaluated. This can be an
existing system (“as-is”) or future system (“to-be”). Then, case studies of previous
security incidents and potential future security vulnerabilities are used to create activity
views. All this data is entered into a model based systems engineering tool so that
traceability is established between all artifacts. This model can now be used to identify
key security resources and gaps in security resources based on the traceability between
the system, industry standards, and past and possible future attack scenarios. Based on
this information and their experience, subject matter experts can determine the
importance of various security resources. The expert opinion determined in this step is
used to develop individual security effectiveness scores (ISES) for each security resource.
The total security effectiveness (TSE) of the system can be selected by the decision
maker and is used to develop a model for performing tradeoffs between a combination of
security resources.

The approach is detailed in the sections below. Separate sections consider the
approach for an existing system versus a system being built. If an architecture was not
originally developed for an existing system, this process would be used to document the
as-is system.
3.3.1 Step 1: Gather documentation
If there is a system that is in the planning stages (“to-be”) and has not yet been
built, this step will be used to gather all the information required to develop the
architecture and attack scenarios. Sources such as subject matter experts, industry
standards, textbooks and news articles can be used. For an existing system, one can
gather all the technical documentation available and any reports of system attacks or
vulnerabilities that have been identified.
The gathering of attack scenarios should not only focus on scenarios that are
directly related to the specific system that is being analyzed, but it should also focus on
systems that have common traits. For example, one can consider a case involving the
security of a chemical plant that uses wireless cameras. If there are no reported incidents
with the cameras, but there was an incident at an electrical substation where the same
type of camera’s wireless signal was jammed, then this scenario should be captured
because of the core similarity in the attack vector. One should note that the step of
gathering documentation will be revisited throughout this methodology because, as a
better understanding of the system is gained, more documentation may be needed.
3.3.2 Step 2: Create list of requirements or statements
After gathering the documentation, the lists of requirements or statements are
derived from what is collected. The reason that requirements or statements are used is
because there may be a general recommendation that will be referenced in the

architecture or specific requirements. CI documentation can contain recommendations
that are general. For example, a recommendation may say that there should be a lighting
system at an electrical substation, but it may not quantify how much coverage those lights
should have. That information may be in another document, or the asset owner may be
given the freedom to decide.
For each document, the list created at this step needs to be decomposed into
distinct units so that they can be referenced in the structural view of the architecture. For
example, if a standard includes an entire section on cyber security, that section will have
to be decomposed into a referenceable list so that the different elements of the system can
be mapped to the relevant sections.
3.3.3 Step 3: Create a structural view of the system
After the requirements are decomposed, a block diagram of the system should be
created using an architecture framework or modeling language such as DoDAF or
SysML. While only one structural view is identified for use, it is possible that multiple
views would be created during this step as needed to support answering the decision
maker’s questions. CI systems can be very complex systems of systems, so it will be
important to capture the system at the appropriate level for the questions that need to be
answered. In addition, the meta-data descriptions for the blocks and flows should be filled
in as completely as possible. This will aid in the evaluation of the architecture
immediately and in the use of the architecture by other system architects in the future.
Resources that are used should be identified clearly in the structural view; this will allow
a seamless transition from this view to the analysis in step 8. During the current step, one
should trace the resources identified in the architecture to the list of statements or
requirements in step 2.

3.3.4 Step 4: create activity views of past and potential future attacks
Now that there is a baseline structure of the system, this step begins with
reviewing the past attacks that were identified in the initial data gathering step. One
should determine the following: has all the information on relevant attacks been gathered
now that the structure of the system is understood? Once the team is comfortable that the
data has been gathered, the first step is to create activity views of past attacks. These
attacks will represent attacks not only on the exact system but also on systems that are
fundamentally similar. For example, an industrial control system and information
technology system are not exact matches, but there are enough similarities that there may
be similar attack vectors used by an adversary.
Once previous attacks have been diagrammed, the next step is for the team to
develop activity diagrams based on potential future attacks. For this step, subject matter
experts should be used to review the architecture developed and identify other scenarios.
In both the past and potential cases, these diagrams should capture all activities associated
with the attacks they describe. The activities should capture who performed the action,
what standards or methods were used, and the relevant inputs and outputs based on
actions. During this step, one ought to trace the activities to the resources identified in the
structural block diagram.
3.3.5 Step 5: Identify gaps in traceability
Now the requirements, structural and activity views are linked. The next step is to
evaluate the traceability between these elements. A traceability diagram can be used to
determine where there is no traceability between elements. The lack of traceability from a
requirement to a structural block or from an attack activity to a structural block could be a
gap that indicates a vulnerability. For example, if a recommended standard is that a

substation should have lighting, but there is no lighting system in the architecture as a
resource, then that could be a potential vulnerability. In addition, if an activity diagram
shows that an attacker came at night and was not stopped because there was no security
guard, and there is not a manned security resource in the structural diagram, then that
could be a potential vulnerability based on past events.
3.3.6 Step 6: Collect subject matter expert surveys
At this stage, the complete architecture model has been built and evaluated for
traceability between elements. The next step is for subject matter experts to evaluate the
model and determine what security resources provide the most security effectiveness
against the identified vulnerabilities. The security resources used here should be those
identified in the structural view of the system. The vulnerabilities will be those identified
in the activity diagrams.
The scores in this step can be derived through many means. One option is to have
the subject matter experts rank the security resources individually as either not effective,
somewhat effective, or very effective in terms of security effectiveness. The percent of
subject matter experts that vote for a particular security resource can then be used to
determine the effectiveness scores that will be used for modeling and analysis.
These effectiveness scores can vary based on different environments. For
example, if someone has a system that is in a military facility, the effectiveness of an
additional fence around the system may be less than a system that is in a rural area. This
analysis will address how to compare such security scores in the last step.
3.3.7 Step 7: Create a model to enable analysis of alternatives
Now that the security effectiveness scores are determined for the security
resources, the next step is to use the effectiveness scores and the cost of the resources to

determine the cost required to meet the security effectiveness desired by a decision
maker. The model developed in this step should seek to establish an effectiveness score
that can be adjusted so that decision makers can select a lower security effectiveness if
they need to lower their costs.
As an example, in the illustrative case study in Chapter 4, an OR model is used,
but other models could be used. For the OR model, the assumptions, objective function,
decision variables and constants in the model are major considerations. The assumptions
should capture any information that the decision maker needs to know about the model.
For example, for a new system (“to-be”) with an intrusion detection system, does the cost
capture the implementation and maintenance of the system or just the cost of the device?
These costs must be as accurate as possible to get useful information out of the model.
Next, the objective function of the model should use the identified resources (e.g., video
surveillance) in the structural diagram as the decision variables. The constants for the
costs and other parameters are very important to making the model useful for decision
makers; if these costs are not properly defined, the result of the model will not be correct.
This data can be obtained from vendor quotes or Internet searches for representative
hardware or software. Sometimes, vendor quotes are proprietary, so that fact needs to be a
consideration when determining when or how such data is shared outside of the entity
that obtained the quote. Once the data obtained has been verified and the model is
complete, the next step is to execute the model so the results can inform decision makers
of their options.
3.3.8 Step 8: Perform analysis to support key decisions
The model should then be executed at various levels of security effectiveness. For
the comparison of alternatives with different benefit scales, the model results can be

compared by establishing a maximum security effectiveness, minimum security
effectiveness, and percentages of effectiveness (e.g., 25%, 50%) based on model
constraints. This will allow a comparison among the models for various sets of benefit
scores, which is illustrated in the case study in the next chapter.
Once the analysis is complete, the results should be presented to the decision
maker and the subject matter experts to determine what security investments should be
made. The results should include the total security effectiveness (TSE) scores, the
security resources, options for security effectiveness solution percentages, and the ISES
originally derived from the subject matter experts. Chapter 4 demonstrates how to apply
the methodology presented here to an electrical substation VA and decision analysis.
3.4 Path 3: Subsystem analysis method
The first step in this approach for deriving a subsystem level decision analysis
model is to develop or use an existing OV-5b operational activity diagram of an attack
scenario from system analysis path 2. Once an OV-5b has been derived from an attack
scenario, the next step is to identify the list of questions that a decision maker or designer
would like to be answered, which can be the questions identified in system analysis path
2 or they can be new questions. Then, the scenario is refined based on the questions that
need to be answered, and, finally, a decision model is developed and analyzed. Figure
1.2, path 3 shows the sequence of these steps, which will be discussed in detail.
3.4.1 Step 1: Develop an OV-5b from an attack scenario
The first step in this process is the same as step 4 in Figure 1.2, path 2. The
architecture development team should develop an OV-5b based on a previous or future
attack scenario. In the case of a future scenario, the scenario should be reviewed by
subject matter experts to evaluate the validity of the scenario. Once the validity of the

scenario is established, the team should begin to work with decision makers and system
designers to identify a list of questions that they would like to know about the scenario.
3.4.2 Step 2: Identify list of questions
Based on the attack scenario identified in step 1, decision makers and system designers
will identify specific questions that they would like answered about the system. These
questions could range from system configuration questions to design questions about how
particular attack scenarios could be used to exploit their systems.
3.4.3 Step 3: Refine the scenario
Once the questions have been developed, the next step is to refine the scenario to
answer the questions. This may include developing a diagram of a detailed attack to
determine the parameters that will be needed for the decision model or interviewing
subject matter experts for more detailed information about the particular behavior of
hardware, software, people, policies or other attributes in the system. This step may not
need to be performed if it is determined that the diagram developed in step 1 is sufficient
for everyone to understand the scenario in sufficient detail to answer the questions. There
will be a feedback loop between step 3 and 4, since it might be necessary to continue to
refine the scenario as the assumptions of the decision model are better understood.
3.4.4 Step 4: Develop decision model
Once a refined scenario is developed, the next step is to develop a decision model
to attempt to answer the questions presented in step 2. Some of the questions presented in
step 2 may not be appropriate for the type of analysis presented here, and it may be
determined what analysis is appropriate to answer those questions. The decision model
step will identify assumptions and further details needed to develop a decision model that
will be useful for decision makers and designers. While in the illustrative example, a
BLMIP is used, network simulation tools such as OPNET, Network Simulator 2, and
OMNet++ could also be used. . It is expected that subject matter experts may need to be
queried during this step to determine the best path forward for selecting parameters and
reasonable assumptions.
3.5 Aggregating the results for analysis
After all three paths are complete, the analysis results for each path allow the
decision maker to determine the security investments of the overall system based on
available resources. For example, the decision maker could choose to invest all their
funds in background checks or some in additional sensors and some in additional wireless
network nodes. This aggregation step is currently executed manually by the decision
maker and potentially a team that they choose. In the next section, the approach is applied
to an electric power system as a case study.
ILLUSTRATIVE CASE STUDY: ELECTRIC POWER SYSTEM VULNERABILTITY
ASSESSEMENT
4.1 Introduction
The method presented in Figure 1.2 and explained in chapter 3 is illustrated in this
chapter through an electric power system case study. The case study begins with a
decision maker determining the purpose of the VA. The scenario is as follows. A decision
maker at an electric utility has $1,000,000 to invest in security. The decision maker
requests that the engineers on the team do an architecture level VA with a focus on
operations, substations and wireless video monitoring. For the operations (path 1 in

Figure 1.2), the decision maker wants to know which roles and job skill levels could
cause the most damage to the system. For the system level (path 2 in Figure 1.2), the
decision maker wants to know which security resources would be the most effective to
mitigate vulnerabilities in an electrical substation. For the subsystem level (path 3 in
Figure 1.2) the decision maker wants to know how to make the wireless network design
robust against a jamming attack. Where should the decision maker invest the funds?
The case study will cover the each of the paths presented in Figure 1.2 and in each
section (human, system, and subsystem) the questions shown in Figure 4.1 will be
answered. The numbers in Figure 4.1 correlate to the analysis path that will be followed
from Figure 1.2. The case study begins with an analysis of the human architecture in
section 4.2, then the system architecture in section 4.3, and finally the subsystem
architecture in section 4.4. All the results are used to help the decision maker determine
how to invest the $1M in section 4.5.
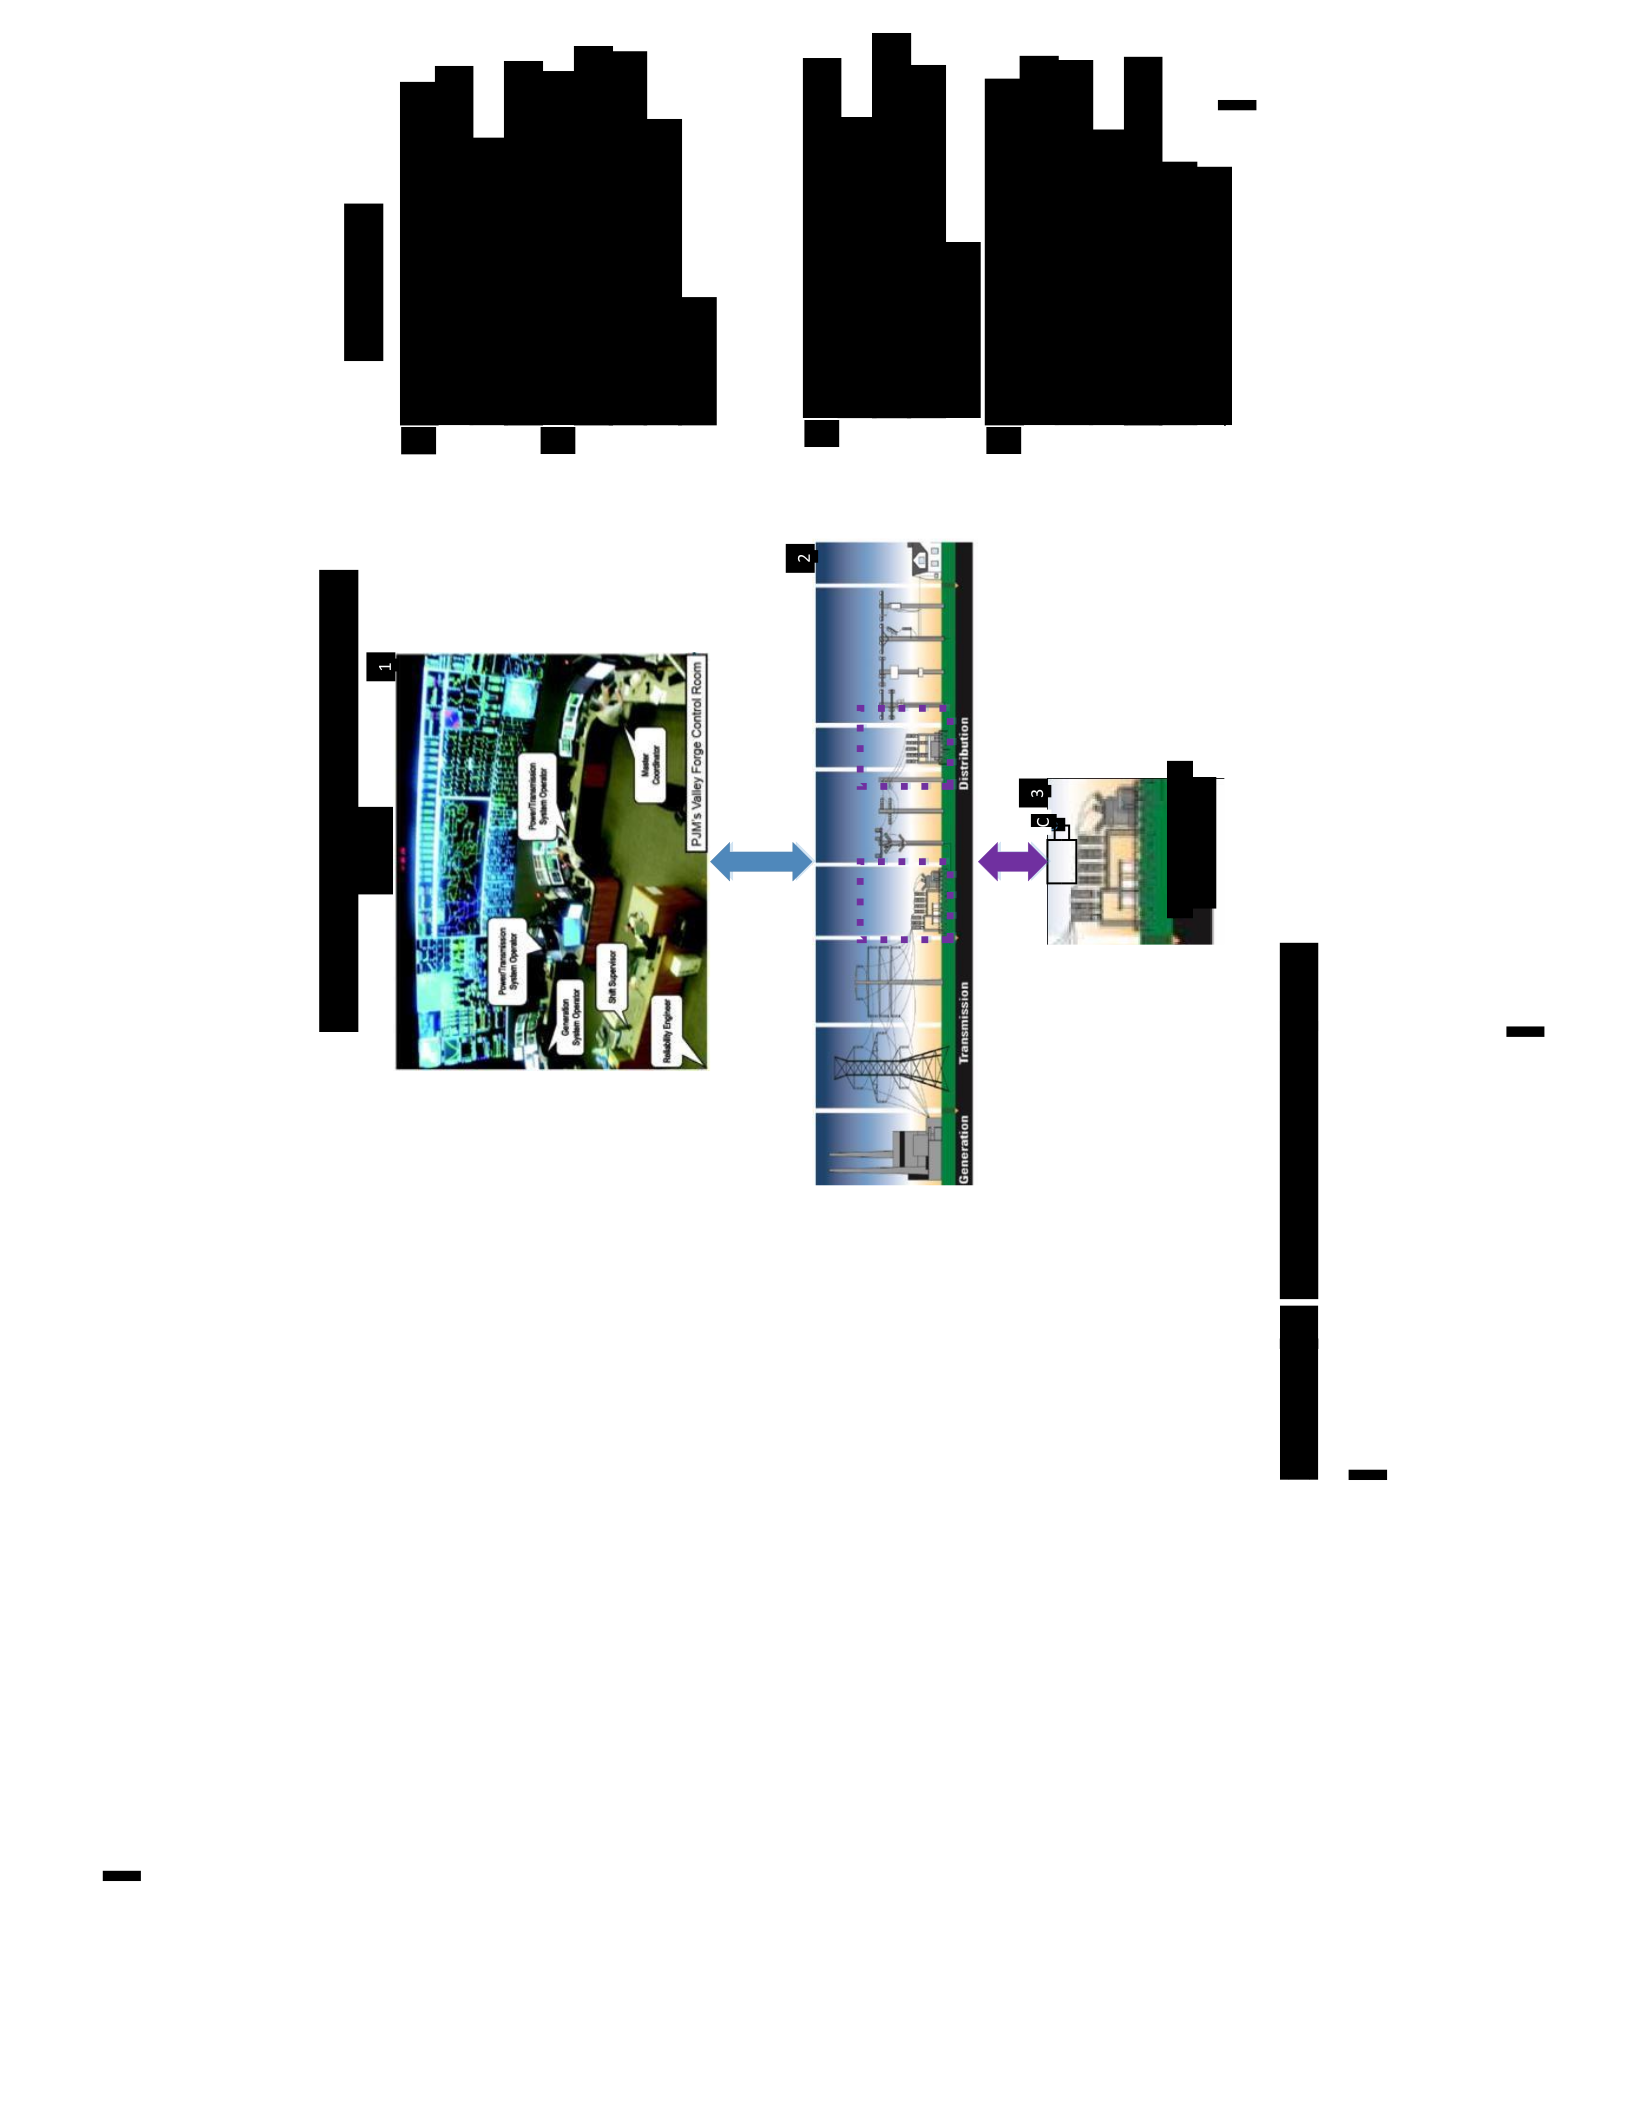
4.2 Illustrative case study: Human architecture assessment (path 1)
4.2.1 Introduction to electrical utility operations and security
The energy sector of CI utilizes both human beings and technology for the
completion of tasks critical for the function of electrical generation, transmission and
distribution. Because electrical utilities’ operations are so integral to the well-being of
society, it is imperative to consider the areas in which they could be vulnerable. For this

case study, identifying insider threats will be the focus of the analysis, since insiders have
been identified as a means to exploit vulnerabilities within electrical utilities [Luallen,
2011]. Luallen describes an insider as “anyone who has approved access, privileges or
knowledge of information systems, information services and missions” [2011: 2]. The
unique value of these human views is to provide a systems-level view of human
organizations’ functionality on a day-to-day basis, in areas ranging widely from training
requirements to safety hazards. For this chapter, the NATO Human View was constructed
based on job descriptions for the San Diego Gas and Electric Company (SDG&E) [2016]
and Apprenticeship Guidelines from Pacific Gas and Electric Company [2011]. Many of
the human views in this case study are partial views, and the complete views are available
upon request. The purpose of this case study is to show how the Human Views can be
used with the most realistic data openly available. Thus, to use the methods discussed in
practice, organizations would have to substitute their real data for the data used here.
4.2.2 HV-A: Concept
The HV-A for electrical utility operations is shown below in Figure 4.2. The top of
the figure shows an operations center and the physical equipment that is used in the flow
of power from its generation to consumer’s homes and businesses. The bottom of the
figure has text that discusses the roles of humans as well as some questions relative to
vulnerabilities that may be relevant for utility operations.
The generation section of the electrical grid relies on employees in the plants to
work together to maintain equipment that generates electricity to provide to consumers.
The primary question is as follows: how easily can employees or people outside the plant
tamper with generation equipment and computer systems? This subject could lead to
follow-on questions such as the following: are badges required to get access to the

facility? Also, transmission and distribution are the next sections of the system where
various roles that employees fill are identified. In that context, the following questions are
raised: Can any of the employees in these areas or terrorists gain access to the systems for
malicious purposes? At a high level, what are the controls in place to prevent such an
occurrence? Finally, on the consumer side, are there systems that consumers can access
that would potentially damage the entire system?
The initial discussions when developing and evaluating the HV-A prepare the
team for the high-level security issues with the system. These issues will be explored in
more detail in views B through H.
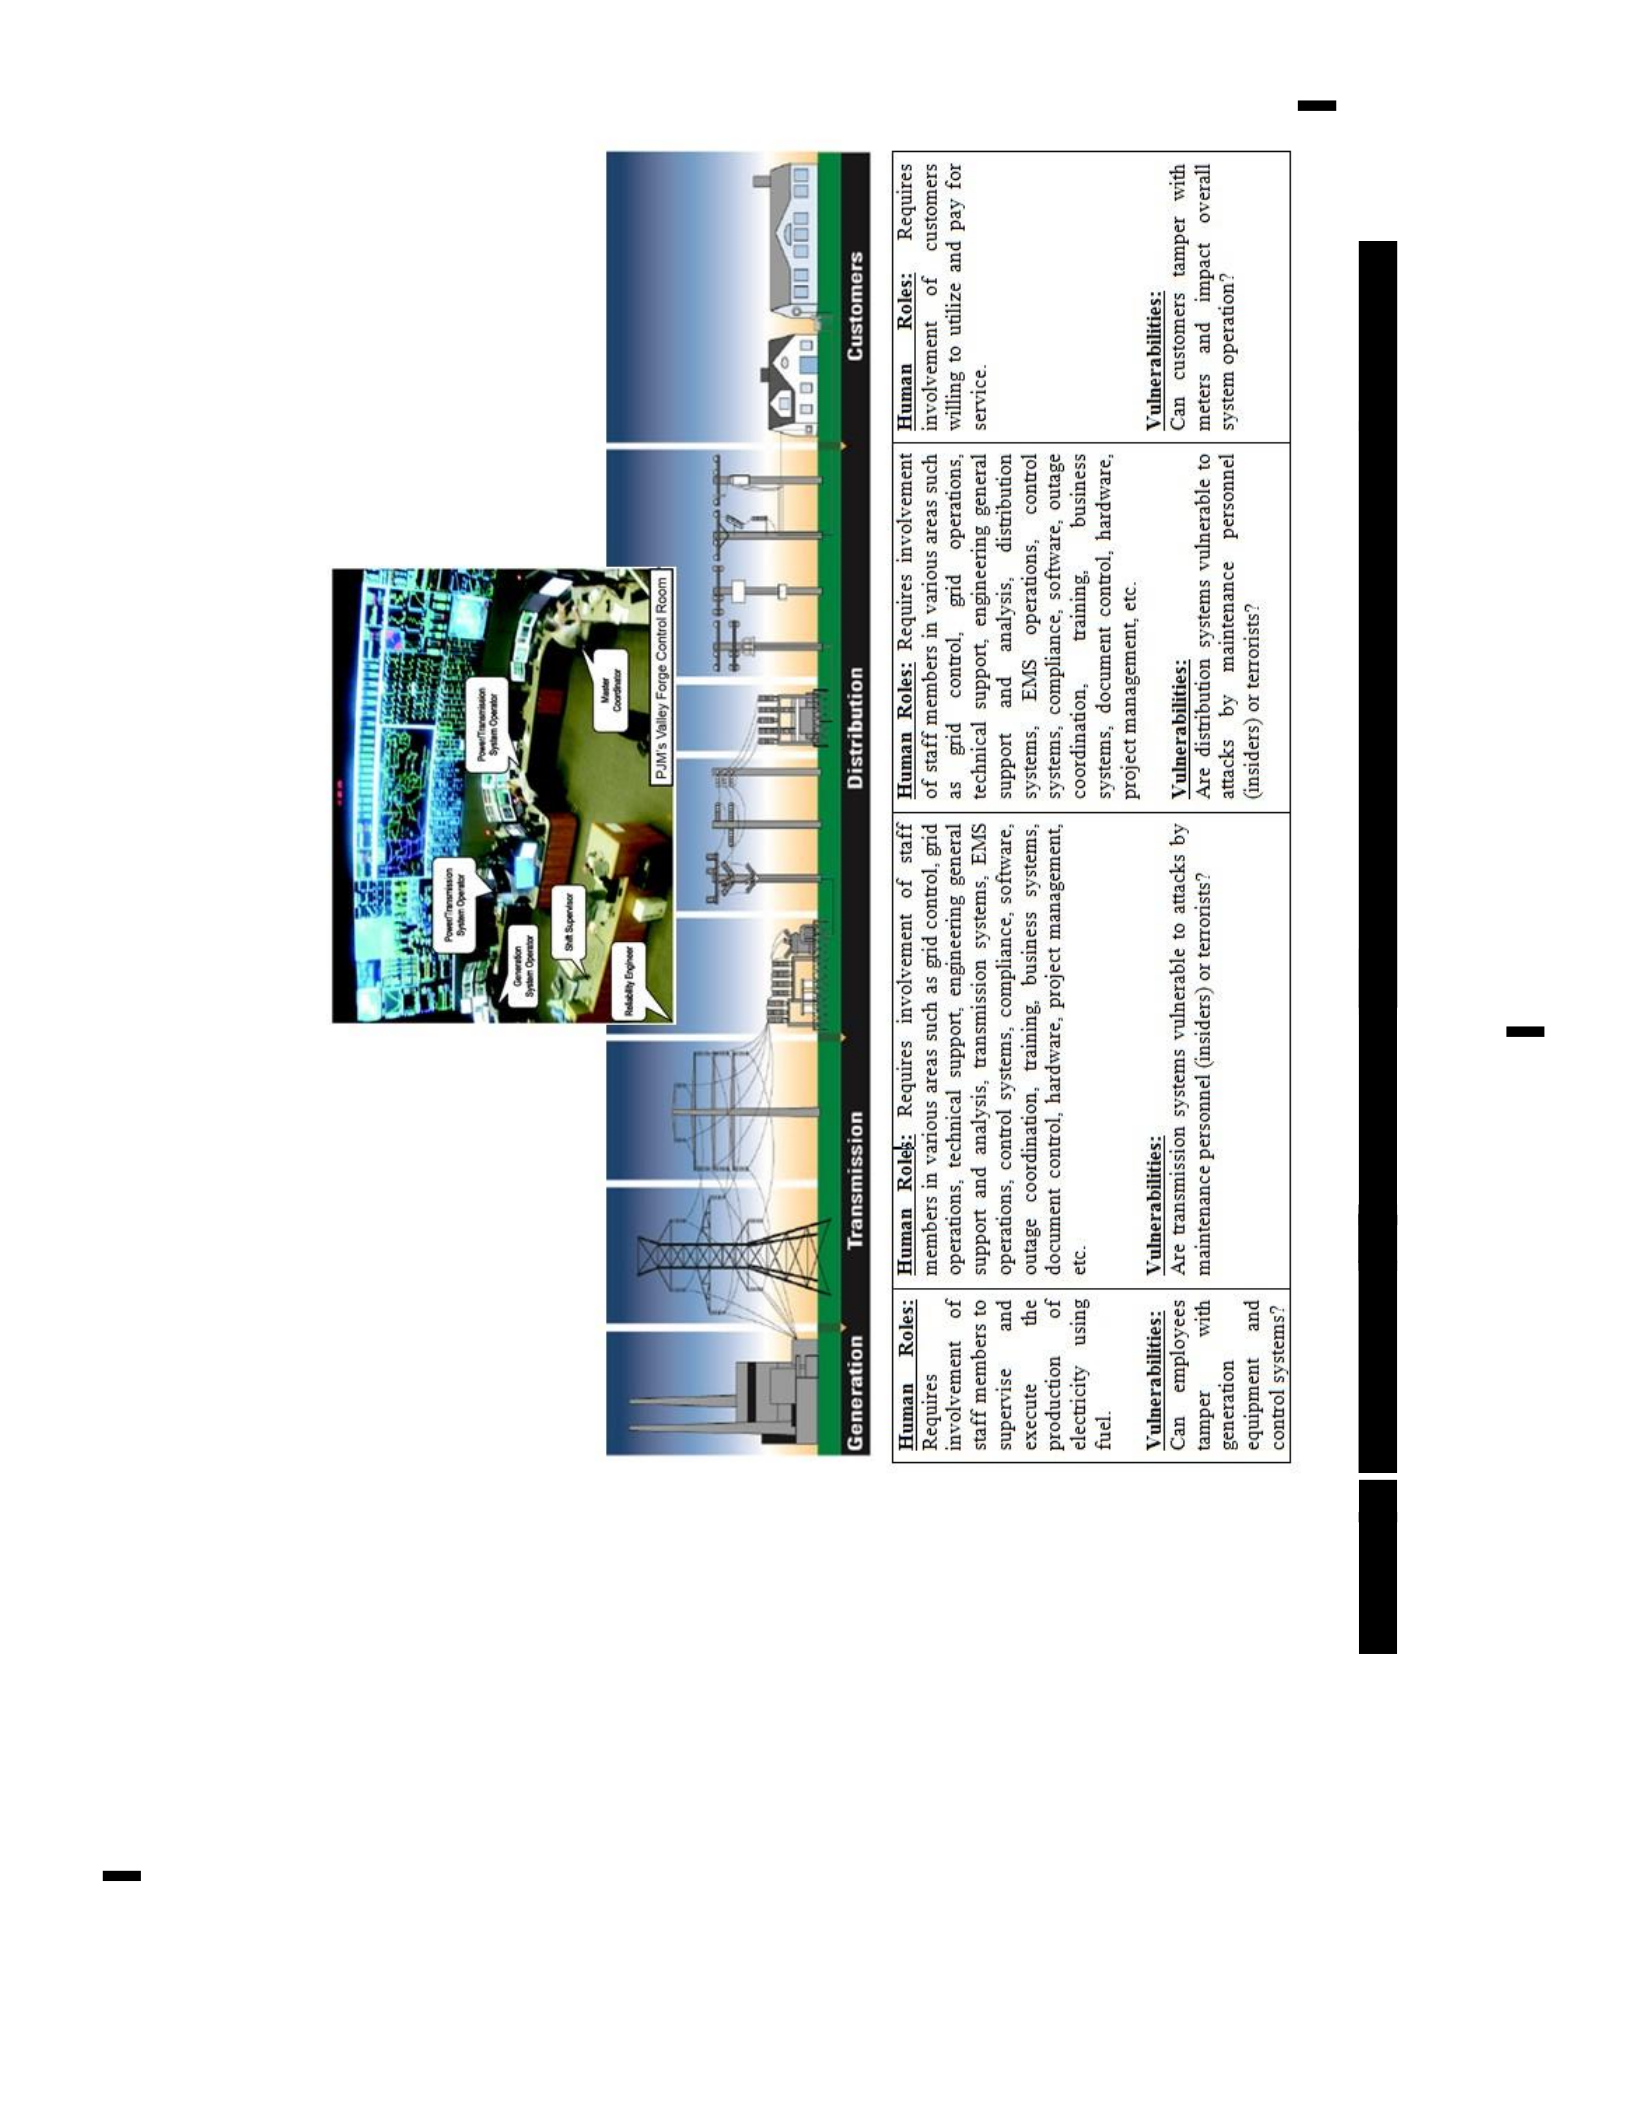
[E€LOz
‘SUsySIH
‘9107
‘OSoIq
ues]
suoTyer1odo
AYITIN
[BOLIO9[O
JOJ
W
MOIA
UeUIN_T
(uoneiado
waysAs
Jfezeao
yoedwm
pue
siajow
Tin
Jadure}
siewojsnd
ued
2seRTIqereuyn
|
“QDLATas
toy
Aed pue
ezyOn
o}
Suni
SIawO}JsND
«JO
JUAWIAATOAUI
sammbey
isajoyy=S
WRU
Ay
{SISUOLMA}
10
(sIaptsut)
Jeuuosiad
=s0ueUaJUTeEM
«Aq
syoEne
0}
a[QeIauNA
stajsAs
UONNGMSIP
zy
ISeHTIqerouN
A
"218
‘ueweseuew
193
foid
“‘QIEMpIeY
“JONUOD
yWeumMdIop
‘suaysAs
ssouisng
‘Sulurey
“UOQeUIPIOOS
aSeINo
‘areAjos
‘aduerdwuod
‘swajsAs
yonuo.
‘suoneiedo
sjyq
‘sutajsAs
uonnqmsip
‘sisAjeue
pue
yoddns
Jeieues
Suussuisue
‘woddns
yesuysay
‘suoneiedo
pus
‘Jomuod
pus
se
YoNs
seare
SNOUEA
Ul
Slaquiaw
Jyels
Jo
JUSWPATOAUI
salmMbsay
ueUMN_
{SISUOL}
JO
(SIapIsut)
JauUOsIed
2IUeUAIUIEU
Aq
SYDeNE
O}]
J[QeIOUTNA
sute}sAS
UOISSIMIsUeD
IV
Son
qeroun
|
“O18
‘Juawmeseuem
yafoid
‘aremprey
“JonUOD
JUaWMIOp
‘sulaysAS
SSauisng
“SUIUIeEQ
“UONEUIPIOOD
asE]NO
*‘QIEAJOS
“adueTduIOD
‘suaysAs
[OUD
‘suoneiado
SINT
‘StaaysAs
wolsstusueg
‘sisAyeue
pue
woddns
Jeieues
Suuseuisue
Yoddns
yeotuysa}
‘suoneiedo
Pls
‘JONUOD
PLUS
se
YOMs
seare
SNOURA
UI
sIaquiau
jyeis
JO
Wwewesjoaut
soimbey
‘joy
weumyA
{staysAs
JOQUOD
pue
juewdmbe
UONEIBUeS
TRUK
zadurey
seeAojdme
ued
7SaIIG
eran|
ee
Suisn
Ayoue72
jo
wononpoid
am
ayndexe
pue
astaradns
O}
Siaquisut
JyEIs
JO
JUSWPAjOAuI
soumbay
uewny
sigswojsnsy
te
oo
pos
aolg
|
—
/
Tee
a
py
en
memes
mm
WOOY
}OUCD
B04
ADEA
Sd
i
}
lL
—-)
r
or
et]
gh
Le
TTSesa
cots)
§
Tels
tel
trsy)|
Zp
Ons

4.2.3 HV-B1: Manpower projections
The HV-B1 for electrical utility operations shown in Table 4.1 is based on several
assumptions: 1) The job divisions within the company are those identified in Table 4.1,
which have been deemed to be necessary for the proper functioning of the company; 2)
Since electrical utilities operate 24 hours a day, employees must be present at all times; 3)
The workday is divided into three distinct shifts in which the system is maintained,
similar to the workday for many workplaces in the real world, with eight-hour shifts
beginning at 7:00 am, 3:00 pm, and 11:00 pm; and 4) The likelihood of a worker in a
certain job division being present is based on the perceived need for members in each job
division to be present, with all workers being present during the day shift (7:00 am to
3:00 pm) and only critical, safety-related employees and possibly trainees and managers
being present at other times.
The model, including these perceived likelihoods and categories of job divisions,
is included in Table 4.1. In Table 4.1, on the vertical axis, the hours of the workday are
shown beginning at midnight and ending at the following midnight. The HV-B1 helps
analysts to determine whether there is a high (H), medium (M), or low (L) likelihood that
a specific group of employees will be present during any one of the three shifts. For
instance, among the types of employees listed on the horizontal axis at top, engineers are
shown as having a “high” likelihood of being present during all three shifts; this is the
case because engineers’ presence is critical at all times for the safe functioning of the
system. On the other hand, employees related to business and human resources (HR) are
more likely to be present during the daytime (regular hours), but they are less likely to be
present at night simply because they are not integral for the functioning of the system at
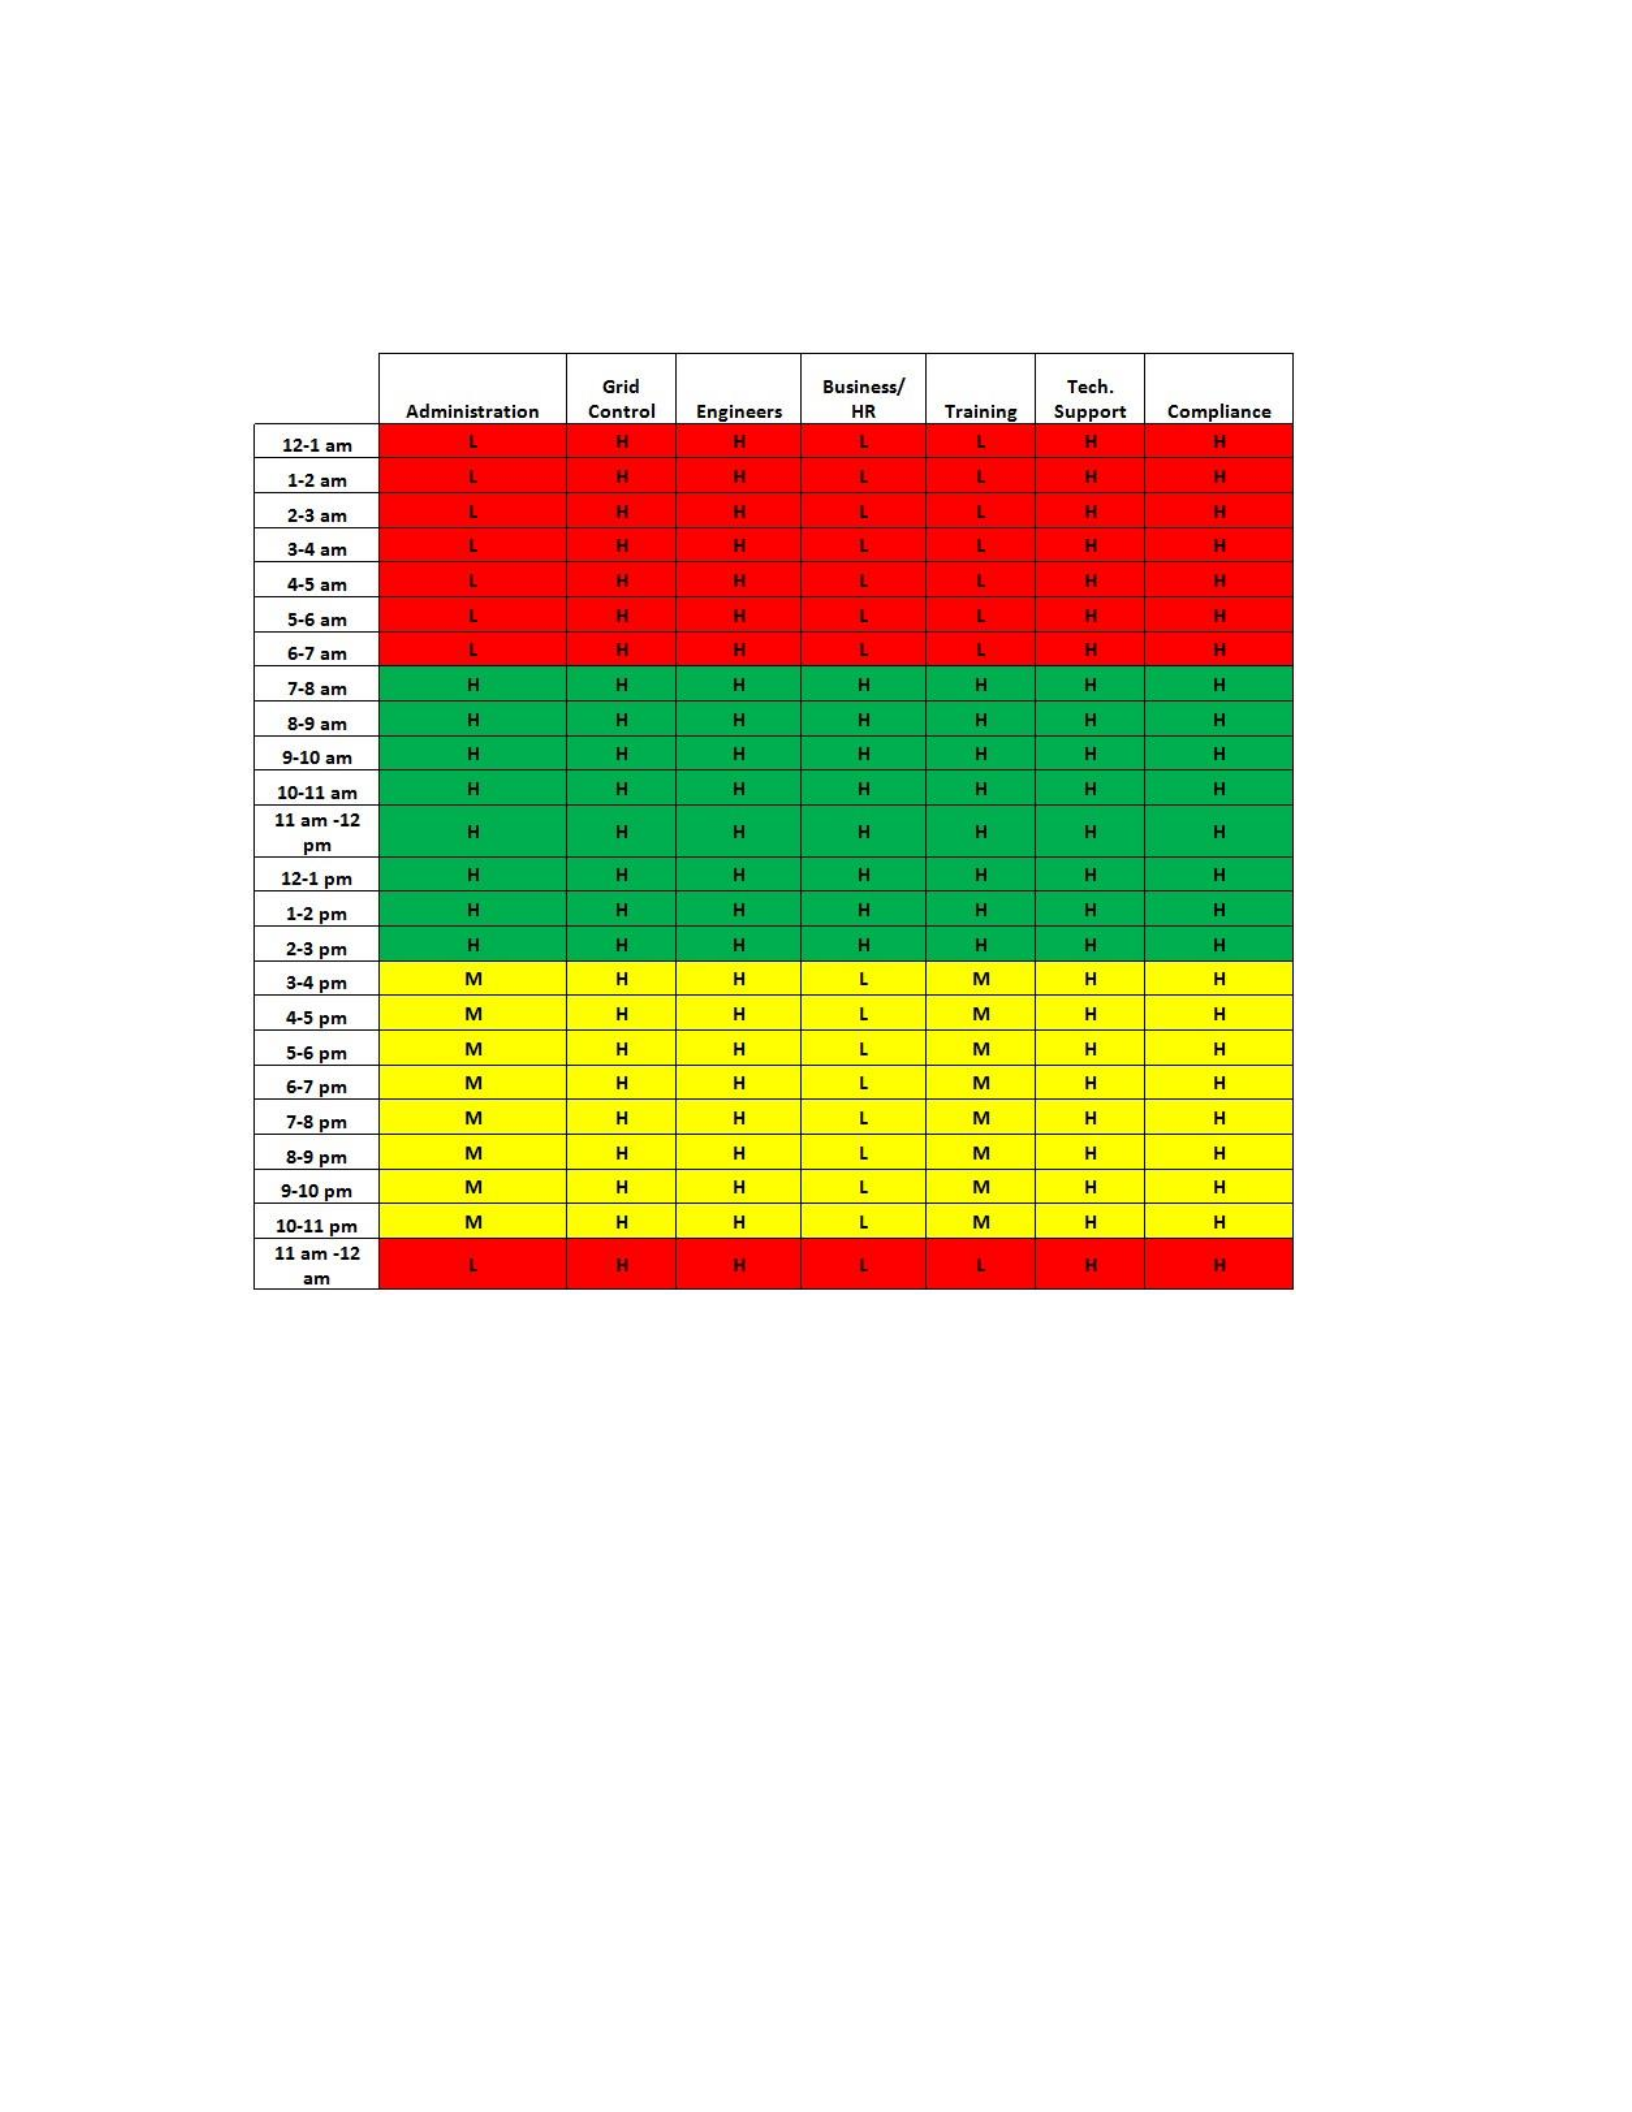
that time. In other words, they can accomplish necessary tasks such as hiring and
disbursing payroll during the day shift, but they are not needed for such tasks at night.
Table 4.1 Human View B1 for job divisions and shifts of the electrical utility system
In terms of predicting at which time of a day an insider threat is most likely to be
successful, this view indicates when particular employees are most likely to be present
without supervision. As previously discussed, engineers are highly likely to be present
during all three shifts, but business and HR workers are probably present only during the
main day shift (7:00 am to 3:00 pm). If someone is intending to perpetrate a malicious
action, it is probably easier to do so when fewer employees are present to watch their
actions and practice surveillance [Brass et al., 1998]. The evidence from the HV-B1

indicates that the day shift has a greater likelihood of many employees being present to
practice surveillance. A color-coded range of times is used to indicate the relative
supervision level for a given time of day, with red denoting the least-supervised shift,
yellow denoting the shift with a moderate level of supervision, and green denoting the
most-supervised shift. Since the day shift (7:00 am to 3:00 pm) had already been
identified as the shift where people are most likely to be present, its hourly ranges were
color-coded with green. The next shift, 3:00 pm to 11:00 pm, includes employee
categories such as training and administrative staff that may be present but are not
guaranteed to be so, so its hourly time ranges were made to be yellow. Finally, the last
shift, 11:00 pm to 7:00 am, is believed to represent the time of day when only critical
safety-related employees like engineers would probably be present; for that reason, it is
color-coded with red. HV-B1 thus provides a clear picture of the manpower requirements
for a given time of day and illustrates when workers are more and less likely to be present
to practice surveillance against other employees that might pose an insider threat.
4.2.4 HV-B2: Career progression
The HV-B2 for electrical utility operations shown in Table 4.2 is used to indicate
the skills and competency requirements for substation maintenance electricians. This data
is from PG&E’s substation maintenance electrician apprenticeship guidelines [Pacific,
2011]. The HV-B2 only captures one job category, so one of these views will need to be
developed for each job category when a utility uses this method. For the given
apprenticeship, the employee must complete the courses listed in the center column and
the on-the-job training indicated in the right-hand column. For instance, during level 2 of
career advancement, an apprentice must complete the following classes: Introduction to
Schematics and Power Circuit Breakers. According to the HV-B2, the apprentice must

also successfully complete 13 tasks including Task 5.1 – Qualified to Install Flex Conduit
to advance to the next stage of the apprenticeship, level 3. This view’s significance is that
it provides a clear indication of what requirements are necessary to advance into higher
positions within the employment hierarchy, which provides an obvious pass-fail metric
for career advancement and for the analyst to see what skills employees at a specific level
have.
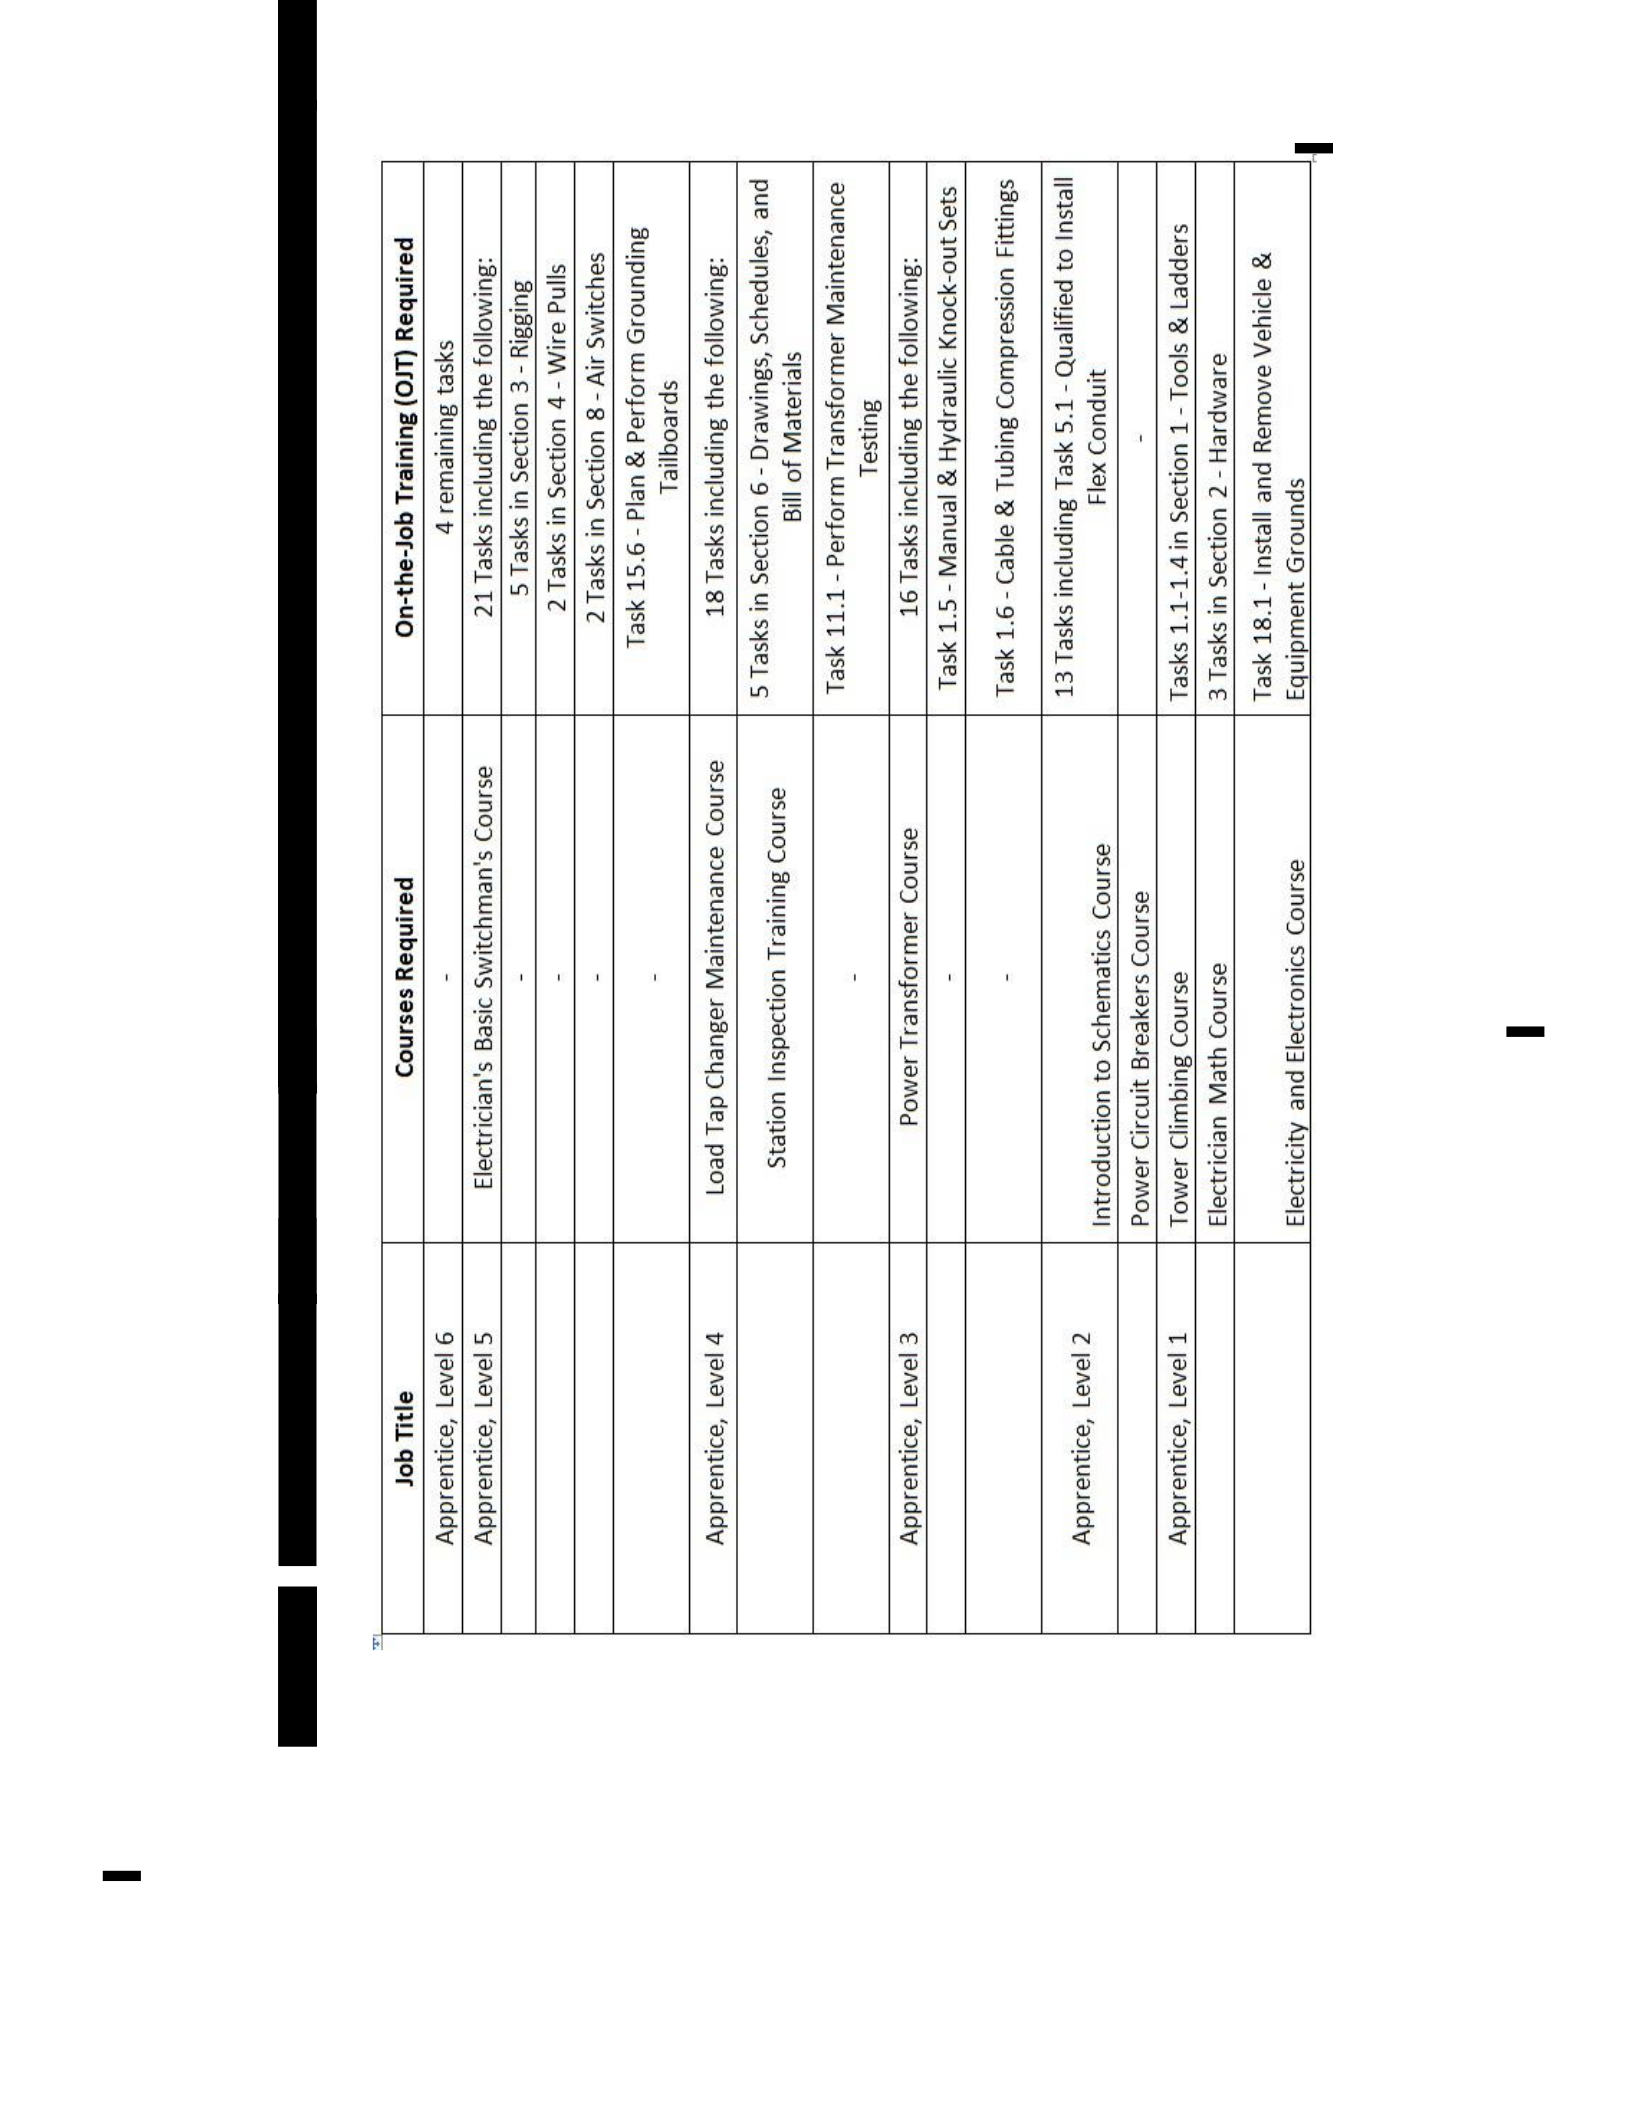

In terms of insider threat analysis, the architects can determine which workers
have the given skills to perform certain malicious actions against the electrical
transmission and distribution system. For instance, if the analyst wants to see which
employees have the capability to exploit power transformers because they are vulnerable
to attack, they would evaluate the record of level 3 apprentices and above since those
individuals have power transformer knowledge and skills. Because insider threat analysis
may be lengthy and time sensitive, the use of HV-B2 can provide assistance with a
relatively fast and easy metric to see which workers meet the minimum knowledge
standard necessary to exploit a particular vulnerability.
4.2.5 HV-B3: Establishment inventory
In electrical utility operations, it is important to understand the manpower
required to maintain operations. The HV-B3 shown in Table 4.3 uses data from the
federal Bureau of Labor Statistics to forecast the number of workers needed in specific
job categories in the electrical transmission and distribution sector with information
collected for 2014 and projected to 2024 [Bureau, “221100” 2015; Bureau, “17-2070”
2015]. This view shows the relative number of employees expected to be needed in a
category of workers and the growth prospects of a particular type of job in the economy
over the next several years. For instance, Table 4.3 indicates that the number of needed
electrical and electronics engineers for utilities involved in electric power generation,
transmission, and distribution will experience a net shrinkage of approximately 1,900
jobs over the decade following 2014.
Table 4.3 Human View B3 data [Bureau, “221100” 2015; Bureau, “17-2070” 2015]
Years for Employment (in thousands)
Type of Manpower
2014
2024 (projected)

Electrical and electronic
equipment mechanics, installers,
and repairers for utilities involved
in electric power generation,
transmission, and distribution
15.8
14.2
Electrical and electronics
repairers, powerhouse, substation,
and relay for utilities involved in
electric power generation,
transmission, and distribution
14.5
13.0
Electrical and electronics
engineers for utilities involved in
electric power generation,
transmission, and distribution
17.9
16.0
From a security vulnerability perspective, the HV-B3 assists in determining, if
crudely, the likelihood that a particular type of worker might be needed in the coming
years, and it can be coupled with other analysis of specific employee behavior to
determine if they would potentially be malicious if laid off. If particular kinds of
employees are not as likely to be needed or feel that they are becoming “expendable”
because their skills are not needed as much as they were needed previously, those
employees might be more likely to pose a threat to the organization for which they work
because of resentment. This view would have to be coupled with other psychological
factors, but could be an initial flag to an organization to begin to review specific
employee records based on upcoming workforce projections.
4.2.6 HV-B4: Personnel policy
The HV-B4 in Table 4.4 describes a subset of the regulations, laws, and policies
applied to particular positions at the SDG&E [2016]. One policy that is likely applicable
to at least some of the employees would be 29 CFR 1926.950(b)(2), which details the

requirements for training qualified employees for constructing new and altering existing
electrical transmission and distribution lines [Occupational, 2015]. This requirement is
indicated as being applicable or not applicable to a particular job title by using a “Y” for
“yes” or an “N” for “no” in the applicable box in Table VI. For instance, the training
required by 29 CFR 1925.950(b)(2) for qualified employees appears to be more
applicable to persons having a direct interaction with the electrical grid, such as the Sr.
Engineer; on the other hand, the Grid Business Process Manager, who is responsible for
tasks such as contracting and invoicing, probably does not do direct work on the electrical
grid system itself, so her job has an “N” listed, evidencing that the requirement is not
applicable to her job responsibilities [San Diego, 2016].
Table 4.4 Personnel policies applicable to senior level employees [Pacific, 2011; San
Diego, 2016]
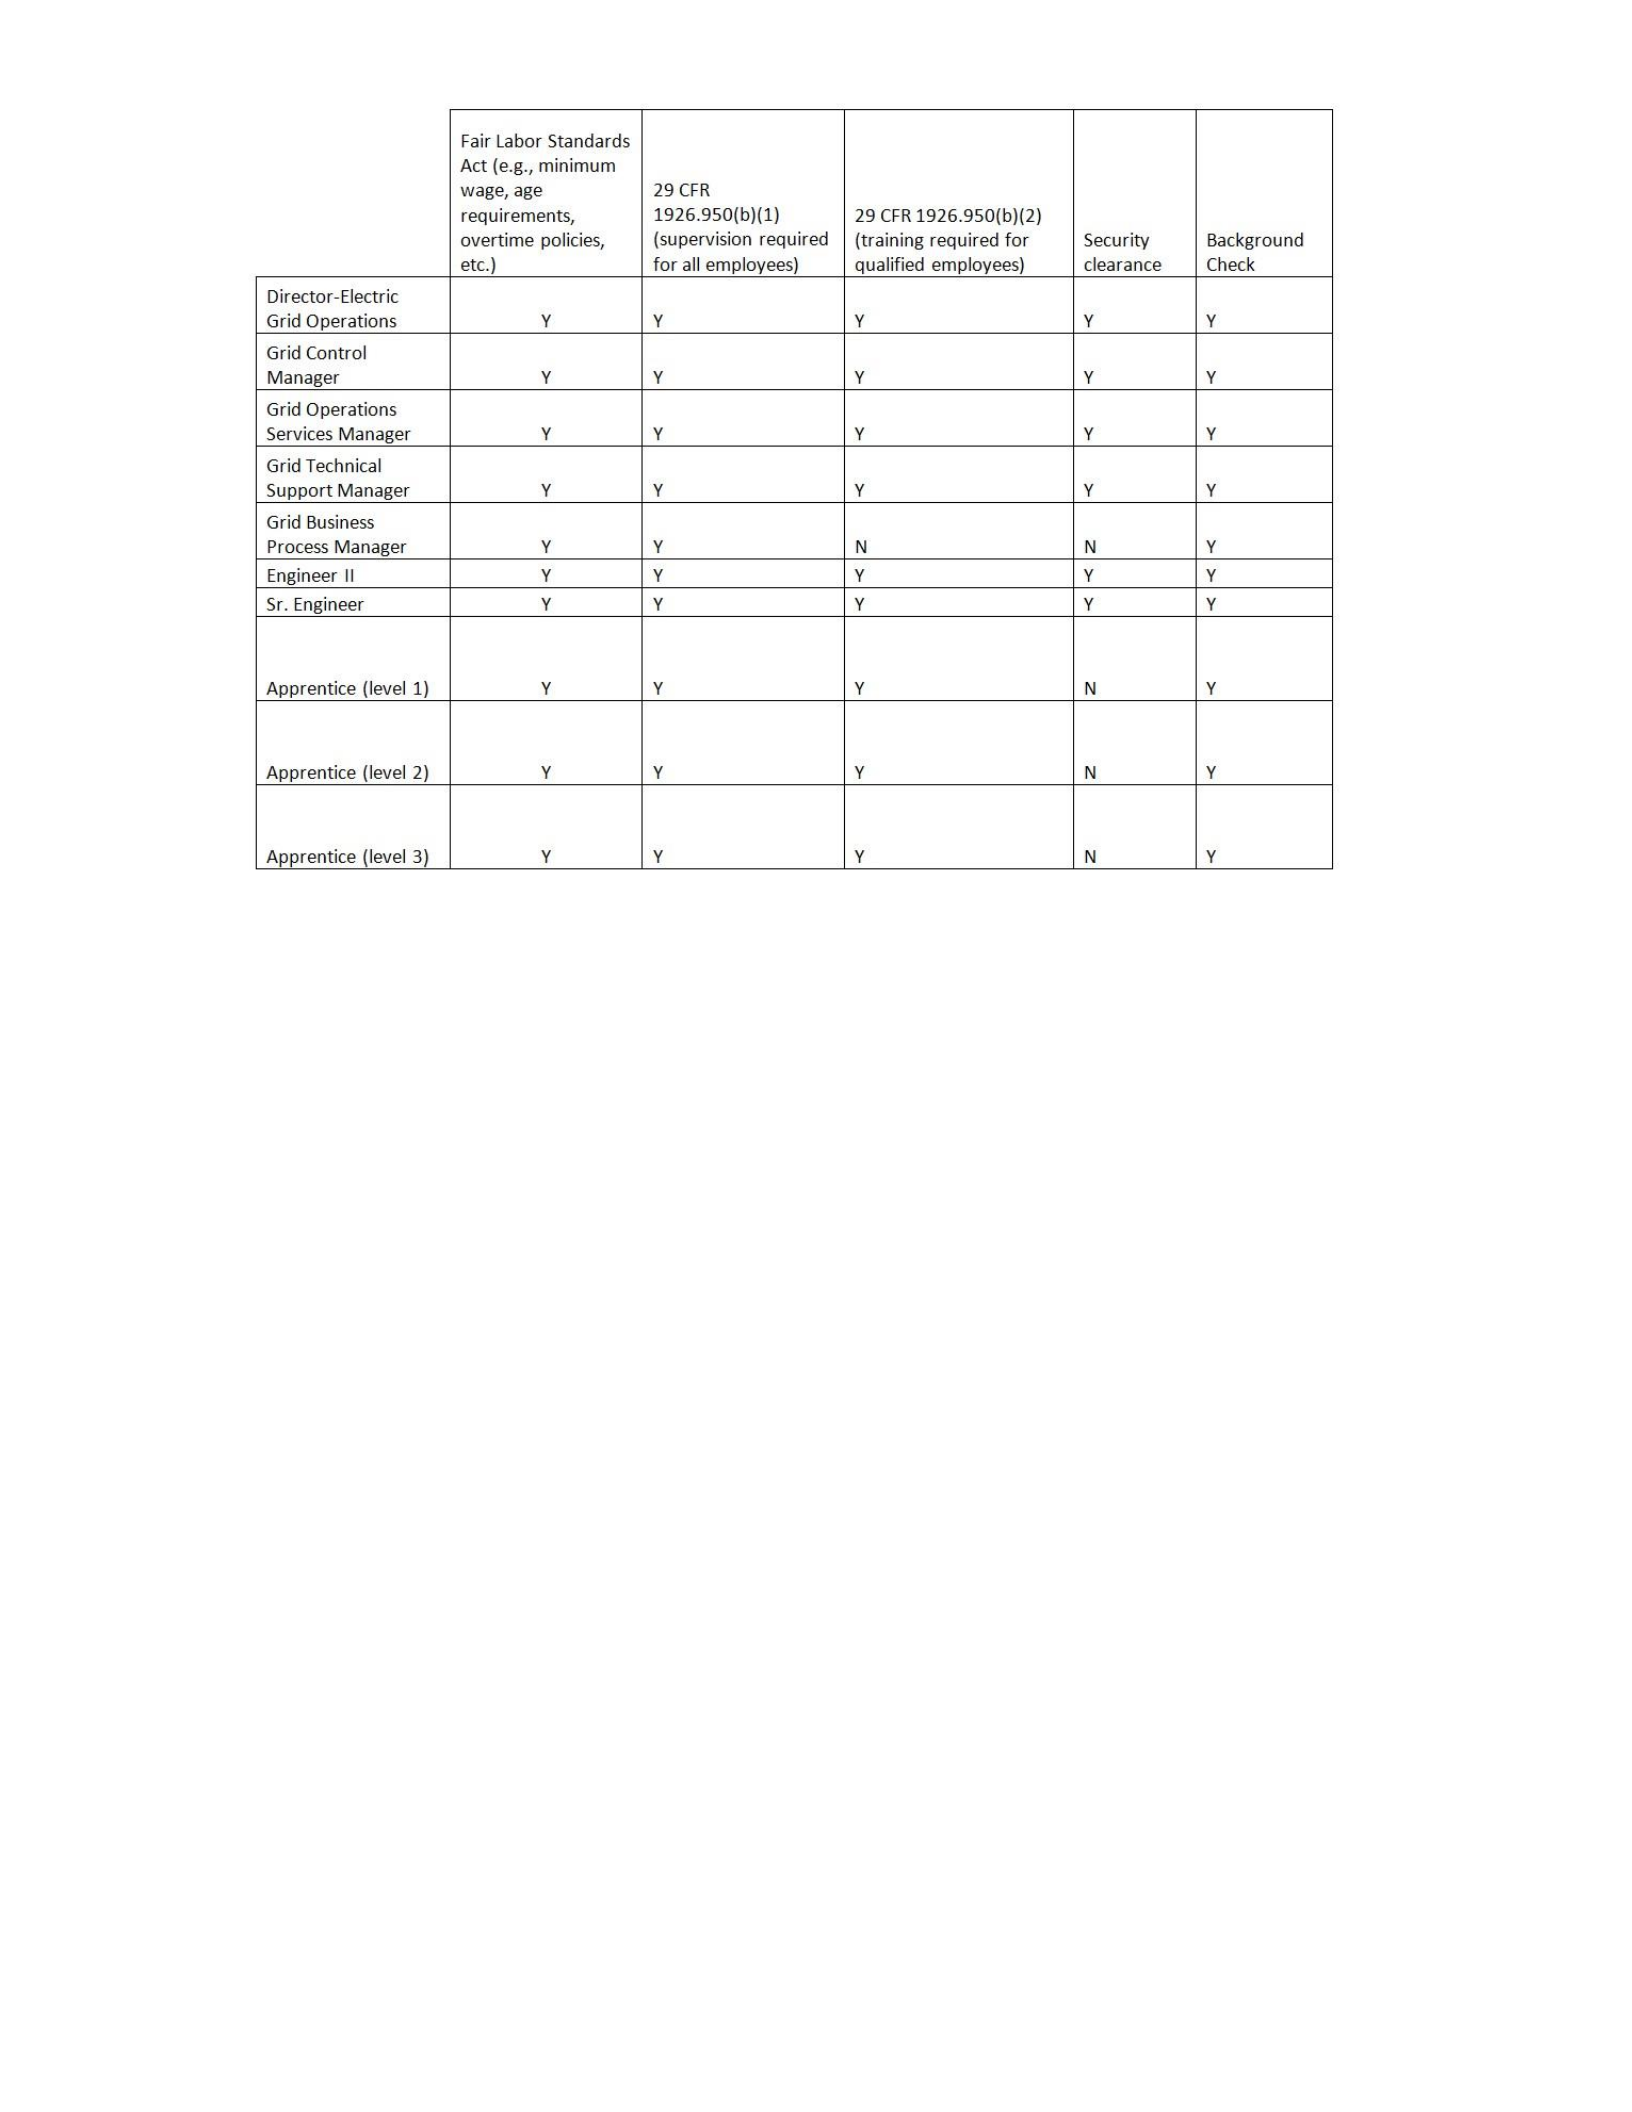
The HV-B4 is useful for VA because analysts can determine which employees are
more prone to engaging in threatening behavior by detecting which of them are subject to
certain types of regulations (e.g., supervisory regulations). It is possible that those
persons’ subject to more supervised training would have more time to be evaluated by
others as malicious or not and may have been more likely to have been identified already
as constituting potential insider threats. In contrast, those not subject to supervisory
regulations, such as the Grid Business Process Manager, may be more likely not to have
been identified as insiders. While this example is very situation-dependent, it gives an
idea how this information can be used.
In addition, some security clearance and background check requirements can help
determine which employees seem more prone to questionable behavior than others. For
example, the Document Coordinator, because his business-related job is the least closely

connected to the electrical grid operations, may be a lower priority to require a special
security clearance among all of the relatively senior officials listed in Table 4.4. Although
the Document Coordinator is also less likely to be exposed to sensitive information, it
does indicate that he or she is less likely to be detected if he or she chooses to act
maliciously and tries to steal sensitive information that is known to employees with
whom the Document Coordinator interacts daily. In such a case, insider threat analysts
can have a means with which to determine which employees might be the most dangerous
– by detecting which ones are not subject to additional security checks like background
checks and by seeing which ones are subject to supervision (even indirect supervision)
while learning to perform their jobs. Some of the available information from HV-B4, as
applied here, can help to detect such individuals.
4.2.7 HV-B5: Health hazards
HV-B5 is a view related to Human Factors and Ergonomics (HFE) that considers
the characteristics of a system that could injure its users or participants [NATO, 2010]. As
shown in Table 4.5 below, various health hazards can be determined and are listed
together at the left side of the table with their relative occurrence rates and proposed
solutions as categories. Whether the hazard is short-term or long-term is also noted in the
figure in the fourth column. An example of a potentially dangerous characteristic is falls,
slips, and trips, which caused 540 accidents in 2014 in the electrical transmission and
distribution utilities sector. A proposed solution, listed on the right of the row for that
hazard, is putting treads on floors in certain areas to minimize slippage. Additionally, the
hazard is marked with an “S,” meaning that it is a short-term hazard, because generally a
fall, slip, or trip takes place almost instantly and does not require much time to cause
serious damage.
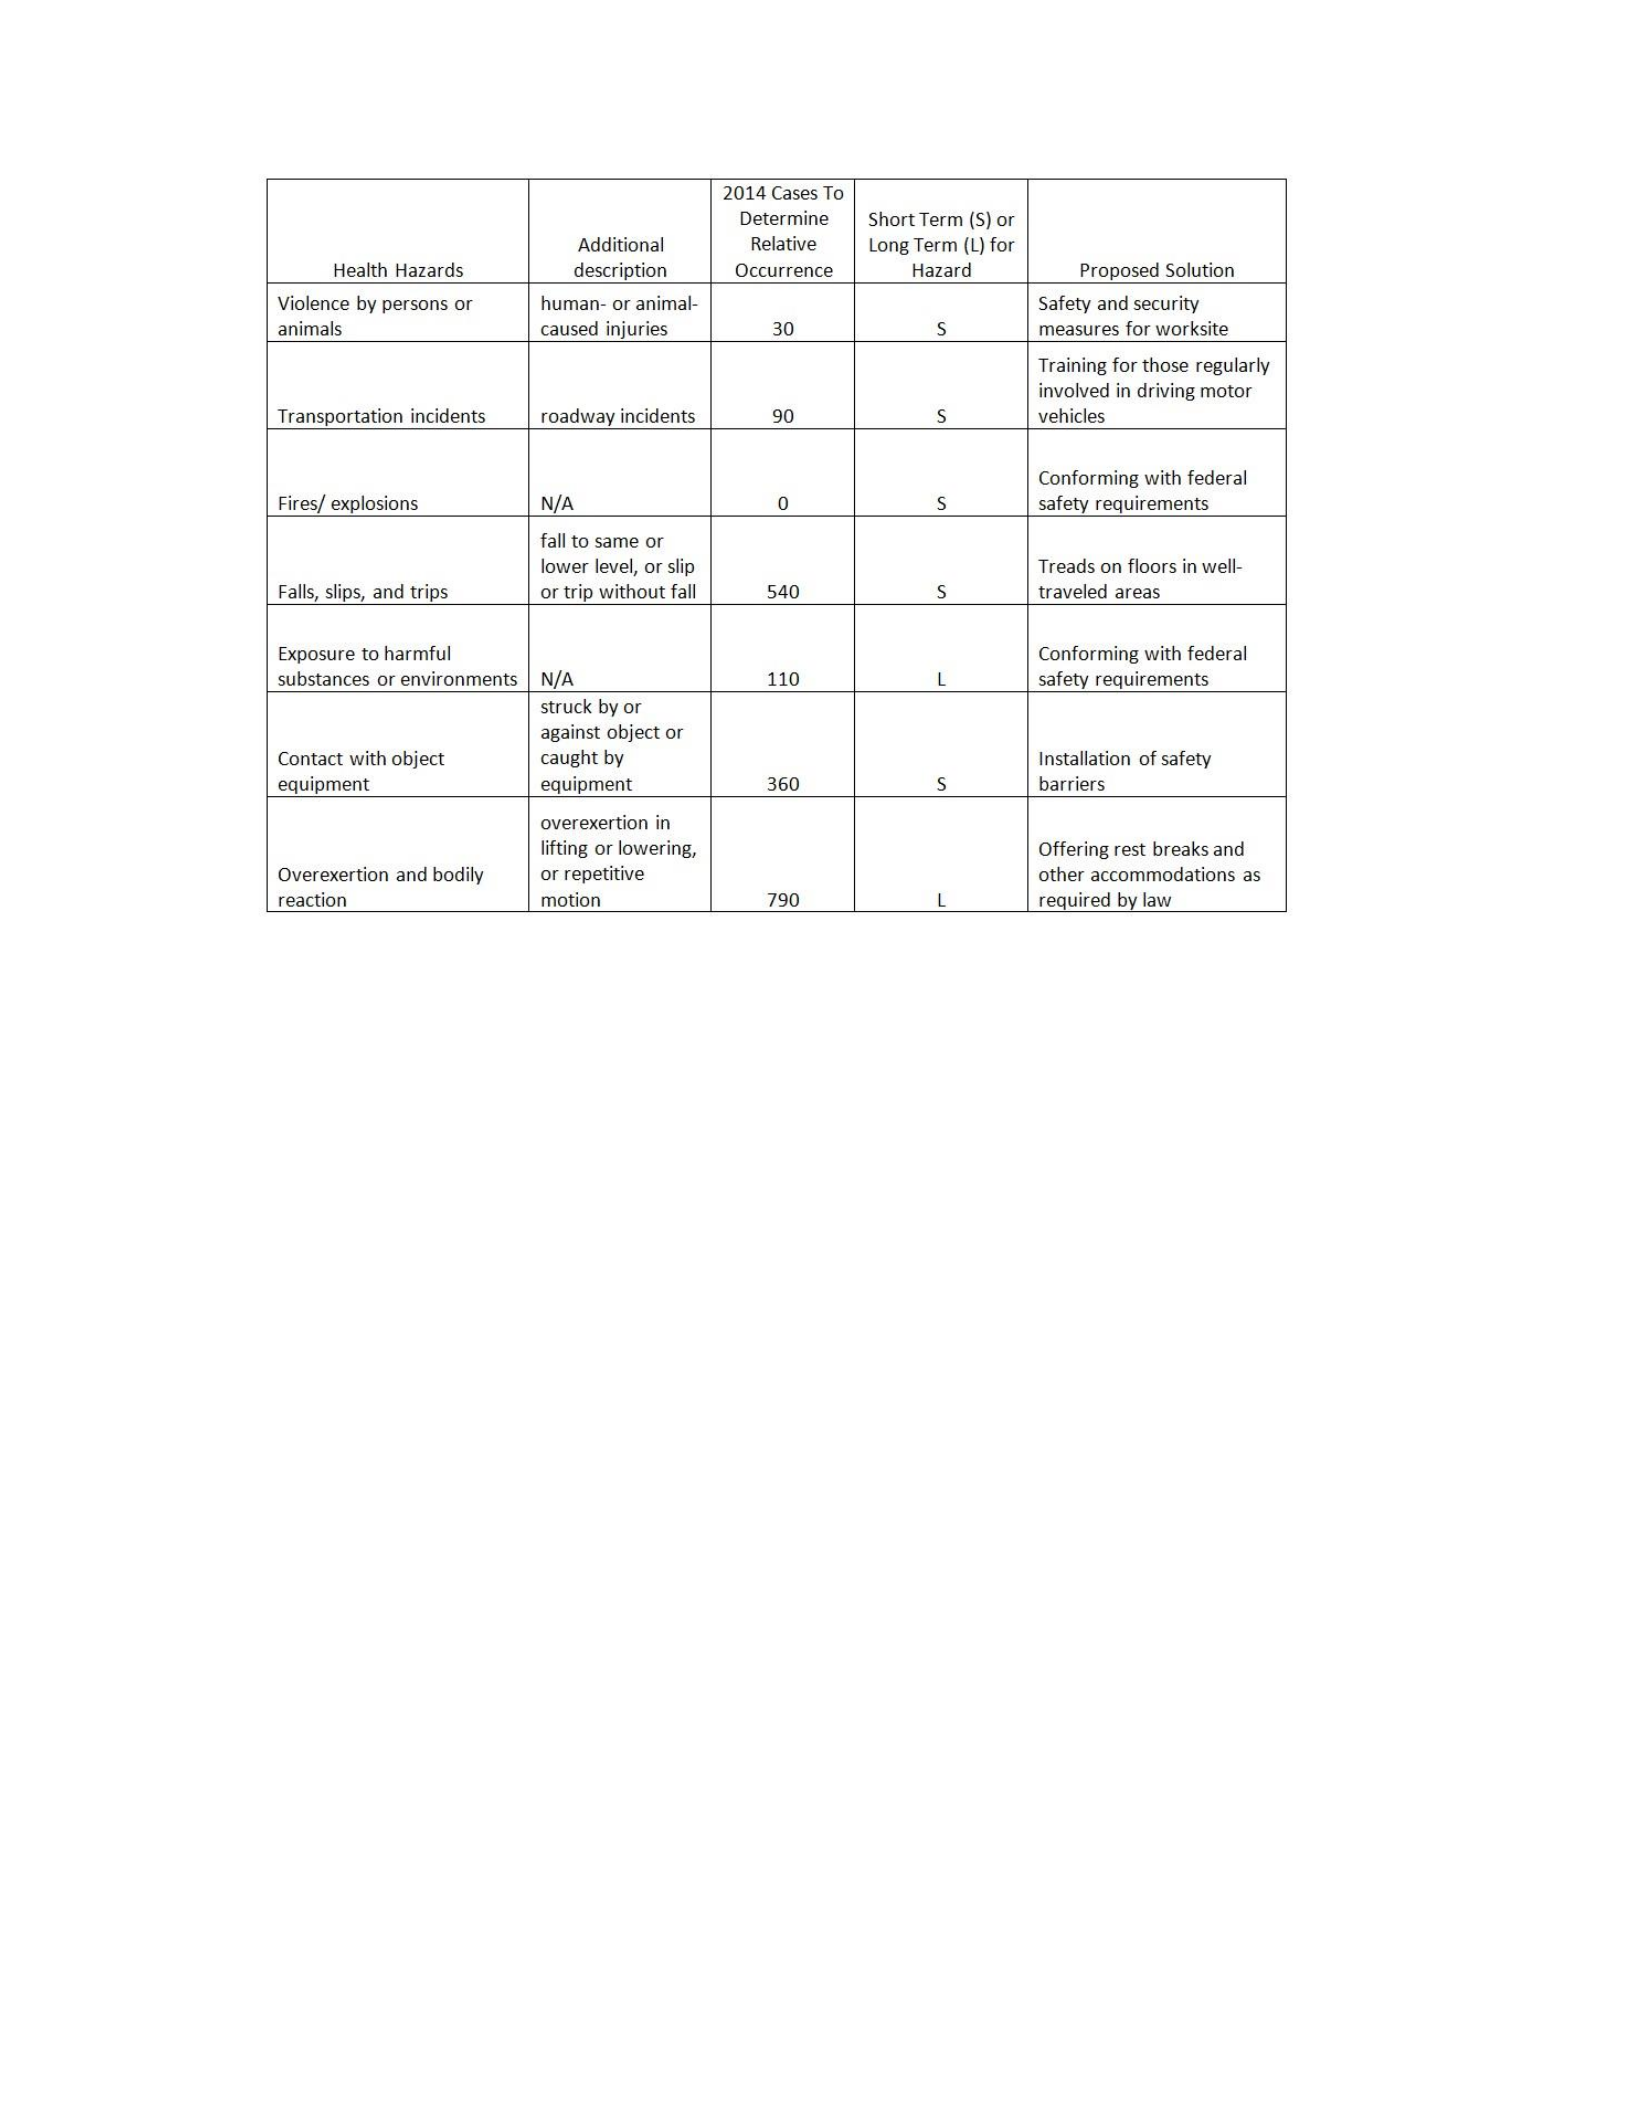
Table 4.5 Listing of potential health hazards for employees
From the perspective of an insider threat analyst, HV-B5 can give an idea of how
an insider could potentially cause damage to those around him so as to decrease
supervision and act maliciously with a decreased fear of being discovered. For instance,
one health hazard listed is “violence by persons or animals.” In that context, someone
could expose his or her co-workers to the possibility of violence, whether by physical
means (e.g., bringing a handgun to the workplace) or by cyber means (e.g., sabotaging a
computer system such that safety warning messages are not shown when hazards are
present). A pattern in these types of safety issues coupled with a specific individual’s
involvement several times might be a red flag. Constructing a model for HV-B5 can assist
analysts with identifying methods of potential threats. Furthermore, the category
including overexertion has a relative occurrence of 790 injuries in 2014. Although
overexertion might be thought of as just a personal, physical problem, it could also pose a

threat because overexertion can cause cognitive fatigue and decreased vigilance – the
perfect elements that an insider could use to act with a lessened worry of discovery
[Gawron, 2015]. These are the type of vulnerabilities that may not be exposed in a
traditional VA but are brought to the forefront when analyzing with the NATO Human
View.
4.2.8 HV-B6: Human characteristics
The Human View B6 (HV-B6) shown in Table 4.6 is based on assumptions that
will be explained further below and is another view properly placed in the HFE category.
In the HV-B6, the architects can consider the characteristics required for an employee to
complete the tasks required for his or her position in the organization: for example, the
ability to lift up to 25 pounds [NATO, 2010]. This particular case study considers the
multitude of people employed at the organization and determines the number of workers
that must satisfy a given requirement. The assumptions required for the data include the
following: 1) The various categories of attributes needed for employees within the
organization include physical, sensory (e.g., visual and auditory), cognitive, and
securityrelated attributes, as an example, and 2) based on the perceived need for a given
attribute within the organization, the number of jobs to which the characteristic seems
applicable has been chosen as all, most, many, some, or none, to more easily illustrate the
data in Table 4.6. As an example, some engineers may need to lift large weights if they
deal with machines with heavy parts, but HR employees probably do not have to lift large
weights because they deal with business- and human-related tasks; consequently, such a
characteristic would seem to apply to “some” workers in the organization.
Table 4.6 Listing of required attributes for employees
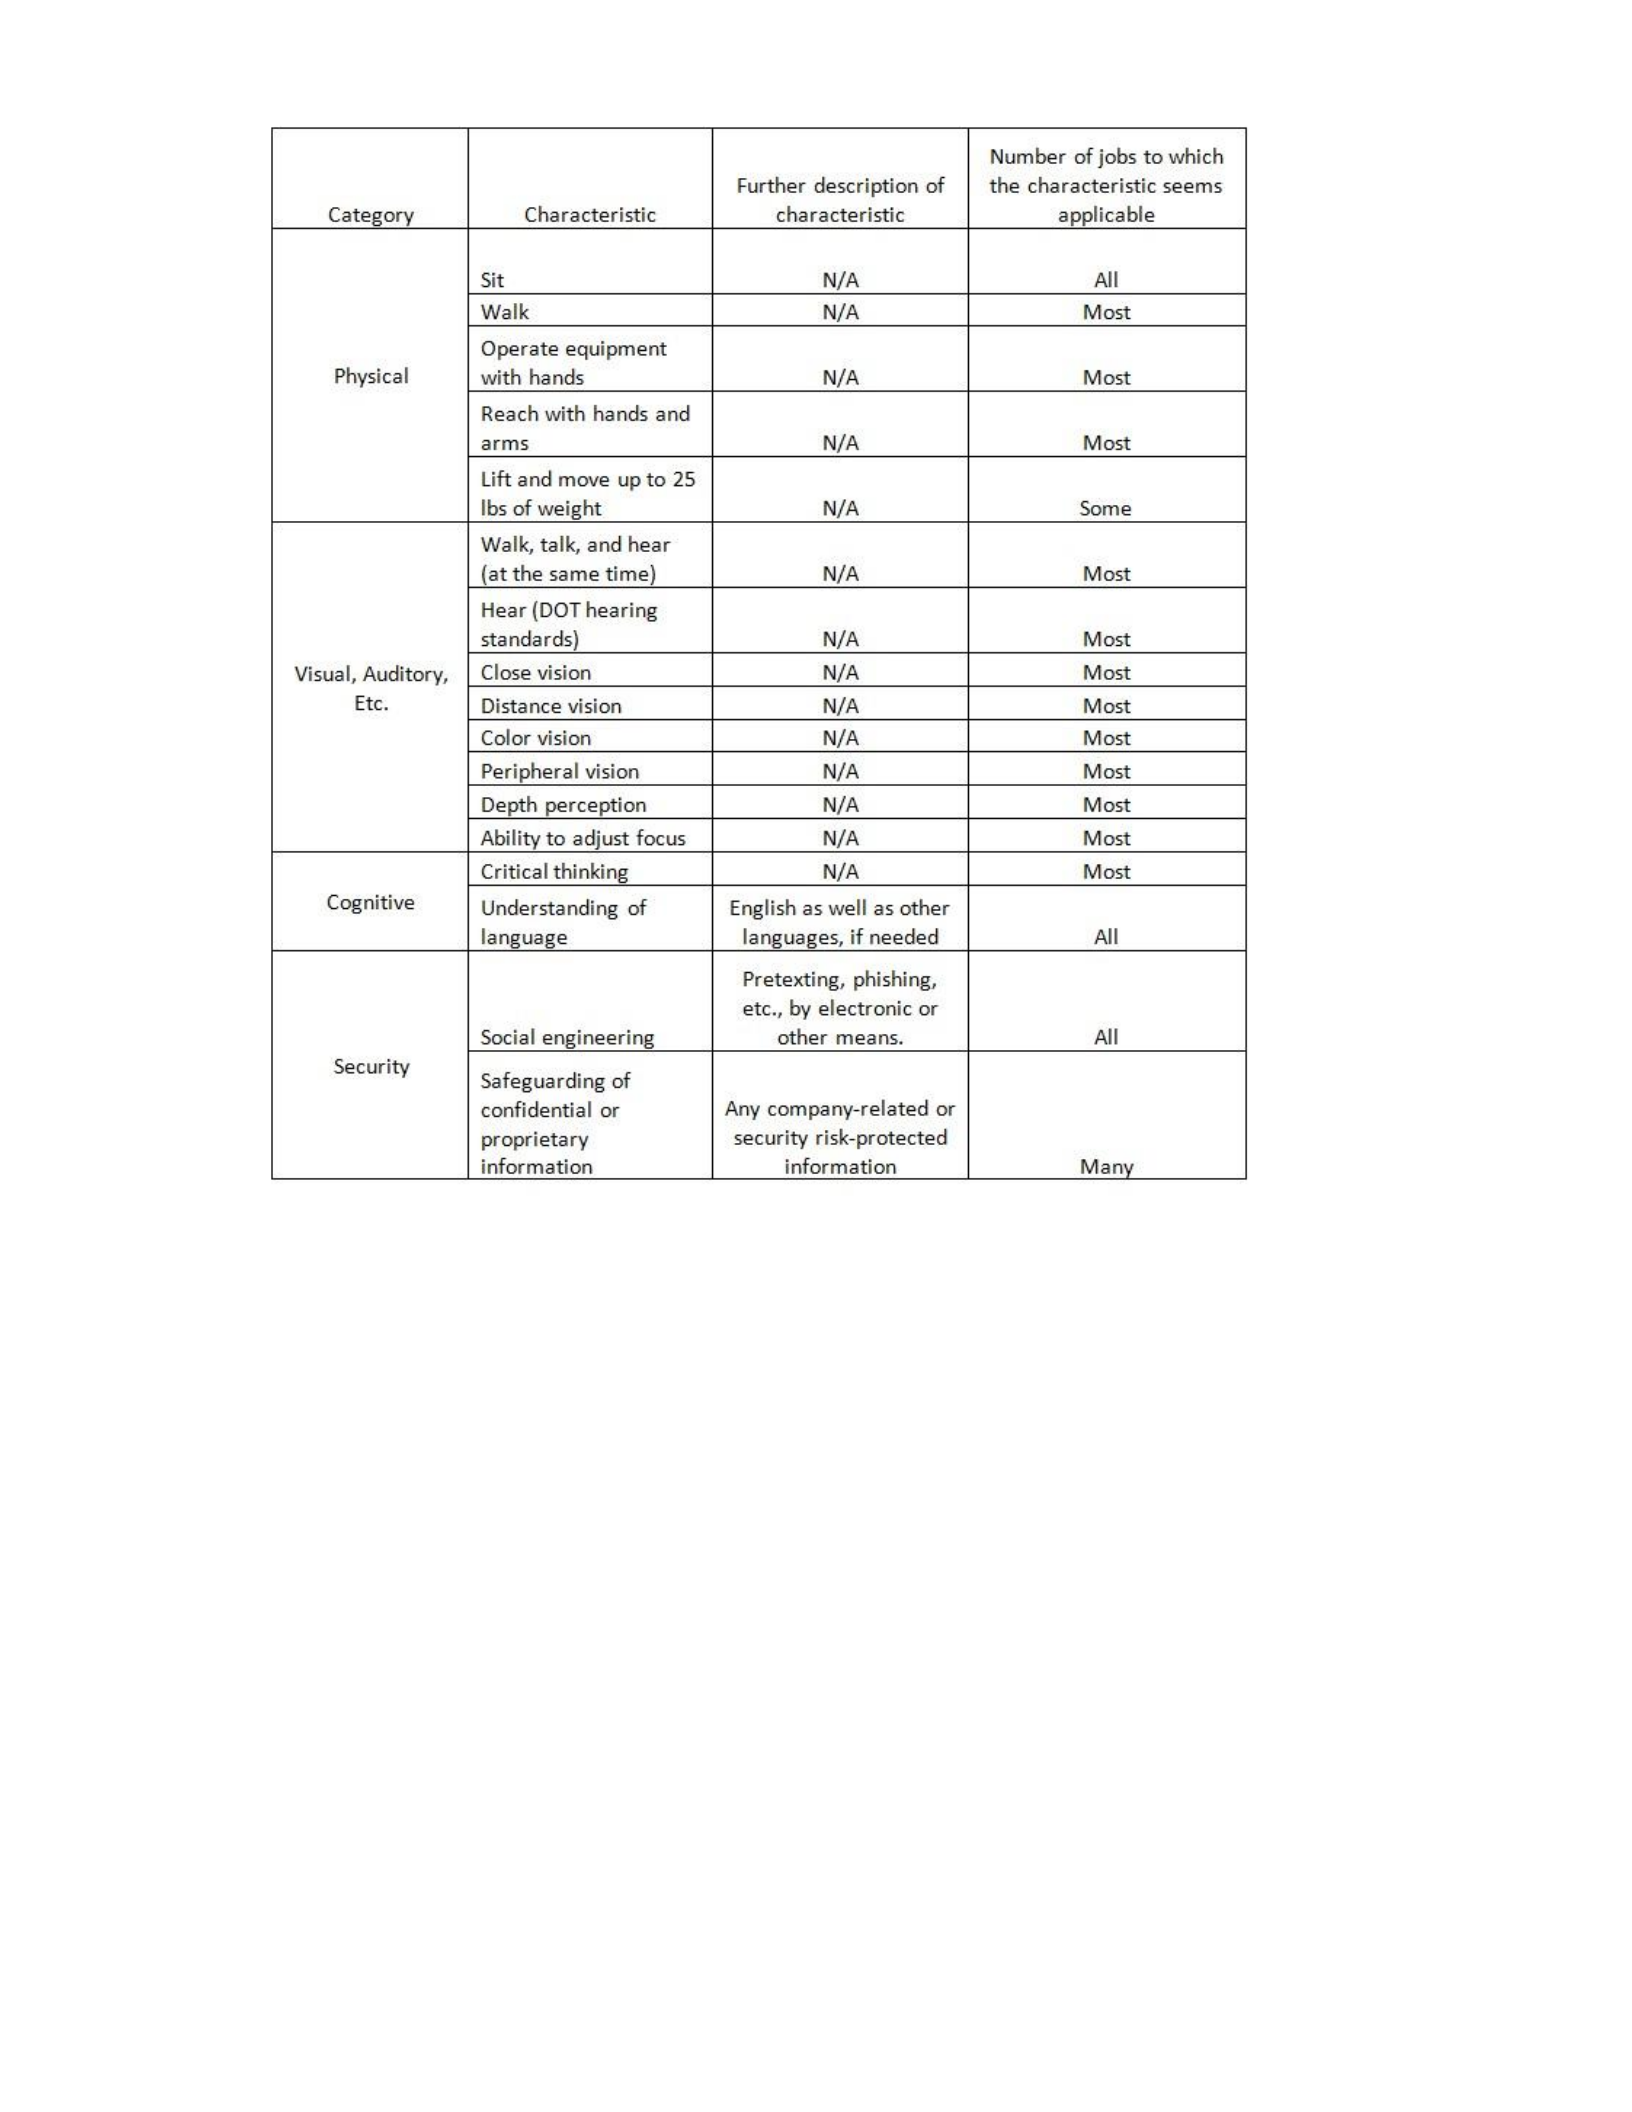
This type of NATO Human View product can help insider threat analysts by
informing them about which employees need security-related abilities and competencies
to perform their job duties. For example, the security category includes the ability to
safeguard confidential or proprietary information. Electrical utility employees have
access to information that should be safeguarded. This information can be useful if
insider threat analysts are concerned about the potential disclosure of confidential or
proprietary information by employees. They can tell that many employees are given at
least some amount of access to either confidential or proprietary information and can
exclude the fraction of workers that are not subject to the requirement from surveillance,
which could save time and money.

Table 4.6 contains high level data, but, depending on the risk of this threat to an
organization, this view can be further detailed to show the specific proprietary
information mapped to specific employees that have access. Such pre-work could reduce
the time needed to determine possible insiders if there was ever a security issue.
4.2.9 HV-C: Tasks
An HV-C for electrical utility operations is shown in Table 4.7. The HV-C
indicates the order of the tasks required for apprenticeship candidates to complete in
order to advance to a higher stage, which constitutes a higher skill level. Additionally, the
table shows the relative ability of an apprentice at each stage of apprenticeship to exploit
system vulnerabilities. For this case study, the levels of apprenticeship are defined as
“low”, “medium,” and “high” in terms of the ability to exploit vulnerabilities. In other
words, the apprentice will have the capability to perform much more complex exploits of
vulnerabilities once she has attained one of the top two levels of apprenticeship by
undergoing extensive training. As the apprentice proceeds to higher levels, she has the
means to act maliciously in a way that she did not at a lower level of training. For
example, once the apprentice at stage 5 has completed tasks related to substation
inspections, the apprentice may be more knowledgeable about the vulnerabilities of the
overall system and better able to exploit such vulnerabilities from within the system.
Table 4.7 Listing of tasks required for apprenticeship advancement and ability to
exploit system vulnerabilities

In terms of indicating an insider threat, this category of NATO Human View
product can demonstrate the interdependencies of various tasks and allows the analyst to
determine which employees have the unique combination of tasks and skills required to
participate in specific exploitation activities. As an example, once the apprentice has
reached stage 4 and can perform transformer maintenance testing, the apprentice would
have some knowledge of transformers. If, at that time, insider threat analysts are
concerned about the vulnerability of transformers to sabotage or some other threat, they
can determine that only apprentices that have reached step 4 and completed the class
related to transformer maintenance testing have the means to act as insider threats.

Furthermore, if analysts are concerned about substation distribution equipment in
conjunction with transformers, they can determine that only level 5 apprentices that have
completed substation distribution switching tasks and that have previously passed the
necessary transformer-related tasks during stage 4 have the ability to pose a threat to the
system from within. Accordingly, HV-C assists with defining the human-related abilities
of a given system and can help with determining which humans have the means to act
maliciously against a given electrical distribution and transmission system. In the HV-H
discussion, such skill level information will be used for TTC analysis.
4.2.10 HV-D: Roles
The HV-D shown in Table 4.8 consists of individuals’ job descriptions from
PG&E, including responsibilities, tasks, and the immediate superior to whom each
individual reports. In the table, positions within the organization are listed along the
horizontal axis, while responsibilities and tasks are listed along the vertical axis. The
hierarchy of accountability for the proper execution of these responsibilities and tasks is
indicated as primary accountability (P), secondary accountability (S), or tertiary
accountability (T). The primary case typifies those individuals whose job descriptions
specifically include execution of the indicated responsibility or task, the secondary case
indicates individuals who are direct supervisors of the primary individuals, and the
tertiary case includes individuals who are direct supervisors of the direct supervisors of
the primary individuals.
Table 4.8 Listing of responsibilities and tasks applicable to jobs [San Diego, 2016]
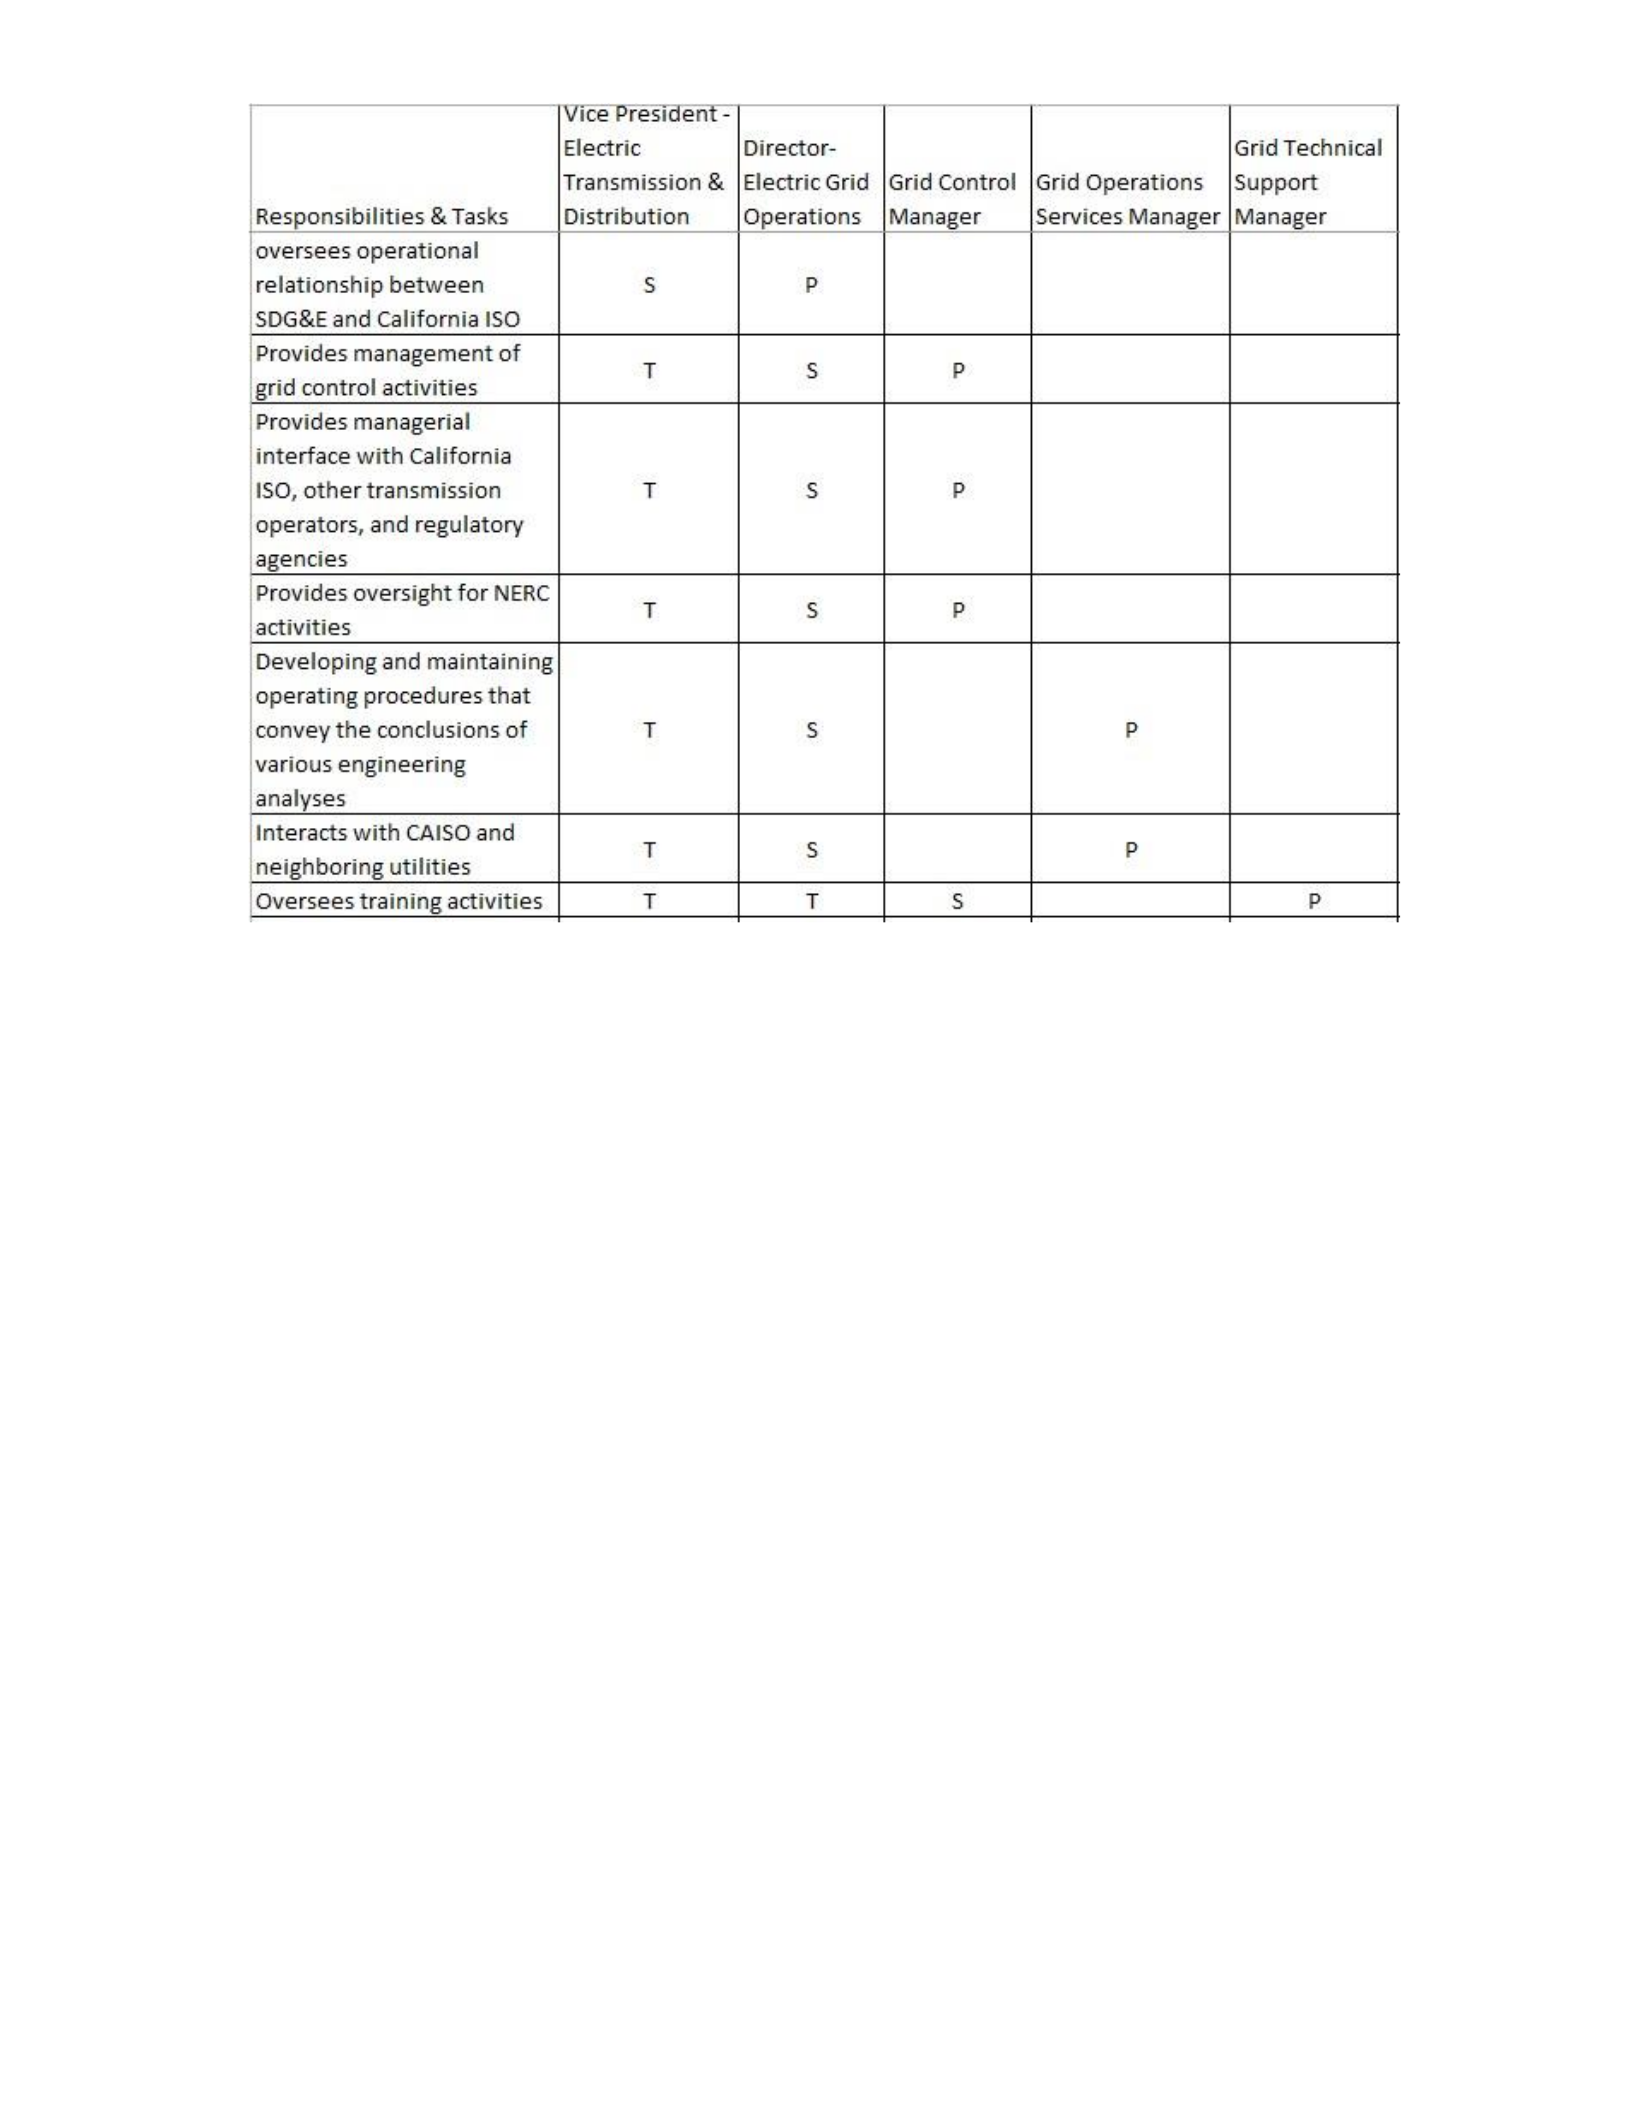
The HV-D is an important NATO Human View product for recognition of security
threats and helps analysts recognize threats by identifying the individuals that are most
responsible for completion of a given task. If a particular task is compromised, it
can easily be determined which people are the closest to the task in terms of both carrying
out and supervising the task. An insider threat analyst, with the assistance of an HV-D
model, may ultimately find out who is responsible for an activity to prevent or diminish
damage caused by an insider threat. An example would be an analyst’s concern, based on
an anonymous tip, about if any of the company’s electrical transmission or regulatory
activities related to the North American Electric Reliability Corporation (NERC) have
been compromised. As the table indicates, the primary (P) responsibility for NERC
activities is vested in the Grid Control Manager. The Grid Control Manager position thus
seems to be the most obvious place to begin an investigation into a potential threat

involving compromised activities related to NERC compliance or otherwise. However,
with the aid of the HV-D, the analyst can see that the person holding the Director –
Electric Grid Operations post has secondary (S) responsibility for the Grid Control
Manager’s tasks; that is, the Director is the official to whom the Grid Control Manager
reports. If the NERC activities are actually compromised, then not only the Grid Control
Manager but also the person holding the job of Director – Electric Grid Operations might
be engaging in malicious activities. In any event, the HV-D provides the user with a very
simple guideline about who is responsible for a task – in this case, at the primary,
secondary, and tertiary levels. However, the idea is portable to any occupational situation
in which the hierarchy of job roles and tasks is available. The HV-D model presented here
shows that, with the input of job roles and tasks, one can determine who is responsible
both directly and indirectly for a task, and one can, using this method, provide greater
security by quickly figuring out who is responsible for an area that may
be compromised. Because of its natural representation as a graph, the HV-D shown here
supports the SNA accomplished with the HV-H product.
4.2.11 HV-E: Human network
The HV-E shown in Figure 4.3 details the interactions among human beings that
are necessary for activities in a system to occur [NATO, 2010]. For a subset of the
numbers in Figure 4.3, there is a corresponding reference number in the legend that
contains the referenced job role and associated tasks.
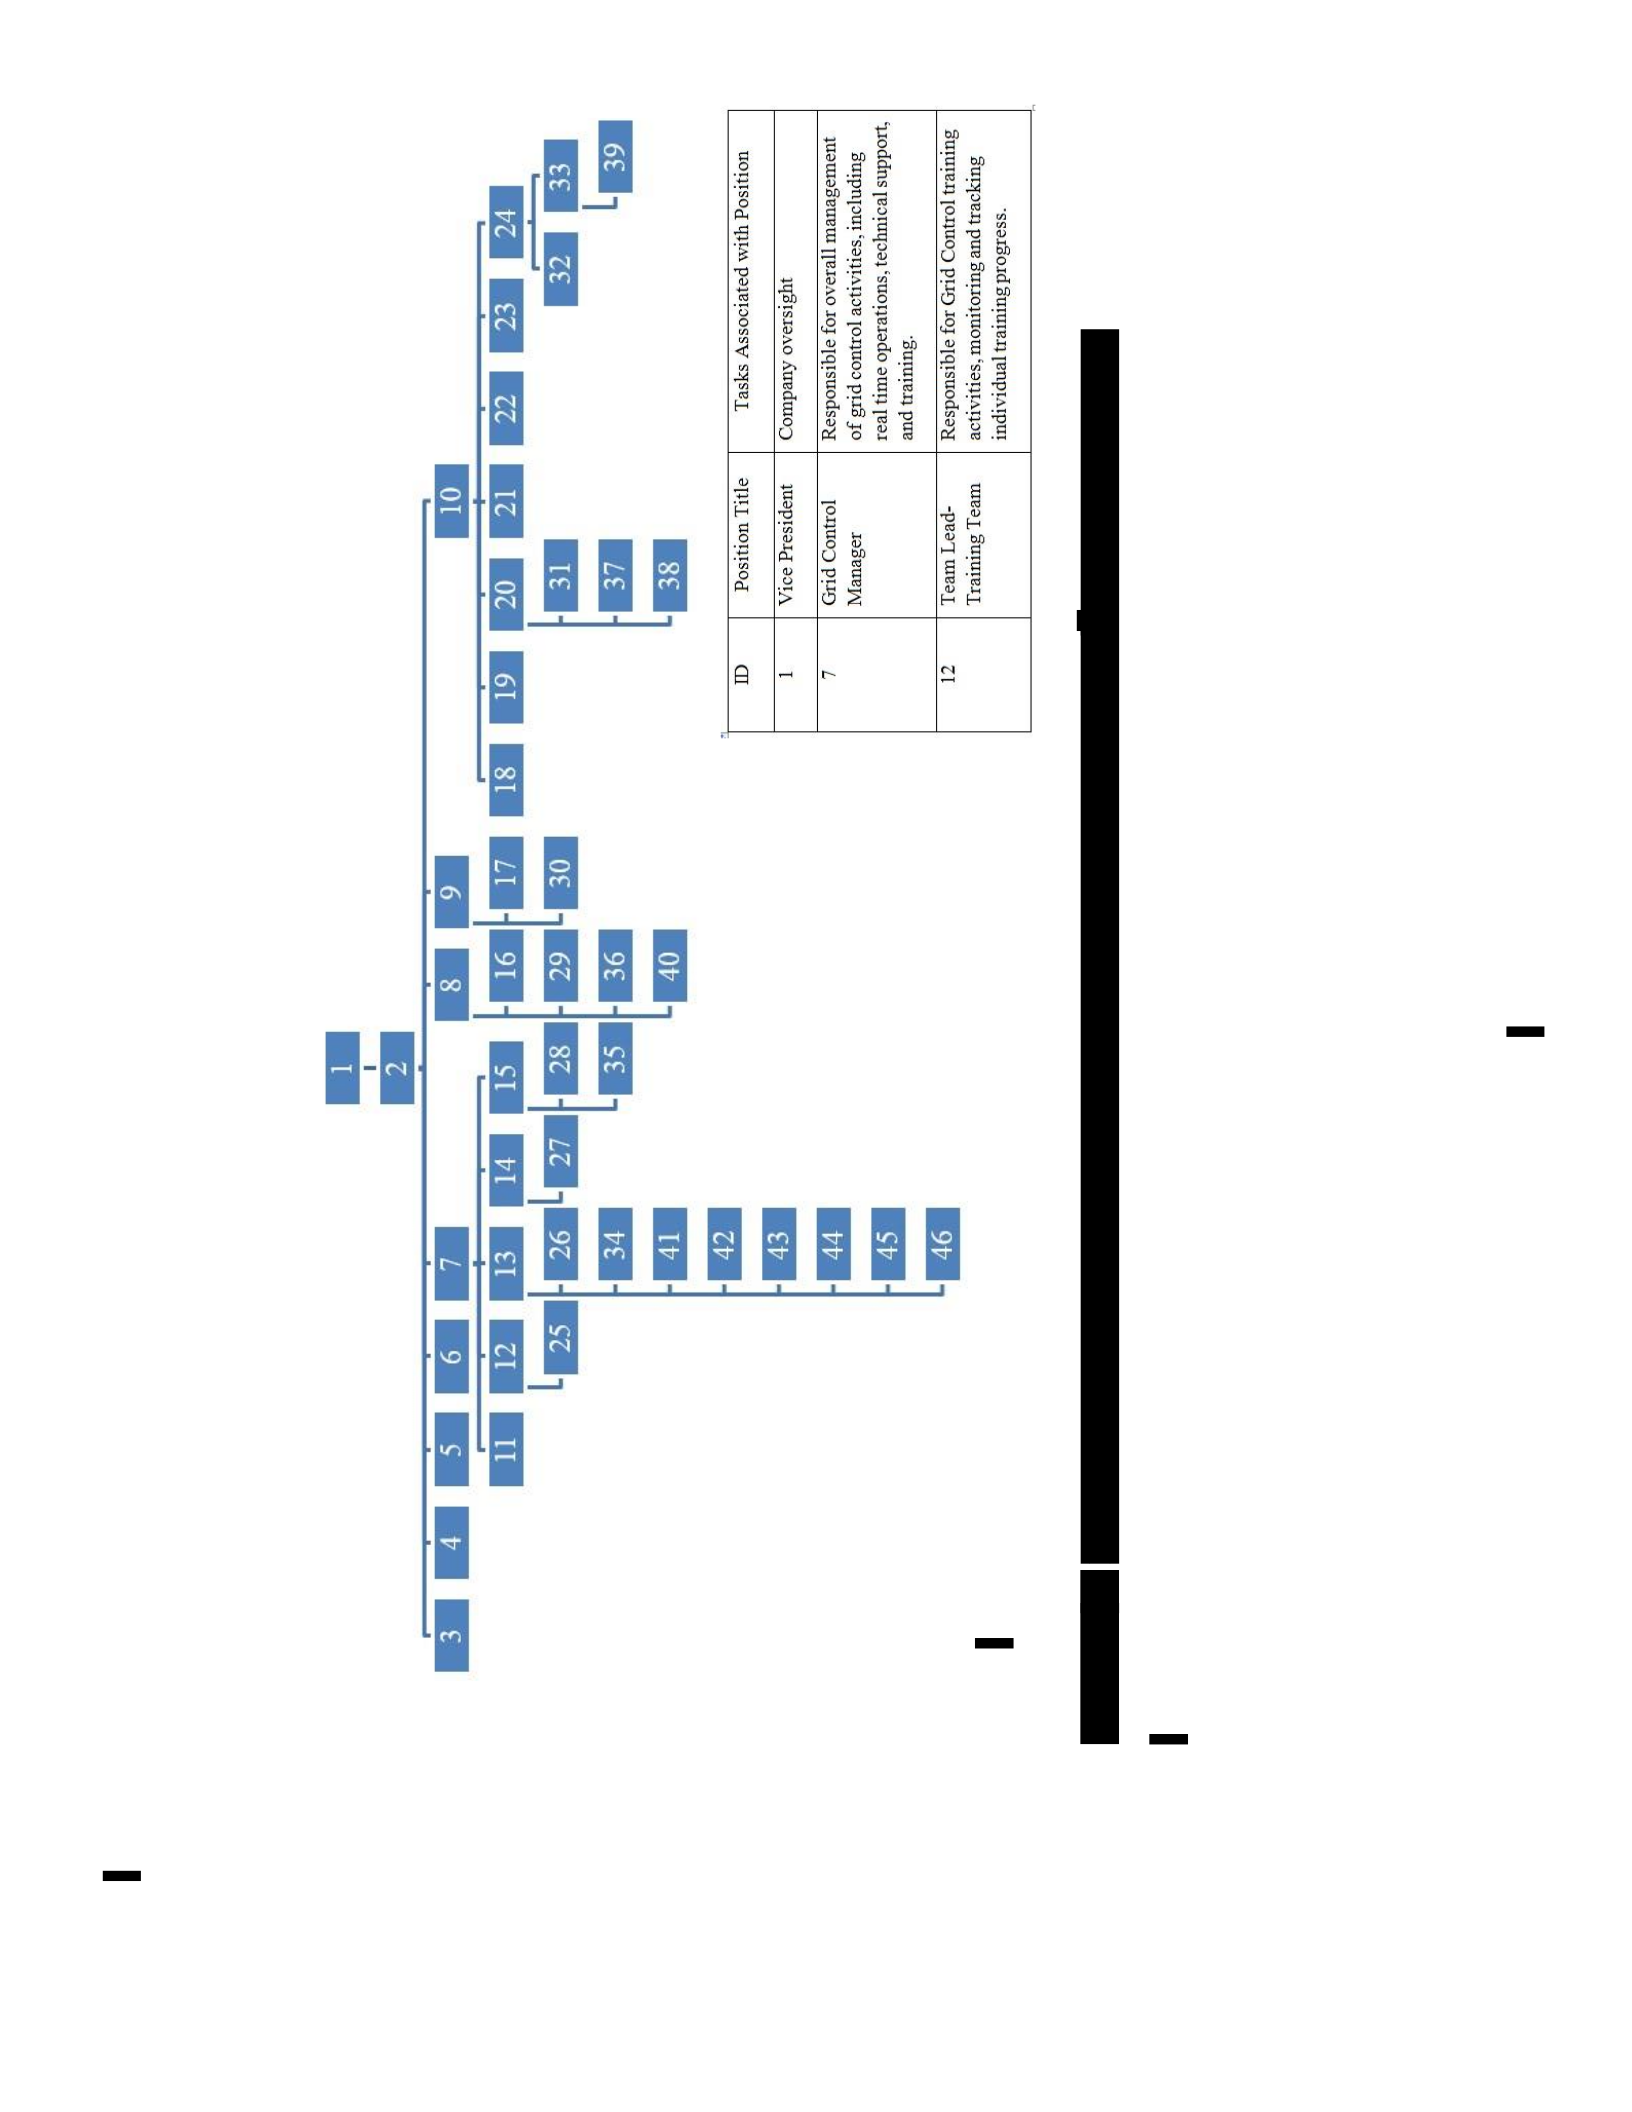
[9L0Z
‘osdIq
URS]
sofor
gol
poyoouUOD
SUIMOYS
WeIseIp
7
MOA
UPUINFT
¢"‘p
OINSI
“ssoisoid
SUIUIe]]
[PNPIAIpUr
SUTYORI]
pue
SULIO}UOU
‘sot}IATOR
weal
SUIUIeIL,
SuIUTeT
[ONUOD
PUD
Joy
epqisuodsey
~peey]
weal
ZI
va
-
“sururey]
pue
‘yroddns
[eormyoe}
‘suonesedo
out]
[eer
KA
ry
SUIPNOUT
‘set}IATOR
[OIJUOD
PIs
Jo
Joseuryy
JUatMSSeULUT
[[BIOAO
OJ
aTqisuodsey
JOUOD
plID
i
Ria
*
yySts1eAo
AueduioD
jepIselg
201A,
T
cp
F
MOHISOd
TM
Poyeloossiy
SHSE
SPL
GOnISOd
dl
Ea
Kira
Gira-
a
a
Ea
ia
Ea-
a
Ee
ie]
i
id
a
ee
ee,
ia
6
6
ee
ee
|
or
a
©”
We En Es
oe oD
B-#

The overall purpose of the HV-E is to provide to the viewer a comprehensive look
at all of the positions available in the organization and the employment hierarchy, so that
the employee’s day-to-day interactions with others may be determined. In addition,
because HV-E also includes the tasks each employee is responsible for, the analyst only
needs to determine who is responsible for a task and may then determine the immediate
and higher-level supervisors of the person responsible for performing that task. For
example, the person holding the Team Lead – Training Team position (position #12 in
Figure 4.3) is directly responsible for grid control training activities, but his job is likely
affected by instruction and supervision by the Team Lead’s immediate supervisor, the
Grid Control Manager (position #7). In this way, the entire chain of responsibility that
affects a given task may be viewed easily by constructing a HV-E diagram.
This kind of Human View is potentially useful for dealing with insider threats
because it shows not only the person responsible for a given task but also the individuals
to whom the person reports. If someone within the chain of command of a given
employee attempts to affect that employee, or vice versa, it can be said that social
contagion is occurring. This means that, to a great degree, how the employee acts is
affected by how the employee perceives others around the employee to behave [Brass et
al., 1998]. If one employee is discovered to have been acting maliciously, analysts can
look at the other employees with whom the insider interacts on a regular basis and
determine if those other employees have also been acting maliciously. For instance, if the
Grid Control Manager position is compromised, an insider threat analyst can determine if
the positions that report to the Grid Control Manager (e.g., Team Lead – Training Team)
have also been compromised. One should note that a position could even be compromised

inadvertently – for example, if the Team Lead – Training Team has acted in good faith on
instructions from the Grid Control Manager that turn out to have been given maliciously.
More ominously, if the Grid Control Manager were to be merely lax in his or her
following of security protocols, his or her poor judgment could make it easier for
subordinates to act maliciously. Regardless of the context, an HV-E diagram can provide
myriad benefits by ensuring that the system’s chain of command for employees and for
employees’ tasks is clearly defined.
4.2.12 HV-F: Training
The HV-F shown in Table 4.9 illustrates the training needed for an employee to
glean the necessary competency required to advance further in an organization’s job
position hierarchy [NATO, 2010]. For example, the tower climbing course is a
prerequisite for a stage 1 apprentice to advance to the next level of his or her
apprenticeship. In a similar but distinct manner to HV-C, HV-F shows the tasks required
for advancement to a higher skill level and competency standard; the distinguishing
characteristic between HV-C and HV-F is that the former includes the general
interconnectedness of how tasks are apportioned to and completed by human beings
during a given amount of time, while the latter considers the specific effects that tasks
involved in training have on various employees. In any case, HV-F can provide a clear
picture of the training that employees undertake and, therefore, to a great extent, the
abilities that they have earned from their training.
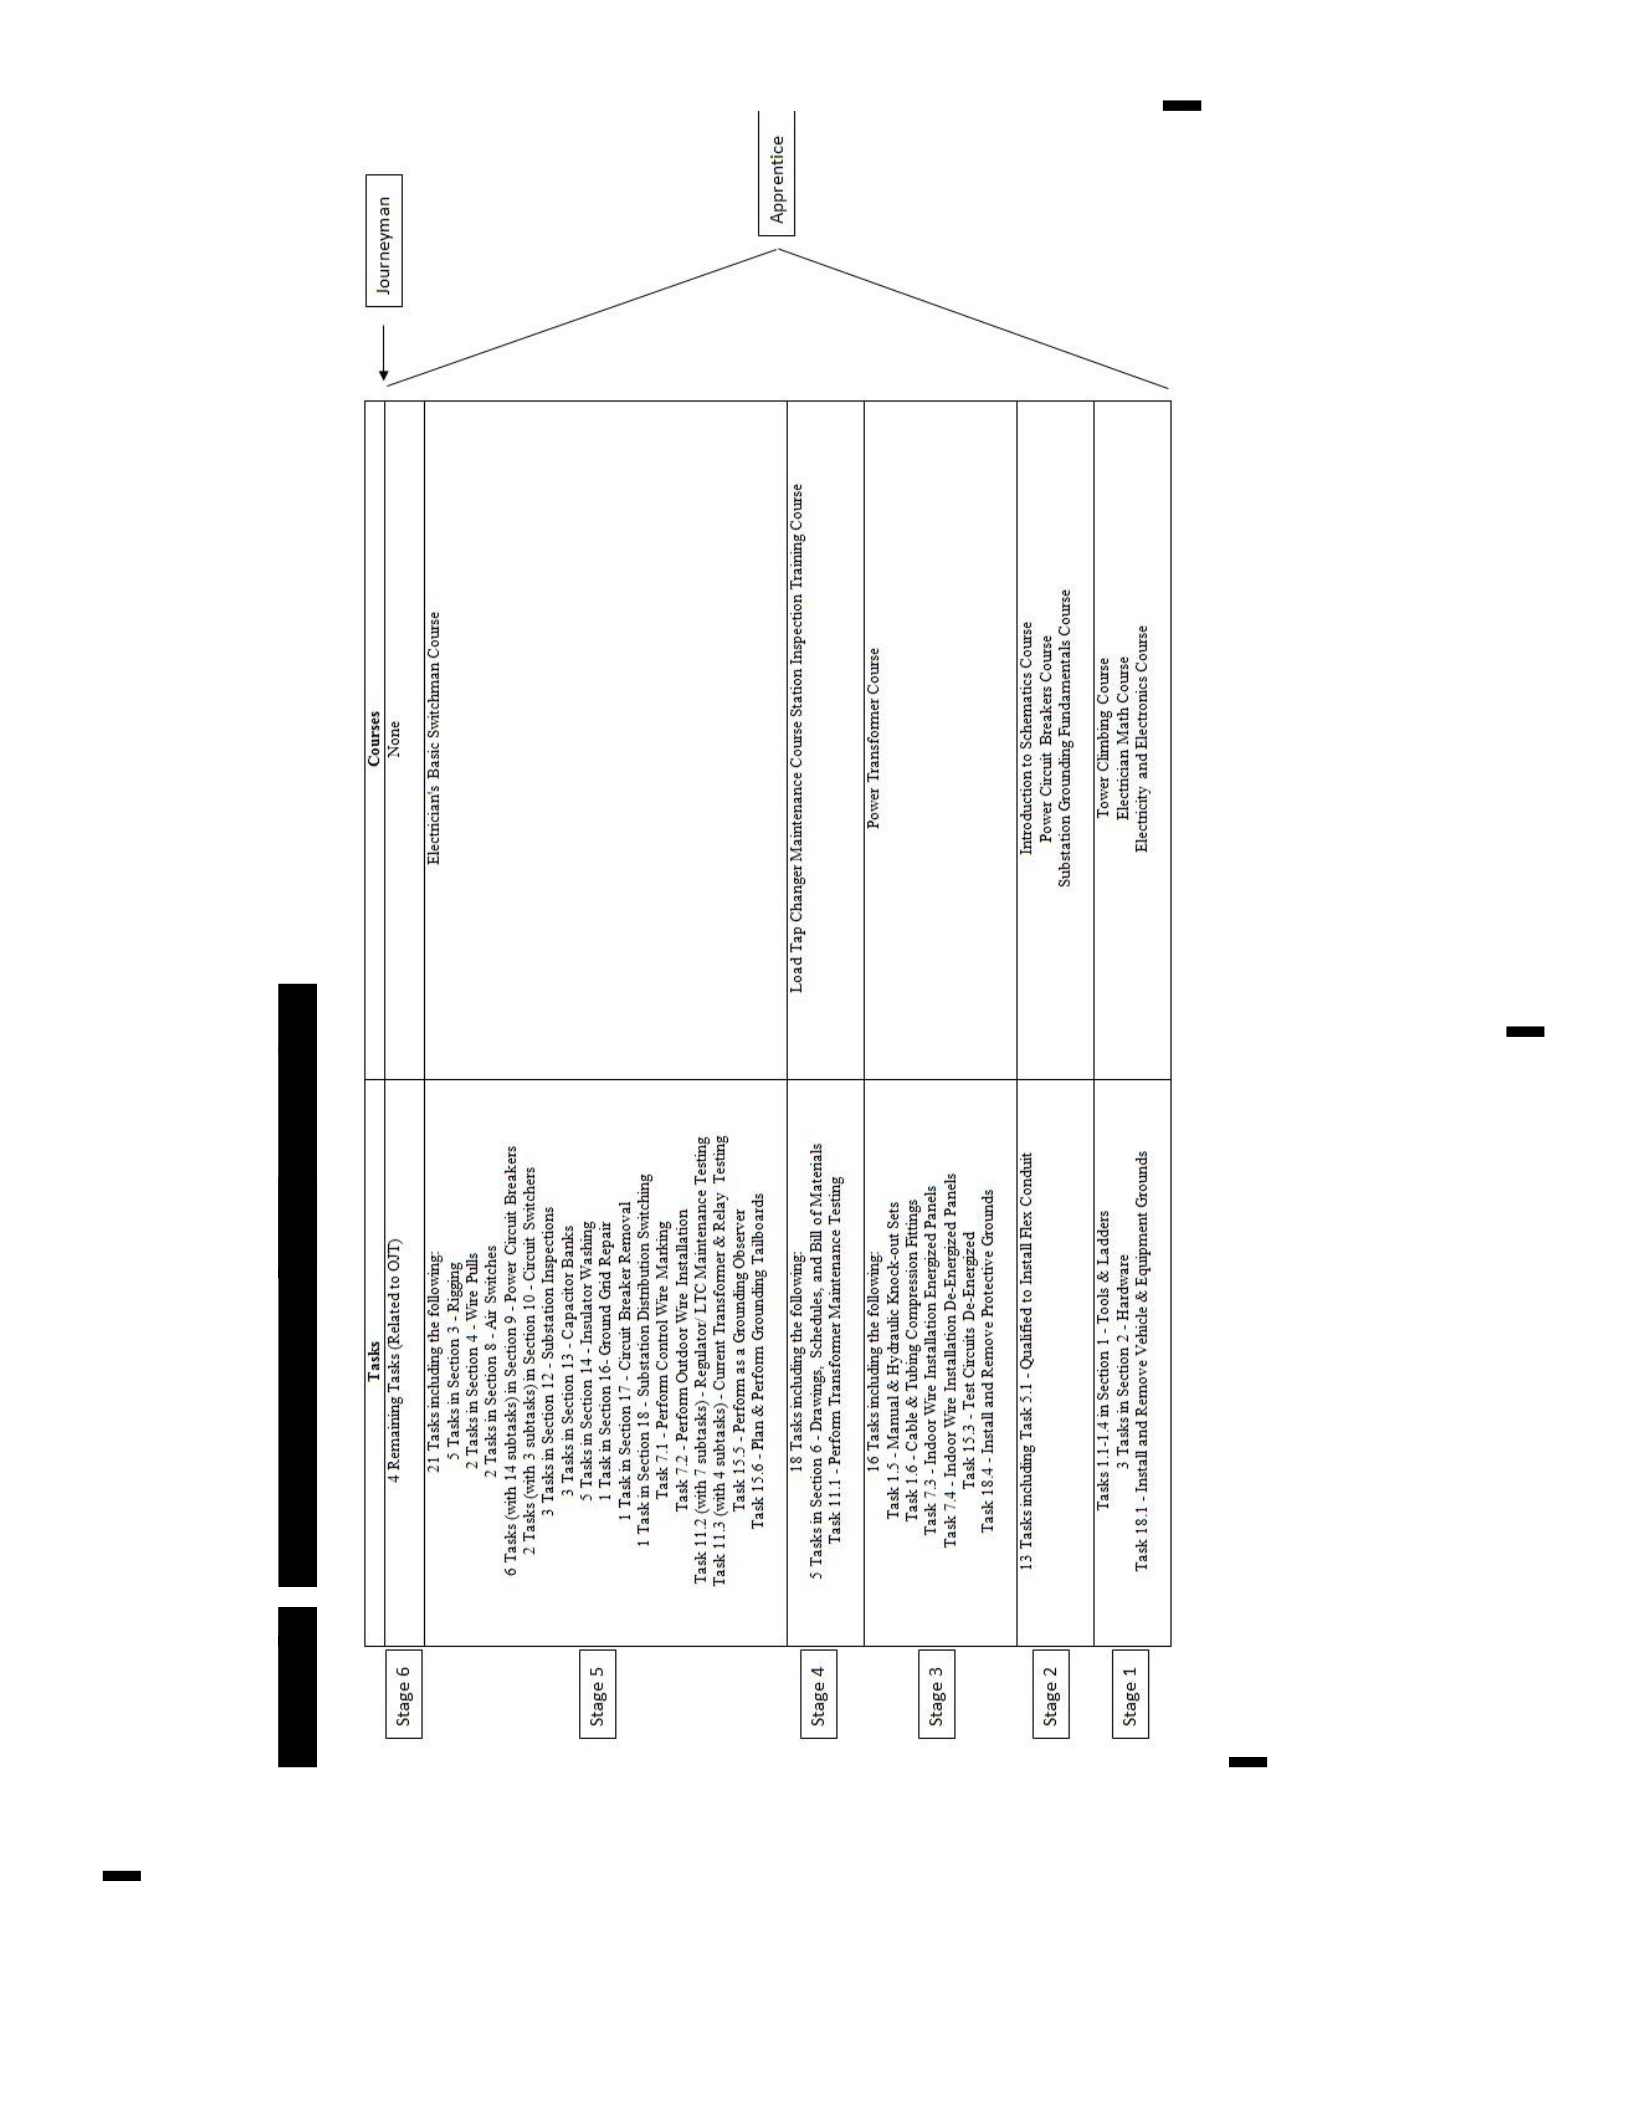

4.2.13 HV-G: Metrics
Insider threat analysis can consider the abilities required to cause damage to the
organization and, using HV-G, determine the minimum level of employee that is capable
of causing such damage. For instance, maintaining load tap changers is part of a course
for training stage 4 apprentices. If, therefore, only apprentices at stage 4 and higher can
deal with issues related to load tap changers, and if load tap changers are a particularly
vulnerable area of the electrical transmission and distribution system, it might be prudent
to have extra surveillance and additional security checks performed for the apprentices at
stage 4 and higher. The training requirements very clearly indicate which people have the
ability to affect (i.e., sabotage or damage) load tap changers so they are the ones that
should be subject to additional security protocols to protect load tap changers. A
determination of the minimum training required to cause damage to a given area of the
system could assist the analyst in excluding those not at a level high enough to cause a
particular sort of problem within the organization. In terms of combatting an insider
threat, HV-G illustrates particularly sensitive job categories and levels that should be
evaluated based on vulnerabilities.
4.2.14 HV-H: Human dynamics
The HV-H, a compilation of all of the other products of the NATO Human View,
will be used to show how SNA and TTC analysis can be used to analyze electrical utility
system operations.
4.2.14.1 Social network analysis
In this section, various SNA metrics will be collected to determine the positions in
the organization most likely to cause the most damage if an individual in a specific job

were to decide to become a malicious insider. The data used was derived from the HV-D
and HV-E. The HV-E requires no additional modifications for data analysis and is an
executable architecture component. HV-D is translated into a graph and then analysis is
performed.
The accountability for the execution of various responsibilities and tasks is a
useful metric to determine which positions within the organization are the most
wellconnected and thus would probably be in the most productive position to perpetrate
an insider exploit. This attribute of “well-connectedness” for an individual is his or her
position’s centrality, of which there are various types. In this investigation of insider
threats, the most relevant are closeness centrality, betweenness centrality, and eigenvector
centrality. Other measures that could be used for analysis are degree centrality, which can
help identify the number of people that can be reached from a particular person, and
PageRank, which can be used to determine the overall important of a person based on
their position in the network [Choudhary and Singh, 2015]. Using the Gephi [2016] open
source visualization software, a web of various nodes and edges was constructed to
illustrate the relationships (links) between all members of the organization and is shown
in Figure 4.4.
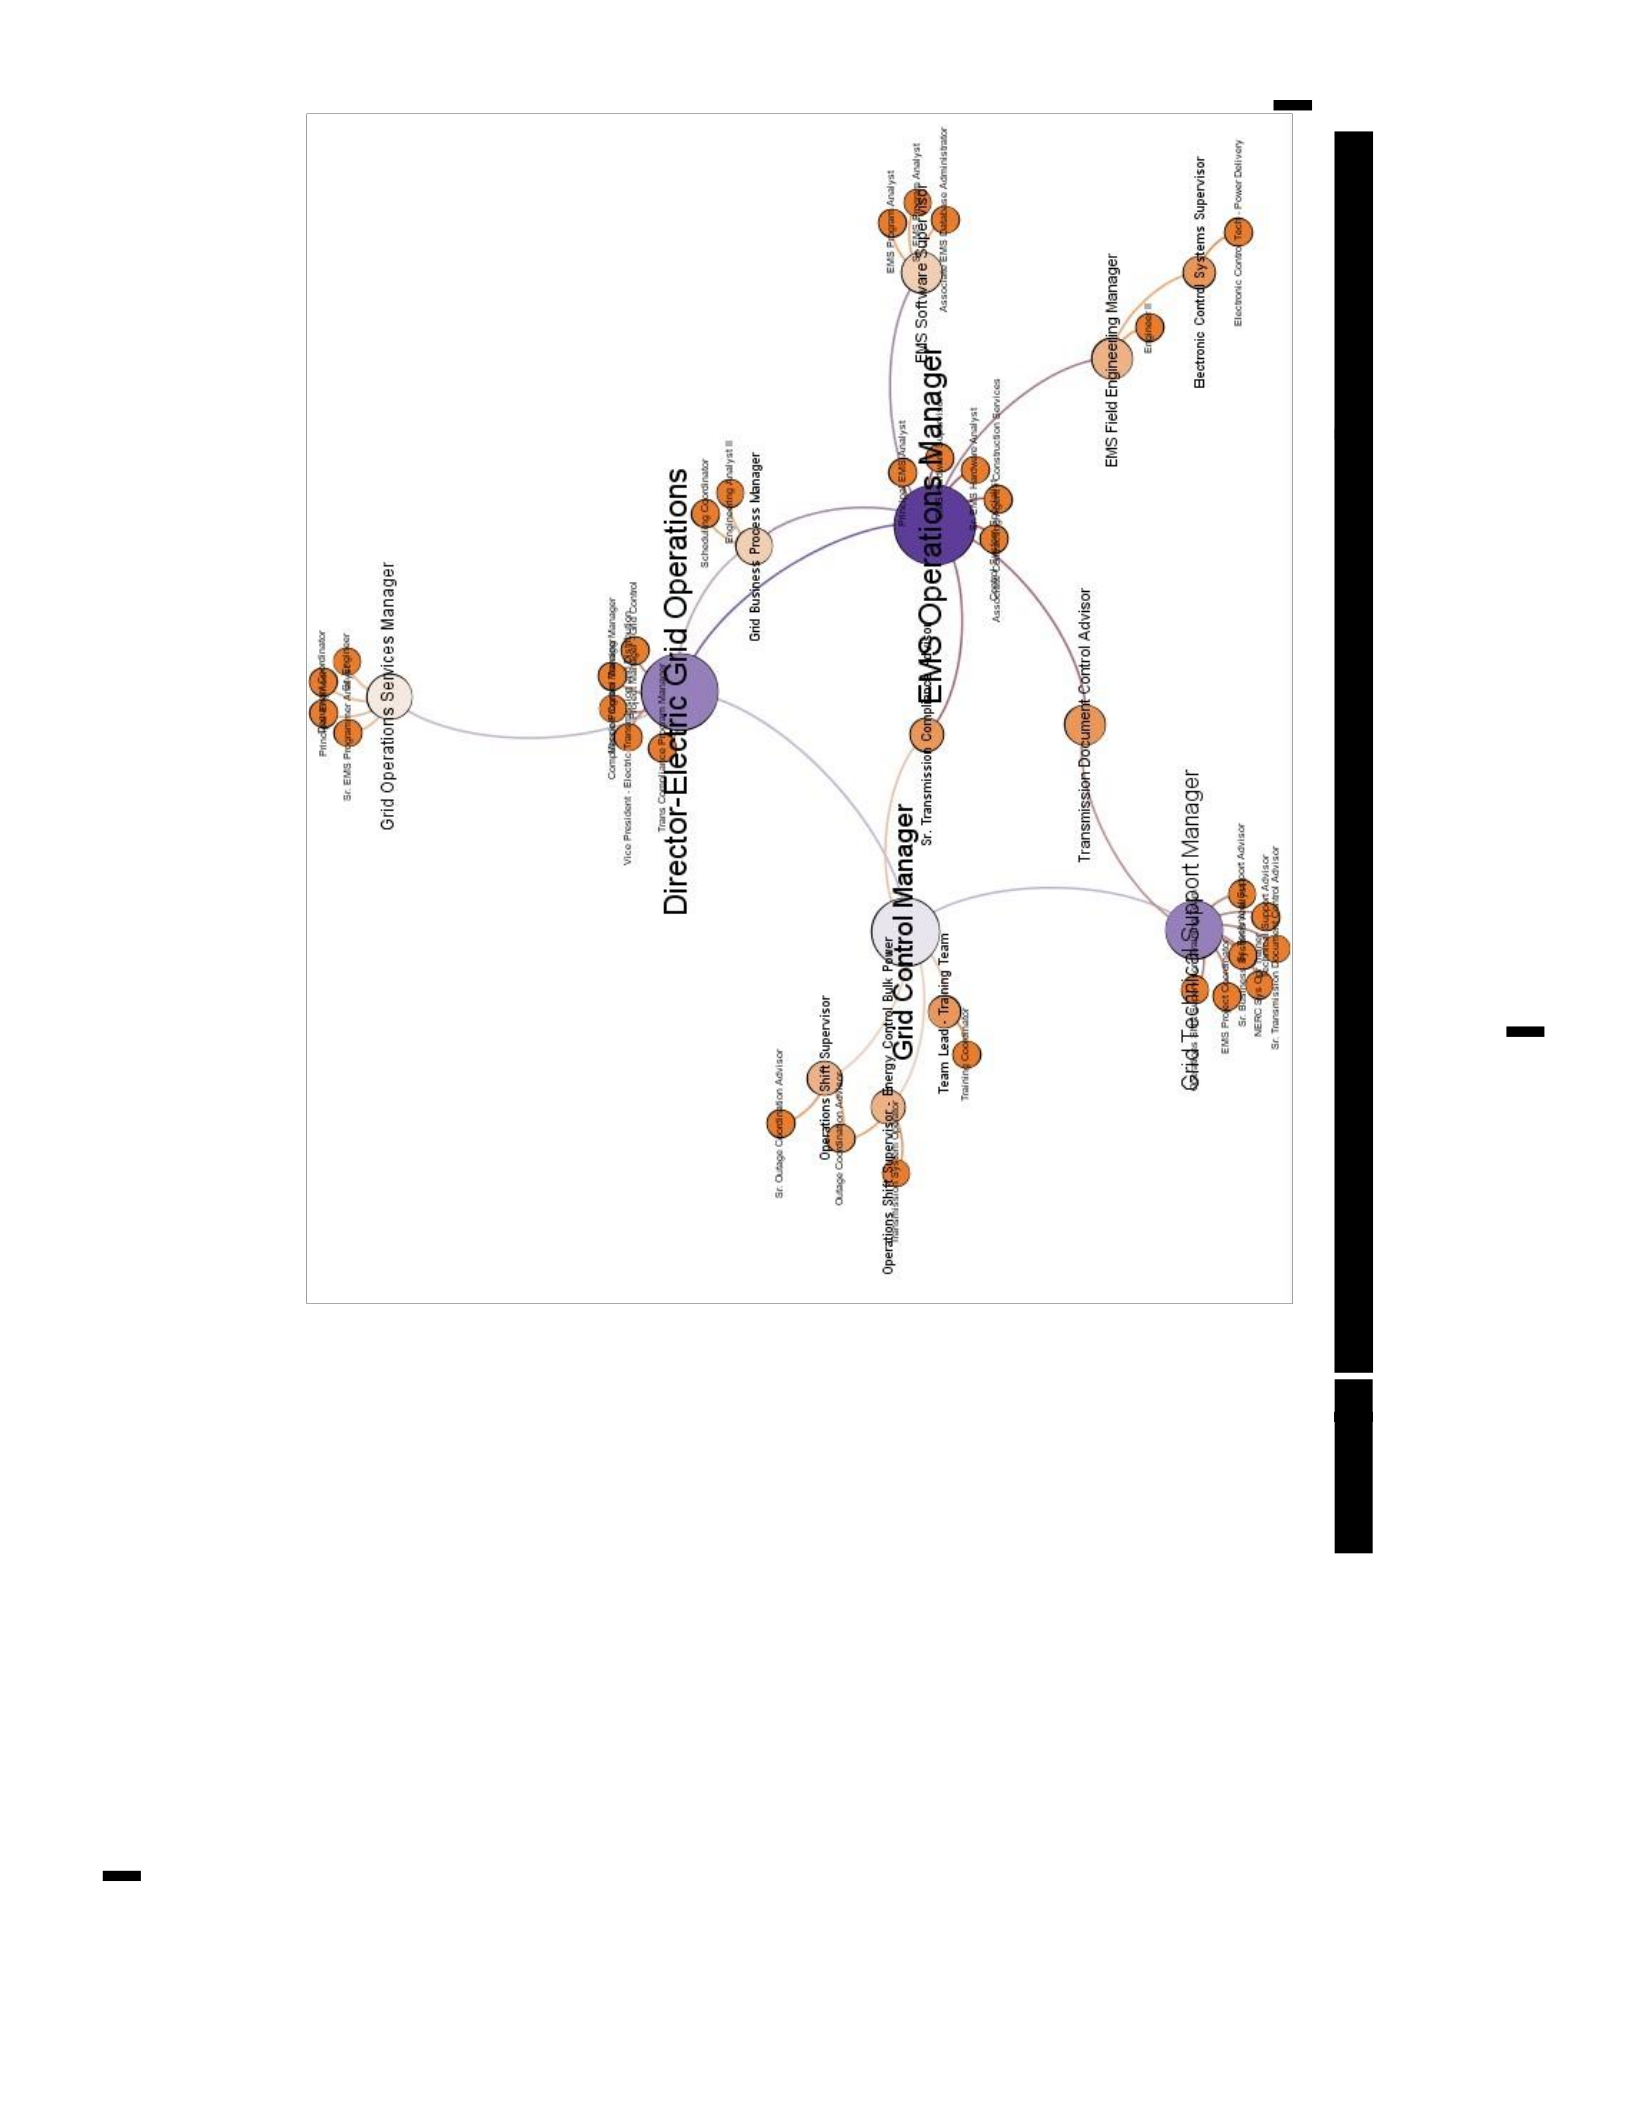
[9107
‘osoI1q
ues]
suontsod
qa=Hoqgs
suowre
sdrysuoneou9jul
Jo
Susi]
Ani
awed
Dage1S
Josijuadng
swa’
Wuog
s1UuKpAR
JOSIAPYY
[O.NUOS
murs
wea;
Bu
es]
weal
OISSIWISUEJ)
“US
JeBeuey|
[0.jU0D
Ered
anf
aR
YO6i
a
sesmuadns
(su
10
oe
\
JOS
INDY
UD!
o6eD
VS
DIB20[S
FOS
OL
piID
Jabeuey
seoifas
shoueiedo
pug
Bev
=
ria
28
atu
Me
py
oInsiy

This graphic demonstrates a position’s centrality proportionally to text size and
node size. Each node represents a different, unique position within the organization, while
each edge represents the “tie” between each employee and his or her supervisor or
supervisors. According to this graphic, the Director – Electric Grid Operations and EMS
Operations Manager positions are some of the most well-connected (having the highest
centrality), because they are the largest on the diagram. The centrality values for these
positions are shown in Table 4.10.
Table 4.10 Top three centrality values among SDG&E job positions
Position
Closeness
Centrality
Betweenness
Centrality
Normalized
Eigenvector
Centrality
Director –
Electric Grid
Operations
0.45
477.0
8.47%
EMS Operations
Manager
0.44
517.5
9.55%
Grid Control
Manager
0.41
391.5
5.89%
Closeness centrality simply refers to “the extent to which an individual can reach
all others in the network in the fewest number of direct and indirect links” [Brass et al.,
1998:21]. The closeness centrality of positions in the organization ranged from
approximately 0.20 to 0.45, for which the highest value corresponded to the Director –
Electric Grid Operations position. Closeness centrality can assist with determining which
people have the easiest, fastest access to other members of the organization. Based on
Figure 4.4 above, the Director, EMS Operations Manager, and Grid Control Manager
have direct access to the other members of the organization.

Betweenness centrality refers to the “number of shortest paths between any pair
that pass through a node” [Choudhary and Singh, 2015:26]. Betweenness centrality
values ranged from 0 to 517.5. Betweenness centrality’s usefulness would be its
indication of the positions that provide the greatest linkage between other positions,
which Choudhary and Singh refer to as “brokers” [2015:26]. In fact, Figure 4.4 shows
that the Director, EMS Operations Manager, and Grid Control Manager provide a
significant amount linkage between all of the others in the organization.
Eigenvector centrality refers to the “relative importance in terms of influence of a
node to its neighboring nodes in the network” [Choudhary and Singh, 2015:26]. The
normalized eigenvector centrality values spanned approximately 0.26% to 9.55%.
Eigenvector centrality can help to detect nodes (positions) that have great influence over
other nodes (positions), by pinpointing which individuals are “well connected to other
well connected persons” [Choudhary and Singh, 2015:26]. Since the Director, EMS
Operations Manager, and Grid Control Manager are well-connected to many others in the
organization, it follows that they are connected to other well-connected individuals.
The greatest benefit of using a variety of centrality measures is that each can
provide a clearer picture of the positions that are the most influential and well-connected:
an attribute that provides clear advantages for those intending to commit crimes against
the organization. The data from these metrics shows that the Director – Electrical Grid
Operations, EMS Operations Manager, and the Grid Control Manager hold positions that
need extensive background checks because of their potential to negatively influence
personnel, systems and procedures of the organization, should any one of them become a
malcontent. Additionally, by investigating the job roles that link multiple individuals with
higher centrality measures (e.g., the Transmission Document Control Advisor that

interacts with both the Grid Technical Support Manager and the EMS Operations
Manager), one could determine additional job roles that could pose a threat because of the
small number of high-level persons with whom they interact, rather than a high number
of lower-level persons with whom they interact. Furthermore, although the quality of
relationships for high-ranking officials may tend to increase as they move higher in the
company hierarchy, the number of direct, primary relationships may decrease simply
because they do not interact much from day to day with many individuals. As a
consequence, it may be the case that some individuals lower-down in the company
hierarchy may actually have greater centrality despite having only a medium-ranking job.
For example, one can see that the Transmission Document Control Advisor, who reports
to the EMS Operations Manager, has higher centrality than some of the other officials
that report directly to the Director, which is likely due to such a scenario.
The second analysis performed with Gephi [2016] included roles in the
organization, job responsibilities and tasks (from HV-D) as nodes and the supervisory
relationships (i.e., to whom each employee reports) as edges. P, S, and T classifications
were used to represent job responsibilities and served as the weights of edges connecting
the responsibilities to the job category. Individuals directly responsible for tasks would be
linked more strongly to those tasks than their immediate supervisors would be. Primary
classifications received a relative weight of 3, secondary classifications a relative weight
of 2, and tertiary classifications a relative weight of 1. The diagram produced that shows
all of these relationships is shown in Figure 4.5.
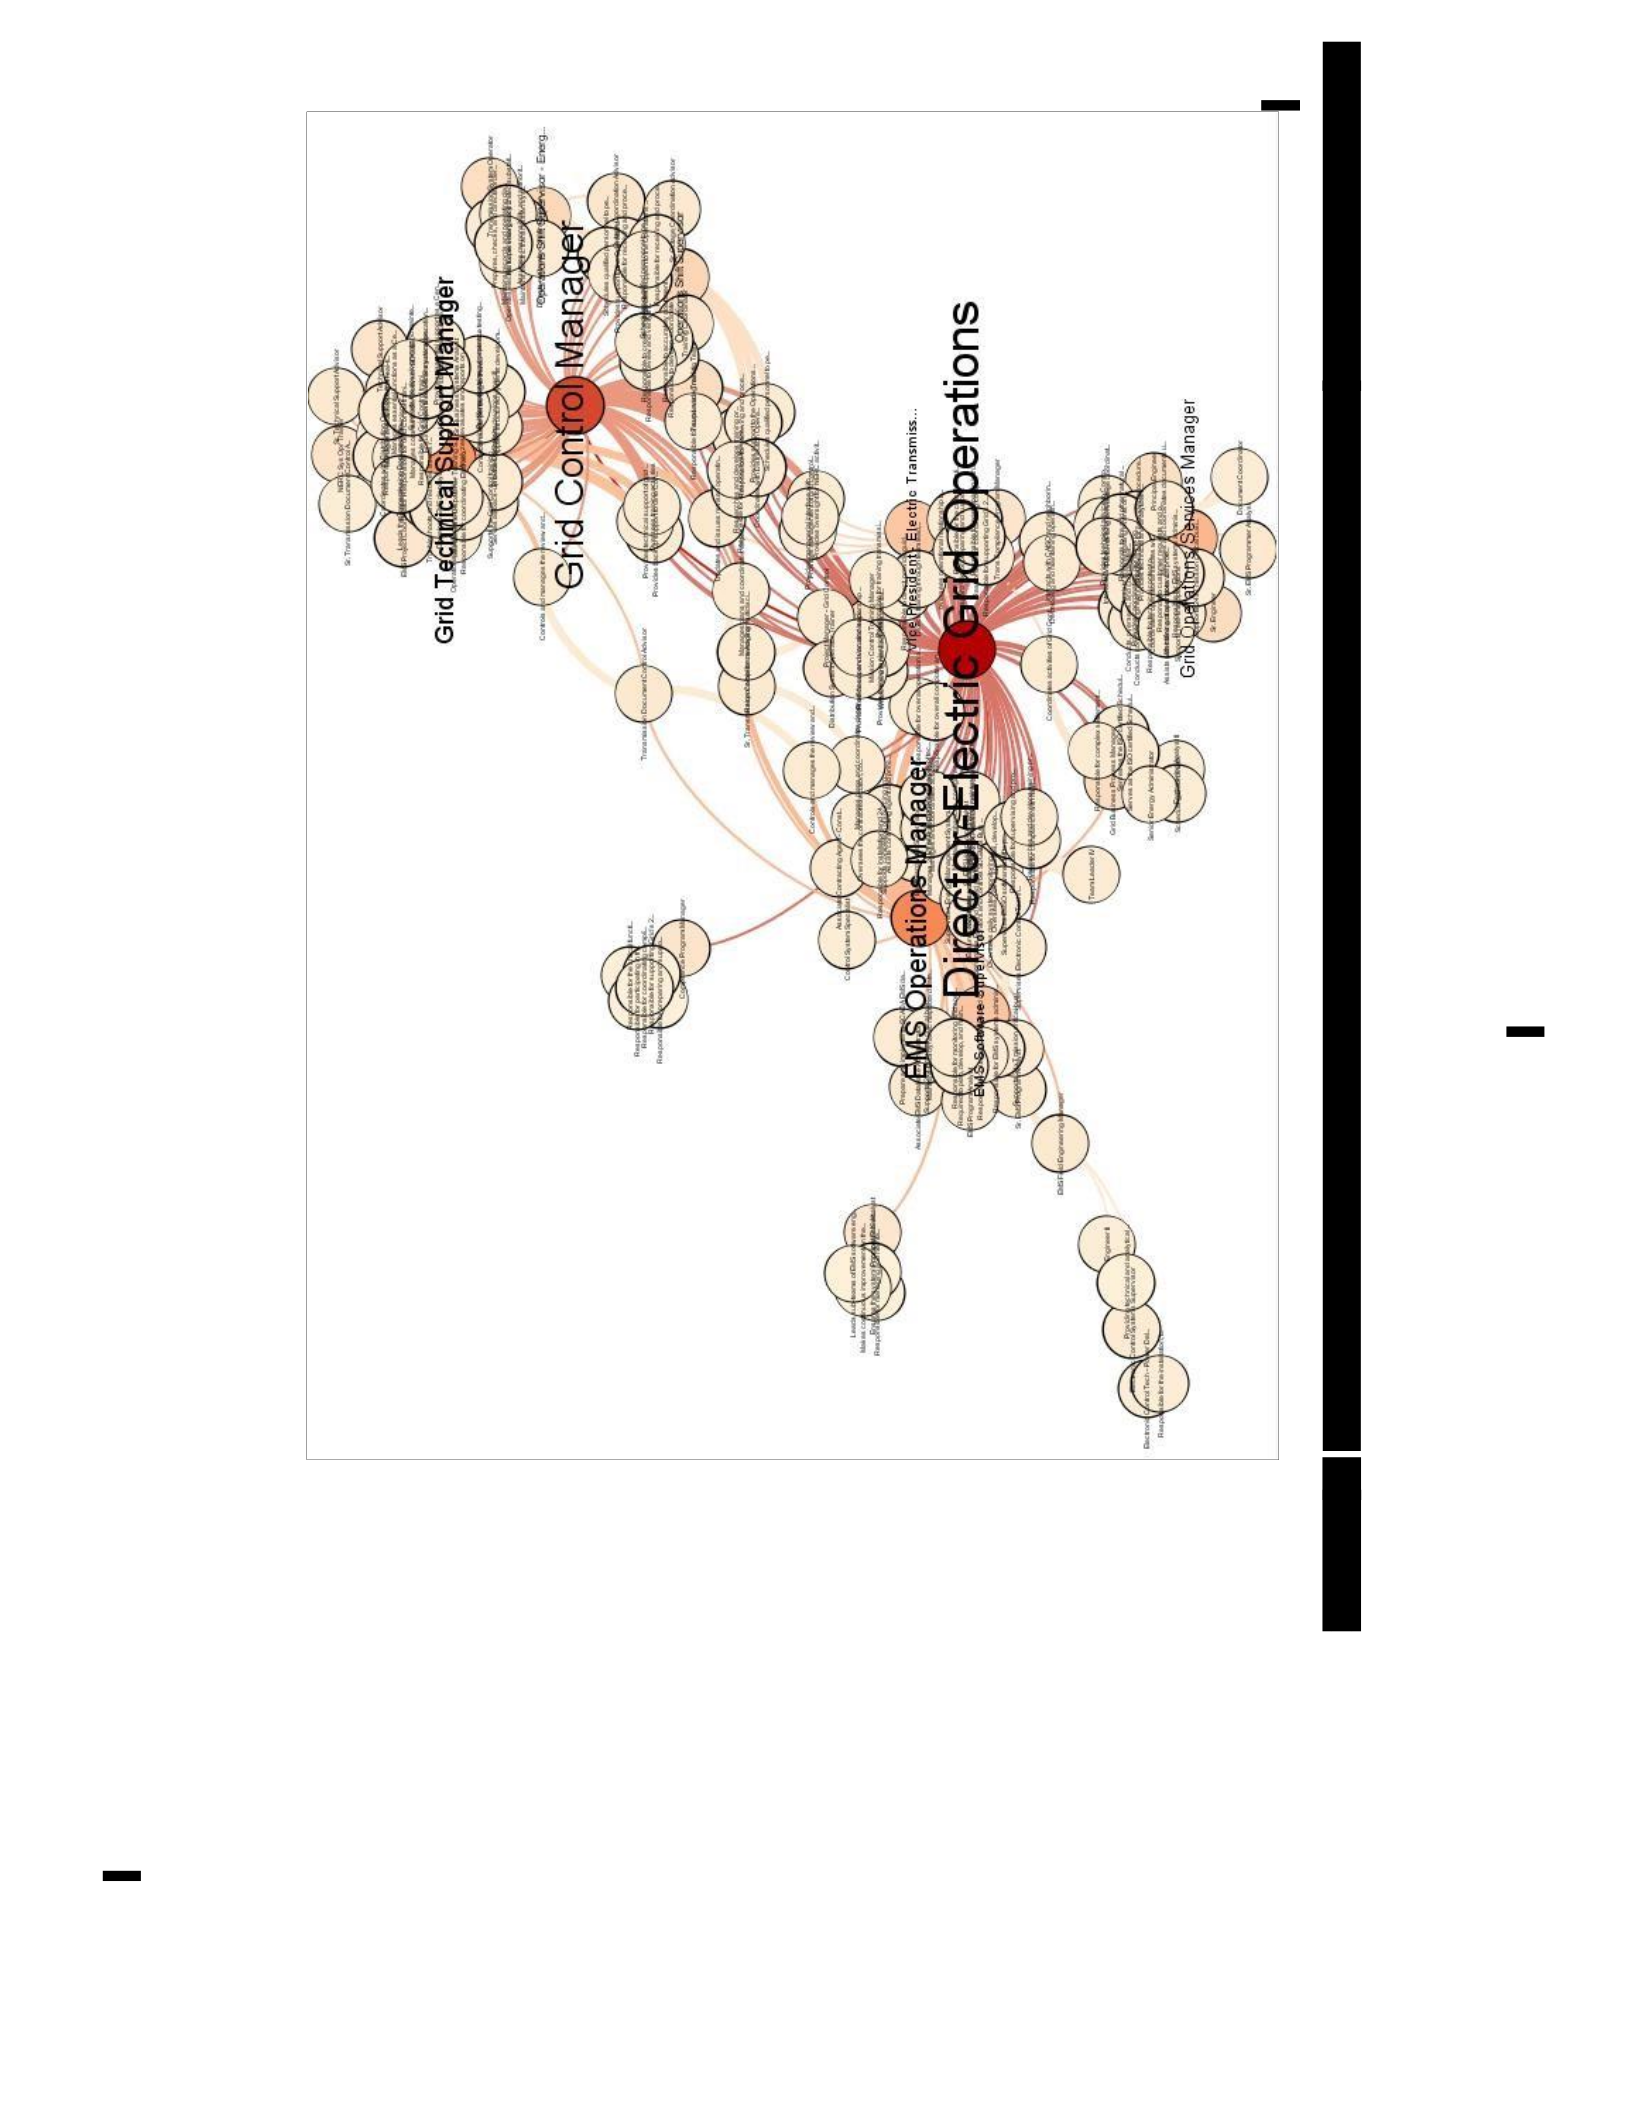
[9L0Z
‘osdIq
URS]
syse}
pue
suoTIsod
qaHds
suowe
sdiysuoynepusjul
jo
SuUNSIT
poms

The diagram in Figure 4.5 indicates that the top three positions in San Diego Gas
& Electric Company that are the most well-connected in terms of overall centrality are
the following: Director – Electric Grid Operations, Grid Control Manager, and EMS
Operations Manager. The centrality values for these positions may be seen in Table 4.11.
Table 4.11 Top three centrality values among SDG&E job positions and tasks [San
Diego, 2016]
Position
Closeness
Centrality
Betweenness
Centrality
Normalized
Eigenvector
Centrality
Director – Electric
Grid Operations
0.60
11830.73
4.89%
Grid Control
Manager
0.51
7782.92
3.37%
EMS Operations
Manager
0.47
4178.76
2.40%
The closeness centrality of positions in the organization, indicating “quick
connectedness,” ranged from approximately 0.20 to 0.60, for which the highest value
corresponded to the Director – Electric Grid Operations position. Additionally,
betweenness centrality values, indicating the best “brokers,” ranged from 0 to 11830.73.
Finally, eigenvector centrality values, indicating an overall measurement of
wellconnectedness, spanned approximately 0.01% to 4.89%. Each of these types of
centrality provides its own clear advantages in trying to pinpoint the positions that
provide the most advantage if compromised by an insider.
Another major advantage of this analysis via Gephi [2016] is that, in the event that
a compromised position is found, one can easily find the tasks and persons most
influenced by the position that may be also be compromised; this is similar to
determining the impacts of an infection. With the knowledge of what each position does
on a regular basis, including not only tasks but also supervisory responsibilities and

influences on other individuals and others’ tasks, it is possible that this form of analysis
can minimize the danger by attempting to limit the spread of damage after an insider
threat is detected – mainly, by “containing the infection.” For example, if the EMS
Operations Manager is found to have been acting maliciously, the SNA allows the analyst
to quickly determine the tasks and people under that position in the chain of command
that are under the highest risk of being influenced by the manager’s malicious actions. If
an analyst is looking for accomplices of a malicious individual, this may be a good place
to start looking. The analysis provided with the NATO Human View data and SNA
metrics is a straightforward way to measure the linked nature of roles and tasks in a
company. Insider threat detection measures would benefit from the use of this analysis to
detect and minimize the threat of insiders.
4.2.14.2 Time to compromise analysis
An additional form of analysis useful to insider threat analysts is a model
involving a concept called time to compromise (TTC). This model involves “estimating
the time to compromise a system component that is visible to an attacker” [McQueen et
al., 2006: 2].
The model includes the TTC for an attacker that fits into one of four skill levels:
novice, beginner, intermediate, and expert. The data provided in the HV-C is used for this
analysis. The HV-C previously discussed indicates the tasks required to advance in each
stage of apprenticeship, and it demonstrates that the vulnerability of the company to
potential damage (low, medium, and high) caused by the apprentice as she advances in
skill level. The skill level for an attacker in this case is roughly analogous to the relative
threat level of an apprentice or other employee. In fact, the following equation from
McQueen et al. [2006] was used to find the value for the time to compromise T:

𝑇 =𝑡1𝑃1+𝑡2 1−𝑃1 1−𝑢 +𝑡3𝑢(1−𝑃1)
(4.1)
where
T is the time-to-compromise
t1 is the mean time estimation for Process 1
t2 is the mean time estimation for Process 2
t3 is the mean time estimation for Process 3
u is the probability that Process 2 is unsuccessful
V is the number of system component vulnerabilities
This model depends on whether or not the system considered is in one of two
processes. Process 1 (P1) is the case in which a given attacker has an exploit available for
a known susceptibility, while Process 2 (P2) is the case in which a given attacker does not
have an exploit available for a known susceptibility (the opposite of P1) [McQueen et al.,
2006]. Finally, Process 3 (P3) is the “identification of new vulnerabilities and exploits”
[McQueen et al., 2006: 4]. The reason that these are necessary to distinguish is that the
relative risk level of a known vulnerability depends on whether or not it is easily
susceptible to an attacker.
To perform the needed calculations to find T, all of the unknown variables
(namely, t1, t2, P1, u, and t3) must be determined. The variable t1, which is the mean
(expected) value for completion of Process 1, is considered to be 1 working day by
McQueen et al. [2006]. The variable P1 may be found by using the following equation
[McQueen et al., 2006]:

𝑃1 =1−𝑒−𝑣𝑚/𝑘
(4.2)
where
P1 is the probability that an attacker is in Process 1
e is Euler’s number
v is the number of vulnerabilities on the component of interest
m is the number of exploits that an attacker can use
k is 9447 vulnerabilities
This analysis will rely on an assumed value of 100 vulnerabilities (V), while the m value
depends on skill level as determined by McQueen et al. [2006] and represented in Table
4.12.
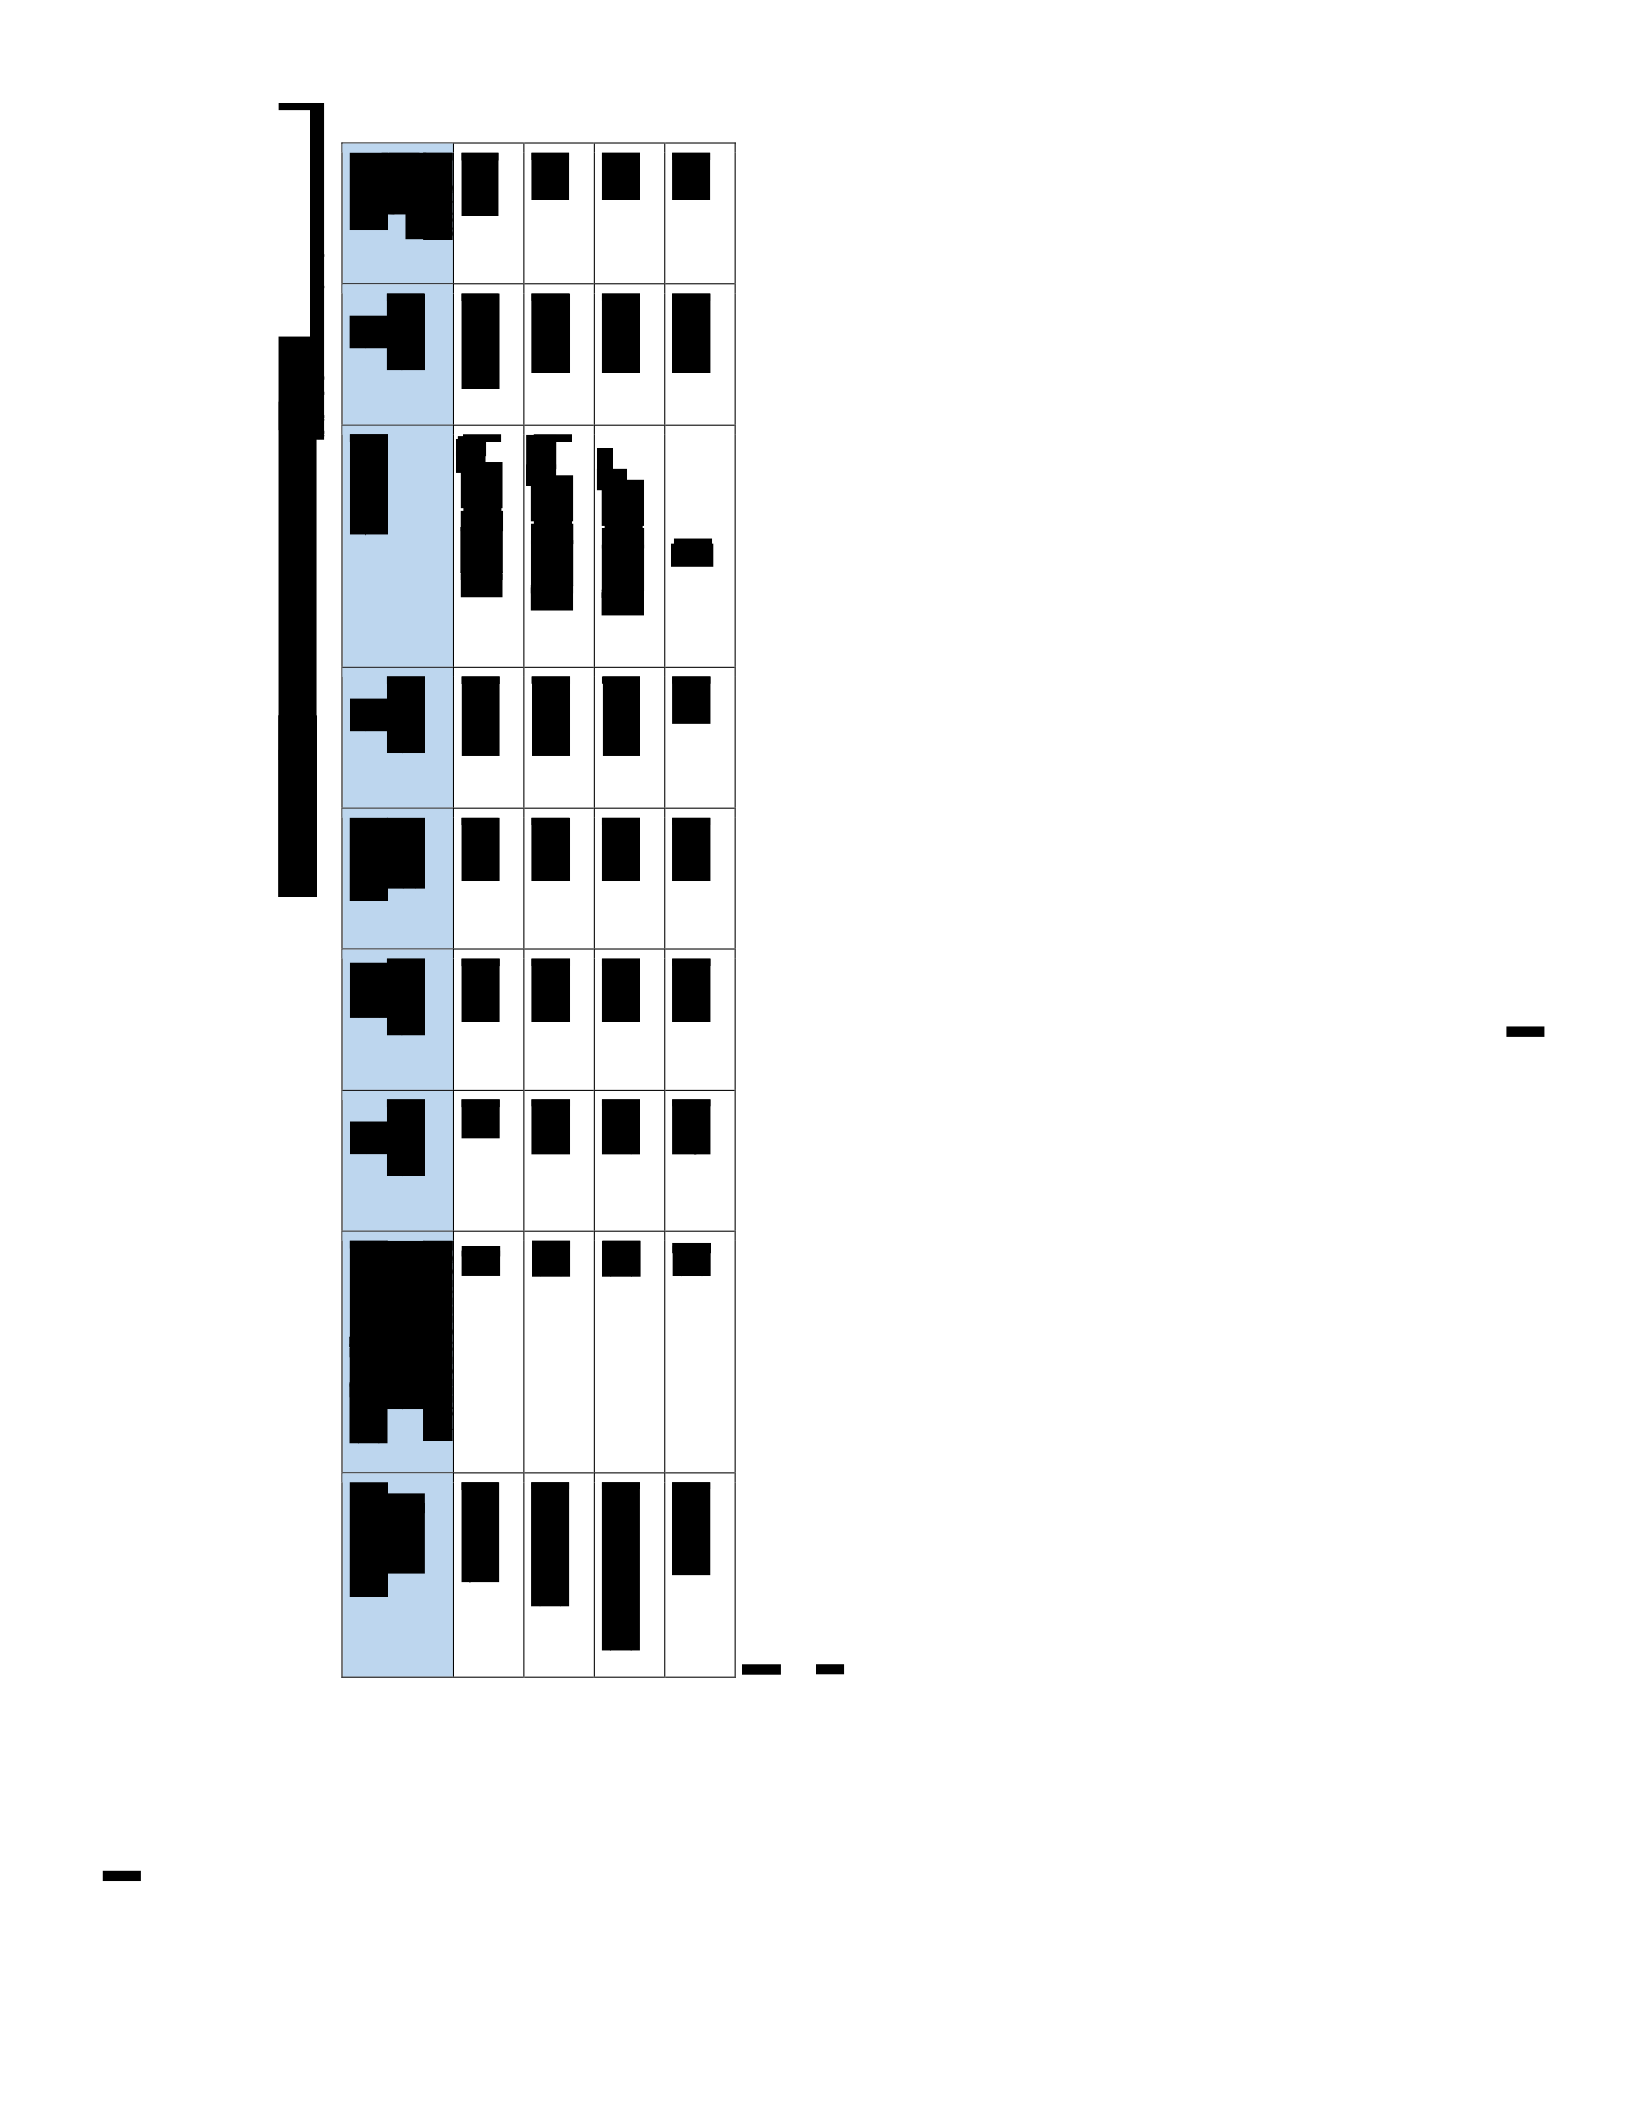
After applying equation 4.2 referenced above, the P1 values for each skill level
were determined as shown in Table 4.14. Also, the variable t2, the mean (expected) value
for the completion of Process 2, is related to the expected time (ET) for Process 2 and is
given by 5.8*ET, where ET is given by the following equation [McQueen et al., 2006] :
𝑉 𝑟
𝐴𝑀
𝐸𝑇 [𝑟 ((𝑁𝑀−𝑖 +2)/(𝑉−𝑖 +1))]
𝑉
𝑟 𝑖=2
(4.3)
where
AM is the average number of vulnerabilities for which an exploit
can be found
NM is the number of vulnerabilities not able to be used (NM=V-
AM)
V is the number of vulnerabilities on the component of interest
r is the number of tries
Equation 4.3 should be evaluated using a V value of 100 vulnerabilities and with
AM/V ratios referenced in Table 4.12 above, as provided by McQueen et al. [2006]. A
spreadsheet analysis tool has been constructed which utilizes the model available from
McQueen et al. [2006], and the analysis process is shown in Figure 4.6.

Figure 4.6 Method of analysis of Human View data for TTC model
Next, the u variable, which represents the probability that Process 2 is not
successful, is calculated using equation 4.4 [McQueen et al., 2006].
𝑢 =(1− 𝐴𝑀 )𝑉
𝑉
(4.4)
Next, t3 is calculated to be able to solve for the time to compromise (T). The t3
value represents the mean (expected) value of Process 3 to complete successfully. It is
found using equation 4.5 [McQueen et al., 2006].
𝑉
𝑡
𝐴𝑀
(4.5)
Finally, the overall time to compromise (T) can be calculated via equation 4.1. To
demonstrate the quantitative nature of the TTC model and the aforementioned negative
correlation between skill level and TTC, an additional analysis was conducted for 75,
150, and 250 vulnerabilities within a system, in addition to the model already discussed
that assumes 100 vulnerabilities within the system. The following overall times to
compromise were determined:
Table 4.13 TTC (in days) for a given number of vulnerabilities
Skill Level
75 Vulnerabilities
100
Vulnerabilities
150
Vulnerabilities
250
Vulnerabilities
Novice
25.0
22.0
17.8
10.9
Beginner
6.5
4.7
2.7
1.3
Intermediate
2.3
1.7
1.2
1.0
Expert
1.1
1.0
1.0
1.0
The data compiled were graphed as shown in Figure 4.7 below. The graph
demonstrates that, as skill level increases from novice to expert, the TTC for a given
number of vulnerabilities decreases. The data produced reiterate the previous conclusion
that, as skill level increases from novice to expert, the danger posed by a would-be insider
threat increases (as shown in this case study), because the TTC decreases greatly as skill
level increases.
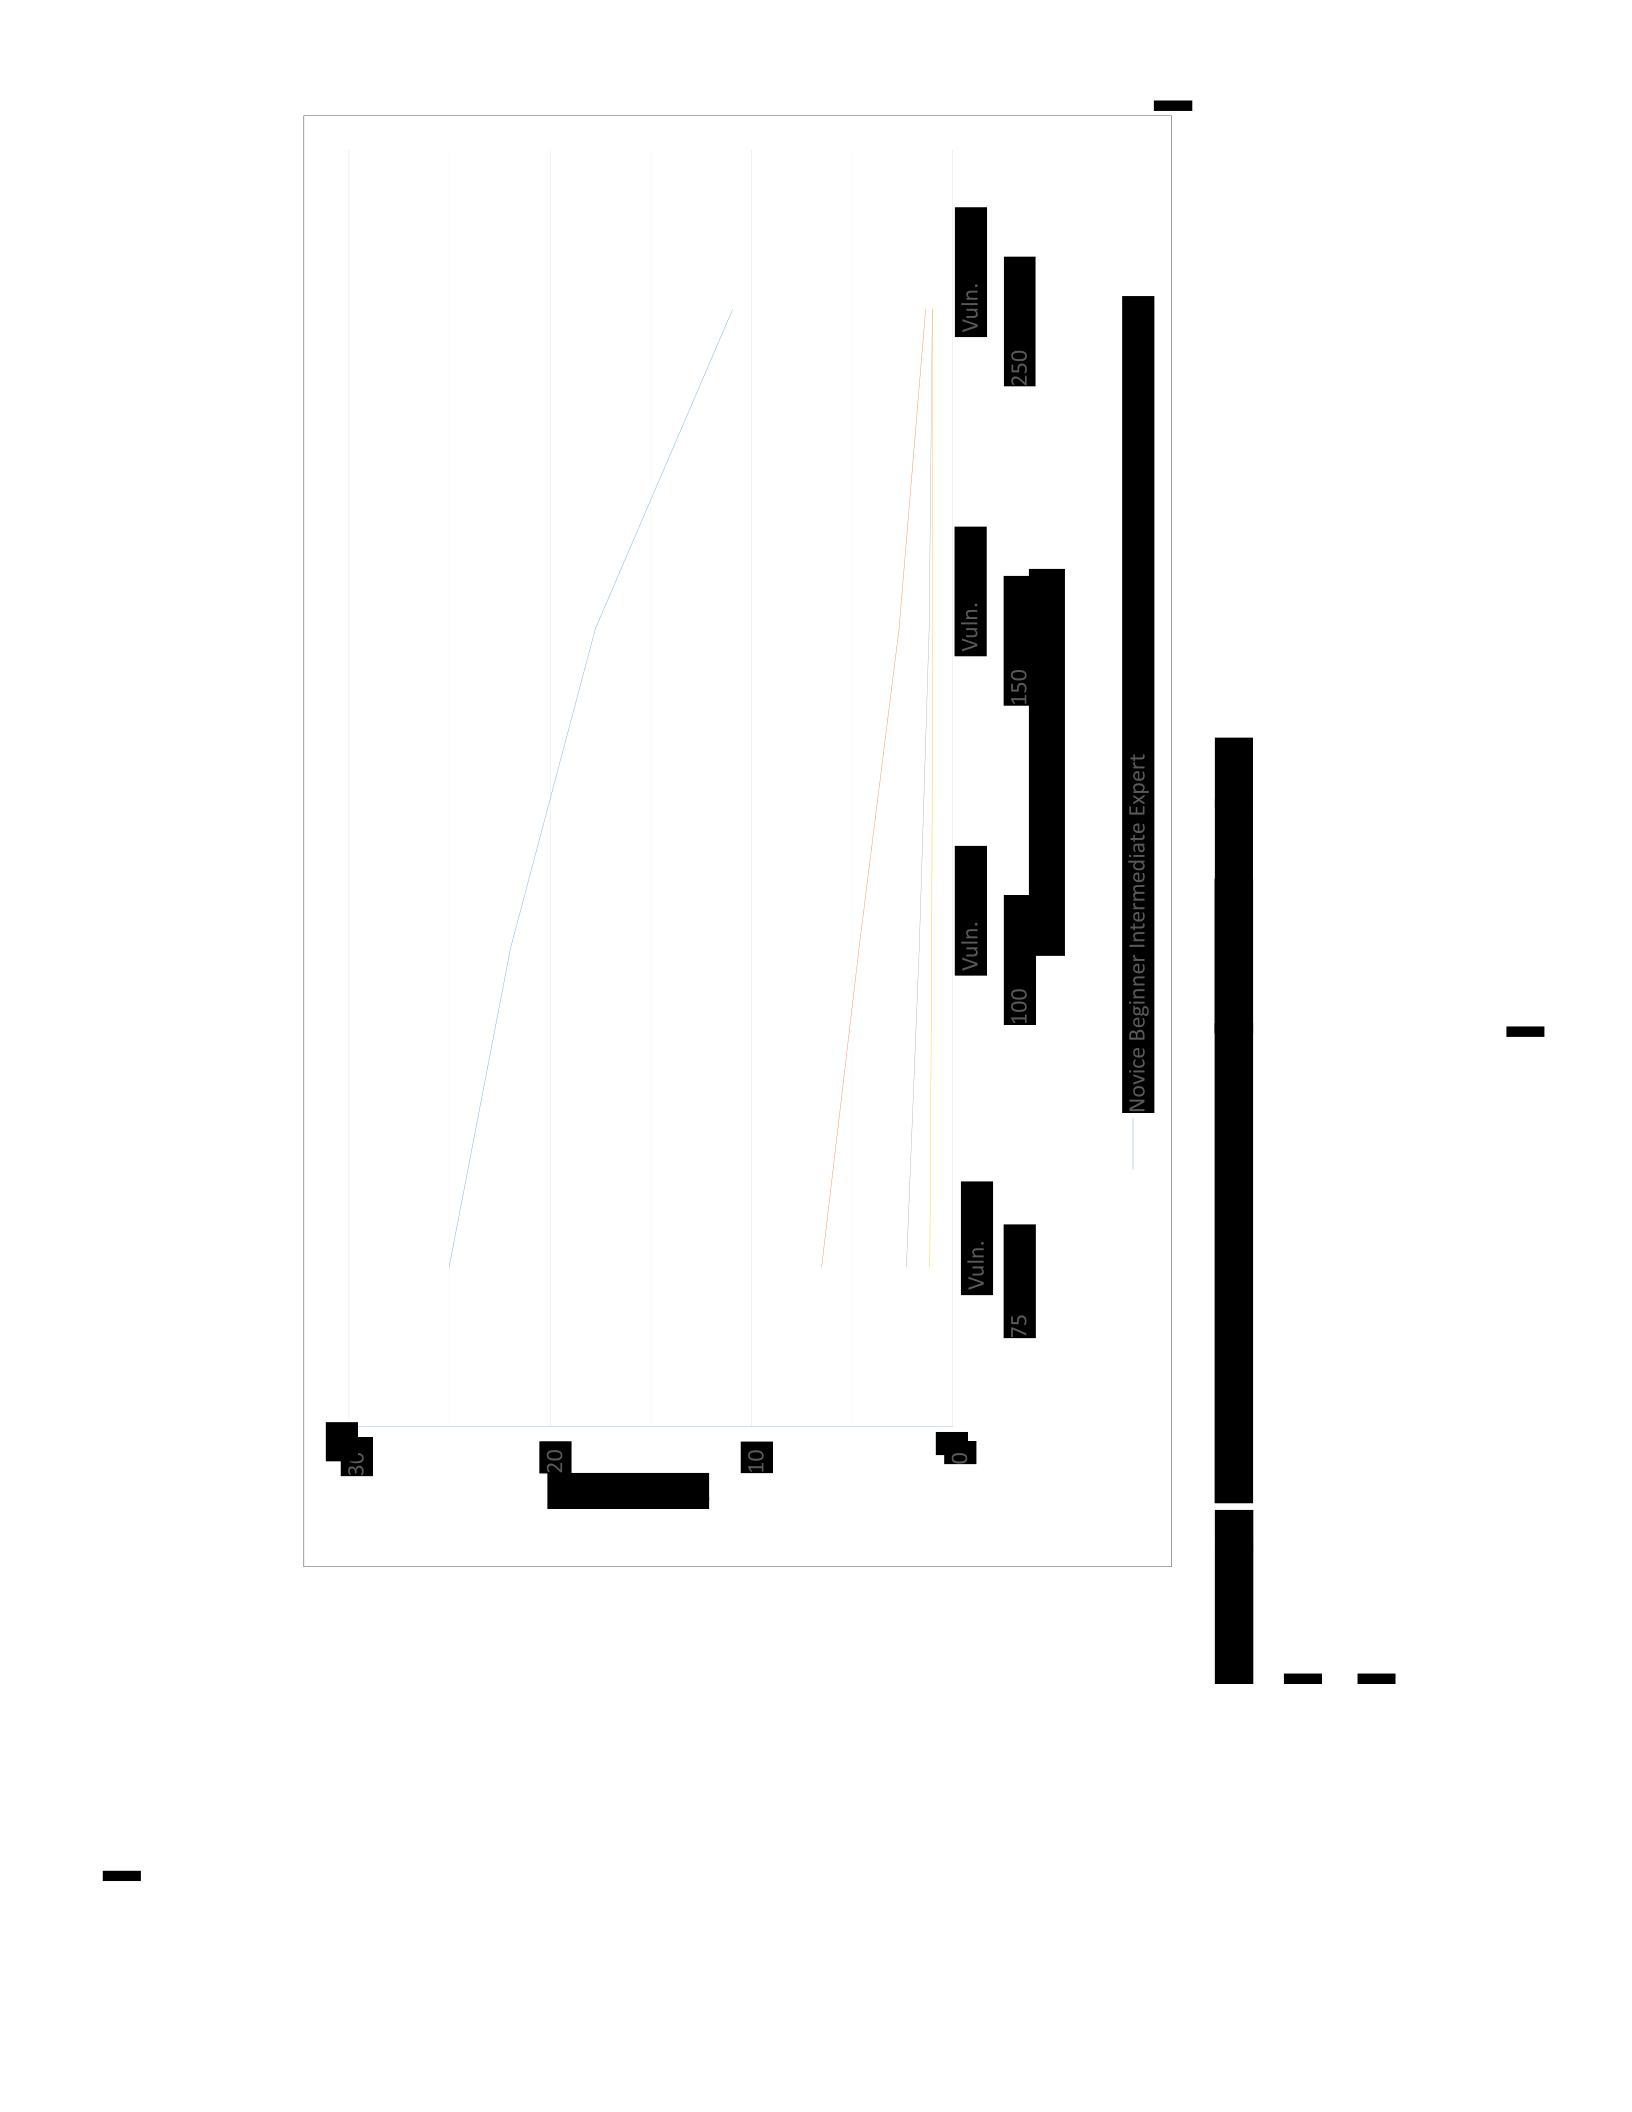
S[OAQ]
[EJS
USAIS
Joj
(SAep
Ul)
BVP
DLLJo
ydeis
ourq
/"p
DUNST
Wedxq
a1e!pawJazu|
JAUUIZag
SIIAON
SOHIQesaU[NA
JO
JOqLUNN
OSC
OST OOT
SZ
“UINA
“UNA
“UNA
“UINA
OT
(sAeq)
DLL
0c
O€

The TTC values provided illustrate that, as competency increases, the ability of an
attacker to compromise the system increases as well (since the time until the system is
compromised decreases). The information presented about the HV-C demonstrates that
competency increases as skill level increases – that is, with the passing of classes to reach
a higher level, one gains more abilities that could be used to attack an electrical
transmission and distribution system. The use of TTC data shows this fact very clearly. In
the context of preventing insider threats, an analyst could divide up the workers in a
facility into categories similar to those used by McQueen et al. [2006] (e.g., beginner or
intermediate) to determine which employees have the unique combination of tasks and
skills required to participate in specific exploitation activities. The analyst could focus on
those with higher skill levels because the analyst would be aware that those with higher
skill levels generally pose a greater threat, and, consequently, the analyst could use
resources more efficiently by focusing mostly just on those posing the greatest threat to
the system, as judged by skill level. Since the vulnerabilities introduced by humans in the
electric power system have been identified, the next step is to identify the system
vulnerabilities.
4.3 Illustrative case study: System architecture assessment (path 2)
4.3.1 Introduction
While the human architecture assessment produced results about the operations of
the electrical power system, this section will assess a component of the physical system,
the electrical substation. This is an important problem because recent attacks on electrical
substations, specifically the Pacific Gas and Electric Metcalf substation attack, have
driven the Federal Energy Regulation Commission (FERC) to approve requirements for
substation protection. In the next section, a background of electrical substation security

will be given to provide context to this portion of the case study. Then, the method
developed will be used to provide decision makers with security alternatives based on
their cost and risk constraints.
4.3.2 Background on substation security
Several attacks on electrical substations have taken place over the past few years.
One such attack occurred in April 2013 at the Pacific Gas and Electric Corporation
Metcalf substation, where gunmen fired bullets at the substation and caused millions of
dollars in damage [Brinkman et al., 2015]. As the concern about physical security of
substations increased, the FERC directed the North American Electric Reliability
Corporation (NERC) to do the following:
Submit for approval one or more Reliability Standards that will require certain
registered entities to take steps or demonstrate that they have taken steps to
address physical security risks and vulnerabilities related to the reliable operation
of the Bulk-Power System. The proposed Reliability Standards should require
owners or operators of the Bulk-Power System, as appropriate, to identify
facilities on the Bulk-Power System that are critical to the reliable operation of
the Bulk-Power System. Then, owners or operators of those identified critical
facilities should develop, validate and implement plans to protect against physical
attacks that may compromise the operability or recovery of such facilities
[NERC2014-04, 2016].
This resulted in the approval of the Critical Infrastructure Protection (CIP) standard for
physical security measures (CIP-04-01) on November 20, 2014 [NERCPSSI,
2016].
The primary purpose of CIP-014-01 is to “identify and protect Transmission
stations and Transmission substations, and their associated primary control centers, that if

rendered inoperable or damaged as a result of physical attack could result in widespread
instability, uncontrolled operation, or cascading with an interconnection” [2016]. The six
requirements that transmission owners must meet to comply with this standard are listed
in Table 4.14.
Table 4.14 Summary of OR model building process [DoDAF202, 2014]
Requirement ID
Summary
R1
Initial Risk Assessment
R2
Third party verification
R3
Notice to operators of control centers
R4
Evaluation of threats and vulnerabilities of physical attack
R5
Security Plan
R6
Third party review of evaluation and security plan(s)
The approach developed can be used throughout this process, but it would likely
be most beneficial in helping with the evaluation in requirement R4. One of the factors
recommended for the evaluation of threats and vulnerabilities is the past history of attack
[CIP-014-01, 2016], which will be represented as an activity diagram in the method
presented in the case study.
4.3.3 System VA approach
In this section, the system VA approach is demonstrated. A distribution substation
is shown in Figure 4.8. The substation used in this example is assumed to be a 280 foot
by 280 foot fenced or walled area. The analysis will focus on physical security parameters
such as lighting, manned patrols, fences and walls. The “to-be” architecture for a
substation is explored, but the analysis can also be applied to an “as-is” architecture for
evaluation.
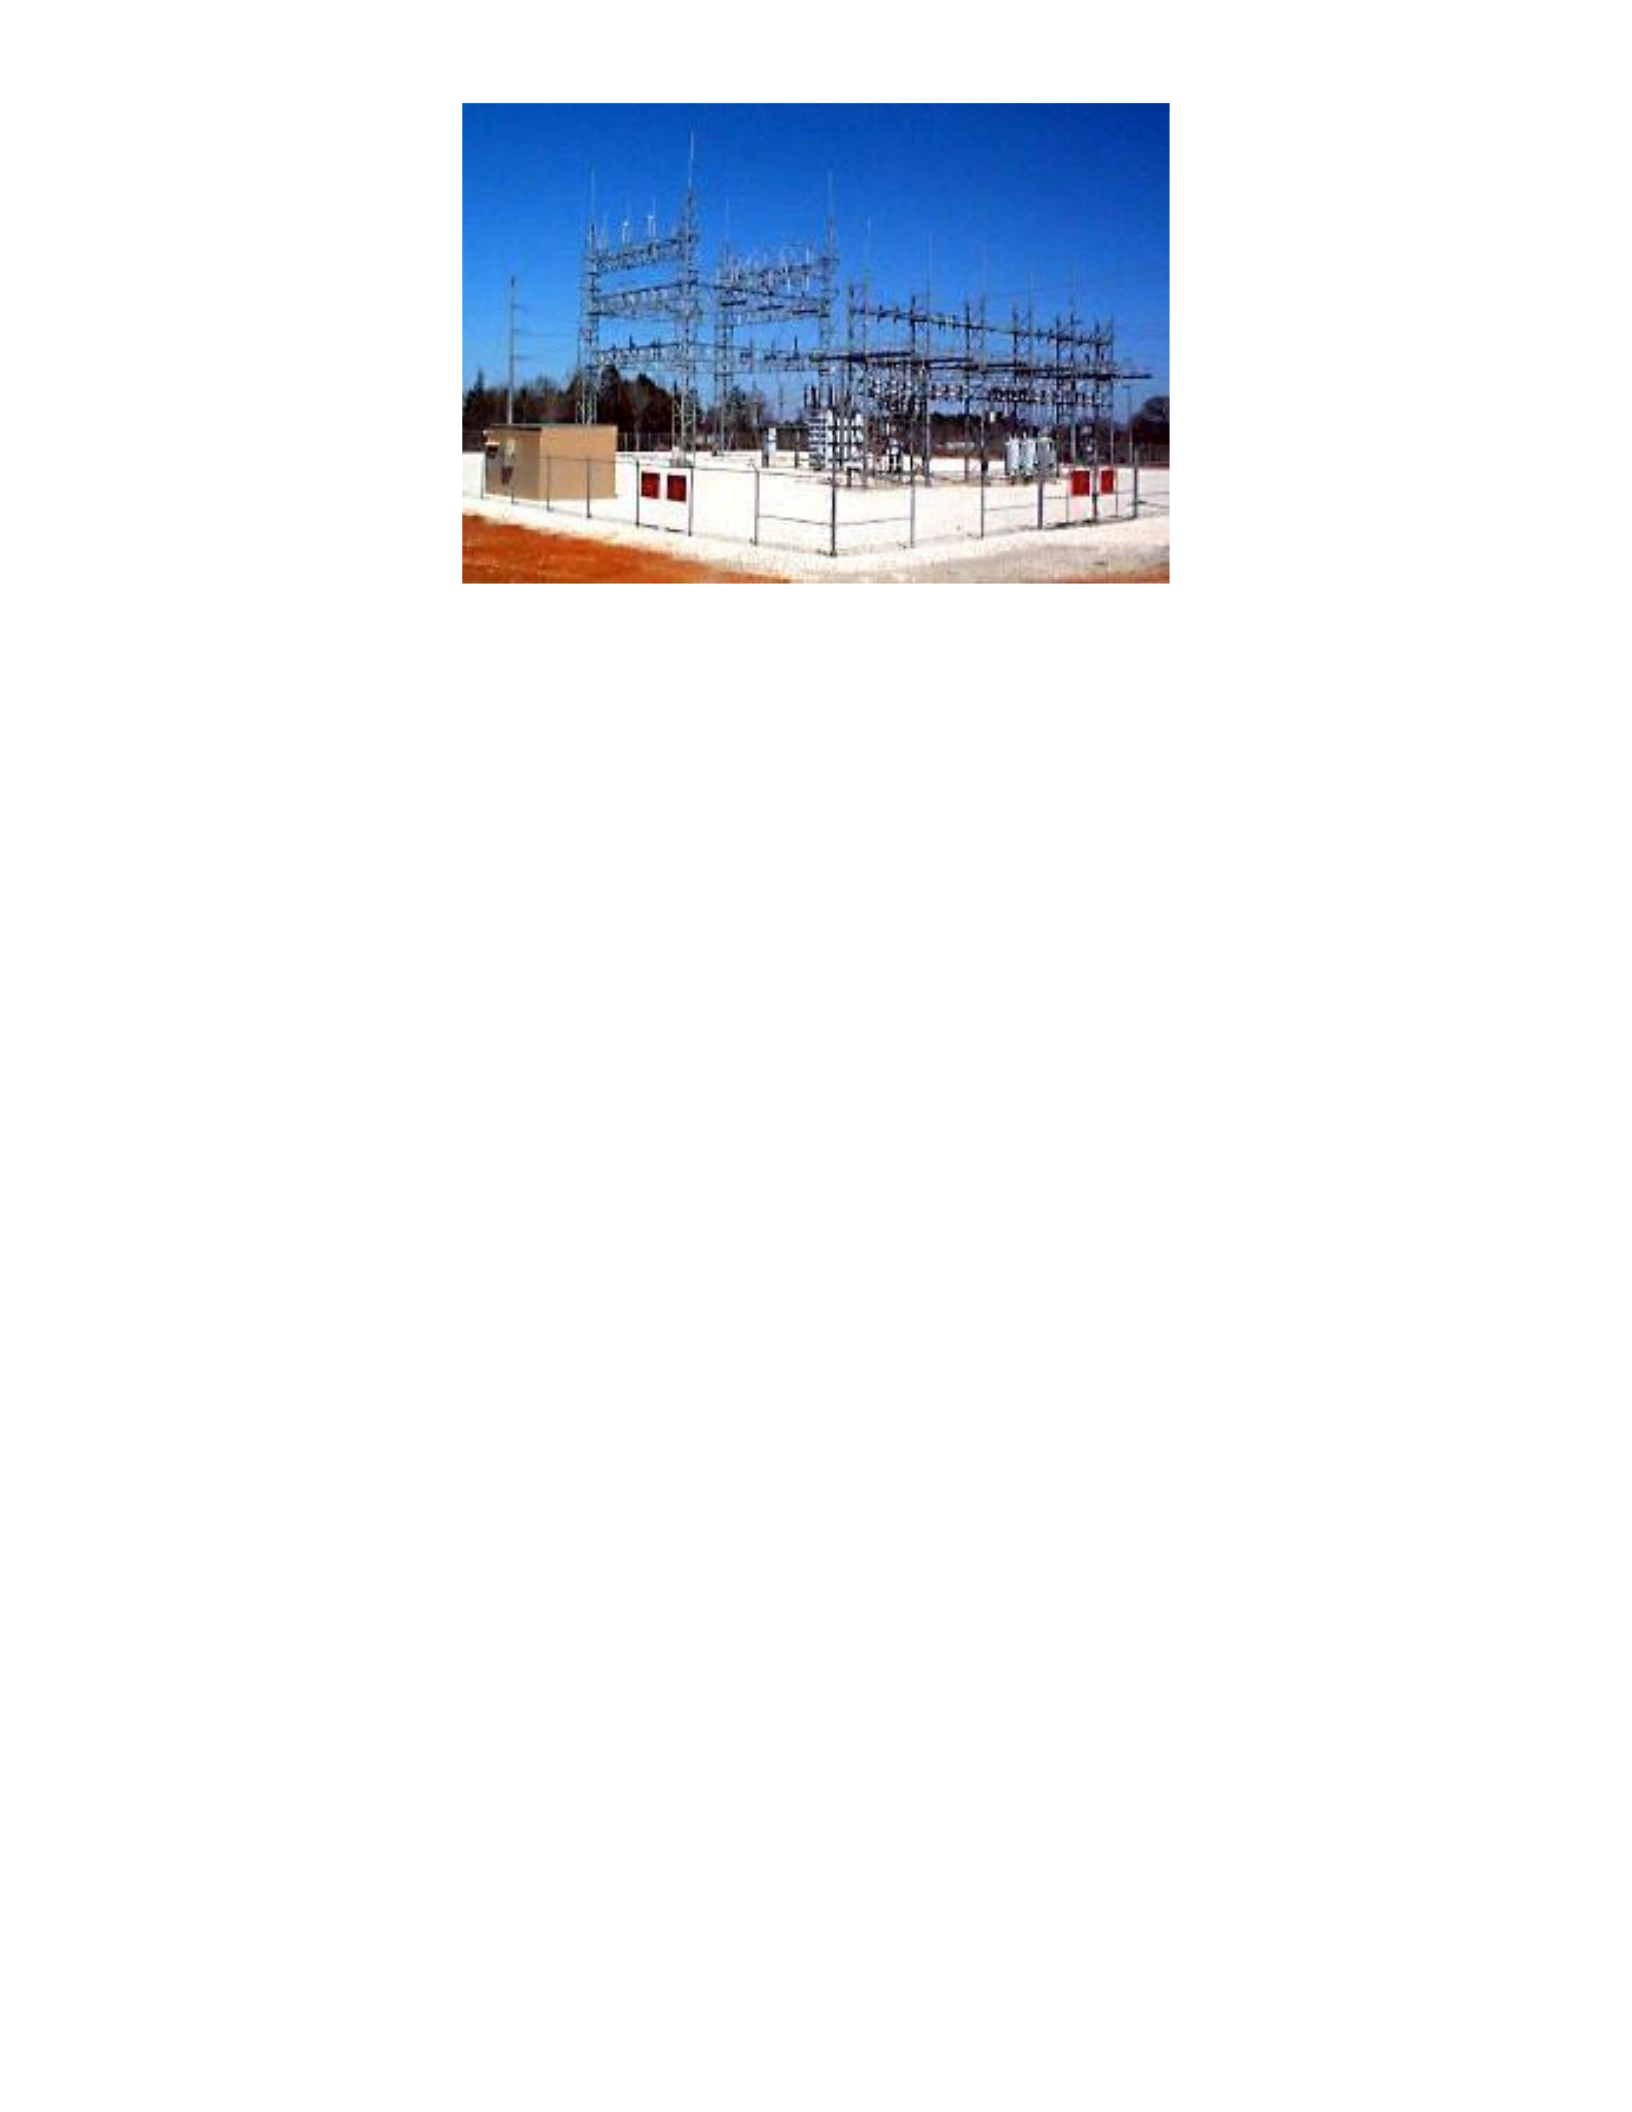
Figure 4.8 Distribution substation [OSHA, 2016]
For this approach, we use the Innoslate [2016] tool by SPEC Innovations for the
model development. This tool was selected because it supports model based systems
engineering and DoDAF.
4.3.3.1 Gather documentation
Three major references are used in this example. The first reference is the IEEE
Guide for Electrical Substation Physical and Electronic Security (IEEE Std 1402TM 2000).
This guide was written to present methods and techniques to prevent human intrusions
into substations [IEEE, 2008]. There are many other guides or standards that can be used,
but we selected that one for this example. McDonald [2012] and Blume
[2007] provided the basis for the system description meta-data in the structural diagram.
Additionally, the activity diagram documentation for the historical attack scenario was
derived from Brinkman et al. [2015] and Smith [“Assault” 2014].

4.3.3.2 Create list of requirements or statements
The statements that are used are shown in Table 4.15. These are directly from
IEEE Std 1402TM -2000 [2008] and only a subset of the security recommendations are
shown below.

Table 4.15 Partial Innoslate export of statements from IEEE Std 1402TM -2000 [2008]
Statements
Number
Name
Description
6.1.1
Fences
Fences of various materials providded primarily to limit access to substation
property; refer to the National Electrical Safety Code (NESC) (Accredited
Standards Committee C2-1997) for fence requirements. In addition, adding
top and bottom rails on fence sections, closed track roller systems to sliding
gates, and methods such as welding to prevent hinge pins and bolts from
being easily removed, may improve the overall integrity of the fencing
systems.
6.1.2
Walls
Solid masonry or metal walls may provide an additional degree or security.
Solid walls are generally more difficult to breach and also prevent direct
line-of-sight access to equipment inside the substation.
6.2.1
Photoelectric
/motion
sensing
Perimeter systems using photoelectric or laser sensing may be utilized to
provide perimeter security. Overall area security may be provided by
motion-sensing devices; however, great attention should be shown in the
placement of these devices since animal intrusion alarms may become a
nuisance and sensors may be deemed ineffective.
6.2.2
Video
Surveillance
Systems
Video systems can be deployed to monitor the perimeter of the substation,
the entire substation area, or the building interiors. Systems of this type
require 24 h monitoring, which can be a costly alternative. Video systems
are available that utilize microwave and infrared to activate a slow-scan
video camera. This can be alarmed and monitored remotely and
automatically videotaped.
4.3.3.3 Create a structural view of the system
The structural view of the system is based on Figure 4.9. A DoDAF SV-1 Systems
Interface Description is used for the structural view. For this example, none of the blocks
are linked to a lower level of detail, such as showing the connection of actual
transformers within the transmission and distribution substation blocks.
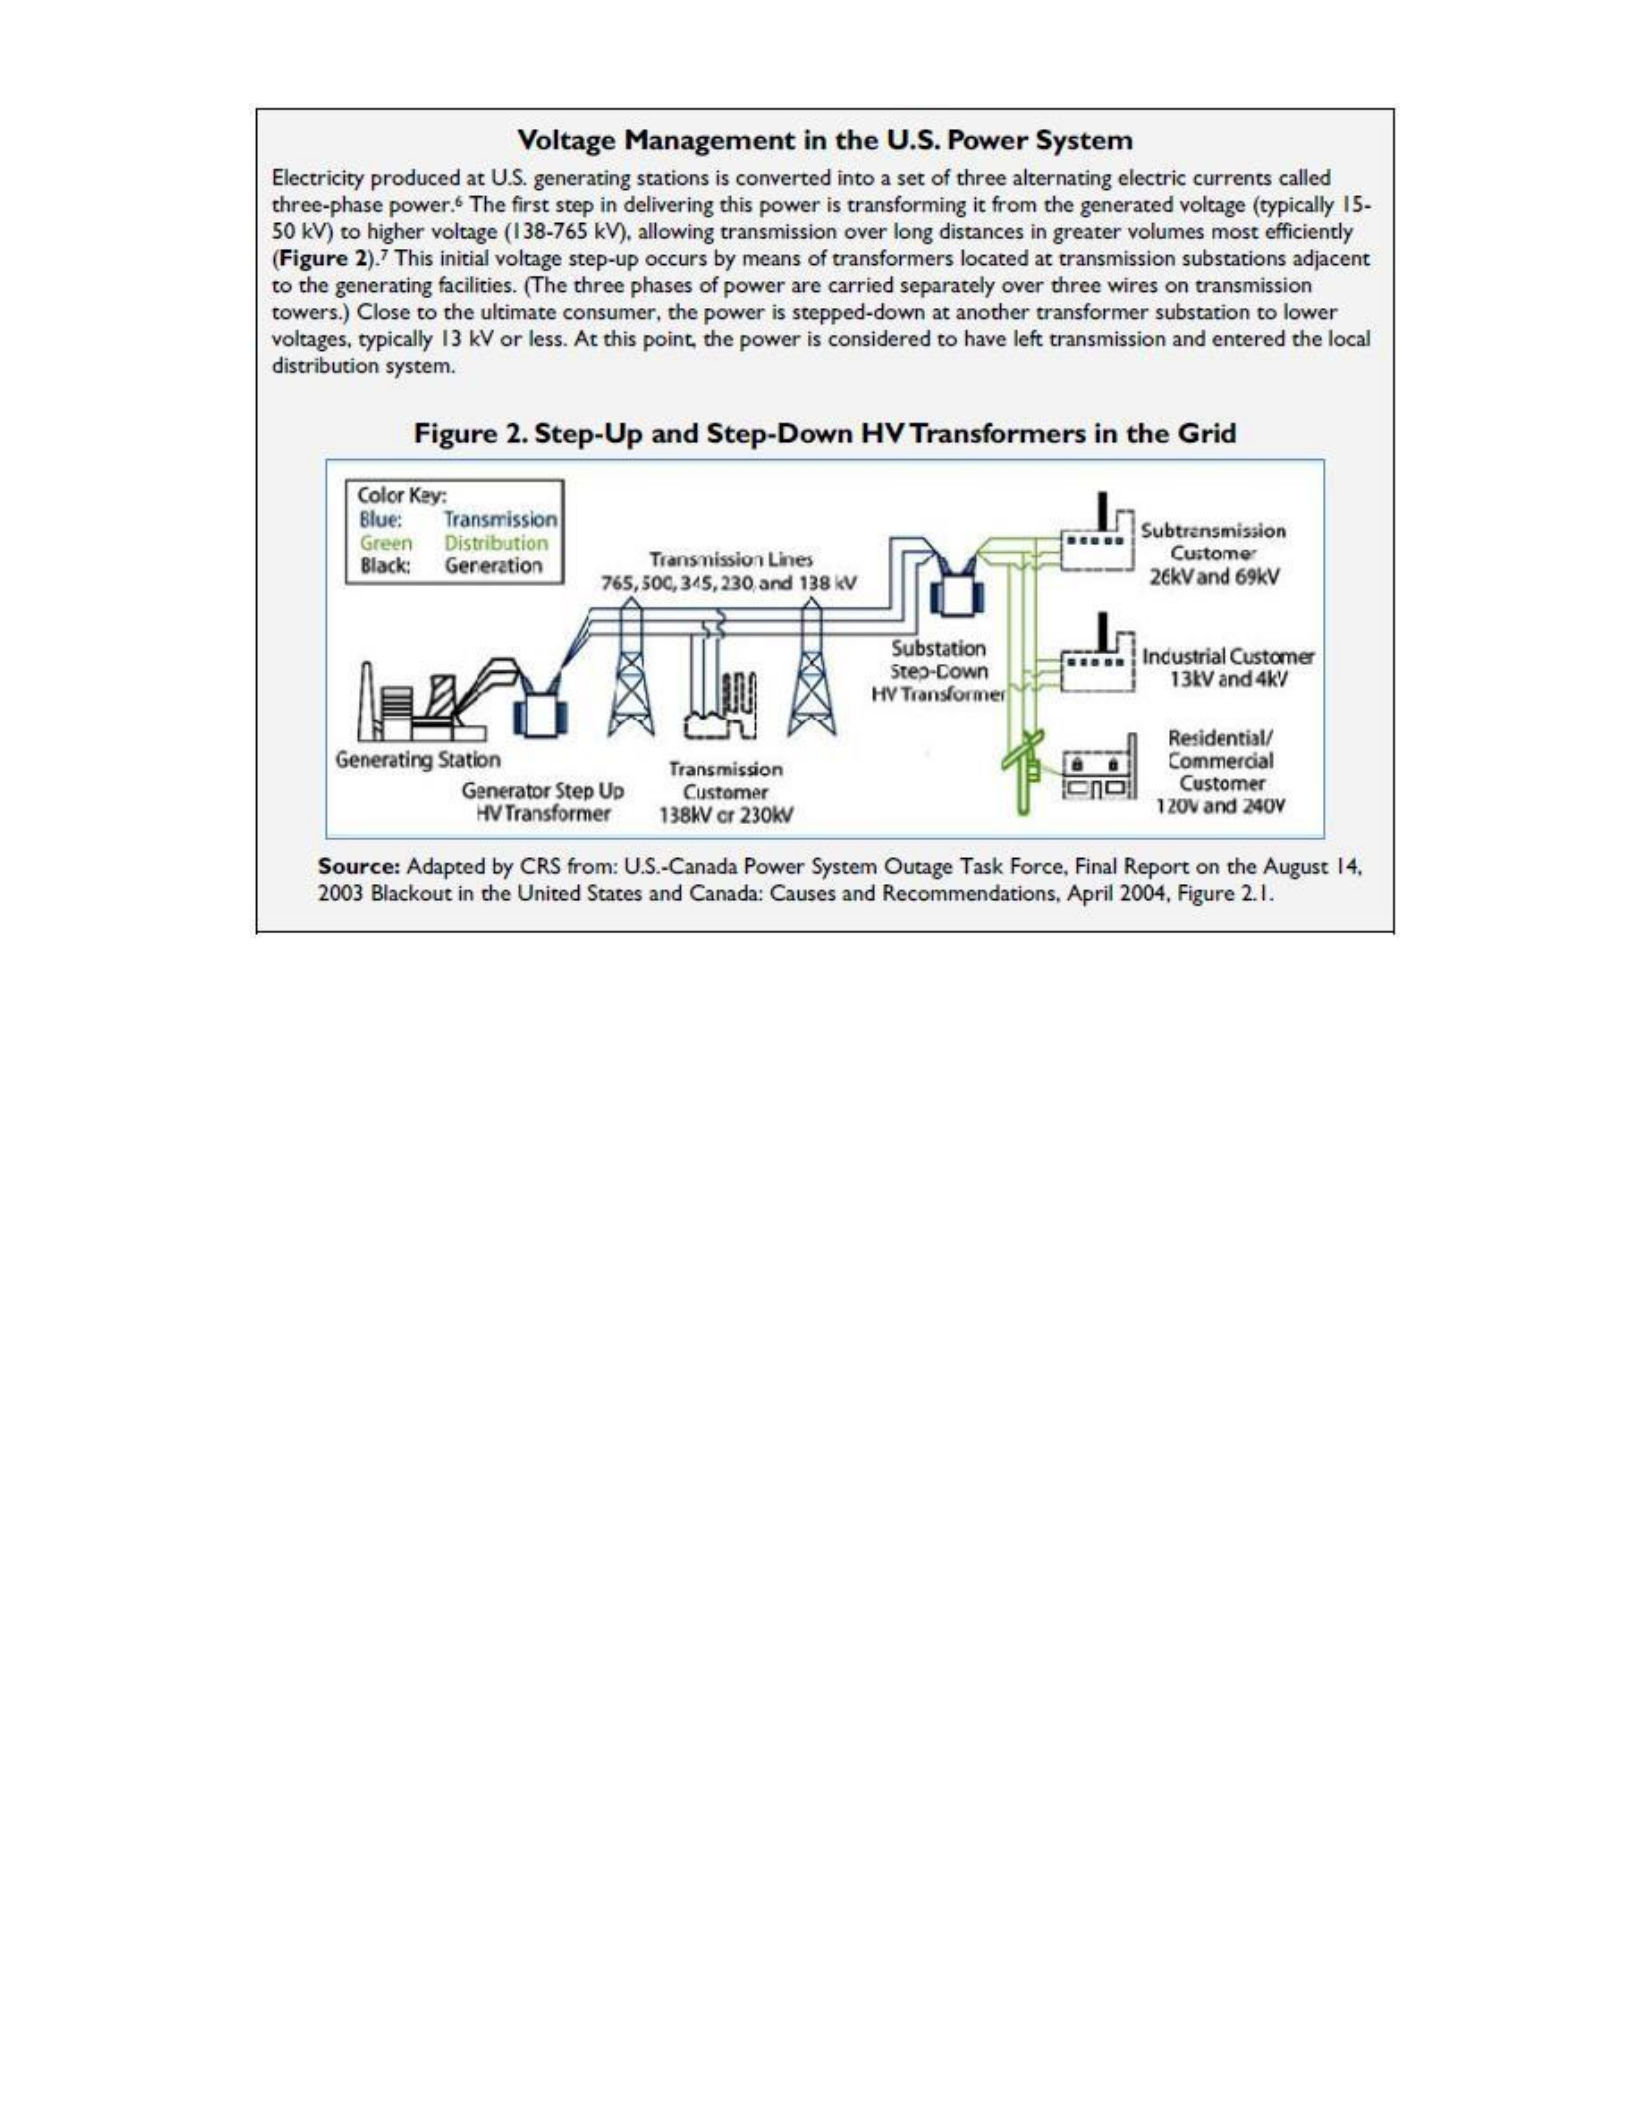
Figure 4.9 Overview of power grid [Parfomak, 2014]
In the SV-1 in Figure 4.10, each block in the tool has meta-data associated with it.
Blocks are identified as assets or resources for this view. For identification purposes,
‘(Resource)’ was added to the blocks that are resources for assets in the architecture. In
the figure below, communications infrastructure and video surveillance are just two
examples of identified resources. Each of the resource blocks is linked to the appropriate
statements from IEEE Std 1402TM -2000 [2008] as defined above. This ensures that the
initial architecture meets recommended standards. For example, ‘video surveillance
(Resource)’ was ‘traced from statement’ 6.2.2 Video Surveillance Systems (see Figure
4.13) in the Innoslate [2016] tool. If there is no traceability from the recommendation to a
security resource in the system, this may be a gap in the architecture that needs to be
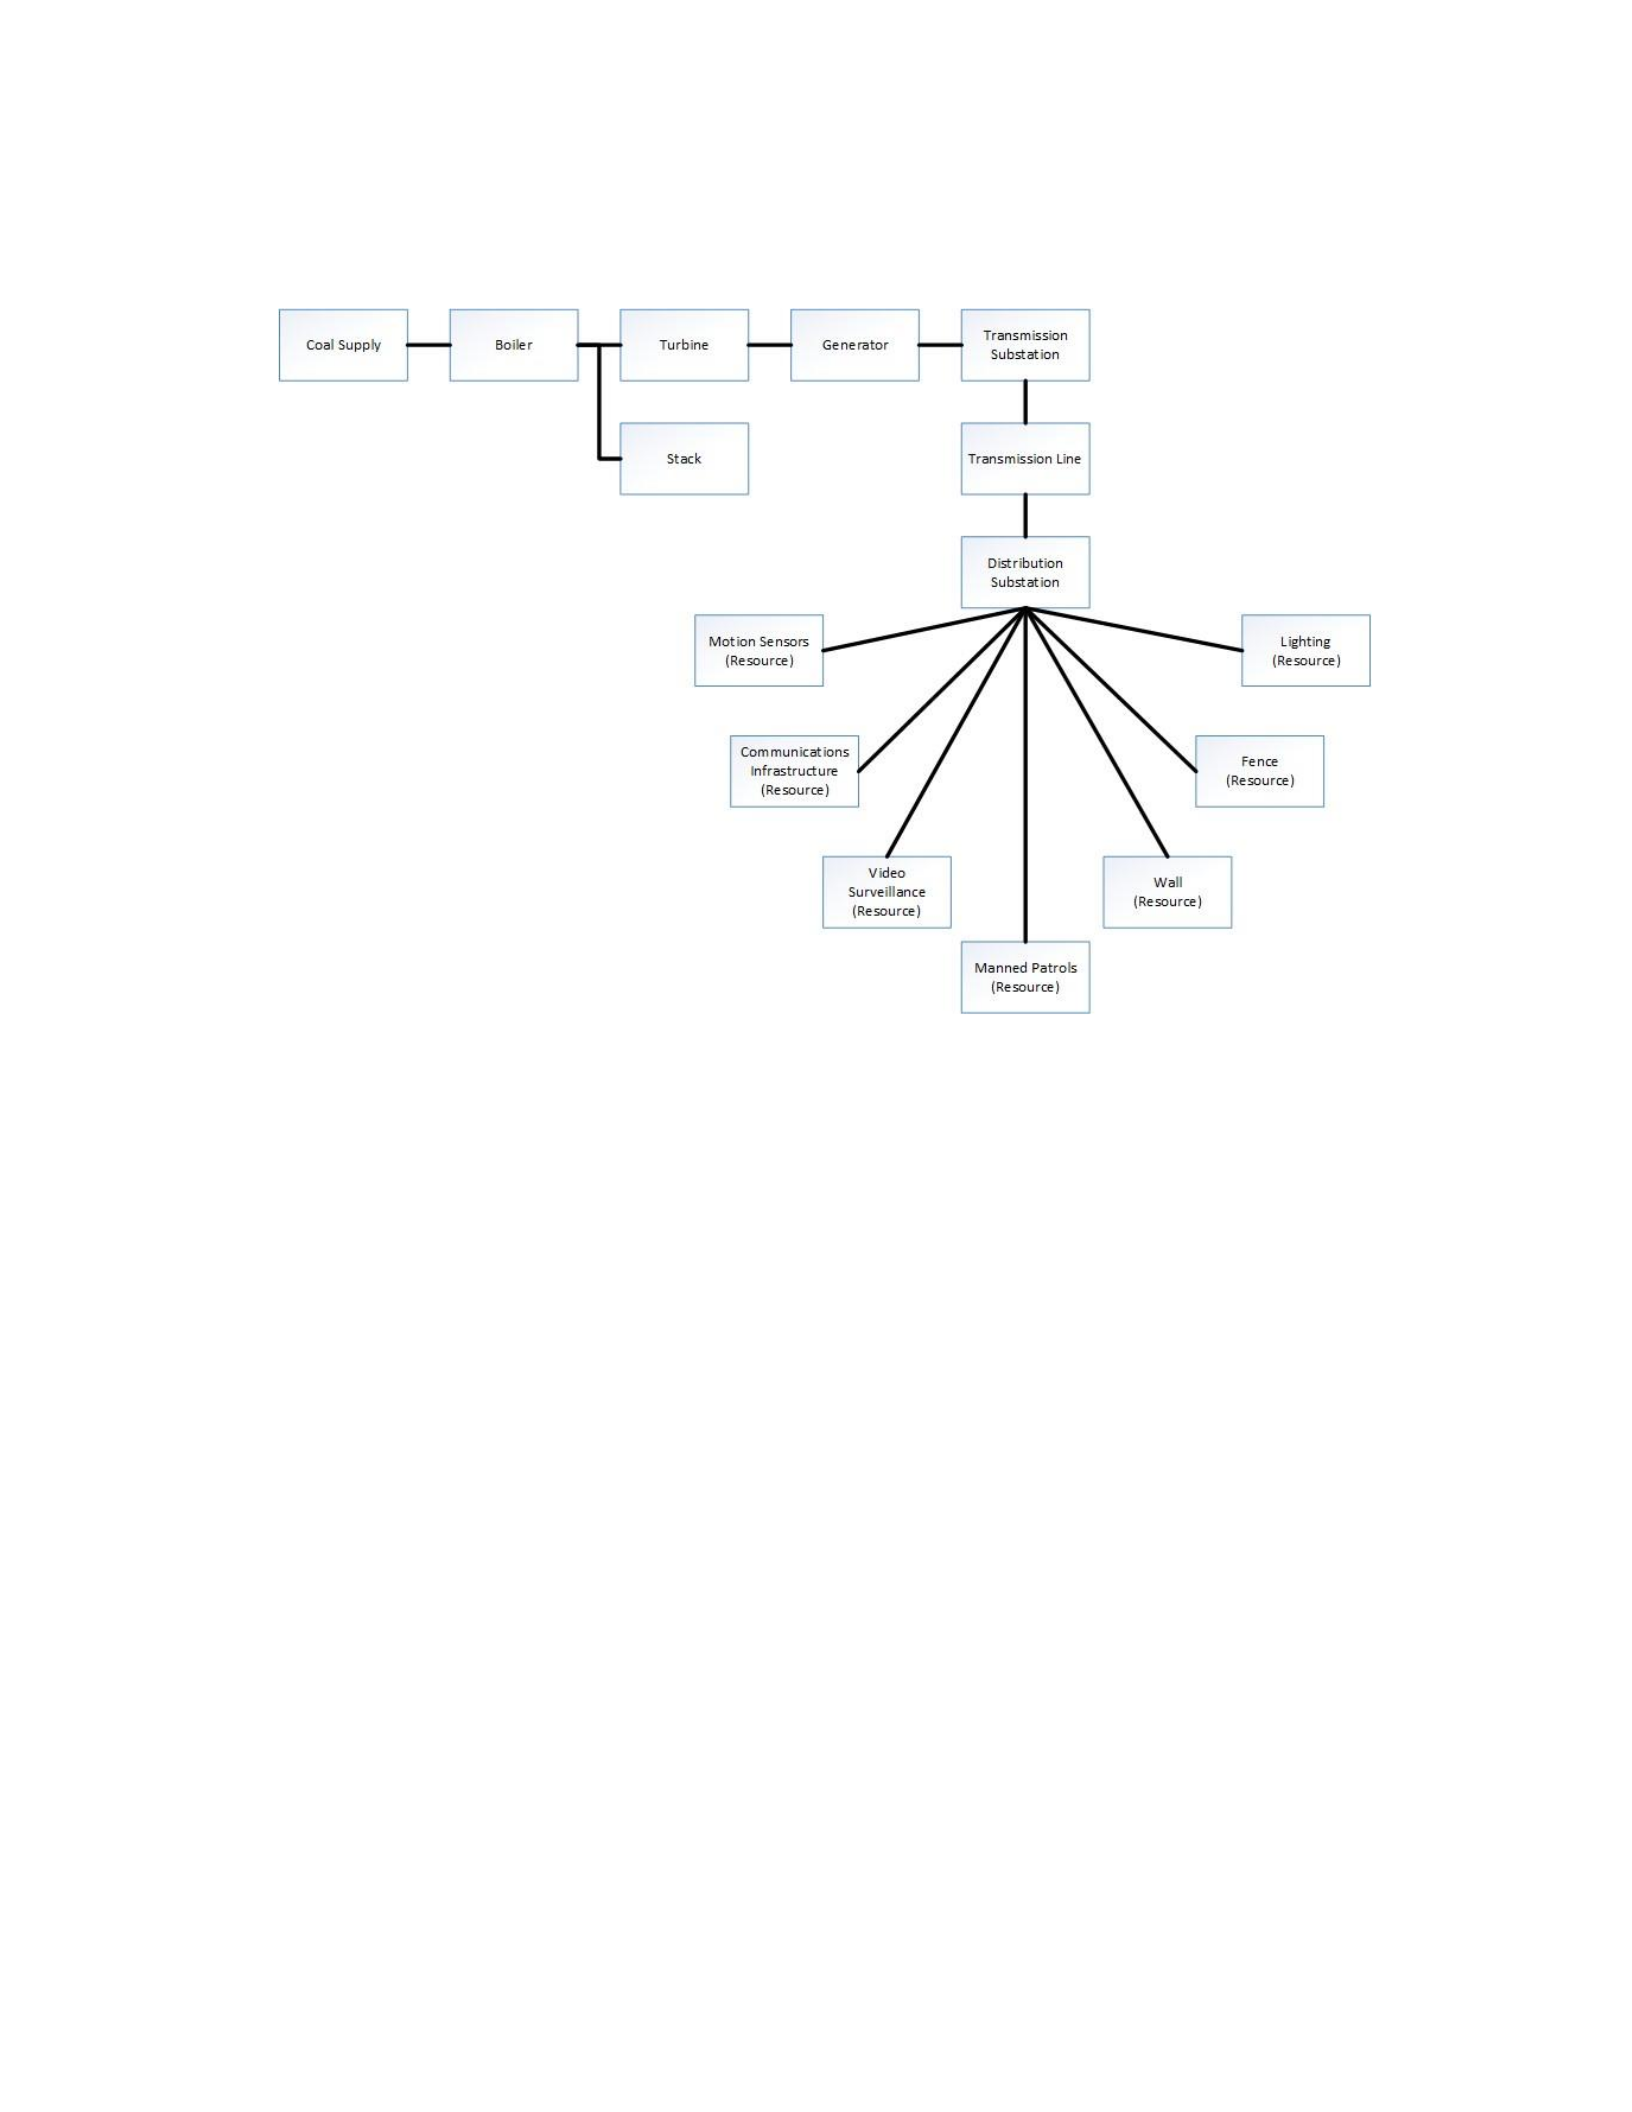
evaluated. In this analysis, we will allocate these resources to obtain the selected security
effectiveness.
Figure 4.10 SV-1 System interface description
4.3.3.4 Create activity views of past and potential future attacks
4.3.3.4.1 Historical substation attack
Now that there are standards and a structural diagram of the system is in the tool,
the next step is to describe the historical attacks on the system or similar system in an
activity diagram. For this example, we will use a DoDAF OV-5b Operational Activity
Model. There are several historical attack scenarios that could be used, as detailed in
Brinkman et al. [2015], but, for this example, we will only use one historical scenario.
The attack scenario used will be the Metcalf substation attack that occurred on April 16,
2013, in which snipers attacked the Pacific Gas and Electric Metcalf substation near San
Jose, California [Brinkman et al., 2015; Smith, “Assault” 2014]. The result of the attack

was that 17 transformers were damaged [Smith, “Assault” 2014], and repair costs
approached $15.4 million [Brinkman et al., 2015]. The detailed series of events was
captured by Smith [“Assault” 2014] and are listed in Table 4.16.
Table 4.16 Timeline of Metcalf attack [Smith, “Assault” 2014]
Time
Description of Event
12:58 a.m.
AT&T fiber-optic telecommunications cables were cut—in a way that
made them hard to repair—in an underground vault near the substation,
not far from U.S. Highway 101 just outside of south San Jose.
1:07 a.m.
Some customers of Level 3 Communications, an Internet service
provider, lost service. Cables in its vault near the Metcalf substation were
also cut.
1:31 a.m.
A surveillance camera pointed along a chain-link fence around the
substation recorded a streak of light that investigators from the Santa
Clara County Sheriff's office think was a signal from a waved flashlight.
It was followed by the muzzle flash of rifles and sparks from bullets
hitting the fence. The substation's cameras weren't aimed outside its
perimeter, where the attackers were.
Approximately
1:37 a.m.
PG&E confirms it got an alarm from motion sensors at the substation,
possibly from bullets grazing the fence, which is shown on video.
1:41 a.m.
The sheriff's department received a 911 call about gunfire, sent by an
engineer at a nearby power plant that still had phone service.
1:45 a.m.
Riddled with bullet holes, the transformers leaked 52,000 gallons of oil,
and then overheated. The first bank of transformers crashed and PG&E’s
control center about 90 miles north received an equipment failure alarm.
1:50 a.m.
Another apparent flashlight signal, caught on film, marked the end of the
attack.
1:51 a.m.
Law-enforcement officers arrived, but found everything quiet. Unable to
get past the locked fence and seeing nothing suspicious, they left.
2:03 a.m.
PG&E’s control center called a worker to go to the Metcalf site.
3:15 a.m.
A PG&E worker arrived at Metcalf to survey the damage.
The events in the timeline are described in the OV-5b in Figure 4.11. The process
begins with the AT&T and Level-3 Communications lines being cut. Note that
‘communications infrastructure’ is identified as a mechanism in the diagram for these two
blocks. The development of this diagram is where the links to the structural SV-1 are
made. This shows that, during this scenario, the ‘communications infrastructure’ was a

key component; in this case, it was damaged. Another example is the ‘Video Surveillance’
that is linked to ‘Attackers begin shooting at substation.’ The video surveillance was not
pointed in the direction to capture the attackers, but it did capture what seemed like the
waving of a flashlight to start the attack. The video system worked partially, but there
may be some room for improvement in how much coverage there is of
the facility.
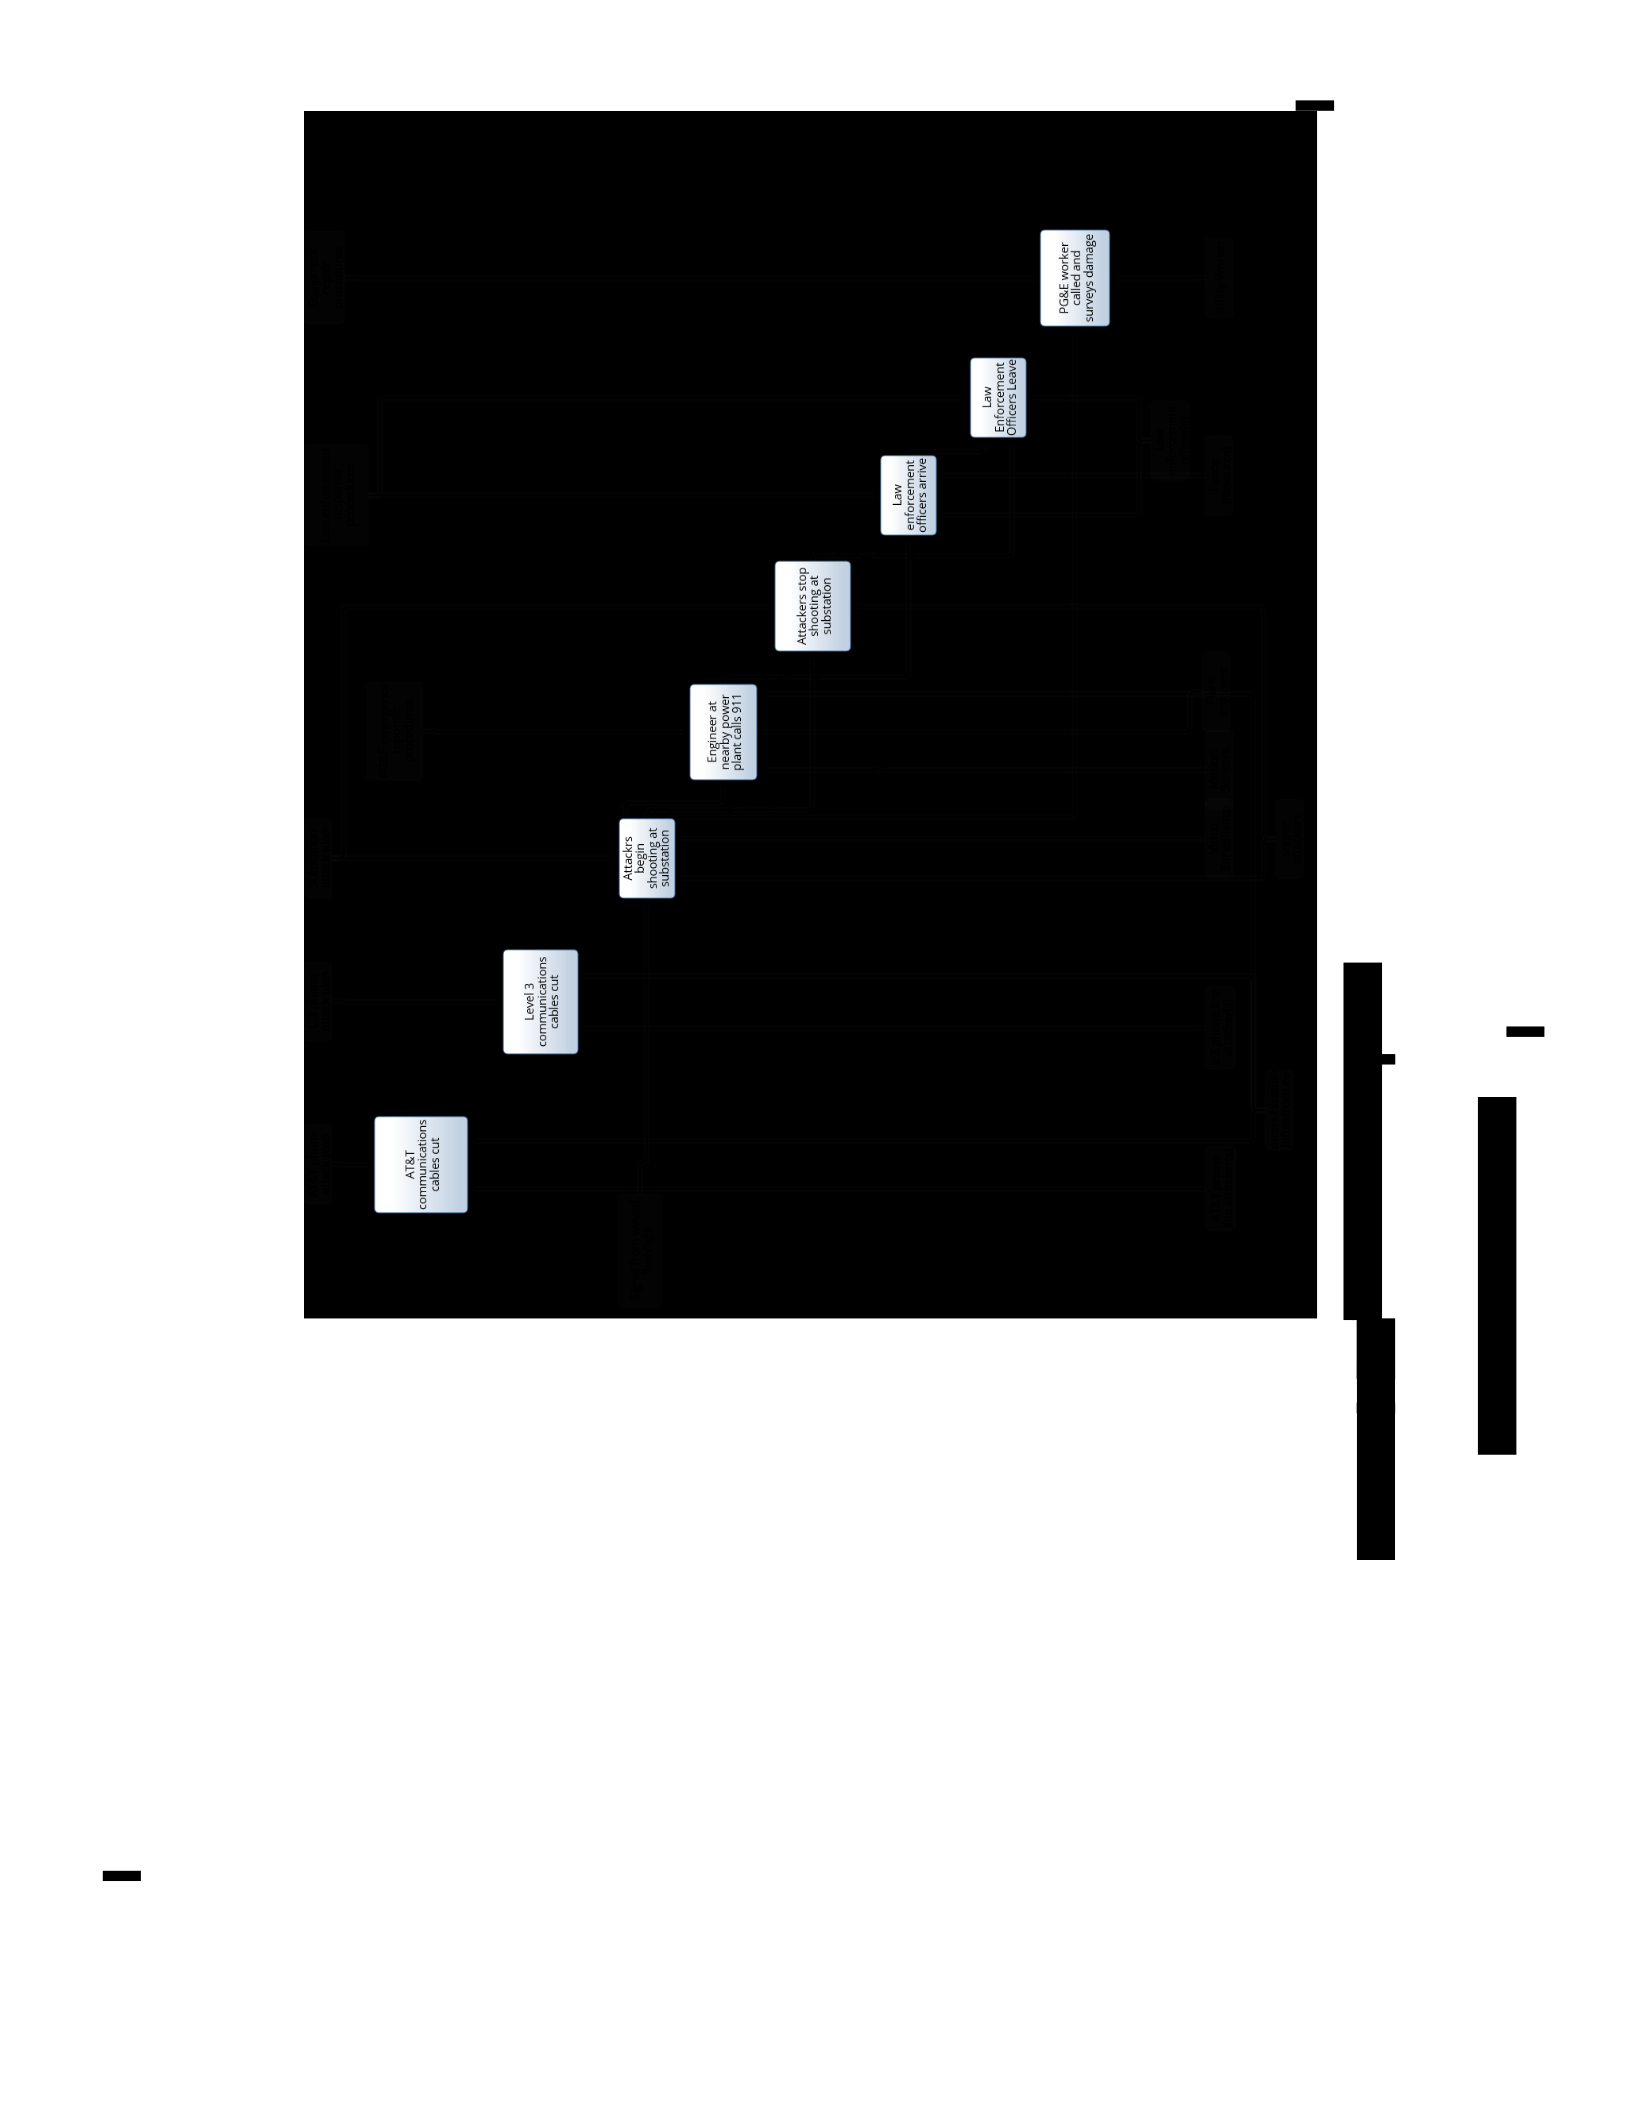
Jao
Quan
agewep
sAavuns
pue
paleo
4ax40M
FBDd
c[>
saunpazoid
dyedai
quatudinby
(aaunosay)
aoua4
Cc]
(s)aaayyo
quawanojug
Me]
ojo
youne
yeaa
jo
q
AO
suaypene
dadius
cp
Jaaulszua
suosuag
a2ue
qudid
UO
oaplA
cl
c]>
Cc]
SAeP2]
s1IYO€
qUaWUSIIOJUZ
meq
L J
pa207
aauad
SALLIE
Sd
aoujo|
qualwa20jue
MET
ci>
sainpazoid
asuodsas
quaWa2OJUa
ME]
Zumocys
oul
wyele
sunpes
buudinba
uoneysqns
ye
Sunooys
dojs
suex2ey
eas
on
jeual
ues
\1e2
|
LL6
syj22
queyd
Jamod
Aquesu
je
Jeaulsuz
L
J
uoneysqns
)
WWUEIE
JOSURS
qe
sunooys
uoneu
ulgaq
SHpeny
|
clo
saunpazod
asuodas
Anuas
saw
PROd
c}>
ued
xpeqe
uoneysqns
aUNINASesJU|
UOMes|UNWWUO:
cp
(suapene
(s)4a42271e
oul]
aul]
auoyd
¢-7
auoyd
Lely
C3
c]3
\
qysi|ysey
f
paaem
Wo
[PUZIS
yn9
sa|qe>
SUO}}E/UNWILUOD
£
[PA]
J
cl
uejd
yaene
auoud
¢-9
no
sajqeo
suones/UNLWUWOD
LBlv
cl
uejd
spene
suo
Lely
Il
py
omsty

4.3.3.4.2 Potential future substation attack
The next step is for the team to determine the possibility of future attacks based on
subject matter expertise and the previous structural and activity artifacts presented in the
model. For this case, a possible future attack could involve jamming the wireless
communication systems used for security resources in the substation. Specifically, for this
example, we will look at jamming the wireless communications for the surveillance
cameras that is performed by a malicious employee.
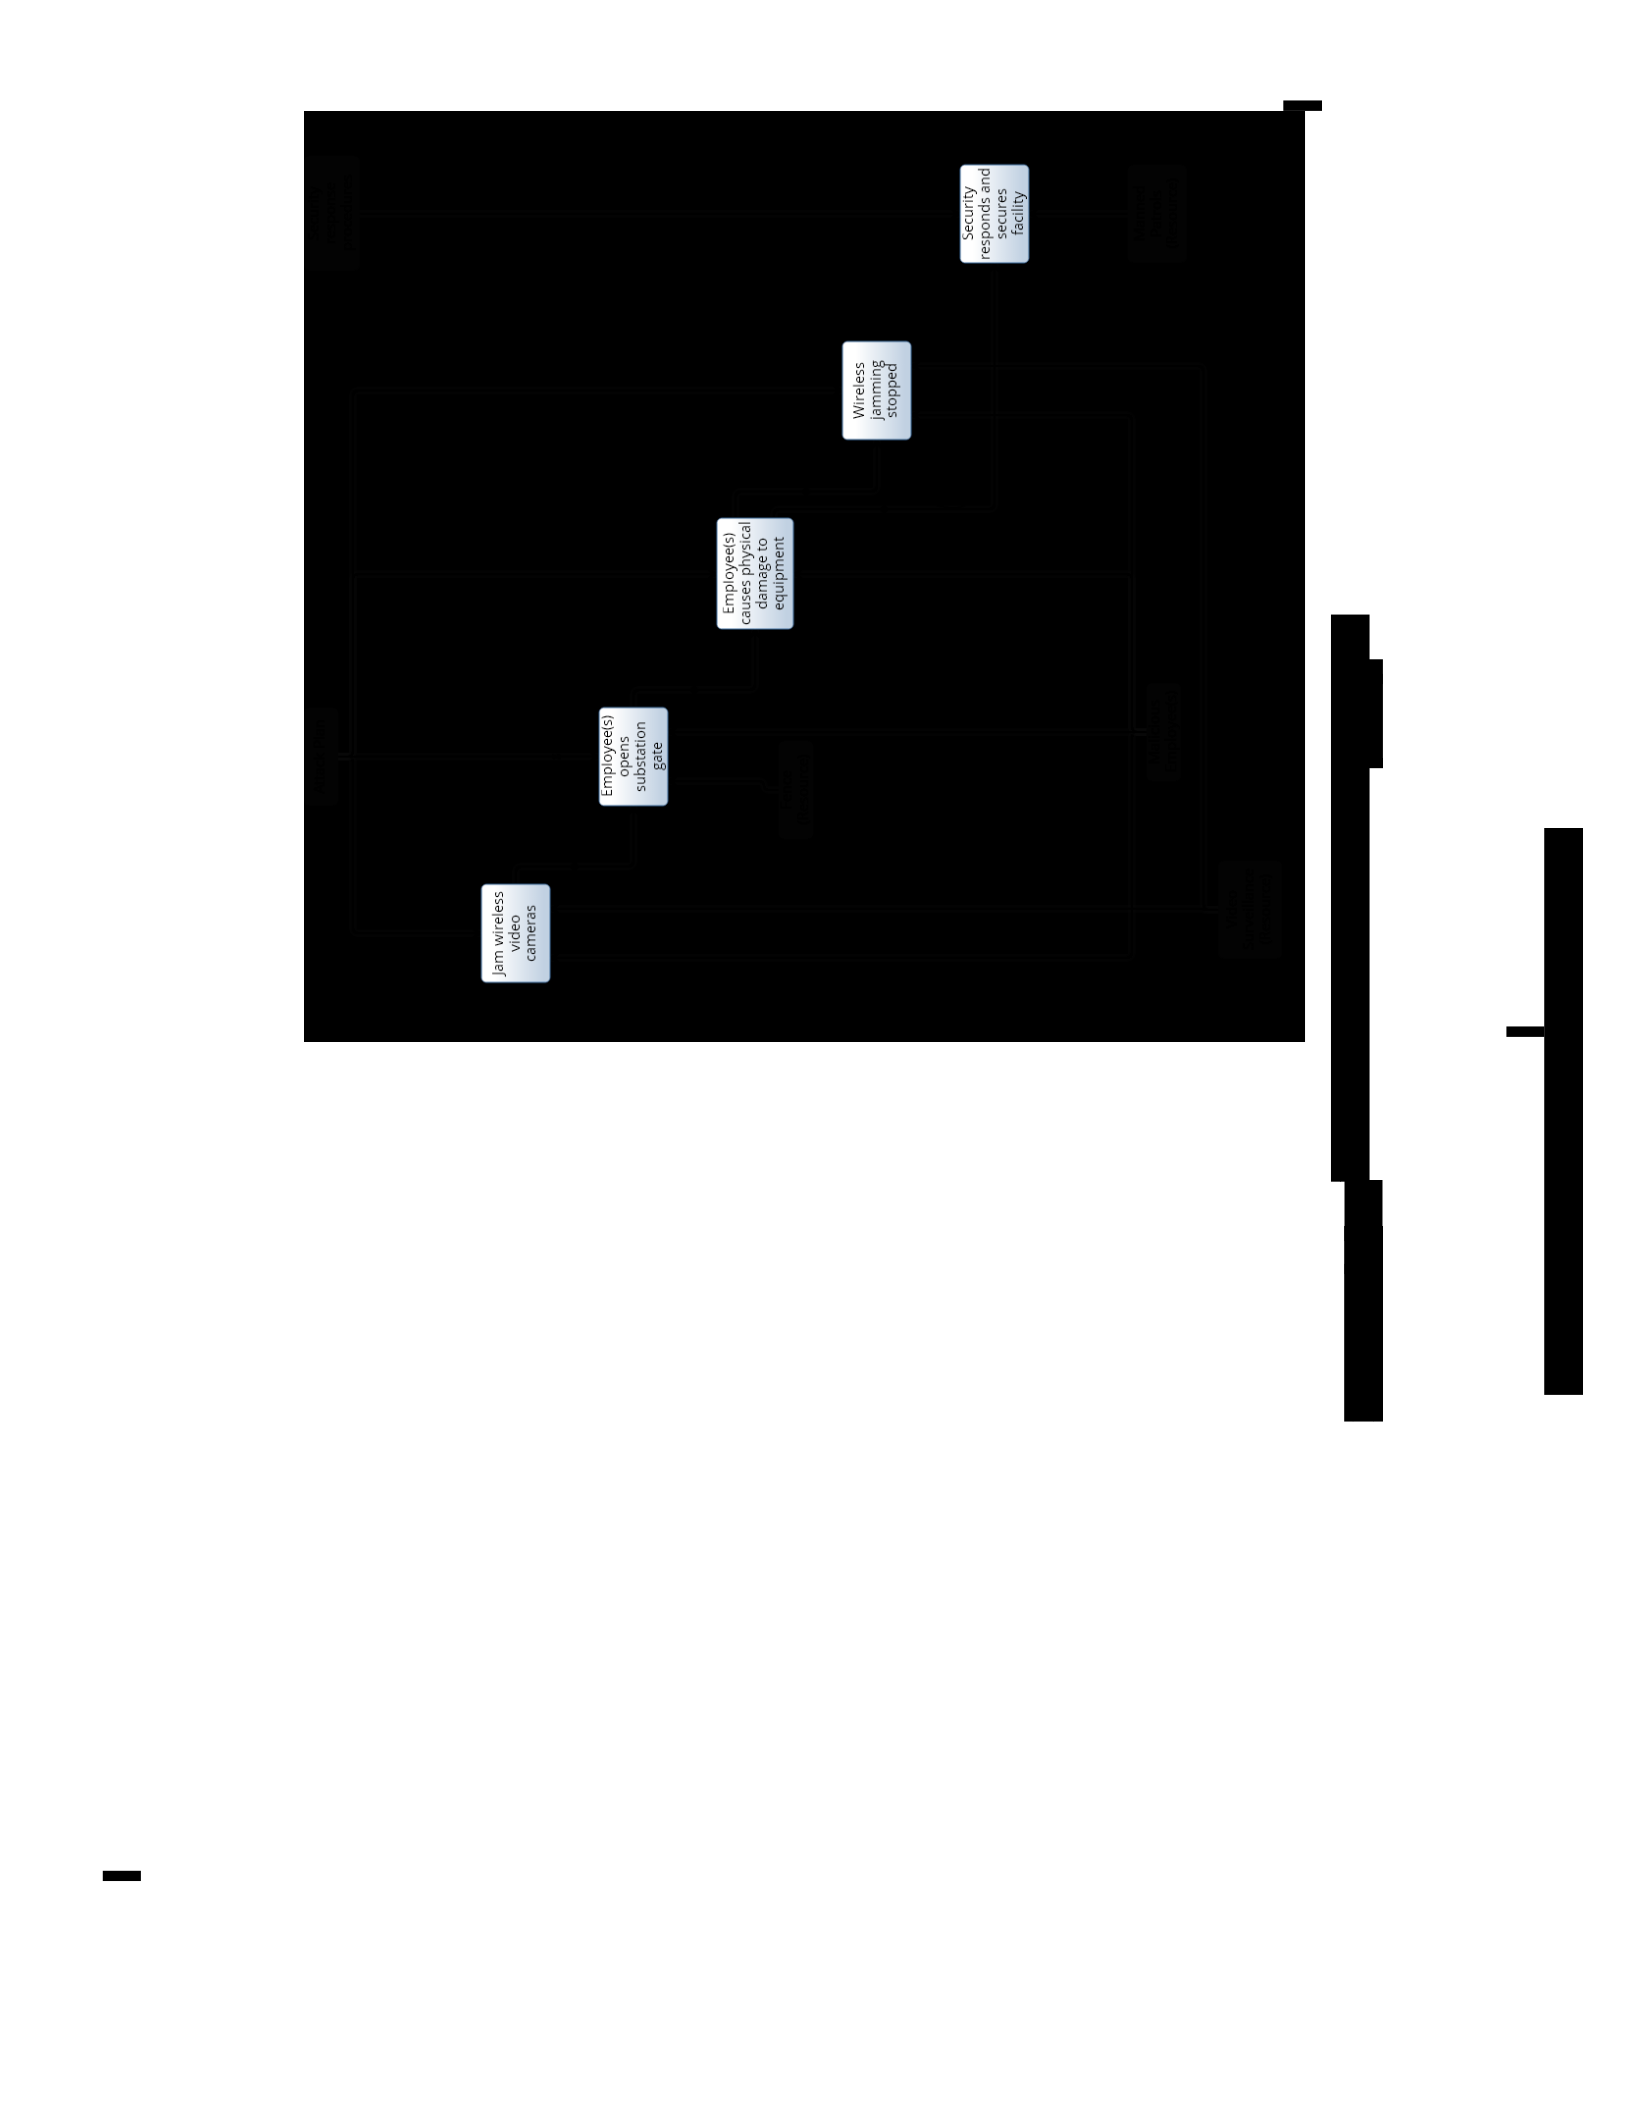
YRUE
sorunuel
Joprsur
snororyeutjog
AO
CIV
omsty
(aounosay)
adueyiavuns
oapiA
cj?
(aounosay)
(sjaaXojduu3
sjoned
SNOIDI/2\Y
pauUPl|
cj?
(~
Aypey)
saindas
pue
spuodsa|~
WHET
Aqunzas
x
addois
|
ule!
SSM
x
aqajdwo2
ysenty
ri
|
eons
juawdinba
,
0]
asewep
"
je2isAyd
sasnes
(s)eaAojdw3
,
x
uoeIsqns
o7
ssa22y
/
ajed
|
uoneisgns
suado
_(sjaaAojdw9
|
x
ULOWUOW
OSPlA
Op
|
|
sesawue>
|
oapIA
ssajatiM
wel
sainpasoid
tl
asuodsas
Aqun3as
ue}g
yen
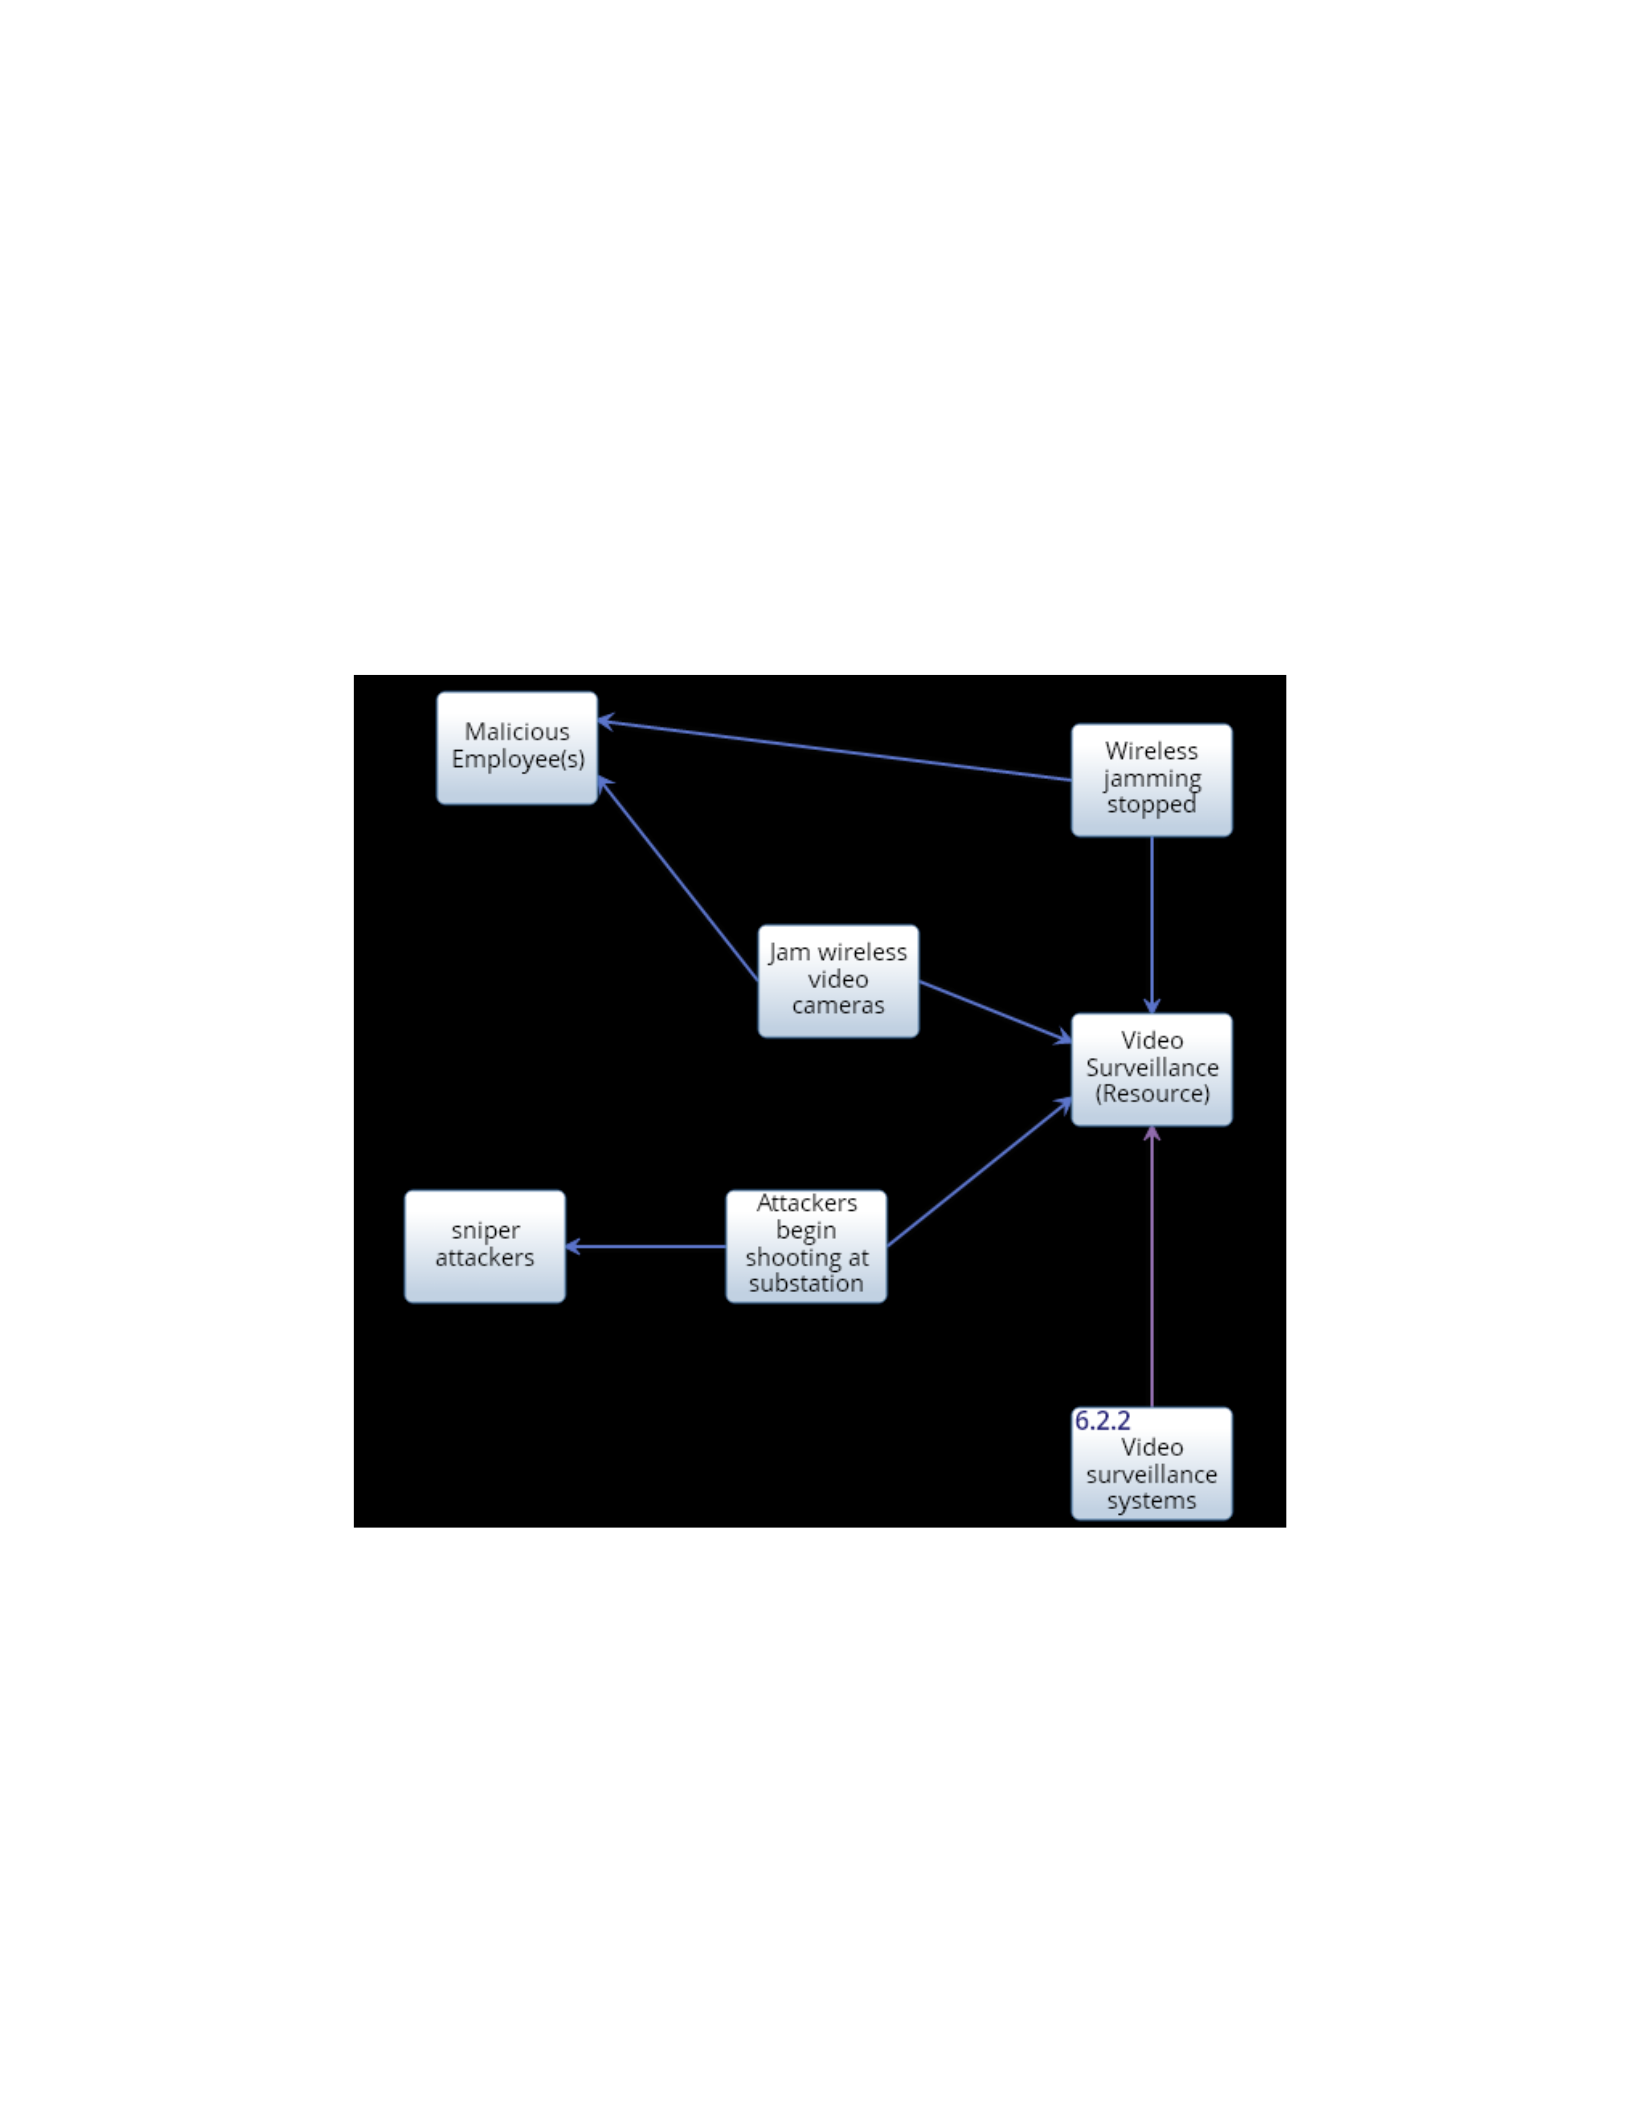
4.3.3.5 Identify gaps in traceability
In the previous two steps, the standards were linked to the SV-1, and the SV-1 was
linked to the OV-5b that captured a historical and future attack scenario. We begin the
assessment of the architecture by first identifying any gaps in the architecture,
specifically security resources, which can be accomplished in multiple ways. In the
Innoslate [2016] tool, a spider diagram can be viewed for each security resource. The
Video Surveillance resource is shown in Figure 4.13 as an example.
Figure 4.13 Spider diagram of video surveillance
The diagram shows that video surveillance is linked to the IEEE Standard as well
as used in some capacity in the Metcalf historical attack and malicious employee future

attack. Based on the discussion in the OV-5b section, it is clear that the video surveillance
was not capturing everything it should have captured, since the snipers were able to find a
place where they could not be seen [Smith, “Assault” 2014]. In the future scenario, it was
shown that the video transmission could be stopped with jamming. Based on this
analysis, the placement and communication mechanisms for video surveillance are a
potential area of investment in the system being developed. Table 4.17 shows an
evaluation of the use of each resource based on gaps in traceability. The lessons-learned
column is based on actual actions taken by PG&E after the Metcalf attack [Brinkman et
al., 2015]. The subject matter expert evaluation explains the assessment of the use of
security resources based on the attacks presented.
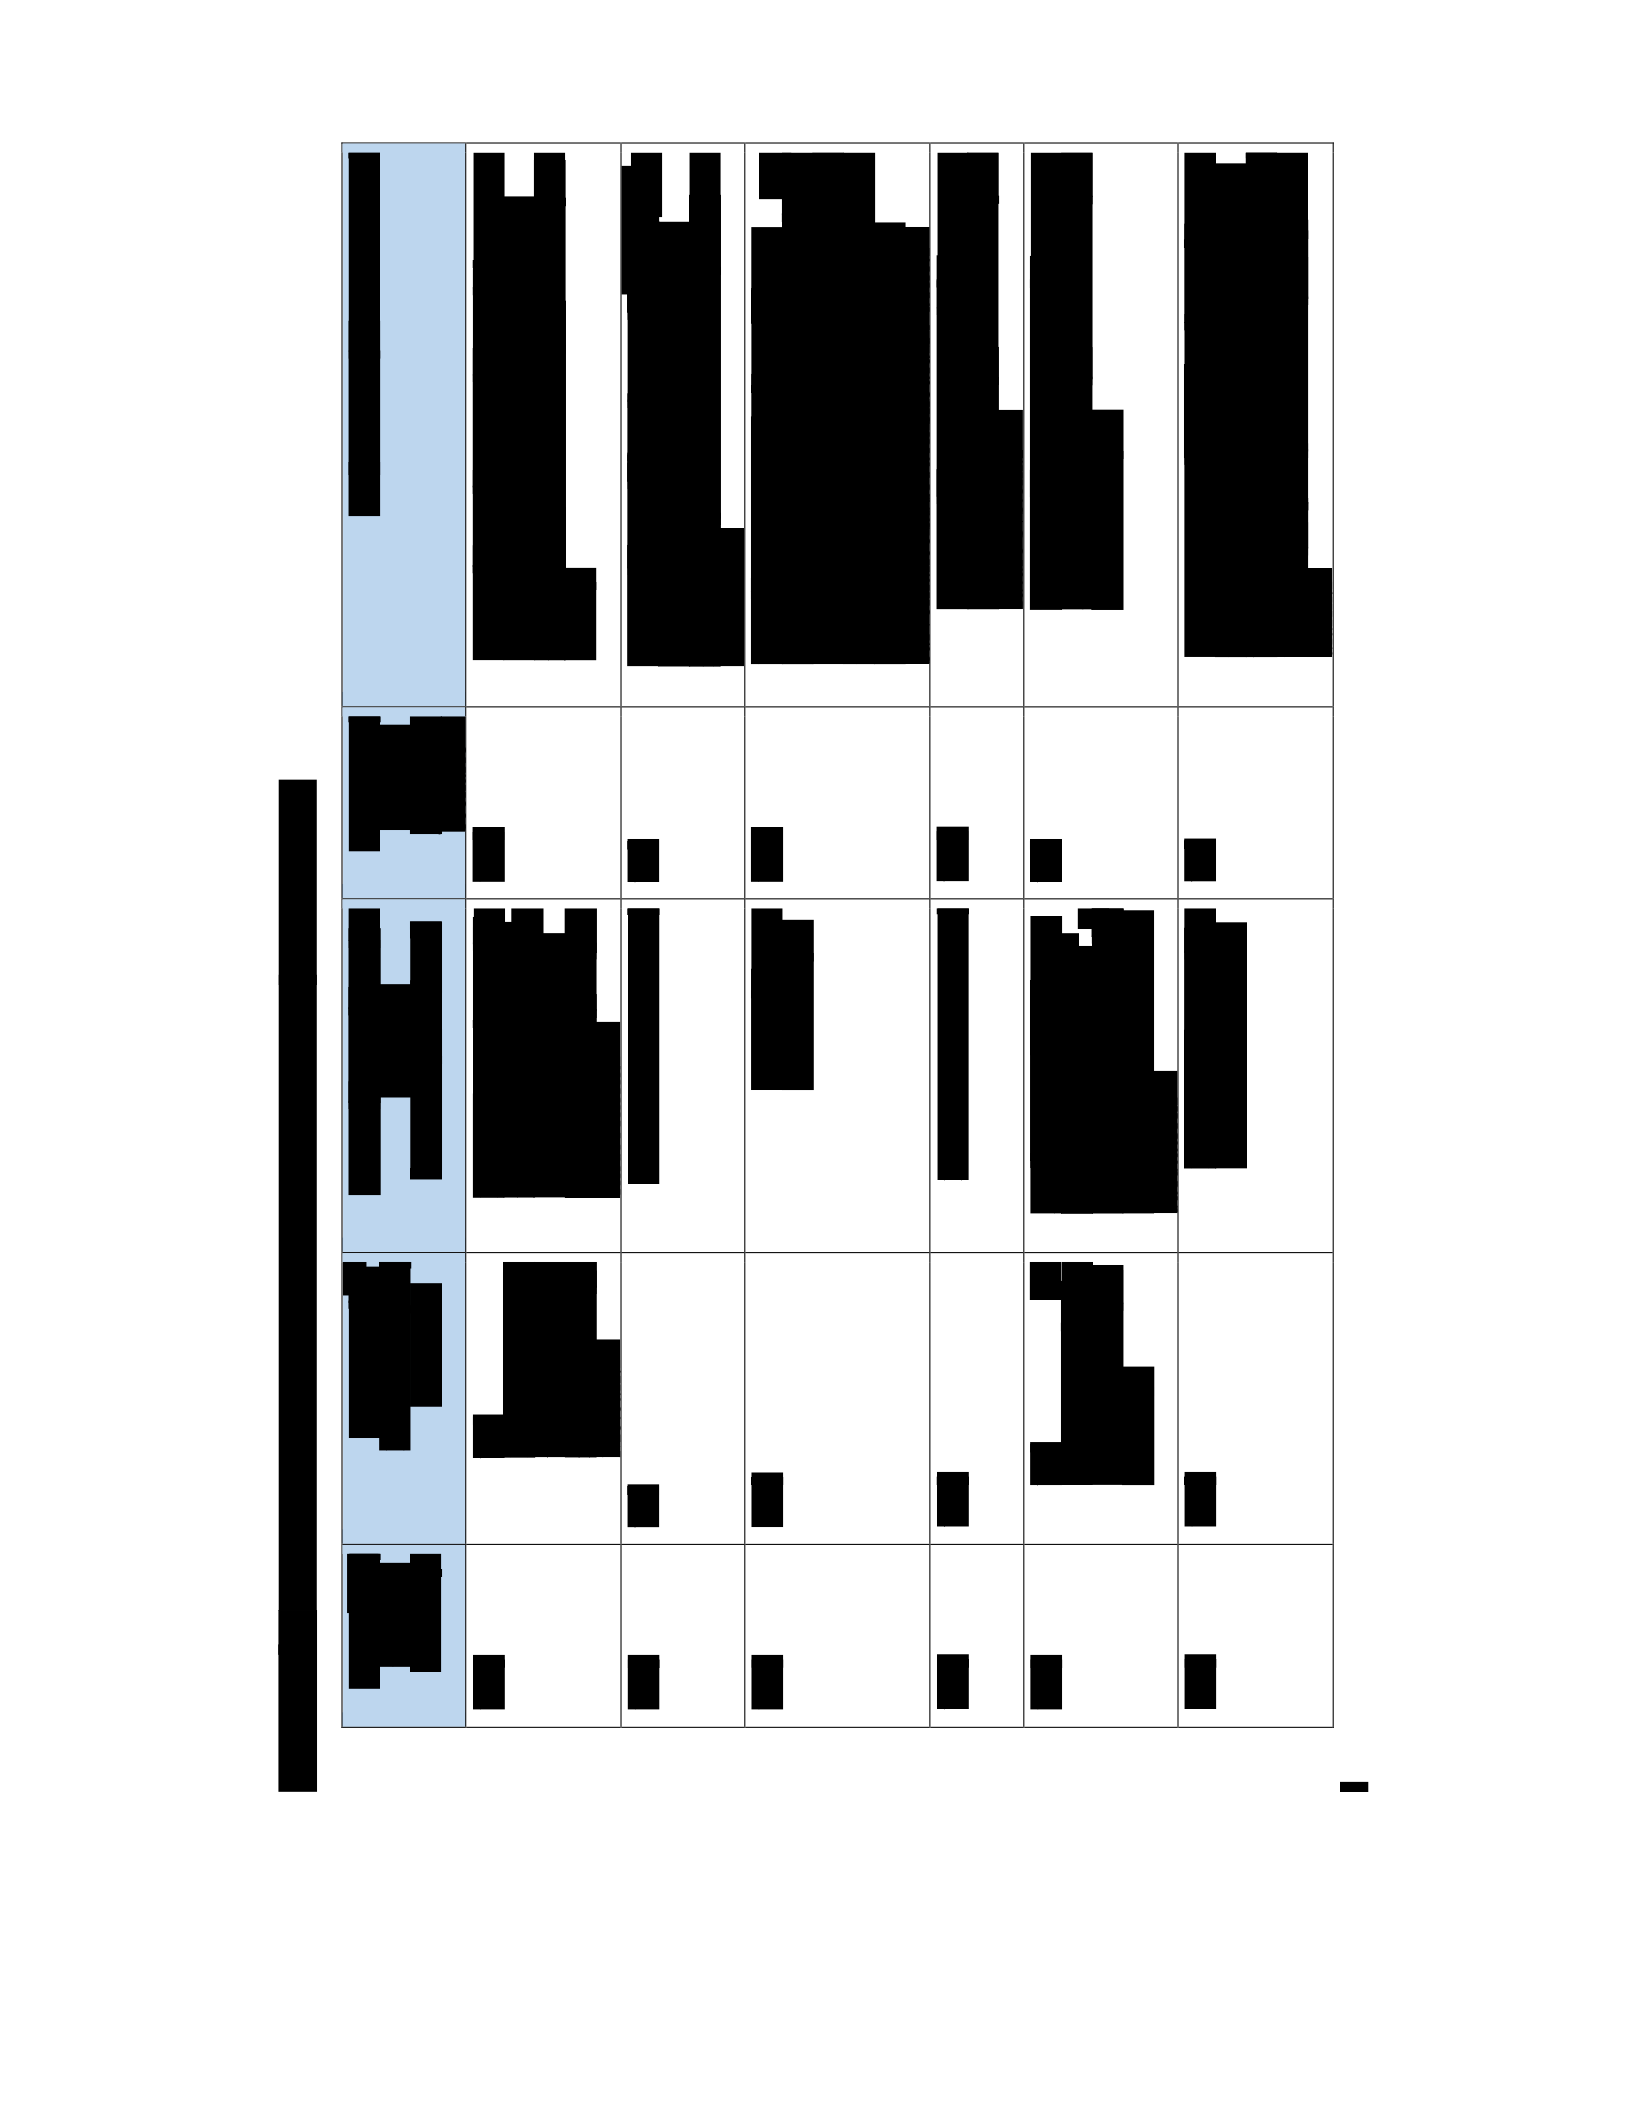

4.3.3.6 Collect subject matter expert opinions
The previous step resulted in expert analysis based on the historical attack
scenarios’ relationship to the new substation structural architecture. The next step is for
the experts to use this analysis and knowledge of the field to determine the effectiveness
of security methods for the new system. For this case study, existing data from the survey
conducted in IEEE Std 1402TM -2000 [2008] is used. In this survey, respondents were
asked to provide the effectiveness of security methods used in four types of substations:
urban, suburban, rural, and industrial/commercial. In this case study, the first three
categories and only the security methods that apply to the case study scenario are used.
Table 4.18 shows the survey data used for the analysis.
Table 4.18 Substation security effectiveness survey results [IEEE, 2008]
IEEE Std 1402-2000 Summary of Relevant Metrics

Method
Respondents
Number of Respondents Respondents reporting method respondents
reporting reporting method very effective to
reporting to method not somewhat effective completely effective survey
effective (%) to effective (%) (%)
Suburban Substation Security
Lights
31
6
78
16
Solid Wall
4
0
75
50
Security Guard
6
0
100
0
Fence
5
0
60
40
Video Camera
3
0
100
0
Alarm System
2
0
0
100
Motion Detectors
1
0
0
100
Urban Substation Security
Lights
31
7
77
16
Solid Wall
7
0
57
43
Security Guard
5
0
60
40
Fence
4
0
0
75
Video Camera
3
0
0
100
Alarm System
2
0
0
0
Motion Detectors
1
0
0
0
Rural Substation Security
Lights
31
13
74
13
Solid Wall
1
0
100
0
Security Guard
4
25
50
25
Fence
5
0
60
40
Video Camera
3
0
66
34
Alarm System
2
0
0
100
Motion Detectors
1
0
0
100
To use the data in the table, an ISES is calculated. First, scores in the not effective
column are assigned a “0” multiplier, those in the somewhat effective to effective column
a “1,” and those in the very effective to completely effective column a “2.” Next, the
survey percentage is multiplied by 0, 1 or 2, depending on the column in which it falls.

Using lights in an urban substation as an example:
0 .7 +1 .77 +2 .16 =1.09 (4.6)
Table 4.19 shows a summary of the security effectiveness scores. It is interesting to note
that, while lights are one of the most common security methods employed, alarm systems
and motion detectors are identified as most effective [IEEE, 2008]. Possible reasons
identified are increased cost, complexity and/or inconvenience [IEEE, 2008]. In the next
section, the interaction between the ISES, security resources (see SV-1), and minimizing
cost will be explored to determine the best options for decision makers.
Table 4.19 Security effectiveness scores
Effectiveness Scores
Method
Urban
Suburban
Rural
Lights
1.09
1.1
1
Solid Wall
1.08
1.75
1
Security Guard
1.4
1
1
Fence
1.25
1.4
1.4
Video Camera
1
1
1.34
Alarm System
2
2
2
Motion Detectors
2
2
2
4.3.3.7 Create OR model to enable analysis of alternatives
In the previous sections, the system was modeled to determine needed security
resources, and subject matter experts were surveyed to determine priorities for system
security. Based on this information, a decision maker may want to know what security
resources should a decision maker invest in based on their budget constraints? In this
section, an OR approach is used, specifically an integer linear program to assist a decision
maker in determining how to use limited financial resources to obtain the highest security

effectiveness from available security resources such as lighting, fences, manned patrols
and walls. This type of analysis has been done in other contexts for the purpose of
protecting CI during construction [Said and El-Reyes, 2010] and simulating the most
effective use of security resources [Marechal et al., 2009]. However, there has not been
work done to perform this decision analysis using security effectiveness scores coupled
with an integer linear program in the architecture trade-space.
4.3.3.7.1 Assumptions
1. Maintenance costs or increasing wages for security officers are not considered.
2. At a minimum, a fence, wall or combination of both is required.
4.3.3.7.2 Decision variables
The decision variables defined in Table 4.20 are based on the security resources
defined in the structural diagram of the architecture. These variables can be modified as
needed to ensure that all relevant security resources are captured.
Table 4.20 Decision variables
Variable
Description
XF
Binary variable (1 or 0) 1 = fence, 0 = no fence
XW
Binary variable (1 or 0) 1 = wall, 0 = no wall
XS
Number of sensors (Integer)
XV
Number of video cameras (Integer)
XA
Number of alarm systems (Integer)
XL
Number of lights (Integer)
XP
Number of security patrol hours (Integer)
4.3.3.7.3 Integer linear program
The objective of (4.7) is to minimize the annual cost of security by implementing
a security resource, Xi, with a cost of Ci. Constraint (4.8) ensures that either a fence or a
wall is selected for the outer perimeter of the substation. In (4.18) Xw and XF are defined
as binary variables with Xw or XF = 1 if there is a fence or wall and 0 otherwise.
Constraints (4.9-11) limit the number of resources (sensors, video cameras, lights)
available based on inventory. Constraints (4.12-14) ensure that the number of security
resources does not exceed what is needed based on the range of coverage (SR, VR, LR) of
the technology and the area (FF) of the substation or the perimeter length (TF). Constraint
(4.15) constrains the alarm system to be one per building within the substation. Constraint
(4.16) ensures that the number of security patrol hours does not exceed that maximum
work hours for one year. Finally, in (4.17), the security effectiveness score threshold is set
and the benefit scores are multiplied by their respective weighted values of the percent of
the maximum usage of a particular resource. The integer linear program is as follows.
𝑖 𝐶𝑖𝑋𝑖 (4.7)
𝑋𝑊 + 𝑋𝐹 = 1 must have a fence or wall
(4.8)
𝑋𝑆 𝑆𝑁 limiting number of sensor (4.9)
𝑋𝑉 𝑉𝑁 limiting number of video cameras (4.10)
𝑋𝐿 𝐿𝑁 limiting number of lights (4.11)
𝑆𝑅𝑋𝑆 𝑇𝐹 limit # sensors to available area (4.12)
𝑉𝑅𝑋𝑉 𝐹𝐹 limit # of cameras to availabl e area (4.13)
𝐿𝑅𝑋𝐿 𝐹𝐹 limit # of lights to available area (4.14) 𝑋𝐴 𝐵 limit alarm
systems to # of buildings (4.15)
𝑋𝑃 𝑃𝑆 limit # of security patrol hours (4.16)
𝐵𝐹𝑋𝐹 + 𝐵𝑊𝑋𝑊 + 𝐵𝑆 𝑋𝑆/𝑆𝑚𝑎𝑥 + 𝐵𝑉 𝑋𝑉/𝑉𝑚𝑎𝑥 + 𝐵𝐴 𝑋𝐴/𝐵 + 𝐵𝐿 𝑋𝐿/𝐿𝑚𝑎𝑥 +

𝐵𝑃 𝑋𝑃/𝑃𝑆 𝐸𝑆 Must meet security effectiveness score threshold (4.17)
𝑋𝑊, 𝑋𝐹 𝑏𝑖𝑛𝑎𝑟𝑦
𝑋𝑆, 𝑋𝑉, 𝑋𝐴, 𝑋𝐿 𝑖𝑛𝑡𝑒𝑔𝑒𝑟.
(4.18)
(4.19)
4.3.3.7.4 Constants
The constants shown in Table 4.21 for this proof of concept example are
engineering estimates based on books, vendor specifications, and publicly available
documents. These constants will need to be further refined for the specific system
architecture that is developed using this method. Key parameters such as the total linear
feet of substation wall or fence, light and video coverage, and motion sensor range will be
based on available technology. The costs of these resources will also vary based on
specific company pricing agreements.
Table 4.21 Constants
Constant
Description
Value
TF
Total linear feet around
substation
1120 (280x280) feet
FF
Total square feet of substation
78400 square feet
SR
Motion Sensor Range
350 feet
VR
Video coverage
130 square feet
LR
Light coverage
5000 square feet
PS
Maximum Physical Security
Hours
8760 hours per year
Lmax
Maximum number of lights
FF / LR (Integer)
Vmax
Maximum number of video
cameras
FF / VR (Integer)
Smax
Maximum number of sensors
TF / SR (Integer)
Table 4.21 (continued)
Constant
Description
Value
B
Number of Buildings in
substation
1
SN
Number of sensors available.
This is currently set so it is not a
limiting factor. This can be used
if there is a limitation of
resources.
100000

VN
Number of video cameras
available. This is currently set so
it is not a limiting factor. This
can be used if there is a
limitation of resources.
100000
LN
Number of lights available. This
is currently set so it is not a
limiting factor. This can be used
if there is a limitation of
resources.
100000
CF
Cost of Fence
$50/linear foot
CW
Cost of Wall
$200/linear foot
CS
Cost of sensors
$600/sensor
CV
Cost of Video Camera
$3000/camera
CA
Cost of alarm
$10,000/building
CL
Cost of lighting
$1500/light
CP
Cost of manned security for 4
security personnel
$600/hour
BF,BW,BS,BV,BA,BP
Effectiveness Score of Fence,
Wall, Motion Sensor, Video,
Building Alarm, and Manned
Patrols
See Table 7
ES
Minimum Desired Security
Effectiveness
This is a measure of how effective
the security is based on subject
matter expert opinion and
historical attack vectors. The
maximum security effectiveness
means that you have the
maximum security that money can
buy based on the type of
substation – urban, suburban or
rural and subject matter expert
opinion.
4.3.3.8 Perform Analysis to support key decisions
The execution of the integer linear program for urban, rural and suburban
substations yield the results described in Table 4.22. The ISES constitute the data shown
in Table 4.19 and are shown in the last column to provide a reference point. The total
effectiveness scores (TES) for each scenario (e.g., 95% solution for Suburban Substation

security), which are located above the cost on the left column, will add to the ISES for
each selected security resource. For the 95% solution for suburban substation security,
that would include all the ISES except the fence, which would be
0.95*(1.75+2+1+2+1.1+1) = 8.41.
In the Maximum Security case, the TES is the same for the urban and rural (8.74)
but not the suburban (8.85) environment. The Minimum Security case involves either a
fence or a wall and is denoted with a TES of 0; this is the same for all the environments.
For this analysis, the highest effectiveness (maximum security) and the lowest
effectiveness (minimum security) identified for each scenario are considered equivalent.

Table 4.22 shows the recommended investments from the minimum to maximum
security solution. We compare the TES by designating the highest score for each scenario
the 100% solution, the middle the 50% solution, and the lowest the minimum solution,
with other percentages detailed in between. This allows a decision maker to determine
their level of comfort with security based on their budget. The ISES drives the
combination of security resources that are used as the TES increases.
For the suburban substation, the wall has a higher ISES and higher cost than the
fence, so it follows that, for the lowest TES and minimum cost, the fence would be the
selection. As the TES increases, sensors and alarms are introduced as security resources.
In the 90% solution, the manned patrols are incorporated; they are introduced at this level
due to the relatively low ISES of 1. In addition, the wall is introduced as the primary
outer perimeter to meet the maximum effectiveness at the minimum cost. The suburban
case can be compared to the urban and rural cases where, because of the effectiveness
scores and subject matter expert data, the wall did not have enough benefit (ISES) to be
in the maximum security configuration.
Comparing the urban and rural substations at the 70% solution point, the video
cameras are introduced into the rural substation but not the urban substation. In the rural
substation, the video cameras have an ISES of 1.34 as compared to an ISES of 1 for the
urban substation. Comparing these values to the ISES for lights (urban = 1.09, rural = 1)
in each case demonstrates that the ISES impacts the selection of security resources. For
the urban case, the majority of the lights are introduced prior to the video cameras
because the ISES is higher for the lights. The opposite happens in the rural case where the
majority of the lights are introduced at the 80-90% solution level. This example shows

how the ISES can cause the combination of resources to change even though the
maximum security configuration of these two substations is the same. The goal is to
incorporate the highest security effectiveness resources at as low a cost as possible. This
leads to the next topic of comparing the costs based on the TES.
Figure 4.14 below compares the costs of security effectiveness for each type of
substation. The data starts to diverge from the 80-90% data. The reason for this is that the
ISES for each resource dictates the mix of resources, and that drives the cost. For
example, the data shows that the cost to get to the 90% security effectiveness level for the
urban substation (>$2 million) is much less than the cost to get to the 90% configuration
for the rural substation (<$1 million). The urban substation costs are higher because of
the high ISES for manned patrols, which means that, to obtain a 90% solution based on
TES, there need to be more manned patrols. In another example, the suburban substation
also has a similar result when compared to the urban substation. Manned patrols are tied
for the lowest ISES, in contrast to the urban substation’s results in which manned patrols
have the highest ISES. When balancing cost and benefit, this results in a reduced cost for
the 80% solution for the suburban substation as opposed to the urban workstation. These
effects influence the cost difference until the maximum TES is reached, in which the
urban and rural substations have the same cost and the suburban substation cost differs
due to having a wall rather than a fence.

UosTIeduUIOD
SSOUdATOATJO
AWLINDAS
SNSIOAJSOD
Ff['p
BINS
ssaueAnoey]
Andes
LUINWUIXE
Al
%56
06
%08
wOL
0S
WINLUIUT|A)
000‘000‘TS
000‘000°¢S
}s0)
[Eun
ae
JM,
000‘000°ES
jso)
ueqIN——
0
°
}s09
uequngns—o—
a
¥
000‘000‘tS
J)
000‘000‘s$
000‘000°9S
000‘000°£S
SS9UaAlqIaj43
AyuNndas
SA
3SOD

The question to answer in this analysis was the following: what security resources
should a decision maker invest in based on their budget constraints? Although it is a proof
of concept, this case study has demonstrated that a decision maker could use this method
to determine the resources they can invest in with the funding available. This
methodology allows key decision makers to include all of their organization’s expertise in
determining the most appropriate investments in the architecture phase of the program. In
this case study, if an asset owner had $2.2M to invest in urban substation security, then
the analysis shows he or she could afford an 80% solution for security effectiveness. This
analysis is valuable because the sooner that a decision maker can plan investments and
understand system vulnerabilities, the greater chance there is that mitigations can be put
in place. After this system level analysis, the next step is to evaluate the wireless video
subsystem.
4.4 Illustrative case study: Subsystem architecture assessment (path 3)
Now that the physical security of the substation has been evaluated, the next step
is to look at the design parameters associated with specific components. For this example
we focus on one specific component: the wireless video monitoring system. In the
previous section of this case study, an analysis of potential future potential attacks
identified the case where the wireless security cameras were jammed by malicious
insiders. In this section, the method developed will be used to provide decision makers
and designers with information to develop a network to support video surveillance that is
robust against jamming attacks. In this scenario, battery powered network nodes are used,
which simulates the case in which a network needs to be set up quickly as a temporary
backup to support secure communications of video data, in the event that the wired video
lines are disabled either by a malicious actor or on accident. This type of scenario

becomes more important as researchers explore the use of wireless communications for
smart grid applications [Aravinthan et al., 2011]. Figure 4.8 shows a representative
substation where cameras can be located anywhere along the fence line or internal to the
substation.
4.4.1 Subsystem VA approach
4.4.1.1 Develop OV-5b operational activity diagram
Figure 4.12 represents a wireless jamming attack scenario. In this scenario, a
malicious employee jams the wireless signal that the video cameras at the substation use
to communicate with the operations center. There could be no video monitoring due to
either complete loss of connectivity or a data rate so reduced that the video data could not
be transmitted. The employee next opens the gate to the substation and causes physical
damage to the equipment in the substation, such as transformers and breakers. The
equipment damage causes an alarm in the operations center, and, as a result, security
personnel respond and secure the facility. The employee stops the jammer after she has
completed the planned activity.
4.4.1.2 Questions that the decision maker wants answered
In this scenario, the questions posed a decision maker are as follows. These questions
were selected because we suppose that a decision maker wants to understand how
securing the network will drive cost, schedule and design tradeoffs that make the network
more or less robust against jamming attacks. For example, increasing the density of
network nodes may be more expensive since more nodes have to be purchased, but it may
make the network more resistant to jamming attacks.
1. Does increasing the density of the network nodes that are used to
communicate with the video cameras help prevent a successful jamming
attack?
2. Does increasing the number of channels available for each network node
help prevent a successful jamming attack?
3. Does changing the transmit current of the network communication nodes
help prevent a successful jamming attack?
4. How does changing the battery capacity impact the overall network
throughput?
5. What number of jammers would have to have been placed to completely
stop communication for the video system?
4.4.1.3 Refine scenario
In order to develop a decision model to answer the questions posed, the scenario
needs to be refined. The first step is to identify the information that is not currently
present in the OV-5b that will be required to develop the model to answer the questions.
If this information does not become available or cannot be reasonably estimated, then we
will know that the model will be unable to answer the questions. In the scenario
presented, all the data was available that was required for the model to provide answers to
the questions.
Table 4.23 Question and data mapping
Question
Data Required
Data
Does increasing the density of the
network nodes that are used to
communicate with the video
Current Density of Network Nodes
Possibility for future density of
7x7 grid
cameras help prevent a successful
jamming attack?
network nodes
9x9 grid
Does increasing the number of
channels available for each
Current number of channels
1

network node help prevent a
successful jamming attack?
Number of channels available
3
Does changing the transmit and
Current transmit and receive
45 each
receive current of the network
current
communication nodes help prevent
a successful jamming attack?
Future transmit and receive current
low: 15 / high: 90
How does changing the battery
capacity of each node impact the
overall network throughput?
Current battery capacity
Future options for battery capacity
170
range (0,1000)
What number of jammers would
have to have been placed to
completely stop communication for
Current number of jammers
available
2
the video system?
Number of jammers available
3
Once the data has been shown to be available, it would help to develop an overall
model that shows more details of the scenario. Figure 4.15 shows the operations center,
the 7x7 grid of ad hoc network nodes, jammer nodes and then the wireless camera at the
substation. The scenario shown is where the operations center is sending commands to
the camera, but it could also show the reverse path where the camera is sending data back
to the operations center. Each of the nodes in the 7x7 grid has a battery with a specified
capacity, transmit and receive current, as well as a radiation pattern based on the nodes’
power output and antenna type. The jammers are placed such that they may or may not
reduce or eliminate network throughput, depending on the range of the jammer to
interfere with the communications. The example shown here is not to scale, but is
presented merely to give an idea of how the scenario is configured. The next step is to
develop the optimization model.
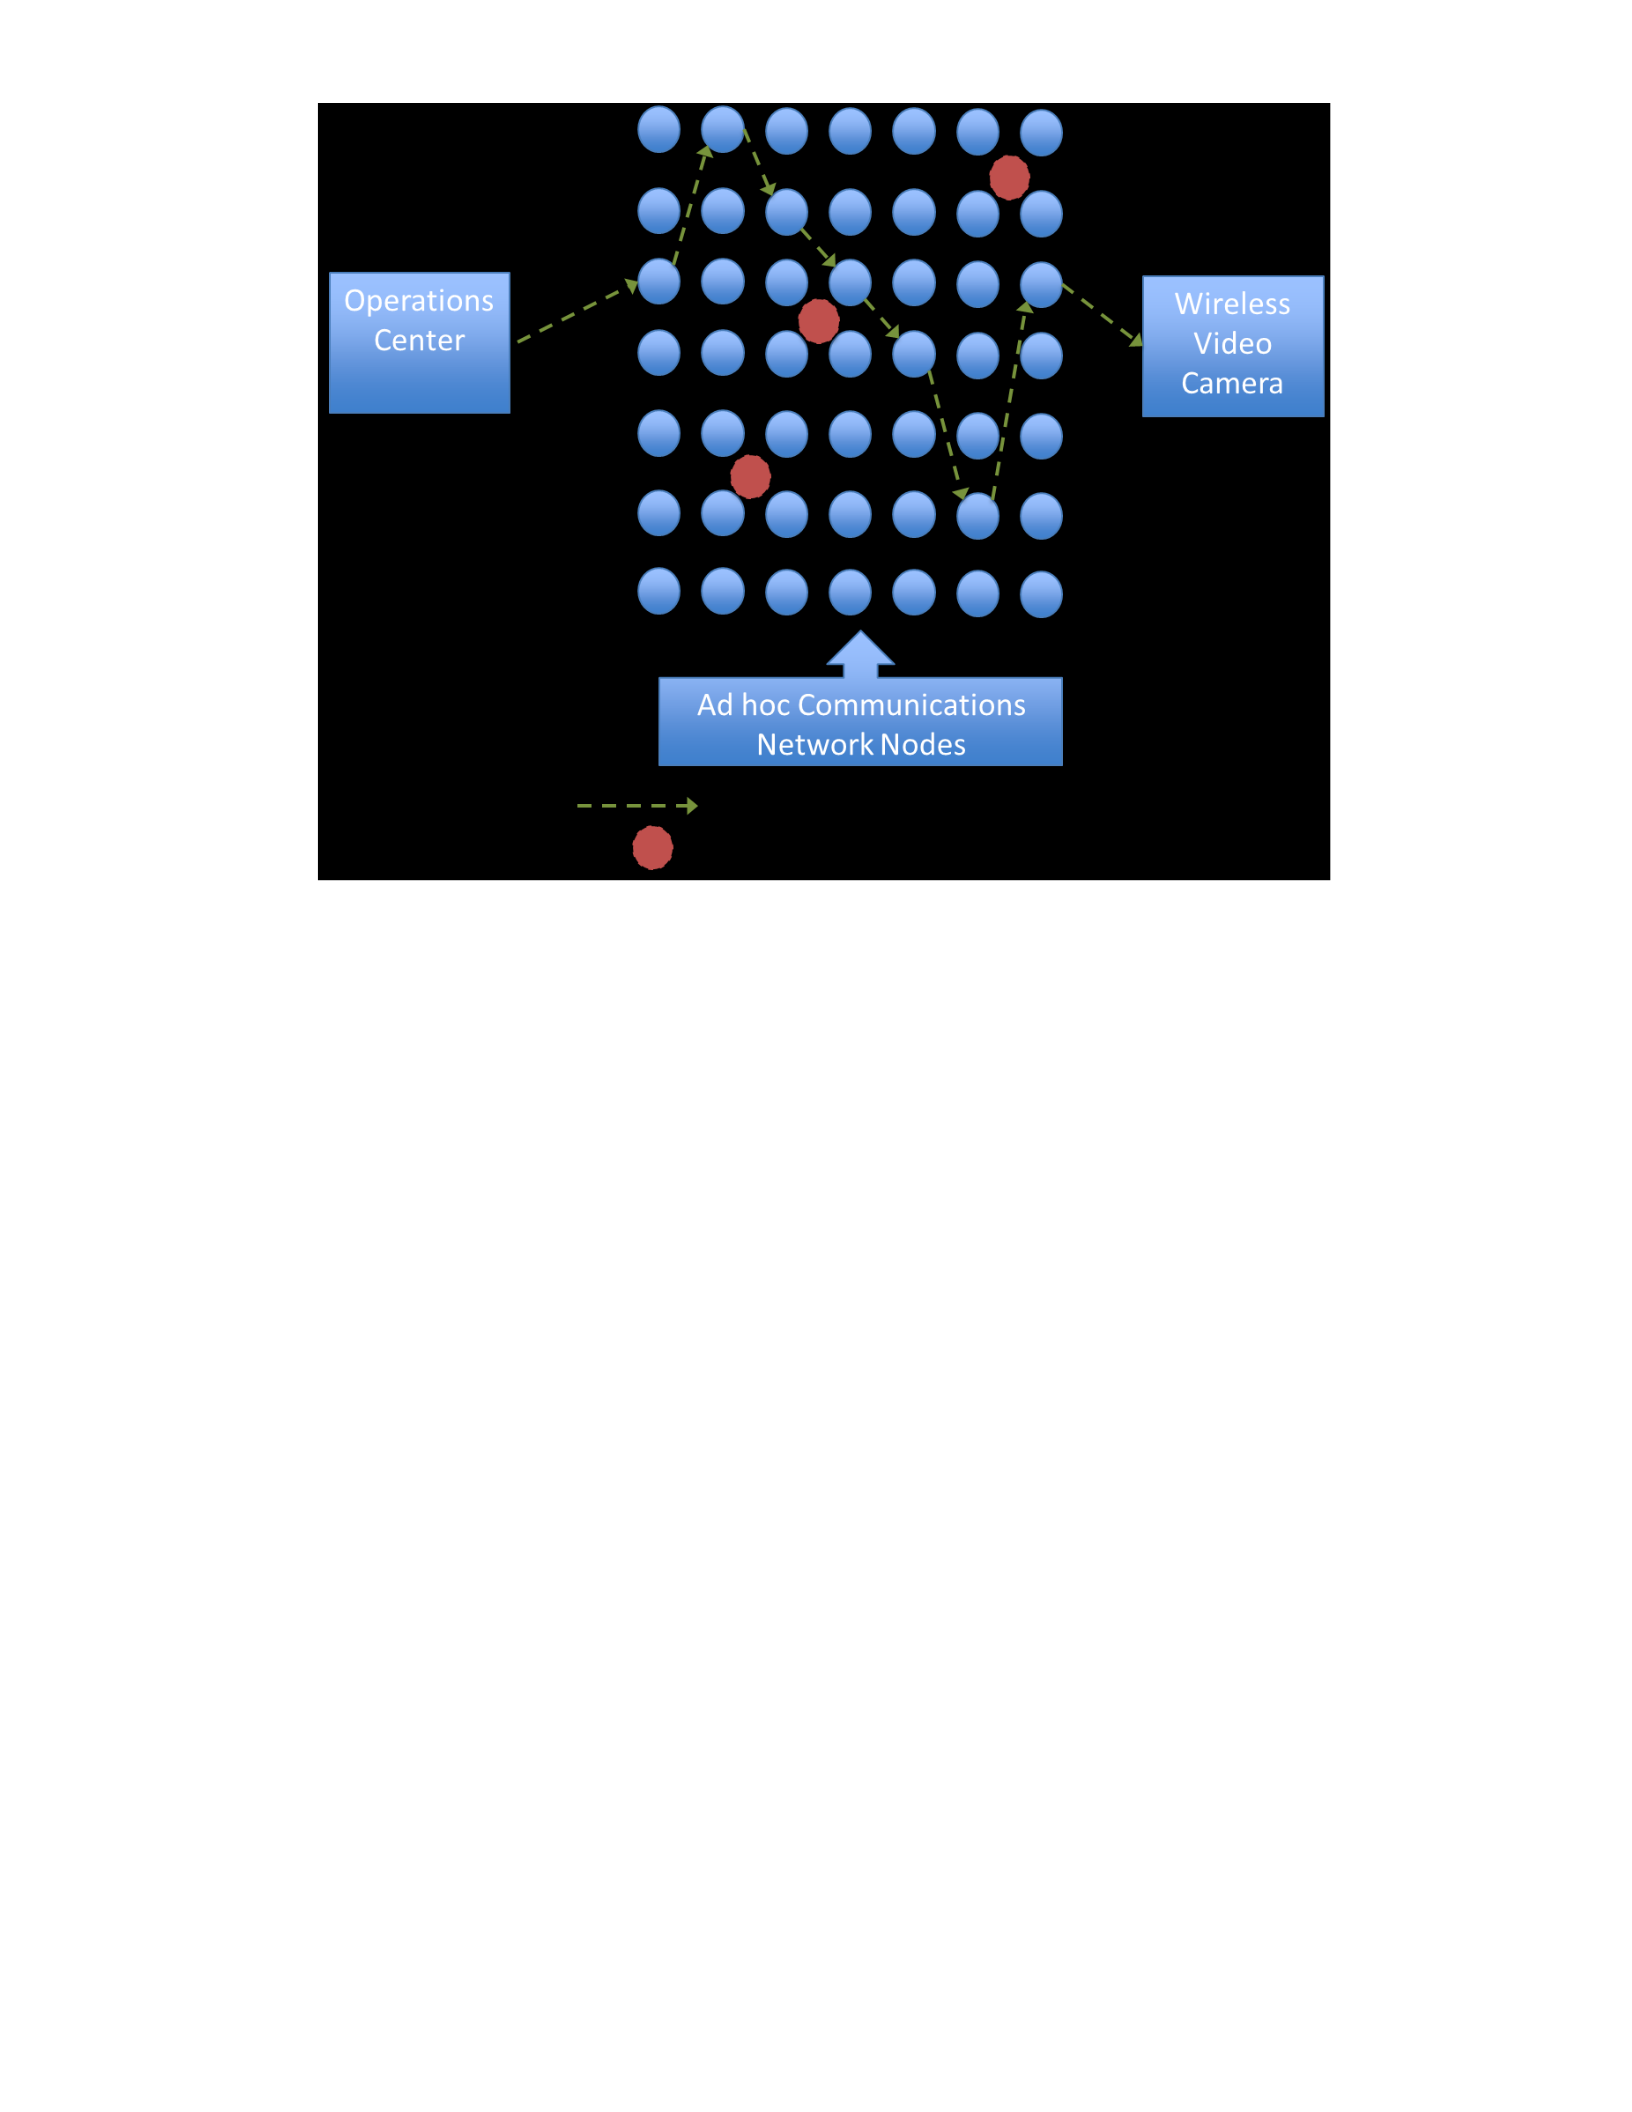
Figure 4.15 Scenario example
4.4.1.4 Develop decision model
Based on the questions asked in the previous section, there are multiple models
that can be developed to answer these questions. In this case, we will use a bi-level
mixed-integer linear program based on Medal’s [2016] work that will represent a two
level Stackelberg game. This type of analysis allows the computation of the worst
possible loss due to jamming attack; therefore, the analysis is pessimistic. In addition, it
provides a lower bound on the total flow of the jamming attack, which supports a
conclusion that a real jammer cannot cause more damage that the model indicates
(provided that the assumptions about the network and jammers are correct). As discussed,
this work will be extended to support directional antennas and consider the battery
capacity at each node. In this game, the malicious employee (attacker) will place
omnidirectional jammers at some location within the set of locations ℒ in space. 𝑟ℓ will
be the cost of locating a jammer at location ℓ𝜖ℒ with a budget of 𝑅. The goal of the
malicious employee is to place the jammers such that the total data that is transmitted
through the network is minimized.
On the defensive side, the goal of the network security personnel at the company
is to maximize the amount of data transmitted through the network while the network is
under attack. This model makes the assumption that the operator knows which nodes in
the network are jammed, and routes and schedules flow accordingly; the operator can
schedule all node to node communications [Medal, 2016].
With these assumptions, equation (1) is solved. Let x be a vector of jammer
locations and let X be feasible vectors of jammer locations. Let y represent the total data
transmitted through the network, Y(x) be the set of total data amounts given a jamming
vector x, and TH(y) be the total data sent through the network. The bi-level formulation is
given in equation 4.20. After determining the overall formulation, the next step is to
determine a way to represent the network so that it can be analyzed. The network is
represented using a three-layer representation.
𝑚𝑖𝑛 𝑚𝑖𝑛 𝑇𝐻 𝑦 (4.20)
𝑌 𝒙
4.4.1.4.1 Three-layer network
Traditionally, studies of the WNJP have only considered networks with omnidirectional
antennas – antennas that transmit with the same power in all directions. However, this
research is unique because it considers networks composed of directional antennas –
antennas that transmit with greater power in a specific direction. In the radiation pattern,
the direction where the primary transmission occurs is called the main lobe; 180 degrees

from that is the rear lobe. An example of an omnidirectional antenna’s radiation pattern is
shown in green below in Figure 4.16, while an example of a directional antenna’s
radiation pattern is shown in blue.

Ulo}ed
UOTVIPeI
PUUDJUL
[PUOTIOOIIP
SNSIOA
[RUOTIOOIIPIUWIQ,
OI
"p
dINBIy
aqo}
Jeay
1st
gor
S9T
FATALE
SST
GBT E6t
cr
t9t
ist
Toe

4.4.1.4.1.1 Physical layer
A major step related to finding an optimal solution for the WNJP requires
consideration of three layers of the network in question. The network’s physical layer
consists of multiple antennas that broadcast data to one another; each antenna can be
illustrated as a node (e.g., node i). The nodes in the physical layer all have various
attributes characteristic of most any antenna, which include a communication range (the
physical distance within which each antenna can broadcast to other nodes) and an
interference range (the physical distance within which its own data broadcasts can jam
the broadcasts of others).
4.4.1.4.1.2 Connectivity layer
An additional network layer is the connectivity layer, which is depicted by a
connectivity graph represented by 𝐺 = 𝒩,𝒜 , where 𝒜 is a set of arcs that use 𝑘 as an
index. Here, “connectivity” refers to the physical transmission by nodes of data to one
another with wireless network signals. An arc, also referred to as an edge, connects any
two nodes i and j if the former is able to transmit a signal successfully to the latter. The
third network layer is the interference layer; in this layer, simultaneous network
transmissions by different nodes through the same space will interfere with each other. As
a result, at any given time, each node can be either sending or receiving a single
communication to or from another node; anything else would imply that interference is
taking place, rendering the attempted communication null.
When considering the connectivity layer, note that the network considered by the
WNJP (as discussed in this chapter) utilizes the 802.11 network protocol. The 802.11
network protocol requires that, for any two nodes, neither can transmit or receive any data
while the other node is transmitting or receiving data, assuming that either node is within

the interference range of the other. Consequently, each node receiving a signal must
transmit and deliver an acknowledgement of its receipt of data to the sending node for the
nodes’ communication to be validated. Without the receipt of a delivery verification
message at the origin node for each transmission to another node, the network would fail
to meet the requirements of the 802.11 protocol and the communication would fail.
Therefore, special consideration must be given to ensuring that the 802.11 protocol’s
requirements are met.
When using an omnidirectional antenna for each network node, the 802.11
communication protocol is readily achieved as shown in Figure 4.17a. The successful
data transmission by one node (solid circle) implies that the data transmitted by the other
node (dashed circle) is also successfully transmitted due to the overlap in the radiation
pattern. The analysis to determine if directional antennas meet the 802.11 protocol is
more complex because one node’s radiation pattern might be able to reach a second node
to transmit data, but the second node’s pattern might be focused mainly in the opposite
direction and not be able to reach the original node. Thus, such a scenario fails to
guarantee that the delivery of sent data can be confirmed with a response. An example of
such a situation is portrayed in Figure 4.17b, in which the solid radiation pattern overlaps
node 2, but node 1’s dashed pattern does not overlap node 2, so no communication is
established between those two nodes. Figure 4.17c shows a scenario in which both nodes
are communicating.
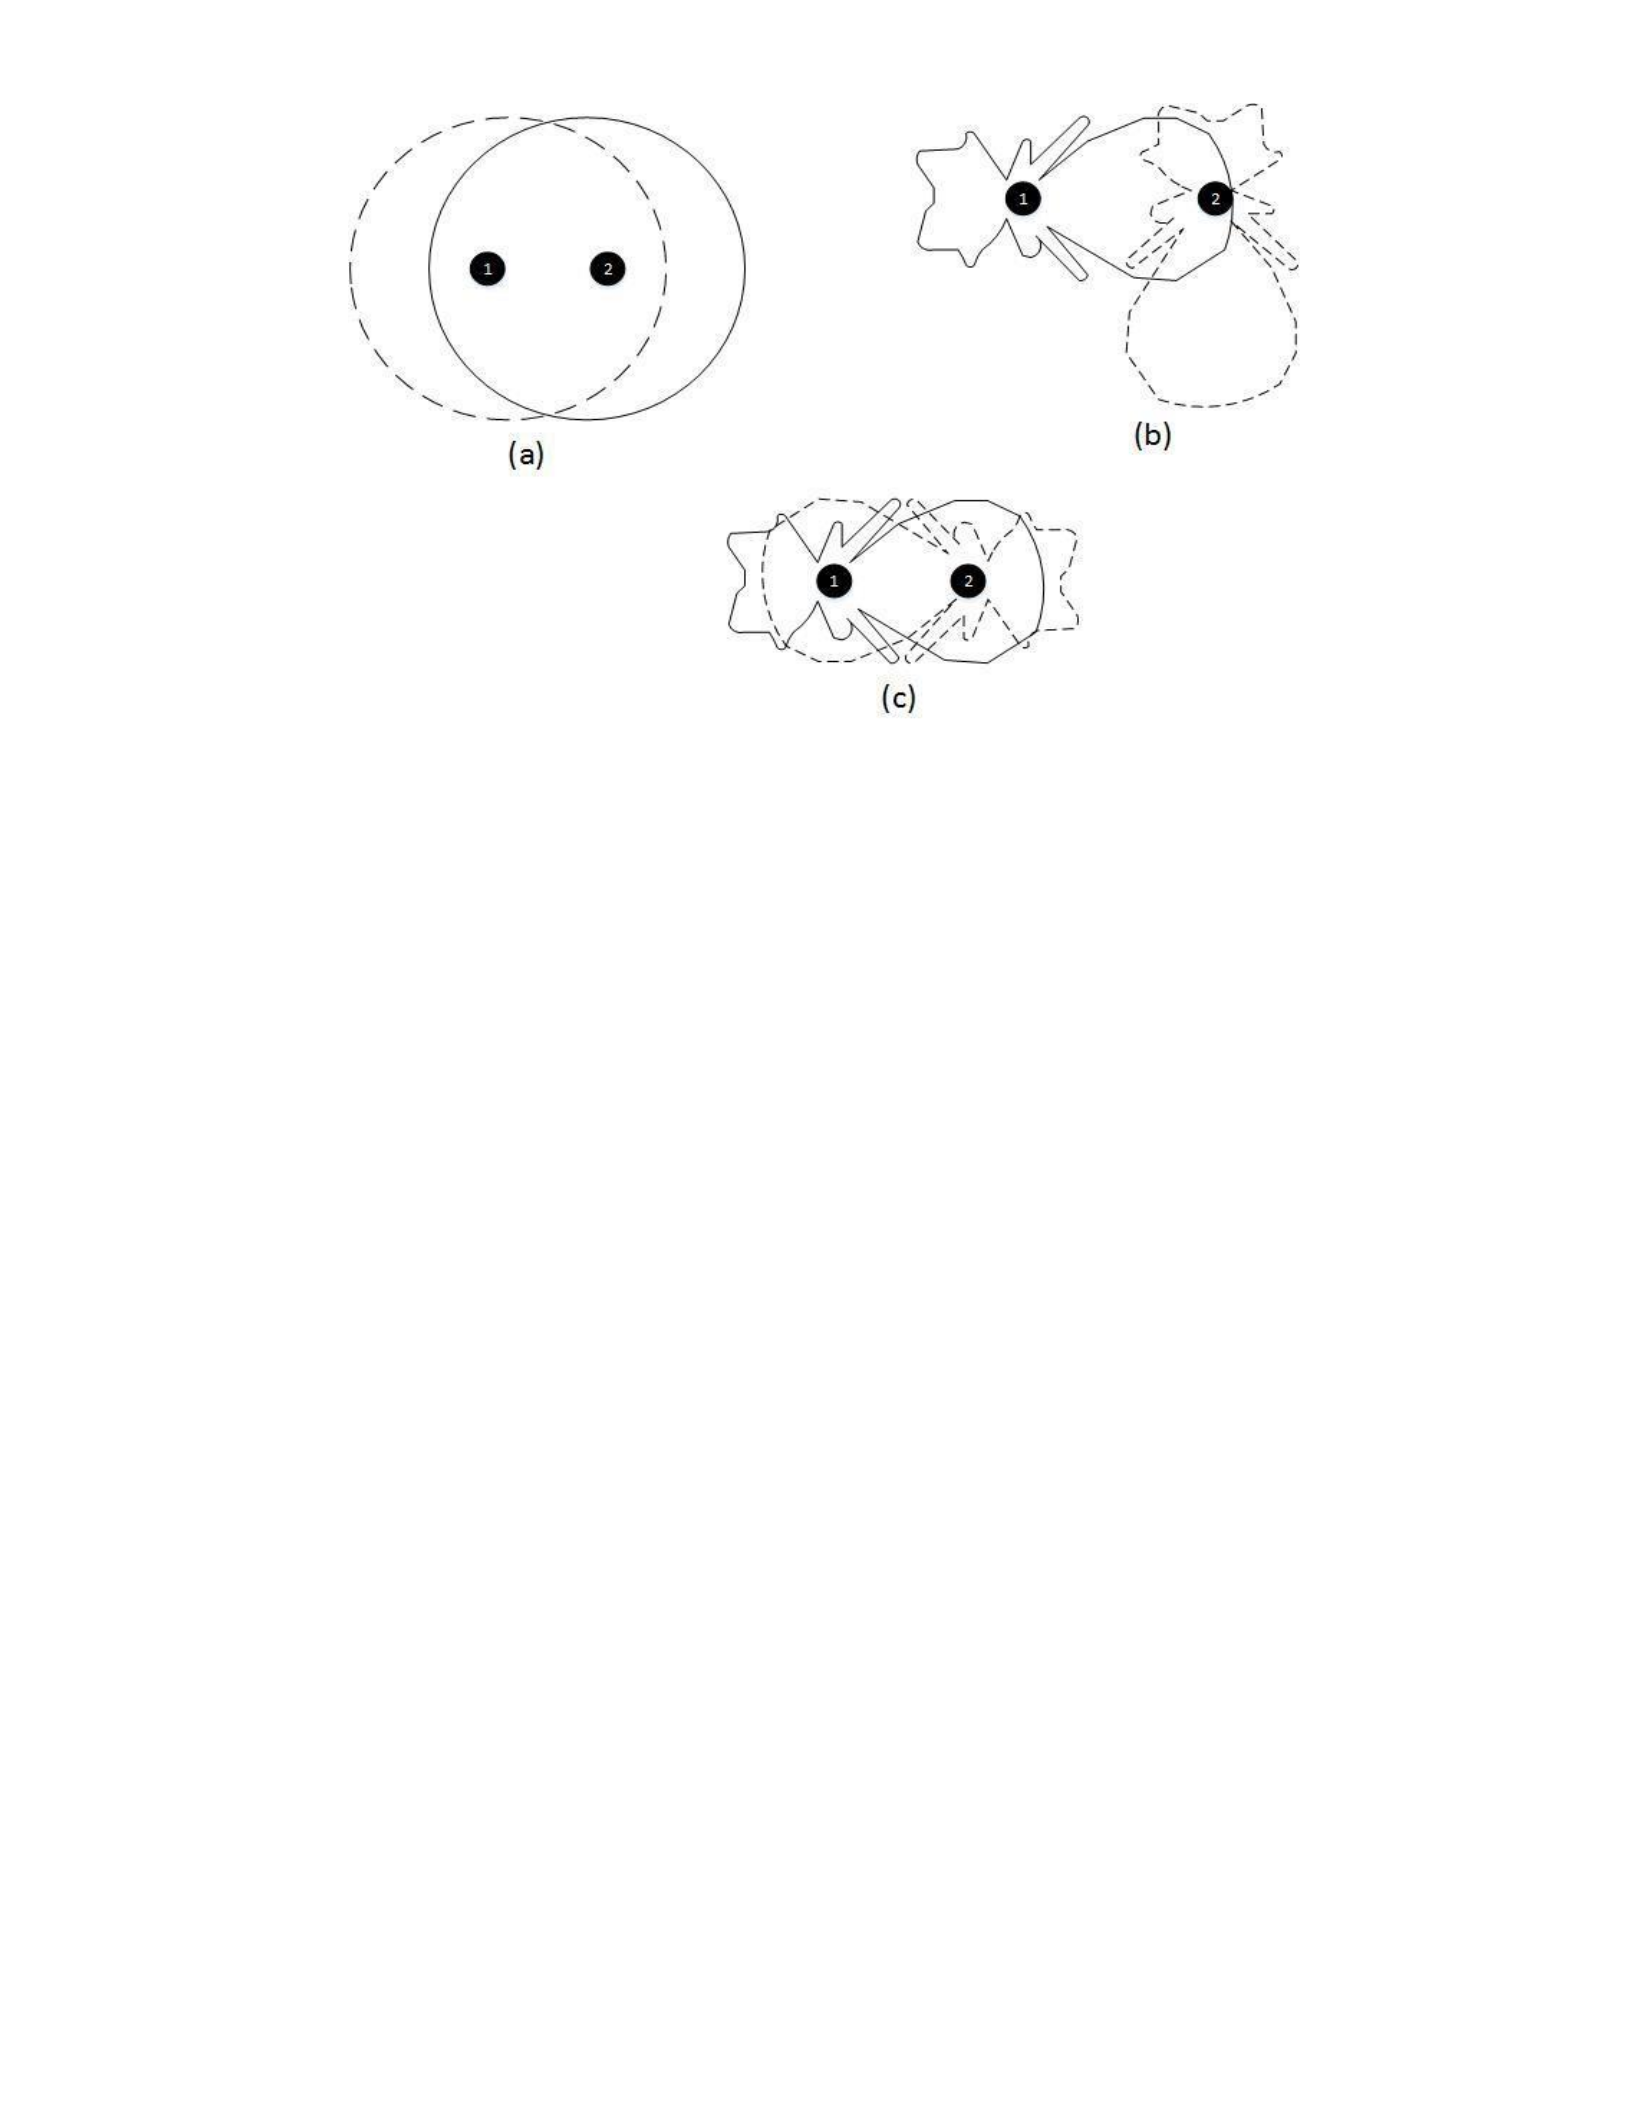
Figure 4.17 Connectivity examples
(a) Omnidirectional connectivity
(b) Directional with no connectivity (c) Directional with
connectivity
Another important attribute to consider for both omnidirectional and directional
antennas is the power level of each radiation pattern. For instance, suppose that there are
three possible power levels for a given array of antennas: low, medium, and high. If the
power level is high, the radiation patterns for the transmissions from each antenna are
going to be of a greater magnitude than those at a lower power level. The graph in Figure
4.18 below demonstrates this fact, with radiation patterns of low, medium, and high
power levels being shown with solid, dashed, and dotted lines, respectively. Therefore,
when considering communications of varying power levels among antennas, it is
imperative to be aware of the potential variance in antennas’ signal strength at different
power levels.

S[OAQ]
Jomod
YSIY
pue
wUNIpow
‘Moy
ye
suIoyed
UONRIPeY
gp
Ns
cilliiie
ez
zeT
827
82T
zEez
zt
9&7
OzT
Ovz
9Tt vez
ZIT
SoZ
80T
7st
vot
9S%
OOoT
09z
JaMOd
UZIH
oo
«
96
v9z
yamog
WnIpay.
—
7
897
88
7Lz
~~
+8
922
o8
08z
92
vez
zw
88z
89
76z
vw
962
O00E
OE
80€
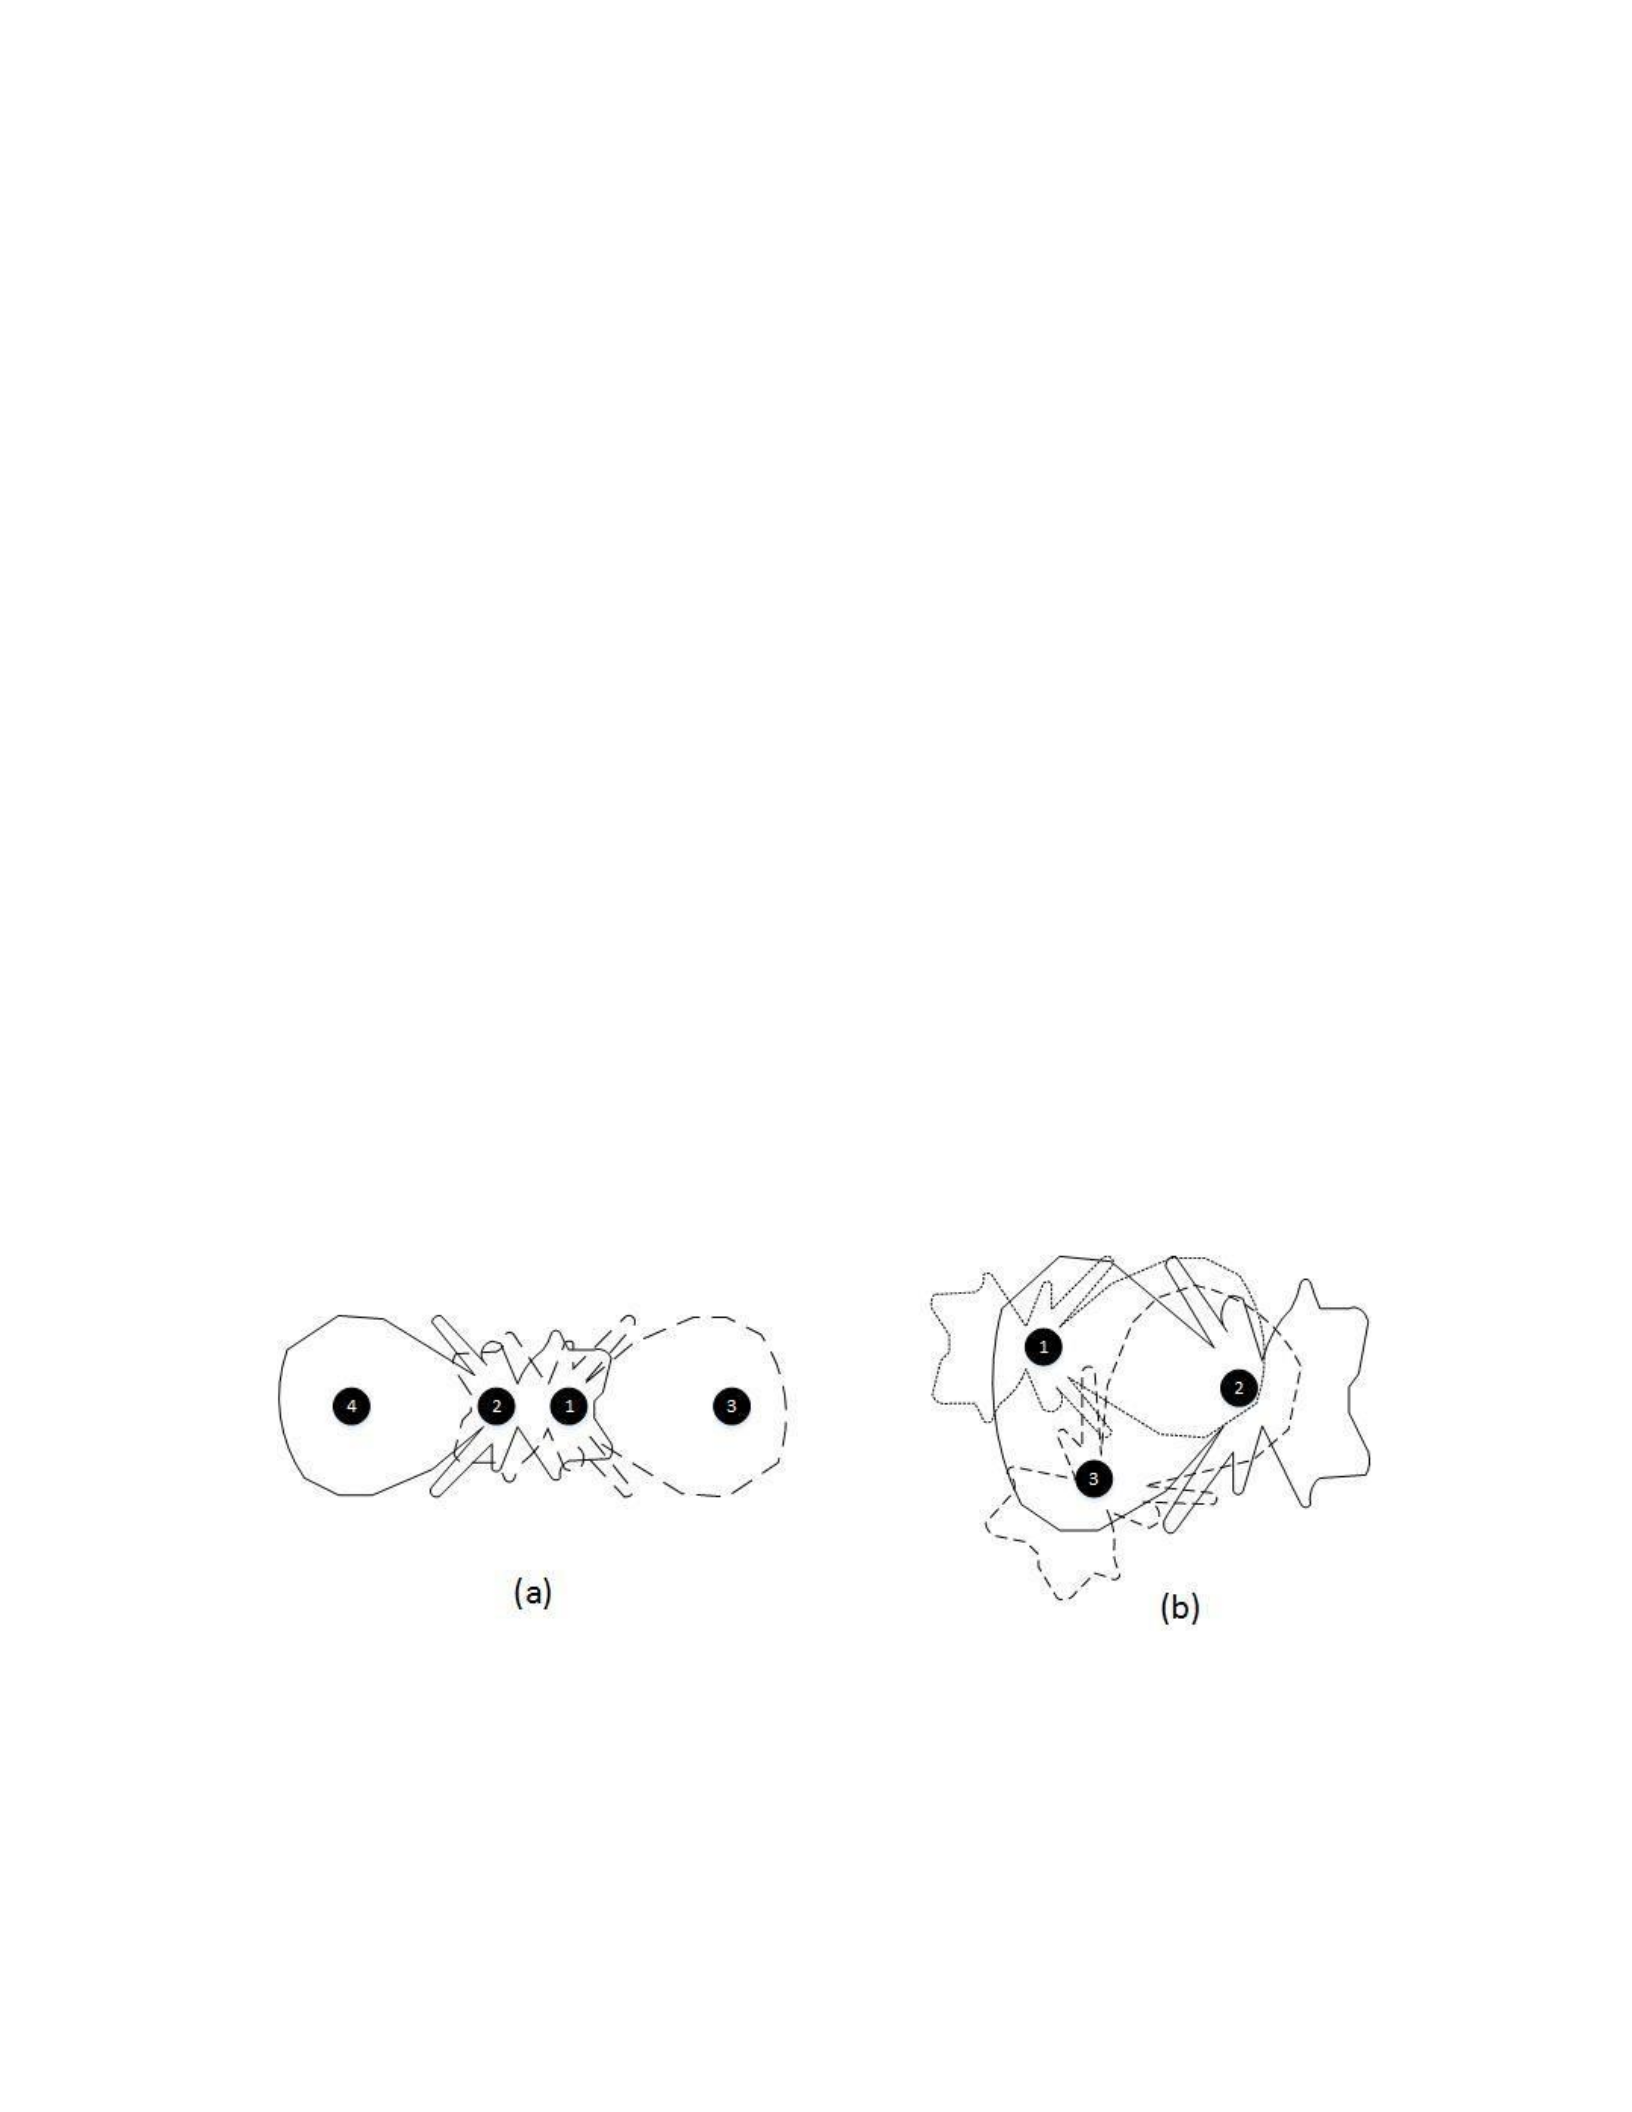
4.4.1.4.1.3 Interference layer
The use of directional antennas, in addition, also affects the interference layer of
the network model. Previously, when using omnidirectional antennas, one had only to
look at the uniform transmission distance at degrees 1 to 360 to determine if the
transmission in a given radiation pattern would reach “into” the transmission of another
node’s radiation pattern and potentially cause a signal conflict that would jam the
transmissions. When using directional antennas, however, one must determine whether
the radiation pattern transmission distance at a given degree toward another node is
aligned to interfere with another radiation pattern’s transmission distance at another
degree out of 360. Nonetheless, one requirement remains: that is, the interference layer’s
requirement that simultaneous network transmissions by different nodes through the same
space will interfere with each other. Figure 4.19a offers one example of this; while nodes
1 and 2 are connected via their rear lobes, if node 1 or 2 is active, neither node 3 nor 4
can be active. In the example shown in 4.19b, node 2’s radiation pattern covers both
nodes 1 and 3, which means that nodes 1 and 3 cannot be active while node 2 is active.
Figure 4.19 Interference examples
(a) Nodes 1 and 2 interfere with each other
(b) Nodes 1 and 3 cannot be active while node 2 is active

4.4.1.4.2 Calculating total data transmitted
The details from each layer will be used to explain how the total data transmitted
in the network under interference is calculated. A conflict graph, which was first
developed by Jain et al. [2005], will be used to model the interference layer. 𝐺′will
represent the conflict graph, which has a node that contains each arc in the connectivity
graph; 𝑖, 𝑗 represents a node in 𝐺′. Nodes 𝑖, 𝑗 and 𝑟, 𝑠 have an arc between them in 𝐺′
if arcs 𝑖, 𝑗 and 𝑟, 𝑠 interfere in 𝐺.
As a result of arcs interfering with each other, simultaneous data transmissions of
all nodes are not possible. Because of this fact, nodes must alternate between “on” and
“off” states to avoid interference. This is mitigated by Jain et al. [2005], whose work
shows that arcs that are active will not interfere with each other if they form an
independent set in 𝐺′. It follows that the maximum total data transmitted can only be
achieved with maximal independent sets in 𝐺′, which is achieved when adding another
node to the set causes it to no longer be independent. The set of all maximally
independent sets will be ℐ = {𝐼1, 𝐼2, 𝐼3, . . . , 𝐼𝐾} with an index of {1,2,3, … , 𝐾}; therefore,
ℐ𝑘 represents all maximally independent sets with arc 𝑘.
Next, how the data is routed and scheduled in the network is defined. Let 𝒘 = 𝑤𝜎 𝜎
𝐼 be a vector that defines the total time the arcs in the 𝐼𝜎 independent set are “on.” Let 𝒚
= 𝑦𝑘 𝑘 𝒜 represent the total data flow on arc 𝑘, which, when multiplied by the capacity of
𝑘𝑈𝑘 and 𝐼𝑘 𝑤𝜎), provides the total data that has flowed on 𝑘.
Finally, the battery capacity and total current (both transmit and receive current)
are defined. Let 𝑇𝜎 represent the total current that is required to transmit and receive
during a communications interaction; let 𝐵𝑖 define the battery capacity for a node. The

𝐼 𝑤𝜎𝑇𝜎𝑖 term represents the total usage of the battery to transmit and receive during
a communication between two nodes.
4.4.1.4.3 Bi-level mixed integer program
We begin to formulate the appropriate mixed-integer program by defining the
vector of binary variables x = , for which 𝑥ℓ is 1 if a jammer is located at location ℓ
but 0 if a jammer is not located at location ℓ. To account for the cost of placing a jammer,
it is appropriate to assign a cost of 𝑟ℓ to placing a jammer at any location ℓ, subject to an
overall budget limitation valued at 𝑅.
In this problem, 𝑦𝑎 represents the total data transmitted over the network into sink
t. We will also refer to a forward star and a reverse star, which are indicated as 𝐹𝑆 𝑖 =
{𝑘:𝑘 = 𝑖,𝑗 and 𝑅𝑆 𝑖 = {𝑘:𝑘 = 𝑗,𝑖 , respectively.
𝑚𝑖𝑛 𝑔 𝒙 (4.21)
│ℒ│
𝑠. 𝑡. 𝑟 𝑅,
(4.22)
where
𝑔 𝒙 = 𝑚𝑎𝑥 𝑦𝑎 (4.23)
𝑠
𝑠. . 𝑦𝑘 𝑦𝑘 𝑖 𝑁 𝛼𝑖 ,
𝑘 𝑘 𝑦𝑎 𝑖 𝑡
(4.24)

𝑤𝜎 𝑈𝑘, 𝐴 𝛽𝑘 ,
𝜎 𝑘
(4.25)
𝑤𝜎𝑇𝜎𝑖 𝐵𝑖 𝑖 𝛾𝑖 ,
𝜎
(4.26)
𝑤𝜎 (4.27)
𝑦𝑘 (4.28)
We determine the total data transmission for a solution involving a particular
placement of jammers via the inner problem 𝑔 𝒙 . In the case of the outer problem’s
objective function (4.21), it is desired that the network throughput be minimized with the
optimal placement of jammers, subject to the budget constraint (4.22). Further, the inner
problem’s objective function seeks to maximize the network throughput. Constraints
(4.24) balance the data flow at any intermediate nodes between the source and sink nodes.
Constraints (4.25) require that the network data flow to and from each node never be less
than zero, with the total data flow in each arc (between any two nodes) to be no greater
than the arc’s data flow capacity multiplied by the fraction of time that the arc is being
used. Next, constraint (4.26) confirms that a maximum limit is set for the transmit current
of the node relative to the total battery capacity, with the variable 𝑤𝜎 constituting the
usage of each node; constraint (4.27) takes care that the total time that an arc is active is
not less than zero. Last, understanding that ℒ𝑘 is the set of available locations within the
jamming range of arc 𝑘, it should be evident that equation (4.28) requires that the
capacity of an arc that is within the proximity of a jammer is zero (i.e., no data flow is
possible under jamming conditions).

4.4.1.4.4 Cormican, Morton, and Wood
To make the process of solving the bi-level mixed-integer programming model
easier, it might seem appropriate simply to consider taking the dual of the inner
maximization problem (g(x)). However, to avoid having to account for bi-linear terms in
the resulting minimization problem because of equation (4.28), Cormican, Morton, and
Wood propose rewriting the inner problem without equation (4.28) simply by assessing a
penalty against data flow through jammed arcs. The updated version of the inner problem,
therefore, is as follows in equation (4.29).
𝑔 𝒙 = 𝑚𝑎𝑥 𝑦𝑎 𝑥 𝑦𝑘
(4.29)
s.t. (4.24) – (4.27).
We then can take the dual of equation (4.29) to derive the minimization problem in
equation (4.30). In the case of equation (4.30), it is desired that the overall battery usage
be kept as low as possible while still maximizing the total data flow overall in the main
model. 𝑚𝑖𝑛 𝐵𝑖𝛾𝑖
𝑋,𝛼,𝛽,𝛾 𝑖
(4.30)
𝑠. 𝑡. 𝛼𝑖 𝑥 𝒜
(4.31)
𝛼𝑖 1
(4.32)
𝑇𝜎𝑖 𝛾𝑖 𝑈𝑘𝛽𝑘 , 𝑖 𝑁𝜎 𝑘 𝐼𝜎
(4.33)
𝛽𝑘 𝒜
(4.34)

𝛾 0
(4.35)
where the set X={xℓ : ℓ , xℓ{0,1}, } denotes the feasible jamming
location solutions.
4.4.1.4.5 Multiple communication pairs
Up to this point, we have considered only a single source-single sink combination
in the context of network data flow; however, a model with multiple sources and multiple
sinks is typically more appropriate and is not difficult to formulate. If ℳ is a set
including source-sink node pairs (of the form 𝑠𝑀, 𝑡𝑀 ), and each pair 𝑚 has a
particular desired data flow rate 𝐷𝑚 between each source and sink pair, the following
model may be formulated to find a value for the throughput. It is significant that
constraint (4.40) limits the demand for each source-sink pair but does not prevent
communication pairs from interfering with one another. The model that follows is the
multiple communication pairs extension of equation (4.29).
𝑔 𝑦𝑎𝑚 − 𝑥 𝑦𝑘𝑚
𝑚 𝑚
(4.36)
𝑦𝑎𝑚 𝑖 𝑠𝑚
𝑠. . 𝑦𝑘𝑚 𝑦𝑘𝑚 = 0 𝑖 {𝑠𝑚,𝑡𝑚} 𝒩
𝑘 𝑘 𝑦𝑎𝑚 𝑖 𝑡𝑚
𝛼𝑚𝑖 ,
(4.37)
𝑦𝑘𝑚 ( 𝑤𝜎),
𝑚 𝜎
(4.38)
𝑤𝜎𝑇𝜎𝑖 ,
𝜎 𝕀𝑖

(4.39)
𝑦𝑎𝑚 𝜁𝑚 ,
(4.40)
𝑤𝜎
(4.41)
After considering the multiple-communication-pair model for the inner problem 𝑔 𝒙 ,
the multiple-communication-pair model for the overall problem is as follows:
𝒙 𝑚𝑖𝑛 𝑋,𝛼,𝛽,𝛾 𝐵𝑖𝛾𝑖 𝐷𝑚 𝜁𝑚
𝑙 𝑚 𝑀
(4.42)
𝑠. 𝑥 , i, j 𝒜
k
(4.43)
𝛼𝑚,𝑡𝑡𝑚 − 𝛼𝑚,𝑠𝑚
(4.44)
𝑇𝜎𝑖 𝛾𝑖 𝑘𝛽𝑘 ,
𝜎 𝜎
(4.45)
𝛽𝑘 𝒜
(4.46)
𝜁𝑚
(4.47)
𝛾
(4.48)

4.4.1.4.6 Branch-and-cut solution methodology
Because finding an optimal solution for the model requires a large number of
constraints, it is useful to use an approach with which the constraints may be generated
dynamically. If ℐ is considered to be a particular subset of the independent set ℐ, then
equation (4.49) may be considered the “relaxed” version of equation (4.30), based on
using ℐ in lieu of ℐ.
𝑚𝑖𝑛 𝐵𝑖𝛾𝑖
𝑋
,
𝛼
,
𝛽
,
𝛾
𝜎
(4.49)
𝑠. 𝑡. 4.31 (4.50)
𝑇𝜎𝑖 𝛾𝑖 ,
𝜎𝜎
(4.51)
Solving model (4.49) should eventually provide a solution to equation (4.30), but, by
limiting the number of original constraints, the procedure to solve is more easily
performed. To account for the constraints not included in equation (4.49), a cutting-plane
approach is utilized by adding new independent sets to subset ℐ on an as-needed basis.
An iterative process is performed with a set ℐ smaller than ℐ, with the optimal objective
function value z* being the same whether considering either the smaller set (z*(ℐ)) or the
larger set of which the smaller set is a part (z*( ℐ)). To generate additional constraints of
type (4.51), a separation problem is used that looks for an independent set that, when

added to ℐ, results in a new constraint (4.51) that is maximally violated based on the
current values for 𝛾𝑖 and 𝛽𝑘. If 𝒩 𝐺′ is defined as the set of nodes in the conflict graph
and 𝒜 𝐺′ is the set of arcs in the conflict graph, the separation problem previously
referenced takes on the form of equation (4.52).
𝑧 𝜷 = 𝑚𝑎𝑥 𝛽 𝑘𝑈𝑘𝑣𝑘 − 𝑇𝜎𝑖𝛾𝑖𝑍𝑖
𝑘𝜖𝒩(𝐺′ ) 𝑖𝜖𝑁𝜎
(4.52)
𝑠. 𝑡 . 𝑣𝑘 + 𝑣𝑘′ 𝑘, 𝑘′ 𝐺′
(4.53)
𝑣𝑘 𝐺′ 𝑠𝑢𝑐ℎ 𝑡ℎ𝑎𝑡 𝑖 𝑖𝑠 𝑜𝑛𝑒 𝑜𝑓 𝑡ℎ𝑒 𝑒𝑛𝑑𝑝𝑜𝑖𝑛𝑡𝑠 𝑜𝑓 𝑘
(4.54)
𝑣𝑘 𝐺′
(4.55)
𝑧𝑖 𝐺′
(4.56)
In problem (4.52-56) the objective function, (4.52), maximizes the right-hand side
of equation (4.51). The 𝑣𝑘 variables have to be an independent set for the (4.53) and
(4.55) constraints to be met. To ensure that the value of 𝛽𝑘 does not become equal to zero
(meaning that equations (4.52-56) would not provide a maximally optimal value), a
modified weights factor 𝜷 = 𝑚𝑎𝑥{𝛽𝑘, 𝜀} 𝑘𝜖𝒩 𝐺′ is utilized with an extremely small
number (e.g., 0.001) as the 𝜀 value. To perform the operation of equation (4.52-56)
effectively, 𝜷 is substituted for 𝛽 𝑘 to find an optimal solution 𝒗 .
Finding optimal solutions for equations (4.49-51) and (4.52-56) depends on
embedding the cutting plane process inside of a branch-and-bound algorithm. Whenever
the branch-and-bound algorithm finds a new solution, a separation procedure is utilized

in which adding a new cutting plane is considered. If 𝛾 and 𝛽 are the current values of 𝛾
and 𝛽when a new value is determined for 𝒙, then the separation procedure is
1. Solve (4.33-37), returning 𝒗 .
2. If 𝛾 𝑘𝜖𝒩 𝐺′ 𝛽 𝑘𝑈𝑘𝑣𝑘 𝜎 𝑇𝜎𝑖𝛾𝑖𝑍𝑖, then add the independent set {𝑘:𝑘
𝒩 𝐺′ ,𝑣𝑘 to .
4.4.2 Results
Now that the model is developed, the next step of the decision-making process is
to execute the model. Table 4.24 shows the baseline parameters that will be used to
execute the model. The experiments were performed with n x n grid networks overlaid on
a fixed-size square. Thus, the greater the dimension of the array, the denser the grid of
network nodes; e.g., a 7 x 7 grid has 49 nodes and a 9 x 9 grid has 81 nodes. The default
grid network is a 7 x 7 grid, but the 9 x 9 grid is also used. The nodes are placed in a unit
1 square with the horizontal
and vertical distance of . For the baseline case, each n−1
network node only communicates on a single channel.
The networks are comprised of 16 communication pairs with a communication
rate from 0 to 2 generated randomly. For the two networks discussed, there are four origin
or destination nodes at the corner of the grid and four at the center of the sides. The
communication range, ci, is dictated by the radiation pattern selected. For the medium
power radiation pattern, the communication range ranges from 0 to 1 depending on the
corresponding degree in the radiation pattern (see Figure 4.16). The interference
multiplier was set to 1.75 based on the recommendation of Iyer and Karnik [2009], which
makes the interference range 1.75ci. This means that the interference range for one node
interfering with another from a communications standpoint will be 1.75 times the
communications range.

Table 4.24 Parameters and baseline values
Parameter
Baseline Value
Network dataset
Grid_7x7
Channels
1
Communication pairs
16
Communication range ci
Dictated by selected radiation pattern (will
use the medium directional antenna pattern
for these experiments unless otherwise
noted)
Number of possible jammer locations |ℒ|
25
Interference multiplier
1.75
Number of jammers
2
Jammer range
1/12
Transmit current for each node
45mA
Receive current for each node
50 mA
Battery capacity for each node
170 mAh
The number of possible jamming locations, ℒ, is a 𝑛 𝑥 𝑛 grid integrated with the
communications layer. The jammer range is set to , which is for an omnidirectional
radiation pattern with a radius of 1/12. This range was selected because it is the range
needed to jam two communications nodes. The number of jammers is set to two, which
means that, out of the 25 possible jammer locations, two will have jammers.
Finally, each node will have a transmit and receive current to represent the total current
𝑇 when a node is transmitting and receiving communications, with a key assumption
being that the quiescent current is not accounted for but can be in future iterations of the
model for specific devices. Each node will have a battery with a capacity represented in
milliamp hours (mAh) – the baseline value will be 170 mAh. The relationship between
the transmit and receive current and battery capacity is as follows in (4.57).
𝑇𝑜𝑡𝑎𝑙 𝑐𝑢𝑟𝑟𝑒𝑛𝑡 𝑇 𝑤 𝑐𝑎𝑝𝑎𝑐𝑖𝑡𝑦 𝐵
(4.57)

The next step is to answer the questions based on the execution of the model.
4.4.2.1 Does increasing the density of the network nodes that are used to
communicate with the video cameras help prevent a successful jamming
attack?
One of the items important to a decision maker is return on investment, i.e., how
much is spent versus how much benefit is received. This question seeks to answer that
question by presenting the performance impact of increasing the number of nodes in the
network. To answer this question, experiments were run with nodes with 1, 2, and 3
channels on two different grids; a 7 x 7 grid containing 49 nodes and a 9 x 9 grid
containing 81 nodes.
As shown in Table 4.25, increasing the density of the network nodes (i.e.,
increasing from the 7 x 7 network to the 9 x 9 network) increases the total data
transmitted through the network. The data represented here is a relative measure of
amount of data transferred and will represent some number of bytes depending on the
network characteristics such as the network bandwidth and actual data rates transmitted
(bits per second) which would impact the total data transmitted for a given period of time.
For example, if the total data transmitted as shown by the model is 1.2, that could
represent 50 bytes of data transmitted depending on the network parameters. In that case,
the model value of 2.4 would indicate 100 bytes of data transmitted. The density of the
network allows multiple paths in which the data can be transmitted in the face of
jammers. In addition, there is less of a probability that the jammers will interfere with the
specific path since there are only two jammers. In general, regardless of the number of
channels, the 9 x 9 dataset transmits more data when under interference. Knowing this
will allow the network designers and decision makers to design a network that has as
many nodes as possible to allow the most paths around the potential jamming attack.

Armed with this information, decision makers can perform a cost benefit analysis
to make the tradeoff of the magnitude of improvement in robustness against the cost. For
example, in this case, if each node is $1000 and 2 units of data are needed for the target
application, then a decision maker could choose to spend $49,000 on 49 nodes or $81,000
on 81 nodes. However if, 4 units of data needed to be transmitted, then a decision maker
would have to spend the $81,000. A decision maker could also determine that if they
needed 4.5 units of data, then a larger grid would be needed, assuming each node was
only limited to three channels. This could also drive requirements for other network
components to help make tradeoffs; for example, that only a certain level of resolution of
video is actually required to avoid costs in security to create a larger network that is
robust against attack.
Table 4.25 Number of channels and total data
Dataset
Number of channels
Total data
% change
Grid-7x7
1
1.2
2
3.1
154
3
3.7
20
Grid-9x9
1
2.4
2
4.1
72
3
4.4
7
4.4.2.2 Does increasing the number of channels available for each network node
help prevent a successful jamming attack?
This question would be helpful for a network designer so he or she could
understand the benefits of increasing the number of channels when doing design tradeoffs
for specific ad hoc network node devices. To answer this question, one should refer again
to the results in Table 4.25. The model was first run with one channel, which indicated

that the total data that flowed through the system after a jamming attack was 1.2. If the
video camera were to require 3 units of data to be effective during the jamming attack,
then, with a 7 x 7 grid, a network designer would need at least two communication
channels. If the same logic applies to the 9 x 9 grid, then a network designer would need
2 channels as well.
As shown in Table 4.25, as the number of communication channels increases, the
total data transmitted through the network also increases. This occurs because, if one
channel is jammed, the network device can cycle through the channels until a channel
that is not jammed is found. Thus, network designers should design networks with the
most available channels to overcome the impact of a jamming attack. The data also shows
that, for both the 7 x 7 and 9 x 9 grids, the greatest benefit with two jammers occurs when
two channels for each node are created. Using three channels gives about a 20% increase
in total data transmission on the 7 x 7 grid but has only a minimal impact on the 9 x 9
grid. In any case, the 9 x 9 grid still transmits more total data.
A decision maker can now use this information to determine the threshold number
of nodes and channels for which the system is robust to likely jamming scenarios and
therefore where it makes sense or not to make additional investments in network nodes.
For example, if 3 units of data need to be transmitted, a decision maker could choose the
7x7 grid with two channels or the 9x9 grid with two channels. Assuming that each of the
nodes is the same cost, it makes more sense to select the 7x7 grid. However, if at some
point in the future the decision maker anticipates needing to transmit 4 units of data, it
may make sense to invest in the 9x9 infrastructure now. Another case to consider is the
case where two units of data is desired to be transmitted. To meet the requirement in this
case, one must use either the 7x7 grid with two channels or the 9x9 grid with one

channel. In the case where a node with two channels is more expensive (e.g., $1500) than
the nodes with one channel (e.g., $1000), then the cost tradeoff would be $73,500 (7x7)
versus $81,000 (9x9) which makes the 7x7 grid cheaper. While this is the same result, a
decision maker could choose to invest in the 9x9 for future capability since the price for
the nodes is fairly close. These are the types of tactical and strategic decision the data
produced by the model allows a decision maker to make.
4.4.2.3 Does changing the transmit current of the network communication nodes
help prevent a successful jamming attack?
Each node has limited battery capacity. In this example, the battery capacity is
influenced by the transmit and receive current and how long the device is transmitting
and receiving. The data shows that there is a point between 1 and about 50 mA of receive
current at which the total data that the system transmits is saturated (i.e., no more data can
be sent). As the current increases, the total data transmitted decreases; this is expected
because with a higher transmit and receive current for each device comes more battery
usage. Knowledge of this fact is useful to network designers because it can help them
understand the level of battery capacity required when designing a network by comparing
this data with the data in the specifications for specific devices.
Decision makers can use this information to determine the type of network nodes
that are needed to transmit the data for a specific application. For example, if
transmission of 1.2 units of data is needed then nodes with as little as 1 mA of transmit
and receive current may be used. By determining the smallest amount of current needed
to transmit a specific amount of data, other design considerations such as battery size can
be optimized to fit the specific application needs. In addition to the robustness against
jamming, another alternative to consider is how an adversary could cause a network to

not transmit data at all or reduce the data transmitted. If an adversary, which could be an
insider, were to place 20,000 mA jamming devices then they could stop data
transmission. On the other hand, if they placed 90 mA devices then they could reduce the
data transmission to a point where it is not useful for a specific application. This could
cost the network operators time in troubleshooting and reduce the confidence in the
reliability of the network, which would allow the adversary additional time to take other
actions. These types of decisions of both the asset owner and adversary are tradeoffs that
this analysis allows a decision maker to make..
Table 4.26 Transmit and receive current impact on total data transmitted
Transmit current (mA)
Receive Current (mA)
Total data transmitted
1
1
1.2
45
50
1.2
90
90
0.77
150
150
0.54
300
300
0.27
1,000
1,000
0.08
2,000
2,000
0.04
3,000
3,000
0.03
4,000
4,000
0.02
5,000
5,000
0.02
10,000
10,000
0.01
15,000
15,000
0.01
20,000
20,000
0.00
4.4.2.4 How does changing the battery capacity impact the overall network
flow?
Figure 4.20 shows the total data transmitted depending on the battery capacity and
the type of radiation pattern, each of which has a different current level. The data shows
that, at high power, the data transmitted is four to five times more than the data

transmitted at medium power. The reason for this is that high power allows more nodes to
connect to each other at any point in time, but there is also a tradeoff because of the
potential to interfere with other communication nodes in the network. The other notable
characteristic of the results is that eventually further increasing the battery capacity
available does not increase the total data transmitted. In the case of high power, this point
is at 240-250mAh and at 160-170mAh in the case of medium power. The low power
radiation pattern is very close to the medium radiation pattern in terms of the amount of
data transmitted. By having this information, network designers can have a preliminary
idea of where the point is at which the battery capacity for each node is optimized based
on the total data they need to transmit through the network.
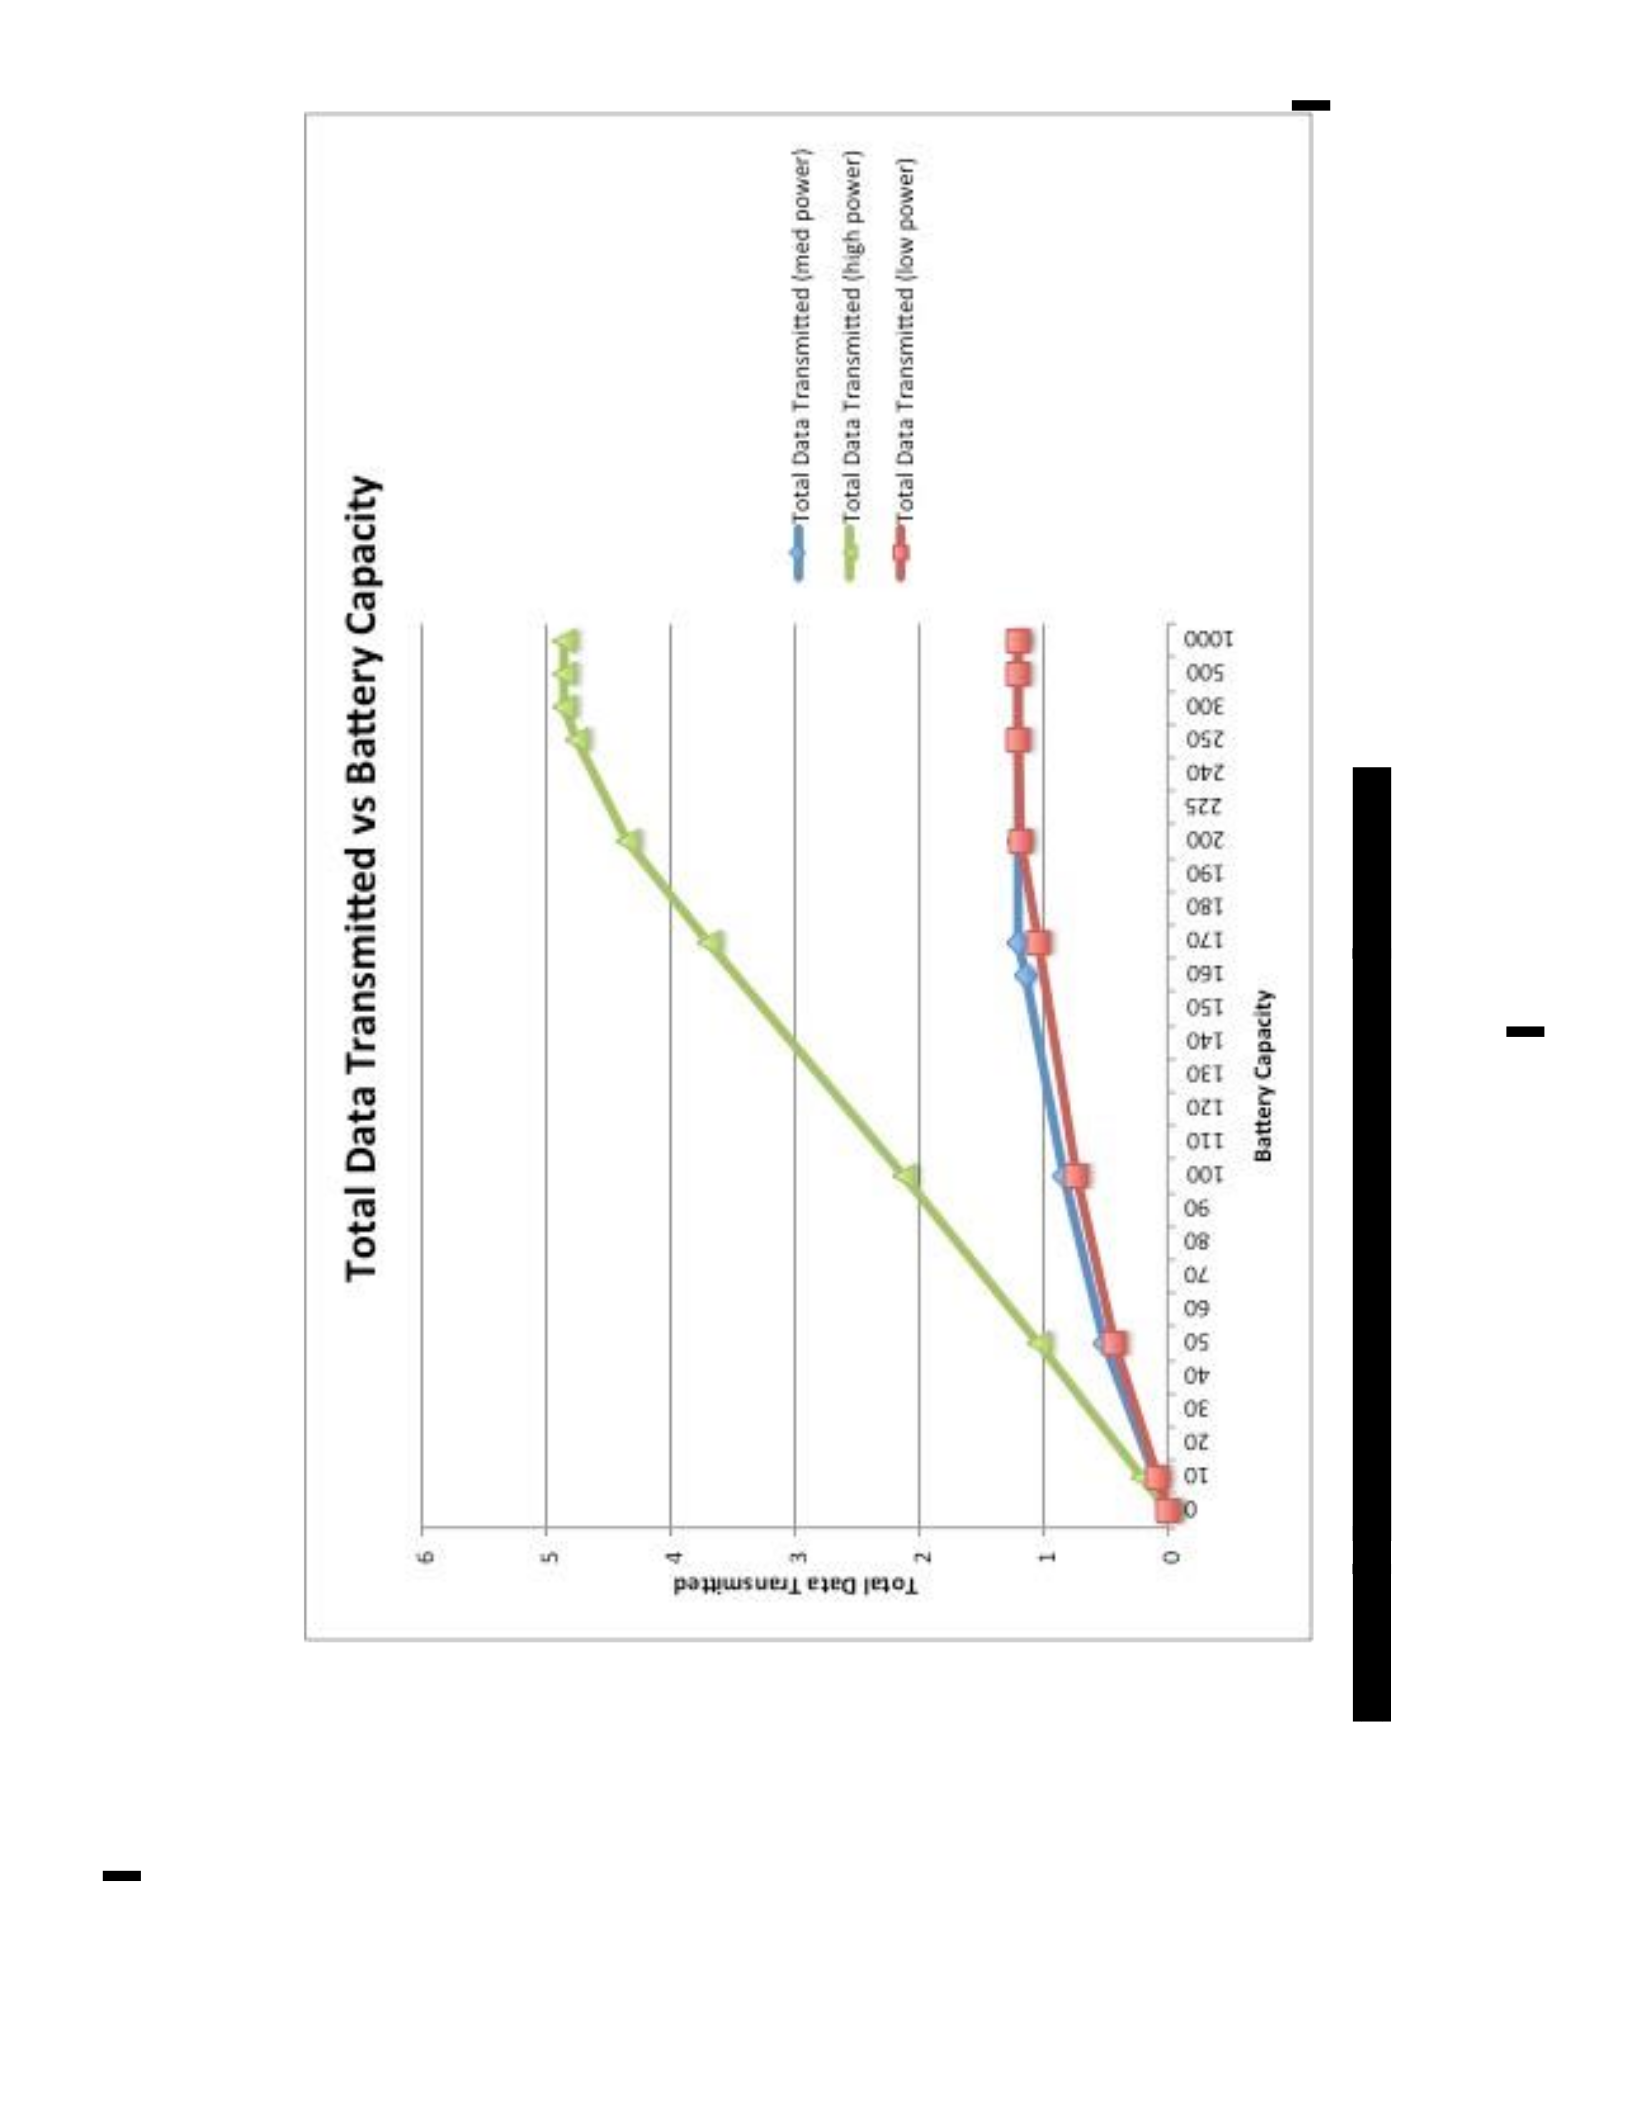
Ayroedes
Alayyeq
SNSIOA
po}TWIsUR])
Pep
[RIO],
OZ
p
NBII
+
Aypede)
Auapeg
SSSBERSSSSEEESEESeexeeserse
0
T
z
[JaMOd
MOF)
PSWIWSULS)
BEG
[230]
wets
A
(LJamod
YFry)
PAWIWSULS
LIEM
[LICL
ents
y
(290d
PaUs)
PIBWSUCL)
CIE
[210]
cep
£
:
po
$
9g
Ayisedez
Asayeg
SA
payiwmsuel
ejeg
je}OL

The ability to determine the battery capacity required to support the desired
amount of data transmitted also allows more detailed design tradeoffs from a size, weight
and power perspective. A decreased battery capacity could decrease the cost of each
network node and therefore allow more network nodes to be added to the ad hoc network
for the same cost. For example, if 49 nodes were needed that required a 1000 mAh
battery (e.g., $4) capacity versus an 81 node network that only required a 200 mAh
battery (e.g., $1) capacity then the cost of the batteries could drive the cost of
implementing more nodes to be closer to the implementation with less nodes. Assuming
the nodes were the same cost, the cost tradeoff would be $196 (49 nodes) versus $81 (81
nodes). Therefore, having more nodes could be less cost based on the battery capacity
required to meet requirements. Based on the results shown above, increasing the number
of network nodes makes the system more robust against jamming attacks and therefore
this analysis involving battery capacity needed (Figure 4.20) could result in identifying a
more robust network for a similar or less cost while transmitting the same amount data.
4.4.2.5 How many jammers would have to be placed to completely stop
communication for the video system?
This question highlights the tradeoff between connectivity, interference, total data
transmitted and cost. In the BLMIP, the tradeoff between connectivity and interference is
a factor in determining the total data transmitted. Connectivity is determined based on the
communication range (𝑐𝑖 and interference range 1.75c𝑖) of each node which determines
which nodes can communicate with each other. Note that the values of the
communication and interference range can be changed in the model which provides a
mechanism to perform tradeoffs to understand how these parameters influence the output
of the BLMIP, which is the total data transmitted. Once the total data transmitted is

determined from the model, the next step is to determine the cost impacts of
implementing a particular solution.
This process can be illustrated by using Table 4.27 to answer the question posed
about the number of jammers to completely stop communication. The radiation pattern
selected is shown in the antenna column of Table 4.27. This was the input to the BLMIP
along with the interference range, which is the same for all the data in the table. Note that
both the radiation pattern and interference range can be modified based on a specific
application. Once the BLMIP is executed, the results show the tradeoff between
connectivity and interference as it impacts the total data transmitted, which is shown in
the last column of Table 4.27.
Table 4.27 Number of jammers and total data transmitted
Number of
jammers
Antenna (power)
Total data
transmitted
1
Directional (low)
2.3
1
Directional (medium)
2.6
1
Directional (high)
4.9
2
Directional (low)
1.0
2
Directional (medium)
1.2
2
Directional (high)
3.7
3
Directional (low)
0
3
Directional (medium)
0
3
Directional (high)
2.6
The data in Table 4.27 shows that, as the number of jammers increases for each
radiation pattern at the three power levels, the total data transmitted decreases. One
should note that, for the low and medium power levels, the data transmission decreases
by half, while the effect on the transmission with high power is much less severe. The
robustness of higher power is shown in Table 4.27 with a scenario involving three

numbers of jammers and the three power levels; the high power level is the only power
level that allows any data transmission no matter how many jammers are placed. The low
and medium power levels do not allow data transmission with 3 jammers; therefore,
network designers would not want to use low or medium power levels in high risk
environments (i.e., three or more jammers).
Once the total data transmitted is determined based on the connectivity range,
interference range, and number of jammers, the next step is to determine the tradeoff
between the total data transmitted and the cost of a solution. As an example, the
Directional (medium) antenna with two jammers, one channel, and total data transmitted
of 1.2 units will be used. This can be compared to the data in Table 4.25 which is based
on a Directional (medium) antenna with two jammers, two channels, and total data
transmitted of 3.1. The only difference in these two data points is the number of channels.
Assuming that a node with more channels is more expensive and a decision maker needs
to transmit 3 units of data, they would likely choose the two channel option. This analysis
is not only useful for answering the question about how many jammers prevent data from
being transmitted, but as shown it can also be used to enable decision makers to make
tradeoffs between multiple factors that influence the overall cost of a system.
4.5 Decision analysis based on the case study results
Based on the results of all the data from the case study, the decision maker was
able to determine how to use their funds for security investments. Table 4.28 below
describes the decision that the decision maker made as a result of the data from each part
of the analysis. For the operations analysis on path 1, the decision maker determined that
they would provide additional background checks for the three key influencers and the
most highly trained technician. The assumption is that there is only one technician at the

level 5 or 6 level. These were the positions that were identified in the analysis as having
the potential to cause the most damage as malicious insiders.
Table 4.28 Case study scenario results
Category
Description
Unit Cost
Total Cost
Operations
(path 1)
Invest in additional
background checks for
the following 4
employee job
functions:
-Director – Electric
Grid Operations
-Grid Control Manager
-EMS Operations
Manager
-Step 5 & 6 Apprentice
Maintenance technician
$10,000 each
$40,000
Electric substation
(path 2)
90% solution for rural
substation
$863,700
$863,700
Wireless video
monitoring
(path 3)
81 nodes with two
channels to support the
data requirements are
needed if accounting
for 2 jammers present
$1,000 each
$81,000
$984,700
For the electric substation analysis on path 2 (see Figure 1.2), the decision maker
determined that the highest risk substation was a rural substation that currently had no
security implemented. The decision maker chose the 90% solution to ensure all the
security measures could be done within budget. Finally, the decision maker determined
that total data of 4 needed to be transmitted and therefore 81 nodes with 2 channels were
needed. This scenario has demonstrated how the data from each path is aggregated to

allow a decision maker to determine the best use of security resources based on budget
constraints.

