


Introduction A newly founded domain is pervasive
A newly founded domain is pervasive systems. A pervasive system is a new trend of systems
that shifts away from the one person, one computer paradigm to the era where human
interaction is explicit. In other words, pervasive systems are the systems that exist everywhere
around the users and provide them with a variety of personalized services according to their
needs. We discuss the characteristics of pervasive systems in more details in section 1. There
are numerous challenges facing the design of successful pervasive systems. Some of the major
challenges are power management, wireless discovery, user interface adaptation and context
aware computing.
Software development is still a difficult engineering process as the level of complexity is
increasing day after day especially for the newly found domains and technologies, such as
Pervasive systems. The convolutions of software lead both researchers and practitioners
towards exploring the software engineering challenges concentrating mainly on manufacturing
individual products. Nowadays, the attention shifted from engineering standalone products
into producing mass-customizable families of similar products, namely the Software Product
Lines (SPL). Instead of starting from scratch for every developed product, a software product
line targets the utilization of reusable core assets.
SPL is mainly based on reusability. It targets the development of software components that
share a common and managed set of features. SPL is divided into three engineering processes:
domain engineering, application engineering and variability and commonality management.
Domain Engineering is for developing core assets in the product line, while application
engineering is for building the final products on top of the product line infrastructure. Above
these two processes comes variability and commonality management to configure the SPL,
add new core assets, or enhance existing ones. SPL is discussed in more details in section 2.3.
Current implementations of pervasive systems are based on ad-hoc implementations through
the adoption of frameworks. One major drawback however, is that developed pervasive
systems are not very scalable and are unable to evolve easily. Also, when dealing with large
and complex pervasive systems, the approaches presented in the related work, seem
insufficient. Pervasive systems are now moving from research to production which requires
the produced artifact to be more complex and to be of higher quality than the prototypes

produced by the research [44]. The heterogeneity of such systems and their management by
the traditional techniques of software development is hectic. This calls for a methodology that
accelerates their development.
1.1. Problem Definition
Many attempts were made to build product line specifications for various kinds of application
domains. Product lines have mainly been specified for application families that are
characterized by their multi-layer systems, for their data intensive usage [79], and for specific
domains such as embedded and distributed systems. two basic attempts for product line
specifications for pervasive systems found in [45] and [14]. Our literature review leads us to
conclude that the idea of Software Product Lines has not yet been maturely adopted in the
domain of Pervasive Systems. There is a clear lack of quasi-comprehensive reference
architectures for pervasive systems development, primarily due to the limited research efforts
made to analyze existing pervasive systems architectures and to create a suitable enough
reference architecture that can be used as a guide for building such systems. The existing
pervasive product lines do not contain reference architecture and do not accommodate for
many features of pervasive systems applications which include but are not limited to: context
identification and reaction, sensor intensity, the presence of actors, and event dissemination.
1.2. Thesis Statement
Our objective in this work was to perform a detailed review of existing pervasive systems
architectures, and to capture a semi-comprehensive set of features that would be
accommodated in the specification of a reference architecture to be used in the development
of a Software Product Line for pervasive systems. Our review will focus on gathering the
features that should be present in any pervasive systems. Subsequently, and instead of creating
an extremely sizable reference architecture for pervasive systems, we automatically generate
architectures for pervasive systems by allowing designers to select a set of features for
pervasive systems. Our automatically generated architectures were compared to human
generated architectures based on a set of pre-determined metrics used in the evaluation of
systems architectures.

1.3. Proposed Approach
The research was divided into four phases. The first phase was to define pervasive systems
and the main characteristics for achieving ubiquity and pervasiveness. The second phase was
to group the different features from the various architectures of pervasive systems and
categorize them. The third phase was to generate component-based architectures, and the
fourth phase was to evaluate them.
The first phase was initiated by investigating the pervasive systems‟ characteristics from
previous work. We narrowed down our related work collection to focus on approaches that
were adopted for defining pervasive systems. Perhaps the most prominent definition is Mark
Wieser‟s definition of pervasive systems in which he states: “The most profound technologies
are those that disappear. They weave themselves into the fabric of everyday life until they are
indistinguishable from it” [92]. The settled characteristics are ubiquitous access, context
awareness, intelligent Interaction and natural interaction. They are all discussed in details in
section 1.
In the second phase, we surveyed the literature for the most prominent architectures in the
domain, while capturing commonalities and variances in each. We then categorized them
according to their usage and operating environment as explained in section 4.1. The third
phase was to generate component-based architectures for a specified set of features. All the
collected pervasive features are first presented to the system designer and he/she selects the
features he/she wishes wanted to include in the system. The selected features are then passed
to our developed tool to generate a component-based architecture that best matches the selected
features. The final task was to compare the results from the evaluation metrics, (presented in
sections 2.7.1, 2.7.2 and 2.7.3), for the generated architectures against a professionally-made
architecture (as presented in section 4.4.2).
This document is organized as follows: Chapter 2 discusses the related work and literature
review on pervasive systems and SPLs. It also discusses the current software engineering
approaches used with SPL processes and the evaluation frameworks and metrics we came
across in order to analyze the generated architectures. Chapter 3 includes the study we

performed for more than fifty pervasive architectures to extract the features and components
from them. Chapter 4 is the core part of the thesis, which discusses the categorization we
carried out, our implementation to generate the pervasive systems‟ architectures, the
experiments we did to evaluate the generated architectures and the results of the experiments.
Chapter 5 is the conclusion for our thesis and finally the appendices.

Chapter 2 Literature Review
In this chapter we present our findings from the related work. We show the features for
pervasive systems that we extracted. Also, we highlight the SPLs and other software
engineering approaches. Finally, we present the evaluation methods we found to evaluate both
the architectures and the SPL.
2.1. Features of Pervasive Systems
The optimization of quality is crucial for pervasive systems as they require invisible
operation which causes them to be small in size and work with limited memory. In order
to have a pervasive computing environment, it is necessary to have the following:
ubiquitous access, context awareness, intelligent interaction and natural interaction [26].
2.1.1. Ubiquitous Access
Ubiquitous access is the sensors and the actuators that transfer input and output between
the real world and the virtual world based on wireless communication infrastructures. There
are many media that data could be sent over such as broadband satellite systems, cellular
radio communications, personal and local area radio communications, infrared and
ultrasonic communications. Due to the variety of hardware and software capabilities, a
communication infrastructure is required for maintaining knowledge about device
characteristics and managing coherent device interactions. The challenge is in keeping the
different connections live while moving between the different network types and
technologies. The routing and handing over can be managed at the network level.
Ubiquitous access also includes service discovery and registration, lookup services,
selfconfiguration and caching.
2.1.2. Context awareness
It refers to the ability of the system to recognize and localize objects as well as people and
their intentions. Also, it includes tracking other objects and coordinating the activities with
respect to and relative to other objects. Examples of such systems are: voice and vision
based systems, biometrical systems (fingerprint, retina, face recognition) In a study
mentioned in [26], a framework is to be proposed for building context-aware applications.
It utilizes a set of software components that work as wrappers for collecting low level
sensor data. Such data are then transformed into high level context information. Context

information is a time index that is represented in a metadata model named Resource
Description Framework (RDF). It is represented over the instances of the abstract object
classes as follows: person, thing and place and their contextual interrelatedness. A context
prediction system is used for predicting the future sensor data.
It assumes a stationary time series underlying the sensor data process.
2.1.3. Intelligent Interaction
It is the ability of the technology-rich environment in the pervasive systems to adapt to
people dealing with it [81].
2.1.4. Natural interaction
Natural Interaction refers to the interaction between the humans and the surrounding
environment and how the surrounding environment receives inputs from the user and acts
upon it, such as natural speech and gesture recognition. Rami et al. describe [95] the
characteristics of pervasive systems as follows:
1. Heterogeneity: Variety of software and hardware components that work with each
other to produce users‟ goals.
2. Presence of small devices: In order to be invisible to the users. They should be small
in size, memory, and power consumption.
3. Limited network facilities: Most of the network protocols are limited in connection
such as GPRS and Bluetooth.
4. High mobility: Handheld devices that can accompany the user everywhere.
5. User-oriented: Presented services should target the user and not a specific device
or location.
6. Dynamic environment: Users keep moving, and the environment should keep track
of them in order to deliver their services.
7. Adaptation to diversity: Pervasive applications should adapt themselves to the
device requirements, networks, etc.
8. Interaction with peers: The applications should have the ability to form ad-hoc
networks between others in order to exchange information.
9. Flexible computation model: Users are interested in different types of data.
Therefore, the need for constructing a flexible computation model will help
pervasive systems to evolve rapidly and smoothly.

Another approach presented in [81] divides the pervasive systems into five features that
should be present in order to name an application as a pervasive one. It should contain the
support for context, location, actors, sensors and events. The difference between the
previous approach and the current one is splitting the location from the context. Context
has a broader view than the user‟s location. There are other interesting things about the
user which are variable. Context includes lighting, noise level, network connectivity,
communication costs, communication bandwidth, and social situation, e.g. with your boss,
co-workers [77].
Now, we will be discussing the different definitions of what is software architecture.
2.2. Software Architecture Definition
In this section, we will be showing the definition for software architectures. The most
formulated and standardized is the definition presented by IEEE Standard 1472000 [3]. It
states that the “Architecture is the fundamental organization of a system embodied in its
components, their relationships to each other, and to the environment, and the principles
guiding its design and evolution”. In other words, the architecture is a design or a set of designs
for a certain system which targets accomplishing a task or more in the environment.
The Standard defines the system as “a collection of components organized to accomplish a
specific function or set of functions”. Also, the environment defined by the Standard as the
situation and conditions of developmental, operational, political, and other manipulations upon
that system. The architecture defines the structure and the behavior of the system. The
structure includes the different ingredients that build the system up. For example, class
diagram from UML can describe the structure of a system. The behavior of a system is defined
by the interactions inside the system according to inputs given to it. Sequence diagram from
UML is used to describe such behavioral attitude of a system.
Now, we will be showing SPL‟s definition, history, fundamentals and life cycle of SPLs in the
following section.

2.3. Software Product Line (SPL)
In this section we will be talking about SPL history, fundamentals, SPL life cycle, engineering
processes: domain engineering, application engineering and variability and commonality
management.
2.3.1. SPL history
Although not new in concept, the idea of Product Lines was adopted in the domain of software
engineering. Computer scientists paid much attention recently to explore software product line
engineering (SPLE) in response to the growing need for methodologies that cut development
costs and take much less time to market than what is currently in place. The move towards
applying SPLE is always motivated by economic concerns. The key feature behind SPLE is
the application of reusability; and SPLE is not the first approach to reuse software. Previous
reusability attempts for developing core assets lacked an organized analysis of future
variability [22].
Now, we will be giving a glimpse about SPLs‟ history. In the 1990s, the concept of product
lines was introduced, and the first methodology that was applied was Feature-Oriented
Domain Analysis (FODA). Concurrently, many companies started to investigate product lines
such as Philips which introduced the building-block method.
Later, many companies and scientific projects in Europe started exploring SPLE [27] such as:
Architectural Reasoning for Embedded Systems (ARES) between 1995 and
1998.
Product-Line Realization and Assessment in Industrial Settings (Praise) from
1998 to 2000.
Engineering Software Architectures, Process and Platforms (ESAPS) from
1999 to 2001.
From Concepts to Application in system-Family Engineering (CAFÉ) from
2001 to 2003.
FAct-based Maturity through Institutionalization, Lessons-learned and
Involved Exploration of System-family Engineering (FAMILIES) from 2003 to
2005.

2.3.2. Fundamentals of SPL
Studies have shown that applying the SPL approach can result in a shorter time-to-market
and improved productivity. SPL is different from single system development. There is a
huge change in perspective between the traditional way of developing software products
and SPLs. The former is based on ad-hoc next-contract vision while the latter is based on
a strategic view of a field of business. SPL is dependent on the concept of reusability but,
not in the traditional meaning. Reusability is for building assets that are to be used in the
product line [51]. SPL works on the development of software components that share a
common, managed set of features and they are developed using the same set of core assets.
The fundamentals of the SPL Engineering Approach are divided between Domain
Engineering, Application Engineering and variability and commonality management.
Domain Engineering is the development of core assets to be used in the product line, while
application engineering is concerned with building the final products on top of the product
line infrastructure. They are loosely coupled and are synchronized by platform releases.
Domain engineering addresses development for reuse while application engineering
addresses development with reuse. Variability and commonality management is for
configuring the SPL, adding new core assets, or enhancing existing ones.
Two major techniques are used when dealing with requirements in the SPL: use cases and
feature models, and they can be used together. The former is used when dealing with user
orientation in the sense of focusing on the functionalities that should be used by the product
line. Consequently, it is considered the driving force for guiding the development. The
latter has a re-use orientation and is used to address better functionality for the product line
members [7].
2.3.3. SPL Life Cycle
In order to deliver a successful product, the management process should capture the life
cycle of the product starting from the inception phase until delivery. Three essential
activities are carried out during the SPL life cycle, the core asset development, product
development and management. The domain engineering or core asset development and the
application engineering or product development are considered two separate lifecycles
[27]. The product management is the phase at which the scope of the product line and its

market strategy are defined. The management of common and variable features and the
change in the market could affect the product line life cycle. For example, the introduction
of new features or the elimination of outdated ones should be monitored by the product
management. Each life-cycle contains four stages which are: requirements engineering,
design, realization and testing.
2.3.4. Domain Engineering
Domain engineering is the process of developing core assets that will be used in the product
line. In other words, it is the process of saving the previous experience in building systems
or components from a certain domain in the form of assets. The activities in the domain
engineering start with product management, with the aim of capturing the commonalities
and variabilities among the products. Followed by domain requirements engineering which
targets getting the requirements, identifying the commonalities and variabilities and
constructing a variability model. The third phase is the domain design phase which is
responsible for the development of the product line architecture that is going to be the basic
infrastructure. Domain realization is where the detailed design and reusable components
are implemented with the realization of the variabilities. During domain testing, the
reusable components that were implemented in the previous activity as well as the
constructed reusable test assets can be reused in testing.
The organization of the assets is dependent on how they will be used to produce different
products. The organization of such assets is the key for successful product lines. Industrial
experience has shown that having the right assets is not enough for easy assembly. The
choice of the right asset should be done in less time than developing it. The evaluation of
the asset organization as suggested by Hunt [42] is based on three approaches which are:
key domain abstractions, architecture, and features. Such approaches are evaluated against
the criteria of: natural division, ease of finding, general applicability, reasonably sized
groups and similarly sized groups.
Natural division: it evaluates if the grouping of the components is understandable and
related to some set of concepts to the project. The selection should be a single category for
each component because multiple categories could lead to ambiguity.

Ease of finding component: the product developer is given some product description and
s/he will choose a component to derive the product. The evaluation here is based on
examining the organizational map to the product description to ensure that the description
is easily understood by the product developer.
General applicability: checks if the approach can be applied to a wide range of problem
domains.
Reasonably sized groups: each group should be in a range of manageable size for the ease
of searching.
Similarly sized groups: this is to maximize the average amount of information provided by
each choice.
Organization Approaches: These approaches as suggested by Hunt in [42] for organizing
the asset base are:
1- Key Domain Abstraction Organization: which starts by creating a group
under the root for each domain identified followed by the identification of the top
level abstractions in each domain.
2- Architectural Organization: it is applied by mapping the architecture onto
a tree – similar to what is done in single product projects. Grouping the components
into reasonably sized groups besides having a layered architecture helps in
organizing the assets.
3- Feature Based Organization: This approach works by organizing the asset
base as features. Features are identified at the early stages in the development
process which is the foundation for having an early organization of assets.
Moreover, features give the glimpse of having a clear vision of the problem and the
solution domain. Converting the feature model into an architectural model is also
easy because the former is in the form of a tree.

The implementation and documentation of the domain software components needs a
systematic way to accomplish. A methodology called Open Service Gateway Interface
(OSGi) helps the developer during the implementation and documentation [22]. OSGi is a
java-based interface, framework and computing environment that is used to manage,
develop and deploy software components. The main motive to use OSGi is the flexibility
in adding, removing and editing components without recompiling the whole system.
Moreover, OSGi is a dynamic environment, i.e. an application can easily migrate to an
updated software component dynamically. Concerning its architecture, it is divided into
four layers. The first layer is the Security Layer and it is used in signing its assets. The
second layer is the Module Layer and it is responsible for managing the bundles – java
classes and other sources that bring functionalities to the end user. Thirdly, the Lifecycle
Layer, is the layer responsible of controlling the security and life cycle operations of the
bundle. Finally, the Service Layer which is used to register services, search for them and
receive notifications whenever their state changes.
Almeida et al. [22] define some rules that should be followed in order to have proper
domain implementation which are:
A component must have interfaces.
A component should have a transparent life cycle mechanism.
A component should be configurable.
A component must have a third-party integration mechanism.
Context independence.
Documentation.
Evolvabiltiy.
Version compatibility.
Their methodology [22] is divided into two steps, component implementation and
component documentation.
The Component Implementation is divided into seven activities. The activities from 1 to
4 are responsible for developing a reusable component, while the rest are for using a service
from a reusable component.

Activity 1: Defining the component and describing the general-purpose information is the
first activity. Such data is stored in a manifest file to be used by the OSGi framework to
install and activate it properly.
Activity 2: The software engineer specifies the provided services which are similar to
specifying an interface that consists of operation and attribute definitions.
Activity 3: At this stage, the services and the code to register them are implemented.
Activity 4: In this activity, the component is built and installed which requires compiling
and packaging it in a suitable form for deployment.
Activity 5: Similar to activity 1, the software engineer describes the components that will
reuse other services.
Activity 6: The required services and the rest of the code are connected at this activity.
Activity 7: The last activity, similar to activity 4, is for building and installing the
component that reuses the services.
2.3.5. Application Engineering
Application engineering is the process of building up the final product with the core assets
developed in the domain engineering as presented in [51]. The activities in the application
engineering are almost the same like domain engineering. The difference is that the
application engineering is intended for the development of a certain product on top of the
platform developed in the domain engineering. The activities start with application
requirements engineering that capture the requirements of a certain product with the least
possible deviation from the existing commonalities and variabilities defined in the product
line infrastructure. The application design is where an instance of the reference
architecture is instantiated with the requirements defined in the previous activity. The
application architecture should be consistent with the reference architecture as long as we
are dealing with reusable component i.e. plug-and-play reuse. Application realization is a
stage where the product is implemented based on the available requirements and
architecture by reusing and configuring existing components and developing new product-
specific ones. Application testing is the final activity before delivering the product. The
product is validated against the application requirements.

2.3.6. Variability and Commonality Management
Modeling the variability is usually produced using the concept of variation points. Such
variation points identify where the location of product variations will occur [7].
In domain engineering, the domain requirements commonality and variability are
developed for producing a set of well-defined reusable assets of SPL. Dependencies among
the requirements of a domain help in getting the requirements set, however, they could lead
to requirements conflict and inconsistencies. A feature oriented approach for managing
domain requirements dependencies suggests using features to reflect the requirements
dependencies. Features are tightly-related requirements from the stakeholder‟s perspective
and they could not be independent in a system. This approach uses the directed graph for
the representation and analysis of the domain requirements dependencies. The directed
graph is better than the tree structure because a tree structure cannot capture feature
dependencies.
2.4. Dynamic Software Product Line (DSPL)
Newly introduced technologies such as ubiquitous computing, service robotics, unmanned
space and water explorations, are facing pressure in producing economically high quality
software on time. Such technologies are dependent on collecting the inputs through sensors
that change dynamically and adapting themselves to changes in requirements at runtime.
Therefore, there is a need for a DSPL that gets software done with a high capability in adapting
itself according to the users‟ needs and resource limitations [87]. A static or traditional
software product line is mainly targeting the variability at the development time. On the other
hand, a dynamic software product line targets the variability at the runtime of a system by
binding variation points at runtime according to the changes in the environment. In other
words, for the generated products in a SPL, binding features could be accomplished at any
time, either at design time, compile time, configuration time or runtime. The main difference
between the DSPL and SPL is that product functionalities could change automatically without
any human intervention.
As mentioned earlier, SPL is proposed in order to cut down the costs and reduce the time-
tomarket. By the use of commonalities and variability management, products are selected
from a set of features. These features are selected at different binding times. The features that
will be used at runtime will be postponed till the end of the product cycle to get bound. Once

the product is released from the SPL, it has no connection with it, i.e. no automated activity is
specified in the SPL in order to keep the features updated.
On the contrary, DSPL aims to create products that are configurable at runtime. The products
also will have the capability to reconfigure themselves and gain advantage from constant
updates. A configurable product (CP) is that produced from a DSPL and it is similar to the one
produced from a traditional SPL [13]. The difference is in the two added components to the
CP to enable reconfiguration which are: the decision maker and the reconfigurator. The
decision maker's task is to retrieve the environmental changes that suggest modification such
as external sensors or users. Such information is then analyzed and the appropriate actions are
chosen to be carried out. The reconfigurator's mission is to execute such changes by the use
of the standard SPL runtime binding.
DSPL has the following properties which are not in the traditional SPL [78] and [13]:
Adaptability: It is the ability to adapt to the change in the requirements and surrounding
environment.
Change in binding several times as well as variation points during the lifetime of the
software.
Automatic capabilities: CP should be able to take decisions about the features that should
be activated or deactivated at runtime according to the collected environmental or user
requirements changes, i.e. it works under unexpected changes from the surrounding
environment.
Product updates: Ease of updating the product features at runtime.
It is dependent on the individual desires and the situation not on the “Market” as the driving
force for it.
In the following two sub-sections, we will be discussing the decision maker and the SPL
configurator.

2.4.1. The Decision maker
The decision maker is responsible for taking the decisions of which features to be
activated/deactivated. In order to allow the decision maker to take decisions, some
information should be taken into account [13]:
The available features in the CP along with their states.
The features' dependencies.
The information about an involution scenario or required features that are present in the
adaptation triggers.
The user requests for features activation/deactivation.
The decision maker generates decision models. The decision models are important
for SPLs as they direct the derivation of the product variations specified by the change in
requirements. In DSPL, the varying requirements at runtime require the decision models
to support automatic reconfigurations in response to such changes.
Three main approaches have been proposed for the description of decision models for
DSPL in order to allow the product to self-adapt itself according to the change in the
requirements during runtime. The three approaches are [34]:
o Situation-action approaches: configurations are specified as to exactly what actions
to perform in certain situations.
o Goal-based approaches: high-level goals and objectives are defined so that the
system self-adapts itself to fulfill them.
o Utility functions-based approaches: application properties, context and goals are
assigned to a utility value for each application.
Utility functions-based approaches are advised because they have many advantages [34]
which are:
1. Achieving the best configuration is a complex process, and requires reasoning
on the dependencies between the context elements, adaptation forms and
concurrent forms.

2. It is better than the situation-action approaches because the situations are not
explicitly described. They result from the middleware at runtime.
3. In order to adopt the application at runtime, a decision model for shared
resources applications can be built from the model fragments accompanied by
the components.
The study by Brataas et. al [34] suggests applying the utility function over their MADAM
(Mobility and Adaptation-enabling Middleware) approach. The MADAM approach is a
self-adaptation approach that uses the architecture models to control variation at runtime.
This approach was developed for the mobile computing environment [43].
A mathematical formula is implied to solve the resulting scalability problem due to the
increase in the variants that lead to poor performance [34]. The algorithm works by going
through all the alternatives, then choosing the one with the peak utility. This cuts down the
performance from the exponential number of computational power to find a variant in a
number of variant points to a linear number.
2.4.2. The SPL Configurator
The SPL configurator is responsible for the following [13]:
o Computing the required configurations in either scenarios – involution and
evolution – and sending them to the CP configurators.
o Generating a variability model for the CP derived from the SPL variability model
according to the selected features.
There are two types of DSPL [13] which will be presented in the following section.
2.4.3. DSPL Architecture
2.4.3.1. Connected DSPL
The DSPL is responsible for the product adjustments. Updates are the task of the
DSPL to be sent to the products attached to it. It works when the CP senses new
environmental changes [13]. It sends such collected data to the DSPL in charge,
which in turn starts processing the sent information and calculates the variations
that could be done. If the changes do not apply to any variant, the process fails and

the adaptation may not be completed. If the changes are applicable, the updates
and the configurations are sent to the CP after they get generated. Finally the CP
updates itself.
2.4.3.2. Disconnected DSPL
The CP is in charge of the adaptation once the product is released. The DSPL
produces artifacts that have the capability to configure themselves to deal with
contextual changes. It works when the CP senses changes. This time the CP
calculates the changes that are required to be done without contacting the DSPL. If
there is no configuration that suits the requirements, the adaptation process fails.
The CP reconfigures itself to the new adaptations if there is a generated
configuration [13].
Cetina et al. [13] proposes a mixed approach as shown in Figure 1. It solves the problem
that may be caused from connected and disconnected DSPLs. Connected ones produce
products that must always be connected with the responsible DSPL. On the other hand,
disconnected ones produce automatic CPs that are shorter in range. The mixed approach
produces CPs that are scenarios aware. In involution scenarios, CPs behave as in DDSPL
while in the evolution ones they behave as in C-DSPL. These are the steps carried out
when there are changes in the requirements at runtime:
1. The CP senses the changes in the environment and it activates the adaptation
process.
2. The CP computes the configurations that are required to deal with the situation.
a. If there is no configuration that suits the environmental changes, the CP
contacts the SPL in charge. The SPL generates the required
configurations and then sends them to the CP. If there are no relevant
updates to the situation the operation fails.
b. If there are matching configurations that can be generated. The CP
performs the task and reconfigures itself

Figure 1: Mixed SPL Overview [13]
A study about a transition from static to dynamic software product line was conducted by Klaus
and Holger [78]. It targets having minimal transitional steps, and it does not recommend
having a middleware as a form of migration. Its goal is to have features allowed to be removed
and added during runtime of a system, i.e. runtime variability. Such transition could lead to
many difficulties and complexities. An example of such complexities is how the system could
handle a certain feature and then what should happen when the feature is called and during the
processing the behavior of the system is changed by removing this feature.
Another study found some concerns that should be taken care of during the change of
configuration throughout the runtime according to [31] which are:
For the parts that are not affected by the reconfiguration, they must continue to work
without any impact on them.
The reconfigured components must finish their current task before being configured.
Reconfiguration concerns must not be intervened with the application concerns.
Gomaa and Hussein [31] describe a way for modeling all the possible configurations for an
application. The four configuration scenarios that are proposed for a product family to evolve
automatically are: Product Configuration, Product Reconfiguration, Feature Reconfiguration

and Component Reconfiguration. Product Configuration is for the initial runtime
configuration while, Product Reconfiguration is for reconfiguring a product to another one at
runtime. Feature and Component Reconfiguration are for dynamically adding, removing or
replacing features and components, respectively. Figure 2 shows the reconfigurable process
and life cycle for evolutionary SPL.
Figure 2: Evolutionary Software Product Line Engineering Process [31]
Trinidad et al. [68] proposes a process for generating component architectures from a feature
model for such systems. It works by activating or deactivating the features by the generated
architecture. Four steps are proposed to produce a component model from a feature model.
They were successfully applied to a real-time television SPL [68] as follows:
1. Defining the core architecture: By extracting the features that are common among the
products. Then, defining the component model by creating a component for each
feature. Finally, relationships between the features are added which will be reflected in
the component model. For example, a relation between a parent feature and a child
feature is a dependency from the parent component to the child one.

2. Defining the dynamic architecture: This step works by using the non-core features to
generate the dynamic architecture. It is the same as the first step but this time they are
generated to the non-core features. Then, the set of interfaces according to the
responsibilities of each component are added.
3. Adding the configurator: The configurator in the architecture is the one responsible for
taking the dynamic decisions for a product. It is also responsible for knowing the
feature model, handling activation and deactivation requests of features and checking
them in order to produce applicable configurations.
4. Defining the initial product: The last step is defining the initial product by choosing
the core features that will be primarily active.
Another study describes how product line engineering can be used for producing product lines
based on web services that can be dynamically customized at runtime [35]. The case study
was carried on a radio frequency management system to demonstrate the suggested approach.
The approach can be extended to work with client/server applications. It also suggests using
the Dynamic Client Application Customization (DCAC) as shown in Figure 3. It is a proposed
approach where at runtime the client user interface objects are customized based on the features
chosen for the application and the values of parameters.

Figure 3: Conceptual overview of DCAC approach [35]
2.5. SPL in Domain Specific
In this section, we focus on the SPL development for certain domains from both industry
and academia. Many attempts have been made for utilizing SPLs for specific domains such
as distributed and embedded systems, data-intensive systems, adaptive systems and
pervasive systems.
2.5.1. Distributed and Embedded Systems
An approach presented is SPLE for configurations of a vehicle control system [50]. The
number of possible configurations grows exponentially with the number of options besides
the growth of the configuration space as new features are introduced. This approach uses

a method for solving the optimization problem with the identification of the minimal set of
configurations and the verification of this small set to achieve the correctness of the entire
product family. An example of family of indicators systems is used to illustrate the
approach in [50]. The example goes through the requirements, the logical architecture and
the evolution of the product line.
Another approach in the research of [96] describes how mobile device limitations and API
fragmentation problems can be solved using aspect-oriented programming. Memory usage
and application footprint size are examples of such limitations. The research suggests using
AspectJ - an aspect oriented extension to java and assists in developing modules for the
crosscutting concerns - in implementing product lines for mobile device applications [96].
It divides the optional features to be developed over the base ones into aspects.
2.5.2. Data-intensive systems
The proposed approach in [79] uses component based and model driven development in
building a SPL for data-intensive systems. Data-intensive systems are the systems that
handle data processing, visualization and storage. They are often multi-tier architectures.
Designing such systems from scratch is a costly process. Improving productivity of such
systems as their complexity increases day after day can be achieved using reusability of
software components. The work done by Schmoelzer et al. [79] presents an approach that
combines the concepts of SPLE with component-based software engineering and model-
based development for data-intensive systems.
Data-intensive systems are usually developed in a multi-layered architecture. They contain
three layers which are the user interface (UI), Business logic (BL) and Data Access and
persistency (DB).
Variability has influence over the three layers of multi-layer architecture. Any variability
in the data structure has effect on the three layers. The database layer is affected because
saving the data persistently is required. The BL layer variability consists of the
combination of control flow and data structure variability. The UI layer variability is
affected by the change in the layout and the way of presenting the data depending on the
customers' needs.
Variability in the database layer: For each product, it has its data structure that has different
variant selections and data structures. Obtaining variability can be done by combining

different data models. It can be achieved by the analysis of the individual and minimal data
model for each variation point and variant. After producing data models for variabilities,
the mapping between variability space and data model space is defined. The dependencies
between variation points and variants are imported from the dependent models to the
variability model. The data model of all selected variants and variation points are combined
to a single model that is used for the generation of the database structure for a certain
product.
Variability in BL: The business layer contains a set of reusable components with interfaces
that are used for their connections. They are called interconnection points or component
assemblies, and they are used for obtaining larger components with more functionality. In
other words, these reusable components are loosely coupled. The reused components and
their way of interaction define the behavior of the component assemblies. The general BL
functions are stored in components that are designed for variation points.
Variability in UI: similar to the way BL components are handled. The UI can be described
for example as a set of UI controls that are built together to form the layout. Combining
the UI components is the most crucial process in the SPL because it is the visible part to
the user. The behavior and the layout should be working properly to achieve a single UI.
This is obtained by defining layouts in XML files which may define extension points for
other layouts.
The framework for model-based product line architecture is shown in Figure 4:

Figure 4: Model-driven multi-layer architecture for SPL development [79]
Figure 5: Associations among the assets in products of web-based systems [10]
Web-based systems are a kind of data-intensive systems. Web applications are evolving
rapidly. They have turned from simple static pages to complicated applications that can be

accessed over the internet. Developing a product line for web-based systems helps in
sharing the common infrastructure between many of its services. Koriandol is a product
line architecture used to design, implement and maintain families of applications as
presented in [10]. It is used for developing product line for web-based systems. Figure 5
shows, the organizational representation of a web-based system by Koriandol. It also
contains a variability management mechanism to dynamically bind variation points to the
fitting variant in addition to the ability to manage the variability during run-time.
2.5.3. Adaptive Systems
Adaptation systems are the systems that adjust their properties and resources according to
the user needs and resource constraints at runtime. The approach presented in [74] uses
the SPL techniques in order to build adaptive systems. Adaptive systems are built as
“component oriented system families with variability modeled explicitly as part of the
family architecture” [74]. The approach includes five steps in order to develop adaptive
systems:
1. Identify fixed and varying user needs and resource constraints: by providing a
UML profile to model the requirements. During this phase, variability is
handled and presented in the models by the use of built-in variability
techniques.
2. Design the architecture: the architecture is modeled using aspect-oriented
methods.
3. Design and implement the components identified by the architecture design and
derive runtime plan objects: prototype tools are implemented in order to
generate plan objects that will be carried out by the system in case of change in
the resources or the requirements at runtime.
4. Design property predictors for the components and composition: predict the
Quality of Service (QoS) for different variants using property predictors. They
are defined during the design phase to be used at runtime in order to choose the
best fit variants according to the state of the environment.

5. Design the utility function: it calculates the gain that the different users will get
according to their preferences. These preferences appear as weights and are
used in the adaptation process.
2.5.4. Pervasive systems
An approach for the design of pervasive SPLs based on Model Driven Development
(MDD) and variability modeling principles is proposed in [14]. The proposed SPL is to
build dynamically-adaptive pervasive systems. Figure 6 shows the proposed SPL for
pervasive systems following the same methodology as the MDD approach. It uses
variability modeling from the SPL at runtime. It utilizes the variability modeling and the
available resources to get the most efficient reconfiguration of the software system to match
the users‟ goals.
Figure 6: SPL for pervasive systems following the MDD Approach [14]
The work presents the possible scenarios in a pervasive systems environment. The software
should be able to adapt itself with the available resources without the contribution of the
users. The possibilities are:
1. A resource becomes unavailable.
2. A new resource becomes available.

3. A new goal is requested from the user.
4. A goal is discarded from the user.
Moreover, it suggests a methodology for automatic reconfiguration:
1. Identify the knowledge reuse: By identifying the knowledge that will be used to
dynamically reconfigure the system. The knowledge comes from The Scope,
Commonality and Variability analysis (SCV) that is made for SPLs to capture such
analysis knowledge to be used in the dynamic configuration. This step is carried out
by the use of PervML, FAMA feature model and Realization model.
2. Extend the SPL: By the use of the previous information, it will be transferred to the SPL
product.
3. Introduce the autonomic reconfigurator component: By applying the autonomic
behavior of the system architecture which is done through dynamic bindings.
Another methodological approach for building pervasive systems based on software
factories and model driven architecture is suggested in [45]. Software factories focus on
developing reusable assets while MDA focuses on high abstraction models to capture the
system, and automatic code generation.
The proposed methodology follows the same way of development that MDA uses. The
work suggests the following techniques for developing pervasive systems:
1. Platform Independent Models (PIMs): for capturing the pervasive system requirements.
The proposed language is PervML.
2. Platform Specific Models (PSMs): these models should have direct representations of
the constructs of the technology they model. The proposed PSM is the OSGi (Open
Service Gateway Initiative) which is a framework initially created for hosting software
for residential gateways. It is a middleware platform that is used to bridge the different
components and hardware entities.
3. PIM to PSM transformation: transforming the PIM to PSM to be able to get them in an
executable form for the specified domains i.e. platform dependant.

4. PSM to source code transformation: generating the source code from the PSM by
applying templates to the elements of the models to generate the code.
The architecture of the framework for pervasive system development as provided by the
approach is:
1. User interface layer: It contains two components. The main user interface which is in
charge of the access to the system services, and individual service interface which is
responsible for the interaction of every particular service in the system.
2. Logical layer: It is classified into two groups.
a. Services for supporting the functionality specified in PervML model: They are
java classes that are registered as OSGi services.
b. Services for the management of the system execution: It contains all the
auxiliary functionalities that are needed to check trigger conditions, provide
web services and ensure overall constraint satisfaction.
3. Communication layer: It is responsible for the management of the pervasive system
with the physical or logical environment. It contains drivers which represent devices
or external software systems.
Figure 7 represents the architecture of the framework.

Figure 7: Global architecture for pervasive system framework [45]
There are software engineering approaches with SPLs presented in the next section.
2.6. Software Engineering Approaches used with SPLs
There are many approaches that appeared in software engineering such as aspect-oriented
programming (AOP), feature-oriented programming, model-driven development, Feature
Oriented Model Driven Development and Component-based Architecture. All such newly
introduced approaches solve some of the limitations in the commonly used approach of object
oriented development [6]. They were proposed to be used with SPL such as in [6], [32], [52],
and [97].
2.6.1. Aspect-Oriented Programming
AOP is a programming paradigm that was proposed for improving the separation of
concerns in software. Separation of concerns means cutting down the program or the
system that needs to be developed into distinct parts or areas of functionality. AOP is built
on modularity which is proposed in procedural and object oriented programming. Some
concerns are called crosscutting concerns as they "cut across" multiple abstractions in a
program [96]. It is similar to what OOP does for object encapsulation and inheritance.

AOP solves the problem of the scattered or tangled code which is hard to understand or
maintain. This is partially useful when one concern is spread over a number of modules
with either different classes or methods. When there is an attempt to modify, it will require
modifying all the affected modules.
2.6.2. Feature Oriented Programming
Feature Oriented Programming (FOP) is a paradigm for building software product lines
where programs are produced by composing features. The development of FOP is based
on feature models.
2.6.2.1. Feature Models
A feature model is a hierarchy of features with variability [52]. It is a domain modeling
technique which is widely used in SPLE. It has the capability of modeling the common
and variable product requirements inside a SPL as well as the product configurations
and derivations. The hierarchical way of representation is used for organizing the large
number of features into multiple levels of increasing details.
Features are used to describe the high level components of the system and its
variabilities between the products. A Feature model represents the common and
variable features of concept instances and the dependencies between the variable
features. It consists of feature diagrams and dependency rules. The feature diagram is
a set of nodes and a set of directed edges [84] that form a tree. There are two types of
features: mandatory features and optional ones. The mandatory feature should exist in
the description of a concept instance if and only if its parent is included. The optional
feature may be included in the description of the concept instance if the parent is
included. If not, the optional one cannot be included. Feature modeling helps in
avoiding the redundancy of features, i.e. removing the features that are included and
never used. It also makes sure not to miss the relevant features and variation points that
are not included in the reusable software. Moreover, it helps in having an abstract,
concise and explicit representation of the variability that exists in the software.
Feature dependencies are either static or dynamic as proposed in Bragança and
Machado‟s approach [7]. The static dependencies reflect the hierarchical feature

relations and static constraints among features in the same level. The former are
decomposition and generalization which are used for capturing the parent-child
features dependencies. Static constraints could be either required or excluded [97].
Dynamic dependencies are either Serial, collateral, synergetic, state change, behave
change, date change or code change [97]. Serial is for features that should be active one
after the other while collateral is for the ones that should be active at the same time.
Synergetic is used for describing the features (two or more) that should be synchronized
during their active period. A change relationship is described as one feature causes
change in another. Change is divided into state change which is used when a feature
causes change in the state of another during the active time. Behave change describes
if the change is in the behavior of one feature by another. A data change relationship
captures the change in data used within a feature by another one. Code change
dependency is for representing if one feature caused change in the code of another
feature‟s code.
The following method is proposed to solve the problems with the analysis of the
dependencies between features in a SPL [76]. The methodology is divided into six
separate steps that are applied sequentially (S1 - S6).
S1: Artifact consolidation: A list of product feature specifications should be
available for the product line. High level features are divided into sub-features.
During this decomposition, dependencies between features appear. A feature
dependency model is used to capture such dependencies and features. S2: Feature
dependency analysis: This activity is done by tracing the features dependencies in
the feature dependency model. If a found feature is not listed in the product feature
specifications, it is recorded. At the end of that process, there should be a list of all
excess features that need to be added to the product line. S3: Feature dependency
restructuring: Excess features could be the result of i) misunderstanding in the
dependency and the decomposition structure in the product specifications or ii) that
feature decomposition was done in a wrong way that caused unnecessary
dependencies. The former is solved by adding excess features to the product feature
specification. The latter is solved by restructuring the decomposition and
dependencies.

S4: Artifact consolidation: A realization dependency model is used to map features
A functional dependency is used to describe the dependencies among features. The
<<Functionality>> stereotype is used to describe the relationship between
architecturally realized components for the features that are in different
architectural elements. The <<Implementation>> stereotype is used to mark the
dependencies between the components that may require services from others to
implement their responsibilities. The component dependency model is formed by
the use of the functional and implementation dependencies at the components level.
S5: Component dependency analysis: Tracing the realization and implementation
dependencies forward for each product feature specification to derive the
corresponding component configuration. Then, listing the features for each
realized component configuration by tracing realization dependencies backwards.
The features and components that are not found in the product feature specification
are listed.
S6: Component dependency restructuring: Correcting dependency violation can be
carried out either by changing the realization mapping from features to components.
The same dependent features are realized by the same architectural elements or by
separating needed parts into their own components. Either ways can be used, but
the one that best fits is the one with the least components in the products.
2.6.3. Model Driven Architecture
Model Driven Development (MDD) is a rising paradigm used for software construction. It
is based on using models to specify programs, and modeling transformations to create
executables [32]. Moreover, it is used to reuse specific patterns of software development.
Therefore, model-driven removes the repetition that could happen in the implementation
activities. Model Driven Architecture (MDA) is a framework for software development
that was proposed by the Object Management Group (OMG) in 2001. MDA suggests a
way to achieve the understanding, design, implementation, deployment, maintenance and
modification of software [32]. MDA is applied by first capturing the business concerns of
the system in a model called Platform Independent Model (PIM) thus abstracting away any
technical details. Secondly, by introducing to the PIM the technical side of the intended

platform, it is transformed into a Platform Specific Model (PSM). Finally, the PSM is used
in generating the code.
Four Step Rule Set (4SRS): It is a model-driven method developed at Minho University that
is used as a framework to map UML use case models into UML object diagrams for single
system development [57]. It is divided into four steps in order to change the use cases into
objects.
Step 1 – Object Creation: at this stage, for each use case three objects are created (interface,
data and control). The suffix (i, d, c) is used for referencing each object to its use case and
'O' for referencing an object.
Step 2 – Object Elimination: the decision on which of the three objects generated from the
first step will be added in the object model takes place at this step. The choice is made
based on entirely representing the use case in computational terms. This step is also
important because it removes the redundancy in the user requirements and points out the
missing ones. This step is divided into internal steps: use case classification, local
elimination, object naming, object description, object representation, global elimination
and object renaming [57].
Step 3 – Object Packing and Aggregation: this step takes the remaining objects after the
previous step in order to construct a coherent object model. However packaging is an
immature technique because it introduces a very light semantic unity between the objects,
it helps in easily reversing the objects within the design phase. In other words, packaging
is flexible in allowing the temporary acquisition of complete and clear object models. On
the other hand, aggregation requires a strong semantic cohesion between the objects and
that makes the reverse a difficult process. Therefore, it could be used only under a
conscious design decision. For example, it can be used when working on a part of the
system that needs the creation of a legacy sub-system or with a pre-defined reference
architecture that limits the object model.
Step 4 – Object Association: this is the final step where the object model is created and the
associations in it are introduced.

An approach described in [11] uses the model driven method 4SRS to obtain the architectural
functional requirements of a product line from its requirements. Moreover, it describes rules
that can be used to transform the requirements model into architectural models while
preserving variability and without extensive information about the domain.
2.6.4. Feature Oriented Model Driven Development
Feature Oriented Model Driven Development (FOMDD) merges the two previously
discussed approaches, Feature Oriented Programming (FOP) and Model Driven
Development (MDD). FOMDD utilizes FOP by producing models from features. Then,
by using MDD, it transforms these models into executables [32].
2.6.5. Component-based Architecture
Component-based software engineering (CBSE) is a branch in software engineering. A
software component is "a software element that conforms to a component model and can
be independently deployed and composed without modification according to a composition
standard" [30]. A component model defines well-defined standards and interactions. It is
obsessed with specifying "standards for naming, meta data, component behavior
specification, component implementation, interoperability, customization, composition and
deployment". However, a software component infrastructure is composed of software
components and their interactions and dependencies. "Building systems from components
is a natural evolution from existing methods and can always be related to other industries"
[30].
A systematic approach is presented in [30] for developing a feature-driven and component-
based product line:
1. Develop a feature model from feature-driven analysis and design methods while
identifying the variabilies and commonalities.
2. Choose one of the aspect-oriented implementation techniques according to the features,
their variabilities and the pattern of the combination required among them.

3. Convert the generated aspects into code snippets, using a chosen mechanism such as C++
templates, parameters or frames, that will be associated together forming complete
components.
4. Select and devise the features then, map them to the matching aspects to deliver the final
components and the whole application out of code snippets and aspects.
2.7. Reference Architecture Evaluation
In this section we will be discussing the different evaluation methodologies that we came
across. There are numerous evaluation criteria and frameworks for valuing object-oriented
methodology.
2.7.1. Architecture Evaluation and Metrics
We now present the evaluation metrics that we came across for evaluating componentbased
architectures which are coupling, cohesion, complexity, size, reusability and adaptability
2.7.1.1. Coupling
Coupling measures the relationship of dependency between two interacting modules. As
quoted in [53], Fenton calculated coupling by the relationships between the elements
belonging to different modules of a system. The equation used is:
Where i is the number corresponding to the worst coupling type, and n the number of interconnections
between S and S', global variables and formal parameters, respectively.
2.7.1.2. Cohesion
Cohesion evaluates the tightness between the linked features composing a system or
module. Interconnected relations are considered cohesive. The following equations are
presented in [53] for calculating cohesion.

Where #MaxInteractions(sp) is the maximum number of possible intra-module interactions between the
features exported by each module of the software part sp
Lack of Cohesion in Methods (LCOM4) [55] measures the number of "connected
components" or number of connected methods in a class. LCOM4 is calculated by
determining the related methods, and then a graph linking the related methods to each other
is drawn. Methods a and b should have the following properties in order to be related:
1. They both access the same class-level variable, or
2. a calls b, or b calls a.
The resulting value is evaluated as follows:
LCOM4=1 means a cohesive class, which is the "good" class.
LCOM4>=2 means there is a problem. The class should be split into smaller
classes.
LCOM4=0 happens when there are no methods in a class. This is also a "bad" class.
2.7.1.3. Complexity
It is used as a metric to evaluate how the system or module is complex. Research is done
to detect the factors that contribute to the complexity. In [53], system complexity is defined
by the dependency in the relationships between the elements. It is measured by converting
the components and their elements into graph.

Where G represents the graph, E is the number of edges, R is the binary relation between
two elements (E x E) and p is the number of connected components of G.
According to [71], complexity is broken down to measure different aspects which are
structural complexity, data complexity and system complexity. Structural complexity of a
module i, S (i), is calculated as follows:
Where fout (i) is the number of modules that module ‘i’ invokes directly.
Data complexity for a module i, D(i), is for measuring complexity in the internal interface
for module i. The equation is:
Where v (i) is defined by the count of input and output variables that are passed to and from
module i
System complexity is calculated as the sum of both structural and data complexities. The
formula is:
In [2], another kind of complexity is presented which is configuration complexity.
Configuration complexity can be applied to any component dependency diagram,
entityrelationship model, box-line diagram, or node-arc structure. It can be defined by the
following forumula:
Where R is the number of relationships and C is the number of components.
Example: For 50 components and 50 dependencies, the complexity measure is 1.

2.7.1.4. Size
Component size for a system is the sum for all the sizes of all the disjoint components or
nodes in a system as mentioned in [53], [23] and [2].
The equation for calculating size as presented in [53] is:
Where n is the number of elements, e is the element that belongs to the component E, and
m is the module inside the component
2.7.1.5. Reusability
Reusability is an important aspect for evaluating object oriented architectures. In [48], a
metric for classes‟ reusability is calculated by the following equation:

2.7.1.6. Adaptability
Adaptability means that the system is flexible enough to be able to change its behavior
according to the changes in the environment. In [94], two metrics were suggested which
are: Impact on Software Architecture (IOSA) and Adaptability Degree of Software
Architecture (ADSA). They are calculated from the adaptability scenarios, which are
scenarios that are generated from the change in system behavior propagated by the system
usage or requirements change. Calculating IOSA is carried out by adding each adaptability
scenario‟s impact analysis.

Where, C is the set of components and T is the set of connectors. |CR| is the change
requirements’ number. |S| is the adaptability scenario number. |PCRk| and |PSk| are the
probability of change requirement CRk and adaptability scenario Sk, respectively. IA is the
impact analysis result of the whole architecture or architecture elements under change
requirement or adaptability scenario. Csk and Tsk are the set of impacted components and
connectors Sk, respectively.
ADSA is calculated by the following equation:
If the ADSA = 1 this means that the architecture is totally adaptable in all dimensions,
while if the result is 0 this means that architecture cannot adaptable to any change
requirement.
2.7.2. Evaluation Frameworks and Metric Suites
For evaluating component-based architectures, there were proposed evaluation suites and
frameworks. This section will summarize the related work we came across.
2.7.2.1. Narasimhan and Hendradjaya’s Evaluation Suite
They presented a suite for measuring the integration of the software components [89]. The metrics
are complexity, criticality, triangular and dynamic metrics. We will not go through dynamic
metrics because they are designed to test applications during runtime.
Complexity Metrics
They are divided into two categories: one for the packing density of integrated components, and
the other for the interaction density between the components
1. Component packing density (CPD)
Density is directly proportional with complexity, i.e. the higher the density, the more complex the
system is. The following formula is used to calculate the CPD:

Where could be: LOC, object/classes, operations, classes and/or modules in the
related components, and is the number of the components
2. Component interaction density (CID)
It is the ratio between the actual numbers of interactions to the available number of interactions in
a component. The higher the density, the more complex the components are.
Where is the number of actual interactions and is the number of maximum
available interactions
3. Component incoming interaction density (CIID)
Where is the number of the used incoming interactions and is the number of
available incoming interactions
The higher density of CIID, the more examination for the component is needed to check all the
received interfaces or events.
4. Component outgoing interaction density (COID)
Where is the number of outgoing interactions used and is the number of
outgoing interactions available.
5. Component average interaction density
It is used for evaluating the entire components‟ assembly complexity. The lower the value of
CAID means lower both interactions and complexity.
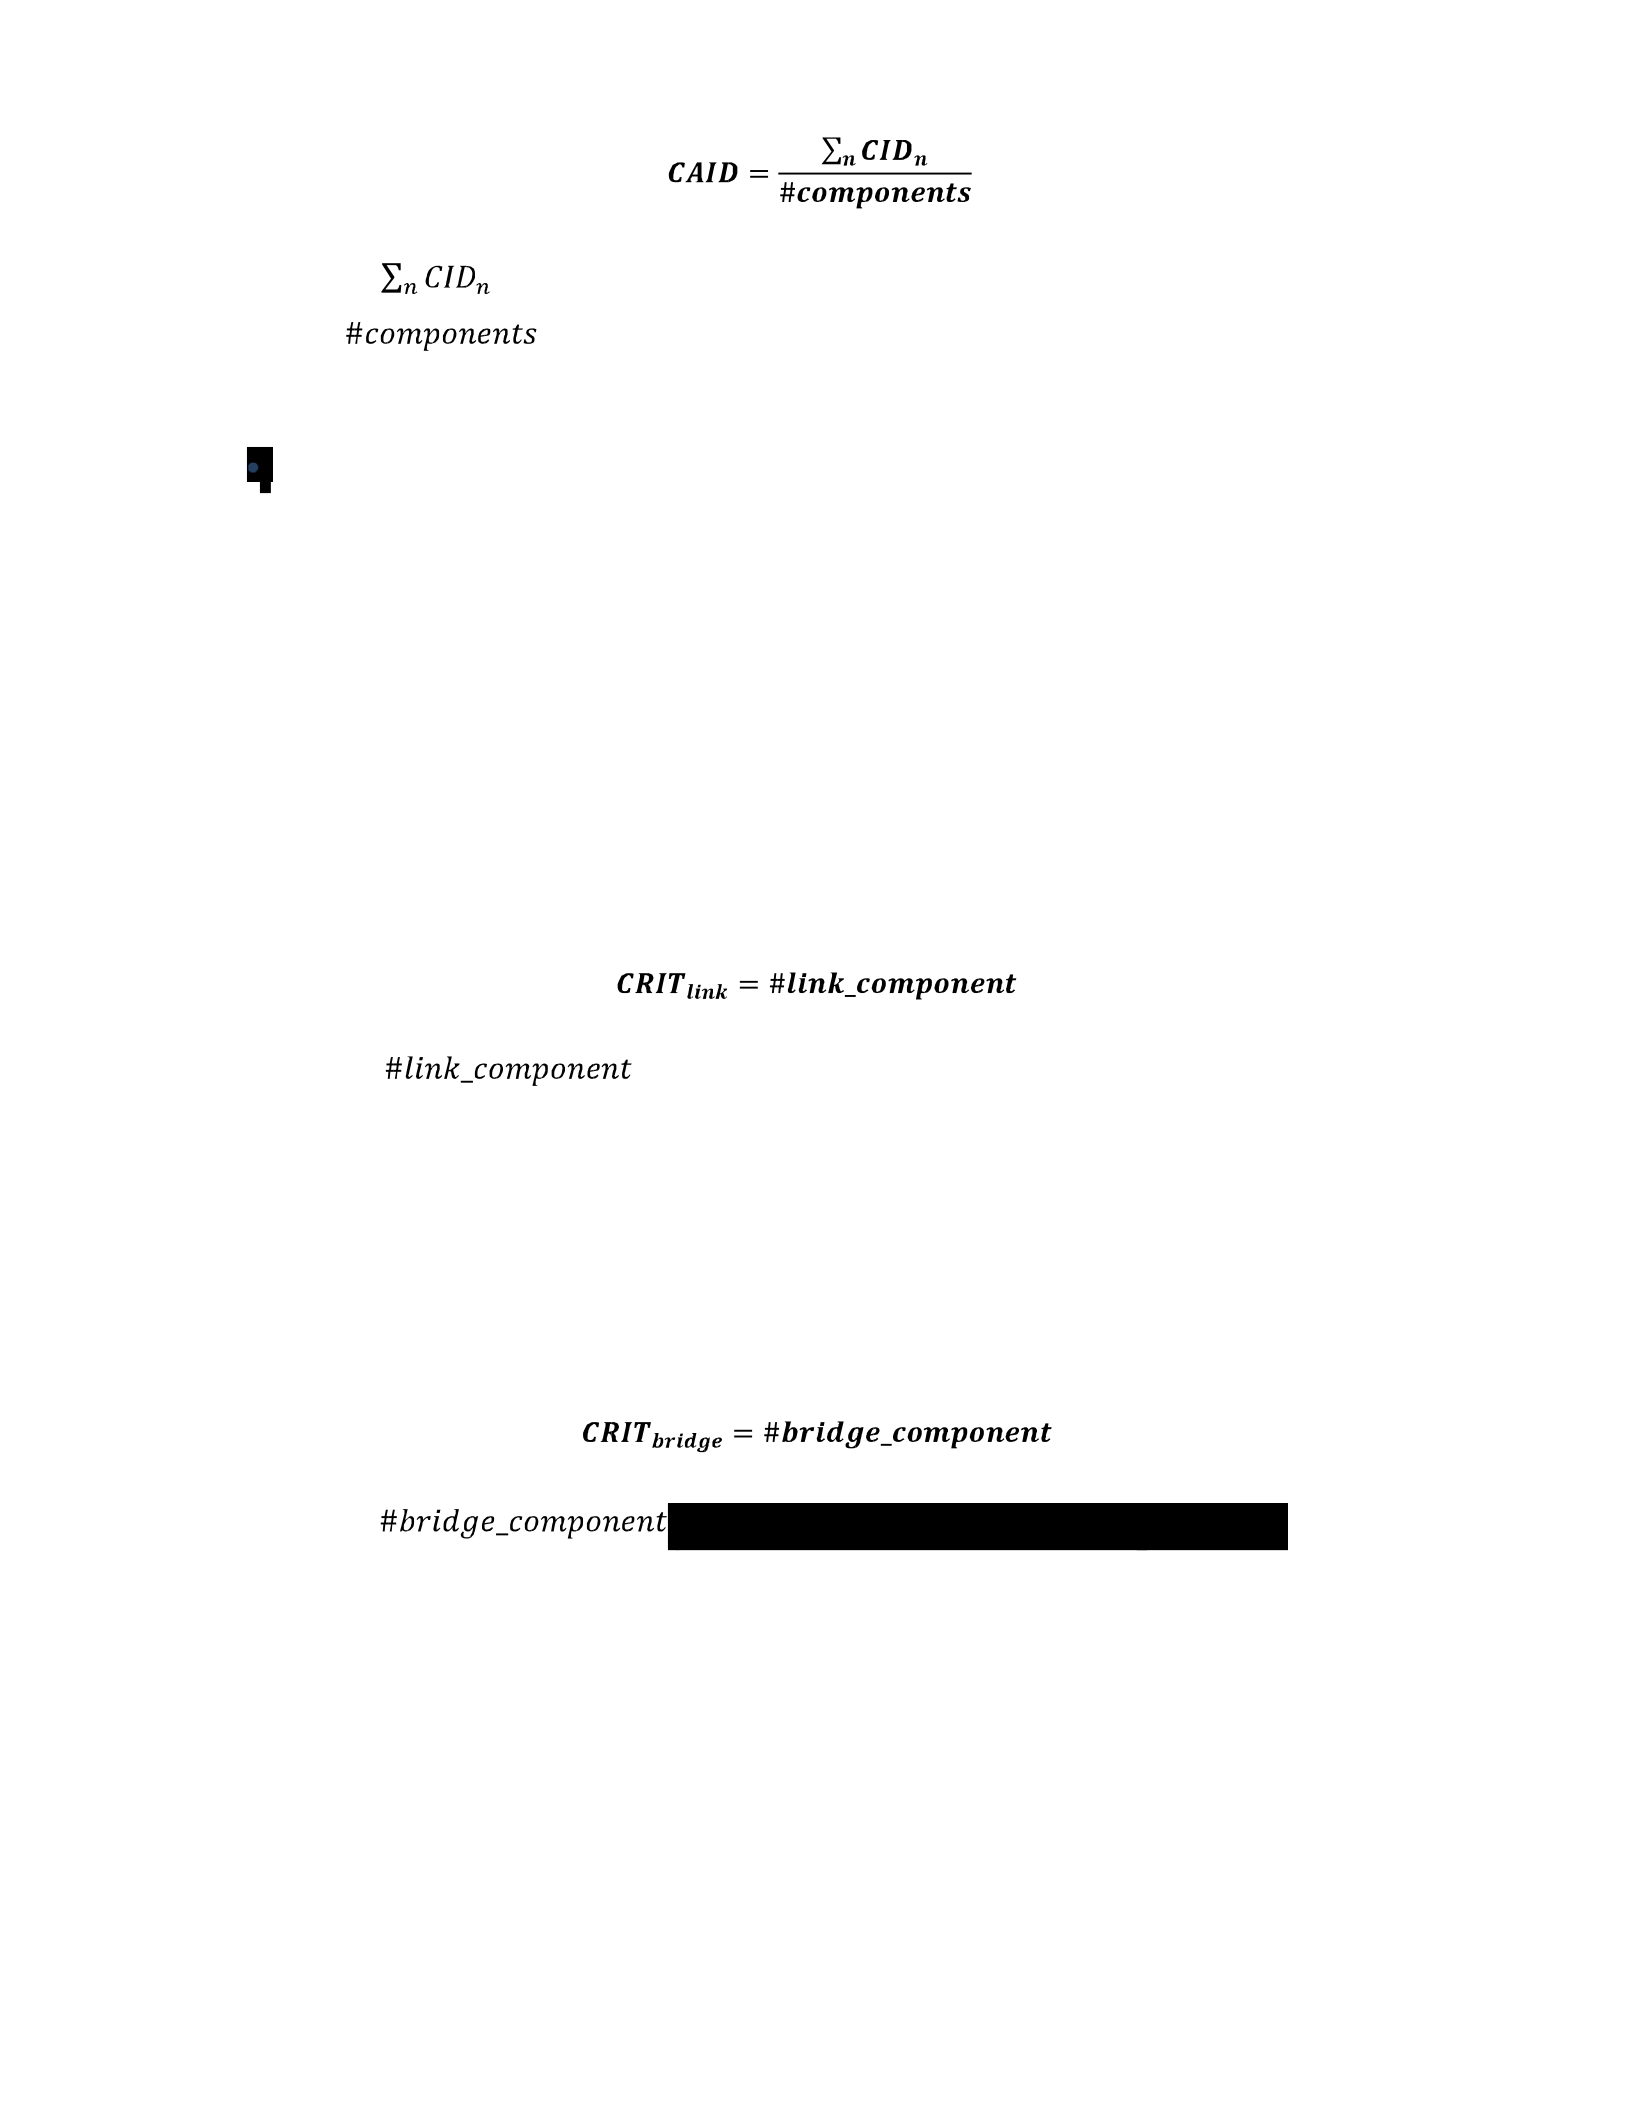
Where is the summation for all the interaction densities for
components 1 to n and is the number of the existing component in the
real system
Criticality Metrics
Critical component is a component that binds a system. Without the existence of it, the system
will not be able to interact with each other. The metrics for criticality are: Link Criticality, Bridge
Criticality, Inheritance Criticality and Size Criticality metrics.
6. Link criticality metrics
For a component to be called critical one, it needs its links to exceed a certain threshold value. The
initial indicator presented in this research is 8 links as a threshold value
Where is the number components with links that are more than a critical value
7. Bridge criticality metrics
Bridge component links are used to connect two or more components or applications. Importance
weight should be added to each bridge link by the developer. This weight should reflect the
probability for failure.
Where
8. Inheritance criticality metrics
It counts the number of base components or elements where others inherit from. The more the
count is, the more possibility for risks to rise.
is the number of bridge components

Where is the number of root components which has inheritance
9. Size criticality metrics
It measures the size for a component. In order to specify the threshold, you choose the
maximum size of a component in the system.
Where is the number of components with exceeding an agreed critical value
10. #Criticality metrics
Criticality metrics is a summation for all the previous matrices. The is used to
identify the crucially level of the components‟ associations.
11. Triangular metrics
It is calculated through CPD, CAID and CRITall. The three metrics have different
prospective to measure. This metric is used to classify and identify software systems‟
types. However, this metric is not fully mature and still under development.
2.7.2.2. Zayaraz and Thambidurai’s Measurement Techniques
Zayaraz and Thambidurai presented a technique for quantifying and measuring software
quality [28]. The technique is built on top of COSMIC Full Function Points (CFFP) and
ISO 9126 quality standards. They have incorporated both CFFP and ISO 9126 quality
standards to be applied at the architectural level. The notation they used is presented in
Table 1. The steps required for measuring the architecture are:
1. Detect the software layers in architecture.
2. Detect the functional processes in every layer.

3. Detect the data flow, i.e. Read, Write, Entry and Exit
4. Applying the rules and principles of COSMIC FFP methodology.
5. Convert the architecture into an architectural COSMIC FFP graph and specifying
the components and connectors.
6. Calculate the architectural complexity measures - System coupling, System
cohesion and System complexity using the following metrics.
Table 1: Zayaraz and Thambidurai’s Notation
Parameter
Notation
Entry
E
Exit
X
Read
R
Write
W
Number of components
N
Layer
L
The following shows the difference between Entry, Exit, Read and Write according to [20]:
- Entry: it is the movement of data from a user into the functional process that requires it.
- Exit: it is the movement of data from a functional process to the user that requires it.
- Read: it is the movement of data from persistent storage to the functional process that requires
it. The storage must be internal to the system unit to be treated as read.

- Write: it is the movement of data from a functional process to persistent storage. The storage
must be internal to the system unit to be treated as write.
For system coupling, the following equation is used:
output range is between 0 and 1.
For system cohesion, the following equation is used:
Where is the degree of connectivity in a layer and represents the
maximum potential intra-connectivity for every layer; the value for is between 0 and 1.
For system complexity, the following equations are used for measuring both Intra-layer and Inter-
layer complexity:
Where
represents the current connectivity, while
represents the maximum potential interconnections between layers. The
Total System complexity
is
:

Maintainability is computed by adding modifiability, extensibility and reusability as shown in
Figure 8.
Figure 8: Dependency tree for Maintinability
The following are the equations for calculating modifiability, reusability, extensibility and
maintainability:
2.7.3. Evaluation Tool (SDMetrics)
According to [80], SDMetrics tool was developed in order to analyze architectures. It takes XML
Metadata Interchange (XMI) file as input and extracts the following categories:

Size
NumOps: Number of operations of the component
NumComp: Number of sub-components of a component
NumPack: Number of packages of the component
NumCls: Number of classes of the component
NumInterf: Number of interfaces of the component
Inheritance
ProvidedIF: Number of interfaces the component provide
Diagram
Diags: Number of times the component appears in a diagram
Coupling
Dep_Out: Number of outgoing UML dependencies (component is the client)
Assoc_Out: Number of associated elements via outgoing associations
Assoc_In: Number of associated elements via incoming associations
Dep_In: Number of incoming UML dependencies (component is the supplier)
Complexity
Connectors: Number of connectors owned by the component
General
NumManifest: Number of artifacts of which this component is a manifestation
RequiredIF: Number of interfaces the component requires
2.8. SPL Evaluation
As an evaluation framework for SPL, an analysis tool is suggested by Mari in [59]. The evaluation
is based on three sources. The three sources are: Normative Information Model-based Systems
Analysis and Design (NIMSAD) evaluation framework, definition of the method and its
ingredients, and finally the component-based software development methodologies. The
evaluation framework is for finding out if the elements defined in the framework are considered

by the method not rating them. In other words, the task of the evaluation framework is to
investigate how the elements were done.
Table 2: The elements of the framework and the questions used in the analysis [59]
The results of the evaluation are divided into four elements: context, user, contents and
validation. Method context is for defining the atmosphere the method will be used in. The
method user is for defining the software architects and their skills. The contents method is for
defining the interface between the requirements and the architecture design. The last method
is validation, which is used for validating the method and making sure that it is mature enough
to be used.
The Family Evaluation Framework (FEF) is proposed to evaluate the performance of SPLs
inside organizations. Its emphasis is on the main phases in SPLs which are the domain and
application engineering as well as the variability management [27]. The structure of FEF is
based on the BAPO model (Business, Architecture, Process and Organization). The BAPO
model covers the software engineering concerns in producing a product. Each dimension is
divided into five levels and three to four evaluation aspects.

Figure 9: The Family Evaluation Framework (FEF) [27]
Each level shows the organizational way of dealing with SPL. In order to go to a higher level,
the previous ones should be satisfied. Business is for measuring the business involvement in
the SPL. Architecture is responsible for the application engineering, domain engineering and
variability management. Process is for measuring the product line processes to be used and
their maturity. Organisation is for assessing the domain and application engineering over the
organization. The result from this assessment is an evaluation profile covering all the aspects
in the framework [27].
In this chapter, we discussed the related work by showing the pervasive system‟s features that we
found in the literature review. Then, we highlighted on the definition of the SPL, the SPL lifecycle,
the different applications for it in different domains and the different software engineering

2
approaches that can be integrated with SPLs. Finally, we explained the different evaluation
methods we found to evaluate both the architectures and the SPL.

Chapter 3 A Study and Categorization of Pervasive Systems Architectures
In this chapter we present the conducted survey we did to extract the architectures from the
pervasive systems. Moreover, we discuss the related pervasive architectures as we researched
them, and their key features and components. The architectures collected in our survey will
help in establishing a well-structured categorization reference for building pervasive systems.
Throughout the section, we will be dividing the pervasive systems according to their usage and
operating environment. This will help in extracting the main features from the architectures
and grouping them according to the categorization criteria. By selecting these features we will
be able to generate architectures that could eventually facilitate the process of building a
Software Product Line for pervasive systems.
3.1. General Pervasive Systems (Non-environment Specific)
An architecture is presented in [93] for pervasive systems. The proposed architecture is
founded on middleware technologies and a variety of services. It is composed of core
services as shown in Figure 10. The Application Objects which reside on the different
devices communicate with the Service Manager. The Service Manager is responsible for
supplying object invocation interfaces of various service components to the application.
The Core Components encapsulate different services such as Service Discovery, Context
Service and Other Services. The Network Infrastructure/protocols interact with the Core
Components through the Communication Management Agent

Figure 10: Architecture for pervasive systems [93]
3.2. Privacy and Security
The focus of the research in [56] is to offer secure services through context-aware
computing environments that can adapt to the changing conditions when requests are
issued. It presents a middleware for securing context-aware applications for smart homes
using authentication and authorization techniques. The Context-Aware Security
Architecture (CASA) supplies the security infrastructure for context-aware applications to
be assembled. The security Management Service (SMS), as shown in Figure 11, is used
for handling the organization of the system policies and role relationships. The
Authorization Service is introduced within the architecture to control the access to the
system according to the policies stored in the SMS. The Environment Role Activation
Service (ERAS) keeps the system‟s condition information and handles enabling and

disabling roles according to the environment variables. The Authentication Service is in
charge of confirming and reclaiming identifications from the environment. Handling the
sensors, network protocols and environmental conditions is achieved by the Context
Management Service (CMS).
Figure 11: CASA high level architecture [56]
An architecture for adapting pervasive environments for several users while at the same
time ensuring their privacy is presented in [86]. Different users with different privacy
adjustable levels can be served according to their preferences. The contradiction in the
users‟ needs is satisfied by clustering the real sensors so that they can be activated in a
location for a user and deactivated in another one. The privacy management architecture,
shown in Figure 12, is composed of a real sensor network, a virtual sensor layer and a
management layer. The role of the virtual sensor layer is to provide a reduced number of
sensor devices to be configured. The management layer is responsible for the
communication between the mobile device and the services as well as distributing data and
configuration requests. The virtual sensor layer is responsible for calculating and enforcing
the current configuration of the environment. The bottom layer represents the real sensor
network which is configured through the virtual sensor network. Users are served

according to the state of each sensor type. By “XOR-ing” the user‟s requirements with the
nearby current area, he/she will be clearly accepted, conditionally accepted, or rejected.
The user is accepted if the user‟s requirements match the sensor‟s state. Conditionally
accepted if the user moves to a different location but the previous location was a clear
accept, then the system will trigger if he/she accepts the new configuration or not. If a
newly appeared user demands to change the current configuration, a clear reject for this
user will be issued as it conflicts with the previously registered users.
Figure 12: Privacy management platform architecture [86]
The research in [40] presented Context Fabric (Confab), an infrastructure for building
privacy-sensitive ubiquitous computing applications according to the privacy requirements
and the trust level. It is based on three interaction mechanisms for privacysensitive
“XOR
-
ing” the user’s
requirements with the
current setting of each
It publishes allowed
data to all known
subscribers
w
hen
the
triggered
by
platform or by a timer
Receives
incoming
subscription requests to
the sensor readings and
about
their
decides
Responsible for triggering re
-
calculations
of
the
current
setting if one of the user moves
Gets
access
to
all
essential information, all
registered users and the
scopes this virtual sensor

applications: optimistic, pessimistic and mixed-initiative. Optimistic applications allow
users to share personal information and identify abuses. The pessimistic applications‟ main
goal is to prevent abuses. The mixed-initiative permits users to choose between sharing
information or not. The data model for Confab holds the data about one‟s location or
activity. People, places, things and services are sent to infospaces. Infospaces are network-
addressable logical storage units that store the context data about those entities which are
managed by infospaces servers. As shown in Figure 13, infospaces (the clouds in the
figure), contain contextual data about a person, place or thing. Every infospace contains
tuples (squares in the figure) that hold data about individual pieces of contextual data. The
infospaces servers are the container for the infospaces (represented in rounded rectangles).
Figure 13: Confab infospaces [40]
The research presented in [16], proposes an architecture for building trust in pervasive
applications. It suggests distributing trusted computing to the terminals rather than
centralizing trust. As shown in Figure 14, each trusted terminal is called a trusted point.
Therefore, there is a need to establish the trust with the terminals in order to gain access.
The Trusted Platform Module (TPM) is embedded into the terminal which is the root of
trust. It connects to ICH through the LPC Bus. The measured VMM (Virtual Machine
Monitor) includes a trusted driver and reference monitor to control the application
programs.

Figure 14: A trusted Architecture [16]
Another research which discusses the challenges that models, protocols and architectures
face in securing pervasive systems is in [72]. Their challenges are categorized as follows:
The need to integrate the socio-technical perspective
Breakdown of classical perimeter security and the need to support dynamic trust
relationships
Balancing non-intrusiveness and security strength
Context awareness
Mobility, dynamism, and adaptability
Resource constrained operations
Balancing security and other service tradeoffs
Another research defines the challenges for pervasive systems as discussed in [69]:
Unobtrusiveness
Location Dependency
Context Dependency
Amount of Data Collection

Role of Service Provider Lack of ownership
There are also suggested models for security in pervasive systems [72], which are:
Models for authentication
Models for access and usage control
Models for privacy
Models for dissemination control
Figure 15 shows the different perspectives for the socio-technical view and the computing-
system view for pervasive systems.
Figure 15: Domain extension for modeling access control in pervasive computing [72]
The Privacy Preferences Project (P3P) is an attempt for securing web applications that were
found useful for pervasive systems [12]. It is for creating a privacy standard for the web.
As shown in Figure 16, the P3P architecture consists of a two-way relationship between a
web-based service, which represents a service that is required to be accessed, and a user
agent, which represents a user requiring a service. The user agent contains an embedded

trust engine for privacy control. It is also responsible for sending the data from the
repository according to the users‟ preferences.
Figure 16: P3P Architecture [12]
The Secure Persona Exchange (SPE) framework is based on P3P with an underlying notice-
choice privacy model [12], [60]. The securities requirements addressed in the framework
as presented in the research are:
Confidentiality: the personal content is required to be secured from other
entities not members of the system. This could be achieved by the use of SSL.
Integrity: personal data needs to be protected against tampering during
communication. Achieving this could be done through securing the message
digests and communicating over SSL.
Authentication: the participants in the system should be authenticated to
guarantee their identity. There are two ways for authentication: entity
authentication and data authentication. The former is for authenticating the
participant in the exchange and the latter is for authenticating the personas and
templates exchanged.
Non-repudiation: it is not a core security requirement of the system but it
prevents an entity from denying previous commitments or actions. It is achieved
by preventing a service provider from denying data collection.
Another research shows two techniques for preventing data misuse and privacy protection
[37]. The first technique is the Privacy Sensitive Information diluting Mechanism

(PSIUM). It stops the misuse of data by a service provider by using a mixture of true and
false sensor data. PSIUM solves the security flaw in P3P where P3P cannot guarantee that
the service provider will not follow the rules. PSIUM, Figure 17, works by sending true
and false data about the location of the user. The service provider will process the data and
send them to all the locations specified. The destination, which is the client‟s device, will
process the data with the true location and discard the rest. The second technique protects
privacy sensitive information by the combination of frequently changing pseudonyms and
dummy traffic as shown in Figure 18. This helps in hiding the identity of the users so that
the trackers will not be able to trace any of the users.
Figure 17: A pervasive service protected by PSIUM [37]

Figure 18: Location-aware system architecture with anonymity enhancer [37]
Another techniques used for privacy-enhancement in pervasive systems is mix zones
described in [5] and [4]. The mix zone model works by assuming the existence of a trusted
middleware system and un-trusted applications. An “application zone” is a geographic
space in which an application registers the user interests such as a supermarket, hospital
grounds or university buildings. The role of the trusted middleware is to limit the
information sent to the applications concerning the location of the users registered in the
application spaces. This region is called mix zone. Mix zones are the areas in which the
users' identity is mixed with other users. Applications do not get traceable user identity,
however they receive a pseudonym. The pseudonym changes once a user enters a mix
zone.
Finally, system architecture, proposed in [64], for preserving users‟ privacy with location-
based applications is shown in Figure 19. The location server abstracts away any
positioning system used to retrieve location. Users register to the location servers to
register their privacy preferences which are saved in the validators. This is achieved when
applications query the location server. According to the validators, users‟ locations are
either hidden or released to the applications.

Figure 19: Privacy system architecture as presented in [64]
3.3. Domain-specific Architectures
Domain-specific pervasive systems, according to our classification, are the pervasive
systems that are developed to act in particular domains. We now describe in details such
systems.
3.3.1. Learning systems
Thomas [88] attempted to theorize the pervasive learning space in a practical and useful
way. A presented model is introduced for designing, developing and evaluating pervasive
learning. There are four key components that need to be considered during the creation of
pervasive learning (PL) environments: community, autonomy, locationality, and
relationality as shown in Figure 20. These components overlap, interact with each other
and cannot function in separation.
Community (C): Learning is not provided by one teacher. Learners are educated by a
learning community, and are educating others in the community as well.
Autonomy (A): This provides a learning community without one central authority figure or
authority structure directing the course of learning. Learners become comfortable with the
knowledge that in the world there is no correct “answer,” but that there are many variations
and possibilities and learning feedback comes from a variety of sources.

Locationality (L): Learning should be inside the classroom and outside it.
Relationality (R): Relating the collected knowledge to the lives of the learners is better as
they learn within their own personal environments where they can understand better.
Figure 20: A model of pervasive learning [88]
MOBIlearn system is a research project intended to support pervasive learning
environments by combining context awareness and adaptivity [9]. Its purpose is to support
a variety of learners such as their skills and motivation to learn, and the context of learning
itself. This allows users to create their own learning places, configuring the physical
resources available to them in the ways that they find most comfortable, efficient and
supportive to them. Figure 21 shows the data flow between the components. The context
awareness subsystem is responsible for storing the contextual data which is in the form of
XML documents. The context metadata is collected from different locations such as: the
sensor input, other subsystems or the user input, to be saved in the context awareness
subsystem. User settings, current and previous activity, device capabilities and other
information are composed from the metadata in the form of context feature objects (CFOs)
at run-time. Such data is filtered and then gets ranked to determine the best options. The
content and service subsystem receives such ranked groups to start activating the
appropriate content, services or interface presentations to the user.

Figure 21: MOBIlearn system dataflow architecture [33]
A proposed infrastructure that supports pervasive and adaptive learning, as shown in Figure
22, is based on the multi-agent system (MAS) paradigm [33]. It allows the deployment
and the integration of various components, devices, learners, educational services and
situations to form pervasive learning communities. The infrastructure is composed of
various networking technologies, various devices and a local server for content. Figure 23
shows the architecture that is built on top of the infrastructure which aims to provide
personalized and adaptive support for the students. The student modeling agent is
responsible for collecting different information from particular components and making
them available to the other components. The location-awareness service is used to provide
face-to-face learning groups to mobile students. The adaptive mechanisms supply the
students with the learning material that fit to their learning styles. Automatic guidance
messages are sent to the individuals to guide them to learn and move in the real world
according to their personalized context-aware knowledge and the knowledge structure in
the learning environments. The presence of Question/Answer service provides an
intelligent asynchronous Q&A knowledge sharing platform.

Figure 22: Overview of the proposed infrastructure at [33]

Figure 23: MAS-based system architecture for pervasive learning [33]
A context-aware language-learning support system for Japanese polite expressions
learning, called JAPELAS (Japanese polite expressions learning assisting system),
provides the learner with the appropriate polite expressions deriving the learner‟s situation
and personal information [38]. Japanese polite expressions are subjective to the situation.
JAPELAS has the following modules:
Learner model: This module has the learner‟s profile such as name, age, gender,
occupation and interests which are collected from the user before using the system. It also

stores the comprehensive level of each expression for the user by detecting it during the
system use.
Environmental model: This module has the data about the rooms in a certain area. The
room is detected in the location manager using a RFID tag and GPS. The location is used
to determine the formality
Educational model: This module is responsible for managing the expressions which are
the learning materials. The teacher enters the basic expressions. Both the learner and the
teacher can add or modify expressions during the system use.
IR communication: IR simplifies the names of communication targets where users can
point to the person rather than enter the target names.
Location manager: It is responsible for detecting the learner‟s location using RFID and
GPS, e.g. store, private room, home, etc. where RFID tags are used indoors, while GPS is
used for outdoors. RFID tags are attached in the entrance doors in the room, and identify
the rooms.
Polite expression recommender: Based on polite expression rules, this module provides
the appropriate expression at the current situation.
Figure 24 shows the CLUE system configuration. It is the generic concept for JAPELAS
and it is proposed by the same authors [66].
Figure 24: CLUE system configuration [66]

Another system is called TANGO (Tag Added learning Objects), a vocabulary learning
system presented in [38] and [66]. It is used to detect the objects around a learner using
RFID tags. Moreover, it provides the learner with the educational information. TANGO
has the following modules:
Learner model: This module has the learner‟s profile such as name, age, gender,
occupation, interests that are entered by the user prior to the use of the system. A test is
carried out by the user to determine the user‟s comprehensive level and it is updated during
the system use.
Environmental model: This module is responsible for preserving the data of objects,
rooms and buildings, and the link between objects and expressions in the learning materials
database.
Educational model: This module manages the learning material that contains the words
and expressions. The teacher enters the fundamental expressions for each object. Then,
both the learners and teacher can add or modify them during system use.
Communication tool: This tool provides the users with a BBS (bulletin board system) and
a chat tool, and stores their logs into a database.
Tag reader/writer: This module reads the ID from a RFID tag attached to an object.
Referring to the ID in the object database, the system obtains the name of the object.
User interface: This module provides learner questions and answers.
3.3.2. Smart Active Spaces
In [47], an architectural framework and a set of middleware components are presented that
help in the integration of perceptual components, sensors, actuators and context acquisition
in smart spaces. Besides, it allows the discovery of the newly appearing resources and gets
them integrated to the system. The system consists of three tiers as shown in Figure 25:
A sensors tier: it consists of the sensors that represent the infrastructure of the
smart space. Signals are collected from the environment through the sensors
then, context is extracted after processing. Figure 26 shows a set of APIs used
as interfaces between the sensors and the smart space applications.
A tier of perceptual components: It is responsible for extracting context cues
from the collected signals, as shown in Figure 27, mainly from the audio and

video ones. Context collected from perceptual components recognize the
location and the identification of the people and objects.
A tier of agents: This tier is responsible for tracking and modeling higherlevel
contextual situations, as well as incorporating the service logic of the pervasive
computing services. Information exchange between perceptual components
and agents is based on CHILIX [47], an IBM middleware that enables access to
the output of the perceptual components based on XML over TCP transfer of
information.
Figure 25: High level architecture for pervasive computing services in smart spaces [47]

Figure 26: Sensor virtualization [47]
Figure 27: Perceptual components visualization and APIs [47]
Gaia which is presented in [73], [58], [83] and [1] is a middleware operating system that
manages the resources in an active space. It brings OS functionalities to the real world.
As depicted in the architecture shown in Figure 28, Gaia is composed of Gaia Kernel,
application framework and Active Space Applications. For the Gaia Kernel, it consists of

the Component Management Core (CMC) and a set of services. The CMC is responsible
for managing the components through creation, destruction, and uploading. The CMC
consists of three abstractions:
Gaia Components (it is the minimum software unit in the system)
Gaia Nodes (any device capable of hosting the execution of Gaia Components)
Gaia Component Containers (Gaia Nodes organize components into containers,
and export an interface to manipulate the components that belong to such
groups.)
Figure 28: Gaia architecture [1]
The set of services are used to deliver security, privacy, context and presence. The application
framework is responsible for decomposing an application into multiple components. The quality
of service is introduced to guarantee that the presented services are up to the level through probing
and profiling. The active space applications are the applications that could be built on top of Gaia
to provide different functionalities.
iTransIT framework is another research carried out to integrate transportation systems and
related services, and has been proposed for usage in global smart spaces [70]. It utilizes
the spatial application programming model that allows accessing and using context
distributed across different services. Figure 29 shows the architecture of iTransIT. It
divides the system into three tiers, legacy tier, iTransIT tier and contextaware applications

tier. The legacy tier contains the current as well as future systems that are used to collect
data. iTransIT tier is used to integrate the legacy systems that implement the spatial objects,
as well as maintaining the information gathered by sensors or provided to the actuators.
Systems in that tier are the ones that interact with the users, i.e. purpose specific, and the
legacy systems. Finally, the application tier contains the services that supply context-aware
access.
SMeet presented in [65] is another approach for smart meeting spaces. It enables users to
interact with remote ones by the use of a wide range of devices embedded in meeting
rooms.
As shown in Figure 30, SMeet is composed of the SMeet mediator, the ACE Connector,
component services, and the SMeet space GUIs: o The SMeet mediator configures a
SMeet node with component services.
o The ACE Connector supports a transparent and constant connection for
SMeet nodes, and it overcomes the network issues.
o The SMeet space GUIs allows ease of control and monitor of the SMeet
node by the participants.
Figure
29
:
iTransIT architecture and data model
[70]
Exposes data model to
other iTransIT systems or
user services

The component services provide access to resources such as devices and software
programs such as audio/video tools. They are categorized into four functional sets:
media & data, networking, display, and multimodal interaction:
o Media & data component services supply flawless audio and video
communication among participants by providing real-time media
transmission.
o Networking monitoring service is used for monitoring network
performance.
o Interactive display control service controls display devices based on user
interaction such as pointing, hand-motion tracking, etc. Moreover, it enables
users to place and resize visual data on any part of display.
o Multimodal interaction component services supply user-friendly interaction
with the tiled display.
Figure 30: SMeet Architecture [65]

3.3.3. Health
Pervasive systems invaded healthcare systems to offer e-health services. We will go
through some of the architectures proposed for healthcare pervasive systems. A
policybased architecture is presented in [19] that monitors patients and the elderly people
indoor as well as outside it by making use of software agents and wireless sensor
technologies. When an alarm is generated due to disturbance in the patient‟s health
situation, automatic actions are carried out by notifying the nurse or the doctor on his/her
PDA to take appropriate actions. The system has two main modules; one handles the
interactions between the patient‟s equipment and the hospital‟s database, and the other
handles the interactions between the hospital‟s database and the doctor‟s devices. Figure
31 shows the architecture of the system. For indoor monitoring, sensors collect the data,
and deliver them to a Bluetooth device (actor) attached to the patient to be sent to the
hospital through a Wi-Fi connection at home. Then, messages pass through a gateway to
be forwarded to the hospital‟s database. However, outdoor monitoring requires a mobile
connection to send the patient‟s data. As claimed by the authors, the best technology that
could be used is 3G. Therefore, the collected data is sent to the hospital through the 3G
enabled mobile device carried by the patient. For indoor and outdoor communication, a
VPN is required to secure accessing the database and increase reliability. For shifting
between indoor and outdoor monitoring, a handover among the devices is required.
Figure 32 and Figure 33 show the sequence for that handover.
Figure 31: generic architecture for healthcare pervasive system [19]

Figure 32: handover from indoor to outdoor [19]
Figure 33: handover from outdoor to indoor [19]
Another system is presented in [75] for checking users‟ health status and taking the
appropriate action according to the symptom diary entered by the user from his/her PDA.
The system is divided into three main subsystems as shown in Figure 34. The first
subsystem is the Sensor Networks which contain the set of sensors used to monitor the
patients. The second subsystem is the Management which manages the flow of the drugs
and actions to be taken to handle the patient‟s situation. The third subsystem is the Server
which contains the Database, Knowledge Base, Allocation and Communication.

Figure 34: Tele-health System [75]
3.3.4. Games
Pervasiveness extended to the games domain in order to make it in one way or another
more realistic. In [15], they presented a coordination infrastructure called Pegasus which
allows flexibly coupling and reconfiguring of components during runtime. In other words,
developing pervasive games without expecting the accurate configurations of physical
interaction devices became easier.
It divides the user interface components into the following:
Tangible Game Boards
The Gesture Based Interaction
Device o Gesture Recognition o
Intensity Measurement o
Pointing o The Smart
Dicebox
Other Interface Components (such as ordinary computing devices (PCs, PDAs etc.)
or simple interfaces such as physical buttons or RFID-augmented playing cards)

Figure 35 shows the architecture for the Pegasus. It is based on three layers of abstraction
which are: Basic Tools Layer, Network Data Layer and Functional Object Layer. The first
is responsible for handling the low level functionalities of dealing with data trees, network
transfer and XML parsing. It is composed of lightweight XMLrelated library functions.
Moreover, it contains functions to be used for connecting and handling data transfer
between multiple Pegasus software components. The second is used to abstract away the
access to shared information among Pegasus instances using predefined functions such as
Gateway Accessor. Finally, the functional object layer is used to implement the functional
objects on top of the network data layer. A functional object is informed through other
functional objects or through Accessors with the changes in the data and evaluates the
situation according to such changes.
Figure 35: The Pegasus coordination infrastructure [15]
Another research discusses pervasive games for mobile users [54]. The use of
locationbased gaming techniques helps the user to roam around according to the game.
Wireless Gaming Solutions for Future (MOGAME), a research project at the University of
Tampere Hypermedia, has presented a prototype of a persistent multiplayer game that is
based on the collected preferences from the players. The prototype is a player-centered
game that is based on pervasiveness. The game is called “The Songs of North” (SoN) and
it is based on location awareness mixed with reality. The player is in contact with a spirit

world that is placed over the physical environment. Players can interact with the spirits
and also hear the sounds of that other world [54].
3.3.5. Mobile
The approach in [67] is that servers continuously push software applications to mobile
devices (MoBeLets), depending on the current context of use. The difference between this
approach and the others is that usually data are pushed to devices.
A software module called MoBeSoul that resides on the mobile phone is responsible of
managing the whole lifecycle of a context-aware application as shown in Figure 36. It is
divided into the following sub-modules:
Context sub-module: It collects the data from the physical, virtual, MoBe Context sensors
or through the user's explicit actions. It is responsible for producing, storing, maintaining,
and updating a description of the current context of the user.
Personalization sub-module: It contains two components, The Personal Data Gatherer
and The Personalized Context Generator.
The Personal Data Gatherer: It is responsible for collecting data about the user's
preferences and habits, and storing them into the internal databases: the User's
Profile database and the Usage and Download Statistics database. The first
database contains all the data about the user, such as, age and gender, besides the
user's preferences. The latter contains the history of the downloaded MoBeLets
including their execution time and the resources they use.
The Personalized Context Generator: It interacts with the context sub-module. It
allows changing the interaction between the user and the context sub-module
according to the preferences of each user.
Filter and Download sub-module: This sub-module is responsible for selecting the
appropriate MoBLets to download. It works by receiving notifications from the context
sub-module. The scheduler component receives such notifications and then redirects it to
the MoBe Descriptor Server (MDS) which sends only the descriptor not the code. The
filter engine filters the received MoBLet descriptors according to the private context

descriptors. The downloader then connects to the MoBe MoBLet Server (MMS) and starts
downloading the code.
Executor sub-module: Its responsibility is to run the downloaded code inside a sandbox.
The Scheduler manages starting, pausing, stopping and destroying MoBLets. The Security
Manager gives the permission to the MoBLets if it requires access to the resources outside
the sandbox.
Another research in [8] presents the Mobile Platform for Actively Deployable Service
(MobiPADS) system. It is designed to support the active deployment of augmented
Figure
36
:
MoBe overall architecture
[67]
Other processes running on mobile
user’s mobile device such as agenda,
timer or an alarm clock
MoBe Context Server:
The MCS pushes
information about the current context to
the users’ devices

services for mobiles. Mobilets are active-services entities and represent the services that
form the service-chain composition.
As shown in Figure 37, MobiPADS consists of two agents, a MobiPADS server and a
MobiPADS client. The server is designed to accept multiple connections from different
MobiPADS clients. Both the server and the client agents are divided into MobiPADS
system components and service spaces. The MobiPADS System Components are
responsible for providing essential services for the deployment, reconfiguration and
management of the mobilets. The MobiPADS Service Space contains a chain of mobilets
that allow the mobile applications to use the functionalities that the mobilets provide.
Mobilets access the system components to acquire their services through mobilet APIs.
Also, events are used to monitor the contextual changes. The meta-objects allow the
applications and the middleware to reconfigure both the event compositions and the service
chain when required.

Figure 37: MobiPADS Architecture [8]
A framework is presented in [24] which enables mobile devices to utilize the available
resources in the surrounding environments. The framework's main goal is to use the
resources for service advertisement, discovery, filtration, synthesis and migration. In Figure
38, the architecture for the framework is divided into four components: services, surrogates,
context monitors and mobile clients.
Services are applications with interface that can provide the user access to surrounding
devices such as a projector, printer … etc. Surrogates, such as a desktop in the wired

infrastructure, help the mobile clients to filter the services and to communicate with the
suitable one. The dispatching surrogate, a special type of surrogate, is responsible for
configuring the network and finding the suitable surrogate on behalf of the mobile device.
The context monitor is responsible for supplying context information to surrogates.
Figure 38: Overall architecture for a network service framework for mobile pervasive computing [24]
3.3.6. Retail Systems
There were many approaches to introduce pervasive systems to retail systems. The
research motivation in [29] is to provide more efficient and effective handling of customer
goods rather than stopping the supply chain at the supermarket's checkout. The system
presented collects the favorite stocks and their consumption rates and notifies the users
with the shopping lists and prices. The system architecture is divided into: backend system,
middleware, shopping cart, home network and mobility. The back-end system is
responsible for tracking the goods by using bar codes or RFIDs through the integration
with the supermarket infrastructure. The middleware is the link between the back-end and
the users. It consists of two elements. First, the transcoder, it communicates with the back-
end by transforming data between various access devices and system modules. Second, the
web or mobile web device, it links the users with the appliance server. The appliance server
is responsible for managing user's sessions. The shopping cart is equipped with a RFID

reader, a bar code reader, an IEEE wireless Ethernet card and display. The home network
is based on X10 with connectivity provided through an Open Service Gateway Initiative
(OSGI) device. Finally, the mobility is satisfied by accessing the services on the user‟s
mobile devices through a WAP gateway connected to the transcoder. An out of stock SMS
is automatically sent to the registered users.
3.3.7. Emergency Management
In emergency management, pervasive systems could be of great help in such situations.
A pervasive architecture based on a Mobile Ad hoc NETwork (MANET) is presented in
[61] for supporting workflow management in case of emergency situations named
MOBIDIS (Mobile @ DIS). It assigns tasks and prioritizes them to the emergency team
according to different predefined models. In Figure 39, each mobile device contains a
wireless stack. The wireless stack consists of a network interface and hardware to calculate
the distance of the neighbors. The Network Service Interface abstracts away the
communication and routing protocols to the upper layers. The Predictive Layer signals the
Coordination Layer if there could be a possibility in losing the connection for the coming
instant. It utilizes the predictive algorithm. The coordination Layer's responsibility is to
find out if a peer is going to disconnect through the Disconnection Manager, and if so, it
applies algorithms for choosing a bridge. The Coordination Layer also contains the
Workflow Execution Engine that is used to assign tasks and the Workflow Reviewer to
review the tasks.

Figure 39: MOBIDIS architecture [61]
ESCAPE, presented by Turong et al., is a peer-to-peer context-aware framework for
emergency situations [39]. It manages and provides context data for adapting processes
for emergency management systems. The ESCAPE framework architecture is presented
in Figure 40. It is composed of the back-end system and the context information
management services (CIMS). The back-end system receives the collected context
information from CIMS. CIMS resides on every handheld device carried by individuals
who form connected teams. It is responsible for collecting context information. The CIMS
consists of different components and services as shown in Figure 41. The Web Services
Client API is used to communicate with other web services. The SOAP server is used to
provide building services based on SOAP. Team discovery and service broadcasting is
done through the Service Location Protocol (SLP). Service Discovery and Team
Management components are used to locate and manage the connected CIMSs. The Query
and Subscription module is responsible for processing the sent requests from the clients.
Collecting context information from other CIMSs and forwarding them to the back-end is
the responsibility of the Data Aggregation and Publish Component. The Sensor Executor
is used to manage the internal context-aware sensors. Finally, the Lightweight Data Storage
component is located at the CIMS to store the gathered context data locally. The back-end

system contains the situation context information management service (SCIMS) which is
responsible for saving the context data related to a situation in a database for providing
support for the teams and for post-situation analysis.
Figure 40: ESCAPE architecture [39]
Figure 41: CIMIS architecture [39]
3.3.8. Transportation:
iTransIT is a framework presented in [21] that was developed to provide a structured
approach for designing and implementing Intelligent Transportation Systems (ITS).
iTransIT, as shown in Figure 42, is structured as a legacy tier, iTransIT tier and application
tier. The legacy Tier is used to generalize all the legacy systems especially transportation
systems that can be integrated into the system. iTransIT tier is used for collecting all the
traffic data and form a spatial data layer to be used by the application tier. The application

tier includes the pervasive services that provide the users‟ contextaware access to the traffic
data.

Figure 42: iTransIT architecture [21]
3.3.9. Bridging:
Context management systems are heterogeneous. Therefore, there is a need to bridge them
together in order to serve mobile users. The research presented in [18] aims to integrate
transparent and semi-transparent bridges between different Context Management Systems
(CMSs). Examples of such different CMSs could be home/office environments, mobile
telecom environments or wireless ad-hoc environments. The AWARNESS project was
developed to serve this purpose. The bridge functionalities as stated should first be able to
map the identification for the users where they could have different identities across
different CMSs. Secondly, it should be able to discover the context producer in other SMSs
in order to translate the context query and filter the discovery results. Thirdly, the bridge

should have the capability of forwarding the context information from other CMSs (foreign
CMSs) to the native CMS by taking care of different communication mechanisms for the
CMSs. Fourthly, the bridge should be able to format context information by translating
context semantics and encode them to be understood by the native CMS. Fifthly, bridging
needs to context adaptation and reasoning in the case of misunderstood context information
from foreign CMSs. Finally, privacy is important to ensure applying the native CMS's
policy over the foreign ones in case they do not ensure it. Figure 43 shows the
AWARNESS bridging architecture. The AWARNESS Bridge, which is located in the
middle, consists of a context broker and many context producers. The context broker is
responsible for recognizing management and context discovery. The context producers act
as proxies and handle context adaptation, reasoning, and formatting context information
for foreign CMSs.

Figure 43: Basic bridging architecture [18]
uMiddle, a system for universal interoperability and a bridging framework for middleware
in pervasive systems is introduced in [46]. It enables interaction between different devices
over various middleware platforms. Figure 44 shows the system architecture of uMiddle.
The devices that need to communicate are called native devices such as a Bluetooth digital
camera and a MediaRenderer TV in Figure 44. Mappers and Translators are abstractions
to enable interoperability. A Mapper is responsible for creating service-level and transport-
level bridges for recognizing the newly appearing devices and abstracting communication,
respectively. A translator establishes a devicelevel bridge for native devices which is
responsible for translating the different representations of device semantics besides
working as a proxy for that device. Hosts are used on the network over the runtime to
connect devices. The Directory Module is used to handle the availability of the devices.

Figure 44: uMiddle architecture [46]
3.3.10. Fault Tolerance
Fault tolerant pervasive systems require relying on eliminating any error or system failure
before deployment and if there are errors, the system should have the ability to mask the
failures and continue providing the service. Therefore, there are three key requirements for
developing fault tolerant pervasive systems as proposed in [17] which are:
1. Dynamic discovery of new services and resources.
2. Automated and transparent recovery from failure.
3. Analytical determination of component replication strategies and deployment
architectures.
Achieving this could be done through replication, replica synchronization and failover.
The architecture for a fault manager is presented in [82]. The Checkpoint store is used by
the applications to store their status regularly. Moreover, each application sends a heartbeat
message to the fault manager to ensure it is connected. When an application gets
disconnected, the fault manager, shown in Figure 45, retrieves the current context
information from the Space Repository through the context infrastructure. This enables the

application to be restarted on an appropriate surrogate device using the saved state from
the checkpoint storage.
Figure 45: Fault manager architecture [82]
3.3.11. Context-aware
The presented architecture in [49] is a case study to validate a software engineering
framework for context-aware pervasive computing. The architecture, as shown in Figure
46, is built with loosely coupled layers on top of each other. They are the context gathering,
context reception, context management, query, adaptation, and application layers. The
context gathering layer is responsible for collecting the data from the sensors and processes
them to extract the needed information from the raw sensor data. The context reception
layer links the context gathering and the context management layers. It sends the collected
data from the context gathering layer in a fact-based representation to the context
management layer and returns back the queries to the appropriate component. The context

management layer is responsible for maintaining a set of context models for the
applications to contact. The query layer provides the top layers, the adaptation and the
application layers, with an interface to query the context management with the fact and
situation abstractions. The adaptation layer holds repositories for situation, preferences
and triggers. Then it evaluates them on behalf of the application layer according to the
results of the query layer. Finally, the application layer supplies a programming kit for two
programming models, the branching toolkit and the triggering toolkit. The former is used
to support context-dependent choices among different alternatives. However, the latter is
used to provide functionalities for creating new triggers dynamically in addition to
activating/deactivating the existing triggers.

Figure 46: Context-aware pervasive architecture [49]
A generic framework for context management is presented in [36] called the Context
Management Framework (CMF). According to Figure 47, the functional blocks that make
up the framework are the Context Source, Context Provider, User Manager and Application
Components. The Context Source collects different information from different data sensors

or other domains. It is also responsible for delivering the context information either by
monitoring the environment directly or by proper interpretation of heterogeneous and
distributed context information. This is achieved by the two subcomponents of the Context
Source which are Context Reasoner and Context Wrapper. The Context Reasoner is
responsible for interpreting such collected context information from the sensors and filters
them according to analysis techniques that help in selecting the context parameters. The
context parameters extracted are used for instantiating or adapting a certain application.
However, the Context Wrapper's duty is to encapsulate particular or singular context
information. The Context Provider collects the information and provides it to the User
Manager and the Application Components. The User Manager preserves information about
the end users, their devices, and the subscription rights for accessing contextual information
and related privacy aspects. The Application Components which reside in the application
layer form the communication link with the Context Provider by establishing get and
publish/subscribe functionalities.
Figure 47: Functional Blocks for Context Management Framework (CMF) [36]

3.3.12. File Migration
An architecture is presented in [41] that enables caching Personal Area Networks (PAN) in
order to increase the availability of data generated by mobile devices, and data migration
between these devices and a remote server. Different devices connect with each other in
an ad-hoc manner. Nodes have the same layout either on mobile device, internet based
system or on a backup server. Figure 48 shows the basic components for each node, file
manager, cache, migration queue and on top of all the applications. When an application
needs to save a file, it passes it to the underlying file manager with the metadata collected
from the user or automatically. Both the file and the metadata are stored locally with
pointers residing in the migration queue to be sent to other nodes.
Migration queues are data structures used to unite the file manager‟s outbound
communications. Files are migrated in chunks rather than complete files to fit in cache
and to decrease the probability of losing a file on an unstable link. When an application
requests a remote file, a request is placed in the migration queue and the file manager
retrieves it.
Figure 48: Node layout [41]
3.3.13. Document Editing
An architecture is presented in [85] that is used for pervasive document editing. The
approach used is based on the Text Native Database extension (TeNDaX), a collaborative

database-based document editing and management system. It enables pervasive document
editing and management on the stored documents in the database. Users can access the
documents anywhere and anytime. Once a change is done by someone, it is saved directly
in the database and the changes are propagated to all other users. Figure 49 shows the
building blocks for the system. The presentation layer is the main access to the documents
by the users where they can perform their modifications, such as OpenOffice. The business
logic layer is the interface between the database and the wordprocessing application. It
contains the Application Servers and they are responsible for text editing within the
database. The real-time server components are used to propagate the information to all the
connected users. The data layer is the primary storage area.
.
In conclusion, we discussed the related pervasive architectures collected in our survey. This
helped in defining a well-structured categorization reference for building pervasive systems. The
categorization is done according to the pervasive systems‟ usage and operating environment. Also,
Figure
49
:
TeNDaX architecture
[85]
A
(
-
G) letters are the
AS (1
-
4)
are the
Application servers
RTSC (1
-
4)
are the real
-
time
server components
DB (1
-
4)
are the
databases

we extracted the main features from the architectures and grouped them according to the
categorization criteria.
Chapter 4
Feature-based Generation of Pervasive Systems’ Architectures
Methodology
In this chapter we discuss our methodology of categorizing the pervasive systems. A variety of
architectures for different scopes in pervasive systems were discussed in Chapter 3. We extracted
the pervasive features from these architectures along with their underlying components. We
classified them according to their type and the domain they fit in. In the next section, we will be
showing in some details the categorization that we followed and the features that we support.
4.1. Discussion and Classification of Common and Variable Features in Pervasive
System Architectures
In this section we discuss the main building blocks of pervasive systems‟ architectures that were
developed by earlier researchers. In Figure 50, we show how Pervasive architectures may be
classified by disciplines. We categorized pervasive architectures into general, bridging, privacy
and security, fault tolerance, context-awareness and domain specific architectures as we presented
in [62].

Figure 50: Pervasive architectures
Figure 51 summarizes the privacy features extracted from the surveyed pervasive
architectures. Privacy in pervasive systems consists of Trusted Channels or Trusted Points
or both for securing the communication. Authentication is used to ensure the identity of
the connected users. In Identity Hiding there are numerous techniques that could be used.
Proxy for Anonymity, True and Wrong Data Sent, Pseudonyms and Dummy Traffic and
Mixzones are used to conceal the users from the provided pervasive functionalities.
Pervasive
Architectures
Privacy and
Security
Domain
Specific
Learning
Smart Active
Spaces
Health
Games
Mobile
Retail
Systems
Emergency
Management
Transportation
Data
Management
Document
Editing
Data Migration
Bridging
Fault
Tolerance
Context
-
awareness
General

Figure 52 summarizes the learning features extracted from the surveyed pervasive
architectures. Learning pervasive systems are characterized by the following:
Learner Profile: To reflect the learner‟s interests and motivation to learn in
order to be easily used to locate instructors. It is also responsible of updating
the learners‟ profiles and keeping track of their changes.
Environment Model Management: It is used to allow the learners to select
the physical surrounding resources that could be used in their learning process.
Educational Model Management: It is divided into Learning Material,
Learning Agents, Evaluation and Assessment.
o Learning Material: It is the material that is used in the learning process.
It could be audio/visual or softcopies. o Learning Agents: They are
either Resource Agents or Q&A Agents. The Resource Agents are used
Figure
51
Privacy features
:
Privacy and Security
Trusted Channels
Trusted Points
Authentication
Identity Hiding
Proxy for Anonymity
True and Wrong Data
Sent
Pseudonyms and
Dummy Traffic
Mixzones

to manage the resources available wether physical or virtual. The Q&A
Agents are used to provide the learner and the instructor with a way of
communication to document their interaction.
o Evaluation: It is evaluation engine that is used for evaluating the
educational material by the learners.
o Assessment: For assessing the educational material.
Figure 52: Learning features
Figure 53 shows the smart active spaces‟ features extracted from the surveyed pervasive
architectures. They are divided into Virtual Spaces, Agents and Services.
Virtual Space: It is the hypothetical space surrounding the user. It is divided into
Session Tracking and Perceptual Component:
o Session Tracking: It is used to link the user data and applications with
the user. A user can roam around different places where he/she can
retrieve his/her data and the applications available.
o Perceptual Component: It is the class of components that are used to
extract context indications from collected signals.
Services: These are the set of services that should be available for the smart pervasive
systems:
Learning
Learner Profile
Environment
Model
Management
Educational
Model
Management
Learning
Material
Learning Agents
Resource Agent
Q&A Agent
Evaluation
Assessement
Interactive
Multimedia
Conferencing

o Presence Service: It collects the information about the active space
resources, i.e. it keeps the status of the software components, people and
devices.
o Media and Data Component Service: It supplies the participants with
real-time audio/video communication. (This is used in smart meeting
spaces)
o Multimodal Interaction Component Service: It provides user-friendly
interaction with the tiled display.
Figure 54 shows the health features extracted from the surveyed pervasive architectures.
Health features are divided into the following:
Figure
53
Smart active spaces’ features
:
Smart Active
Spaces
Virtual Space
Session Tracking
Perceptual
Component
Services
Presenence Service
Media and Data
Component Service
Multimodal
Interaction
Component Service

119
Drug Manager: It is responsible for managing the supply of drugs to the
patients according to the situation and the need.
In-door and Outdoor Handover: It is a handover mechanism to switch
between monitoring indoors and outdoors to sustain availability all the
time. Health Sensor Network: It contains the health sensors that
monitor the patient‟s situation such as heartbeat, blood pressure … etc.
Health Data Warehousing: It is a database that contains the patients‟
history as well as the medication required for them to keep track of their
progress. Physician Notification: It is used for notifying the
physician with the patient‟s situation. If the case is severe, the nearest
physician gets notified.
Figure 55 shows the games‟ features extracted from the surveyed pervasive architectures.
Figure
54
:
Health features
Health
Drug Manager
In
-
door and
Outdoor
Handover
Health Sensor
Network
Health Data
Warehousing
Physician
Notification

120
Gesture Based Interaction Devices: They are the devices used to allow the
players to interact with the games using their body movements or using external
devices. o Gesture Recognition: It is used to capture the players‟ body
movement and to send to the game engine the required action.
o Pointing Devices: They are used by the players for easily playing without
being so close.
Figure 55: Games’ features
Figure 56 shows the mobile features extracted from the surveyed pervasive architectures.
Here are the features described:
Security Management: It is an important feature in order to prevent any
unauthorized access for the mobile resources.
o Sandbox: It is the same concept as in java. It is used to execute the
downloaded programs and services in tightly-controlled resources.
Mobilet: It is a chain of service objects used to supply improved services
to the underlying mobile applications. They can be added, updated or
deleted dynamically.
Games
Gesture Based
Interactive
Devices
Gesture
Recognition
Pointing Devices

121
Mobile Manager: It is responsible for executing and migrating the services and
the programs.
o Executer: It is responsible for executing the downloaded programs
inside the sandbox.
o Service Migration: It is responsible for the services to migrate between
the mobile phones and the detected resources.
Surrogates: They are wired resources that mobile phones can use to filter the
services and to communicate with the suitable ones.
Figure 57 shows the retail features extracted from the surveyed pervasive architectures.
Retail features are:
Shopping Cart: The shopping cart is equipped with Readers and a PDA to keep
track of the added items and display to the customer the price and special offers
for the related products.
Figure
56
:
Mobile features
Mobile
Security
Management
Sandbox
Mobilet
Mobile
Manager
Executer
Service
Migration
Surrogates

122
o Screen: The shopping cart could be equipped with a screen that displays
the different messages and notifications to the user, such as the list of
items currently in the basket.
o Internet: The shopping cart could be connected to the Internet in order
to help the user to check the reviews for a certain product.
Readers: They are used to keep track of the products and their location. They
are installed on the shopping cart and on the shelves.
o Bar Code Reader: It is a type of monitoring for the products.
o RFID Reader: It is the Radio Frequency Identification to monitor the
products.
Transcoder: It is used to communicate with the back-end system of the shop
by transforming the data and making them available to the customers.
Home Appliance Server: The server is located at the store owner‟s home. Its
responsibility is to connect to the store and check the availability of the items
that are out of stock from home. It could be configured according to the users‟
needs and preferences.

123
Figure 58 shows the emergency systems‟ features extracted from the surveyed pervasive
architectures. Emergency systems are categorized by the following features:
Distance Calculation: It is used to calculate the distance between the sensors
and the neighbors as well as the distance between the nearest emergency team
and the situation place.
Workflow Management: It is responsible for assigning tasks to the emergency
team according to the different predefined models.
o Workflow Execution Engine: It is used to assign tasks to the emergency
team.
o Workflow Reviewer: It is used to review the tasks given and report if
they are done correctly or not.
Situation Context Information Management Service: It is responsible for
saving the context data related to a situation in a database for providing support
for the emergency teams and for post-situation analysis.
Team Manager: It is responsible for monitoring the team‟s progress and
prioritizes tasks.
Figure
57
Retail features
:
Retail
Shopping Cart
Screen
Internet
Readers
Bar Code Reader
RFID Reader
Transcoder
Home Appliance
Server
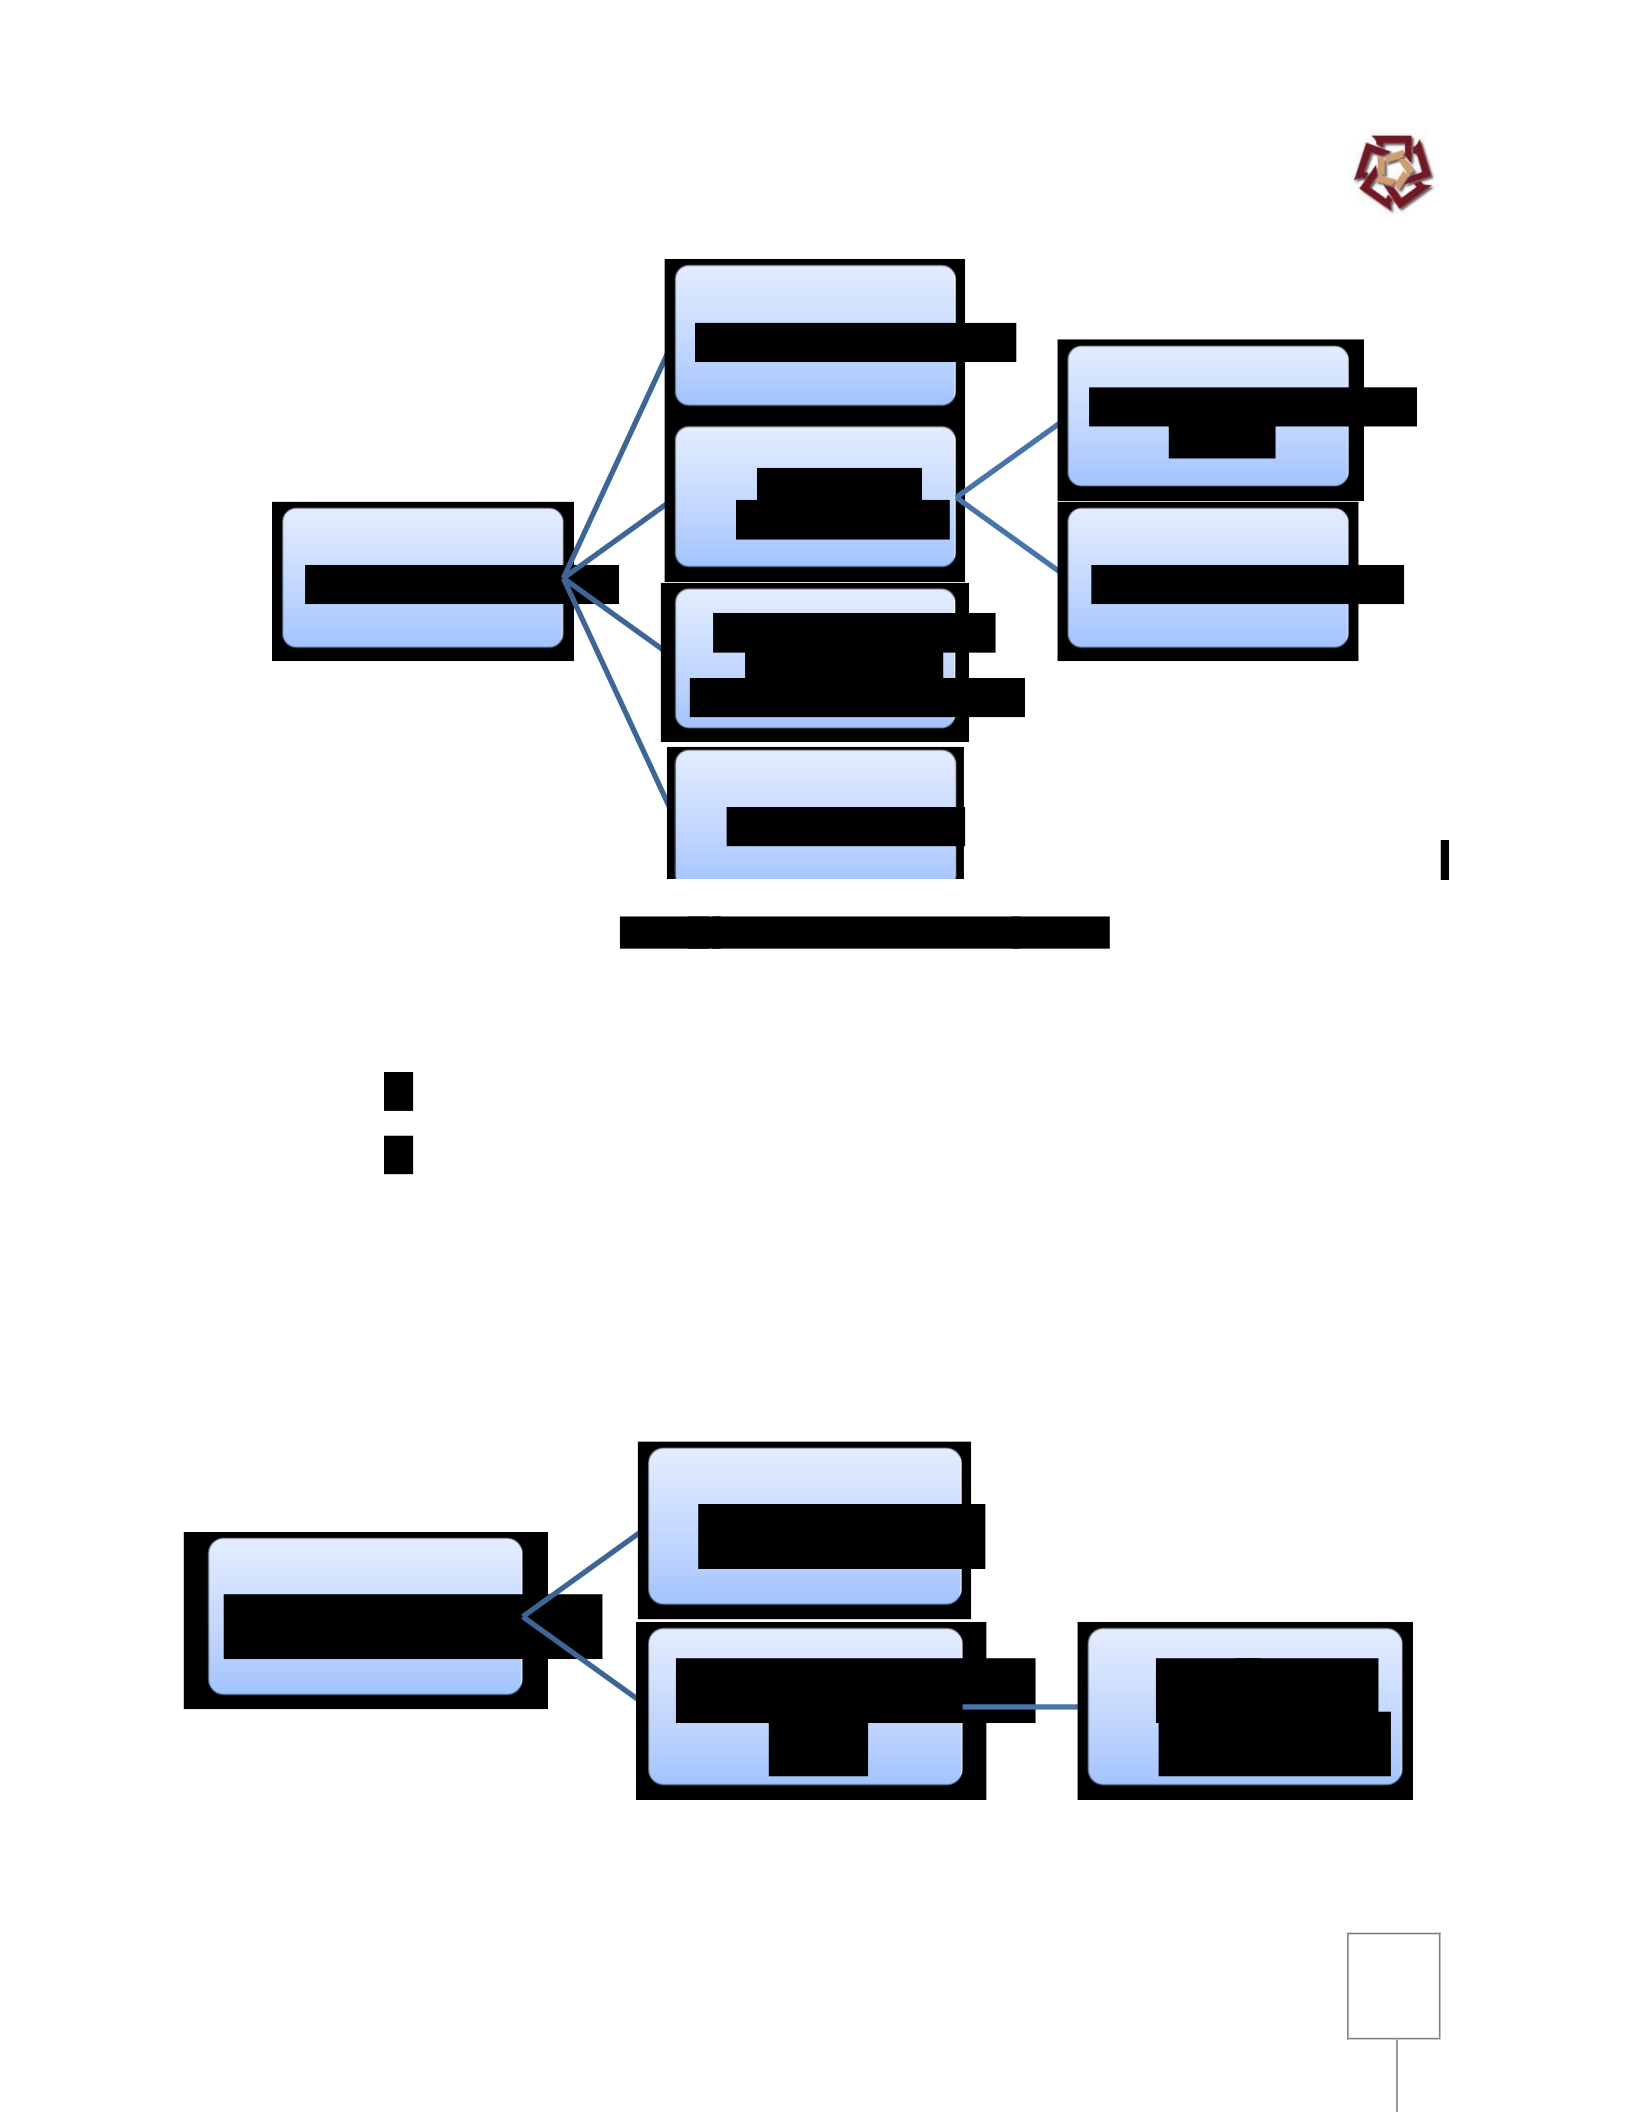
124
Figure 59 shows the Transportation features extracted from the surveyed pervasive
architectures. Transportation features are:
Legacy Tier: It is responsible for integrating with the current traffic systems
Management Tier: It is responsible for managing the incoming traffic data that
are collected and for analyzing them.
o Geo-data Collector: It is responsible for collecting the geographical data
from the streets, filtering them and sending them to the management tier.
Figure
58
:
Emergency systems' features
Emergency Systems
Distance Calculation
Workflow
Management
Workflow Execution
Engine
Workflow Reviewer
Situation Context
Information
Management Service
Team Manager
Transportation
Legacy Tier
Management
Tier
Geo
-
data
Collector

125
Figure 59: Transportation features
Figure 60 shows the bridging features extracted from the surveyed pervasive architectures.
The Bridging architecture features are:
Context Broker: It is responsible for identity management and context
discovery.
Context Producer: It is responsible for handling context adaptation, reasoning,
and formatting context information for foreign CMSs.
Interoperability: It is responsible for exchanging information between different
devices. It is divided into Mapper and Translator.
o Mapper: It is responsible for creating service-level bridges and for
recognizing the newly appearing devices and transport-level bridges for
abstracting the communication.
o Translator: It establishes the device-level bridge for native devices.
Moreover, it is responsible for translating the different representations
of device semantics as well as working as a proxy for that device.
Directory Module: It is used to handle the availability of the devices.

