

Homework 3
 nancy2014
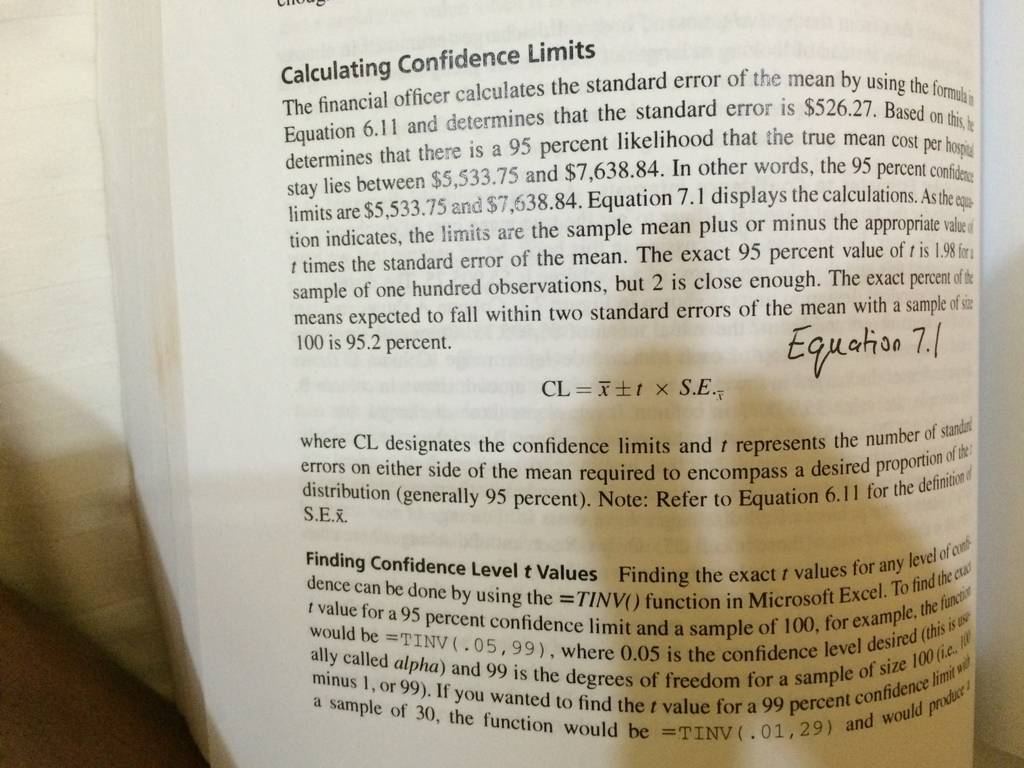
Exercises 7.1
1. Using =TINV( ) and Equation 7.1, calculate the exact 95 percent upper and lower confidence limits for hr following:
a. n = 40, mean = 32, S.E. = 1.23
b. n = 40, mean = 32, S.E. = 3.23
c. n = 140, mean = 32, S.E. = 1.23
d. n = 140, mean = 32, S.E. = 3.23
2. Using t = 2 and Equation 7.1, calculate approximate 95 percent upper and lower confidence limits for the following:
a. n = 40, mean = 32, S.E. = 1.23
b. n = 40, mean = 32, S.E. = 3.23
c. n = 140, mean = 32, S.E. = 1.23
d. n = 140, mean = 32, S.E. = 3.23
3. How well do the values in Exercise 2 approximate those in Exercise 1?
7. Use the hospital charge worksheet in the file Chpt 4-1.xls. Assume that the data represent a random sample from a larger population and do the following:
a. Calculate the exact 95 percent upper and lower confidence limits for the population mean of LOS.
b. Calculate the exact 95 percent upper and lower confidence limits for the population mean of charges.
c. Calculate the exact 95 percent upper limit only for the population mean of charges-that is, the value below which 95 percent of all sample means will be respected to fall.
d. Calculate the exact 95 percent upper and lower confidence limits for the population proportion, which is female.
Exercises 7.2
1. Use the file generated by selecting one hundred samples of thirty waiting times (see attached data set for Exercise 7.2).
a. Calculate the exact 95 percent upper lower confidence limits for each sample.
b. Use the =AND( ) statement, as given in Figure 7.3, to determine whether the confidence limits for each sample contain the true population mean.
c. Use =COUNTIF( ) to determine whether the proportion of samples of the one hundred actually contains the true mean of the population within the 95 percent limits.
d. Can you account for the result you got in (c)?
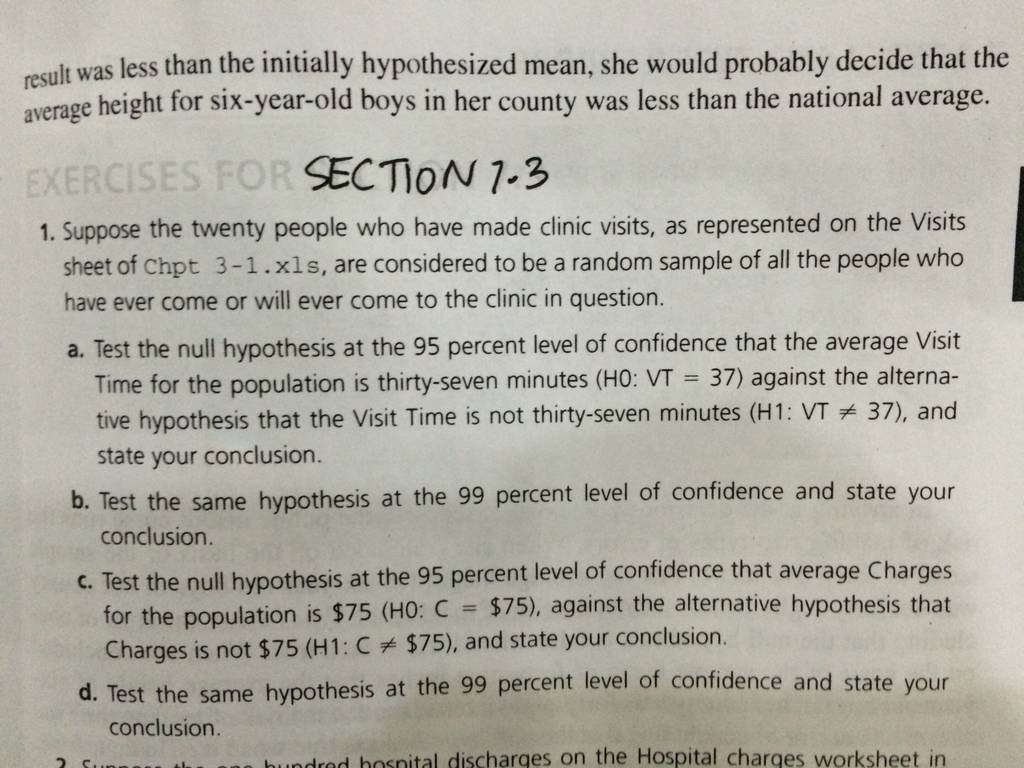
Exercises 7.3
(SEE ATTACHED IMAGE FOR EXERCISE 7.3) #1 only
Exercises 7.4
6. Consider the following hypothesis. H0: average cost per stay in a large hospital is $6,200, and H1: average cost per stay is $5,600, to be tested at the 95 percent level of confidence. A sample of one hundred and twenty records has been selected and assessed for cost. The standard deviation of the costs is $3,100.
a. Is alpha known in principle? If yes, can its value be stated from the information given? If yes, what is the alpha?
b. Is beta known in principle? If yes, can its value be stated from the information given? If yes, what is beta?
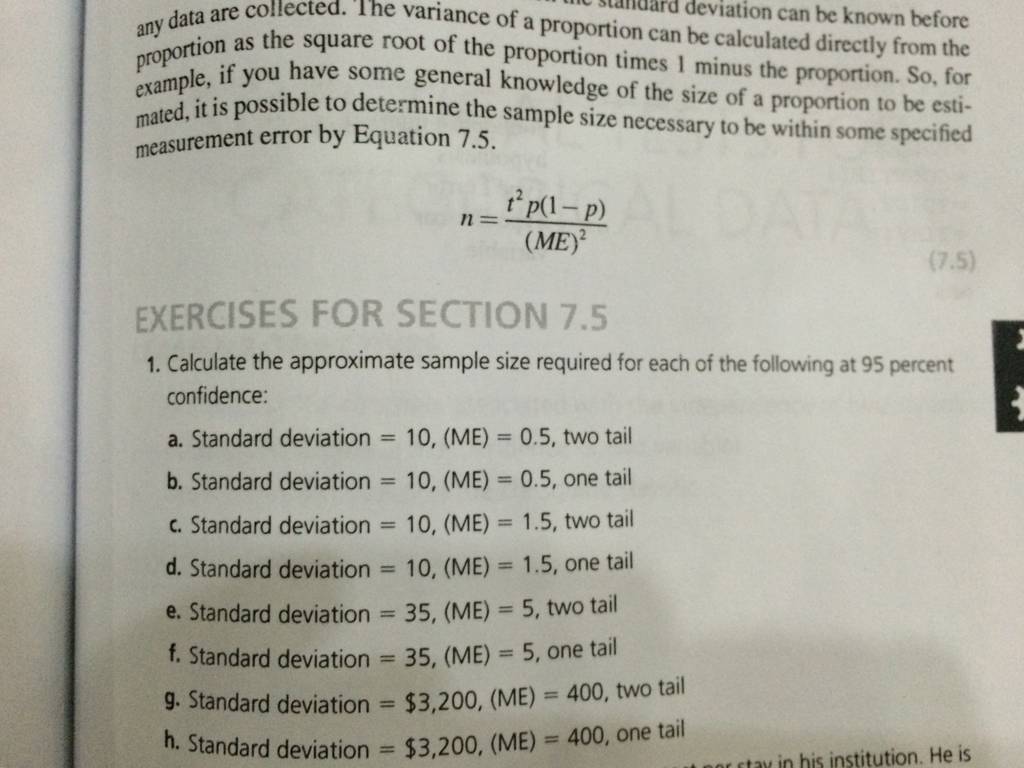
Exercises 7.5
1. Calculate the approximate size required for each of the following at 95 percent confidence:
a. Standard deviation = 10, (ME) = 0.5, two tail
b. Standard deviation = 10, (ME) = 0.5, one tail
c. Standard deviation = 10, (ME) = 1.5, two tail
d. Standard deviation = 10, (ME) = 1.5, one tail
e. Standard deviation = 35, (ME) = 5, two tail
f. Standard deviation = 35, (ME) = 5, one tail
g. Standard deviation = $3,200, (ME) = 400, two tail
h. Standard deviation = $3,200, (ME) = 400, one tail
2. A hospital administrator wants to measure average cost per stay in his institution. He is willing to be within $200 of the true value with a probability of 95 percent. An initial investigation of a random sample of ten records determined that the standard deviation of cost was $3,987. How large a sample will need to be taken to meet the administrator’s needs?
(PLEASE DO THE FOLLOWING QUESTIONS BELOW ON A SEPARATE EXCEL WORKBOOK)
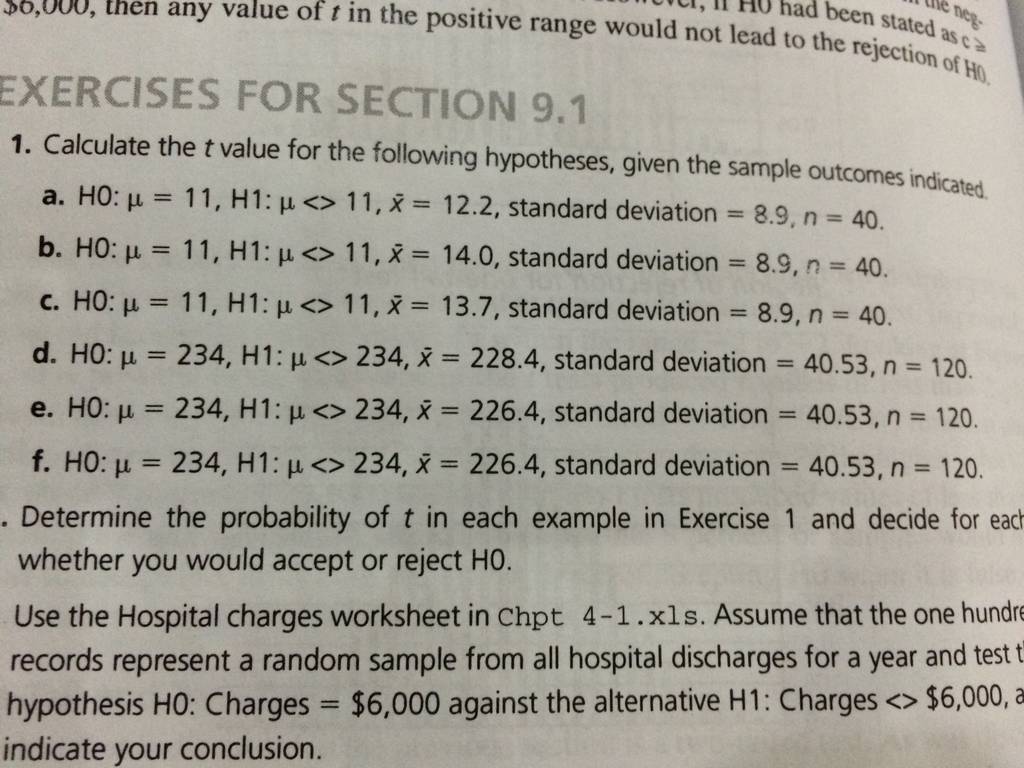
Exercises 9.1
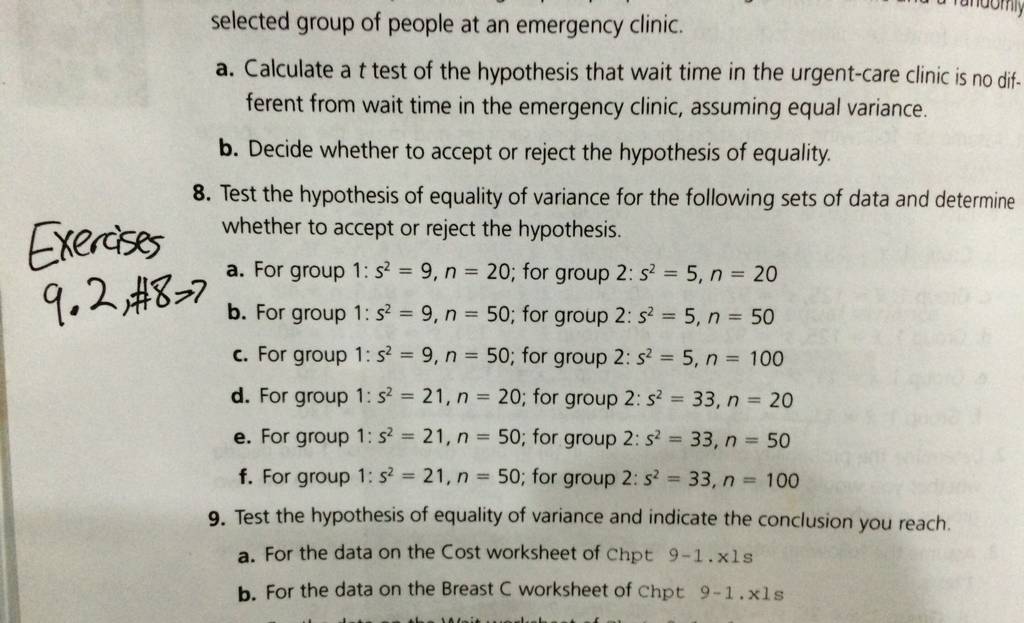
1. (SEE ATTACHED IMAGE FOR EXERCISE 9.1, Number 1). Please answer 1a-c only.
2. Determine the probability of t in each example in Exercise 1a-c only, and decide for each whether you would accept or reject H0.
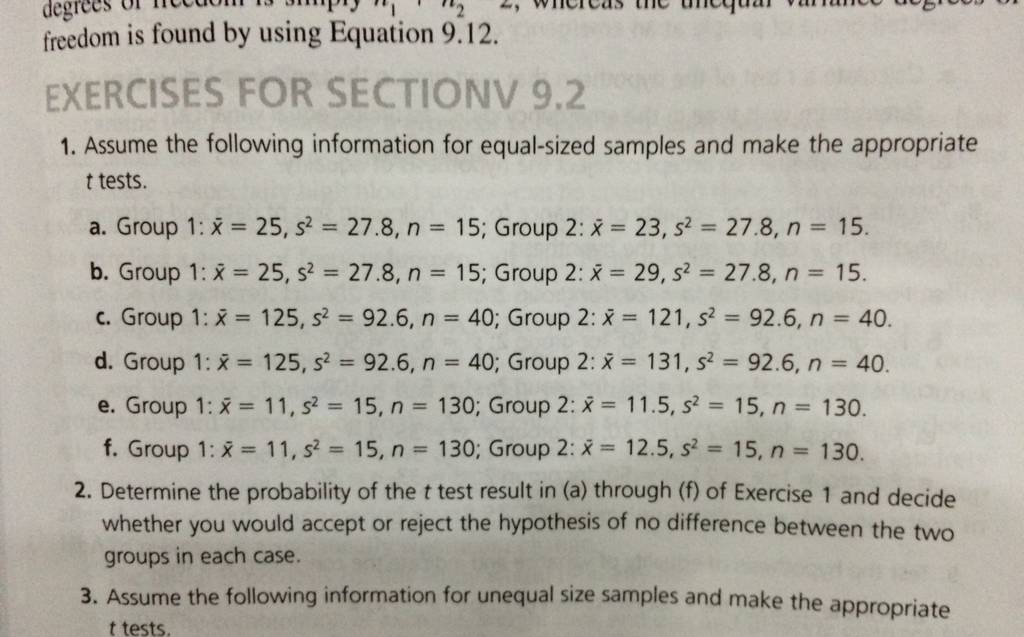
Exercises 9.2
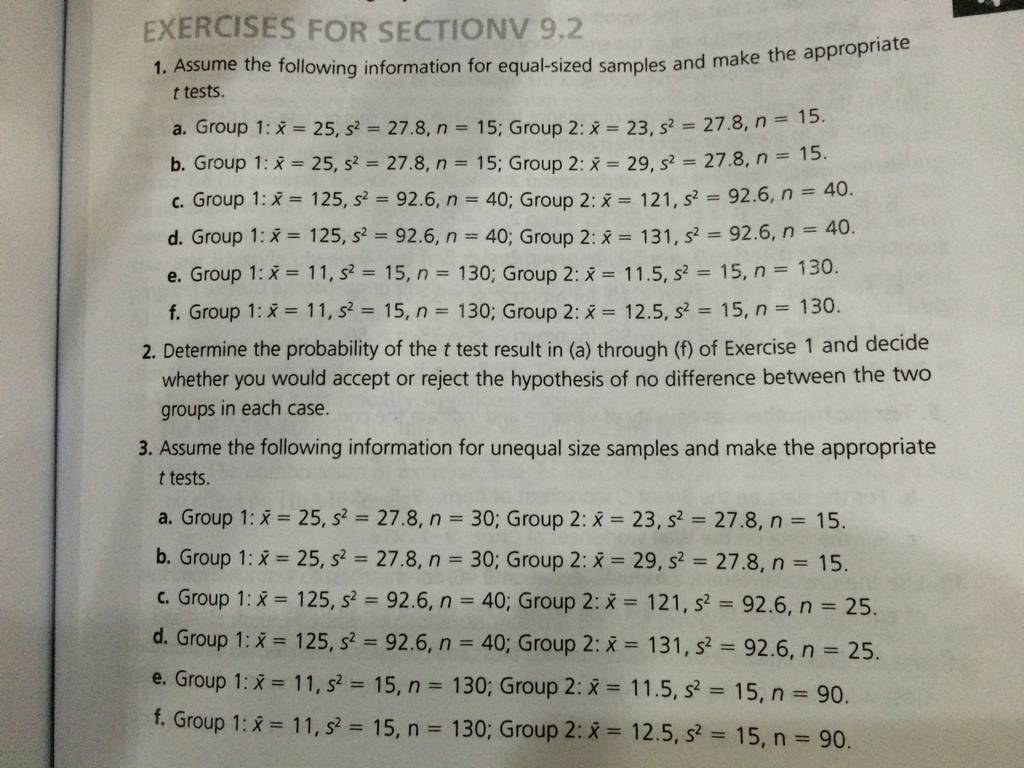
1. (SEE ATTACHED IMAGE FOR EXERCISE 9.2, Number 1). Please answer 1a-b only.
2. Determine the probability of the t test result in (a) and (b) of Exercise 1 and decide whether you would accept or reject the hypothesis of no difference between the two groups in each case.
3. (SEE ATTACHED IMAGE FOR EXERCISE 9.2, Number 3). Please answer 3a-b only.
4. Determine the probability of the t test result in (a) and (b) of Exercise 3 and decide whether you would accept or reject the hypothesis of no difference between the two groups in each case.
8. (SEE ATTACHED IMAGE FOR EXERCISE 9.2, Number 8). Please answer 8a-b only.
Exercises 9.3
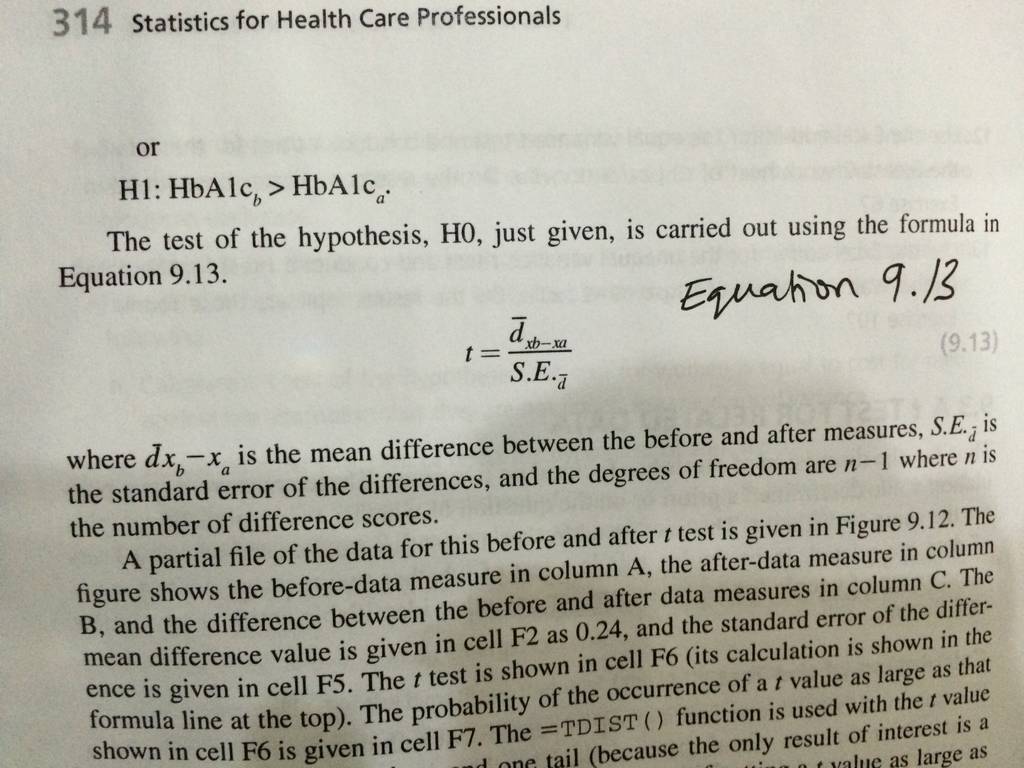
2. The data on the Weight worksheet of Chpt 9-2.xls represent the weight of twenty five who wen tin a prescribed diet at the beginning of one year time period. The Before weights are their weights at the start of the program and After are their weights one year later.
a. Use the formula in Equation 9.13 to test the hypothesis that weight before equals weight after against the alternative that weight after is less than before, and indicate your conclusion.
b. Use the Excel add-in for related data and replicate the results found in (a).
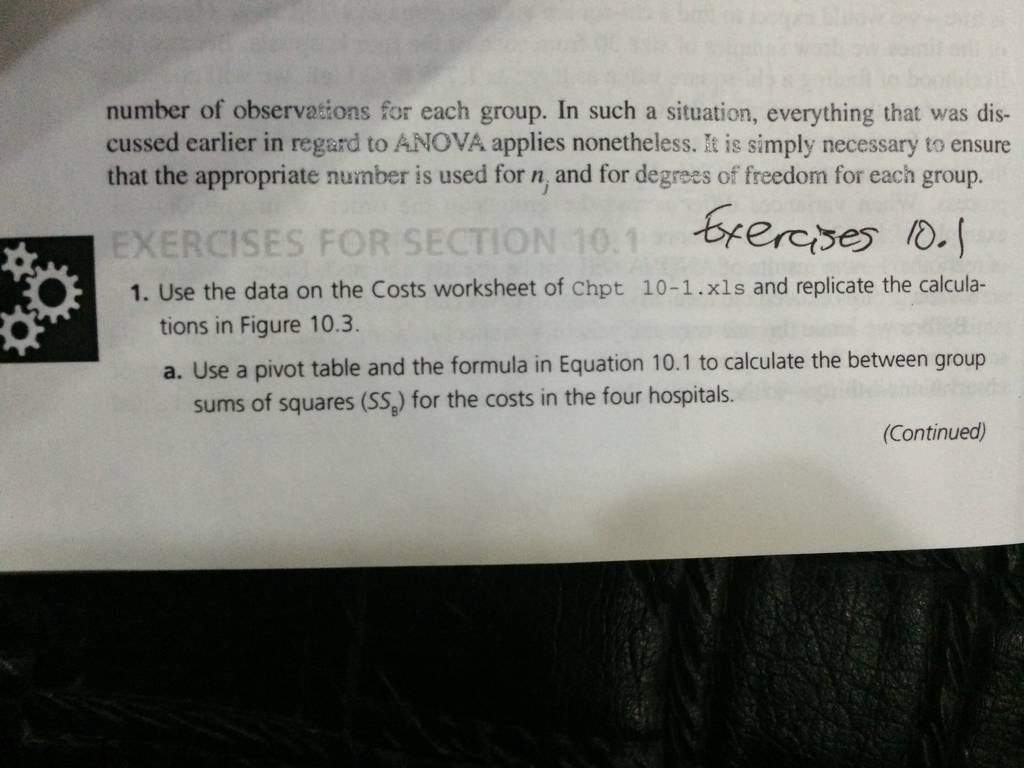
Exercises 10.1
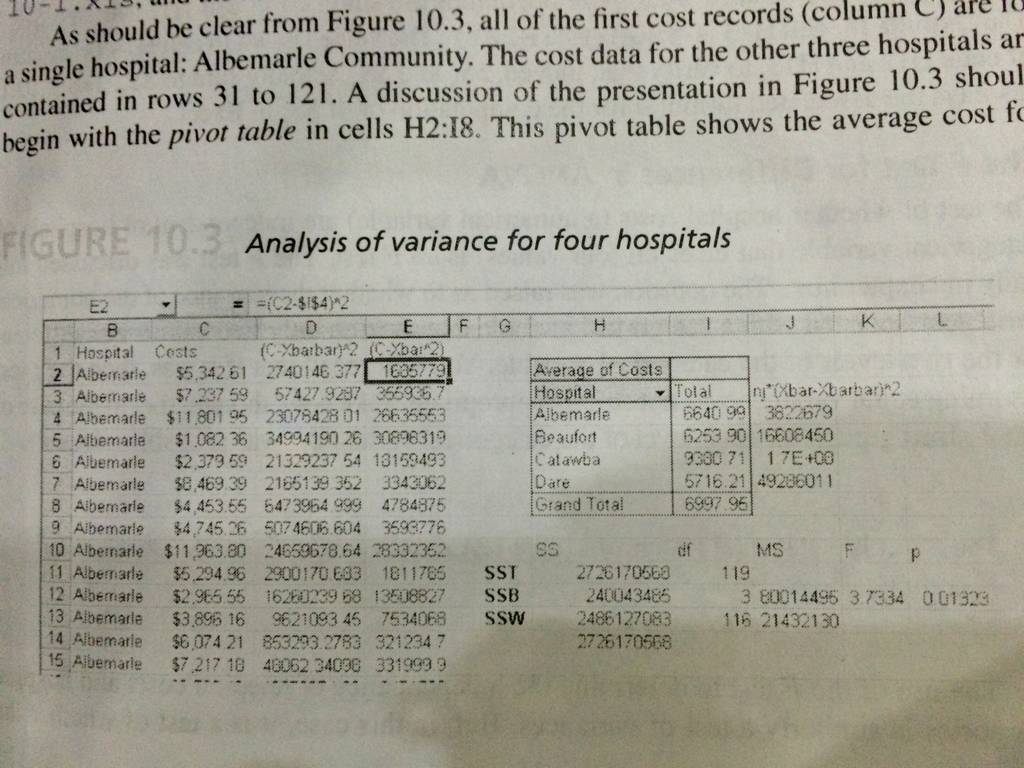
1. Use the data on the Costs worksheet of Chpt 10-1.xls and replicate the calculations in Figure 10.3.
a. Use a pivot table and the formula in Equation 10.1 to calculate the between group sums of square (SS 8) for the costs in the four hospitals.
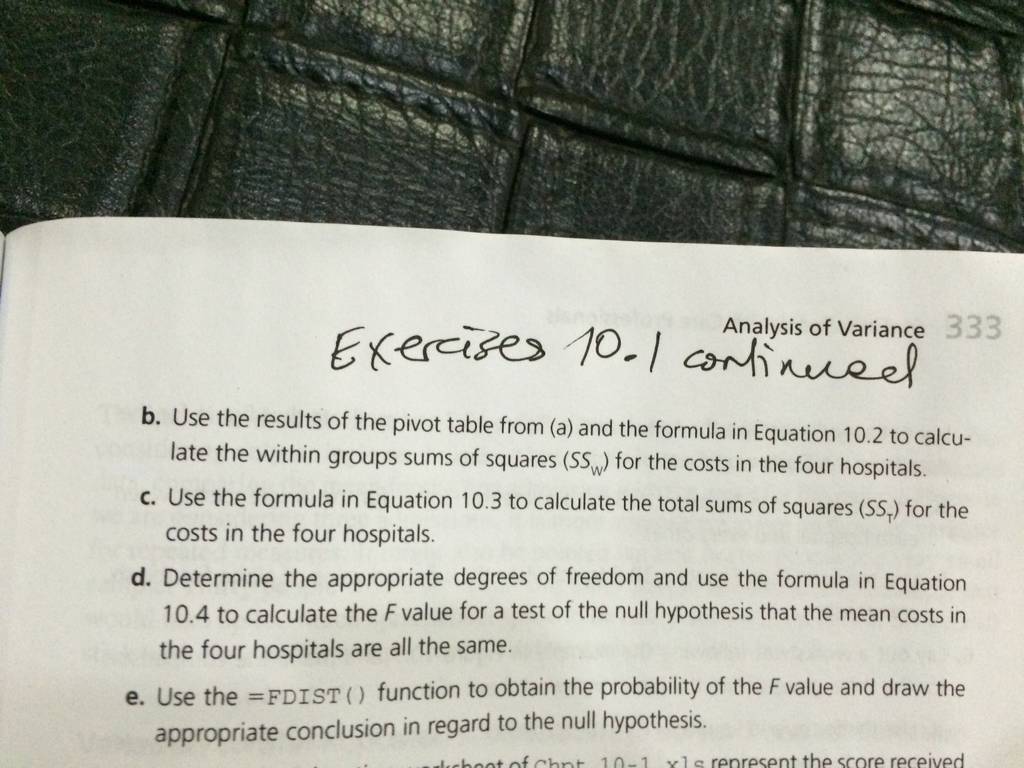
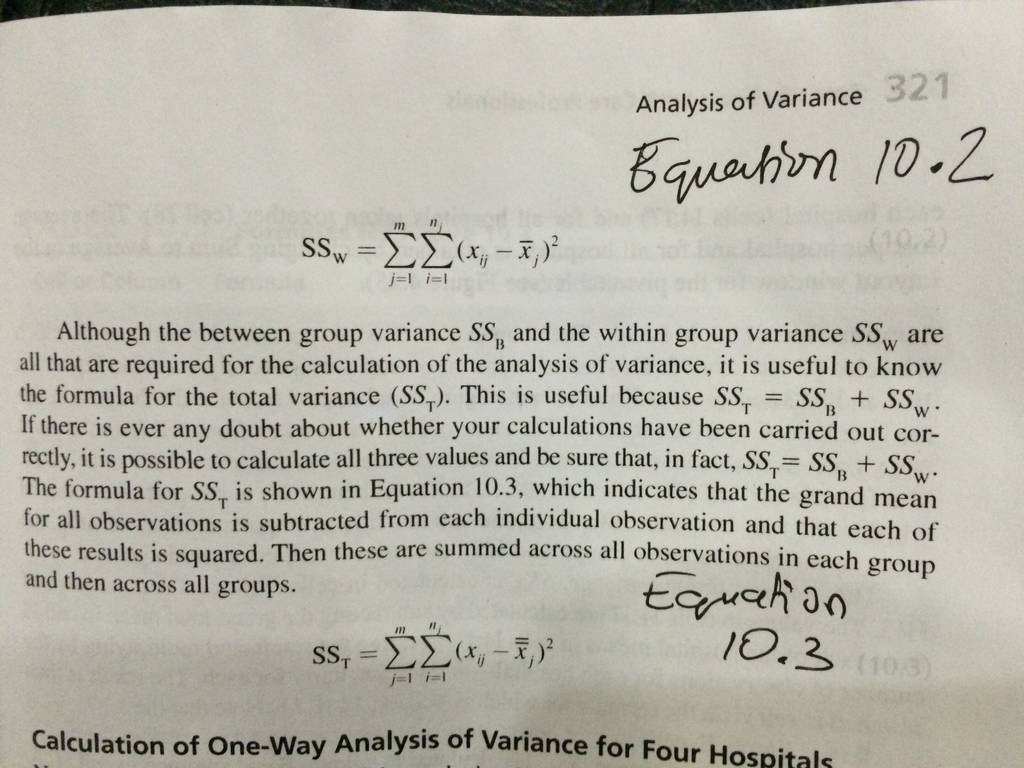
b. Use the results of the pivot table from (a) and the formula in Equation 10.2 to calculate the within groups sums of squares (SS w) for the costs in the four hospitals.
c. Use the formula in Equation 10.3 to calculate the total sum of squares (SS T) for the costs in the four hospitals.
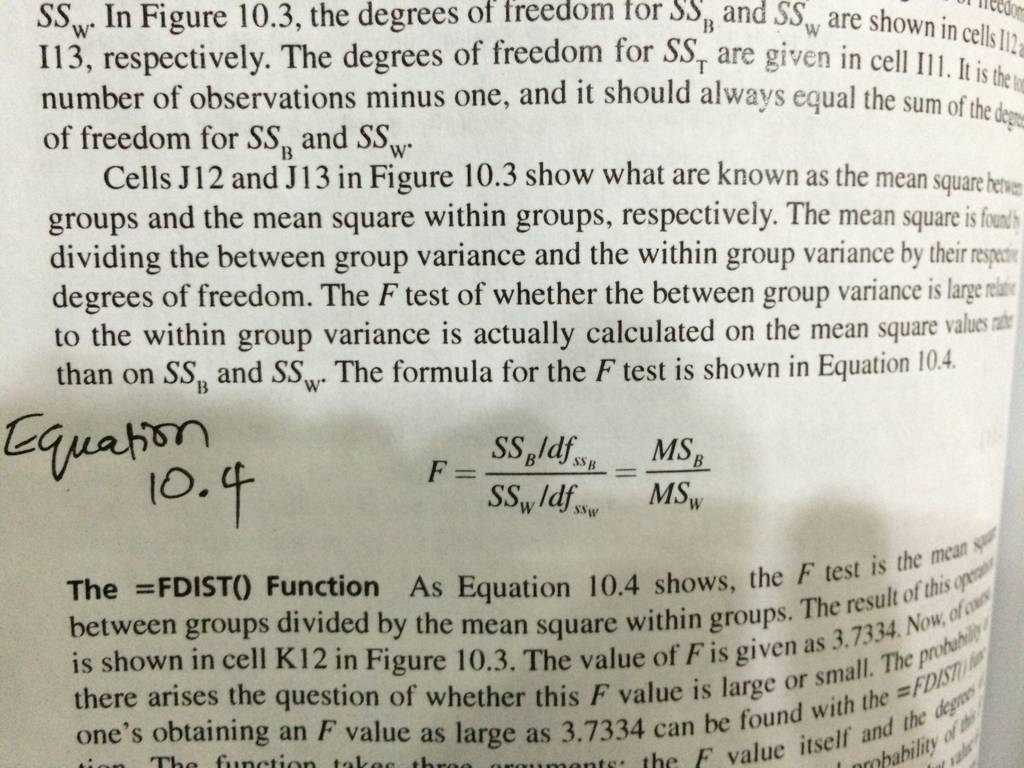
d. Determine the appropriate degrees o freedom and use the formula in Equation 10.4 to calculate the F value for a test of the null hypothesis tat the mean costs in the four hospitals are all the same.
e. Use the =FDIST( ) function to obtain the probability of the F value and draw the appropriate conclusion in regard to the null hypothesis.
(I also attached a picture of Exercises 10.1, #1 for better understanding).
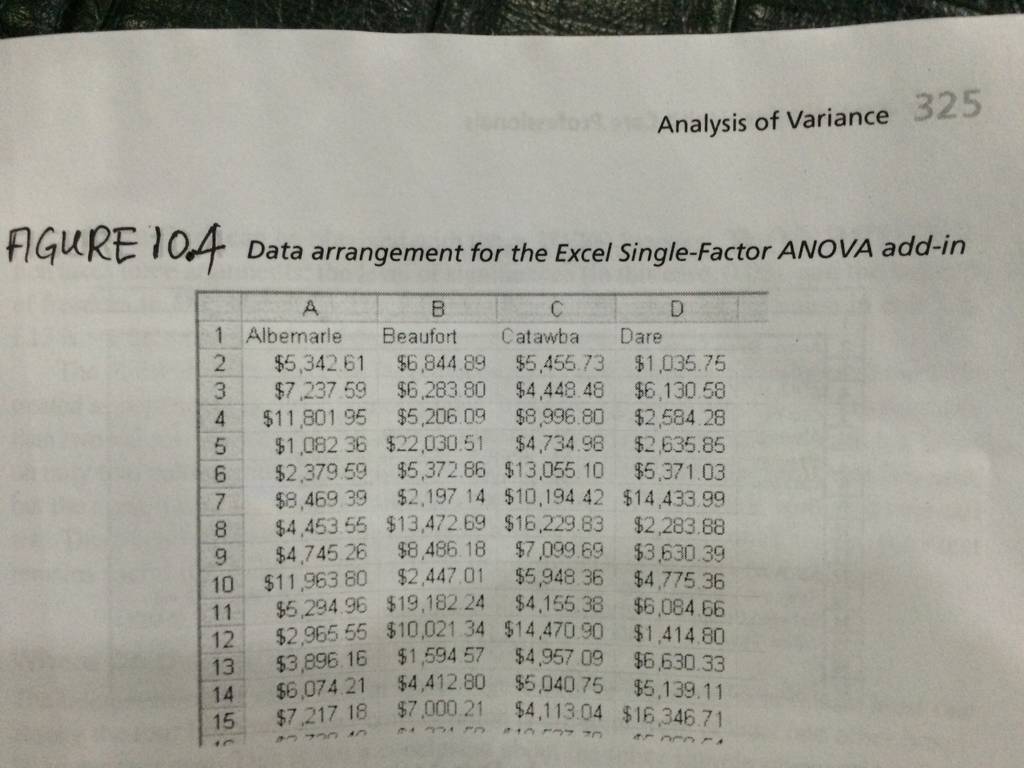
3. On a fresh spreadsheet, rearrange the data on the Costs worksheet of Chpt 10-1.xls into four columns, as shown in Figure 10.4.
a. Use the ANOVA: Single-Factor data analysis add-in to carry out the analysis of variance
b. Confirm that the results are the same as those obtained in Exercise 1.
Exercises 10.3
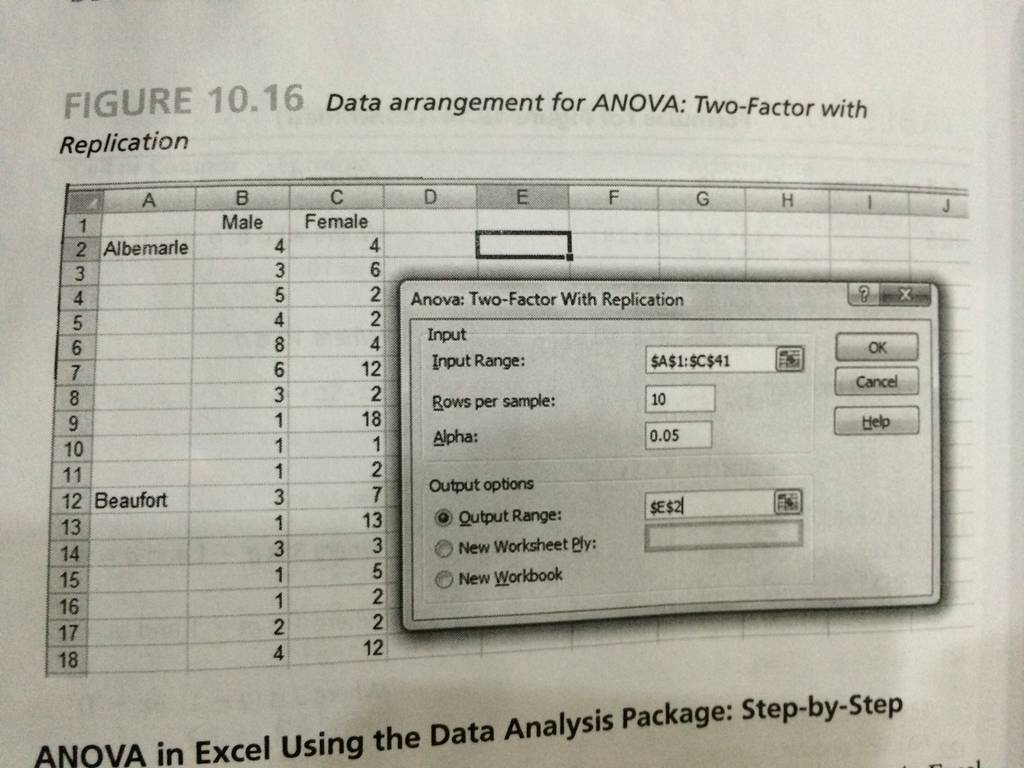
3. Rearrange the data for hospital LOS as given in Figure 10.16 and carry out the analysis of variance using he ANOVA: Two-factor with Republican add-in. Confirm that the results are the same as those found in Exercise 1.
 12 years ago
 60
60
Purchase the answer to view it

 nancy2014-3_part_1.xlsx
- nancy2014-3_part_2.xlsx
- Business Communications assignment
- Suppose that in the year 2000, a typical Social Security recipient consumed only Food and Housing. The price of housing...
- Law Assignment
- Research or Information Paper
- read the power point and write one page due in 4 hous
- Assignment for Nyanya
- Ecological Footprints
- pad515dq2
- ECO 500: Excel Assignment One
- Assignment Formal Sentence Outline,Research Draft 2,Research Paper Draft 3,Final Research Paper Draft