

EXCEL
 BXT6525
Memo
- Start Word and create a new blank document.
- Create a memo for the sales meeting as shown in the figure below, using the following formats:
- The company name should be in Arial 20-point, bold, purple font.
- The memo headings and text should be in Times New Roman, 12-point font, with left-aligned tab stops set to 1 inch.
- Replace Your Name Here with your name.
- The body text should be in Times New Roman, 12-point font, with bold text where indicated.
- Save the document as Meeting Memo.
Spreadsheet and Chart
- Start Excel and create a new blank workbook.
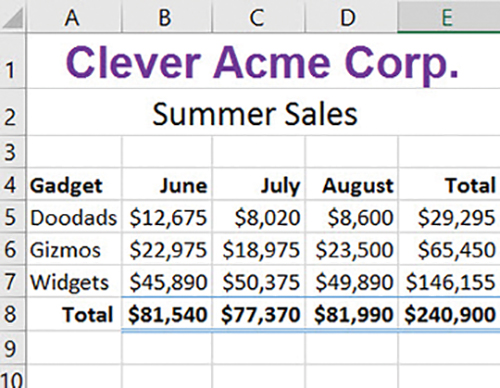
- Enter data as shown in the figure, using the following formats:
- The company name should be in Arial, 20-point, bold, purple font.
- The Summer sales title should be in 16-point font.
- The company name and Summer sales titles should be merged and centered.
- Column headings should be bold, and month headings right-aligned.
- The sales figures should be in Currency cell style with no decimal places.
- Formulas that use functions should be used for calculated totals.
- Cells B8 through E8 should be formatted in the Total cell style.
- Save the worksheet as Summer Sales.
- Create a column chart based on cells A4 through D7 that looks similar to the figure below.
- Select the 2-D Column Stacked Column style.
- After the chart is created, add data labels as shown in the figure.
- Edit the chart title as shown in the figure.
- Save the modified workbook. Your final spreadsheet should look similar to the figure below.
Presentation
- Start PowerPoint and create a new blank presentation.
- Change the theme of the presentation to Crop or another appropriate style if you don’t have Crop.
- Verify that slide 1 uses Title Slide layout and then enter text so that your slide looks similar to the figure below.
- Add a new slide 2 with a Blank layout, insert a table, and then add the sales data from the Summer Sales workbook. Size the table so that slide 2 looks similar to the figure below.
- Add a new slide 3 with a Blank layout and then insert a Stacked Column chart. Add the Summer sales data, format the title, and add the data labels to each column. Size the chart so that slide 3 looks similar to the figure below.
- Add a new slide 4 with a Picture with Caption layout and add content so that the slide looks similar to the figure below. Insert the Glow in the Dark Widget.jpg, a data file for this graded project.
- Add three more Picture with Caption layout slides to introduce the Lime Doodad, Buttercup Gizmo, and Black Widget products. Their corresponding image files are data files for this graded project. Your slides should look similar to the following figures.
- Add a new slide with a Title and Content layout and add text so that the slide looks similar to the figure below.
- Add a new slide with a Title Only layout. Insert text and a clip art picture that thanks employees for their hard work (use “thank you” as the search text when searching for the image). Size and position the picture to look similar to the figure below.
- Apply the Page Curl transition to all the slides.
- Apply the Grow & Turn animation to each of the bullet items on slide 8.
- Save the presentation as Fall Meeting, and then play the slide show from the beginning to check your presentation.
Scoring Guidelines
Rubric
Skill/Grading CriteriaExemplary
(4)Proficient
(3)Fair
(2)Poor
(1)Not Evident
(0)Create a memoA memo with all appropriate formatting, including tab stops, and accurate text, has been created.A memo with most of the correct content and formatting has been created.A memo with most of the correct content and some of the correct formatting has been created.A memo with little or no formatting and inaccurate content has been created.No attempt has been made to create a memo.Create a spreadsheetAll cell data is correctly formatted and the calculations use formulas with functions.Cell data is correctly formatted and some calculations use formulas with functions.Some cell data is correctly formatted and some calculations use formulas with functions.Some cell data is present with little or no formatting or use of formulas for calculation.No attempt to create a spreadsheet has been made.Create a chartA column chart based on the correct data, the specified style, and the correct labels has been created.A column chart based on the correct data, the specified style, but without the correct labels has been created.A column chart based on the correct data, with an unspecified style, and the correct labels has been created.A chart has been created without the correct data, specified style, or labels.No attempt to create a chart has been made.Create a presentationA presentation in the specified theme with 9 slides in the correct layouts has been created.A presentation in the specified theme with most of the slides in the correct layouts has been created.A presentation in the specified theme with some of the slides in the correct layouts has been created.A presentation with fewer than 9 slides in varying layouts has been created.No attempt has been made to create a presentation or fewer than 9 slides without some required content have been created.Insert Excel data as a linked object into slide 2The specified cell data has been pasted as a linked Excel Worksheet object into slide 2 and appropriately sized.The specified cell data has been pasted as an Excel Worksheet object without linking.The specified cell data has been copied and pasted as a PowerPoint table or embedded.An attempt has been made to paste some cell data into the presentation.No attempt has been made to add Excel spreadsheet data to the presentation.Paste an Excel chart into slide 3The specified Excel chart has been pasted into slide 3 and appropriately sized and positioned.The specified Excel chart has been pasted into slide 3 but not sized or positioned.The specified Excel chart has been recreated in the presentation by using the Insert Chart command.The chart has been inserted as an Excel Worksheet Object and displays the entire worksheet.No attempt has been made to add a chart to the presentation.Insert data file imagesImages have been inserted as specified.Most of the specified images have been inserted.Some of the specified images have been inserted.Few of the specified images have been inserted on any slide.No attempt has been made to add specified images to the presentation.Insert a clip art image into slide 9An appropriate clip art image has been inserted on slide 9 and appropriately sized and positioned.An appropriate clip art image has been inserted on slide 9 but may not be sized or positioned appropriately.N/AN/ANo attempt has been made to add an appropriate clip art image.Apply a transitionThe Page Curl transition has been applied to all slides.The Page Curl transition has been applied to two or more slides.The Page Curl transition has been applied to one slide only.The wrong transition has been applied.No attempt has been made to apply a transition to any of the slides.Apply animationsThe Grow & Turn animation has been applied to each bullet item separately.The Grow & Turn animation has been applied to all the bullet items together.A different animation has been applied to each bullet item separately.A different animation has been applied to all the bullet items together.No attempt has been made to apply an animation.
Submission Checklist
Before submitting your project, make sure you’ve correctly completed the following:
- Enter text in Word.
- Set tab stops.
- Apply formatting to text in Word.
- Enter and format data in Excel.
- Merge and center cells in Excel.
- Change the decimals displayed by numbers in Excel.
- Create a 2-D Column chart in the Stacked Column style.
- Modify the data labels of the chart.
- Change the layout of the specified slides.
- Apply a theme to the presentation.
- Add nine slides of different layouts to the presentation.
- Insert and format a table in a slide.
- Create and format a chart in a slide.
- Insert existing picture files into slides.
- Insert a clip art image from the Internet into a slide.
- Apply a transition to all slides.
- Apply an animation to bullet points separately.
- View a slide show from the beginning.
What to Submit
You will submit three files for this project:
- Meeting Memo.docx
- Summer Sales.xlsx
- Fall Meeting.ppt
Be sure to keep a backup copy of any files you submit to the school!
 6 years ago
 10
10
Purchase the answer to view it

 AnswerDocument.docx