


Econ 4th Edition Chapter 12, Problem 1P
 Damien Scott
 (Not rated)
(Not rated)
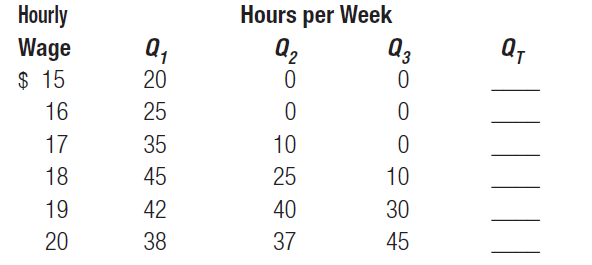
The following table shows the hours per week supplied to a particular market by three individuals at various wage rates. Calculate the total hours per week (QT) supplied to the market.
Why does the quantity supplied tend to increase with the hourly wage? Which individuals, if any, have backward-bending supply curves in the wage range shown? Does the market supply curve bend backward in the wage range shown in the table?
 9 years ago
The following table shows the hours per week supplied to a particular market by three individuals at various wage rates. Calculate the total hours per week (QT) supplied to the market. Why does the quantity supplied tend to increase with the hourly wage?
NOT RATED
Purchase the answer to view it


