

DISCUSSION 2
 obaogutapi
From your survey results:
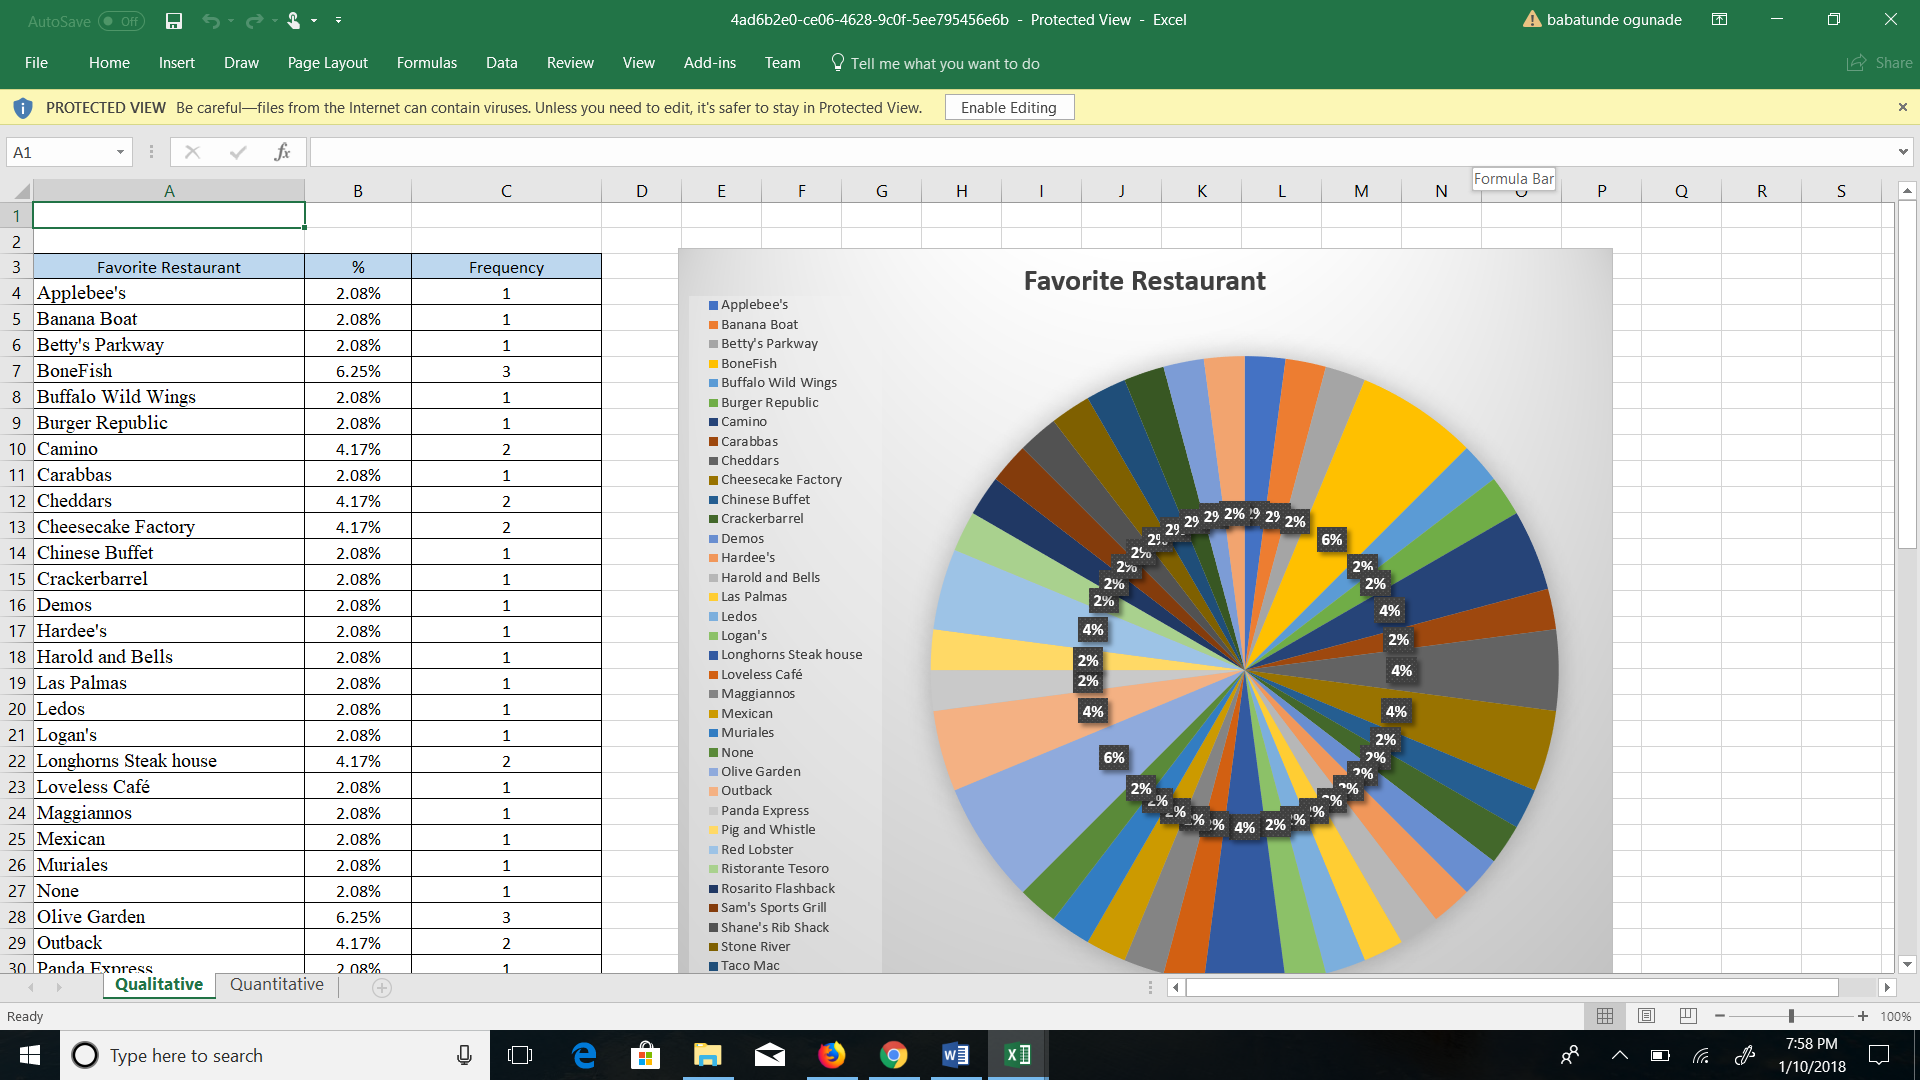
- Choose one of your qualitative columns of data and make an appropriate graph using Excel, an on-line tool, etc. Do not submit this by hand. Discuss why you chose the particular graph.
- Choose one of your quantitative columns of data and make an appropriate graph using Excel, an on-line tool, etc. Do not submit this by hand. Discuss why you chose the particular graph.
 8 years ago
 5
5
Answer(2)![blurred-text]()
![blurred-text]()

Purchase the answer to view it

NOT RATED
 order_39321_Discussion2.doc
- order_39321_Revised.doc
Purchase the answer to view it
NOT RATED
other Questions(10)
- Car Rental Application
- programing hw
- RESPOND TO PEERES DISCUSSION 2
- result and conclusion
- The Role of Weak Institutions in Underdevelopment
- Grand Canyon FIN 450 Full Course - (All Discussions and All Chapters Problems) 2016
- Zimbardo experiment
- Help with assignment
- paraphrase homework for " tom mutunga" need it in 6 hours
- Section 2: Marketing Budget (MS Excel worksheets template)