


Buss1020 assignment 400 word + table (due in 12 hours)
 fanbing910724
Data summary and visualization
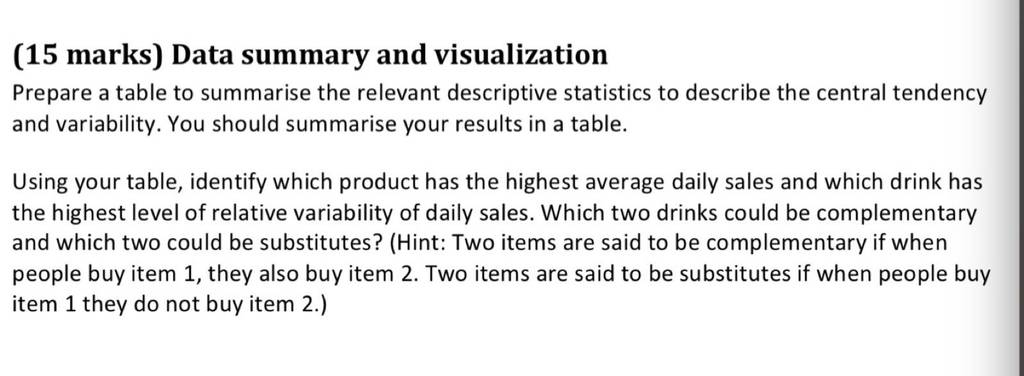
Prepare a table to summarise the relevant descriptive statistics to describe the central tendency
and variability. You should summarise your results in a table.
Using your table, identify which product has the highest average daily sales and which drink has
the highest level of relative variability of daily sales. Which two drinks could be complementary
and which two could be substitutes? (Hint: Two items are said to be complementary if when
people buy item 1, they also buy item 2. Two items are said to be substitutes if when people buy
item 1 they do not buy item 2.)
please also including the graph table, it's important as well.
 9 years ago
 20
20
Answer(1)![blurred-text]()

Purchase the answer to view it

NOT RATED
 DescriptiveAnalysis.docx
other Questions(10)
- Logistics Management Homework
- na
- 2paper
- Compare and contrast Strategic, tactical and actionable intelligence to addressing violent street crime (robbery, murder, aggravated assaults).
- Hello I need a paper done.
- LR for Nyanya only
- due in 2 hours
- Professional, Ethical, and Legal Aspects of Error Disclosure
- Finance Questions
- HCA 331 Introduction to Health Care Education

