

Business Assignment
 HelpMeGrad
Week 1 Assignment
PLEASE NOTE: MUST BE 100% ORIGINAL WORK, NEVER SOLD BEFORE! PLAGIARISM WILL BE DISPUTED!
Please check for plagiarism before sending:
Question 1
The following information regarding the ten richest Americans was reported in a recent issue of Forbes.

- How many elements are in the above data set?
- How many variables are in this data set?
- How many observations are in this data set?
- Which variables are categorical and which are quantitative?
Question 2
A sample of the ages of 10 employees of a company is shown below.
20 30 40 30 50
30 20 30 20 40
- Using a method of your choosing, construct a dot plot for the above data.
Question 3
The following data shows the price of PAO, Inc. stock over the last eight months.
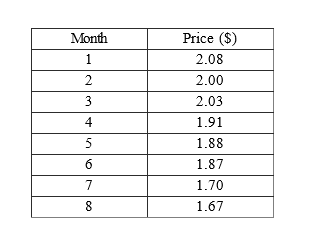
- Develop a scatter diagram and draw a trend line through the points.
- What kind of relationship exists between stock price and time (negative, positive, or no relation)?
 8 years ago
 10
10
Answer(1)![blurred-text]()
Purchase the answer to view it

NOT RATED
 Workings.xlsx
- Solutions.docx
- tre.pdf
other Questions(10)