


lOMoARcPSD|51793812
lOMoARcPSD|51793812
PSY – 260 Statistical Literacy
Chapter 5 Soomo webtext
5.1 when can researchers make casual claims about their data?
- when data is produced by manipulating variables
5.2
A) what is one realistic example of an "r" v alue that shows a strong. - b. -0.89
B).
lOMoARcPSD|51793812
C).
5.3
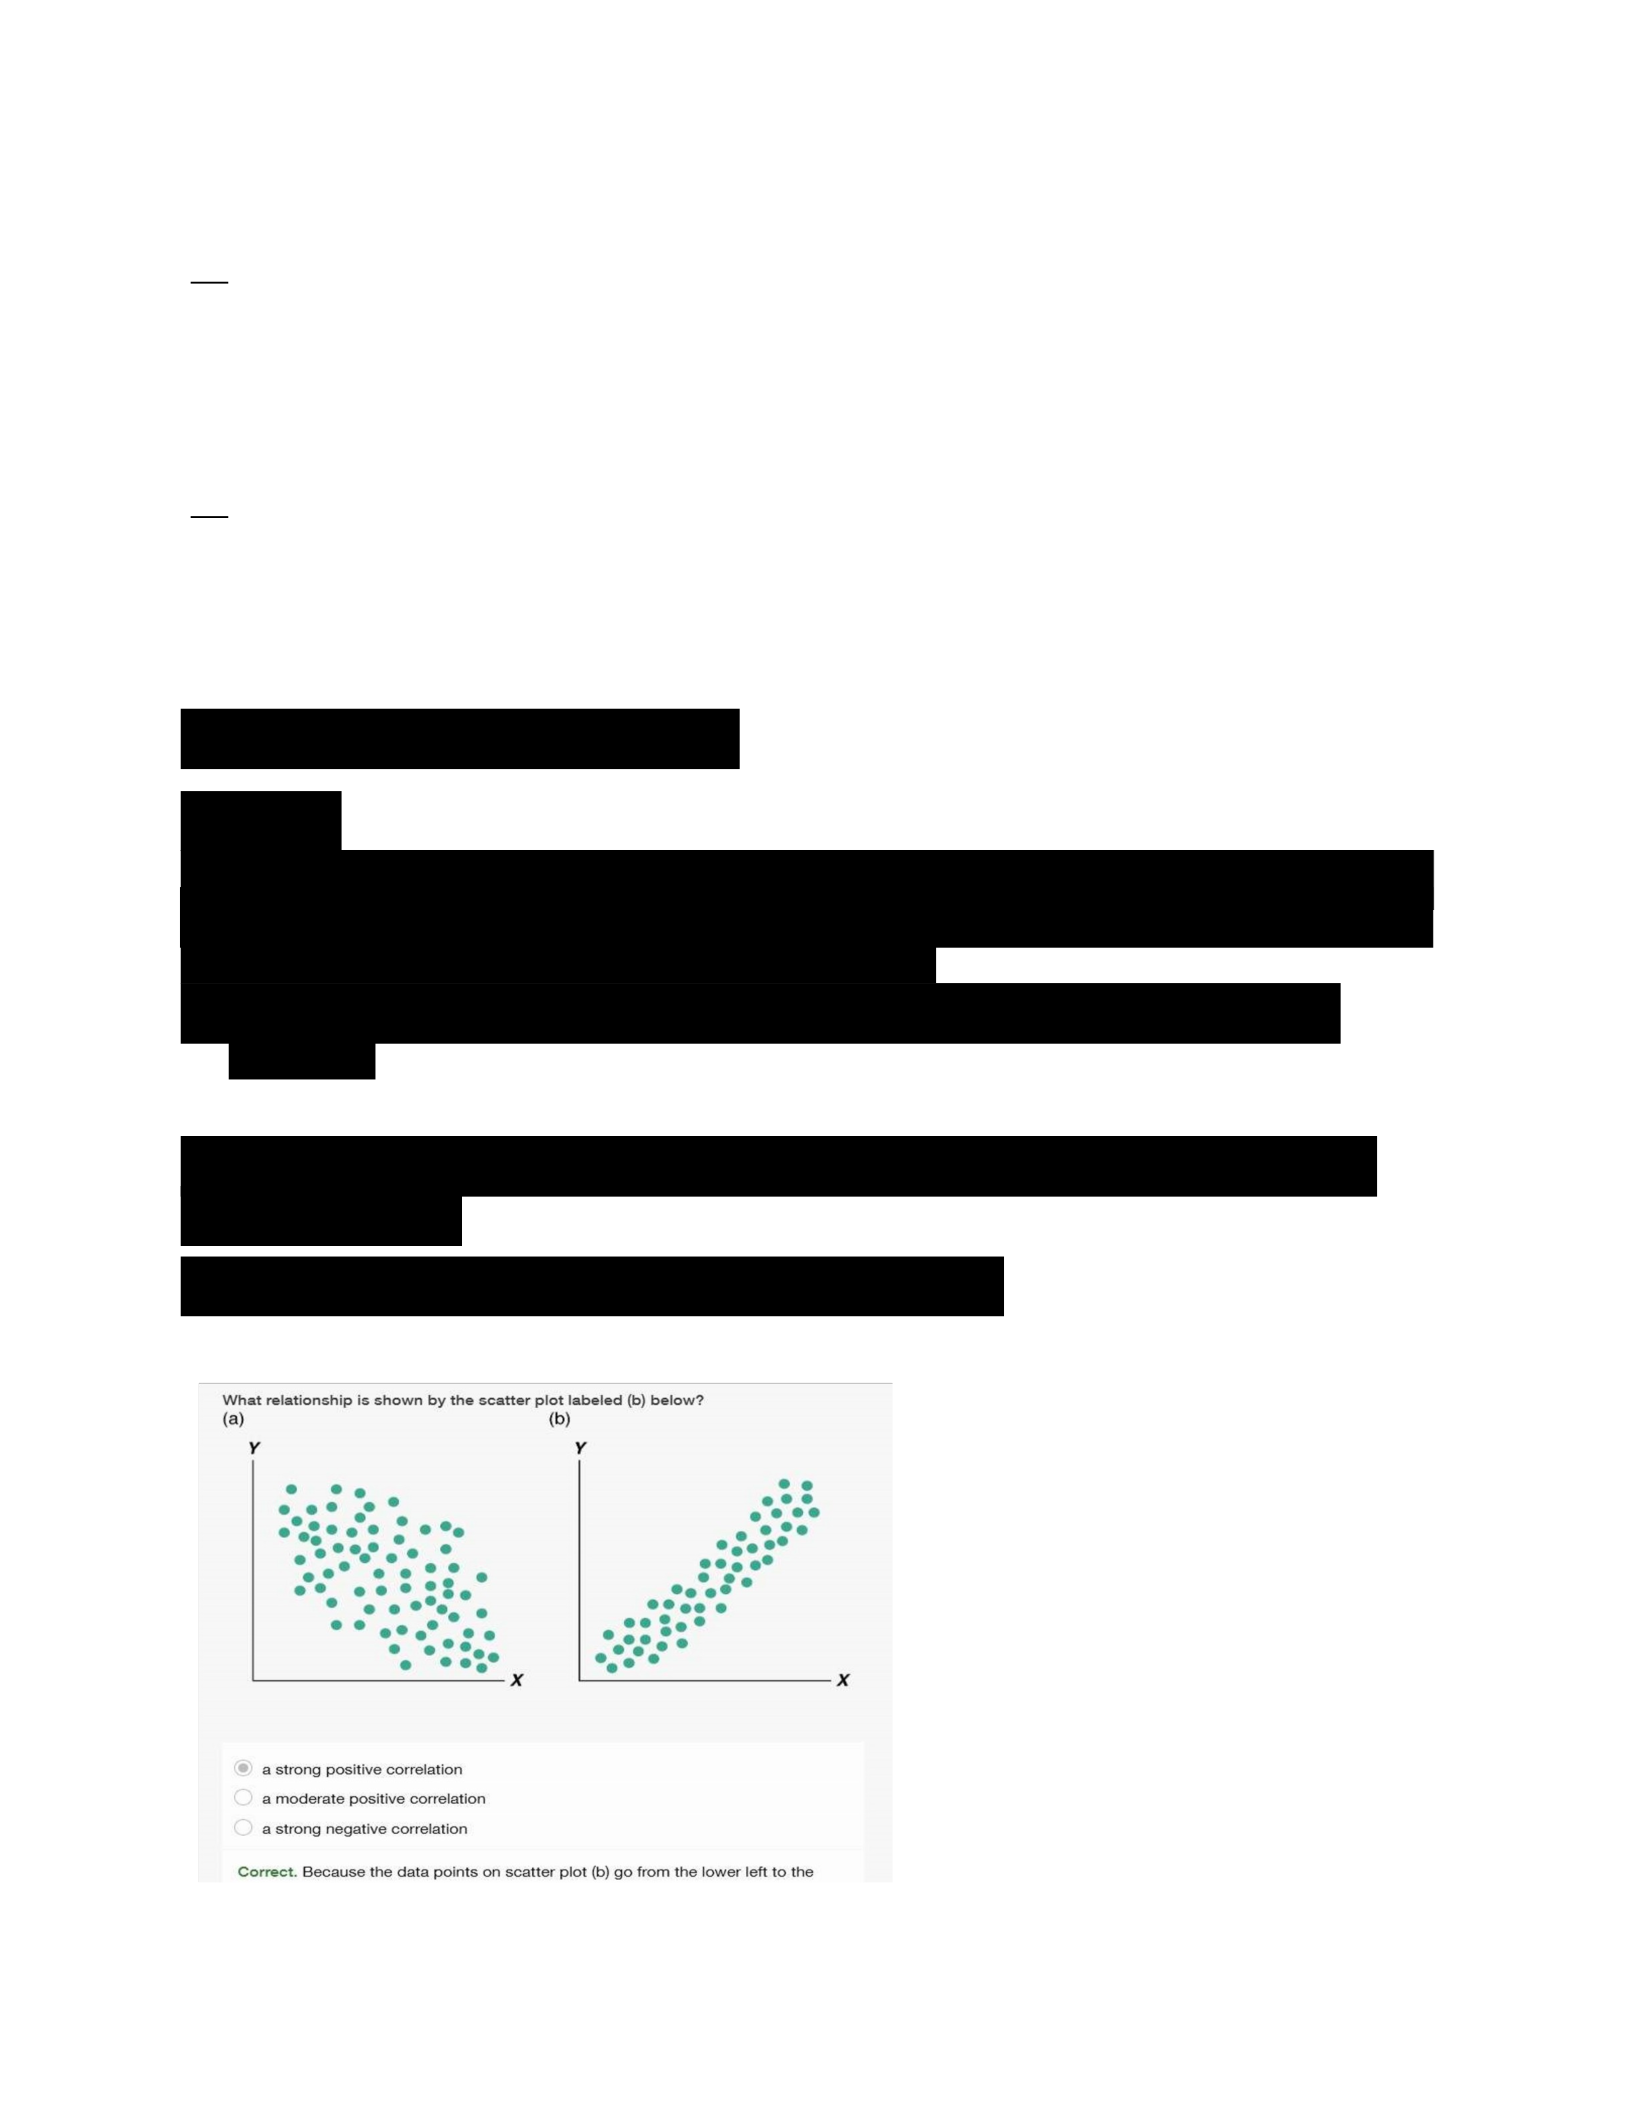
How does a scatter plot help researchers identify whether there is a relationship between variables?
- it shows the shape of the data.
5.4
Under what conditions would a correlation coefÏcient yield a negative value?
- when, on average, people who score low on x score high on y


