


lOMoARcPSD|54384572
Selling Price and Area Analysis for D.M. Pan National Real Estate Company 1
Report: Selling Price and Area Analysis for D.M. Pan National Real Estate Company
Southern New Hampshire University
lOMoARcPSD|54384572
Selling Price and Area Analysis for D.M. Pan National Real Estate Company 2
Introduction
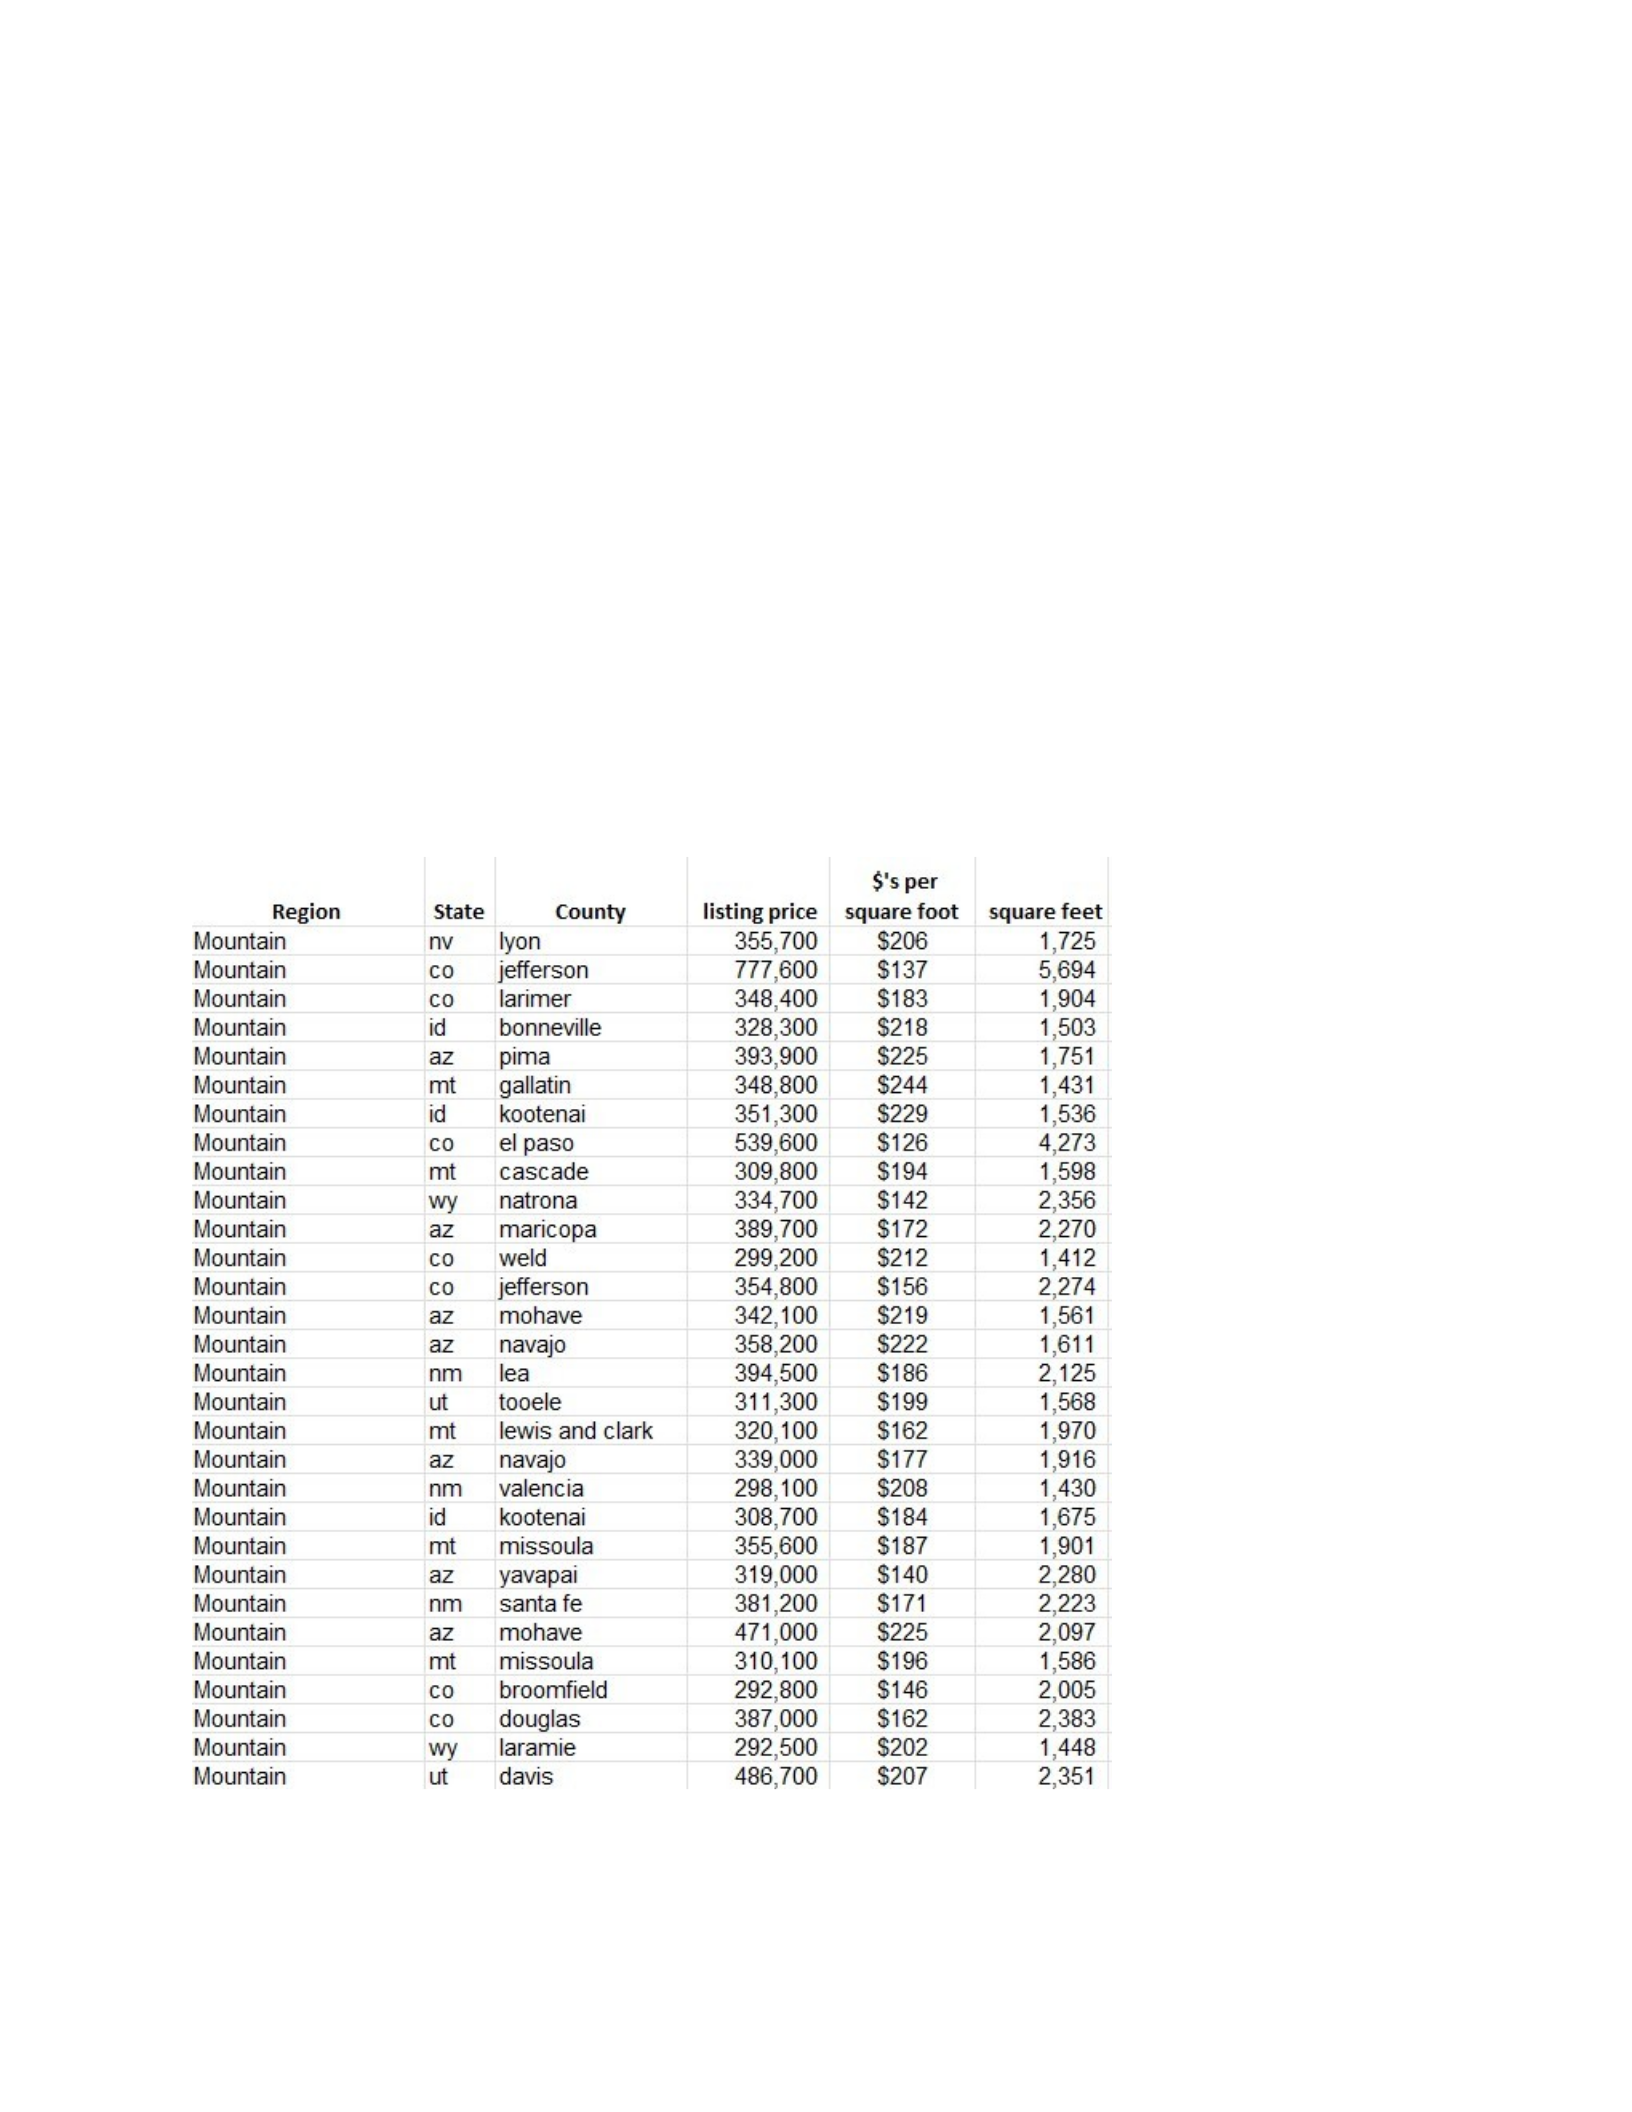
This report will provide analyzed data of the connection between the listing price and the
square feet of 30 houses in the Mountain region of the United States. The 30 houses that we are
using for this are a random sample to help to minimize any bias to allow for a more accurate and
reliable analysis. Additionally, the sample will also be compared to national data to assess how
square footage may affect the pricing on a house. Generate a Representative Sample of the
Data
lOMoARcPSD|54384572
Selling Price and Area Analysis for D.M. Pan National Real Estate Company 3
Analyze Your Sample
The sample for the Mountain region was selected out of 99 listings completely randomly.
This was done using Excel’s random function to give each line a random number and then was
filtered from lowest to highest of those random numbers, which I selected the 30 lowest
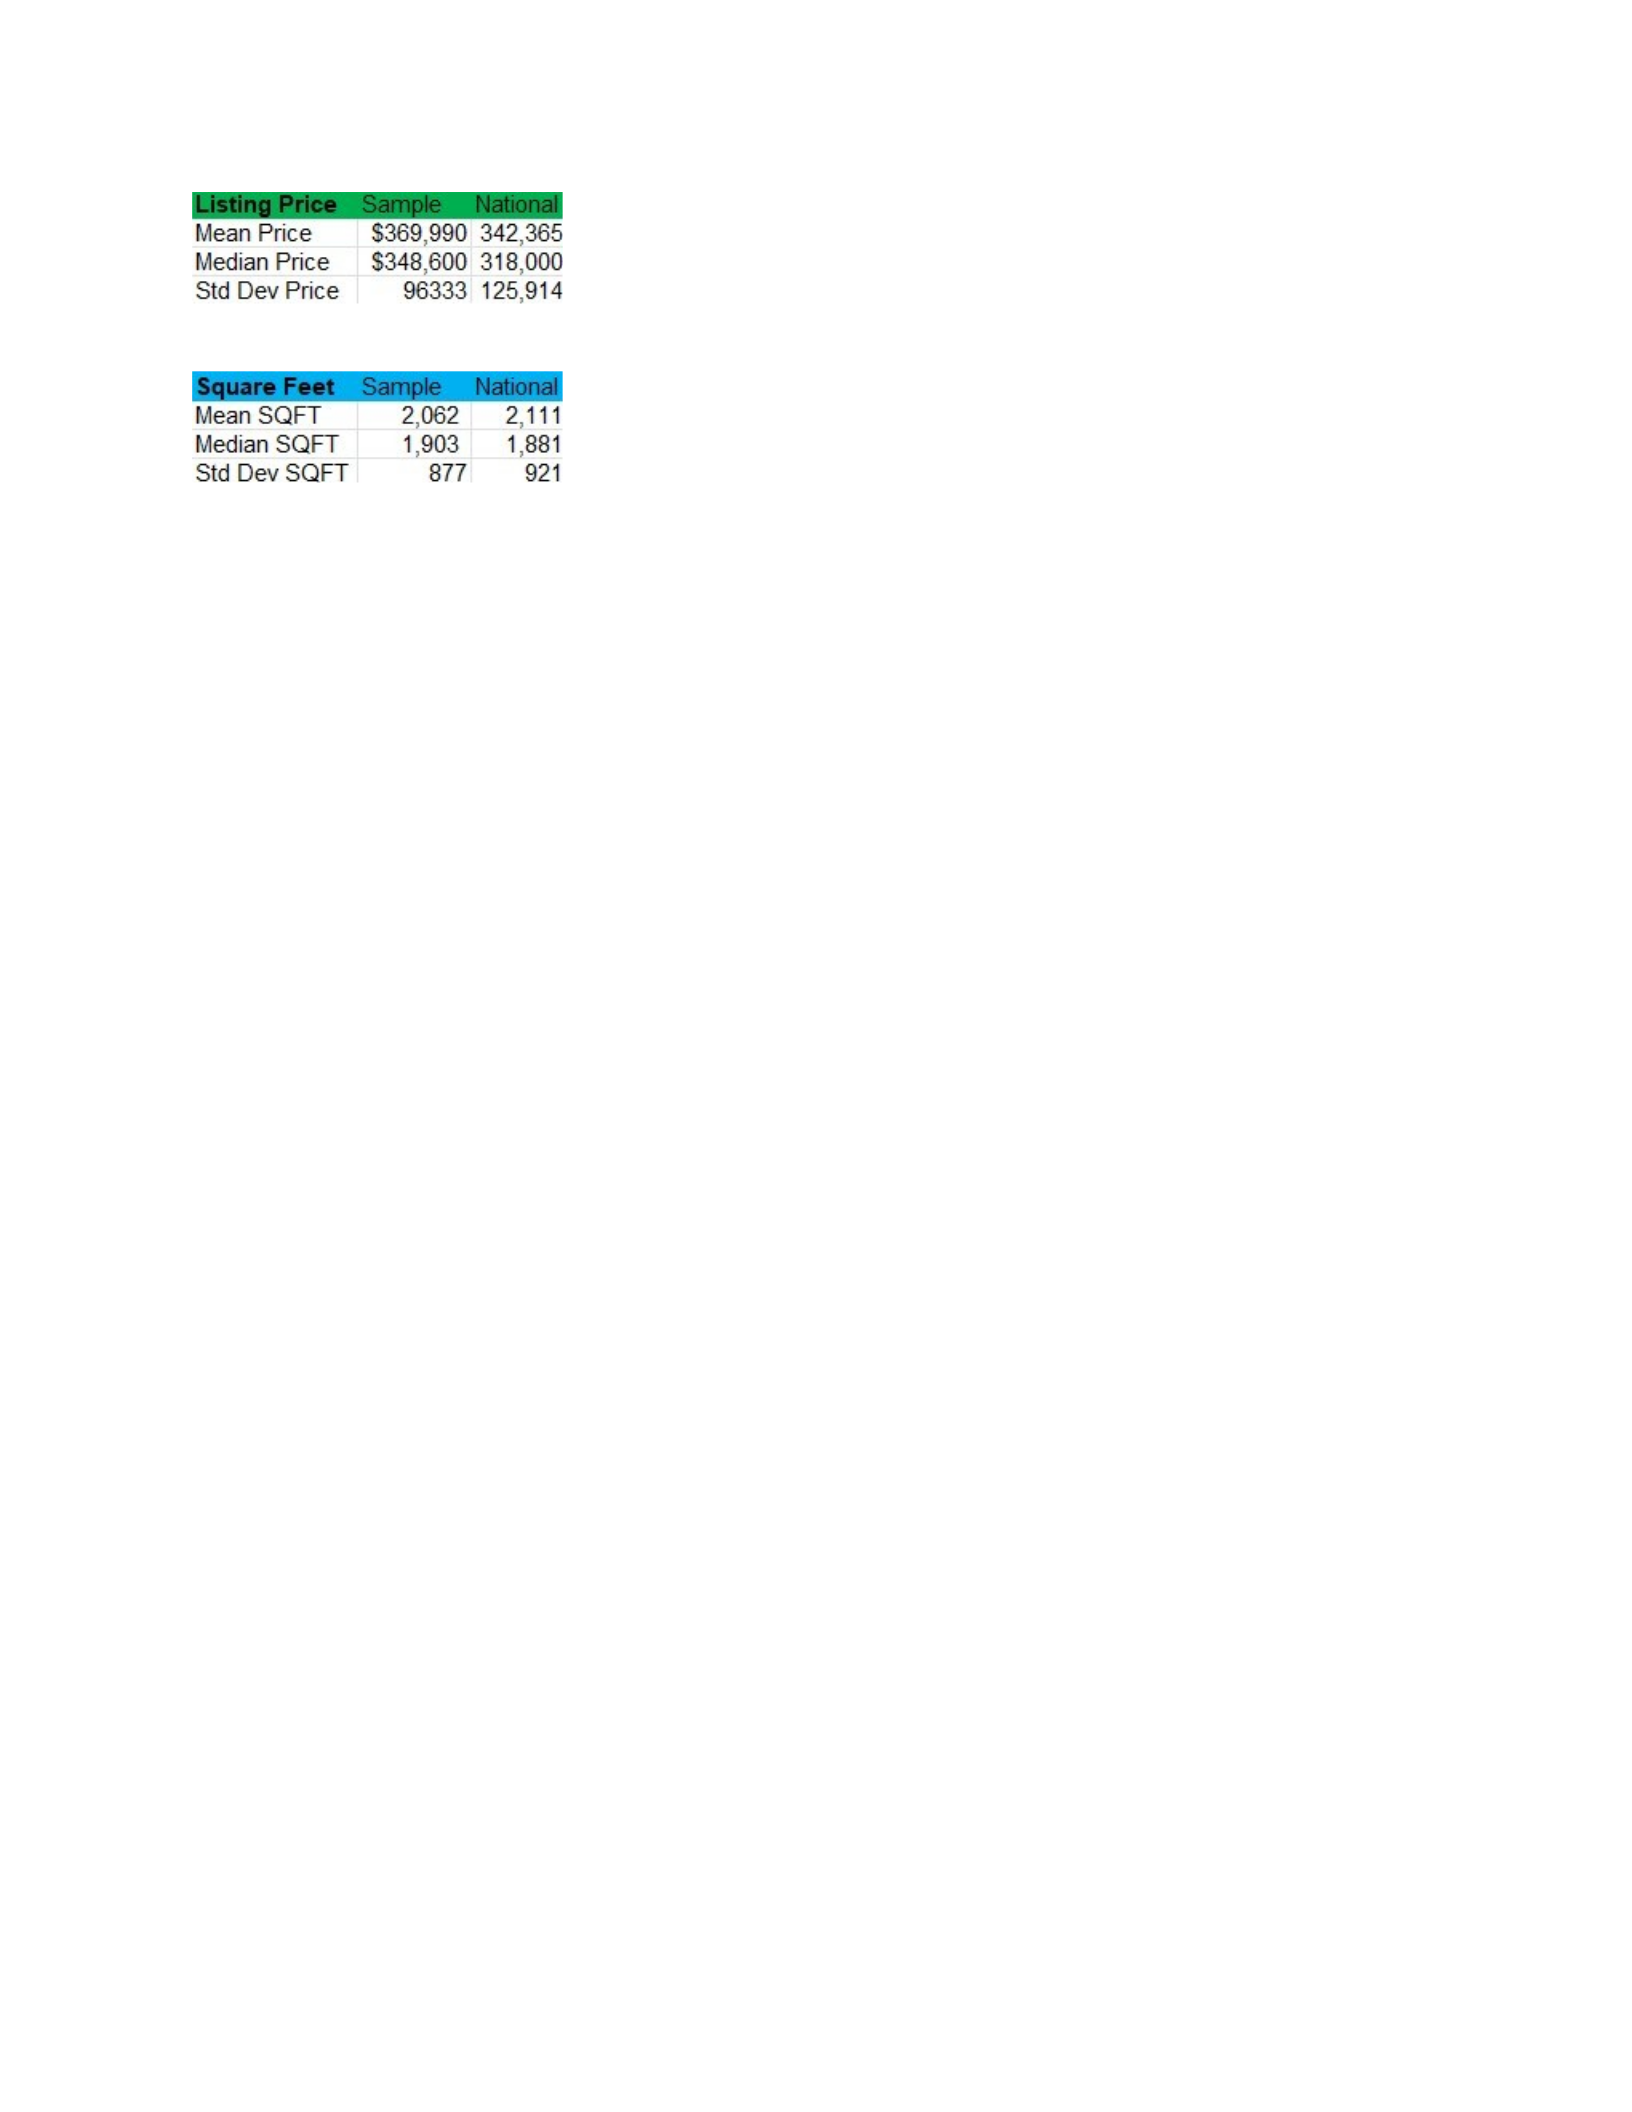
numbers. In comparing the Mountain region sample to the National data, it was found that the
mean and median listing price for the sample was higher, but the sample’s standard deviation
was lower. The standard deviation could be lower because the regional sample could have less
houses in its sample and is not as widespread as the national sample. Also in recent months, per
the news Utah which is part of this sample has had a large increase in their housing costs, this
could be why the mean and median were higher. In comparing square feet, the numbers were
very close together with the mean and standard deviation in the regional sample were slightly
lower than the national, and the median was slightly higher. This data would show that square
footage is a bit smaller in the regional sample, but it does not vary as much. With this analysis it
shows that houses in the regional sample tend to have a higher listing price than the national on
average, but it does have less variation. With square footage it is similar, showing that even
though the listing prices are higher in the regional sample, the house size is comparable.
lOMoARcPSD|54384572
Selling Price and Area Analysis for D.M. Pan National Real Estate Company 4
Generate Scatterplot
Observe Patterns
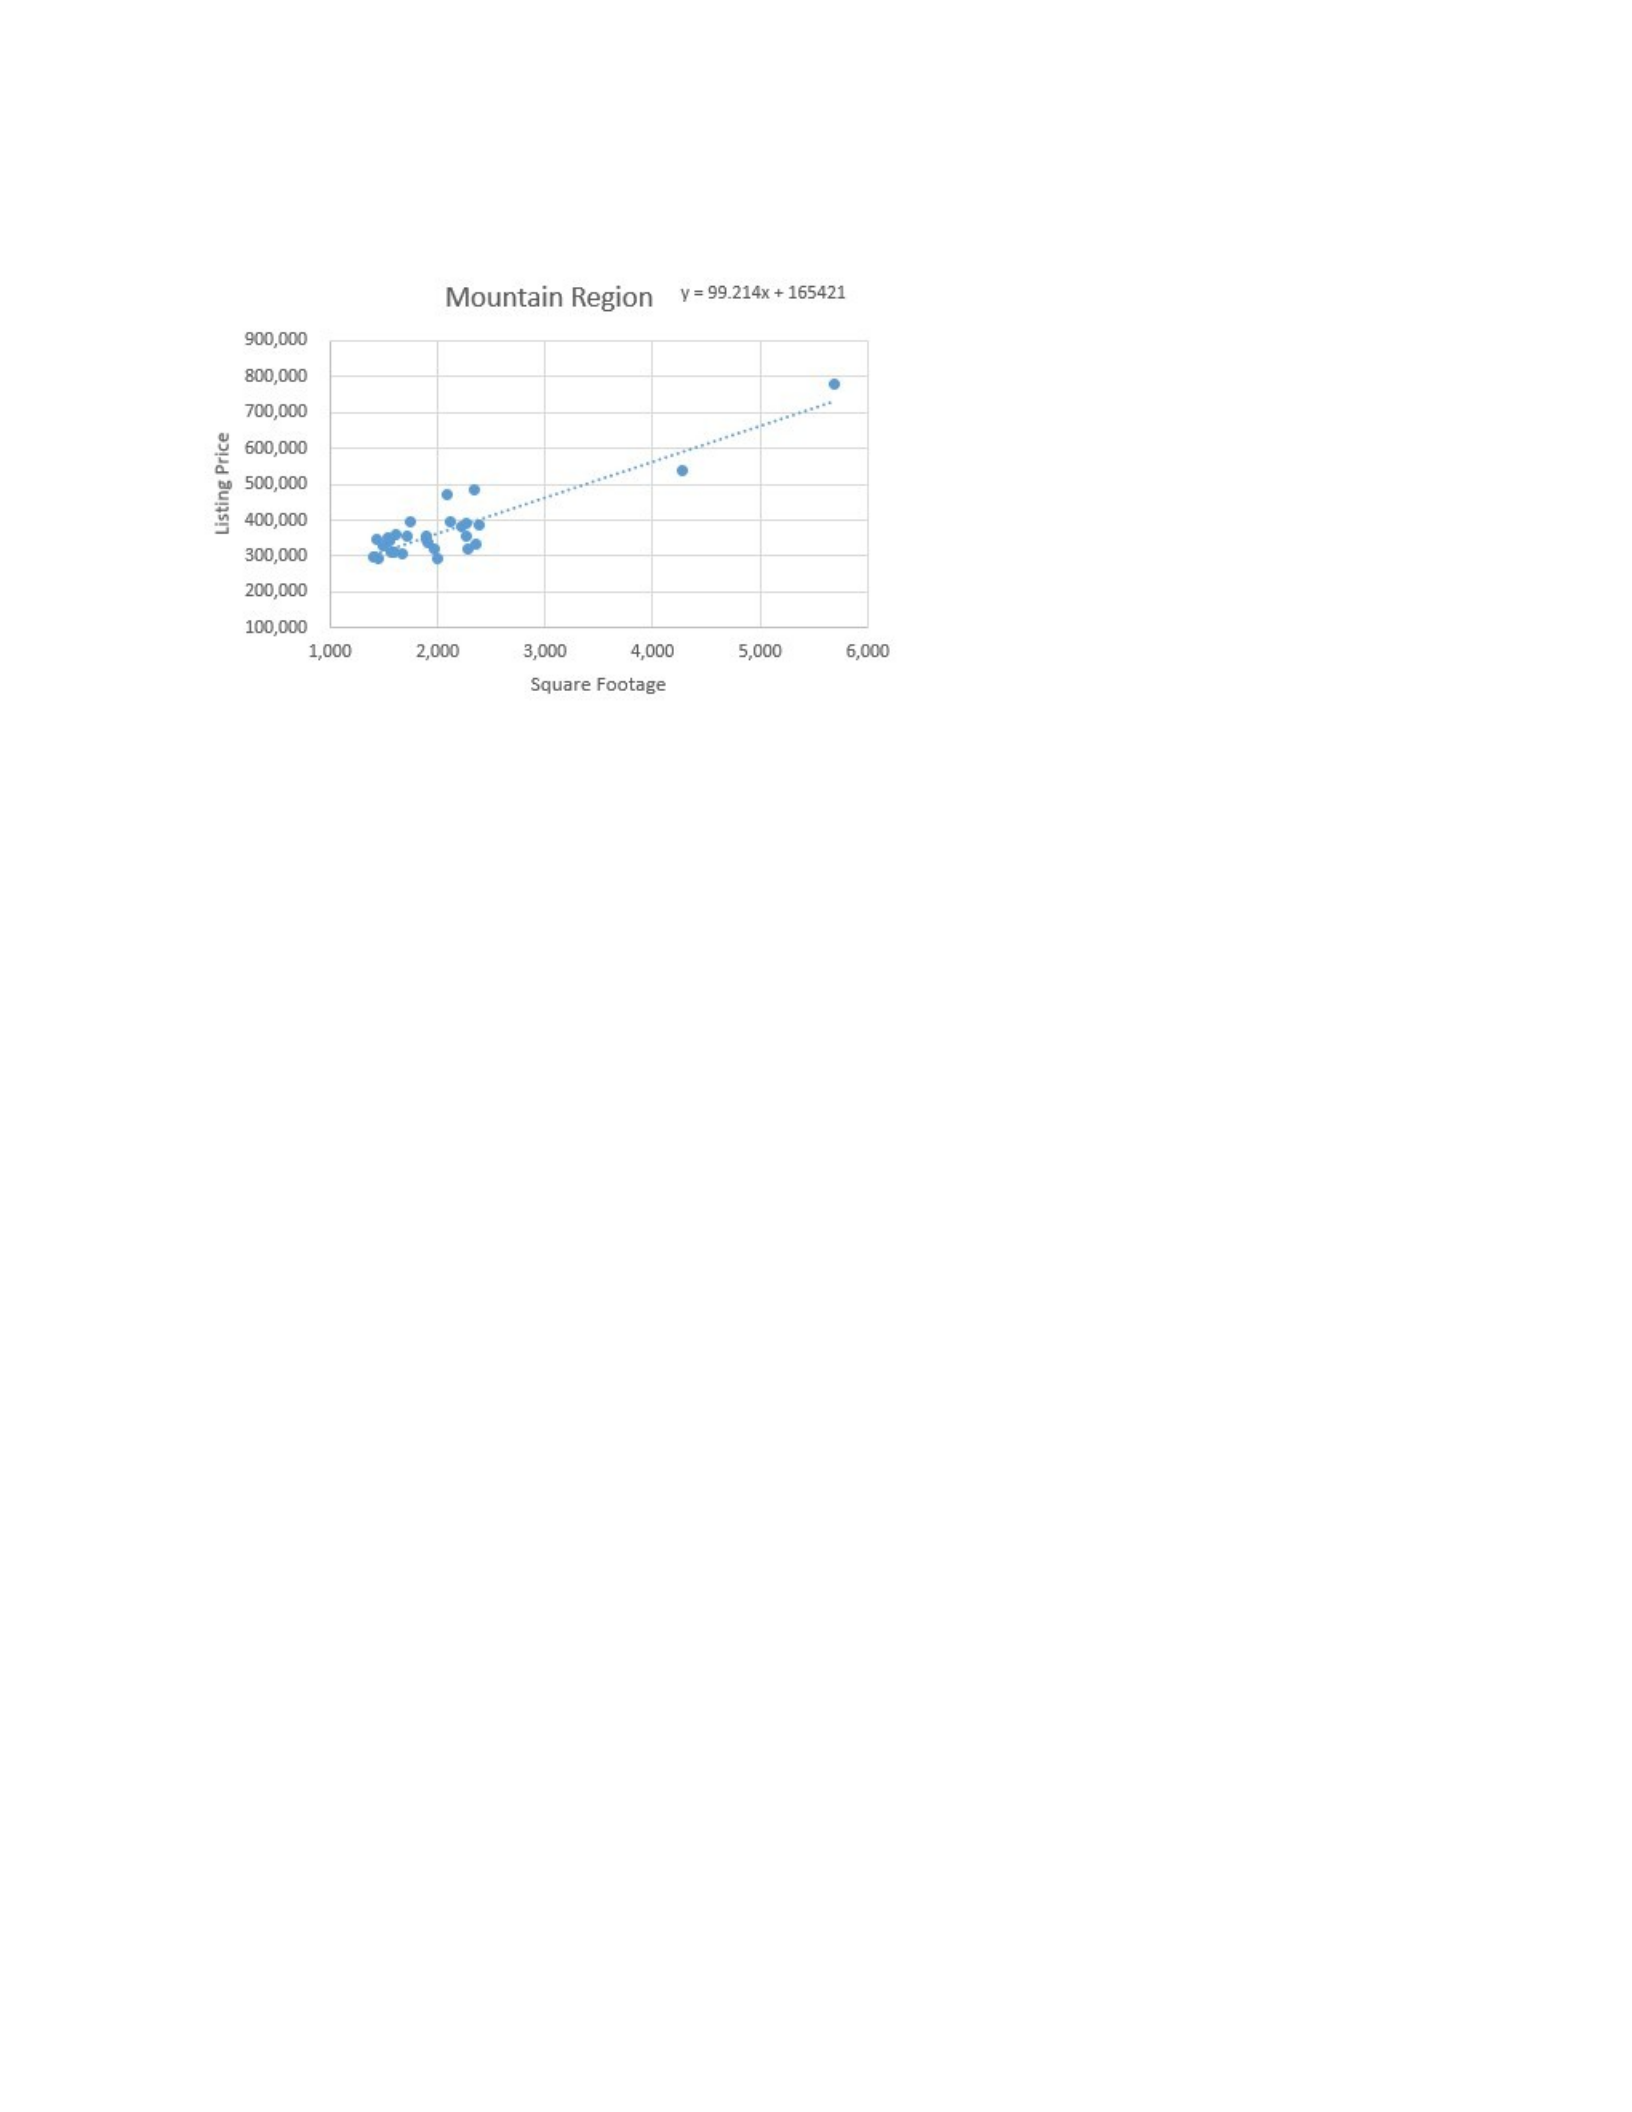
In the above scatter plot the x-axis is the independent variable, which is the square
footage of houses in the sample. The y-axis represents the dependent variable, which is listing
price. Independent variables are used to make predictions for dependent variables and in this
case, it seems to be correct as square footage seems to influence the listing price of a house no
matter which sample you are reviewing.
There is an association between x (square footage) and y (listing price). It is a positive
association. As x value was increasing, y was increasing overall.
The data does appear to have a linear pattern, which is also indicated as we were able to
have a linear regression equation. With the equation shows the slope to be 99.214, which means
for every one-unit x increases y will increase 99.214. With that if I were to sell an 1800 square
foot house I would list it for $344,006 per the equation, being that is an odd listing price I would
probably list it at $345,000 to have a more uniform price.
It also shows a moderate positive correlation on the line. Most of the data points did
follow the trend of the linear line, but there were few outliers. Being that the regional sample

lOMoARcPSD|54384572
Selling Price and Area Analysis for D.M. Pan National Real Estate Company 5
only included 30 houses randomly, I believe that a few of the larger houses that would have a
higher listing price are in the sample causing those outliers. Being I am from the Mountain
region I am also aware of other reason that would cause these to have a higher listing price
making them outliers. The other reason could be location, there is many sought after locations
for skiing or outdoor activities in the Mountain region that people will pay a large amount of
money to have a house in said areas. Those houses also tend to be larger than the average size
house in the region.
In comparing the Mountain regional sample and the National sample it is showing that
house size is similar, but the listing prices in the regional sample are higher. The standard
deviation was lower on for both listing price and square footage for the regional sample. Future
research could provide the factors for why there is a difference in pricing.

