


Hypothesis Testing for Regional Real Estate Company 1
Hypothesis Testing for Regional Real Estate Company
Emily Higdon
Southern New Hampshire University

Hypothesis Testing for Regional Real Estate Company 2
Introduction
The purpose of this analysis is to find the average cost per square foot of home sales for the
Pacific region for the Regional Real Estate Company. I will take that information to the
salesperson so that he can make sure that he can make the statement (that the average cost per
square foot is less than $280) before asking for the advertisement text to be changed. To get a
random sample of 750, I first made a column with the label random. I then used the =RAND()
function, which created an entire column of random numbers in each of the cells. I highlighted
every cell in that column in order to be able to sort the data from that column. I then took the first
751, deleted anything under that, and the remaining cells 2-751 is my random sample of 750.
Hypothesis Test Setup
The population parameter is the mean cost per square foot in the Pacific Region. Average
is what is being tested in the hypothesis test. I will use mu to represent the population mean cost
per square footage in the Pacific Region. The mean cost per square foot based on the new
advertisement is $280, and the salesperson made the claim that the mean cost in the Pacific
regions is less than $280.
The null hypothesis (H0) is that the mean cost per square foot in the Pacific region is
greater than or equal to $280. The alternative hypothesis (Ha) is that the mean cost per square
foot in the Pacific region is less than $280. The type of test I will be using is the left-tailed test. A
two-tailed test is not correct for this scenario because the claim would have had to be that the
mean cost per square foot in the Pacific region is not equal to $280.
Data Analysis Preparations
Hypothesis Testing for Regional Real Estate Company 3
The sample size for my data set is 750. For calculating the mean, I will use the
=average() function and then highlight column E, which gave me a mean of $263. To get the
median I used the function =median and highlighted column E, which gave me a median of
$202. To get the standard errorI used the function =STDEV.S divided by SQRT of 750, which
gave me the standard deviation of 5.804.
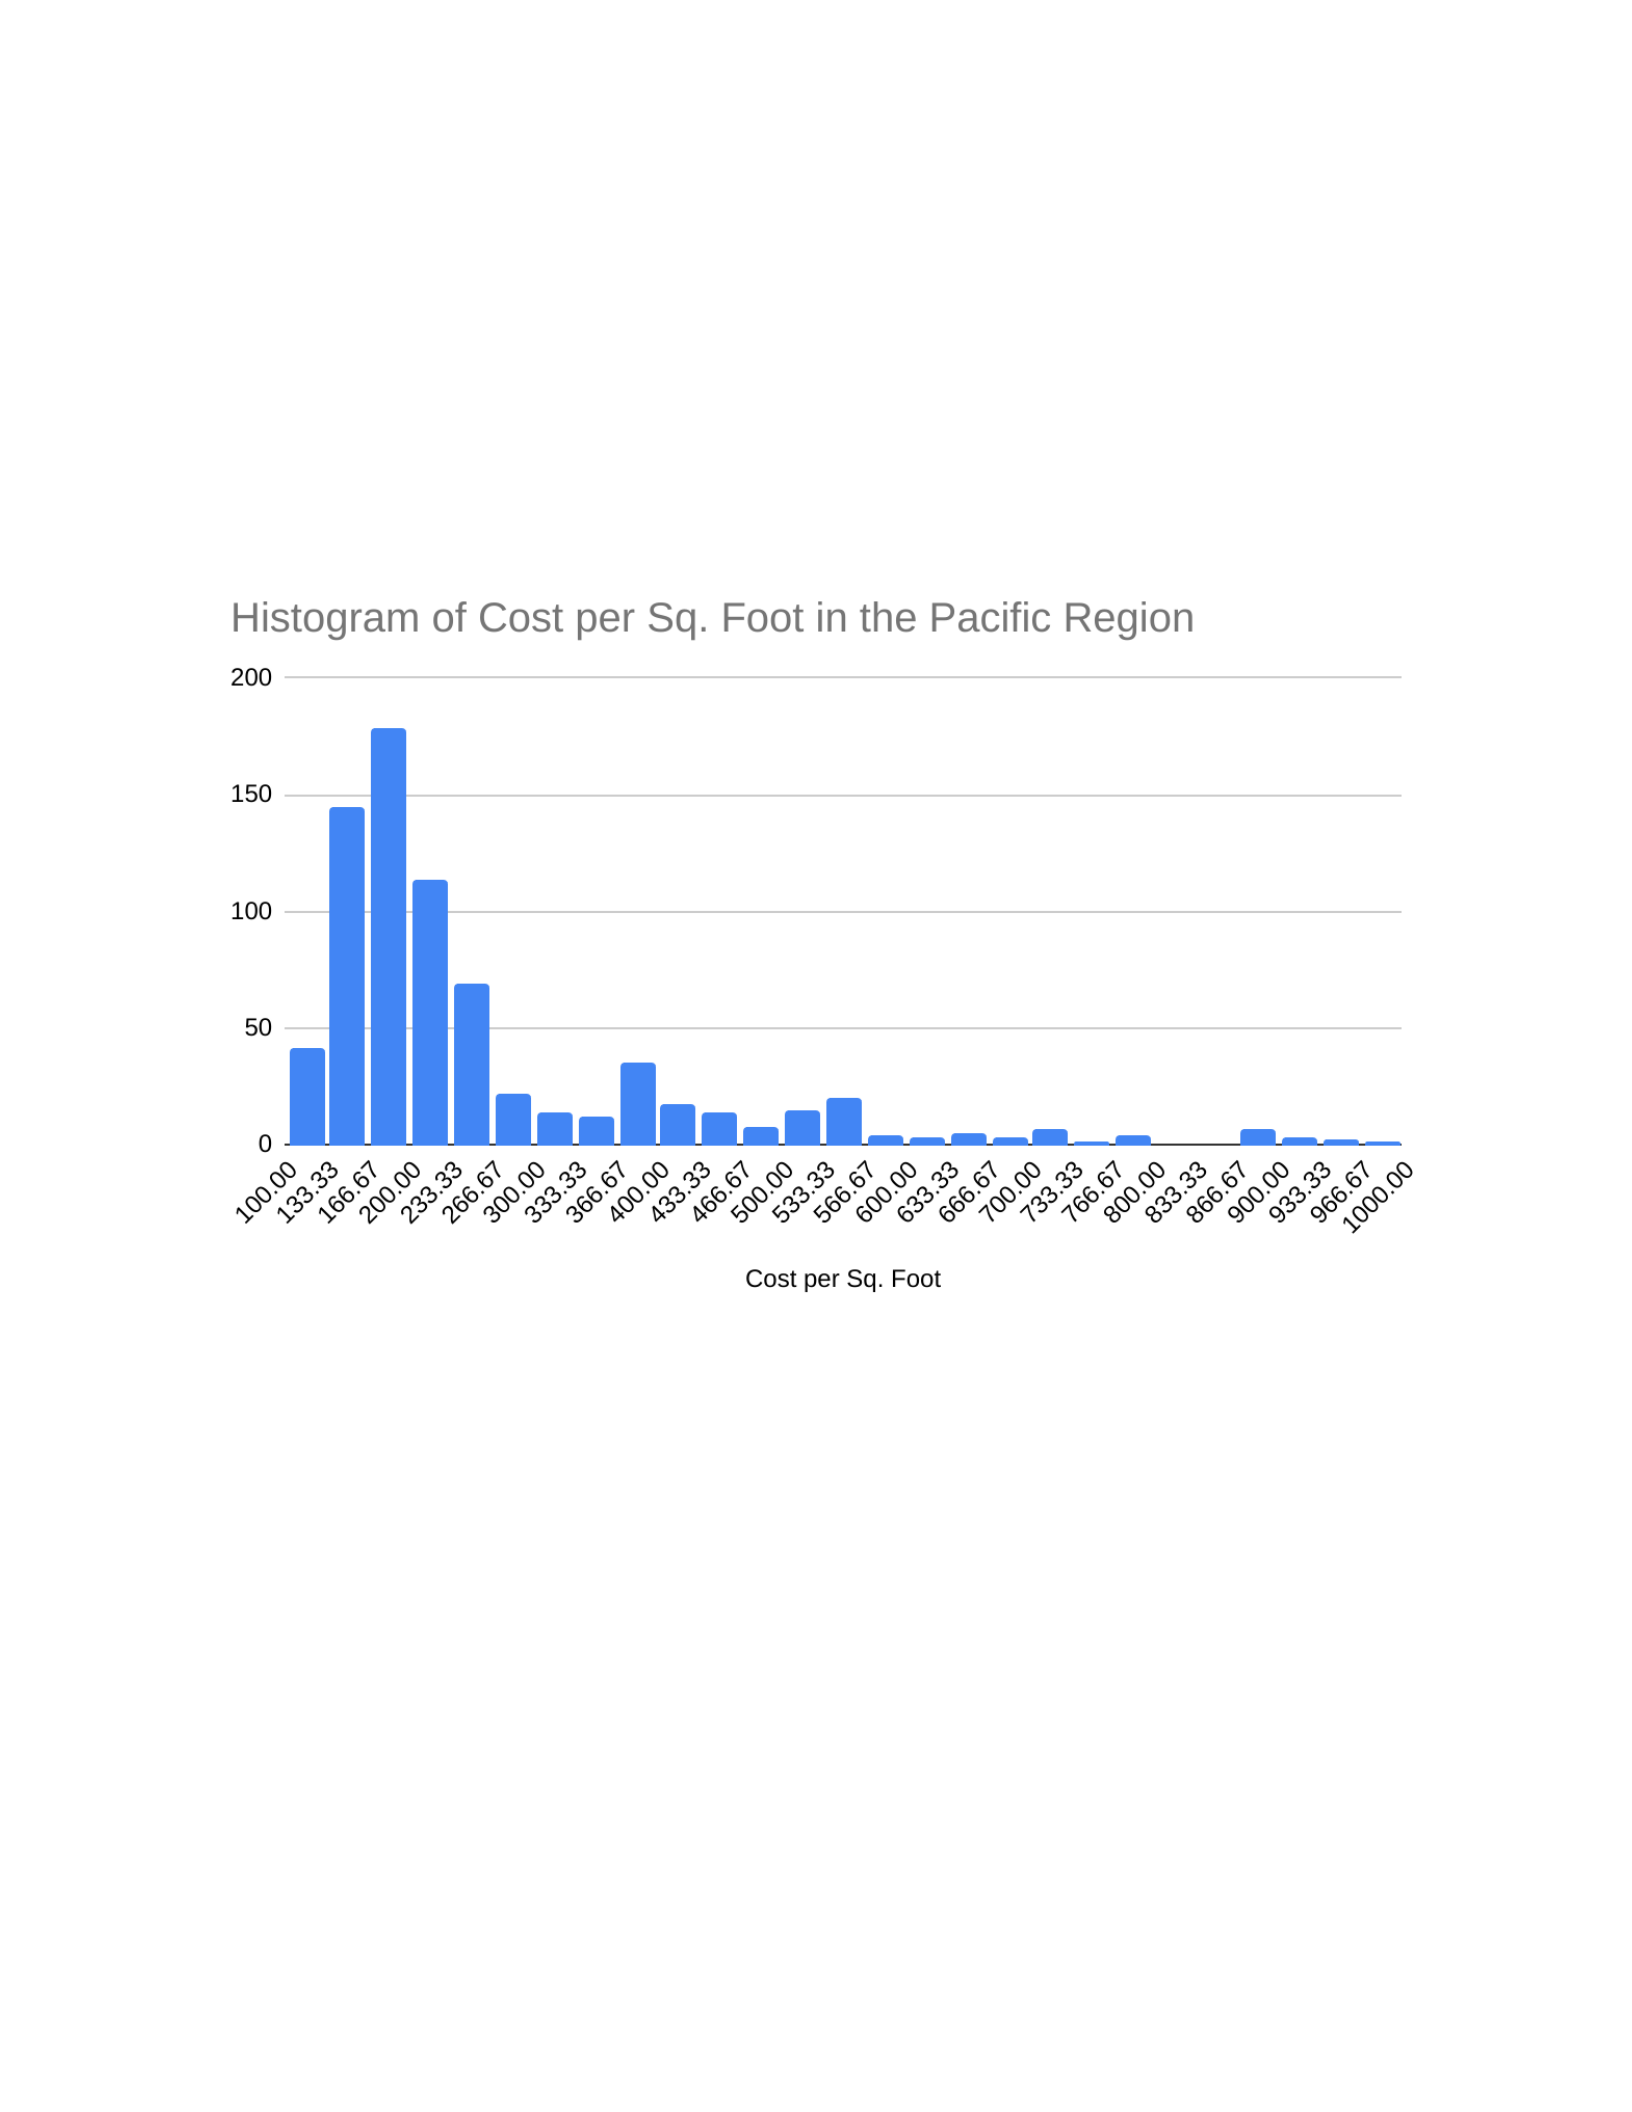
This histogram is centered and is right skewed between the parameters $165 and $300.
Conditions for a left tailed test were fulfilled for the collected sample data. The test significance
level is going to be a=0.5.
Calculations
The sample mean for this data set is $263 and the standard error is 158.971. After inputting the
correct function for the test statistic, I got -2.929 as the test statistic. In order to calculate the p
value, I used the test =T.DIST([test statistics],[degree of freedom], 1). After entering that

Hypothesis Testing for Regional Real Estate Company 4
function, I found that p= 0.00175189. If the p value and test statistic were added into a bell-form
diagram, it would be dropped into the 99.7 percentile diagram.
Test Decision
Since the p value (0.00175189) in my calculations is less than 0.5, we will reject the null
hypothesis.
Conclusion
After my calculations, we can conclude by saying the average cost per square foot of home sales
is higher than the cost per square foot in the Pacific region, which would indicate that the
salesperson was correct with his original advertisement. The reason that we have rejected the
null hypothesis (HO) was because the value of P was less than our test significance level of 0.5
and have shown proof that sales were less than $280 as we stated in the alternative hypothesis.

