


2
VALIDITY
SPSS: Validity Assignment
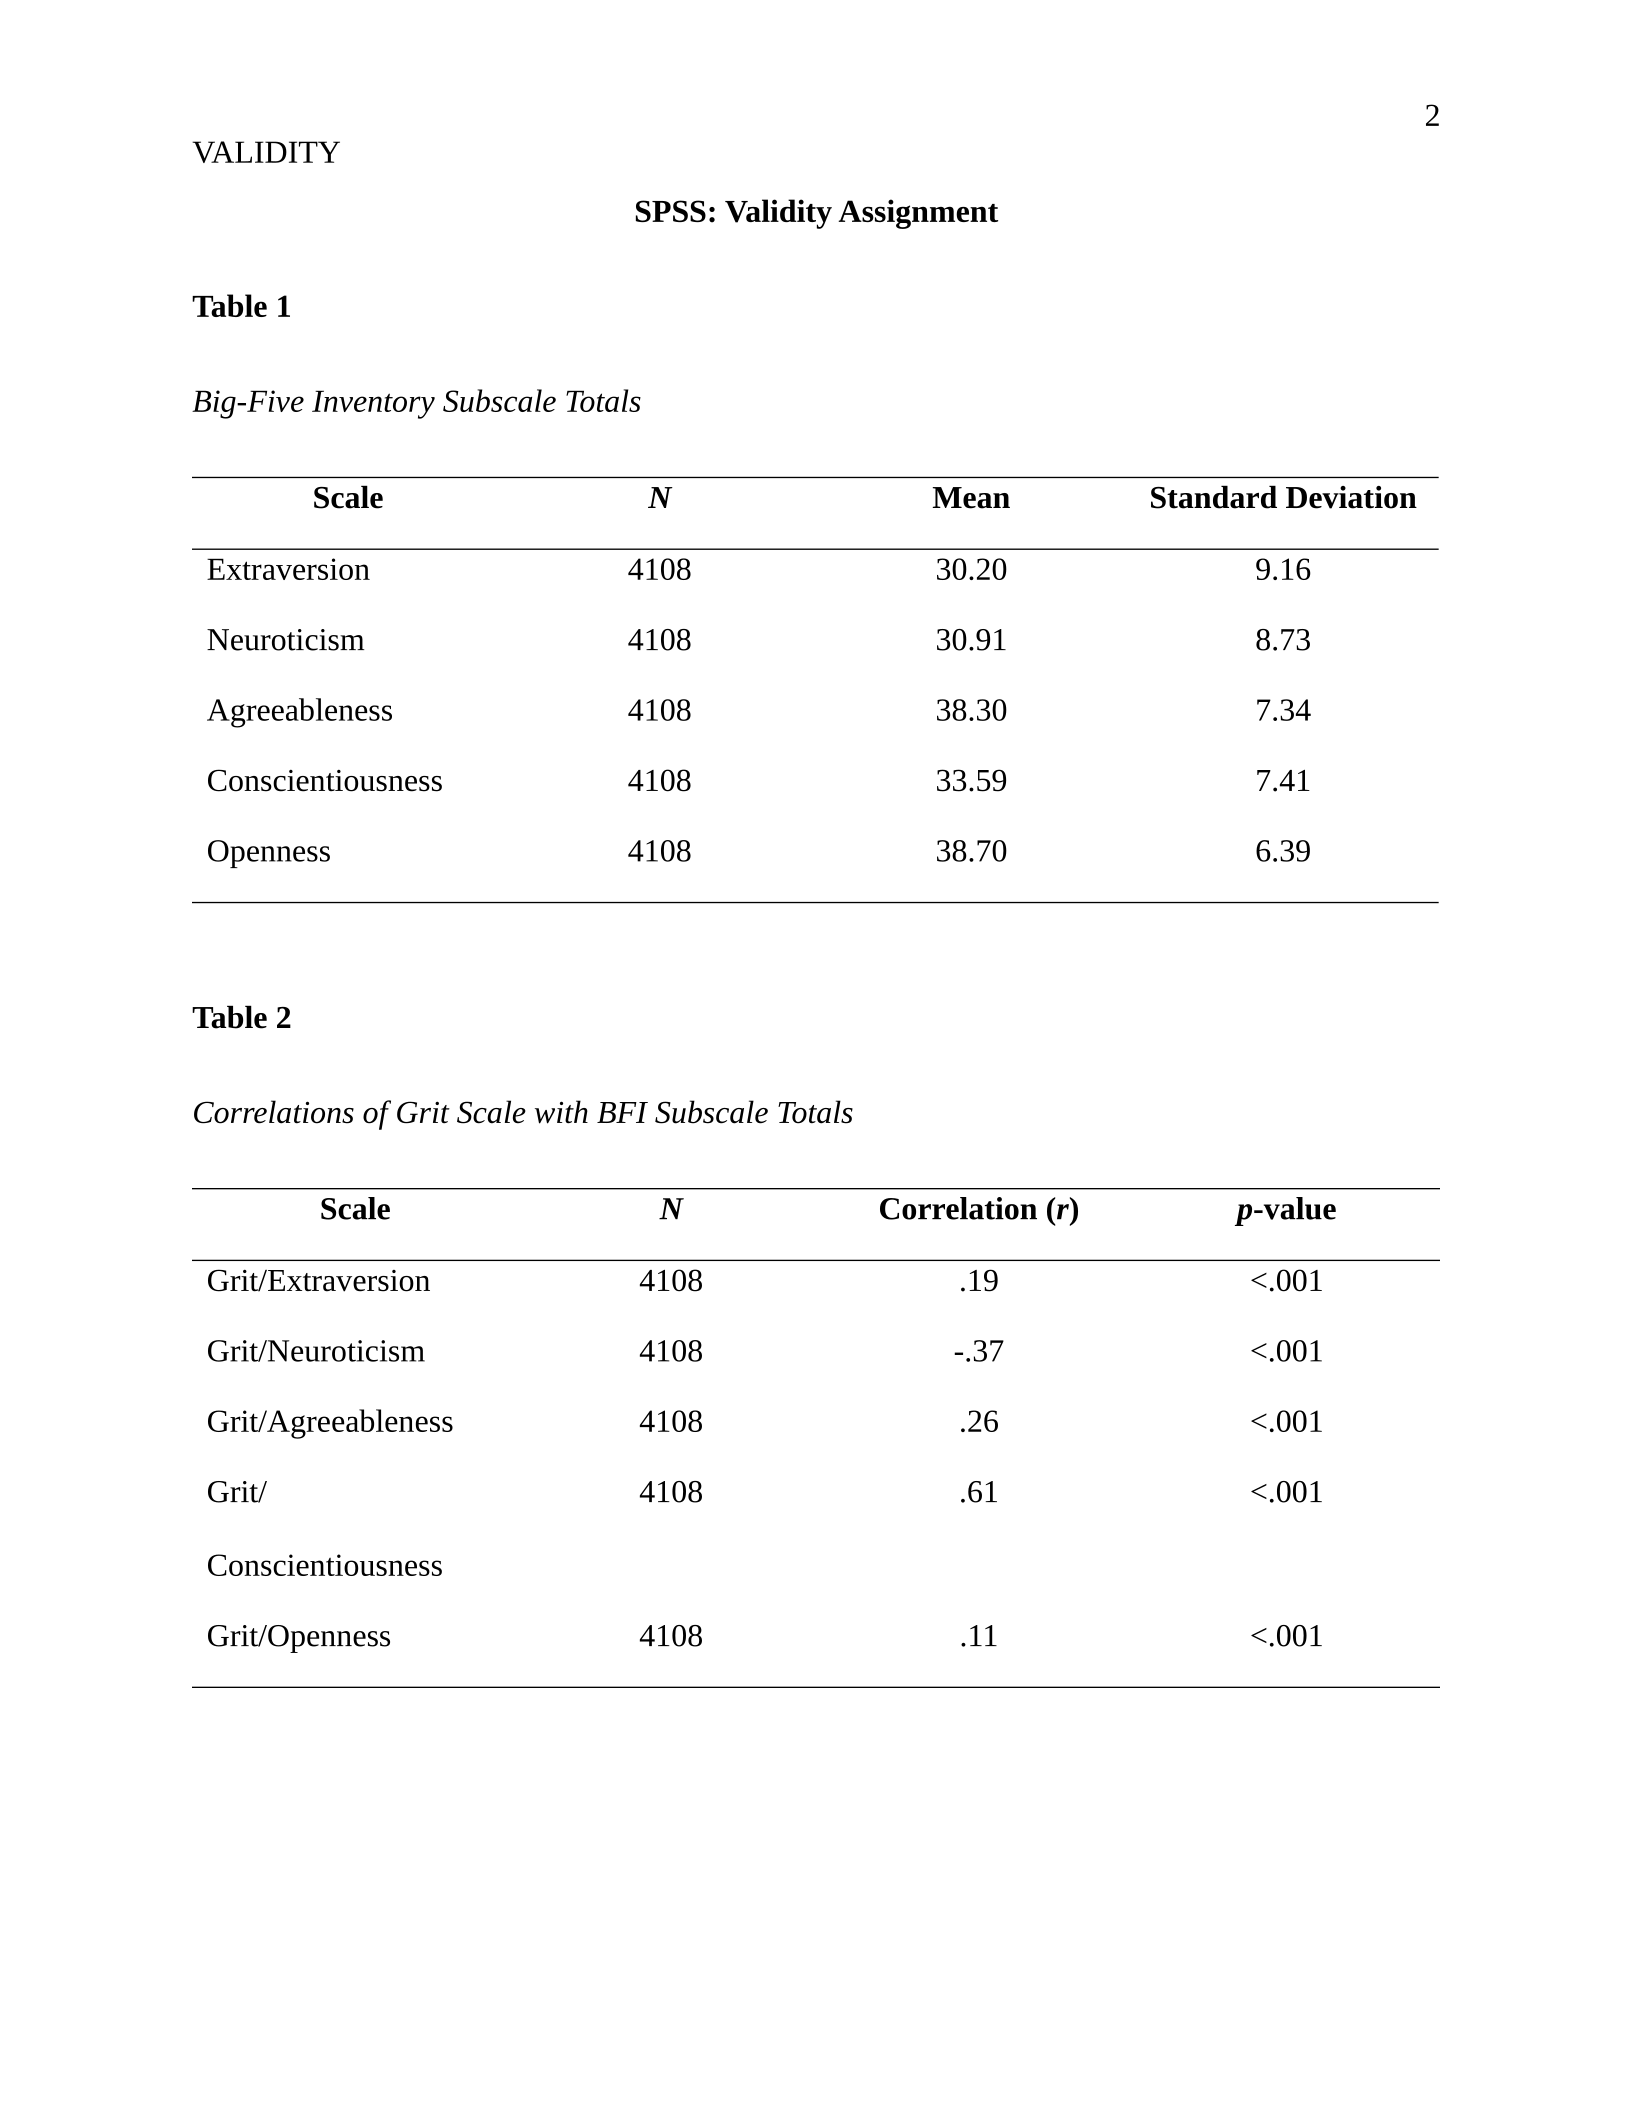
Table 1
Big-Five Inventory Subscale Totals
Scale NMean Standard Deviation
Extraversion 4108 30.20 9.16
Neuroticism 4108 30.91 8.73
Agreeableness 4108 38.30 7.34
Conscientiousness 4108 33.59 7.41
Openness 4108 38.70 6.39
Table 2
Correlations of Grit Scale with BFI Subscale Totals
Scale NCorrelation (r)p-value
Grit/Extraversion 4108 .19 <.001
Grit/Neuroticism 4108 -.37 <.001
Grit/Agreeableness 4108 .26 <.001
Grit/
Conscientiousness
4108 .61 <.001
Grit/Openness 4108 .11 <.001
3
VALIDITY
Summary
The validity coefficient used with this data set was the Pearson’s r. The closer this
coefficient is to 1, the stronger the correlation and the higher the validity. The correlation
coefficient between grit and extraversion was .19 which indicates a very low correlation. Grit
and openness also had a very low correlation of .11. Agreeableness had a slightly higher
correlation coefficient but .26 is still an indication of a weak correlation. Pearson’s r for grit and
neuroticism was -.37 which indicates a weak negative correlation between the variables. Finally,
the correlation between grit and conscientiousness was .61 which indicates a moderate
correlation. Interestingly, while the majority of the correlations indicated a weak relationship, the
p-value for each correlation was significant at <.001.
Duckworth (2007) found similar results when correlating the subscales of the BFI with
grit scores. In study 2, they found that grit related to conscientiousness the most with a Pearson’s
r value of .77 and a significance value of <.001. All other correlations between grit and the BFI
subscales were weak but statistically significant, as with the current data set. Duckworth’s fifth
study also indicated the strong, statistically significant relationship between grit and
conscientiousness (r=.64, p<.001). Similar findings across these different populations is an
indication of reliability in measurement.
These correlations make theoretical sense in a few different ways. In order for someone
to persevere and accomplish their long-term goals they must have the strong desire to do their
best. This is why grit and conscientiousness are strongly correlated in several studies. The
negative correlations found between neuroticism and grit display how an individual cannot be
stressed and dissatisfied while also being gritty. The opposite would also be true; one cannot be
4
VALIDITY
gritty if one is constantly stressed and dissatisfied. The other subscales on the BFI were weakly
correlated with grit because they are not predictors of accomplishment.
Another way to provide validity evidence for the grit scale would be to compare how grit
correlates to academic success. Researchers could examine how gritty high scoring GPA students
are. Low grit levels could possibly predict dropout rates while high grit levels could predict
honorable accomplishments. This would provide incremental validity (Cohen et al., 2022). Grit
could then be used as a predictor for academic achievement.
5
VALIDITY
References
Cohen, R. J., Schneider, W. J., & Tobin, R. M. (2022).GPsychological testing and
assessmentG(10th ed.). Boston, MA: McGraw-Hill. ISBN: 9781260837025.
Duckworth, A.L., Peterson, C., Matthews, M.D., & Kelly, D.R. (2007). Grit: Perseverance and
passion for long-term goals. Journal of Personality and Social Psychology, 9, 1087-1101.
Goldberg, L. R. (1992). The development of markers for the Big-Five factor structure.
Psychological Assessment, 4, 26-42.
Powered by TCPDF (www.tcpdf.org)

